Article

Growth of Vegetables in an Agroecological Garden-Orchard System: The Role of Spatiotemporal Variations of Microclimatic Conditions and Soil Properties

by
Toky Ramananjatovo
1,*,
Etienne Chantoiseau
1,
Pascale Guillermin
2,
René Guénon
1,
Mickaël Delaire
2,
Gerhard Buck-Sorlin
2 and
Patrice Cannavo
1
1
EPHOR, Institut Agro, 49045 Angers, France
2
IRHS, INRAE, Institut Agro, Université d’Angers, SFR 4207 QuaSaV, 49071 Beaucouzé, France
*
Author to whom correspondence should be addressed.
Agronomy 2021, 11(9), 1888; https://doi.org/10.3390/agronomy11091888
Submission received: 2 September 2021 / Revised: 17 September 2021 / Accepted: 18 September 2021 / Published: 21 September 2021
(This article belongs to the Special Issue Impacts of Nutrient Management on Soil Productivity and Water Quality)

Abstract

:
Garden-orchard systems (GOS) consist in intercropping various vegetables with fruit trees. They are very promising to produce fruits and vegetables in sufficient quantity and of adequate quality while limiting environmental impacts. We assessed the effects of apple trees on the spatiotemporal variations of microclimatic conditions and soil properties, and their influence on the growth of two vegetables (radish and lettuce). We performed measurements on five vegetable beds situated at different distances from apple tree rows (from 1.5 to 5 m). Vegetable beds near the apple trees received on average 8% less radiation. Air temperature near the trees was on average 1.5 °C lower during daytime while air relative humidity was up to 5% higher. Apple trees improved the soil surface properties. Soil organic matter was up to 40% higher in the vegetable beds near the rows whereas soil bulk density was 16% lower, N mineralization was up to two times faster. Mineral N and bulk density were the primary limiting factors for the growth of radish while lettuce growth was mainly affected by microclimate. Our results provide a framework to define a spatial arrangement of GOS that optimize the ecosystem services of fruit trees and, therefore, the productivity of GOS.

1. Introduction

Agroforestry systems (AFS), i.e., the intercropping of woody species with annual crops, are among the most sustainable cropping systems to ensure high production through the tree-crop complementarity in terms of land and resources use [1,2]. AFS have generally higher land equivalent ratio [3,4] and use water and nutrients more efficiently than crop and tree monocultures [5,6]. Among AFS, garden-orchard systems (GOS), where vegetables are intercropped with fruit trees, could be very suitable to satisfy the growing demand for local and sustainable quality products [7]. Given all their agro-environmental interests [8], GOS are very promising to provide fruits and vegetables in sufficient quantity and of adequate quality on the market while limiting the degradation of soil and water resources. However, the level of knowledge about GOS remains unsatisfactory. Although some studies have been carried out on fruit tree-based AFS [1,9,10,11,12,13,14,15], they were limited to a global comparison of the productivity of the system with an adjacent sole crop while the respective contribution of soil and climatic factors to crop growth responses was not elucidated. To our knowledge, no scientific studies have been conducted to date on the characterization of the biophysical interactions existing between fruit trees and vegetables in GOS, and the quantification of their spatiotemporal variations.
Similar to most previous research on AFS, the study of GOS can be approached by analyzing the ecosystem services and disservices provided by fruit trees in each above-ground and below-ground compartment. This is particularly important for GOS which are characterized by a wide diversity of vegetables (leafy, stem, root, fruit, etc.), with varying growth and development demands. Indeed, leafy, fruit or stem vegetables might be more sensitive to aerial environmental changes while root vegetables could primarily be affected by soil properties. For above-ground effects, it has been reported that tree shade can improve the microclimatic conditions of understory crops in summer by buffering air temperature and by increasing air humidity [16], thereby reducing evapotranspiration [17,18]. However, the reduction of incident radiation by shading is also known to be an important limiting factor for vegetable growth under non-limiting water and nitrogen conditions [19]. For below-ground effects, the improvement of soil properties by trees is well documented in AFS: (1) tree shade can help maintaining a higher soil water content in the topsoil layer [20] and improve the land productivity under arid conditions [4]; (2) litterfall and tree root turnover increase the input of organic matter residue into the soil [21,22,23], which enhance the soil microbial activities [24] and improve soil fertility [25]; (3) soil structure is generally improved in AFS through the enrichment in soil organic matter [26]; (4) trees can recycle water and nitrate in deep soil layer through their deeper root system and thereby reduce water and nitrogen losses from the system [27,28]. Nevertheless, trees may also capture water and nitrogen that would otherwise be available for crops [29]. Such competitions are susceptible to decrease the productivity of the crop [30] or even of the whole system [31,32]. Thus, these positive and negative effects of trees must be studied in GOS in order to optimize the cultivation techniques.
On the other hand, crop yields are highly variable depending on the spatial arrangement of trees and crops [33]. This variability is partly driven by the changes in microclimatic conditions and soil properties with distance from the trees [34] and across different time scales (diurnal, seasonal) [35]. For this reason, the spatial and temporal variations of fruit tree-induced microclimate and soil properties must also be accurately quantified to design adequately GOS.
In this study, we assessed the effects of apple trees on the spatiotemporal variations of microclimatic conditions and soil properties, including soil nitrogen and soil water dynamics, and their influences on the growth and development of two successive crops: a root (radish) and a leafy (lettuce) vegetable. We designed and conducted a field experiment involving continuous microclimate monitoring and soil sampling at a high spatial resolution, to answer the following research questions: (1) How do microclimate and soil properties vary at various distances from apple trees? (2) How can these variations be related to growth and yields of different types of vegetables?

2. Materials and Methods

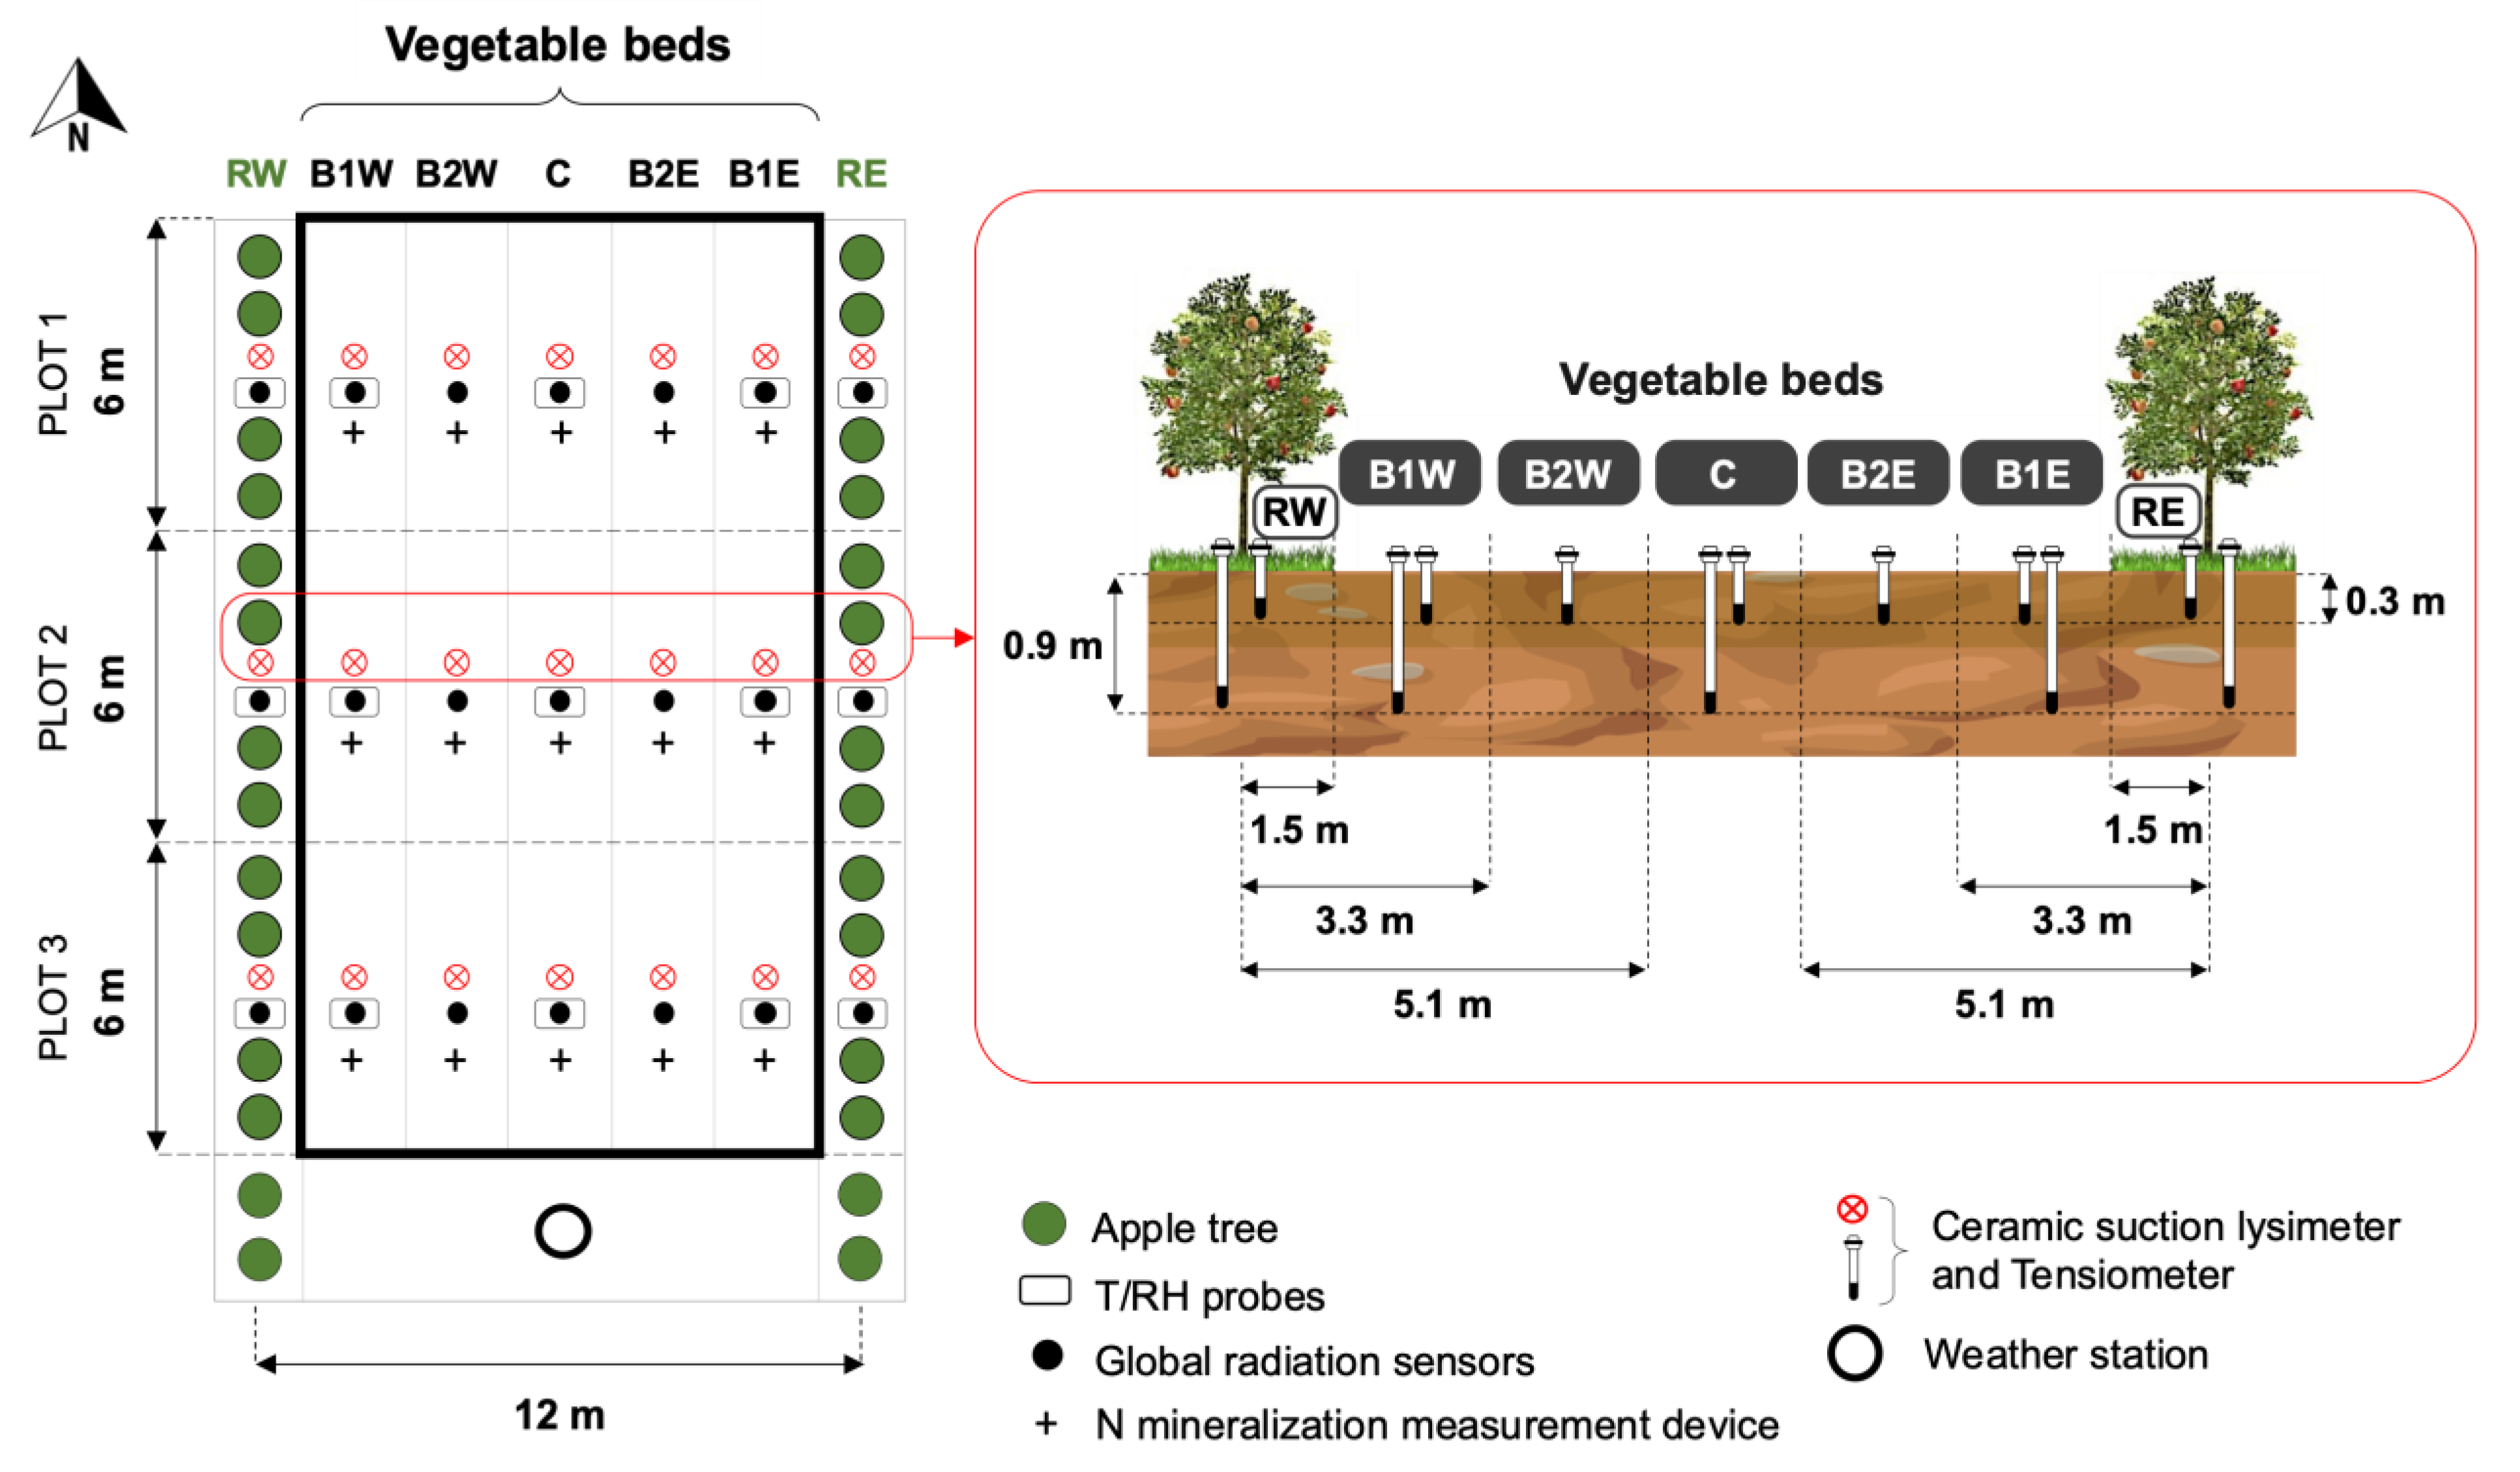
2.1. Site Description

The study was conducted at the Institut Agro—Agrocampus Ouest, Angers (France, longitude 0°36′ W, latitude 47°28′ N, elevation 49 m). The climate at the site is temperate (Cfb in the Köppen-Geiger classification) with relatively cold and wet winters and hot summers. The yearly average temperature and precipitation are 11.5 °C and 690 mm, respectively (Météo, France, 1981–2010). The soil type is Luvisol Redoxisol [36] with 4 layers. Soil thickness is approximately 1.2 m. The main characteristics of the soil profile are given in Table 1.

2.2. Experimental Design

The experiments were carried out in a 36 m long × 12 m wide area, between two rows of seven varieties of apple trees, planted in 2000 (Malus × domestica Borkh, var. “Elstar”, “Gala”, “Fuji”, “Granny Smith”, “Red winter”, “Golden Delicious”, “Reine des Reinettes”). The height of all apple trees was maintained at about 2.5 m, and individual trees were also otherwise comparable in dimensions (8 cm DBH, 90 cm trunk height). The two tree rows were 12 m apart and oriented North to South. The distance between trees within a row was 1.6 m, with branches connected to each other. Soil surface under the tree rows was covered by a 3 m-wide herbaceous grass strip.
We divided the inter-row into five 1.8 m-wide vegetable beds on which radish and lettuce were grown in succession from June to October 2020. Microclimatic conditions, soil properties and plant growth parameters were measured under each apple tree row and on each vegetable bed in order to characterize their variations according to the distance from the apple trees. Thus, four levels of the factor “Distance to tree” were studied: (1) below the East (RE) or West (RW) apple tree row, (2) on the vegetable bed situated at 1.5 m from the East (B1E) or West (B1W) tree row, (3) on the vegetable bed situated at 3.3 m from the East (B2E) or West (B2W) tree row, and (4) on the central vegetable bed situated at 5.1 m from the tree rows (C) where apple trees are assumed to have no effect on crop development. Three soil pits were excavated on each side of the experimental field in order to collect soil samples for the characterization of the soil profile and to observe the root profile of the apple trees. We did not observe apple tree roots in the central bed (C). All measurements were replicated in three elementary plots (6 m × 12 m) (Figure 1).
Radish (Raphanus sativus L., var. “Ostergruß BIO”) was sown on 23 June 2020 and harvested on 14 August 2020. Lettuce (Lactuca sativa L., var. “Olana BIO”) was planted at 4-leaf stage on 31 August 2020 and harvested on 21 October 2020. For radish, direct seeding was carried out at an inter-row spacing of 30 cm and within-row spacing of 10 cm. Then, seedlings were thinned 23 days after sowing to a final spacing of 20 cm within a row. During lettuce cultivation, vegetable beds were covered with a micro-perforated plastic mulch for weed control. The inter-row and within-row spacing of lettuces was 30 cm × 30 cm. The final planting density was 24 plants.m−2 and 16 plants.m−2 for radish and lettuce, respectively.
Vegetable beds were irrigated with a drip irrigation system (Dripnet PC 390—Ø 16 mm, NETAFIM, Gardanne, France). Drippers delivered the same flow rate of 1.6 L.h−1 on the whole plot. The irrigation rates were: (1) 9 mm.day−1 from sowing to 27 days after sowing (DAS), 6 mm.day−1 from 28 to 34 DAS, 4 mm.day−1 from 35 to 40 DAS and 2 mm.day−1 from 45 DAS to harvest for radish and (2) 2 mm.day−1 from planting to 20 days after planting (DAP) for lettuce; no irrigation from 21 DAP (21 September) onwards due to rainfall. Irrigation was split into two equivalent supplies at 9 a.m. and 6 p.m. Apple tree rows were not irrigated. No fertilizers were applied considering the high organic matter concentration in the Ag soil layer at the beginning of the experiment (>30 g.kg−1 DW in 0–30 cm, Table 1).

2.3. Microclimate Characterization

Microclimatic variables monitored during the experiment were global radiation [W.m−2], air temperature [°C] and air relative humidity [%]. Global radiation was measured using 21 silicon quantum sensors (RG100, Solems, Palaiseau, France, ±10%) installed under each apple tree row and on each vegetable bed (3 sensors per bed). A total of 15 ventilated probes (HMP45, HMP110 and HMP60, Vaisala, Helsinki, Finland) were installed under the tree rows, on the vegetable beds closest to the rows (B1 beds: B1W and B1E) and on the central bed (C) for air temperature (±0.2 °C) and relative air humidity (±2.5%) measurements (3 sensors per bed). All sensors were mounted at 0.5 m height and were connected to a DL2 automatic data logger (Delta-T Device, Cambridge, UK). Measurements were performed every minute, and averaged and recorded every 10 min.
An automatic weather station (Watchdog 2000 series, Spectrum Technologies, Aurora, IL, USA) was installed near the plot at 2 m height to measure rainfall, wind speed, and wind direction. Finally, three photosynthetically active radiation (PAR) sensors were mounted on the C bed, near the global radiation sensors, to check the equivalency between PAR and global radiation (GR). We found that the PAR/GR ratio was around 0.41 (R2 = 0.98) at any time of the day.

2.4. Soil Properties Measurements

2.4.1. Soil Water Content

Soil water potential [hPa] at 30 cm depth was recorded continuously under the tree rows and in each vegetable bed (Figure 1), using 21 automatic tensiometers (SKT 850, SDEC, Reignac-sur-Indre, France) that were connected to a DL2 automatic data logger. Fifteen tensiometric tubes (SMS 2000, SDEC) were also installed at 90 cm depth, under the tree rows and in the B1 and C beds. Soil water potential at 90 cm depth was read daily at around 5 p.m. using a manual electronic tensimeter (SMS 2500S, SDEC).
In parallel, for each soil layer, a soil water retention curve was established in the laboratory from undisturbed soil core samples collected in three nearby pits around the field. Samples were gradually dried using sand suction tables [37] with potentials equivalent to 1, 3.2, 5 and 10 kPa. A ceramic pressure press [38] was used for greater suctions (33, 100 and 1500 kPa). Soil volumetric water content ( θ ) was then calculated from soil water potential data and the soil moisture retention curves. The Van Genuchten model [39] was used to establish a relationship between soil water potential and volumetric water content:
θ θ r θ s θ r = ( 1 + ( α | h | ) n ) m  
m = 1 ( 1 / n )  
where θ is the soil volumetric moisture content [cm3.cm−3], θ s and θ r are the saturated soil volumetric moisture content [cm3.cm−3] and residual soil volumetric water content [cm3.cm−3], respectively; h is the soil water potential [hPa], α [hPa−1] and n are parameters.
To verify the relevance of the calculated values, the gravimetric soil water content in each soil layer and in each vegetable bed was monitored three times during both radish and lettuce growing seasons: at sowing or planting, at the middle of the crop cycle (37 DAS for radish and 31 DAP for lettuce) and at harvest. Soil samples were collected before onset of irrigation and oven-dried at 105 °C for 48 h.

2.4.2. Soil Bulk Density

Bulk density measurements were made in triplicate in each vegetable bed at the middle of each crop cycle by the coring method. Undisturbed soil core samples were collected at 15 cm depth using a metal cylinder (8 cm diameter and 5 cm height) and then oven-dried at 105 °C for 48 h. Bulk density [g.cm-3] was calculated as the ratio between the soil dry weight and the metal cylinder volume.

2.4.3. Soil Organic Matter

At the planting of each crop, soil organic matter in the surface layer was measured in each vegetable bed and under each tree row by loss on ignition. Soil samples were first oven-dried at 105 °C for 48 h to eliminate water, and then heated in a muffle oven at 550 °C for 7 h. Soil organic matter concentration [g.g−1 DW] corresponds to the sample weight difference before and after combustion, divided by the dried soil mass.

2.4.4. N Mineralization

We used the method described by Raison et al. [40] to measure the rate of soil N mineralization in each vegetable bed. Briefly, undisturbed soil core samples were collected from the surface layer (0–15 cm) and were incubated in-situ for 30 days using PVC tubes (8 cm diameter and 15 cm height). The bottom of the tube was covered with a fine-meshed nylon to prevent N mineral uptake by roots while the top was covered with a cap to prevent N leaching. The upper part of the tube had four perforations (1 cm in diameter) to allow diffusion of air through the tube. Net N mineralization (or immobilization) was calculated as the difference of the sum of NH 4 + and NO 3 contents after and before incubation, divided by incubation time (almost 30 days). Four incubations were carried out throughout the experiment: from 23 June (sowing) to 30 July (37 DAS) and from 31 July (38 DAS) to 30 August (16 days after harvest) for radish, and from 31 August (planting) to 01 October (31 DAP) and from 02 October (32 DAP) to 05 November (15 days after harvest) for lettuce.

2.4.5. Mineral Nitrogen Concentration in Soil and Soil Solution

Soil mineral N concentration ( NO 3 , NH 4 + ) in each soil layer was measured in each vegetable bed by the coring method, using a manual auger. Soil cores were sampled three times during each growing season over the same time as for the gravimetric soil water measurement i.e., at plantation, at the middle of the crop cycle (37 DAS for radish and 31 DAP for lettuce) and at harvest. Mineral N in soil samples was immediately extracted after sampling with 1M KCl at a ratio of 1:5 (w/v). Soil extracts were stored at −18 °C until analysis.
Nitrate and ammonium concentrations in soil solution at 30 cm and 90 cm depth were also measured after rainfall events (on 21 August and 5 October). Porous ceramic cup lysimeters (SPS 200—Ø 63 mm, SDEC) were used for sampling. A negative pressure around −700 mbar was created inside the lysimeter tube by using a manual vacuum pump (SPS 400, SDEC) to force soil solution circulation towards the inside of the ceramic cup. After 48 h, soil solutions were collected and stored at −18 °C until analysis.
Nitrate concentration in soil solution and in KCl soil extracts were determined by nitration of salicylic acid [41] while ammonium concentration was analyzed by colorimetry using the salicylate method described by Nelson [42].

2.5. Vegetable Growth and Yield

Radish and lettuce growth was monitored on each vegetable bed by measuring leaf area and dry mass every week. Triplicate plant samples were collected at each date. For radish, the whole plant was collected and washed with demineralized water. Then, leaves were separated from the tubers and scanned at 200 dpi resolution (e-Studio 2508A, Toshiba, Inc., Tokyo, Japan) for leaf area measurement. Only the aboveground part was sampled for lettuce. Immediately after cutting, leaves were separated, counted, and scanned. Digital images were processed using the EBImage package [43] of R Studio. Plant organs were then oven-dried at 60 °C for 48 h and 96 h for leaves and tubers, respectively, to measure their dry mass.
At harvest, all plants were collected and weighed. Forty subsamples were selected on each vegetable bed in order to determine the plant average water content. Then, the total dry matter produced on each bed was deduced from the fresh weight data.

2.6. Data Analysis

The significance of the spatial variation of daily microclimatic conditions (global radiation, air temperature and humidity) was assessed by performing a t-test (p < 0.05) on the differences between each tree row or vegetable bed and the C bed, calculated on the entire daily dataset of each crop cycle.
The cumulative global radiation and growing degree-days over each growing season were also calculated on each vegetable bed and under each tree row. The daily growing degree-day (GDD) [°C-days] was calculated using the following equation [44]:
G D D = [   T M A X + T M I N 2   ] T B A S E
where T M A X   is the daily maximum temperature [°C], T M I N is the daily minimum temperature [°C] and T B A S E [°C] is the base temperature (temperature below which no significant crop development is expected). T B A S E were 4.5 °C [45] and 4 °C [46] for radish and lettuce, respectively.
We also considered the spatial variation of the microclimatic variables at a diurnal scale, as the nighttime conditions can confuse or mask the differences occurring during daytime and vice versa. Furthermore, these spatial variations could be more or less pronounced depending on weather conditions. Thus, we firstly classified the studied days into typical meteorological days. To do so, we performed a k-means clustering using the FactoMineR package [47] of R Studio. The variables involved in the clustering were the daily mean temperature [°C], the daily mean relative humidity [%] and the daily clearness index ( K T ) which is the ratio between the global radiation [MJ.m−2] and the extraterrestrial radiation [MJ.m-2]. The K T index gives an indication of the cloud cover. Daily extraterrestrial radiation ( R a ) was calculated from the sun position in the sky using the following equation [48]:
R a = 24   ( 60 ) π   G S C   d r   [ ω S   s i n ( φ )   s i n ( δ ) + c o s ( φ )   c o s ( δ )   s i n ( ω S ) ]
where G S C is the solar constant (=0.082 MJ.m−2.min−1), d r is the inverse relative distance Earth-Sun, ω S is the sunset hour angle [rad], φ is the site latitude [rad] and δ is the solar declination angle [rad]. d r , ω S and δ are given by:
d r = 1 + 0.033   c o s ( 2 π 365   J )
ω S = a r c c o s ( t a n ( φ )   t a n ( δ ) )
δ = 0.409   s i n ( 2 π 365   J 1.39 )
where J is the Julian day. The optimal number of clusters was determined by Silhouette method [49]. Then, for each day class, we calculated the differences between the values of microclimatic variables measured under the tree rows or on the vegetable bed and those measured on the C bed at each timestep to study the diurnal evolution of the difference.
One-Way ANOVA followed by Tukey’s HSD test were used to assess the differences among the vegetable beds in soil properties (bulk density, organic matter, N mineralization, soil and soil solution mineral nitrogen concentration) and vegetable dry mass at a significance level of 5%. Pearson’s correlation analysis was performed with the xtable package [50] of R Studio to identify correlations between the microclimatic conditions, soil properties and the vegetable growth. All statistical analyses were performed with the version 3.6.0 of R Studio [51].

3. Results

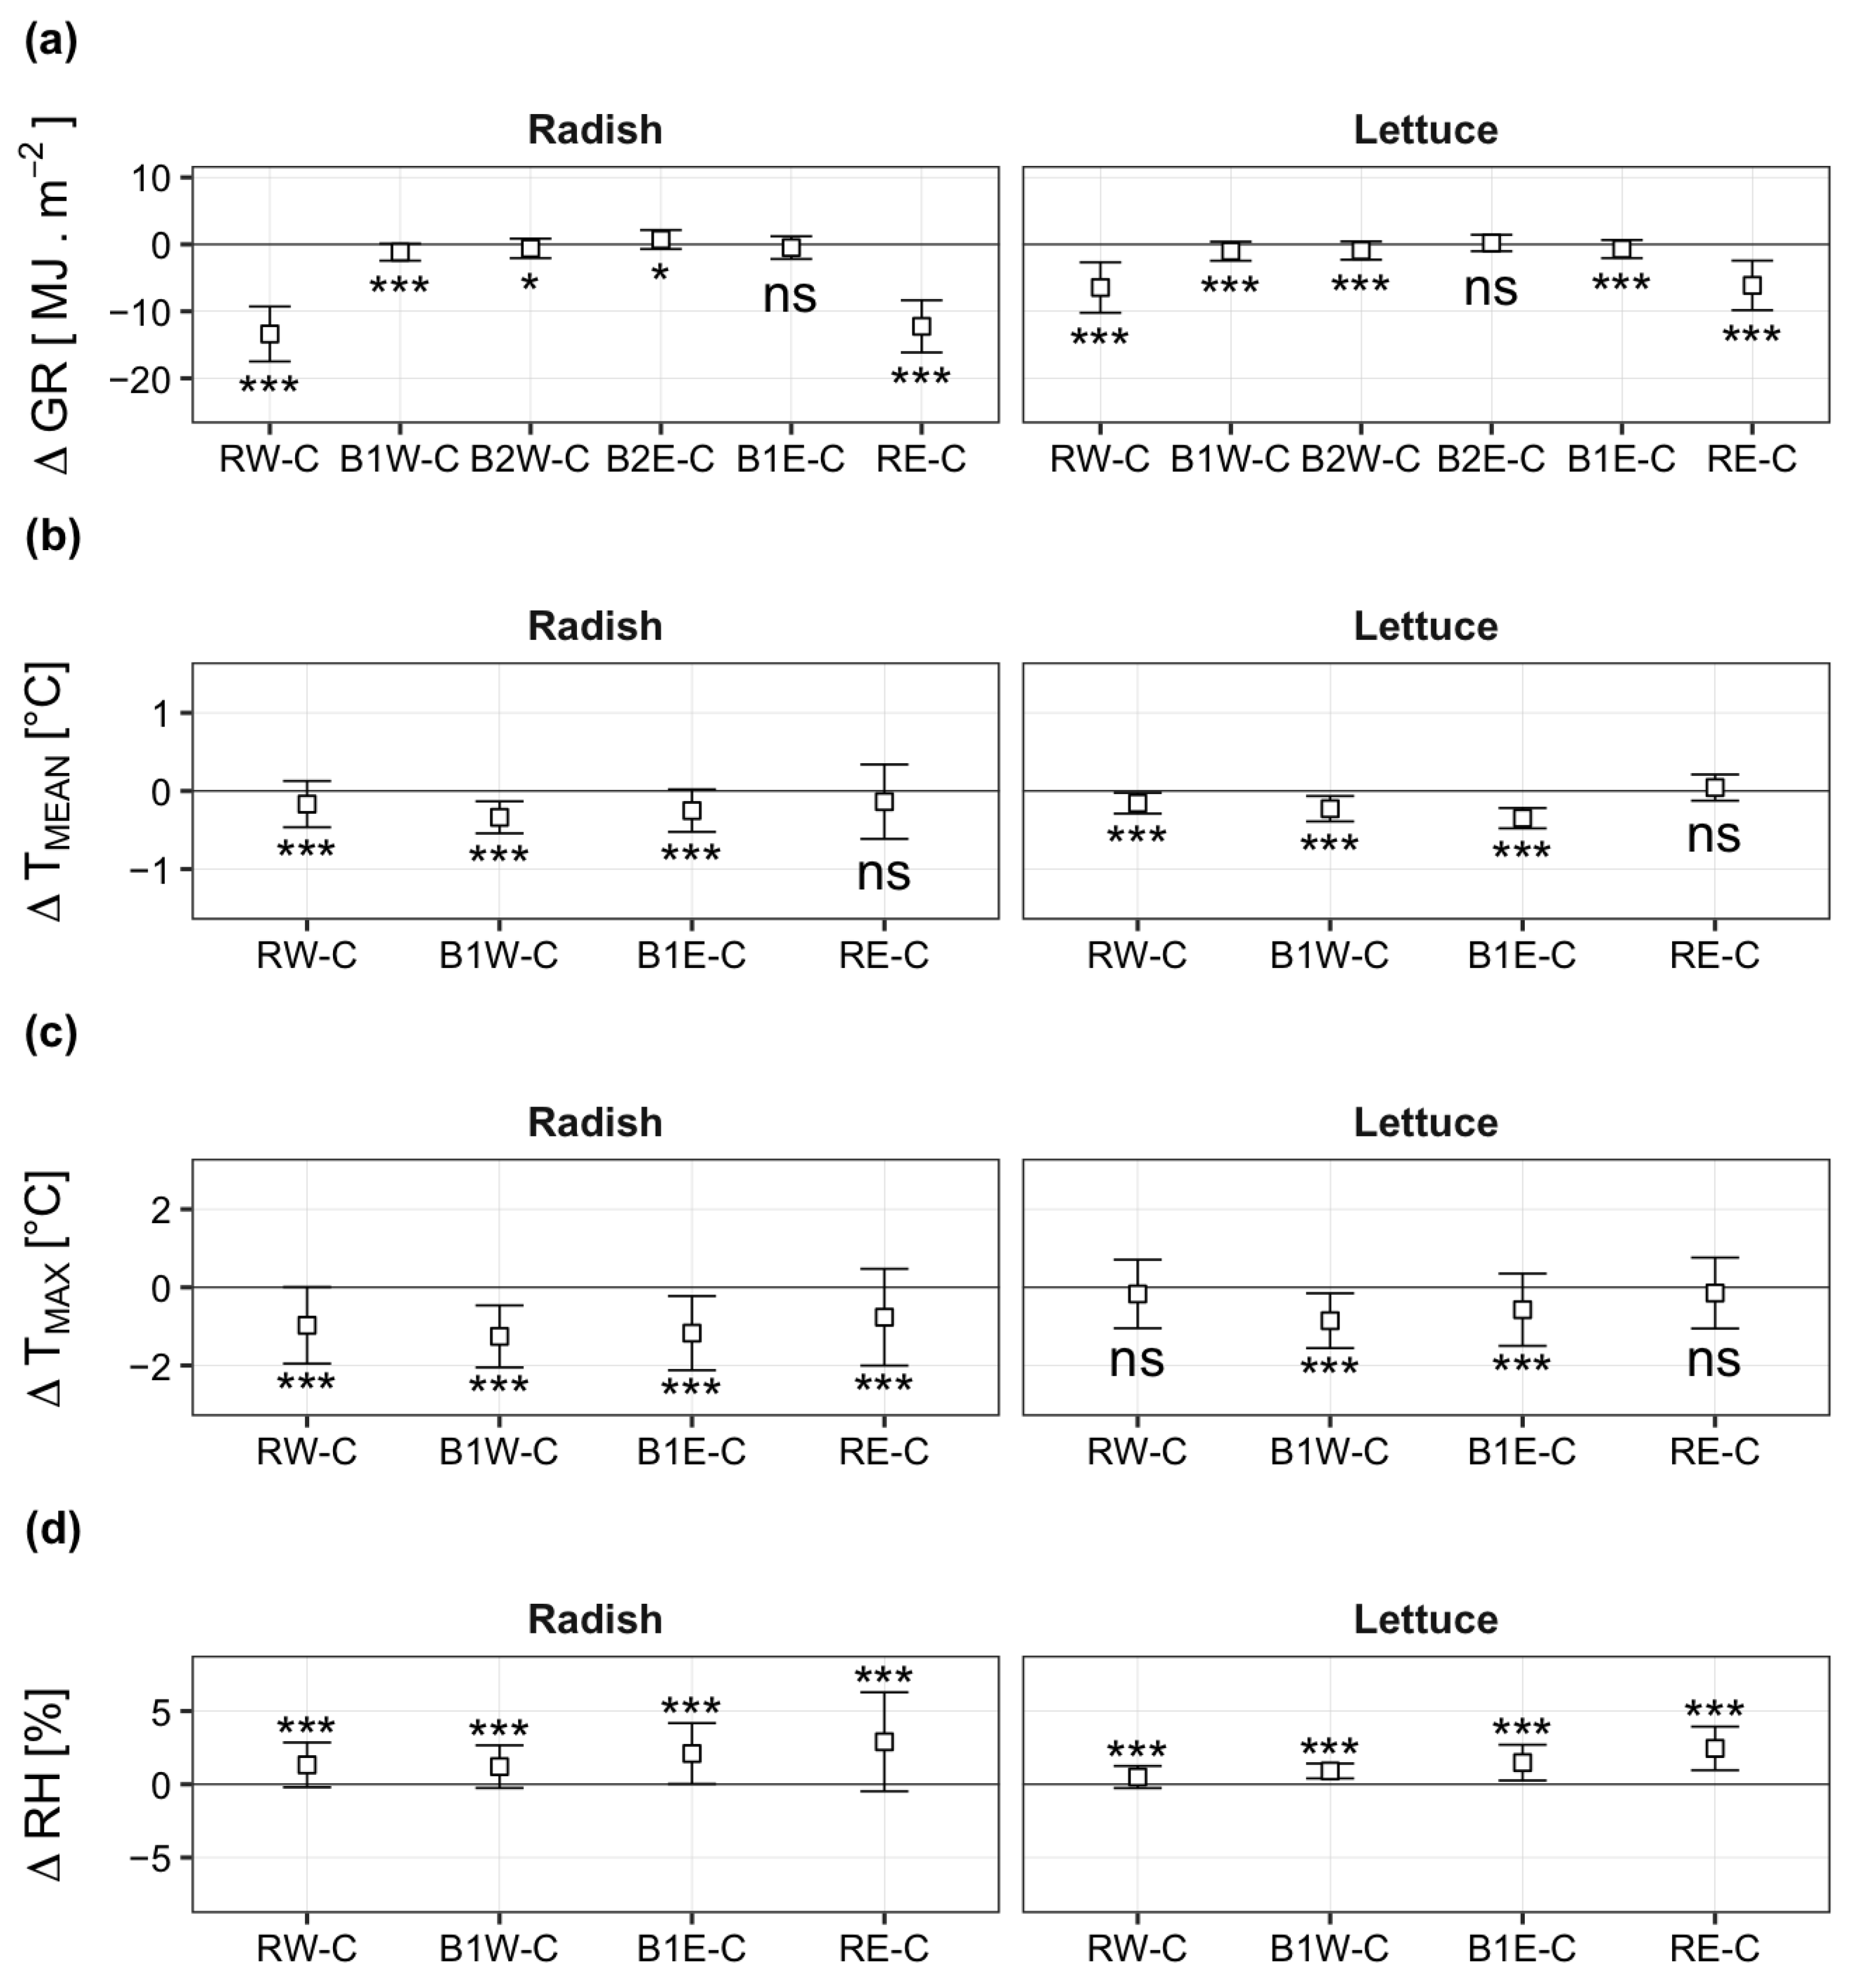
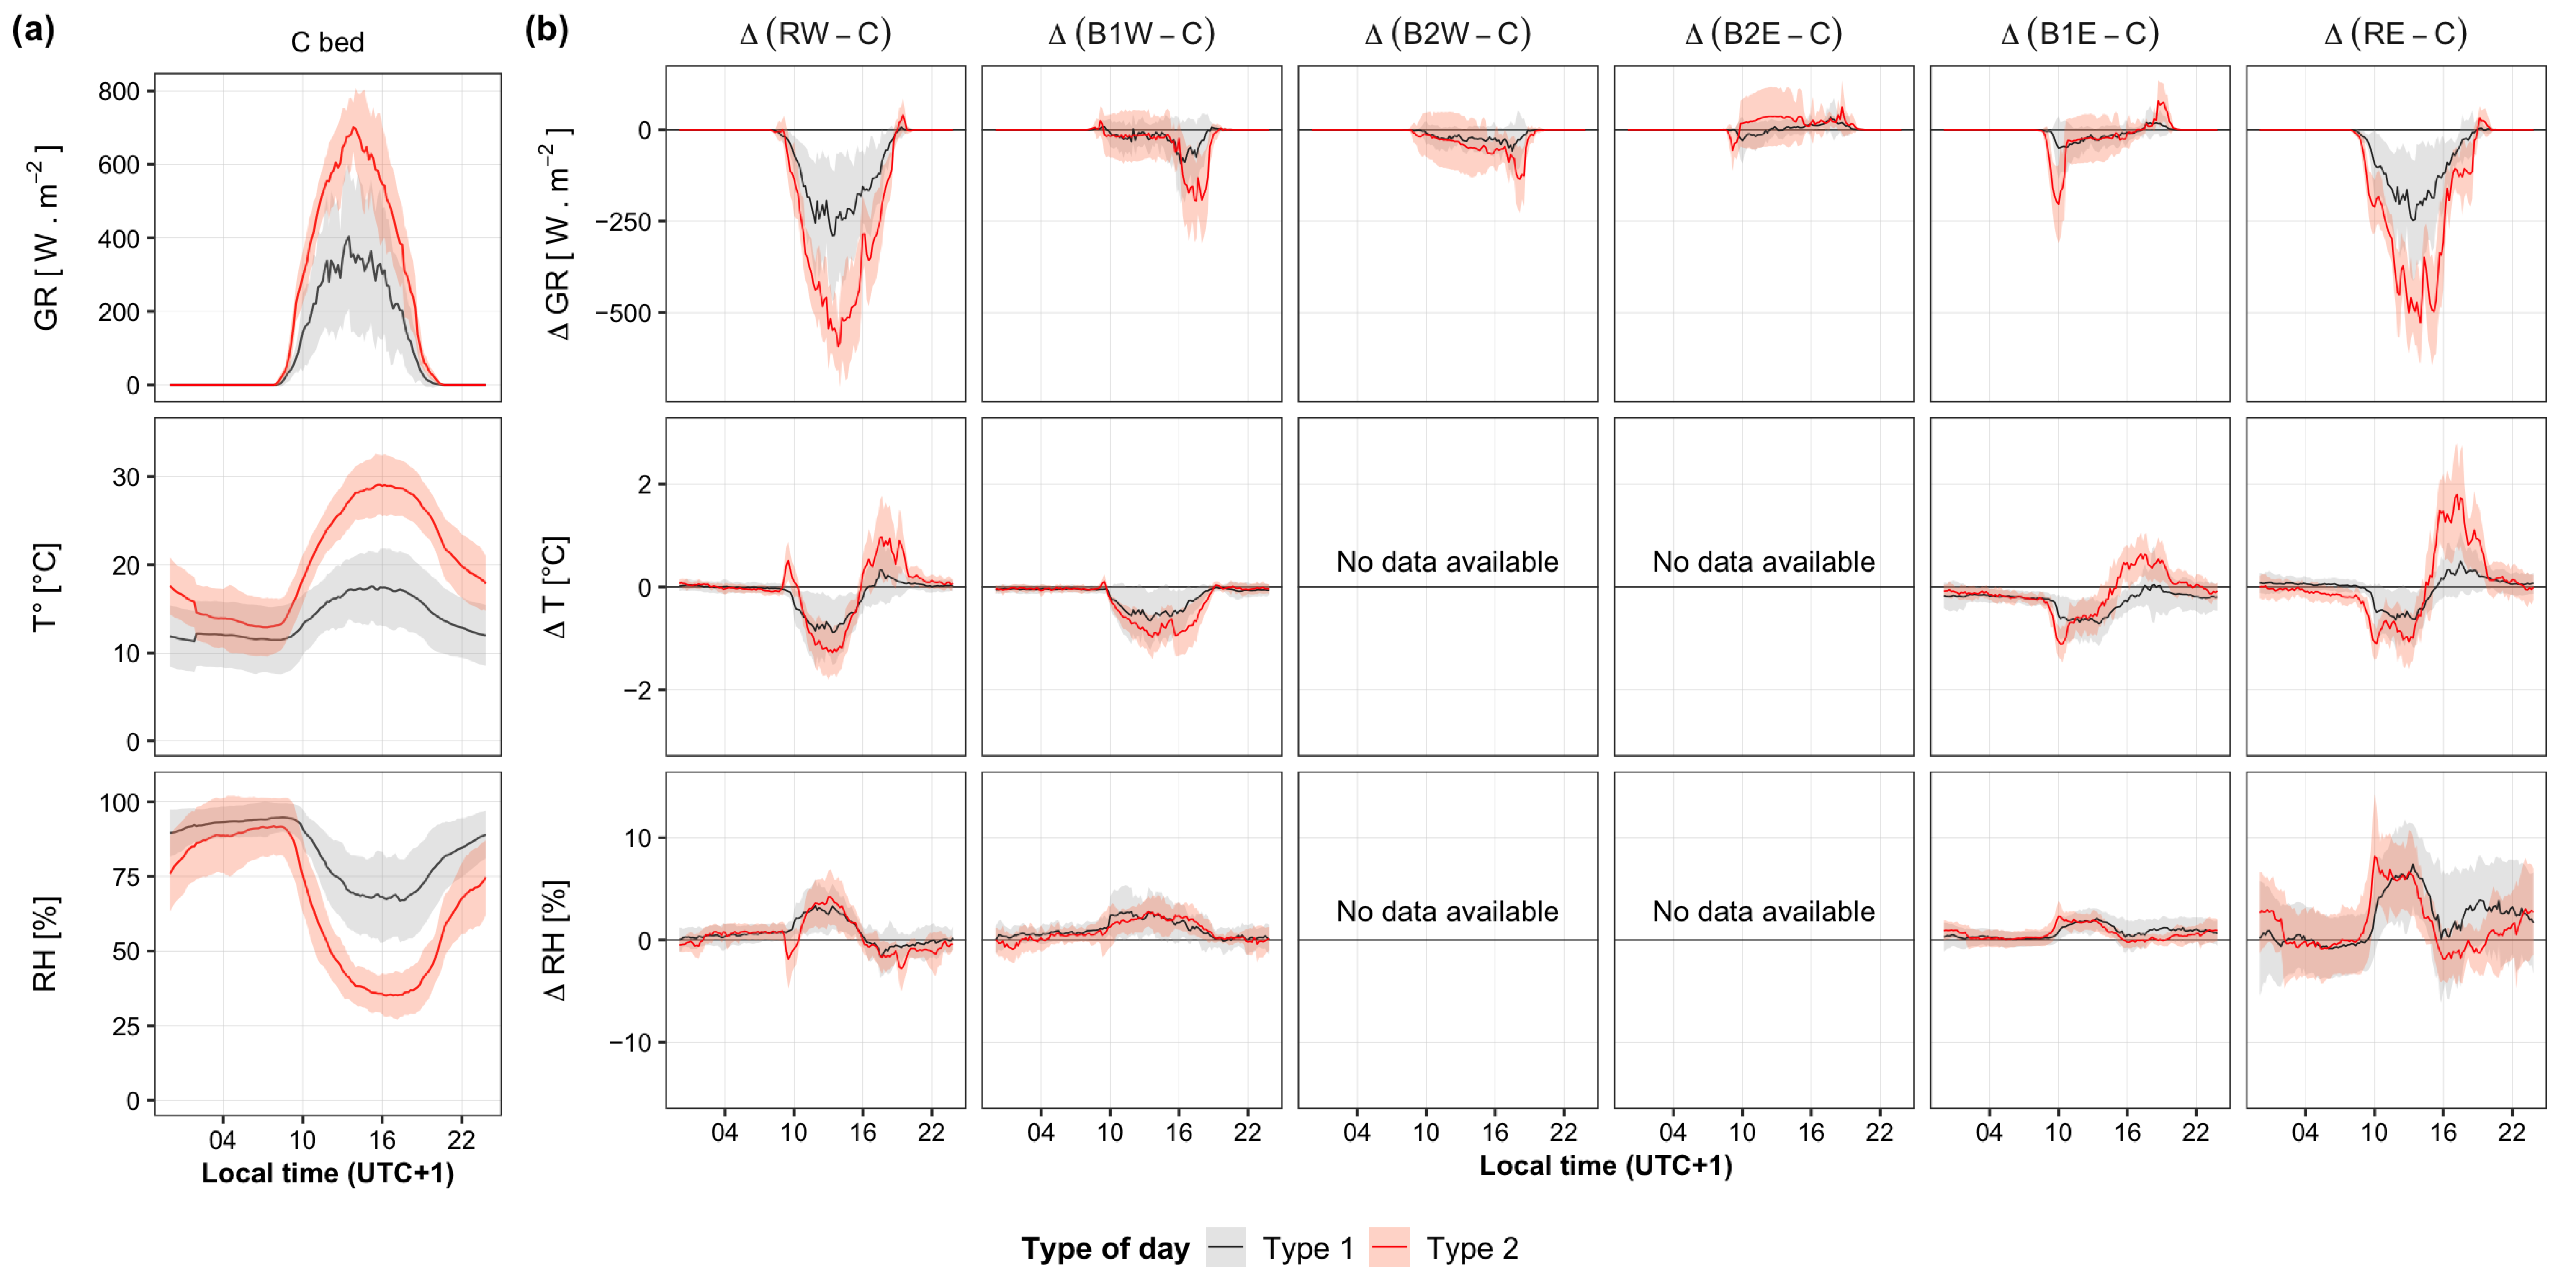
3.1. Spatiotemporal Variation of Microclimatic Conditions

Figure 2 shows the average of daily differences in global radiation (ΔGR), mean air temperature (ΔTMEAN), maximum air temperature (ΔTMAX) and relative air humidity (ΔRH) between the apple tree rows or the B1 or B2 vegetable beds and the C bed during each crop growth cycle.
The global radiation (GR) was significantly lower under the tree rows and on B1 and B2 beds compared to C (ΔGR < 0) for both cropping seasons, except on B2E where we recorded a significant positive difference (p < 0.05) during the radish crop and a non-significant difference during the lettuce crop (Figure 2a). The differences were on average 12 and 6-times greater under the tree rows than on B1 or B2 beds during the radish and lettuce growing season, respectively. We also recorded negative values of ΔTMEAN on B1 beds and under RW during the two growing seasons. ΔTMEAN was not significantly different from zero under RE, neither during the radish nor the lettuce crop (Figure 2b). The values of ΔTMAX were always negative, but differences were not significantly different from zero under the tree rows during the lettuce growing season. During the radish growing season, ΔTMAX was lower under the tree rows compared to B1 beds (Figure 2c). Finally, for both crops, air relative humidity (RH) under the tree rows and on the B1 beds was significantly higher than on C (ΔRH < 0, p < 0.001). The differences increased along a West-East gradient (Figure 2d).
During the radish growing season, cumulated GR was reduced by 69% and 63% under RW and RE, respectively, and by 6%, 3% and 2.5% on B1W, B2W and B1E. For lettuce, the reduction of cumulated GR was 60%, 57%, 10%, 9% and 7% on RW, RE, B1W, B2W and B1E, respectively. B2E received 3% and 2% higher radiation than C during the radish and lettuce growing season, respectively (Figure 3a). For both cropping seasons, the cumulated growing degree-days (GDD) was slightly lower on the B1 beds compared to C and very close between the tree rows and the C bed. Cumulated GDD on RW, B1W, C, B1E and RE were respectively 865, 855, 877, 860 and 872 °C-days for radish and respectively 682, 662, 686, 664 and 685 °C-days for lettuce (Figure 3b).
The daily maximum temperatures (TMAX) recorded on the C bed ranged from 20 °C to 41 °C during the radish growing season (Supplementary Materials, Figure S1a) while the daily mean RH varied between 50% and 75% (Supplementary Materials, Figure S1b). Differences in daily maximum temperature between B1 and C ranged from a maximum of 2 °C down to 0 °C (average difference of 1.5 °C) (Supplementary Materials, Figure S1a). The lettuce growing season was marked by two contrasted climatic conditions: (1) warm and relatively dry conditions between 31 August (planting) and 18 September (19 DAP), which were characterized by a daily TMAX ranging from 20 to 39 °C and a daily RH under 75% and (2) cool and wet conditions from 19 September (20 DAP), with a daily TMAX below 15 °C and a daily RH above 80% (Supplementary Materials, Figure S1). The daily TMAX differences between B1 and C were less than 1.5 °C during the lettuce growing season.
All days in both growth cycles were classified into typical meteorological days, by clustering. The optimal cluster number was k = 2 with a silhouette coefficient of S ( i ) = 0.61 (not shown). This separation allowed us to distinguish two types of days:
  • Day type 1: cloudy sky, with cold and humid conditions
  • Day type 2: clear sky, with warm and dry conditions
The frequency of cloudy days (day type 1) and clear days (day type 2) were respectively 28% and 72% during the radish growing season, and respectively 67% and 33% during the lettuce growing season (not shown).
On the C bed, the GR reached maximum values at around 2 p.m. (solar noon) for each day type, with an average peak of 400 W.m−2 for cloudy days (day type 1) and 700 W.m−2 for clear days (day type 2). The average maximum temperatures were 16 °C on cold days (day type 1) and 30 °C on warm days (day type 2). These were recorded at around 4 p.m. The relative air humidity exhibited maximum values in the morning, before 10 a.m., and minimum values at around 4 p.m. (Figure 4a). For each day type, we presented in Figure 4b the diurnal evolution of the mean differences in global radiation (ΔGR), air temperature (ΔT) and air relative humidity (ΔRH) between the apple tree rows or the vegetable beds and the C bed. For both clear and cloudy days, sensors installed under the apple tree rows (RW and RE) received less radiation than those on the C bed at any time of the day (ΔGR < 0). On clear days, negative differences up to −550 W.m−2 were recorded between RW and C and −500 W.m−2 between RE and C. These differences were lower on cloudy days (|ΔGR| < 250 W.m−2). Negative ΔGR was observed only in the afternoon on the B1W bed (from 4 to 7 p.m.) with a value up to −240 W.m−2 during clear days and −50 W.m−2 during cloudy days. On B2W, negative ΔGR was observed for a short period in the afternoon, only on clear days, from 4 to 5 p.m. B2E and C received approximately the same amount of GR during both clear and cloudy days. Finally, negative ΔGR up to −250 W.m-2 was recorded between B1E and C in the morning, from 8 to 10 a.m., during clear days whereas B1E and C received approximately the same amount of radiation during cloudy days.
On warm sunny days (day type 2), air under the apple tree rows was cooler than on the C bed, from 10 a.m. to 4 p.m. Maximum values of ΔT were respectively −1.5 °C and −1 °C for RW−C and RE−C (Figure 4b). The opposite phenomenon occurred from 4 p.m. to 8 p.m. (higher temperatures up to 2 °C were recorded under the tree rows i.e., ΔT > 0). Generally, it was warmer on C than on the B1 beds. Temperature differences recorded during cold days (day type 1) followed the same trends as those recorded during warmer days but with lower amplitude of variability (|ΔT| < 1 °C).
Finally, air under the apple tree rows was generally more humid than on C (Figure 4b). From 10 a.m. to 4 p.m., ΔRH up to 5% and 8% were recorded for RW−C and RE−C, respectively. The differences were lower than 2% between the B1 and the C bed. The trend and the range of variation of ΔRH were similar under both humid (day type 1) and dry conditions (day type 2).

3.2. Spatiotemporal Variation of Soil Properties

3.2.1. Soil Water Content

The lettuce growing season was marked by several heavy rainfall events (Figure 5). Cumulative rainfall recorded over the radish and lettuce growing seasons was 9 mm and 126 mm, respectively.
From 23 June (sowing of radish) to 21 July (28 days after sowing (DAS)), soil moisture at 30 cm depth was maintained at field capacity in all vegetable beds. We observed a spatial heterogeneity of soil water content (SWC) in the topsoil layer (0–30cm) after reducing the irrigation dose to 4 mm.day−1 on 28 July (35 DAS). Soil drying was more pronounced in the vegetable beds located in the eastern part of the plot (B1E and B2E) compared to those located in the western part (B1W and B2W). Thus, soil volumetric water content decreased from 0.24 cm3.cm−3 to 0.20 cm3.cm−3 in B1E and B2E, to 0.22 cm3.cm−3 in C and to 0.23 cm3.cm−3 in B1W and B2W. At the time of planting of lettuce (31 August), SWC was homogeneous among all vegetable beds (0.23 cm3.cm−3) and decreased very slowly until 17 September (17 days after planting (DAP)). After the first rainfall event (18 September), soil drying was slower in B2W, moderate in B1E, B1W and C and faster in B2E (Figure 5a).
At 90 cm depth, SWC evolution in time was steady among the vegetable beds (0.26 cm3.cm−3) and was not affected by the changes of irrigation rates, neither during the radish nor during the lettuce growing season. However, the two important rainfall periods induced a slight increase in SWC (<0.01 cm3.cm−3) (Figure 5b), indicating a slight deep infiltration through the soil profile when heavy rainfall occurs.

3.2.2. Soil Bulk Density and Soil Organic Matter

Soil surface in the B1 beds showed lower bulk density than in B2 and C beds for both growing seasons (p < 0.001) (Table 2). Soil organic matter (SOM) was up to 40% higher in B1W compared to the C bed (p < 0.001).

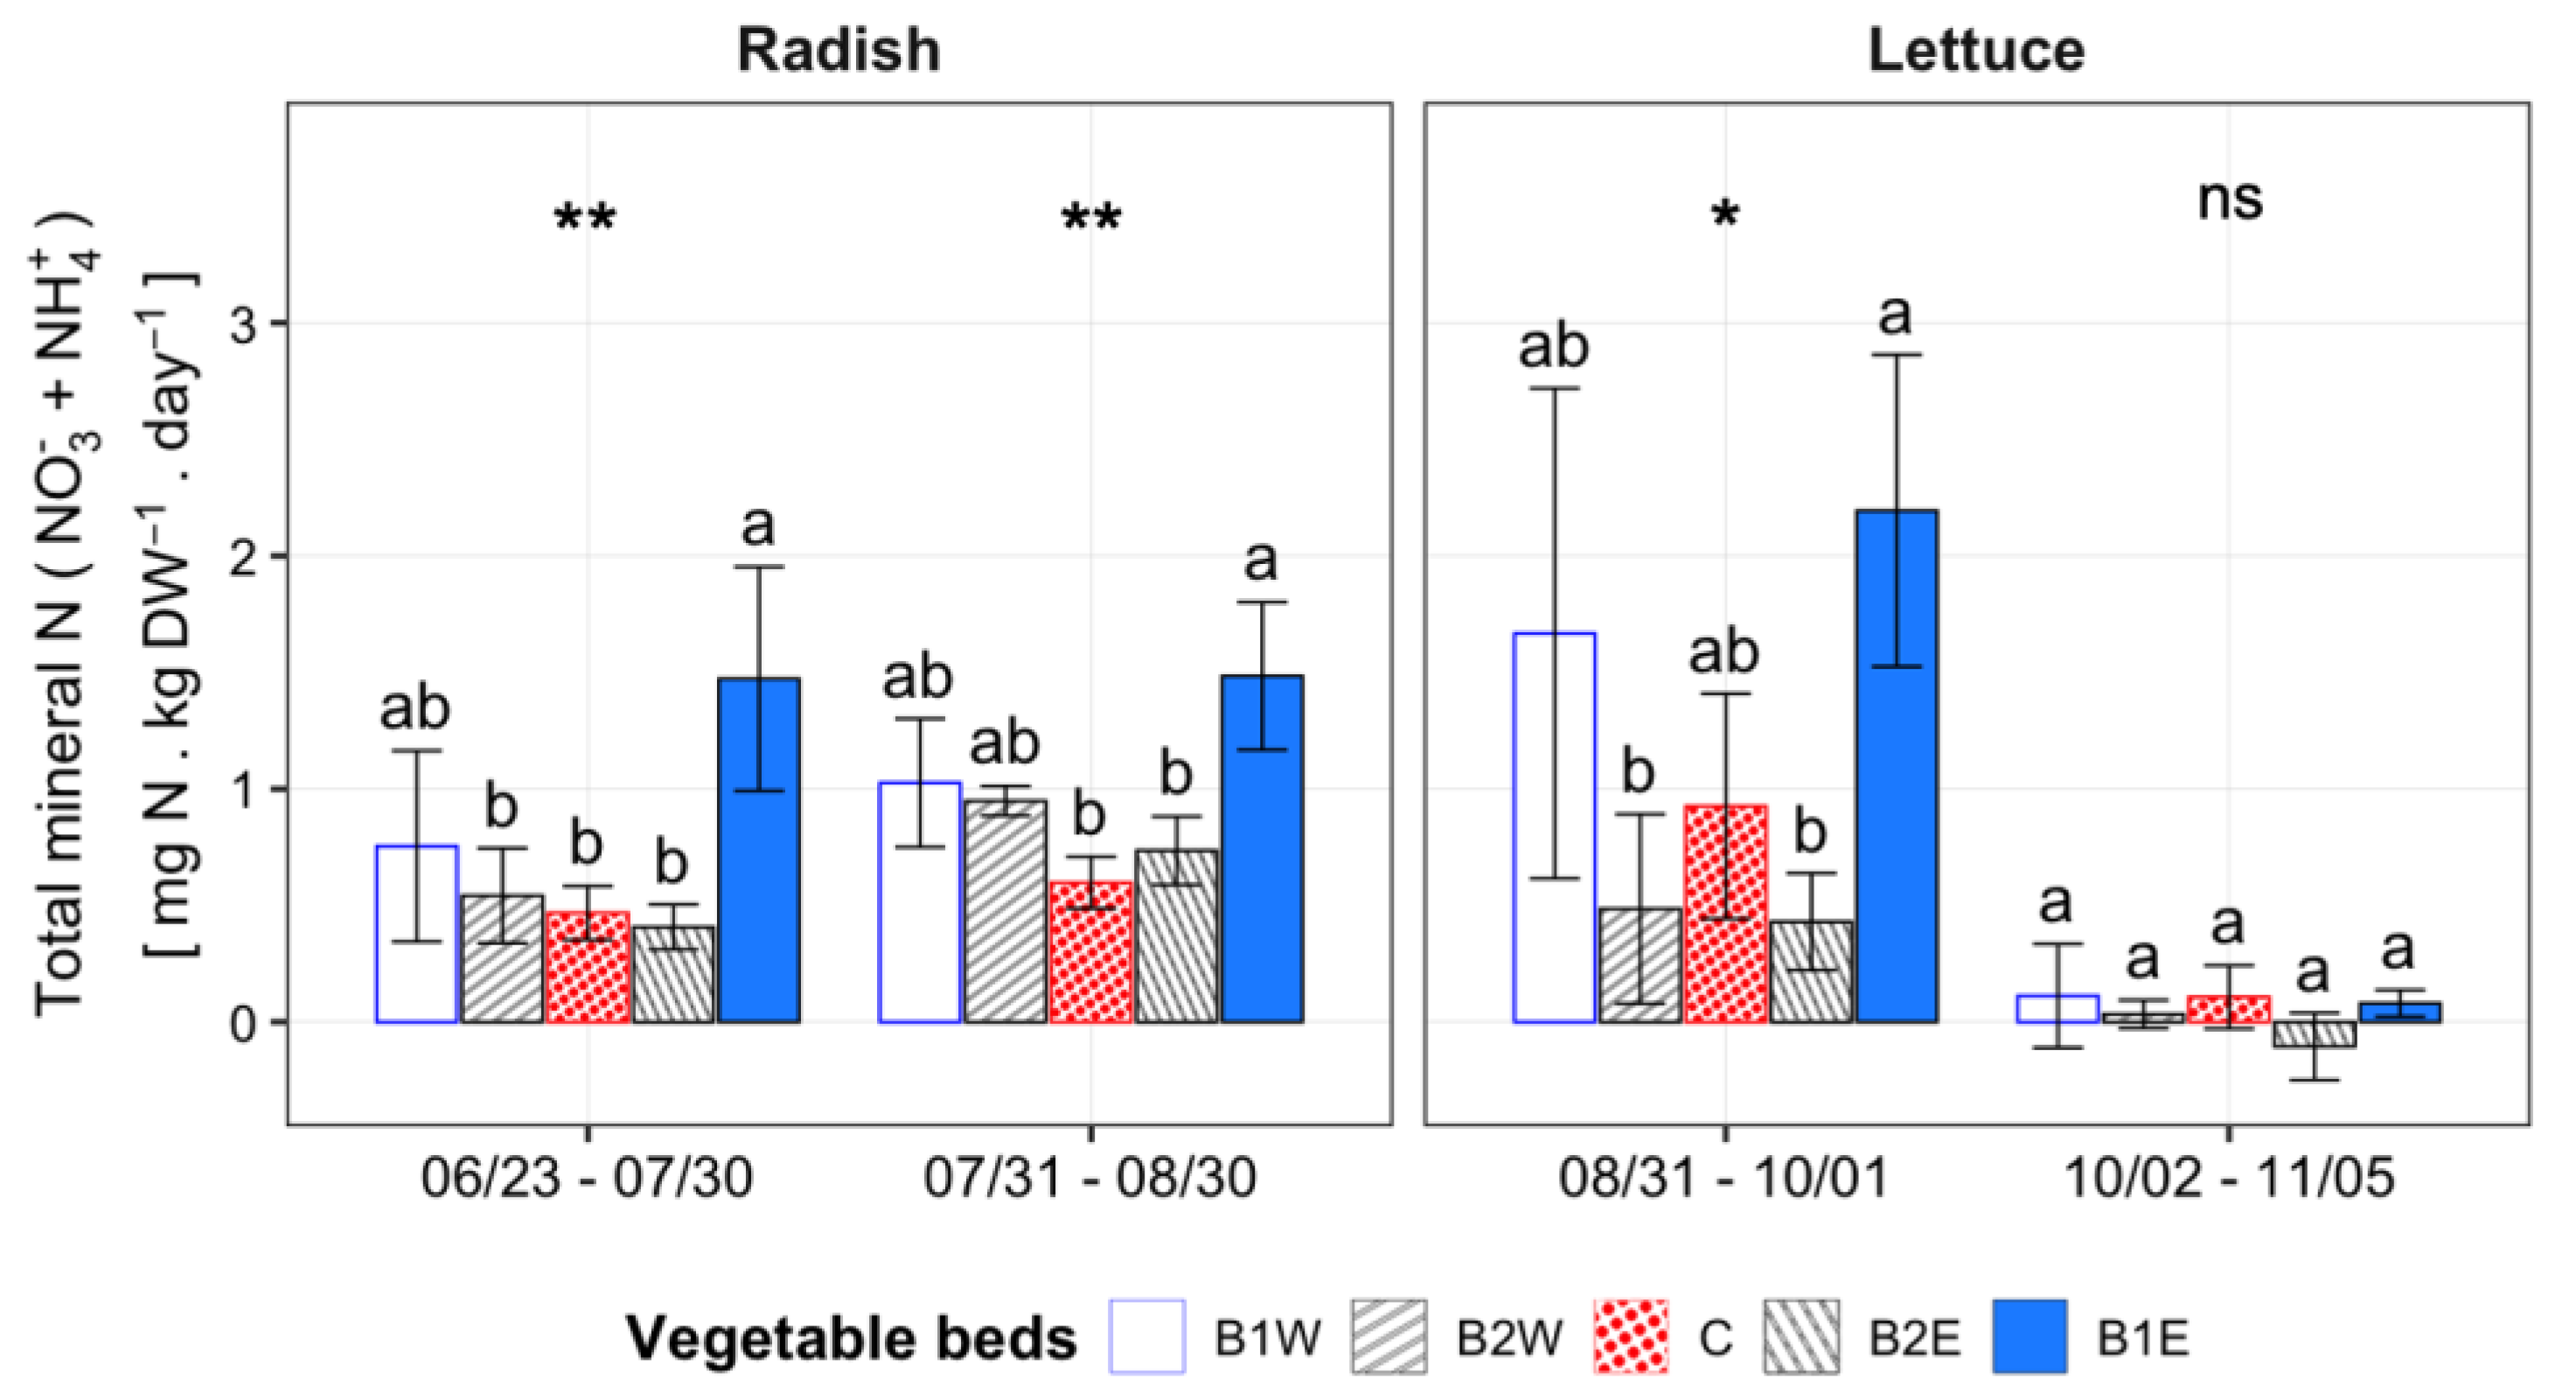
3.2.3. N Mineralization

N mineralization rates over the growing seasons in each vegetable bed are presented in Figure 6.
Mineral N production increased during the first three months (from 23 June to 1 October) in B1E, B1W and C beds and only during the first two months (until 30 August) in B2E and B2W. The production of mineral N stopped after 3 months in all vegetable beds, in October. From 23 June to 1 October, N mineralization showed a significant heterogeneity between vegetable beds (p < 0.01) with a total mineral N production up to two-times faster near the apple tree rows (B1W and B1E) (Figure 6). From 31 August to 1 October, the production of NO 3 was, respectively, 2.18, 1.62, 0.49, 0.42 and 0.43 mgN.kg−1 soil DW.day−1 in B1W, B1E, C, B2E and B2W (Supplementary Materials, Figure S2). NH 4 + accumulation was negligible in all vegetable beds during both cropping seasons (<0.5 mgN.kg−1 soil DW.day−1) (Supplementary Materials, Figure S2).

3.2.4. Soil Mineral Nitrogen

At sowing of radish, the concentrations of NO 3 in the topsoil layer (0–30 cm) were homogeneous between all vegetable beds (5 mgN.kg−1 soil DW), except in B2W where a lower concentration was observed (2 mgN.kg−1 soil DW, p < 0.01) (Supplementary Materials, Figure S3). After 37 days, NO 3 in the B1 beds increased significantly compared to B2E and C (p < 0.001): 14 and 10 mgN.kg−1 soil DW in B1W and B1E, respectively, and lower than 5 mgN.kg−1 soil DW in B2W. Soil in B2E and C showed intermediate values (5 mgN.kg−1 soil DW). At the harvest of radish (14 August), NO 3 concentrations exhibited the same pattern of heterogeneity than at 37 DAS, but with lower differences between B1 and the other vegetable beds. The concentrations of NO 3 in the 0–30 cm layer increased between the harvest of radish and the planting of lettuce. At the planting of lettuce (31 August), NO 3 in B2W was 10 mgN.kg−1 soil DW while concentrations measured in the B1E and B1W beds were up to two-times higher (p < 0.001). After 31 days (31 DAP), NO 3 decreased but still maintained the same patterns of spatial heterogeneity (Supplementary Materials, Figure S3).
The concentrations of NO 3 measured at 50 cm depth presented the same heterogeneity patterns as those measured in the topsoil layer, but with lower differences between B1 and the other vegetable beds (p < 0.01). At 90 cm depth, NO 3 were homogeneous between all vegetable beds. Finally, NO 3 were generally slightly higher in Cg layer (90–120 cm) than in BTg (50–90 cm), but the differences were not statistically significant.
The concentrations of NH 4 + were generally very low (<5 mgN.kg−1 soil DW). Differences were not significant between vegetable beds at all depths during both radish and lettuce growing seasons. Furthermore, all concentrations were homogeneous in the whole soil profile (Supplementary Materials, Figure S3).

3.2.5. Mineral Nitrogen in Soil Solution

At 30 cm depth, NO 3 concentrations in soil solution were twice as high in the B1 beds compared to C (p < 0.01), with 4.34, 6.25 and 2.51 mgN.L−1 in B1E, B1W and C, respectively, on 21 August, and 24.44, 23.08 and 11.29 mgN.L−1 on 05 October. At 90 cm depth, there was no statistical difference among vegetable beds. The measured values were below 3 mgN.L−1 for both sampling dates. The concentrations of NH 4 + were very low (<0.5 mgN.L−1) in all vegetable beds, for each depth and at each sampling date (Supplementary Materials, Table S1).

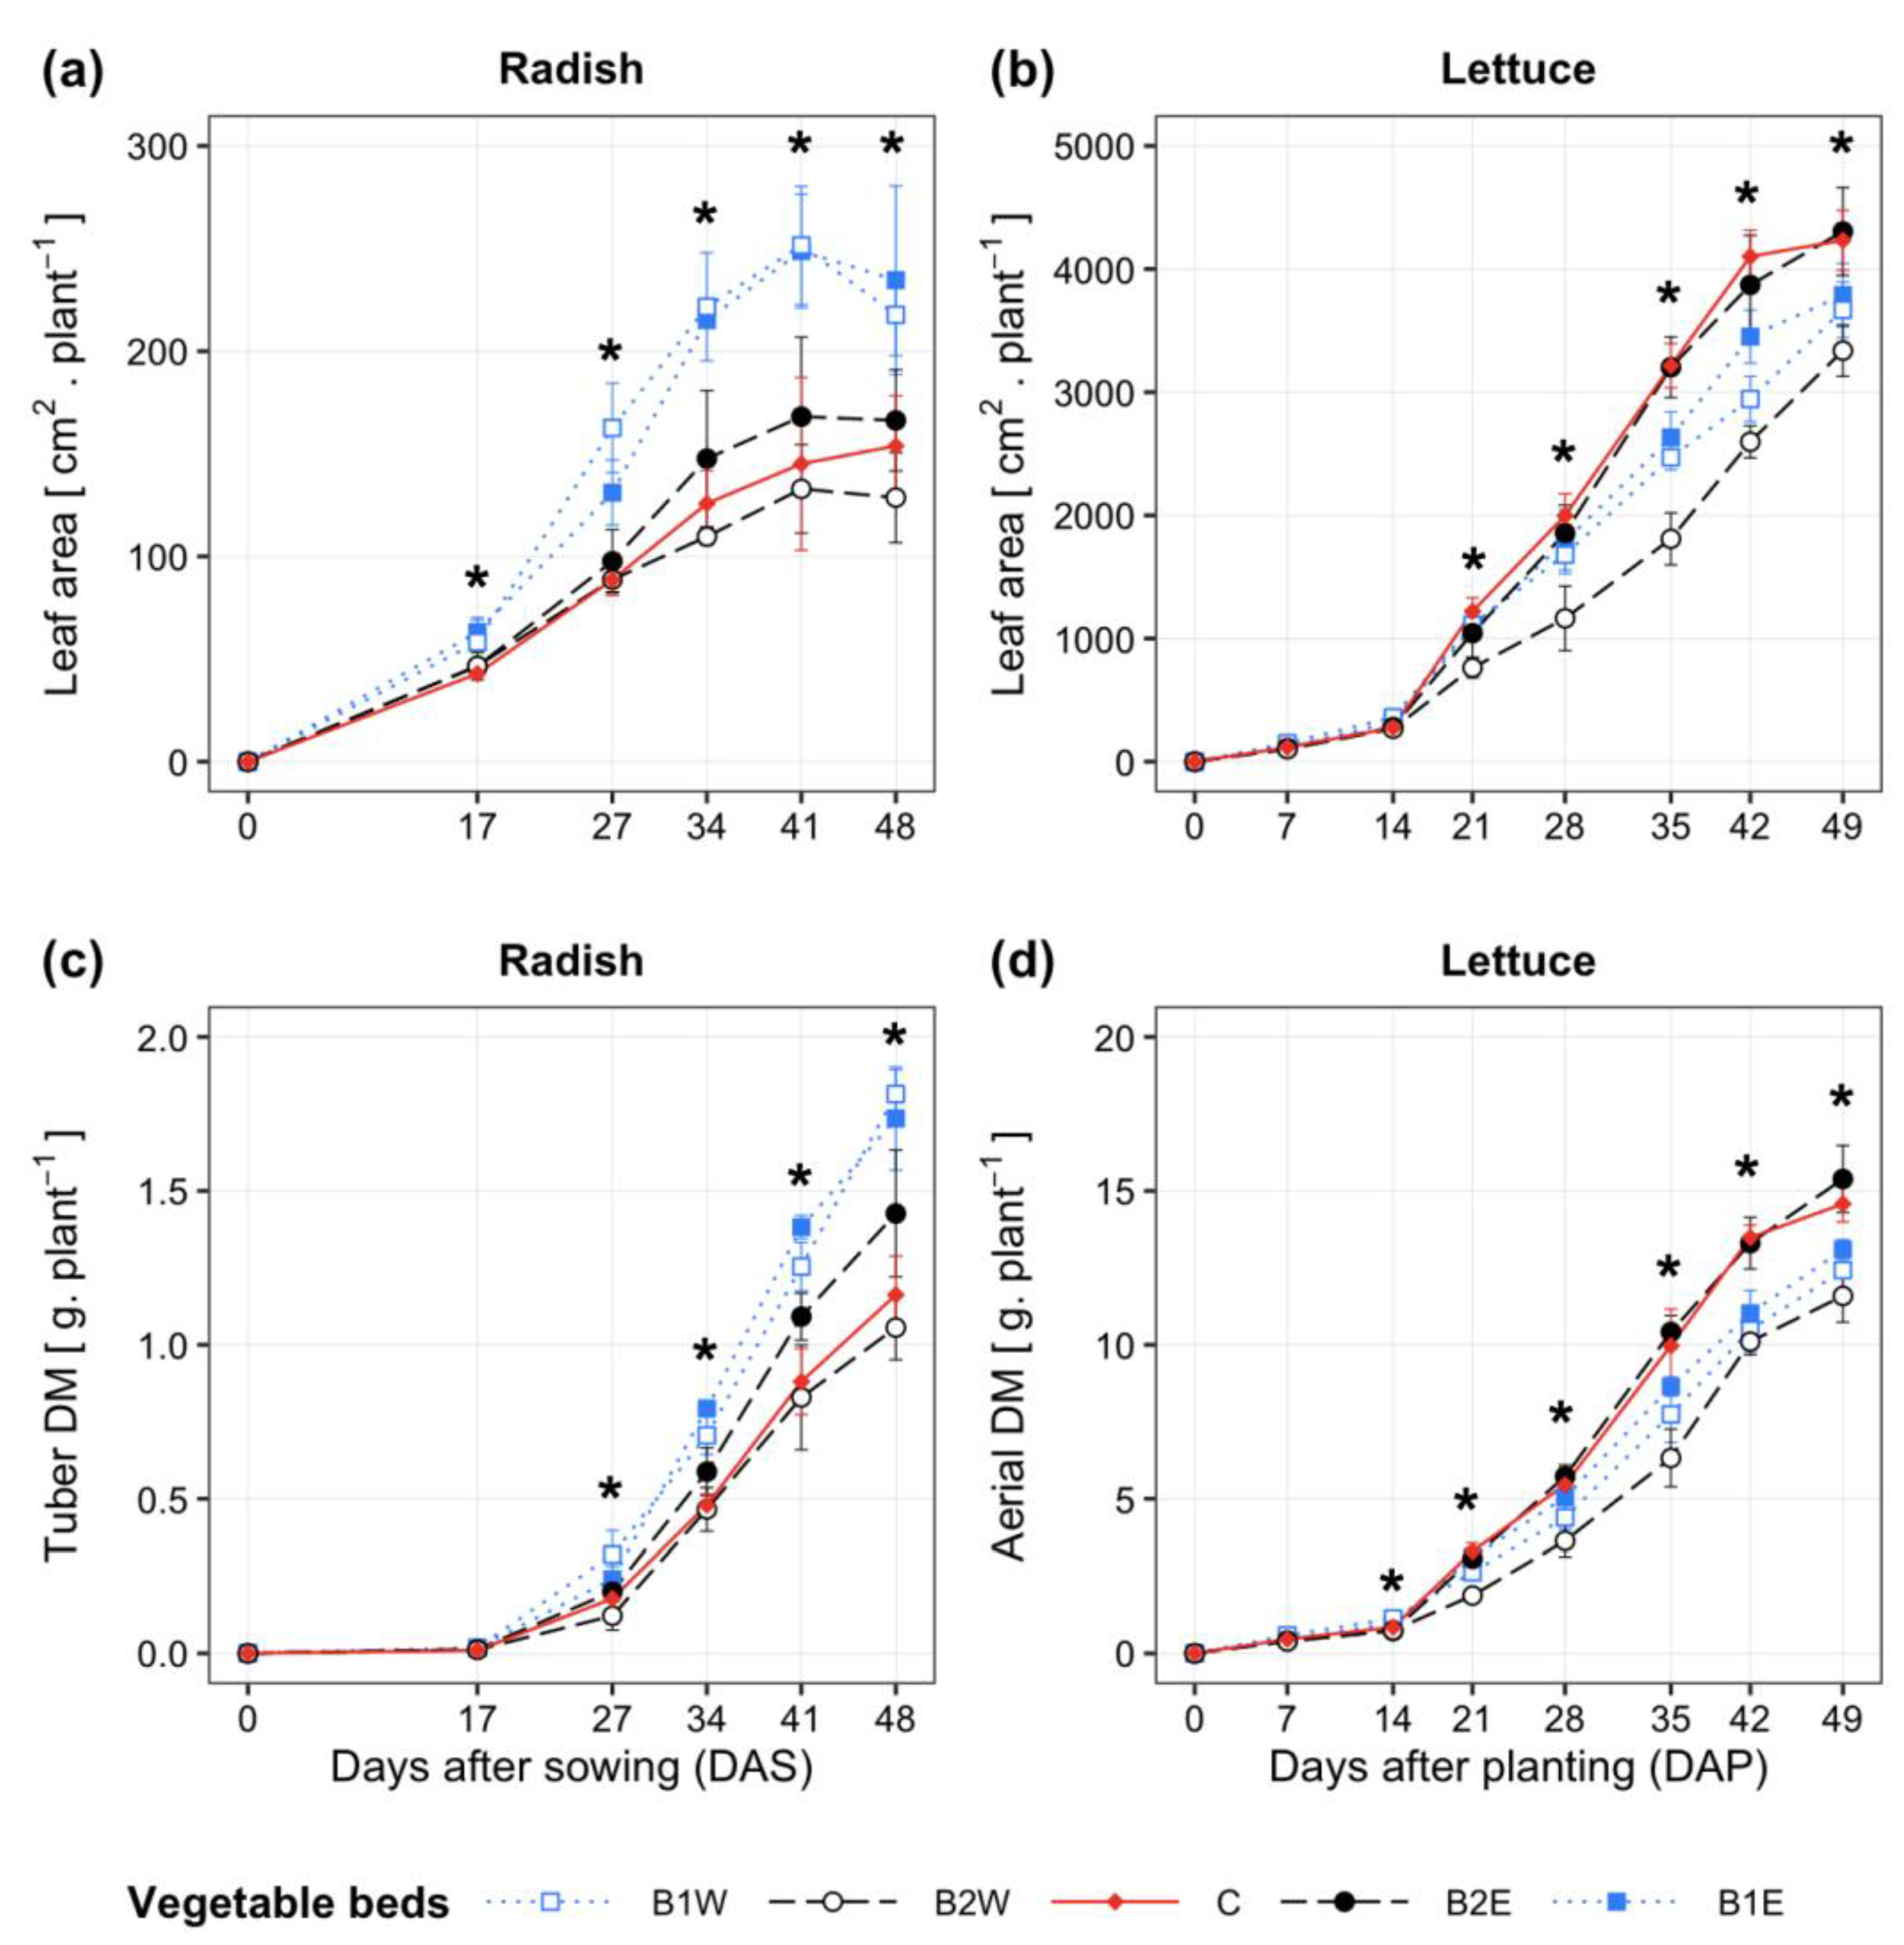
3.3. Crop Growth Properties

The two species did not show the same dynamics of leaf area and biomass accumulation on each bed. For both crops, the B2W bed always showed the lowest values of leaf area establishment and biomass accumulation among the five vegetable beds (Figure 7).
For radish, from 27 to 41 days after sowing (DAS), leaf area was significantly lower (p < 0.001) on the C bed than on B1W and B1E (Supplementary Materials, Figure S4a). The tuber dry mass showed the same trend (significant differences (p < 0.001) between B1 beds and C) from 34 to 48 DAS (Supplementary Materials, Figure S4b). The earliest difference in tuber dry mass was observed at 27 DAS, between B1W and C, with respectively 0.32 and 0.17 g DW.plant−1 (Figure 7c). The differences in tuber dry mass persisted throughout the growing season and resulted in an average of 56% and 49% higher biomass on B1W and B1E beds, respectively, compared to C and thus a significantly higher yield on these beds (28 and 29 g DW.m−2 on B1W and B1E, respectively, vs. 22 g DW.m−2 on C) (Supplementary Materials, Figure S6). Leaf areas were always slightly higher on B2E than on C but the differences were not statistically significant. The tuber dry mass measured on B2E from 34 to 48 DAS showed an intermediate value between C and B1E (Figure 7c).
For lettuce, leaf area and above-ground biomass measured on the vegetable beds located in the middle of the inter-row (C and B2E) were always higher than those measured near the tree rows (B1W and B1E) (Figure 7b,d). Significant differences between C or B2E and the B1 beds were apparent at the later stage of growth: at 35 days after planting (DAP) for the leaf area (p < 0.001) (Supplementary Materials, Figure S5a) and at 42 DAP for the biomass (p < 0.001) (Supplementary Materials, Figure S5b). At 42 DAP, lettuce plants that were grown on C and B2E beds had reached 92% and 86% of their final biomass, respectively. Leaf area and above-ground biomass of lettuce grown on B1E were slightly higher than those on B1W, from 21 DAP, but differences were not significant. Therefore, the final yield of these two beds were very similar (Supplementary Materials, Figure S6).

3.4. Correlations between Variables

Pearson’s correlation coefficients between microclimatic conditions, soil properties and crop growth are presented in Table 3.
The final biomass of radish was positively correlated with the leaf area (r = 0.77, p < 0.01), the SOM concentration (r = 0.71, p < 0.01) and the N mineralization (r = 0.63, p < 0.05). We observed a very strong negative relationship between the biomass and the soil bulk density (r = −0.86, p < 0.001). The final above-ground biomass of lettuce was positively correlated with the leaf area (r = 0.88, p < 0.001) and the cumulative GR (r = 0.88, p < 0.001). Unlike in radish, lettuce biomass showed a negative relationship with SOM (r = −0.53, p < 0.05).
Soil bulk density and SOM were negatively correlated (r = −0.77, p < 0.01 during the radish growing season; r = −0.82, p < 0.01 during the lettuce growing season). N mineralization was positively correlated with SOM (r = 0.82, p < 0.01 during the radish growing season; r = 0.59, p < 0.05 during the lettuce growing season).

4. Discussion

We discuss below how the microclimatic conditions and the soil biophysicochemical properties vary with the distance to the apple trees and how these effects can impact the growth of the two studied vegetables.

4.1. Effects of Apple Trees on the Spatial and Temporal Variations of Microclimatic Conditions

The results of this study confirmed the expected direct effect of apple trees on the modification of the daily GR, air temperature and relative air humidity on vegetable beds located near the tree rows. The shading effect was clearly expressed on the B1 beds and decreased or even disappeared on the B2 beds. In contrast to continuous cover forestry systems where light attenuation was spatially homogeneous under the canopy [52], light attenuation presented a considerable diurnal variation in hedgerow systems depending on the shadow patterns [53]. In the morning, the rising sun shone directly on the westernmost vegetable beds in the inter-row. The eastern beds, on the other hand, were shaded by the eastern apple tree row. In the afternoon, the azimuth of the sun gradually increased while the solar elevation declined. Thus, the western apple tree row cast a shadow on the western vegetable beds. The duration of the shading effect was not the same near each row. The afternoon shading at the west side of the inter-row remained in place for a longer time than the morning shading at the east side (Figure 4b) and lead to a lower average daily GR received on the western vegetable beds (B1W and B2W). This is mainly due to the diurnal evolution of the azimuth and the altitude of the sun.
The spatial variation of GR was modulated by the weather conditions. Indeed, we observed that GR differences were amplified on sunny days while they were less apparent on cloudy days (Figure 4b). Renaud and Rebetez [54] found the same trend with respect to photosynthetically active radiation (PAR) in forestry systems. There was also an occurrence of a seasonal variation in our study. We observed a clear decrease in cumulative GR on all vegetable beds between the two growing seasons (Figure 3a), which logically resulted from two factors: the more frequent occurrence of cloudy days during the lettuce growth cycle (28% for radish vs. 67% for lettuce, data not shown) and the evolution of solar angle [55]. Solar elevation declined from 65° to 45° between the radish and the lettuce growing season, which should have decreased both the cumulated GR on each vegetable bed, under the tree rows and the GR differences between B1 and C. However, these two last effects were not observed (Figure 3a). Under the tree rows, the seasonal decrease in GR may have been compensated by lower light attenuation by the canopy due to autumnal senescence of leaves which occurred during the lettuce growing season.
The shading effect contributed, at least partly, to the variation of the daily air temperature and relative humidity. For temperature, Monteith et al. [56] suggested that generally in agroforestry systems, air in a sheltered area is cooler than in an exposed one. Our results corroborate Monteith’s affirmation as we found that depending on the time of day, temperatures were up to 1.5 °C lower on B1 beds than on C (Figure 4b). Rodrigues et al. [57] have found the same order of temperature difference in a mango orchard in Brazil but in their studies, mango trees were taller (6.5 m) and the inter-rows wider (10 m) than in our experimental plot. For relative air humidity, we found that the B1 beds were generally more humid than C. This result is consistent with Beer et al. [58] who reported higher relative humidity in shaded coffee and cacao agroforestry system.
In our study, the lower differences in GR between the B1E and C beds were conversely associated with greater differences in maximum and mean air temperatures and relative humidity between these two beds (Figure 2). This indicates that the shading effect alone is not sufficient to explain the differences in air temperature and humidity and there are other factors that should be considered such as wind direction, turbulent air movement and tree transpiration. Indeed, trees can refresh the air near their canopy by transpiration of water vapor [59]. Transpiration from the grass strip at the base of the apple trees could have also reduced air temperature and increase relative humidity under the rows, as reported by Meng et al. [60] in an apple orchard in China. The contribution of transpiration in temperature attenuation should be further investigated in future studies.
In contrast to the previous described process (attenuation of temperature near the trees), our results showed that the air under the apple tree rows was up to 2 °C warmer in the late afternoon (Figure 4b). This complies with Taha et al. [61] who found 1.5 °C higher temperature under an orchard canopy compared to an open-site during the evening and night hours, during clear and calm weather conditions. Indeed, trees may have provided a warming effect on microclimate during nighttime as demonstrated by several authors [62,63]. The apple tree canopy may have acted as an obstacle to the dispersion of heat from the ground that was warmed up during the daytime. Indeed, in the evening, the longwave radiation emitted from the ground to the tree can be reflected, absorbed by the canopy and re-emitted back to the ground [64]. Furthermore, tree trunks and branches were reported to be important heat sources as they can absorb shortwave radiation during daytime, especially at low sun angles [65]. This phenomenon may probably amplify the warming effect under apple trees in the late afternoon.

4.2. Effects of Apple Trees on the Spatial Variation of Soil Properties

4.2.1. Soil Water Content, Soil Organic Matter and Bulk Density

The insignificant spatial difference in soil moisture during the early stage of radish growth is mainly due to the influence of irrigation. The water competition that was frequently mentioned by several authors in agroforestry systems [66,67] does not seem to have been the main factor for the spatial variation in soil water content (SWC) encountered in our study during the late stages of radish growth (Figure 5), where water restriction has been applied. Indeed, if tree uptake was the driving factor of the spatial distribution of soil moisture, we should have observed a lower SWC in both B1W and B1E vegetable beds than in C in the surface or in the deeper horizons, as these beds were located close to the tree rows. However, this was not verified in the B1W bed at 30 cm depth while at 90 cm depth, SWC was homogeneous between all vegetable beds. The most remarkable result of our study was the very marked decrease in SWC along a West-East gradient in the surface layer during the late growth stage of radish. The possible benefits of reduced soil evaporation and crop transpiration close to the tree row, as reported by several authors in agroforestry systems [68,69,70], seem to be evident in our study. Indeed, during the warmest period of the day when the potential evapotranspiration was at its maximum, the eastern beds (B1E and B2E) were directly exposed to sunlight, resulting in a rapid drying of the soil, while the western beds were shaded and therefore were subjected to lower evapotranspiration. This SWC gradient was almost not perceptible during the lettuce crop, which, unlike the radish, was grown on a plastic mulch. As plastic mulch is known to prevent direct contact with turbulent air and to significantly reduce soil evaporation, we can assume that soil evaporation would have been more involved in this West-East SWC gradient rather than plant transpiration. Beyond the distribution of SWC with distance from the tree rows, the differences between the east and the west sides of the rows were an interesting result for the design of Garden-Orchard systems. We expected soil moisture to be spatially variable at 90 cm depth, as trees can use water from deep soil layers through their deeper root system [66], thus, the B1 vegetable beds would have a lower SWC. However, in our experiment, the apple tree roots were not well developed neither in depth nor laterally, probably due to the high bulk density of the intermediate and deeper horizons (Table 1), which may have limited the maximum depth of their penetration [71]. We also suspected a subsurface lateral flow due to the high bulk density of the intermediate soil layer which could explain the SWC homogeneity over time at 90 cm depth, despite several changes in irrigation rates.
The presence of apple trees had a direct effect on soil organic matter (SOM) and the soil bulk density, and particularly in the B1 beds. The higher SOM concentration in the B1 beds is firstly related to a higher supply of leaf-litter (data not shown), as already reported in different agroforestry systems [72,73]. Effectively, the presence of perennial trees leads to an annual fall of leaves and twigs leading to an enrichment of organic matter in the topsoil layer. Upson and Burgess [74] have found higher soil organic carbon (SOC) under the tree rows than in the inter-rows in a poplar silvoarable agroforestry system. Our results showed a similar trend as we observed a significantly higher SOM under the apple tree rows than in the vegetable beds (not shown). Furthermore, our study provides more information on the spatial variability of SOM in the inter-row. Unlike Cardinael et al. [75] who found homogeneous SOC in the inter-rows of five agroforestry systems in France, we observed a decreasing gradient of SOM with increasing distance from the apple tree rows. The factor that has been reported in Cardinael’s study was the compensation of the additional C inputs from trees near the tree rows by a lower input of organic C from the crop residues, due to lower yields. In our study, crop residues were always exported, which probably led to the heterogeneity of SOM induced by apple trees in the inter-row. Another C supply near the apple trees would be the root turnover and the secretion of root exudates either by the trees or by the herbaceous grass strip located under the rows, which could have increased the SOM pool in the tree rows and in the vegetable beds closest to the rows [76]. This would need further investigations.
The lower soil surface bulk density in the B1 beds may be due to the improvement of the soil structure on these beds through the lateral expansion of the herbaceous grass growing under the tree rows. It can also be explained by the higher amount of SOM in these beds. Indeed, we found that SOM was negatively correlated with bulk density, as observed by Arvidsson [77] from 96 measurements conducted on field-experiments in Sweden. As organic matter has generally a lower particle density [78] and can increase soil porosity [79], its higher amount logically reduces soil bulk density.

4.2.2. N mineralization and Soil Mineral Nitrogen

The various effects of apple trees, as previously discussed, would provide a better understanding of the spatiotemporal variation of N mineralization, which is very different between the B1 and the other vegetable beds (Figure 6). The higher SOM measured near the tree rows is an explanatory factor but is not sufficient to explain neither the higher mineralization rate observed in B1E than in B1W, although B1W presented a higher SOM concentration (Table 2), nor the peak of mineralization rate observed on 1 October in the B1 beds. Indeed, N mineralization was also driven by soil temperature and SWC [80]. In cropland soils, N mineralization increased sharply with temperature, particularly between 25 and 35 °C [81]. The mineralization rate in B1E could therefore have been favored by the warmer conditions on the east side of the inter-row during the afternoon (Figure 4b), as discussed before. Regarding the influence of SWC, active soil N mineralization occurs at 60–80% of the water holding capacity [80] but can be limited by oxygen supply under conditions of very high moisture [82]. Guntiñas et al. [81] found lower mineralization at 100% of field capacity than at 80% which is consistent with the lower N mineralization rate that we measured in B1W compared to B1E, as B1W showed a slightly higher SWC than B1E. The peak of mineralization rate observed during the lettuce growing season would be probably linked to the effect of the plastic mulch by increasing soil temperature and therefore enhancing N mineralization as reported by Hai et al. [83] while the low N mineralization from 1 October to 5 November could be attributed to a lower temperature (<15 °C). Another relevant factor that can explain the spatial variability of N mineralization observed in our study is the soil microbial activity. Guillot et al. [84] reported for a hybrid walnut-tree alley cropping system that the microbial biomass was negatively correlated with distance from the trees. They found that the soil microbial biomass was close to two-times higher under the tree rows than at 6.5 m from the row. Furthermore, Yao et al. [85] have shown in apple orchards that the presence of the grass strip can improve abundance and diversity of the soil microbial community. We can therefore assume that soil microbial activity may have been intensified in the B1 beds due to the proximity to the apple trees and the herbaceous grass strip under the rows. This may explain the higher rate of N mineralization in B1 beds compared to B2 and C beds yet this needs to be further investigated. Exudates from the roots of apple trees and the herbaceous grass strip may also have stimulated microbial decomposition of SOM near the tree rows, as reported by Meier et al. [86]. Further experiments would be needed to conclude on this point.
The differences in N mineralization rates would logically explain the distribution of the soil mineral N content between vegetable beds. Regarding soil N solution content, it is difficult to assess the efficiency of apple trees in reducing nitrate leaching. Although the nitrate concentration was very low in the soil solution in the deep horizons, it would be more attributed to low soil N content as the vegetable beds were not fertilized. However, there could be a risk of nitrate leaching in the B1 beds given the higher nitrate concentrations in the soil solution in soil surface in these beds at the end of the lettuce growing season (Supplementary Materials, Table S1).

4.3. Effects of Microclimatic Conditions and Soil Properties on Vegetable Growth

Climatic variables mainly impact the photosynthetic rates, and therefore the biomass accumulation and also drive the allocation of assimilates between the above-ground and the below-ground parts of the plant [87]. According to the “functional equilibrium” concept [88], plants affected by below-ground resources deficiency (nutrients, water, etc.) will allocate more biomass to the roots whereas they will allocate more biomass to the shoots in case of above-ground resources limitations (light, CO2, etc.). This assumes that under shaded conditions, the biomass accumulation should have been favored on leafy vegetables than on root vegetables, which was not the case in our study. Thus, in our study, the biomass of the edible parts of each vegetable might have been less affected by the partitioning of assimilates than by the direct effects of microclimatic conditions on the photosynthetic activity. The evaluation of photosynthetic activity involves on the one hand the photosynthetic light-response curve and its modulation by temperature and leaf N content [89], and on the other hand the regulation of stomatal opening by light, temperature and relative humidity [90]. It also depends on the functional traits of each species. Four parameters of the light-response curve vary significantly between radish and lettuce: (1) the light-saturated net photosynthetic rate (35 μmol CO2.m−2.s−1 for radish vs. 20.2 for lettuce), (2) the light compensation point (29 μmol CO2.m−2.s−1 for radish vs. 36.2 for lettuce), (3) the light saturation point (1366 μmol CO2.m−2.s−1 for radish vs. 1055 for lettuce) and (4) the quantum yield (60 mmol CO2.mol−1 photons for radish vs. 74 for lettuce) [91,92]. Given the respective light-response curve profile of each species, radish can more easily acclimatize to a change in light environment than lettuce. This means that shading would have less impact on the photosynthetic activity of radish than on that of lettuce. Indeed, since the quantum yield of lettuce is greater and its light-saturated photosynthetic rate lower, a reduction in light will lead to a very rapid decrease in its photosynthetic capacity, which is consistent with the lower biomass observed on the B1 beds from 21 to 49 days after planting in our study. Cometti et al. [93] have recently found a rapid reduction in biomass of lettuce when level of shade was above 50%. The photosynthetic activity is modulated by temperature as high temperatures are known to favor both plant respiration and transpiration, leading to lower radiation use efficiency and limited photosynthesis [94]. For radish, Oh et al. [91] found a maximal photosynthetic rate at 24 °C and an exponential decrease above 30 °C. This assumes that in our study, the attenuation of high temperatures on the B1 beds (Supplementary Materials, Figure S1a) would partially explain the increase of biomass on these beds. For lettuce, Jie and Sing Kong [95] showed that lettuce grown under day temperatures ranging between 26 and 41 °C exhibited lower values of both light-saturated photosynthetic rate, maximum photosynthetic rate, and quantum yield. Therefore, in our study, the high temperature attenuation by shading would explain the higher biomass on the B1 beds at the early stage of growth (14 days after planting) (Supplementary Materials, Figure S5b) where the daily maximum temperature ranged from 25 to 39 °C (Supplementary Materials, Figure S1a). Even though lettuce plants grown on these beds received less radiation due to the shading effect, they could have adopted a morphological adaptation by optimizing their leaf arrangement to intercept more light [19]. On the other hand, below 25 °C (optimum temperature for photosynthesis), a small rise in temperature can greatly promote the photosynthetic rate and thus the growth of lettuce [96]. Ouyang et al. [97] have observed an increase by 38% in lettuce yield by increasing the temperature from 16 °C to 20 °C. In our study, 18 days after planting (18 September), rainfall decreased the maximum air temperature below 20 °C (Supplementary Materials, Figure S1a) and thus created a more favorable environment for lettuce growth. As the C beds showed higher temperature than the B1 beds during almost the whole lettuce growing season (Supplementary Materials, Figure S1a), we can assume that the higher biomass observed from 21 to 49 days after planting on the C bed confirm Ouyang’s results. Even if high temperature stress occurs during the early stages, lettuce can grow normally once the normal growth temperature is regained and if the physiological bolting stage has not been reached [98].
Authors have generally reported a negative effect of soil compaction on crop development and yield [99]. The decrease in soil bulk density in the vegetable beds closest to the apple tree rows would therefore enhance the biomass of both radish and lettuce crops in our study. This effect was observed on radish as our results showed a very high negative correlation between soil bulk density and root biomass. Adekiya et al. [100] found the same correlation in a two-year field experiment. Tuber growth was probably limited in the B2 and C beds because of the increase of the root penetration resistance in the soil, due to high bulk density [101]. For lettuce, the opposite phenomenon was observed i.e., higher biomass on vegetable beds, which presented higher bulk densities. This result is in line with the study of Azzi et al. [102] who found a greater leaf area and a higher aboveground biomass on lettuce grown in more compacted soils. According to the authors, an increase in the absorption of nutrients and water through the enhancement of the contact between roots and soil substrate by the compaction could explain this effect. The values of soil bulk densities studied in Azzi’s experiments were very close to ours (1.2 g.cm−3 and 1.4 g.cm−3).
Higher soil mineral nitrogen (SMN) would enhance the plant biomass production through its favorable effect on the photosynthetic activity. It was verified in our study, especially on radish, as leaf area and tuber dry mass were higher on the B1 beds compared to B2 and C during the whole cropping season. Several authors have already shown that higher N levels improve radish growth and yield [103]. In our experiment, the improvement of SMN in the B1 beds resulted from higher SOM concentration and a higher mineralization rate, as previously discussed. However, for lettuce, vegetable beds with higher SMN (B1E, B1W) showed lower yield than beds with lower SMN (C, B2E). SMN therefore appeared to be sufficient to ensure a normal growth of lettuce on all vegetable beds, except on B2W where we observed a lower biomass accumulation. This means that in our study, where no N fertilizer was applied, N was not a limiting factor for lettuce growth except on B2W where the growth was limited by N stress and probably by lower incident radiation due to shading.
The spatial variation of soil water content (SWC) induced by apple trees did not affect the final yield of both crops. Indeed, we did not find significant differences in yield of radish between B1E and B1W beds which showed a very contrasted SWC at the late stage of the crop cycle. This is in line with the results of Kang and Wan [104] who found that lower soil moisture occurring at the late growth stage (32 days after sowing) did not have a significant impact on radish development and yield, but decreased the market quality of the tubers by increasing their cracking rate. Similarly, for lettuce, as SWC were almost homogeneous between all vegetable beds during the whole growing season, we cannot point out a water stress effect to explain the heterogeneity of lettuce growth among the vegetable beds.
In summary, it seems that in our study, SMN and bulk density were the primary limiting factor for the growth of radish while lettuce growth was primarily affected by the microclimatic conditions, especially temperature and cumulated radiation. High temperatures slowed down the growth of both crops.

5. Conclusions

To our knowledge, this work is among the first attempts to investigate the spatiotemporal variations of both microclimate, soil properties, and the growth of vegetables in garden-orchard systems. Our study showed that apple trees create a specific microclimatic condition in their surroundings which decreases with distance from the rows. Trees also modified the soil surface physico-chemical properties in the vegetable beds near the rows: SOM was higher, which enhanced the N mineralization rate whereas soil bulk density was lower. To better understand the dynamics of SOM biodegradation, the processes occurring in the apple tree rhizosphere will be investigated, especially the sensitivity of soil microorganisms to root exudates, which may induce significant variability in N mineralization. The variations induced by the apple trees on the microclimatic conditions and the soil properties differently affected the agronomic performances of the two studied vegetables: the yield of radish was higher on the vegetable beds close to the trees while the opposite trend was observed for lettuce. Our results allow us to conclude on three points: (1) among all the effects of fruit trees in Garden-Orchard systems, some correspond to ecosystem services that enhance the growth of vegetables, while others correspond to disservices; (2) the interactive effect of these services and disservices on the growth of vegetables are species-dependent; (3) the classification of tree effects into ecosystem services and disservices may vary according to season and climate i.e., a positive effect during one period of the year (for e.g., the temperature attenuation in summer) may become a disservice at another period. These three statements imply that the specific traits of each vegetable species should be further investigated in garden-orchard systems, in addition to the interactive effects of microclimatic conditions and soil properties and their seasonality. To do so, a purely experimental approach seems to be very time-consuming and complex. Therefore, a modeling approach will be performed by adapting the Hi-sAFe model [105] to garden-orchard systems in order to characterize these effects and to test several scenarios of spatial arrangement and crop associations/successions that optimize the agro-environmental performance of garden-orchard systems.

Supplementary Materials

The following are available online at www.mdpi.com/article/10.3390/agronomy11091888/s1, Figure S1: Evolution of daily maximum air temperature (a) and daily mean relative humidity (b) on the C bed and differences between the B1 and the C bed. Figure S2: Nitrate and ammonium production rates in the upper soil layer (0–15 cm) in each vegetable bed during each growing season. Figure S3: Evolution of the N mineral concentration in the soil profile at plantation, in the middle of the crop cycle (37 days after sowing (DAS) for radish, 31 days after planting (DAP) for lettuce) and at harvest during each growing season. Figure S4: Evolution of the leaf area (a) and the tuber dry mass (b) of radish on each vegetable bed. Figure S5: Evolution of the leaf area (a) and the aerial dry mass (b) of lettuce on each vegetable bed. Figure S6: Yield of radish and lettuce on each vegetable bed. Table S1: Concentration of mineral N in soil solution at 30 cm and 90 cm depth after heavy rainfall events.

Author Contributions

Conceptualization, T.R., E.C., P.G., R.G., M.D., G.B.-S. and P.C.; methodology, T.R., E.C., P.G., R.G., M.D., G.B.-S. and P.C.; validation, E.C., P.G., R.G., M.D., G.B.-S. and P.C.; formal analysis, T.R., E.C., P.G., R.G. and P.C.; investigation, T.R., E.C., P.G., R.G., M.D., G.B.-S. and P.C.; writing—original draft preparation, T.R.; writing—review and editing, T.R., E.C., P.G., R.G., M.D., G.B.-S. and P.C.; visualization, T.R., E.C., P.G., R.G. and P.C.; supervision, E.C., G.B.-S. and P.C.; project administration, T.R., E.C., G.B.-S. and P.C.; funding acquisition, E.C., P.G., R.G., M.D., G.B.-S. and P.C. All authors have read and agreed to the published version of the manuscript.

Funding

This research was funded by the French Ministry of Agriculture and Food, the regional program “RFI Objectif Végétal” of Pays de la Loire (France), and the “Fondation de France” foundation.

Acknowledgments

The authors are very grateful to Rémi Gardet (Phenotic platform) for the preparation of the experimental plot and for logistical support, to Dominique Lemesle (EPHor), Hervé Autret (IRHS) and Camille Lebras (IRHS) for the installation and the maintenance of all sensors used in this study, to Yvette Barraud-Roussel (EPHor) for laboratory measurements, to Christophe Ducommun (EPHor) for the description of the soil profile, and to Daniel Sochard (IRHS) for his suggestions on crop management practices.

Conflicts of Interest

The authors declare no conflict of interest. The funders had no role in the design of the study; in the collection, analyses, or interpretation of data; in the writing of the manuscript, or in the decision to publish the results.

References

  1. Bado, B.V.; Whitbread, A.; Sanoussi Manzo, M.L. Improving Agricultural Productivity Using Agroforestry Systems: Performance of Millet, Cowpea, and Ziziphus-Based Cropping Systems in West Africa Sahel. Agric. Ecosyst. Environ. 2021, 305, 107175. [Google Scholar] [CrossRef]
  2. Schwendenmann, L.; Pendall, E.; Sanchez-Bragado, R.; Kunert, N.; Hölscher, D. Tree Water Uptake in a Tropical Plantation Varying in Tree Diversity: Interspecific Differences, Seasonal Shifts and Complementarity. Ecohydrology 2015, 8, 1–12. [Google Scholar] [CrossRef]
  3. Paut, R.; Sabatier, R.; Tchamitchian, M. Modelling Crop Diversification and Association Effects in Agricultural Systems. Agric. Ecosyst. Environ. 2020, 288, 106711. [Google Scholar] [CrossRef]
  4. Temani, F.; Bouaziz, A.; Daoui, K.; Wery, J.; Barkaoui, K. Olive Agroforestry Can Improve Land Productivity Even under Low Water Availability in the South Mediterranean. Agric. Ecosyst. Environ. 2021, 307, 107234. [Google Scholar] [CrossRef]
  5. Lehmann, J.; Weigl, D.; Droppelmann, K.; Huwe, B.; Zech, W. Nutrient Cycling in an Agroforestry System with Runoff Irrigation in Northern Kenya. Agrofor. Syst. 1998, 43, 49–70. [Google Scholar] [CrossRef]
  6. Ling, Q.; Gao, X.; Zhao, X.; Huang, J.; Li, H.; Li, L.; Sun, W.; Wu, P. Soil Water Effects of Agroforestry in Rainfed Jujube (Ziziphus jujube Mill.) Orchards on Loess Hillslopes in Northwest China. Agric. Ecosyst. Environ. 2017, 247, 343–351. [Google Scholar] [CrossRef]
  7. FranceAgriMer. Pratiques et Habitudes de Consommation des Fruits et Légumes. 2016. Available online: https://www.franceagrimer.fr/content/download/43681/416109/file/Synthèse_pratiques_habitudes_F&L.pdf (accessed on 10 April 2019).
  8. Ouma, G.; Jeruto, P. Sustainable Horticultural Crop Production through Intercropping: The Case of Fruits and Vegetable Crops: A Review. Agric. Biol. J. N. Am. 2010, 1, 1098–1105. [Google Scholar] [CrossRef]
  9. Ahmed, F.; Monika, A.; Hossain, M.; Wadud, M. Performance of Guava Fruit Tree-Based Agroforestry Practice during Summer Season in Charland and Plainland Ecosystems. J. Agrofor. Environ. 2018, 12, 1–8. [Google Scholar]
  10. Bellow, J.G.; Hudson, R.F.; Nair, P.K.R. Adoption Potential of Fruit-Tree-Based Agroforestry on Small Farms in the Subtropical Highlands. Agrofor. Syst. 2008, 73, 23–36. [Google Scholar] [CrossRef]
  11. Bellow, J.G.; Nair, P.K.R.; Martin, T.A. Tree–Crop Interactions in Fruit Tree-based Agroforestry Systems in the Western Highlands of Guatemala: Component Yields and System Performance. In Toward Agroforestry Design: An Ecological Approach; Jose, S., Gordon, A.M., Eds.; Advances in Agroforestry; Springer: Dordrecht, The Netherlands, 2008; pp. 111–131. ISBN 978-1-4020-6572-9. [Google Scholar]
  12. Do, V.H.; La, N.; Mulia, R.; Bergkvist, G.; Dahlin, A.S.; Nguyen, V.T.; Pham, H.T.; Öborn, I. Fruit Tree-Based Agroforestry Systems for Smallholder Farmers in Northwest Vietnam—A Quantitative and Qualitative Assessment. Land 2020, 9, 451. [Google Scholar] [CrossRef]
  13. Hossain, J.; Ahmed, T.; Hasnat, M.Z.; Karim, D. Screening of Tomato Varieties for Fruit Tree Based Agroforestry System. Int. J. Agric. Res. Innov. Technol. 2014, 4, 61–69. [Google Scholar] [CrossRef] [Green Version]
  14. Kassa, G. Profitability Analysis and Determinants of Fruit Tree Based Agroforestry System in Wondo District, Ethiopia. Afr. J. Agric. Res. 2015, 10, 1273–1280. [Google Scholar] [CrossRef]
  15. Rahman, G.M.M.; Wadud, M.A.; Shahjahan, M.; Jewel, K.N.A. Fruit Tree Based Agroforestry Practices in Char Land Farming System. J. Agrofor. Environ 2014, 8, 1–6. [Google Scholar]
  16. Karki, U.; Goodman, M.S. Microclimatic Differences between Mature Loblolly-Pine Silvopasture and Open-Pasture. Agrofor. Syst. 2015, 89, 319–325. [Google Scholar] [CrossRef]
  17. Cannavo, P.; Sansoulet, J.; Harmand, J.-M.; Siles, P.; Dreyer, E.; Vaast, P. Agroforestry Associating Coffee and Inga densiflora Results in Complementarity for Water Uptake and Decreases Deep Drainage in Costa Rica. Agric. Ecosyst. Environ. 2011, 140, 1–13. [Google Scholar] [CrossRef]
  18. Lin, B.B. The Role of Agroforestry in Reducing Water Loss through Soil Evaporation and Crop Transpiration in Coffee Agroecosystems. Agric. For. Meteorol. 2010, 150, 510–518. [Google Scholar] [CrossRef]
  19. Marrou, H.; Wery, J.; Dufour, L.; Dupraz, C. Productivity and Radiation Use Efficiency of Lettuces Grown in the Partial Shade of Photovoltaic Panels. Eur. J. Agron. 2013, 44, 54–66. [Google Scholar] [CrossRef]
  20. Niether, W.; Schneidewind, U.; Armengot, L.; Adamtey, N.; Schneider, M.; Gerold, G. Spatial-Temporal Soil Moisture Dynamics under Different Cocoa Production Systems. CATENA 2017, 158, 340–349. [Google Scholar] [CrossRef]
  21. McClaugherty, C.A.; Aber, J.D.; Melillo, J.M. The Role of Fine Roots in the Organic Matter and Nitrogen Budgets of Two Forested Ecosystems. Ecology 1982, 63, 1481–1490. [Google Scholar] [CrossRef] [Green Version]
  22. Muchane, M.N.; Sileshi, G.W.; Gripenberg, S.; Jonsson, M.; Pumariño, L.; Barrios, E. Agroforestry Boosts Soil Health in the Humid and Sub-Humid Tropics: A Meta-Analysis. Agric. Ecosyst. Environ. 2020, 295, 106899. [Google Scholar] [CrossRef]
  23. Ruess, R.W.; Cleve, K.V.; Yarie, J.; Viereck, L.A. Contributions of Fine Root Production and Turnover to the Carbon and Nitrogen Cycling in Taiga Forests of the Alaskan Interior. Can. J. For. Res. 1996, 26, 1326–1336. [Google Scholar] [CrossRef]
  24. Leigh, M.B.; Fletcher, J.S.; Fu, X.; Schmitz, F.J. Root Turnover:  An Important Source of Microbial Substrates in Rhizosphere Remediation of Recalcitrant Contaminants. Environ. Sci. Technol. 2002, 36, 1579–1583. [Google Scholar] [CrossRef]
  25. Sauvadet, M.; Saj, S.; Freschet, G.T.; Essobo, J.-D.; Enock, S.; Becquer, T.; Tixier, P.; Harmand, J.-M. Cocoa Agroforest Multifunctionality and Soil Fertility Explained by Shade Tree Litter Traits. J. Appl. Ecol. 2020, 57, 476–487. [Google Scholar] [CrossRef]
  26. Cherubin, M.R.; Chavarro-Bermeo, J.P.; Silva-Olaya, A.M. Agroforestry Systems Improve Soil Physical Quality in Northwestern Colombian Amazon. Agrofor. Syst. 2019, 93, 1741–1753. [Google Scholar] [CrossRef]
  27. Schroth, G. A review of belowground interactions in agroforestry, focussing on mechanisms and management options. In Agroforestry for Sustainable Land-Use Fundamental Research and Modelling with Emphasis on Temperate and Mediterranean Applications; Auclair, D., Dupraz, C., Eds.; Springer: Dordrecht, The Netherlands, 1999; Volume 60, pp. 5–34. ISBN 978-90-481-5258-2. [Google Scholar]
  28. Seyfried, M.S.; Rao, P.S.C. Nutrient Leaching Loss from Two Contrasting Cropping Systems in the Humid Tropics. Trop. Agric. 1990, 68, 9–18. [Google Scholar]
  29. Gao, X.; Liu, Z.; Zhao, X.; Ling, Q.; Huo, G.; Wu, P. Extreme Natural Drought Enhances Interspecific Facilitation in Semiarid Agroforestry Systems. Agric. Ecosyst. Environ. 2018, 265, 444–453. [Google Scholar] [CrossRef]
  30. Li, F.; Meng, P.; Fu, D.; Wang, B. Light Distribution, Photosynthetic Rate and Yield in a Paulownia-Wheat Intercropping System in China. Agrofor. Syst. 2008, 74, 163–172. [Google Scholar] [CrossRef]
  31. Guo, Z.L.; Zhong, C.; Cai, C.F.; Ding, S.W.; Wang, Z.M. Nitrogen Competition in Contour Hedgerow Systems in Subtropical China. Nutr. Cycl. Agroecosyst. 2008, 81, 71–83. [Google Scholar] [CrossRef]
  32. Livesley, S.J.; Gregory, P.J.; Buresh, R.J. Competition in Tree Row Agroforestry Systems. 2. Distribution, Dynamics and Uptake of Soil Inorganic N. Plant Soil 2002, 247, 177–187. [Google Scholar] [CrossRef]
  33. Prasad, J.V.N.S.; Korwar, G.R.; Rao, K.V.; Mandal, U.K.; Rao, C.A.R.; Rao, G.R.; Ramakrishna, Y.S.; Venkateswarlu, B.; Rao, S.N.; Kulkarni, H.D.; et al. Tree Row Spacing Affected Agronomic and Economic Performance of Eucalyptus-Based Agroforestry in Andhra Pradesh, Southern India. Agrofor. Syst. 2010, 78, 253–267. [Google Scholar] [CrossRef]
  34. Kohli, A.; Saini, B.C. Microclimate Modification and Response of Wheat Planted under Trees in a Fan Design in Northern India. Agrofor. Syst. 2003, 58, 109–117. [Google Scholar] [CrossRef]
  35. Artru, S.; Garré, S.; Dupraz, C.; Hiel, M.-P.; Blitz-Frayret, C.; Lassois, L. Impact of Spatio-Temporal Shade Dynamics on Wheat Growth and Yield, Perspectives for Temperate Agroforestry. Eur. J. Agron. 2017, 82, 60–70. [Google Scholar] [CrossRef]
  36. IUSS Working Group WRB. World Reference Base for Soil Resources, 2006: A Framework for International Classification, Correlation, and Communication; FAO, Ed.; World soil resources reports; 2006 (2nd ed.); Food and Agriculture Organization of the United Nations: Rome, Italy, 2006; ISBN 978-92-5-105511-3. [Google Scholar]
  37. De Boodt, M.; Verdonck, O.; Cappaert, I. Method for Measuring the Water Release Curve of Organic Substrates. Acta Hortic. 1974, 37, 2054–2063. [Google Scholar] [CrossRef]
  38. Richards, L.A. Pressure-Membrane Apparatus, Construction and Use. Agric. Eng. 1947, 28, 451–454. [Google Scholar]
  39. van Genuchten, M.T. A Closed-Form Equation for Predicting the Hydraulic Conductivity of Unsaturated Soils. Soil Sci. Soc. Am. J. 1980, 44, 892–898. [Google Scholar] [CrossRef] [Green Version]
  40. Raison, R.J.; Connell, M.J.; Khanna, P.K. Methodology for Studying Fluxes of Soil Mineral-N in Situ. Soil Biol. Biochem. 1987, 19, 521–530. [Google Scholar] [CrossRef]
  41. Vendrell, P.F.; Zupancic, J. Determination of Soil Nitrate by Transnitration of Salicylic Acid. Commun. Soil Sci. Plant Anal. 1990, 21, 1705–1713. [Google Scholar] [CrossRef]
  42. Nelson, D.W. Determination of Ammonium in KCl Extracts of Soils by the Salicylate Method. Commun. Soil Sci. Plant Anal. 1983, 14, 1051–1062. [Google Scholar] [CrossRef]
  43. Pau, G.; Fuchs, F.; Sklyar, O.; Boutros, M.; Huber, W. EBImage-an R Package for Image Processing with Applications to Cellular Phenotypes. Bioinformatics 2010, 26, 979–981. [Google Scholar] [CrossRef]
  44. McMaster, G.S.; Wilhelm, W.W. Growing Degree-Days: One Equation, Two Interpretations. Agric. For. Meteorol. 1997, 87, 291–300. [Google Scholar] [CrossRef] [Green Version]
  45. Maynard, D.N.; Hochmuth, G.J.; Knott, J.E. Knott’s Handbook for Vegetable Growers, 5th ed.; John Wiley & Sons, Ltd.: Hoboken, NJ, USA, 2007; ISBN 978-0-471-73828-2. [Google Scholar]
  46. Borrelli, K.; Koenig, R.T.; Jaeckel, B.M.; Miles, C.A. Yield of Leafy Greens in High Tunnel Winter Production in the Northwest United States. HortScience 2013, 48, 183–188. [Google Scholar] [CrossRef] [Green Version]
  47. Lê, S.; Josse, J.; Husson, F. FactoMineR: An R Package for Multivariate Analysis. J. Stat. Soft. 2008, 25, 1–18. [Google Scholar] [CrossRef] [Green Version]
  48. Allen, R.G.; Pereira, L.S.; Raes, D.; Smith, M. Crop Evapotranspiration-Guidelines for Computing Crop Water Requirements-FAO Irrigation and Drainage Paper 56; Fao: Rome, Italy, 1998; 300p, ISBN 978-92-5-104219-9. [Google Scholar]
  49. Kaufman, L.; Rousseeuw, P.J. Finding Groups in Data: An Introduction to Cluster Analysis; Applied Probability and Statistics, New York, Wiley Series in Probability and Mathematical Statistics; John Wiley & Sons, Ltd.: Chichester, UK, 1990. [Google Scholar]
  50. Dahl, D.B.; Scott, D.; Roosen, C.; Magnusson, A.; Swinton, J. Xtable: Export Tables to LaTeX or HTML. R package version, 2009, pp. 1–6. Available online: http://cran.pau.edu.tr/web/packages/xtable/xtable.pdf (accessed on 3 April 2021).
  51. R Studio Team RStudio: Integrated Development for R. RStudio 2020. Available online: http://www.rstudio.com/ (accessed on 8 June 2020).
  52. Monteith, J.L. Light Interception and Radiative Exchange in Crop Stands. In Physiological Aspects of Crop Yield; John Wiley & Sons, Ltd.: Hoboken, NJ, USA, 1969; pp. 89–111. ISBN 978-0-89118-571-0. [Google Scholar]
  53. Palmer, J.W. Diurnal Light Interception and a Computer Model of Light Interception by Hedgerow Apple Orchards. J. Appl. Ecol. 1977, 14, 601–614. [Google Scholar] [CrossRef]
  54. Renaud, V.; Rebetez, M. Comparison between Open-Site and below-Canopy Climatic Conditions in Switzerland during the Exceptionally Hot Summer of 2003. Agric. For. Meteorol. 2009, 149, 873–880. [Google Scholar] [CrossRef]
  55. Breshears, D.D.; Rich, P.M.; Barnes, F.J.; Campbell, K. Overstory-Imposed Heterogeneity in Solar Radiation and Soil Moisture in a Semiarid Woodland. Ecol. Appl. 1997, 7, 1201–1215. [Google Scholar] [CrossRef]
  56. Monteith, J.L.; Ong, C.K.; Corlett, J.E. Microclimatic Interactions in Agroforestry Systems. For. Ecol. Manag. 1991, 45, 31–44. [Google Scholar] [CrossRef]
  57. Rodrigues, J.C.; Miranda, I.S.; de Sousa, A.M.L.; Rodrigues, J.C.; Miranda, I.S.; de Sousa, A.M.L. Microclimate in Understories of a Mango Orchard and a Degraded Area in the Eastern Amazon. Rev. Ambiente Água 2018, 13, e2129. [Google Scholar] [CrossRef]
  58. Beer, J.; Muschler, R.; Kass, D.; Somarriba, E. Shade Management in Coffee and Cacao Plantations. Agrofor. Syst. 1997, 38, 139–164. [Google Scholar] [CrossRef]
  59. Chen, X.; Zhao, P.; Hu, Y.; Ouyang, L.; Zhu, L.; Ni, G. Canopy Transpiration and Its Cooling Effect of Three Urban Tree Species in a Subtropical City- Guangzhou, China. Urban For. Urban Green. 2019, 43, 126368. [Google Scholar] [CrossRef]
  60. Meng, L.; Yu, L.; Mao, P.; Zhang, G. Effects of Inter-Planting Cocksfoot and White Clover as Cover Crops on the Microclimate of Apple Orchard. Pratacultural Sci. 2009, 26, 132–136. [Google Scholar]
  61. Taha, H.; Akbari, H.; Rosenfeld, A. Heat Island and Oasis Effects of Vegetative Canopies: Micro-Meteorological Field-Measurements. Theor. Appl. Climatol. 1991, 44, 123–138. [Google Scholar] [CrossRef] [Green Version]
  62. Taha, H.; Akbari, H.; Rosenfeld, A. Vegetation Canopy Micro-Climate: A Field-Project in Davis, California. 1989. Available online: https://escholarship.org/uc/item/7td0c626 (accessed on 16 September 2021).
  63. von Arx, G.; Dobbertin, M.; Rebetez, M. Spatio-Temporal Effects of Forest Canopy on Understory Microclimate in a Long-Term Experiment in Switzerland. Agric. For. Meteorol. 2012, 166–167, 144–155. [Google Scholar] [CrossRef]
  64. Souch, C.A.; Souch, C. The Effect of Trees on Summertime below Canopy Urban Climates: A Case Study Bloomington, Indiana. J. Arboric. 1993, 19, 303–312. [Google Scholar]
  65. Dupont, S.; Patton, E.G. Influence of Stability and Seasonal Canopy Changes on Micrometeorology within and above an Orchard Canopy: The CHATS Experiment. Agric. For. Meteorol. 2012, 157, 11–29. [Google Scholar] [CrossRef]
  66. Dupraz, C.; Liagre, F. Agroforesterie: Des Arbres et des Cultures; France Agricole Editions: Paris, France, 2008; ISBN 978-2-85557-150-8. [Google Scholar]
  67. Godefroid, S.; Koedam, N. Tree-Induced Soil Compaction in Forest Ecosystems: Myth or Reality? Eur. J. For. Res. 2010, 129, 209–217. [Google Scholar] [CrossRef]
  68. Eastham, J.; Rose, C.W. Pasture Evapotranspiration under Varying Tree Planting Density in an Agroforestry Experiment. Agric. Water Manag. 1988, 15, 87–105. [Google Scholar] [CrossRef]
  69. Jackson, N.A.; Wallace, J.S. Soil Evaporation Measurements in an Agroforestry System in Kenya. Agric. For. Meteorol. 1999, 94, 203–215. [Google Scholar] [CrossRef]
  70. Raz-Yaseef, N.; Rotenberg, E.; Yakir, D. Effects of Spatial Variations in Soil Evaporation Caused by Tree Shading on Water Flux Partitioning in a Semi-Arid Pine Forest. Agric. For. Meteorol. 2010, 150, 454–462. [Google Scholar] [CrossRef]
  71. Kormanek, M.; Głąb, T.; Banach, J.; Szewczyk, G. Effects of Soil Bulk Density on Sessile Oak Quercus petraea Liebl. Seedlings. Eur. J. For. Res. 2015, 134, 969–979. [Google Scholar] [CrossRef] [Green Version]
  72. Gupta, N.; Kukal, S.S.; Bawa, S.S.; Dhaliwal, G.S. Soil Organic Carbon and Aggregation under Poplar Based Agroforestry System in Relation to Tree Age and Soil Type. Agrofor. Syst. 2009, 76, 27–35. [Google Scholar] [CrossRef]
  73. Pardon, P.; Reubens, B.; Reheul, D.; Mertens, J.; De Frenne, P.; Coussement, T.; Janssens, P.; Verheyen, K. Trees Increase Soil Organic Carbon and Nutrient Availability in Temperate Agroforestry Systems. Agric. Ecosyst. Environ. 2017, 247, 98–111. [Google Scholar] [CrossRef]
  74. Upson, M.A.; Burgess, P.J. Soil Organic Carbon and Root Distribution in a Temperate Arable Agroforestry System. Plant Soil 2013, 373, 43–58. [Google Scholar] [CrossRef] [Green Version]
  75. Cardinael, R.; Chevallier, T.; Cambou, A.; Béral, C.; Barthès, B.G.; Dupraz, C.; Durand, C.; Kouakoua, E.; Chenu, C. Increased Soil Organic Carbon Stocks under Agroforestry: A Survey of Six Different Sites in France. Agric. Ecosyst. Environ. 2017, 236, 243–255. [Google Scholar] [CrossRef] [Green Version]
  76. Hendricks, J.J.; Nadelhoffer, K.J.; Aber, J.D. Assessing the Role of Fine Roots in Carbon and Nutrient Cycling. Trends Ecol. Evol. 1993, 8, 174–178. [Google Scholar] [CrossRef]
  77. Arvidsson, J. Influence of Soil Texture and Organic Matter Content on Bulk Density, Air Content, Compression Index and Crop Yield in Field and Laboratory Compression Experiments. Soil Tillage Res. 1998, 49, 159–170. [Google Scholar] [CrossRef]
  78. Logsdon, S.D.; Karlen, D.L. Bulk Density as a Soil Quality Indicator during Conversion to No-Tillage. Soil Tillage Res. 2004, 78, 143–149. [Google Scholar] [CrossRef]
  79. Pepper, I.L.; Brooks, J.P.; Gerba, C.P. Chapter 23—Land Application of Organic Residuals: Municipal Biosolids and Animal Manures. In Environmental and Pollution Science, 3rd ed.; Brusseau, M.L., Pepper, I.L., Gerba, C.P., Eds.; Academic Press: Cambridge, MA, USA, 2019; pp. 419–434. ISBN 978-0-12-814719-1. [Google Scholar]
  80. Li, Y.; Liu, Y.; Wang, Y.; Niu, L.; Xu, X.; Tian, Y. Interactive Effects of Soil Temperature and Moisture on Soil N Mineralization in a Stipa Krylovii Grassland in Inner Mongolia, China. J. Arid Land 2014, 6, 571–580. [Google Scholar] [CrossRef]
  81. Guntiñas, M.E.; Leirós, M.C.; Trasar-Cepeda, C.; Gil-Sotres, F. Effects of Moisture and Temperature on Net Soil Nitrogen Mineralization: A Laboratory Study. Eur. J. Soil Biol. 2012, 48, 73–80. [Google Scholar] [CrossRef]
  82. Curtin, D.; Beare, M.H.; Hernandez-Ramirez, G. Temperature and Moisture Effects on Microbial Biomass and Soil Organic Matter Mineralization. Soil Sci. Soc. Am. J. 2012, 76, 2055–2067. [Google Scholar] [CrossRef]
  83. Hai, L.; Li, X.G.; Liu, X.-E.; Jiang, X.J.; Guo, R.Y.; Jing, G.B.; Rengel, Z.; Li, F.-M. Plastic Mulch Stimulates Nitrogen Mineralization in Urea-Amended Soils in a Semiarid Environment. Agron. J. 2015, 107, 921–930. [Google Scholar] [CrossRef]
  84. Guillot, E.; Bertrand, I.; Rumpel, C.; Gomez, C.; Arnal, D.; Abadie, J.; Hinsinger, P. Spatial Heterogeneity of Soil Quality within a Mediterranean Alley Cropping Agroforestry System: Comparison with a Monocropping System. Eur. J. Soil Biol. 2021, 105, 103330. [Google Scholar] [CrossRef]
  85. Yao, S.; Merwin, I.A.; Bird, G.W.; Abawi, G.S.; Thies, J.E. Orchard Floor Management Practices That Maintain Vegetative or Biomass Groundcover Stimulate Soil Microbial Activity and Alter Soil Microbial Community Composition. Plant Soil 2005, 271, 377–389. [Google Scholar] [CrossRef]
  86. Meier, I.C.; Finzi, A.C.; Phillips, R.P. Root Exudates Increase N Availability by Stimulating Microbial Turnover of Fast-Cycling N Pools. Soil Biol. Biochem. 2017, 106, 119–128. [Google Scholar] [CrossRef] [Green Version]
  87. Wolf, S.; Marani, A.; Rudich, J. Effects of Temperature and Photoperiod on Assimilate Partitioning in Potato Plants. Ann. Bot. 1990, 66, 513–520. [Google Scholar] [CrossRef]
  88. Brouwer, R. Some Aspects of the Equilibrium between Overground and Underground Plant Parts. Jaarboek van het Instituut voor Biologisch en Scheikundig onderzoek aan Landbouwgewassen 1963, 1963, 31–39. Available online: https://edepot.wur.nl/361707#page=27 (accessed on 16 September 2021).
  89. Sage, R.F.; Sharkey, T.D.; Pearcy, R.W. The Effect of Leaf Nitrogen and Temperature on the CO2 Response of Photosynthesis in the C3 Dicot MChenopodium album L. Funct. Plant Biol. 1990, 17, 135–148. [Google Scholar] [CrossRef]
  90. Driesen, E.; Van den Ende, W.; De Proft, M.; Saeys, W. Influence of Environmental Factors Light, CO2, Temperature, and Relative Humidity on Stomatal Opening and Development: A Review. Agronomy 2020, 10, 1975. [Google Scholar] [CrossRef]
  91. Oh, S.; Moon, K.H.; Song, E.Y.; Son, I.-C.; Koh, S.C. Photosynthesis of Chinese Cabbage and Radish in Response to Rising Leaf Temperature during Spring. Hortic. Environ. Biotechnol. 2015, 56, 159–166. [Google Scholar] [CrossRef]
  92. Zhou, J.; Wang, J.Z.; Hang, T.; Li, P.P. Photosynthetic Characteristics and Growth Performance of Lettuce (Lactuca sativa L.) under Different Light/Dark Cycles in Mini Plant Factories. Photosynthetica 2020, 58, 740–747. [Google Scholar] [CrossRef] [Green Version]
  93. Cometti, N.N.; da Silva, J.V.; Zonta, E.; Cessa, R.M. Evaluation of Photosynthetic Photon Flux in Lettuce Cultivation at Different Shading Levels. Hortic. Bras. 2020, 38, 65–70. [Google Scholar] [CrossRef]
  94. Wheeler, T.R.; Hadley, P.; Ellis, R.H.; Morison, J.I.L. Changes in Growth and Radiation Use by Lettuce Crops in Relation to Temperature and Ontogeny. Agric. For. Meteorol. 1993, 66, 173–186. [Google Scholar] [CrossRef]
  95. Jie, H.; Sing Kong, L. Growth and Photosynthetic Characteristics of Lettuce (Lactuca sativa L.) under Fluctuating Hot Ambient Temperatures with the Manipulation of Cool Root-Zone Temperature. J. Plant Physiol. 1998, 152, 387–391. [Google Scholar] [CrossRef]
  96. Li, R.; YueLin, Z.; Takagaki, M.; Yamori, W.; LiFei, Y. Effects of root zone temperature on the growth and mineral elements content of hydroponically-grown lettuce. Acta Agric. Shanghai 2015, 31, 48–52. [Google Scholar]
  97. Ouyang, Z.; Tian, J.; Yan, X.; Shen, H. Effects of Different Concentrations of Dissolved Oxygen or Temperatures on the Growth, Photosynthesis, Yield and Quality of Lettuce. Agric. Water Manag. 2020, 228, 105896. [Google Scholar] [CrossRef]
  98. Khan, M. Effect of High Temperature and Exposure Duration on Stem Elongation of Iceberg Lettuce. Pak. J. Agric. Sci. 2018, 55, 95–101. [Google Scholar] [CrossRef]
  99. Arvidsson, J.; Håkansson, I. Response of Different Crops to Soil Compaction—Short-Term Effects in Swedish Field Experiments. Soil Tillage Res. 2014, 138, 56–63. [Google Scholar] [CrossRef]
  100. Adekiya, A.O.; Agbede, T.M.; Aboyeji, C.M.; Dunsin, O.; Simeon, V.T. Effects of Biochar and Poultry Manure on Soil Characteristics and the Yield of Radish. Sci. Hortic. 2019, 243, 457–463. [Google Scholar] [CrossRef] [Green Version]
  101. Sojka, R.E.; Busscher, W.J.; Lehrsch, G.A. In situ strength, bulk density, and water content relationships of a durinodic xeric haplocalcid soil. Soil Sci. 2001, 166, 520–529. [Google Scholar] [CrossRef] [Green Version]
  102. Azzi, V.; Kanso, A.; Kazpard, V.; Kobeissi, A.; Lartiges, B.; El Samrani, A. Lactuca Sativa Growth in Compacted and Non-Compacted Semi-Arid Alkaline Soil under Phosphate Fertilizer Treatment and Cadmium Contamination. Soil Tillage Res. 2017, 165, 1–10. [Google Scholar] [CrossRef]
  103. Baloch, P.A.; Uddin, R.; Nizamani, F.K.; Solangi, A.H.; Siddiqui, A.A. Effect of Nitrogen, Phosphorus and Potassium Fertilizers on Growth and Yield Characteristics of Radish (Raphinus sativus L.). Am.-Eurasian J. Agric. Environ. Sci. 2014, 14, 565–569. [Google Scholar]
  104. Kang, Y.; Wan, S. Effect of Soil Water Potential on Radish (Raphanus sativus L.) Growth and Water Use under Drip Irrigation. Sci. Hortic. 2005, 106, 275–292. [Google Scholar] [CrossRef]
  105. Dupraz, C.; Wolz, K.J.; Lecomte, I.; Talbot, G.; Vincent, G.; Mulia, R.; Bussière, F.; Ozier-Lafontaine, H.; Andrianarisoa, S.; Jackson, N.; et al. Hi-SAFe: A 3D Agroforestry Model for Integrating Dynamic Tree–Crop Interactions. Sustainability 2019, 11, 2293. [Google Scholar] [CrossRef] [Green Version]
Figure 1. Experimental design. RW: west apple tree row, B1: vegetable bed located at 1.5 m from the east (B1E) or the west (B1W) apple tree row, B2: vegetable bed located at 3.3 m from the east (B2E) or the west (B2W) apple tree row, C: vegetable bed located at 5.1 m from the apple tree rows, RE: east apple tree row.
Agronomy 11 01888 g001
Figure 2. Average of daily differences in global radiation (a), mean air temperature (b), maximum air temperature (c) and relative air humidity (d) between the apple tree rows or the B1 or B2 vegetable beds and the C bed over the radish and lettuce growing seasons. Error bars represent the standard deviation of the mean (n = 53 days for radish, n = 52 days for lettuce). Asterisks indicate that values are significantly different from zero (p < 0.05, t-test). ns: not significant, * p < 0.05, *** p < 0.001.
Agronomy 11 01888 g002
Figure 3. Cumulative daily global radiation (a) and growing degree-days (GDD base 4.5 °C and 4 °C for radish and lettuce, respectively) (b) under the tree rows and on the vegetable beds over the radish and lettuce growing seasons.
Agronomy 11 01888 g003
Figure 4. Diurnal evolution of mean global radiation, air temperature and air relative humidity on the C bed (a) and diurnal evolution of mean difference in global radiation, air temperature and air relative humidity between the tree rows or the vegetable beds and the C bed (b) during cloudy days, with cold and humid conditions (Type 1, n = 54 days) and clear days, with warm and dry conditions (Type 2, n = 51 days). Ribbon represents the standard deviation of the mean.
Agronomy 11 01888 g004
Figure 5. Daily evolution of soil water content at 30 cm (a) and 90 cm depth (b) over the radish and lettuce growing seasons. Arrows represents the change in irrigation rate. FC: field capacity, WP: wilting point.
Agronomy 11 01888 g005
Figure 6. N mineralization rates in the upper soil layer (0–15 cm) in each vegetable bed during each growing season. Error bars represent the standard deviation of the mean (n = 3). Different letters indicate significant differences (p < 0.05, Tukey HSD test) among vegetable beds at each date (ns: not significant, * p < 0.05, ** p < 0.01).
Agronomy 11 01888 g006
Figure 7. Evolution of the leaf area of radish (a) and lettuce (b), radish tuber dry mass (c) and lettuce aerial dry mass (d) on each vegetable bed. Error bars represent the standard deviation of the mean (n = 3). Asterisks indicates significant differences (p < 0.05, Tukey HSD test) among vegetable beds at each date.
Agronomy 11 01888 g007
Table 1. Main characteristics of the soil profile.
Soil LayerAgEgBTgCg
(0–30 cm)(30–50 cm)(50–90 cm)(90–120 cm)
Texture
 Clay [%]15.52236.531.3
 Silt [%]42.239.631.728.3
 Sand [%]39.637.831.139.7
Chemical properties
 pHH2O6.77.27.55.1
 pHKCl5.96.36.63.8
 Organic matter [g.kg−1]356<6<6
 Total C [g.kg−1]20.33.5<3<3
 Total N [g.kg−1]1.30.50.40.3
 C:N ratio15.67.4<7.4<10.8
 P2O5 [mg.kg−1]681610<10
 K2O [mg.kg−1]25814011171
 MgO [mg.kg−1]165157168125
 Na2O [mg.kg−1]14122721
 CaO [mg.kg−1]1757132425281149
 CaCO3 [g.kg−1]<1<1< 1<1
 CEC [meq.100 g−1]7.56.37.77.2
Hydraulic properties (mean ± SD, n = 3)
 Bulk density [g.cm−3]1.37 ± 0.111.65 ± 0.061.55 ± 0.071.61 ± 0.06
 Field capacity [% volumetric water content]24.4 ± 1.428.7 ± 4.330.1 ± 6.329.1 ± 5.1
 Wilting point [% volumetric water content]17.7 ± 0.623.2 ± 3.724.4 ± 7.222.4 ± 4.6
 Saturated hydraulic conductivity [10−4 cm.s−1]4.33 ± 0.471.23 ± 0.133.03 ± 0.502.33 ± 0.13
Table 2. Soil bulk density and soil organic matter concentration in the upper soil layer (0–30 cm) measured during each crop cycle (in the middle of the cropping season for bulk density and at planting for SOM). Values are mean ± SD (n = 3). Different letters indicate significant differences (p < 0.05, Tukey HSD test) among vegetable beds.
BedRadishLettuce
Bulk Density
[g DW.cm−3]
SOM
[g.kg−1 DW]
Bulk Density
[g DW.cm−3]
SOM
[g.kg−1 DW]
B1E1.26 ± 0.07b37.36 ± 1.11b1.28 ± 0.08b37.76 ± 1.23ab
B2E1.45 ± 0.05a32.76 ± 1.86b1.46 ± 0.05a33.46 ± 1.14c
C1.46 ± 0.06a33.05 ± 2.27b1.51 ± 0.03a31.42 ± 2.80c
B2W1.46 ± 0.04a33.39 ± 3.67b1.49 ± 0.02a33.51 ± 1.29bc
B1W1.23 ± 0.02b46.46 ± 2.34a1.31 ± 0.05b41.55 ± 0.53a
Table 3. Pearson correlation coefficients among microclimatic conditions, soil properties and crop growth for each vegetable. DM: dry mass, LA: leaf area, GR: global radiation, GDD: growing degree-days, SOM: soil organic matter. n = 9 for cumulated GDD, n = 15 for the other variables. * p < 0.05, ** p < 0.01, *** p < 0.001.
Final DMFinal LACumulated GRCumulated GDDBulk DensitySOM
RadishFinal LA0.77 **
Cumulated GR−0.18−0.28
Cumulated GDD−0.62−0.270.41
Bulk density−0.86 ***−0.81 **0.450.65
SOM0.71 **0.54 *−0.60 *−0.56−0.77 **
N mineralization 0.63 *0.60 *−0.61 *−0.59−0.76 **0.82 **
LettuceFinal LA0.88 ***
Cumulated GR0.88 ***0.74 **
Cumulated GDD0.610.590.64
Bulk density0.480.250.510.66
SOM−0.53 *−0.38−0.55 *−0.72 *−0.82 **
N mineralization −0.28−0.08−0.37−0.07−0.55 **0.59 *
Publisher’s Note: MDPI stays neutral with regard to jurisdictional claims in published maps and institutional affiliations.

