
Simulating Agronomic Adaptation Strategies to Mitigate the Impacts of Climate Change on Wheat Yield in South-Eastern Australia

1
School of Agricultural and Wine Sciences, Charles Sturt University, Wagga Wagga, NSW 2650, Australia
2
Graham Centre for Agricultural Innovation, (an Alliance between NSW Department of Primary Industries and Charles Sturt University), Wagga Wagga, NSW 2650, Australia
Agronomy 2021, 11(2), 337; https://doi.org/10.3390/agronomy11020337
Submission received: 8 January 2021
/
Revised: 4 February 2021
/
Accepted: 10 February 2021
/
Published: 13 February 2021
(This article belongs to the Special Issue Adaptation of Crops to Climatically Variable Environments: Physiological and Agronomic Strategies)
Abstract
:Rising air temperature and change in rainfall patterns are expected to have impact on agricultural production. The impact of climate change on wheat production was investigated and agronomic adaptation strategies were evaluated for two emission scenarios of Representative Concentration Pathway (RCP4.5 and RCP8.5) and three projection periods (2030, 2050 and 2070) using a climate model ensemble in the bio-physical model Agricultural Process SIMulator (APSIM). Early and late maturing wheat varieties were tested under six sowing time scenarios. Under RCP4.5, growing season rainfall would decrease by 9%, 15% and 19% in 2030, 2050 and 2070, respectively, and temperature would increase by 0.7 °C, 1.2 °C and 1.4 °C, respectively. For RCP4.5, the wheat yield would decrease by 9%, 15% and 19% in 2030, 2050 and 2070, respectively. Under RCP8.5, the yield would decrease by 9%, 18% and 27%, respectively. Short-season cultivars would be suitable for the low-rainfall environments and long-season cultivars for the high-rainfall environments. In 2050, for RCP4.5 at a low-rainfall site, the yield of early maturing variety would decrease by 11% and 31%, while at a high-rainfall site, these values would show a 9% decrease and 1% increase, respectively. At the low rainfall site, yield reduction for early sown variety would be 14% and 23% when late sown, while late maturing wheat would have a much higher yield reduction. At the higher rainfall site, yield reduction for early and late sown early maturing variety would be 3% and 15%, while for late-maturing wheat these values would be only 1% and 2%. Generally, the future climate is expected to have significant impact on wheat yield and changes in agronomic practices can mitigate the impacts on yield.
1. Introduction
Wheat (Triticum aestivum L.) is one of the major staple crops in the world, and Australia is the fifth largest exporter of wheat with an annual value of US$3.1 billion or 11% of the global wheat trade [1]. In Australia, wheat is almost entirely grown under rainfed/dryland environment in the grain-belt that extends from Western Australia, through South Australia, Victoria, New South Wales and southern Queensland. However, wheat production highly varies from year to year, mainly due to rainfall variability, which can be exacerbated by climate change [2]. Under the current climate, the choice of cultivar and sowing time has been shown to have the potential to reduce yield loss, which occurs due to increased temperature and evaporative demand in spring [2]. Observed climate conditions in the wheat-producing regions of Australia have already shown a trend towards increased temperature and decreased rainfall, particularly winter–spring rainfall [3]. From fundamental crop physiology principles, climate change-induced higher temperature and CO2 levels result in faster development and higher photosynthesis rates. However, under field conditions, the interactions of these climate change factors are substantially more complex. For example, the benefit of increased photosynthetic rates from higher CO2 levels could be limited by the shortening of the grain-filling stage due to increased temperature. On the other hand, the impact of rainfall decline can be moderated by the improved water-use efficiency from higher CO2 levels [4]. Crop yields might increase due to increased carbon assimilation rates and increased crop water-use efficiency [5]. The question is whether this increase in yield due to fertilisation can offset yield loss due to a rise in temperature and decreased rainfall. Generally, it is expected that the harm from climate change-induced factors (e.g., increase in temperature and decline in rainfall) due to CO2 and other greenhouse gases outweighs the benefits from CO2 fertilisation [6].
In order to get the agricultural industry better prepared and adapted to the changing future climate, it is important to investigate the potential impacts of climate change on production and identify and evaluate different on-farm adaptation strategies that could minimise the climate change risk focusing on the impacts on crop phenology and grain yield. The impact of climate change and variability on wheat production of the Australian grain-belt has been assessed in some studies [7,8,9]. Although a complete assessment of climate change risk should include both impact and adaptation, there are only limited adaptation evaluation studies [10,11]. Some of the earlier studies of climate change’s impact on crop yield were done by setting a hypothetical decrease in rainfall and increase in temperatures in the future climate [9,12,13]. However, due to complex interactions among weather variables, physico–bio–chemical responses to changing atmospheric composition, and radiative forcing of the climate system, the temporal pattern and variability of the current climate will not be the same as the one in the future climate [14,15]. As a result, in order to assess the impact of climate change on crop phenology and yield, climate change data from global climate models (GCMs) should be used as inputs to process-based crop models. Agricultural Process SIMulator (APSIM) is one of such models widely used in Australia and worldwide to simulate genetic x environment x management interactions of a wide variety of crops [16]. Due to uncertainty in different emission scenarios and individual model assumptions, the use of a single model can result in under-estimation or over-estimation of rainfall amounts at regional scales in the future climate [17,18]. Thus, the use of an ensemble of different future climate projections for a particular region as projected by different GCMs is important [19,20].
The number of days from sowing to flowering and from sowing to maturity are critical variables as there would be a positive correlation between these and eventual grain yield [21]. Cultivar type and sowing date determine the length of these stages and high temperature during late spring can shorten the grain filling period and increase leaf senescence that can have detrimental effects on final grain yield [2,22]. The aim of this study is (1) to investigate the effects of climate change on different agro-meteorological variables, wheat phenology, and grain yield using a process-based model and GCM; and (2) to evaluate if changing sowing time and cultivar choice would reduce or offset the negative impacts of climate change on wheat yield.
2. Materials and Methods
In this study, analysis of the impact of climate change and evaluation of adaptation strategies was done using down-scaled climate data from an ensemble of 11 GCMs.
2.1. Study Sites Characteristics
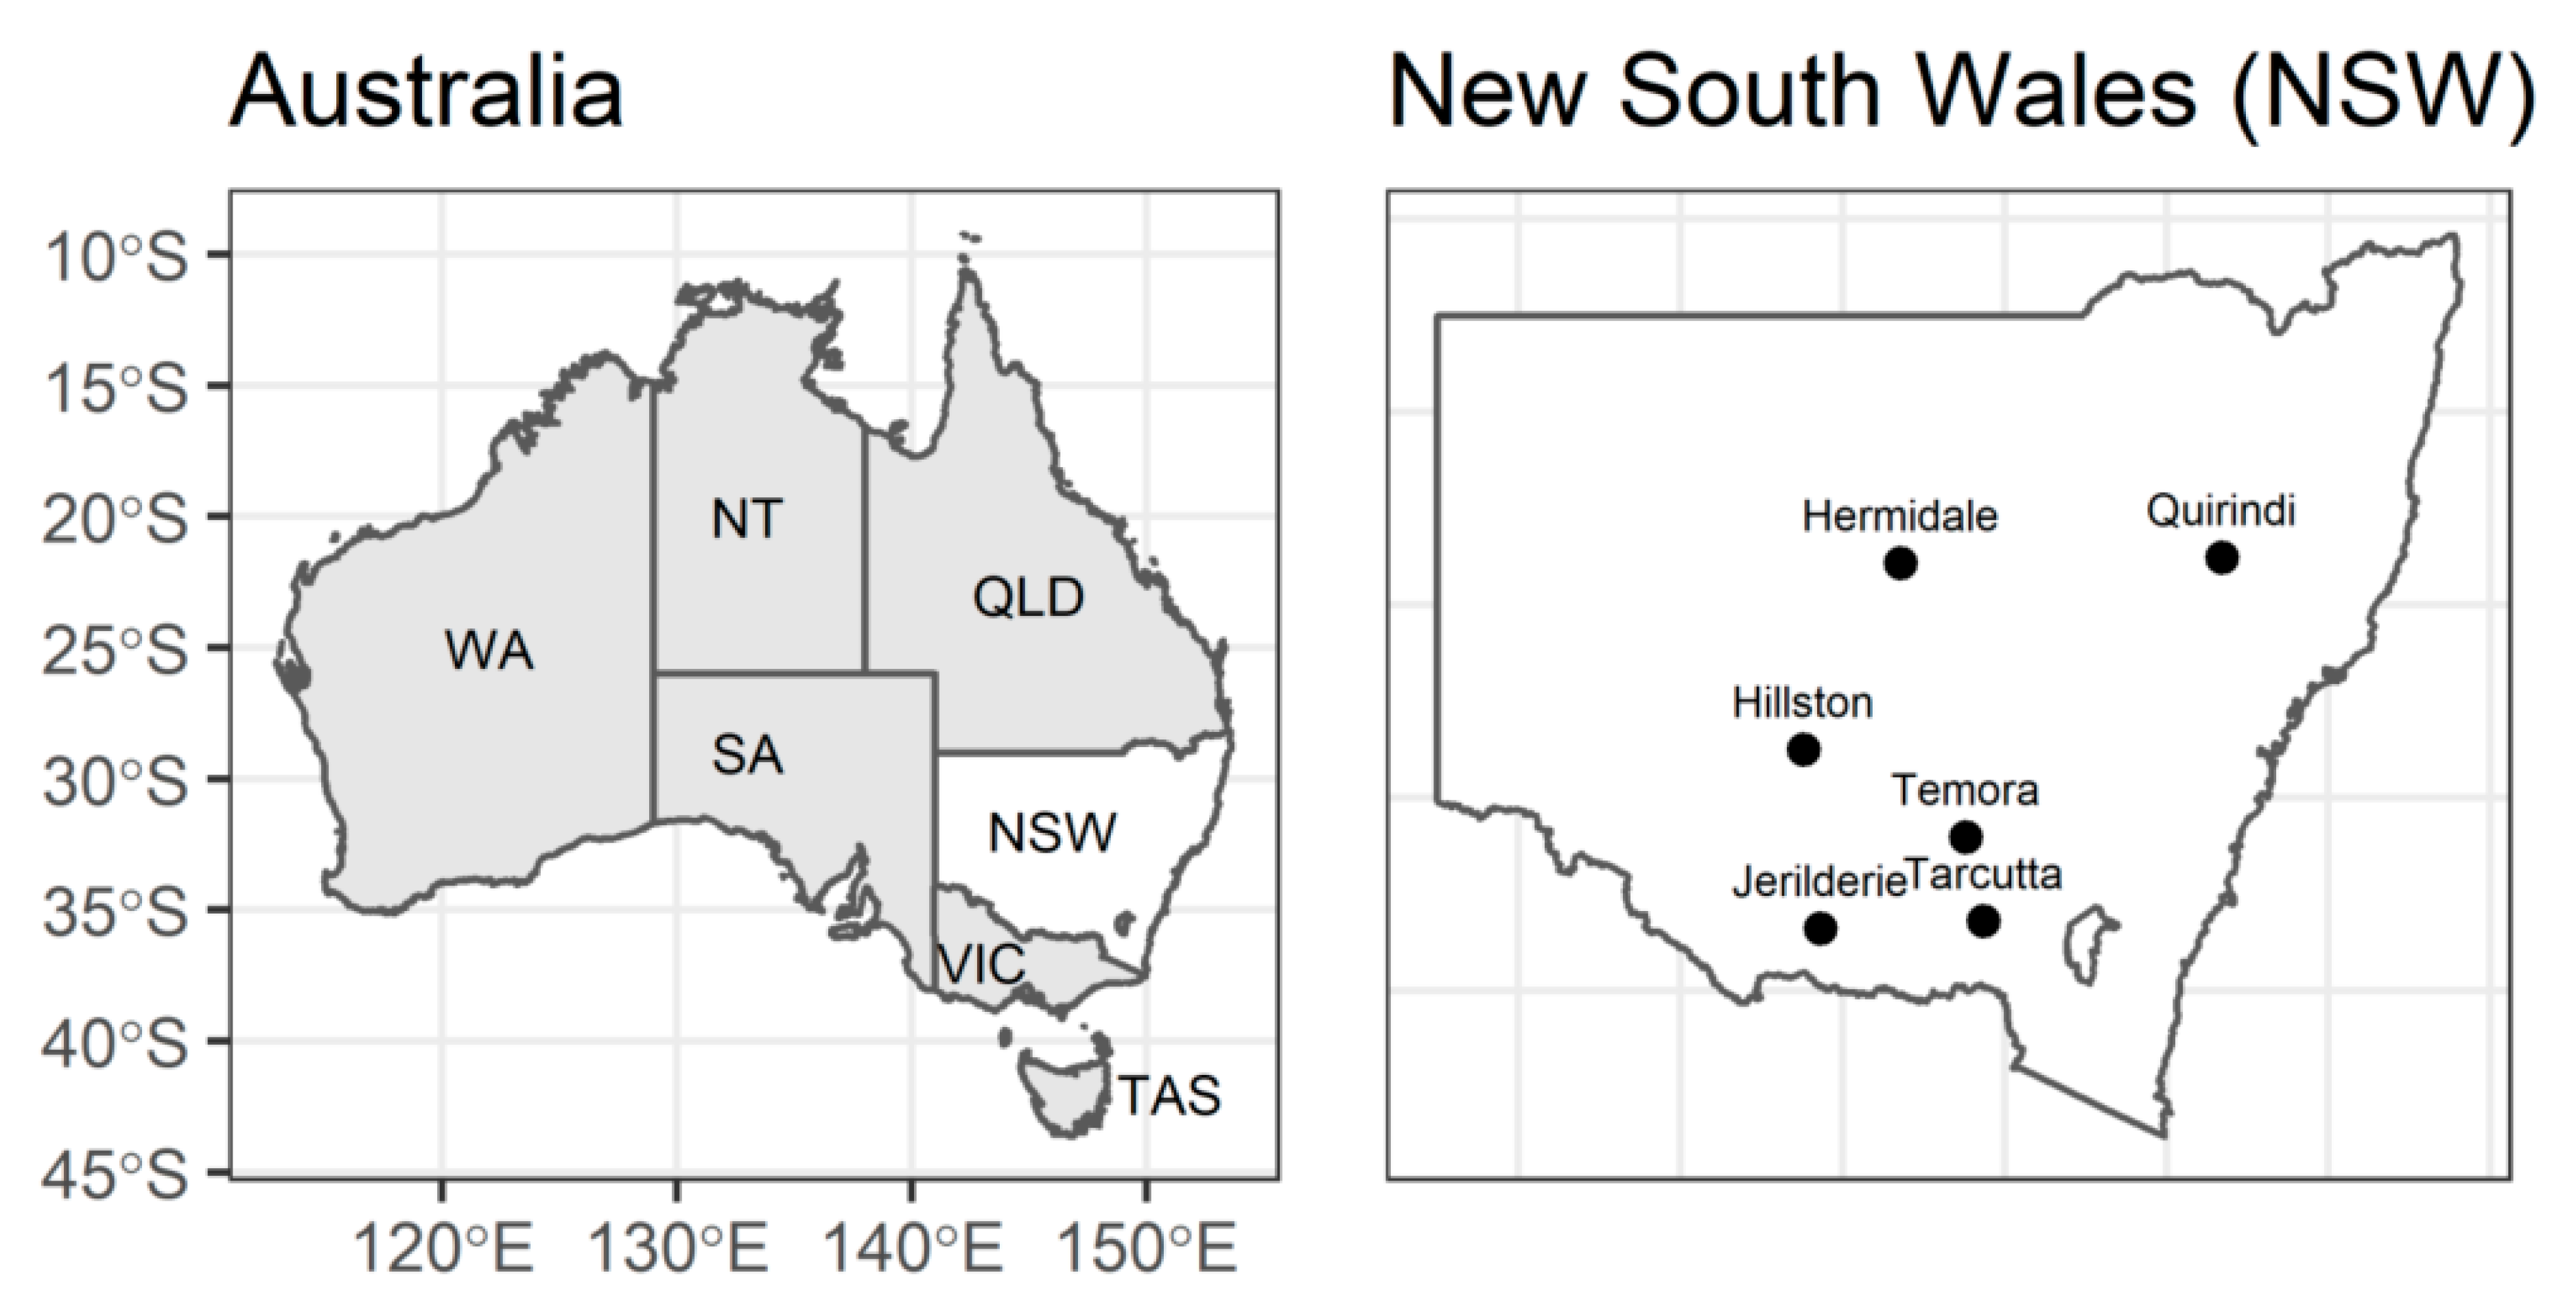
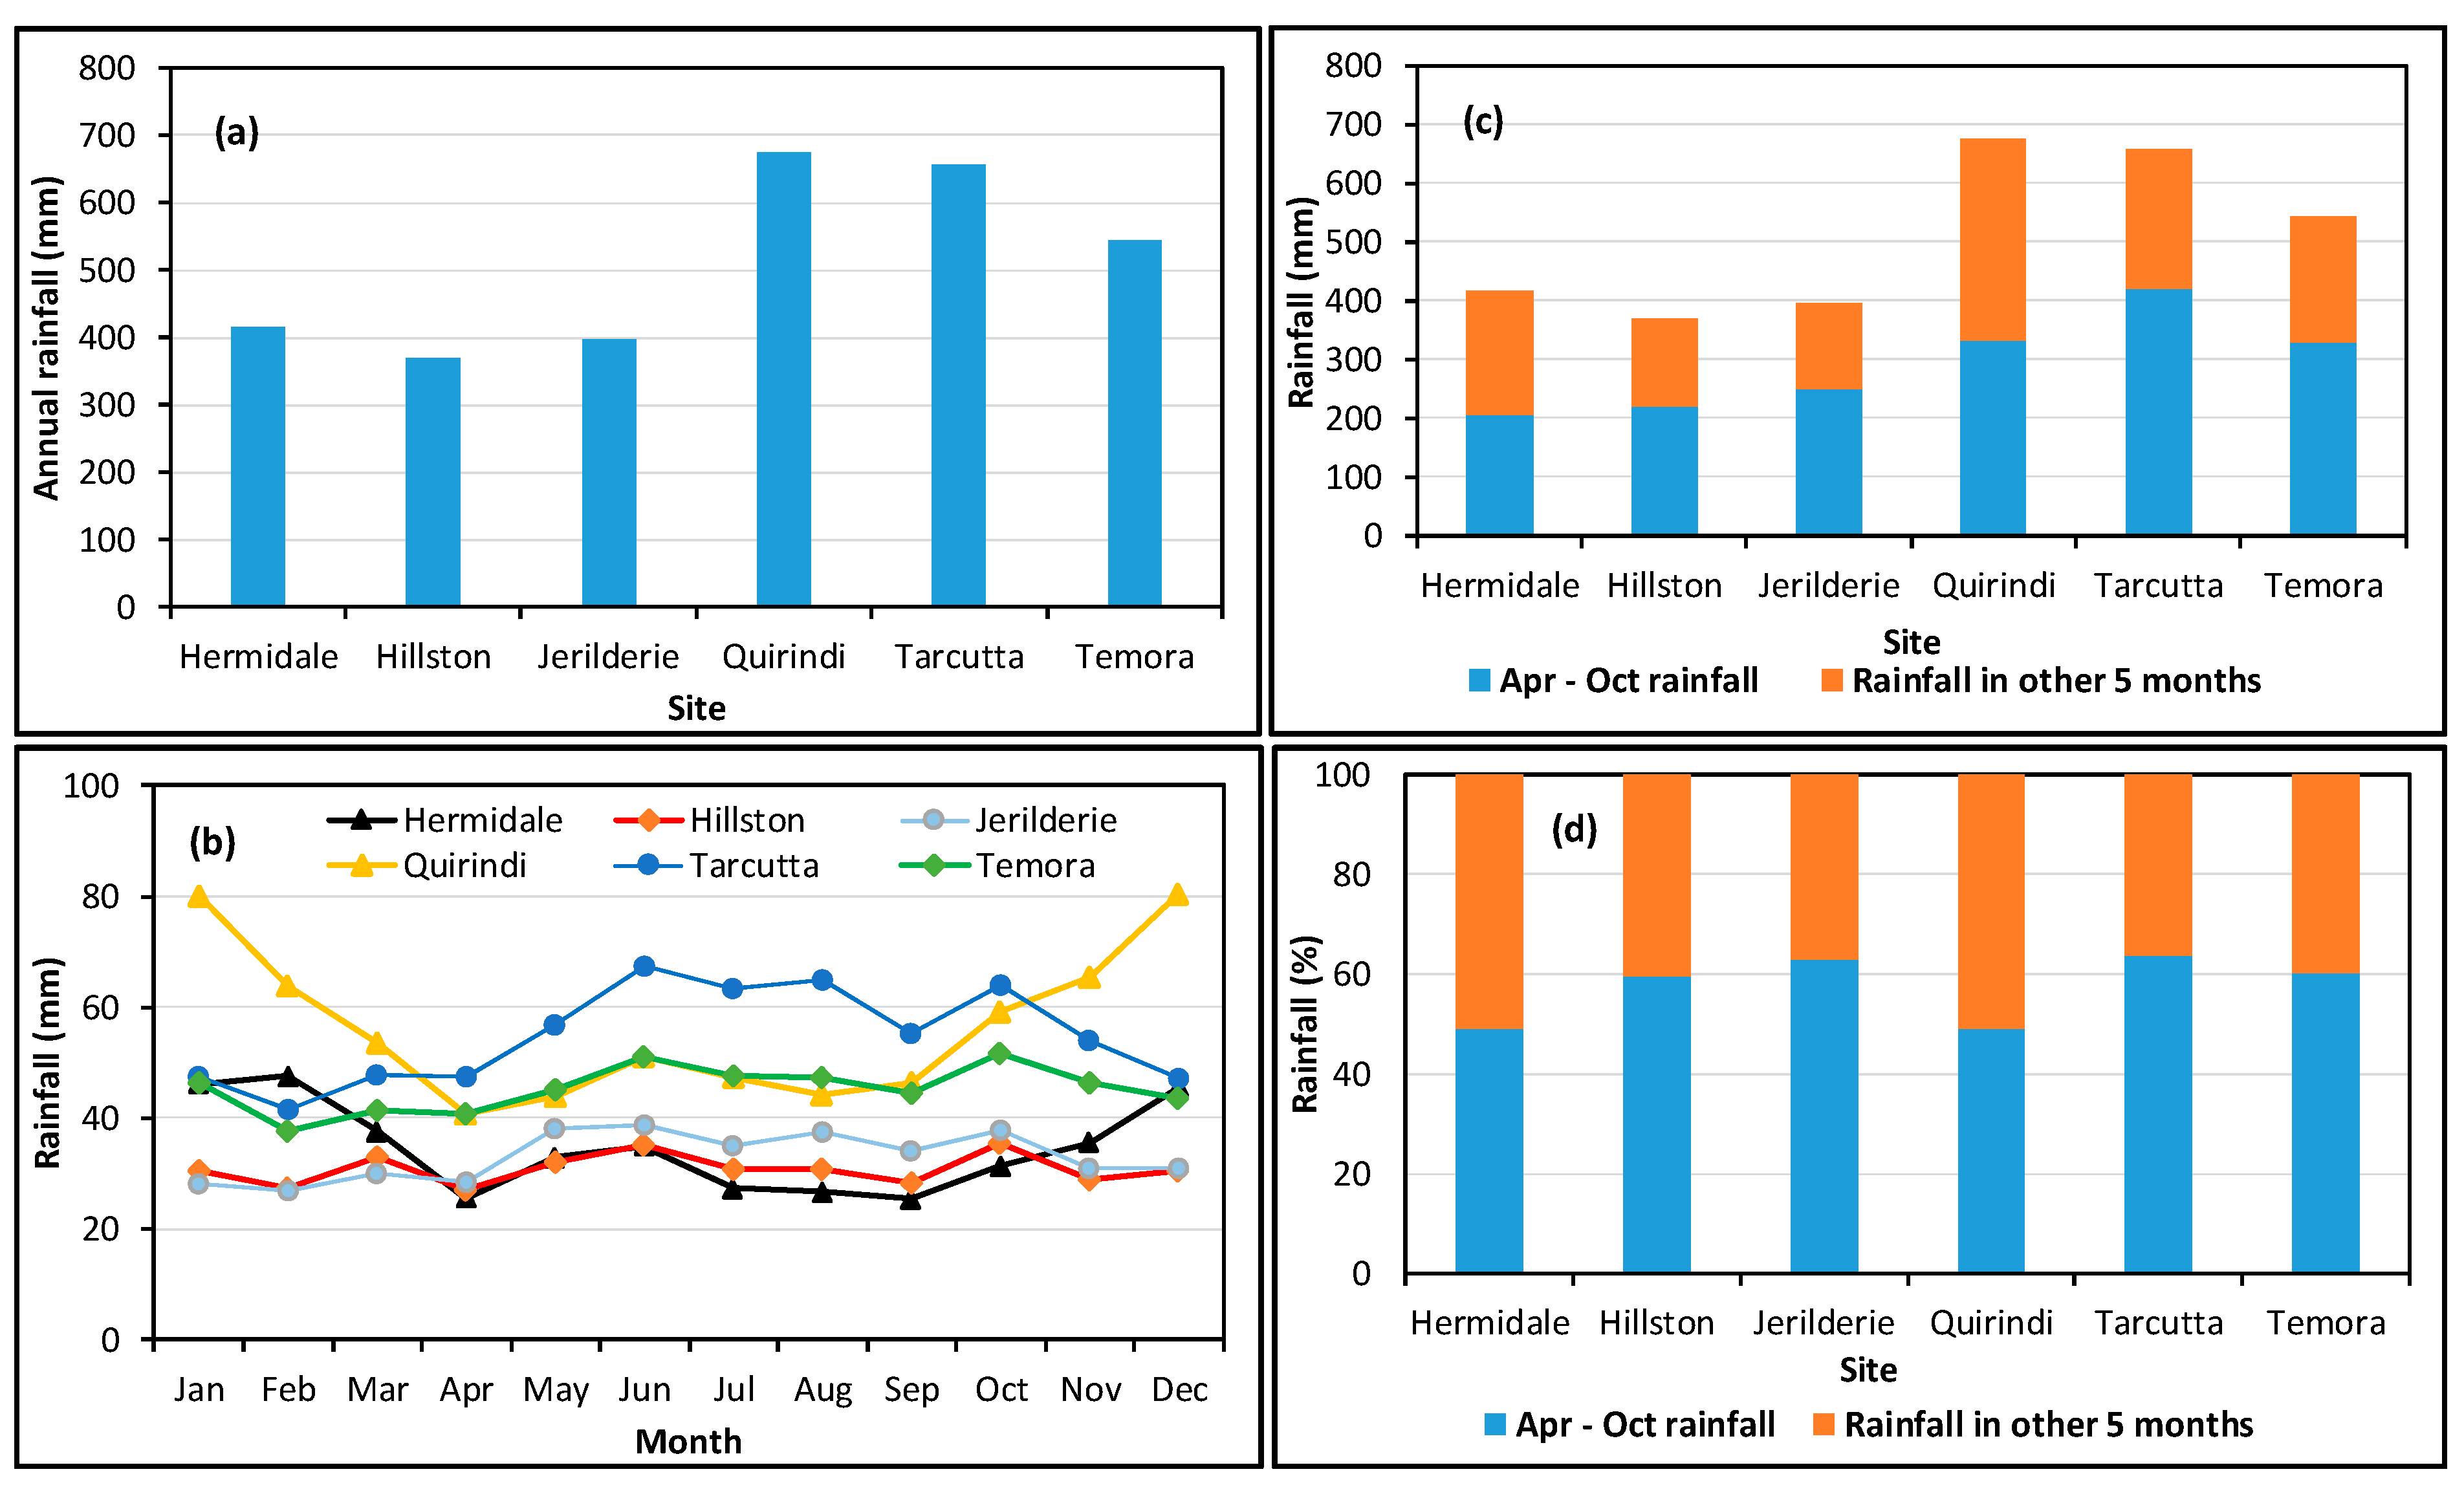
Six representative wheat production areas in terms of geographical distribution and rainfall amounts and distribution were selected in eastern and south-eastern Australia (Figure 1). The weather data for the study site, Wagga Wagga, were obtained from the Australian Bureau of Meteorology (http://www.bom.gov.au/ accessed on 6 May 2020) and the Scientific Information for Land Owners (SILO) climate database (https://www.longpaddock.qld.gov.au/silo accessed on 6 May 2020). Three of the sites with respective rainfall (Hermidale 416 mm, Hillston 370 mm and Jerilderie 398 mm) have relatively low annual rainfall, while three (Quirindi 676 mm, Temora 544 mm and Tarcutta 657 mm) have relatively high annual rainfall. Two of the sites (Hermidale and Quirindi) have summer-dominant rainfall, two of the sites (Hillston and Temora) have more or less uniform rainfall distribution throughout the year, and two of the sites (Jerilderie and Tarcutta) have slightly winter-dominant rainfall (Figure 2).
Hermidale had a summer-dominant rainfall pattern with 51% of the rainfall during the five summer (Jan–March and Nov–Dec) months and 49% during the seven winter (April–October) months (Figure 2). Hillston had a winter-dominant rainfall with 59% of rainfall during the winter months and 41% during the 5 summer months. Jerilderie had a winter-dominant rainfall with 63% of rainfall during the winter months and 37% of the rainfall during the 5 summer months. Quirindi had a summer-dominant rainfall with 51% of the rainfall during the summer months and 49% of rainfall during the winter months. Tarcutta had a winter-dominant rainfall with 64% of rainfall during the winter months and 36% of the rainfall during the summer months. Temora had a winter-dominant rainfall with 60% of rainfall during the winter months and 40% of the rainfall during the summer months.
2.2. Climate Projections Data
Climate projections data from the GCMs archive, developed by different modelling groups through the Coupled Model Intercomparison Project phase 5 (CMIP5) were used. In the latest Intergovernmental Panel on Climate Change (IPCC) assessment report (IPCC assessment report 5, IPCC-AR5), the projected changes were set for four representative concentration pathways (RCPs), which are scenarios of emissions of greenhouse gases. Four RCP types were identified in the IPCC-AR5, namely RCP2.6, RCP4.5, RCP6.0 and RCP8.5; in this study RCP4.5 and RCP8.5 scenarios were used. RCP4.5 is for an anthropogenic radioactive forcing reaching 4.5 W/m2 by 2100 relative to the preindustrial level. It assumes an emissions reduction that would stabilise the CO2 concentration at about 540 ppm by 2100. RCP8.5 is a high emission scenario with a radiative forcing of 8.5 W/m2 by 2100. It corresponded to an increase in emissions, leading to a CO2 concentration of about 940 ppm by 2100 [23]. The baseline period centred on 1985 (1971–2000) and three future periods 2030, 2050 and 2070 were selected.
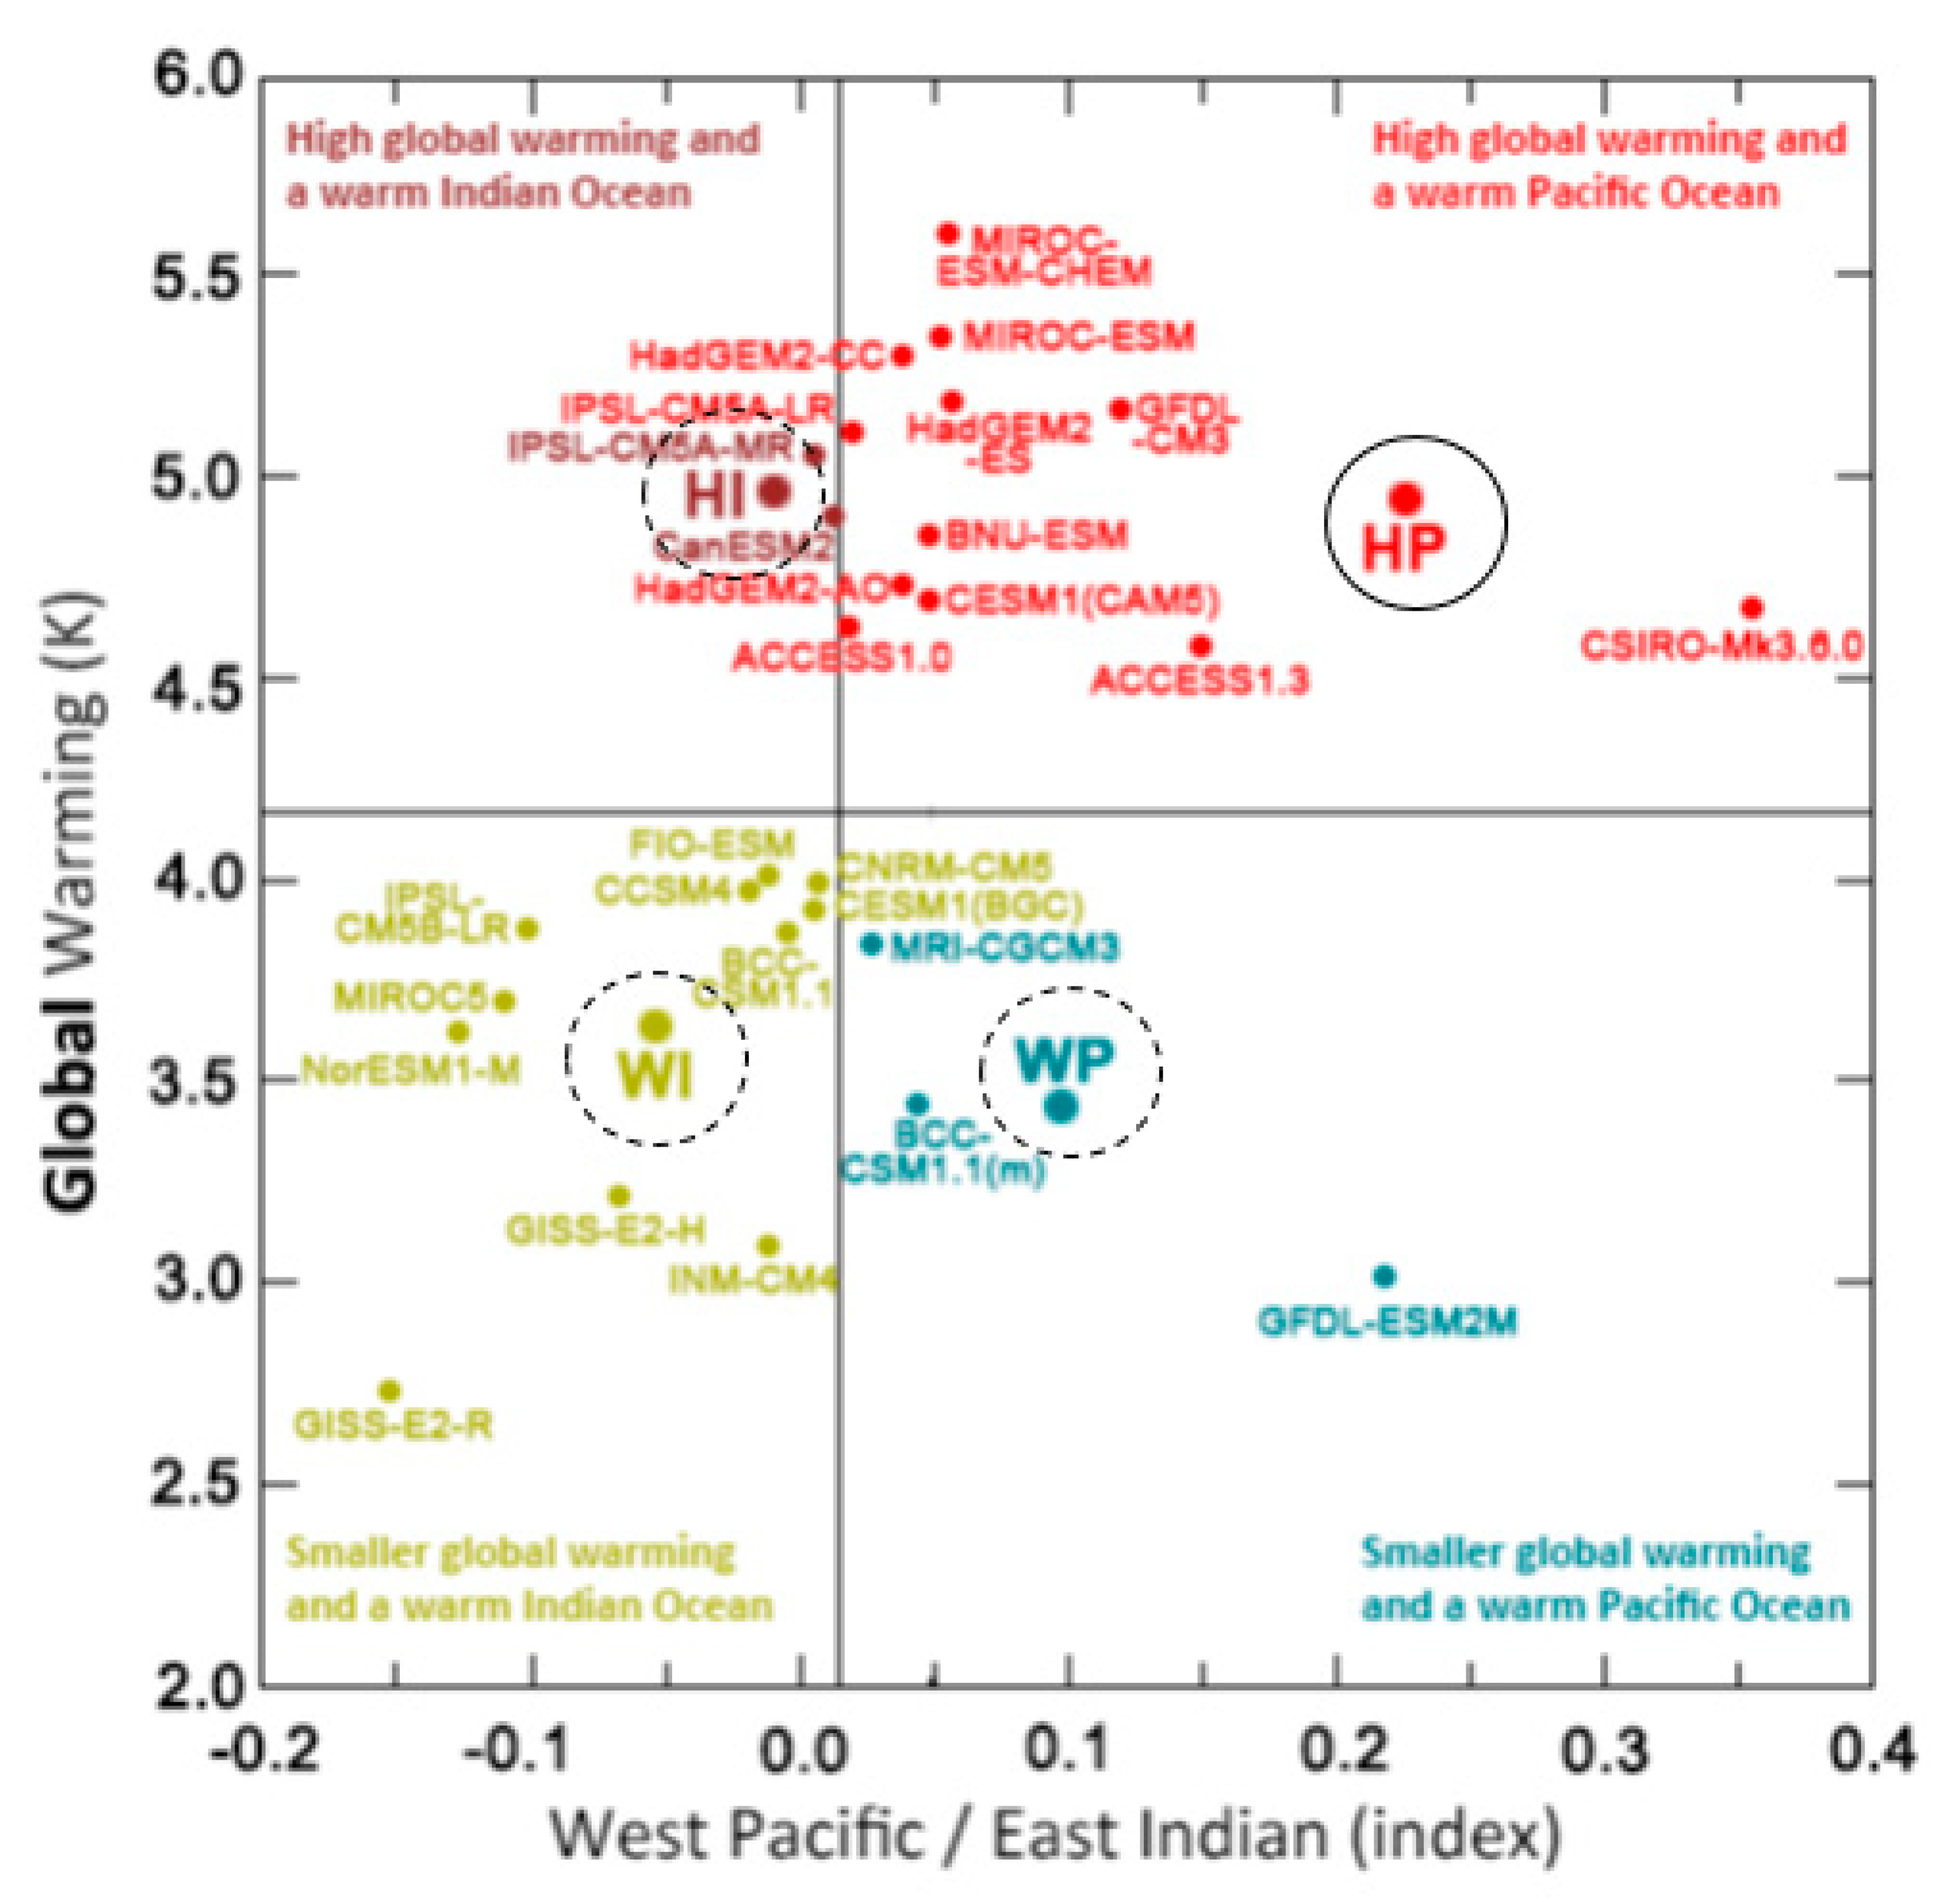
Spatially and temporally complete Australia-wide daily climate data from 1889 to current was obtained from the SILO historical database. The consistent climate change scenarios (CCS) historical baseline high-quality climate datasets are available from 1960 onwards (http://www.longpaddock.qld.gov.au/silo accessed on 6 May 2020). A model-ready format of climate change projections data was obtained from the CCS project. In the CCS-AR5 projections data, 19 GCM composites for four representative future climate periods are available. Because of the inherent assumptions in the models and model bias, using climate projections from a single GCM can lead to large errors. For this reason, it is advised either to use all available GCMs or to use a composite projection based on these models. In this study, a composite of climate models suitable for the study region was used (https://legacy.longpaddock.qld.gov.au/climateprojections/index.html?csrt%= accessed on 6 May 2020). In this resource, there are four composite climate projections clusters: HP = high global warming and a warm Pacific Ocean; WI = smaller global warming and a warm Indian Ocean; HI = high global warming and a warm Indian Ocean; WP = smaller global warming and a warm Pacific Ocean (Figure 3). Of the four composite models, HP, which has the highest number of models and the highest relative “accuracy” was used in this study.
2.3. Climate Change Impacts and Adaptation Strategies
The impact of changing climate (CO2 concentration, air temperature and rainfall) on crop phenology, above-ground dry matter, evaporation/evapotranspiration and grain yield was simulated using APSIM [16]. The impacts were determined for six sites, three projection periods, two emission scenarios, two wheat cultivars and six sowing dates. The APSIM simulated the yield of short-season and long-season wheat cultivars at different sites was used to evaluate the suitability of a particular cultivar to a given site in the future climate (Table 1). The simulated yield of a given cultivar in the future climate, relative to the baseline yield, for different sowing dates was used to evaluate sowing dates suitable in the future climate.
2.4. Simulations
APSIM-Wheat model (Version 7.10) [16] was used to determine the likely effects of climate change on wheat phenology, water use, dry matter production and grain yield under two climate change scenarios (RCP4.5 and RCP8.5), for the baseline period 1985 (1971–2000), and three projection periods (2030, 2050 and 2070). The potential of short-season vs. long-season wheat cultivars and early-sowing dates vs. late-sowing dates in reducing the effects of climate change on wheat yield was also evaluated at six sites in the major wheat-producing region of Australia. APSIM, one of the most widely used agricultural systems models, is a bio-physical model with a modular structure of soil, crop, climate, and management components [16]. A simulation model was set up for two wheat cultivars, short-season Livingston and long season Sunbrook. In northern NSW, the recommended sowing window of Livingston is the 4th week of May–3rd week of June and the recommended sowing window of Sunbrook is the 2nd week of April–4th week of April. In southern NSW, the recommended sowing window of Livingston is the 3rd week of May–2nd week of June.
For each cultivar, six sowing periods were simulated. For Livingston week 1 (wk1) of April, wk4 of April, wk3 of May, wk3 of June, wk1 of July, wk3 of July. For Sunbrook, wk2 of March, wk4 of March, wk2 of April, wk4 of April, wk2 of May, wk4 of May. Non-limiting nitrogen fertiliser (150 kg/ha NO3-N) was applied at sowing. A sowing density of 100 plants/m2, row spacing of 25 cm, and sowing depth of 3 cm were used. The soil water profile was assumed to be 50% full at the time of sowing. A number of parameters were simulated, including days to flowering, days to maturity, above-ground dry matter, and grain yield. The changes in temperature, rainfall, days to flowering and days to maturity, relative to the baseline period, were determined. The changes in grain yield for different sowing dates, relative to the baseline period, were used to evaluate how a change in sowing date can be used to mitigate yield loss due to climate change. The percentage yield reduction of the two varieties at different locations were used to assess which variety would be suitable for which site in the future climate. The output data for all the combinations of factors: site, projection year, emission scenario, wheat variety, and sowing date were analysed and summarised using the R-statistical program [25]. A soil with high plant available water capacity (191 mm/1.5 m), bulk density 1.53 g/cm3, wilting point 0.17 cm3/cm3 and field capacity 0.30 cm3/cm3 was adopted from the APSoil database https://www.apsim.info/apsim-model/apsoil/ accessed on 6 May 2020 [26].
3. Results
3.1. Projected Climate Relative to Baseline
Temperature was projected to increase under both RCP scenarios considered in this study, RCP4.5 and RCP8.5. Under the medium emission scenario RCP4.5, relative to the baseline, the increase in minimum temperature would be 0.67 °C, 1.25 °C and 1.4 °C in 2030, 2050 and 2070, respectively, while the maximum temperature would increase by 0.9 °C, 1.6 °C and 2.2 °C, respectively. There was no significant difference between the study sites. For Temora-RCP4.5, for example, the median winter crop growing season minimum temperature would increase by 0.7 °C, 1.2 °C and 1.4 °C in 2030, 2050 and 2070, respectively, while the maximum temperature would increase by 0.8 °C, 1.2 °C and 1.8 °C, respectively. For RCP8.5 these values would be 0.7 °C, 1.3 °C and 2.1 °C for minimum temperature and 0.8 °C, 1.6 °C and 2.6 °C for the maximum temperature.
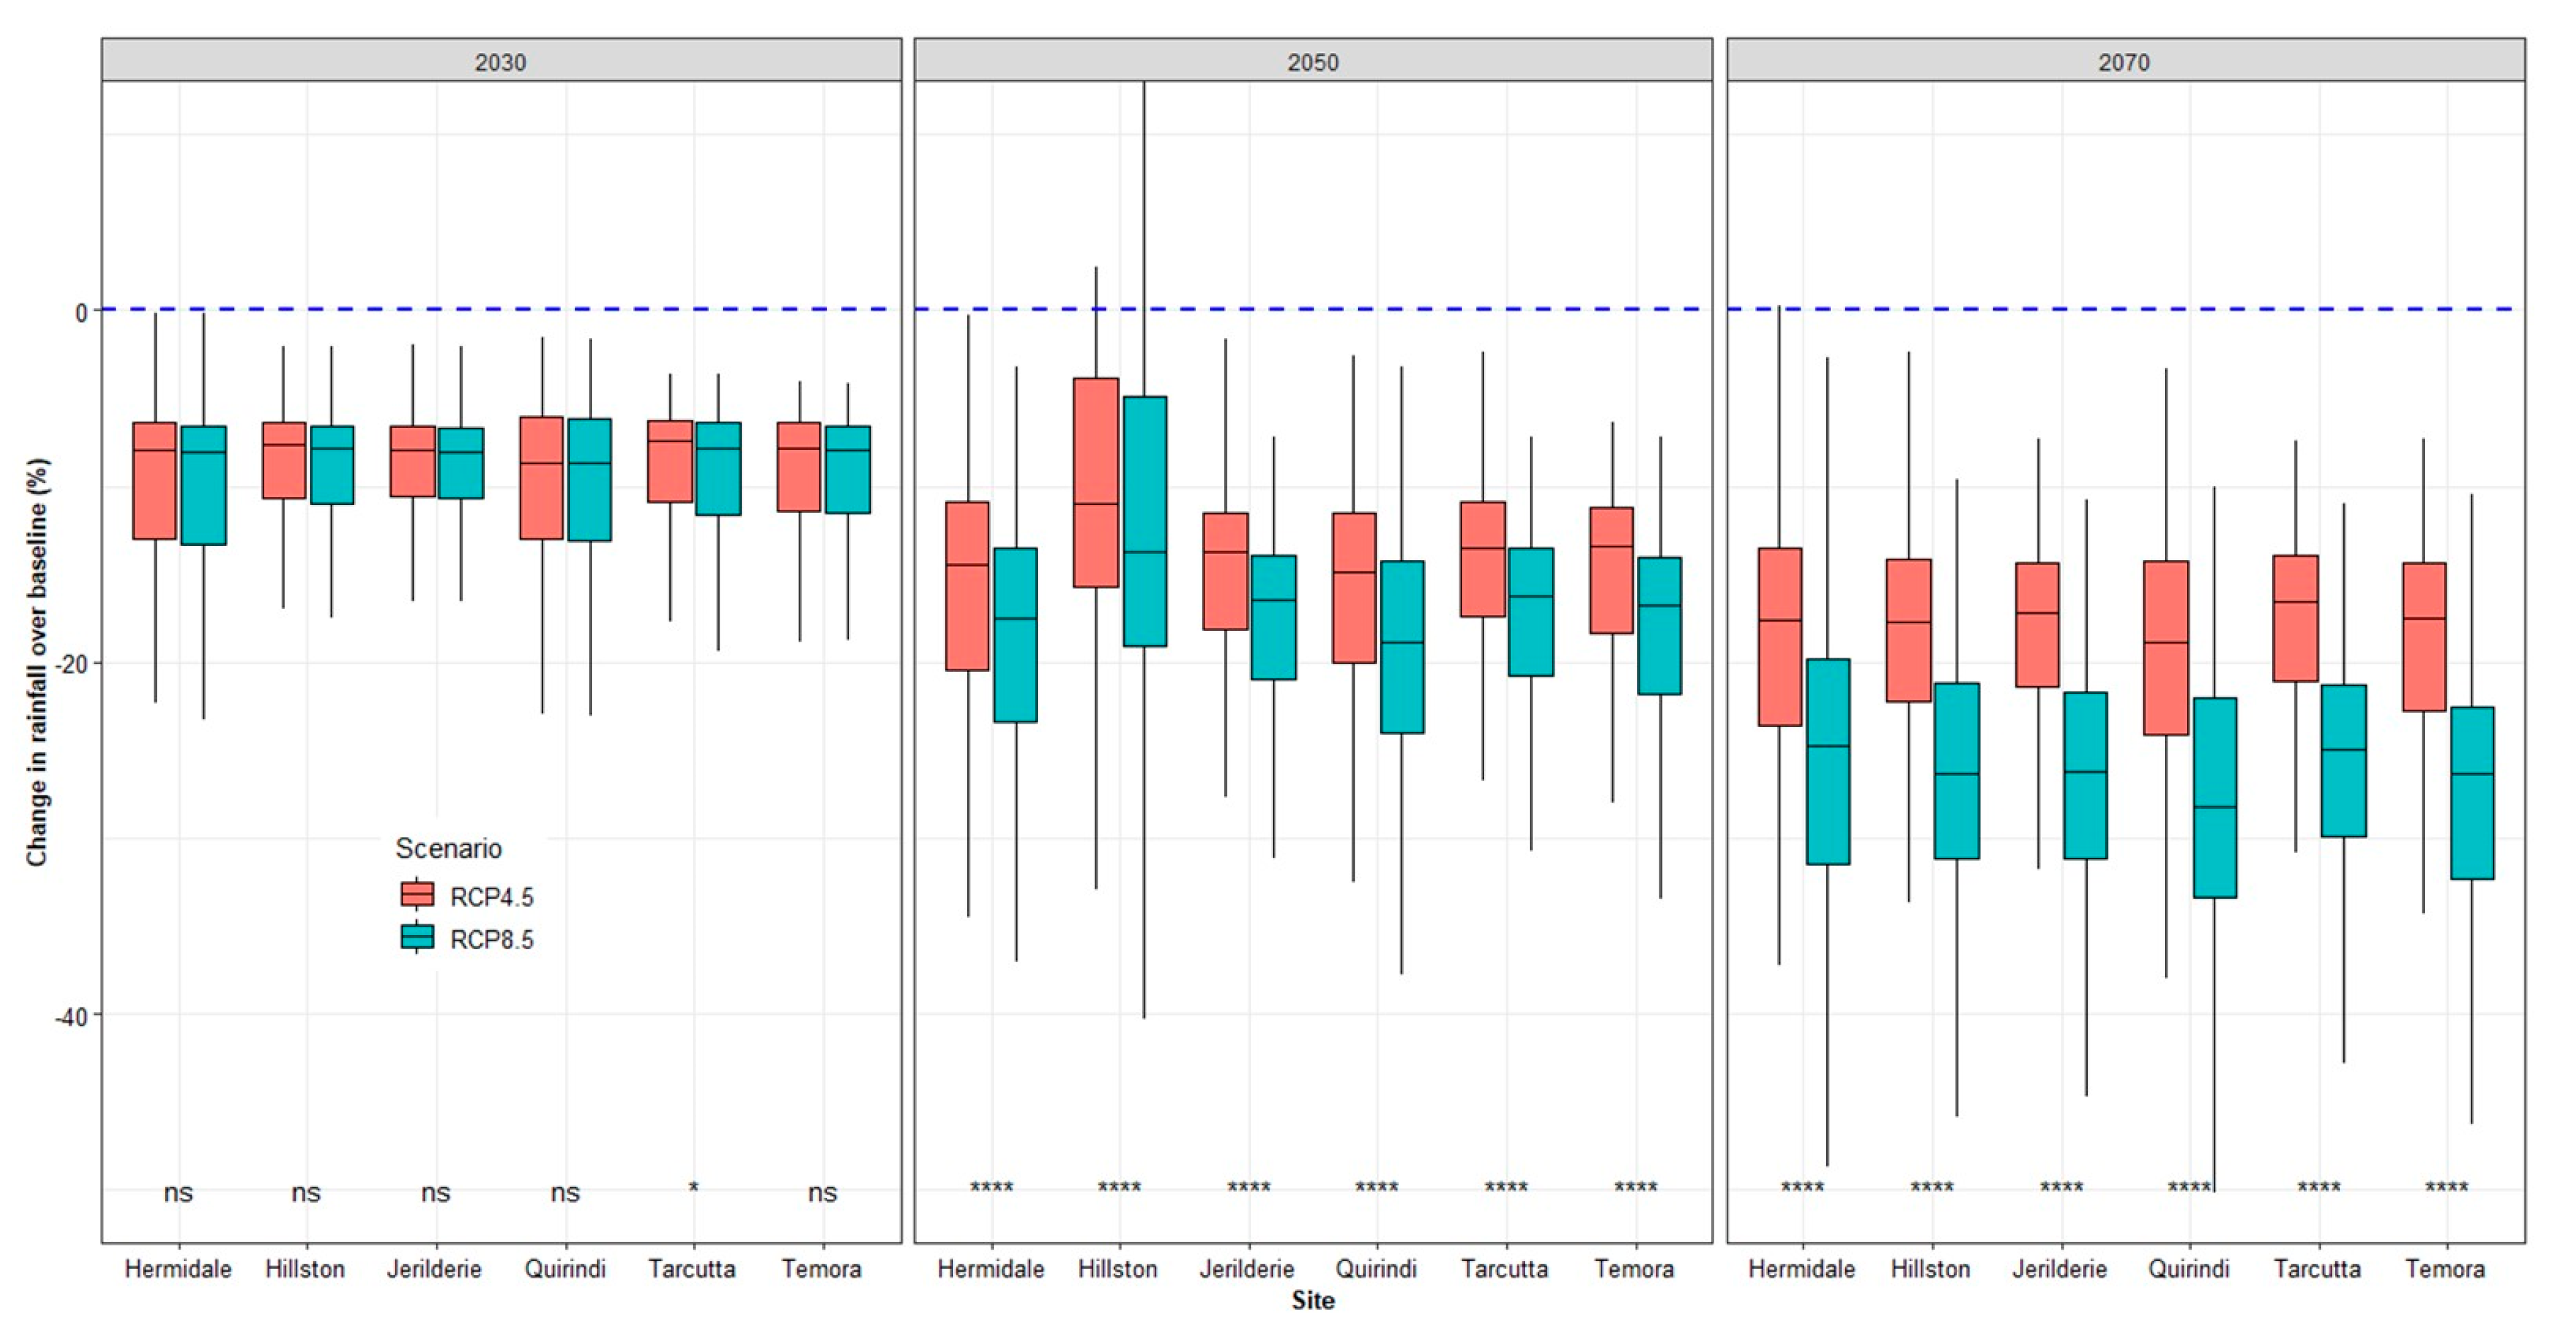
The change in projected rainfall relative to the baseline during the three projection periods and the two climate scenarios is shown in Figure 4. Under RCP4.5, the rainfall would decrease by almost the same proportion at all sites, which was 9% in 2030, 15% in 2050 and 19% in 2070. In the near future projection (2030), there would be no significant difference between the two emission scenarios, with both scenarios having a median rainfall reduction of 9%. In 2050 and 2070, there would be a significant difference between the rainfall reduction of the two emission scenarios; in 2050, the rainfall would reduce by 15% and 18% under RCP4.5 and RCP8.5, respectively, and in 2070, RCP4.5 and RCP8.5 would result in rainfall reduction of 19% and 27%, respectively. For the intermediate scenario RCP4.5, in 2030 the reduction in incrop rainfall would vary from 17 mm at Hermidale to 38 mm at Tarcutta. In 2050, the incrop rainfall decrease would vary from 25 mm at Hermidale to 61 mm at Tarcutta and in 2070, the rainfall would decrease by 31 mm at Hermidale and 75 mm at Tarcutta.
It can be seen that early sowing results in higher incrop rainfall. For example, for the Tarcutta–Livingston RCP4.5, incrop rainfall for sowing in the 1st week of April would be 371, 348 and 331 mm and for sowing in the 1st week of July, it is 295, 277 and 265 mm in 2030, 2050 and 2070, respectively. For Jerilderie-Livingston-RCP4.5, 1st week of April sowing (202, 187 and 183 mm) vs. 1st week of July sowing (156, 147 and 141 mm) in 2030, 2050, and 2070, respectively. The rainfall variability is projected to increase in the future, with the highest variation being in the low rainfall environments and the lowest in high rainfall environments.
3.2. Impact of Projected Climate on Crop Phenology
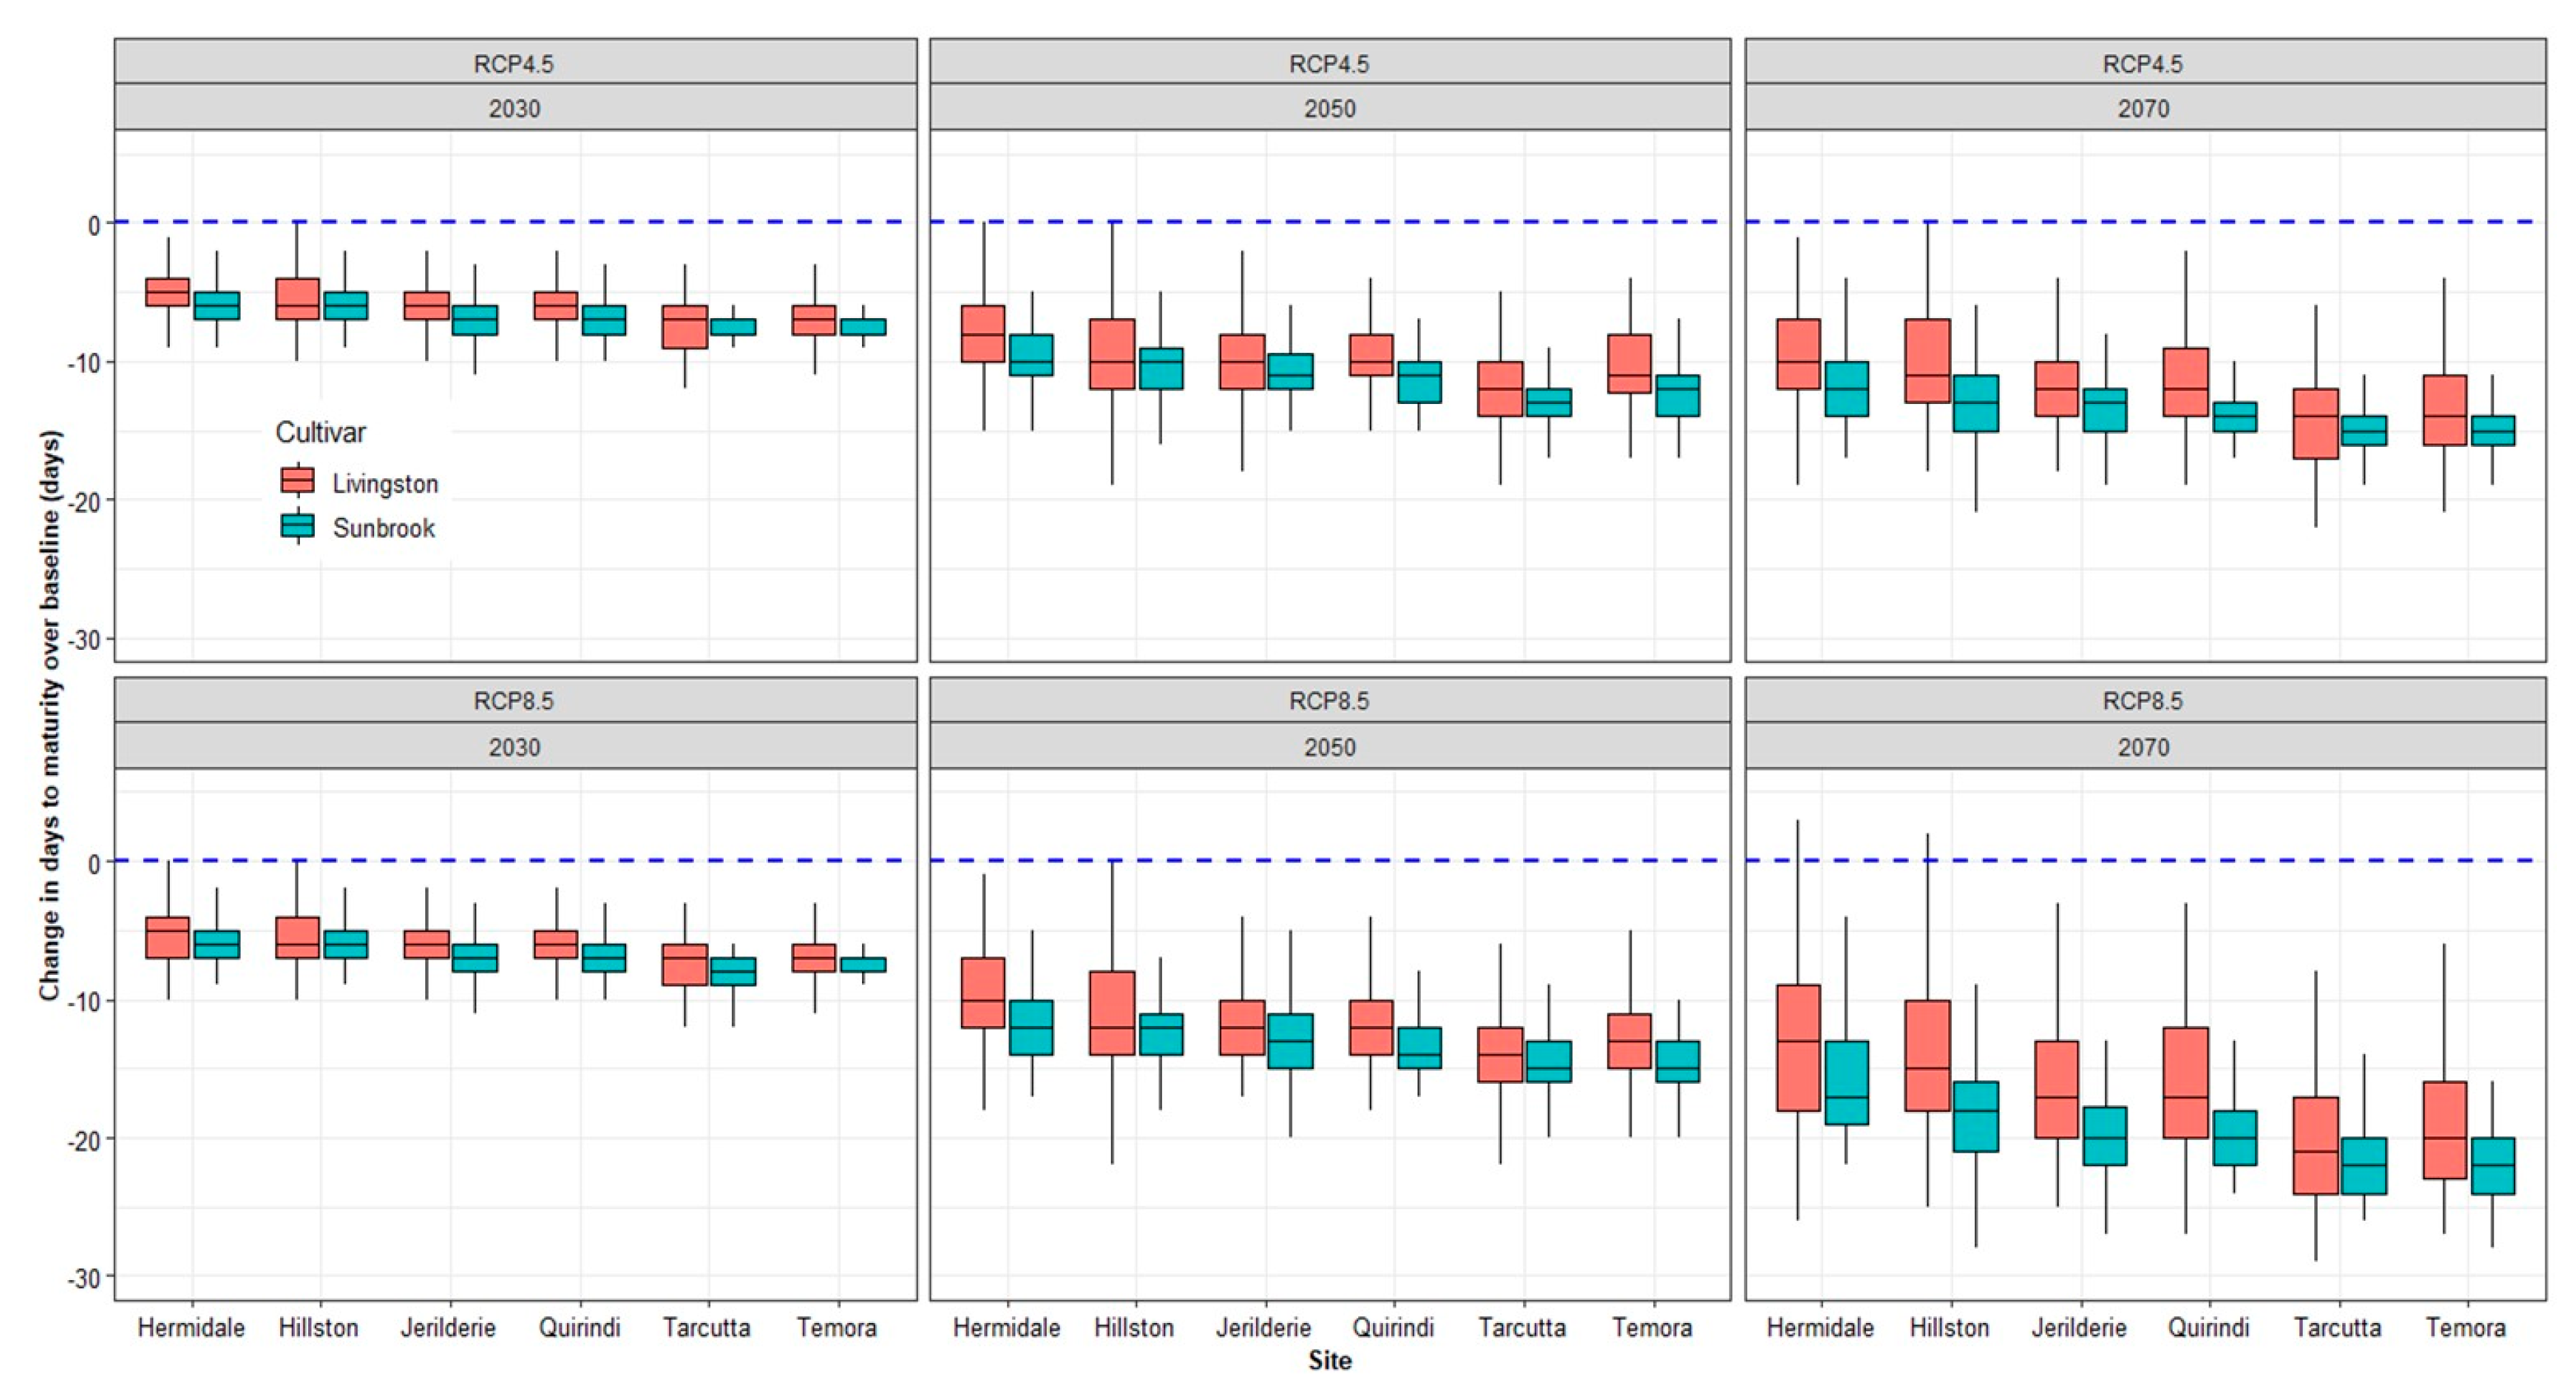
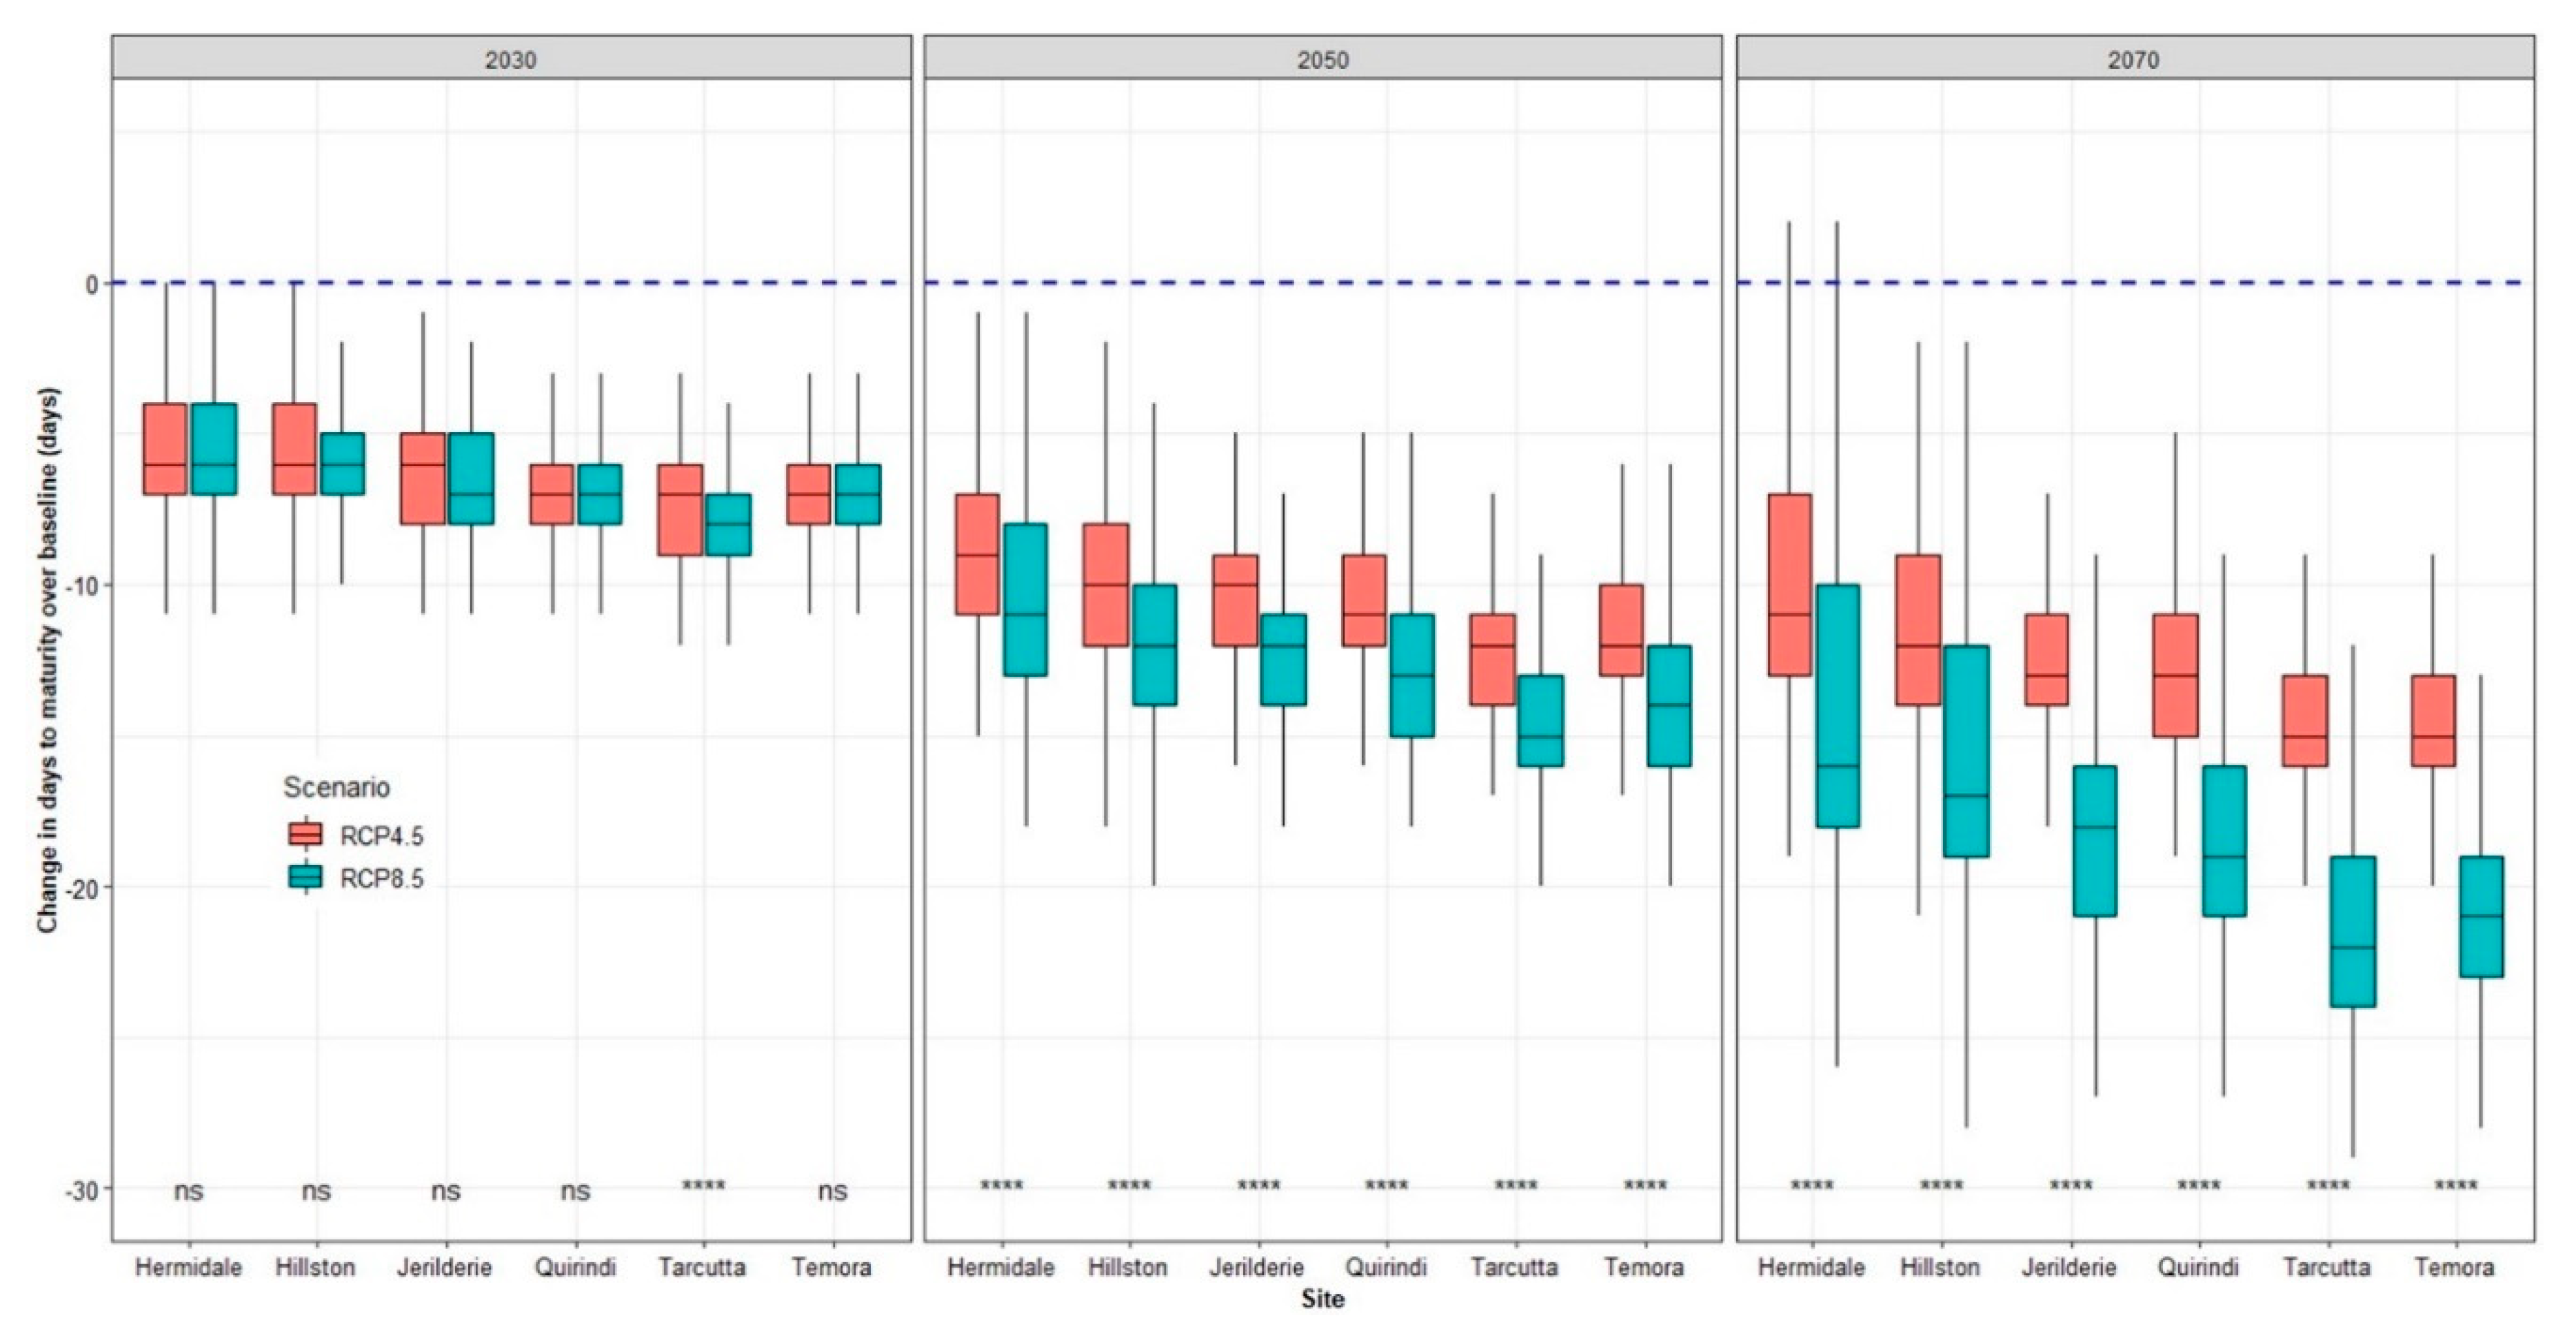
The timing of phenological events, such as days to flowering (DTF) and days to maturity (DTM), are important as they determine the yields of annual crops. There would be a significant reduction in days to maturity (DTM) (Figure 5 and Figure 6) and of the days to flowering (DTF) (Figure 7 and Figure 8) in 2030, 2050 and 2070 relative to the baseline 1971–2000. It can be seen that the reduction in DTM was higher for the relatively high-rainfall sites, distant projection year and long-season cultivar. The reduction in DTM for different emission scenarios and projection periods is shown in Figure 5. The difference between the DTM of the two emission scenarios increases with the projection period with no significant difference in 2030, except at Tarcutta. There would be a significant difference between the reduction in DTM of the two emission scenarios in 2050 and 2070. Taking the average for all the sites and the two emission scenarios, the DTM would decrease by 12 days, 22 days and 30 days in 2030, 2050 and 2070, respectively.
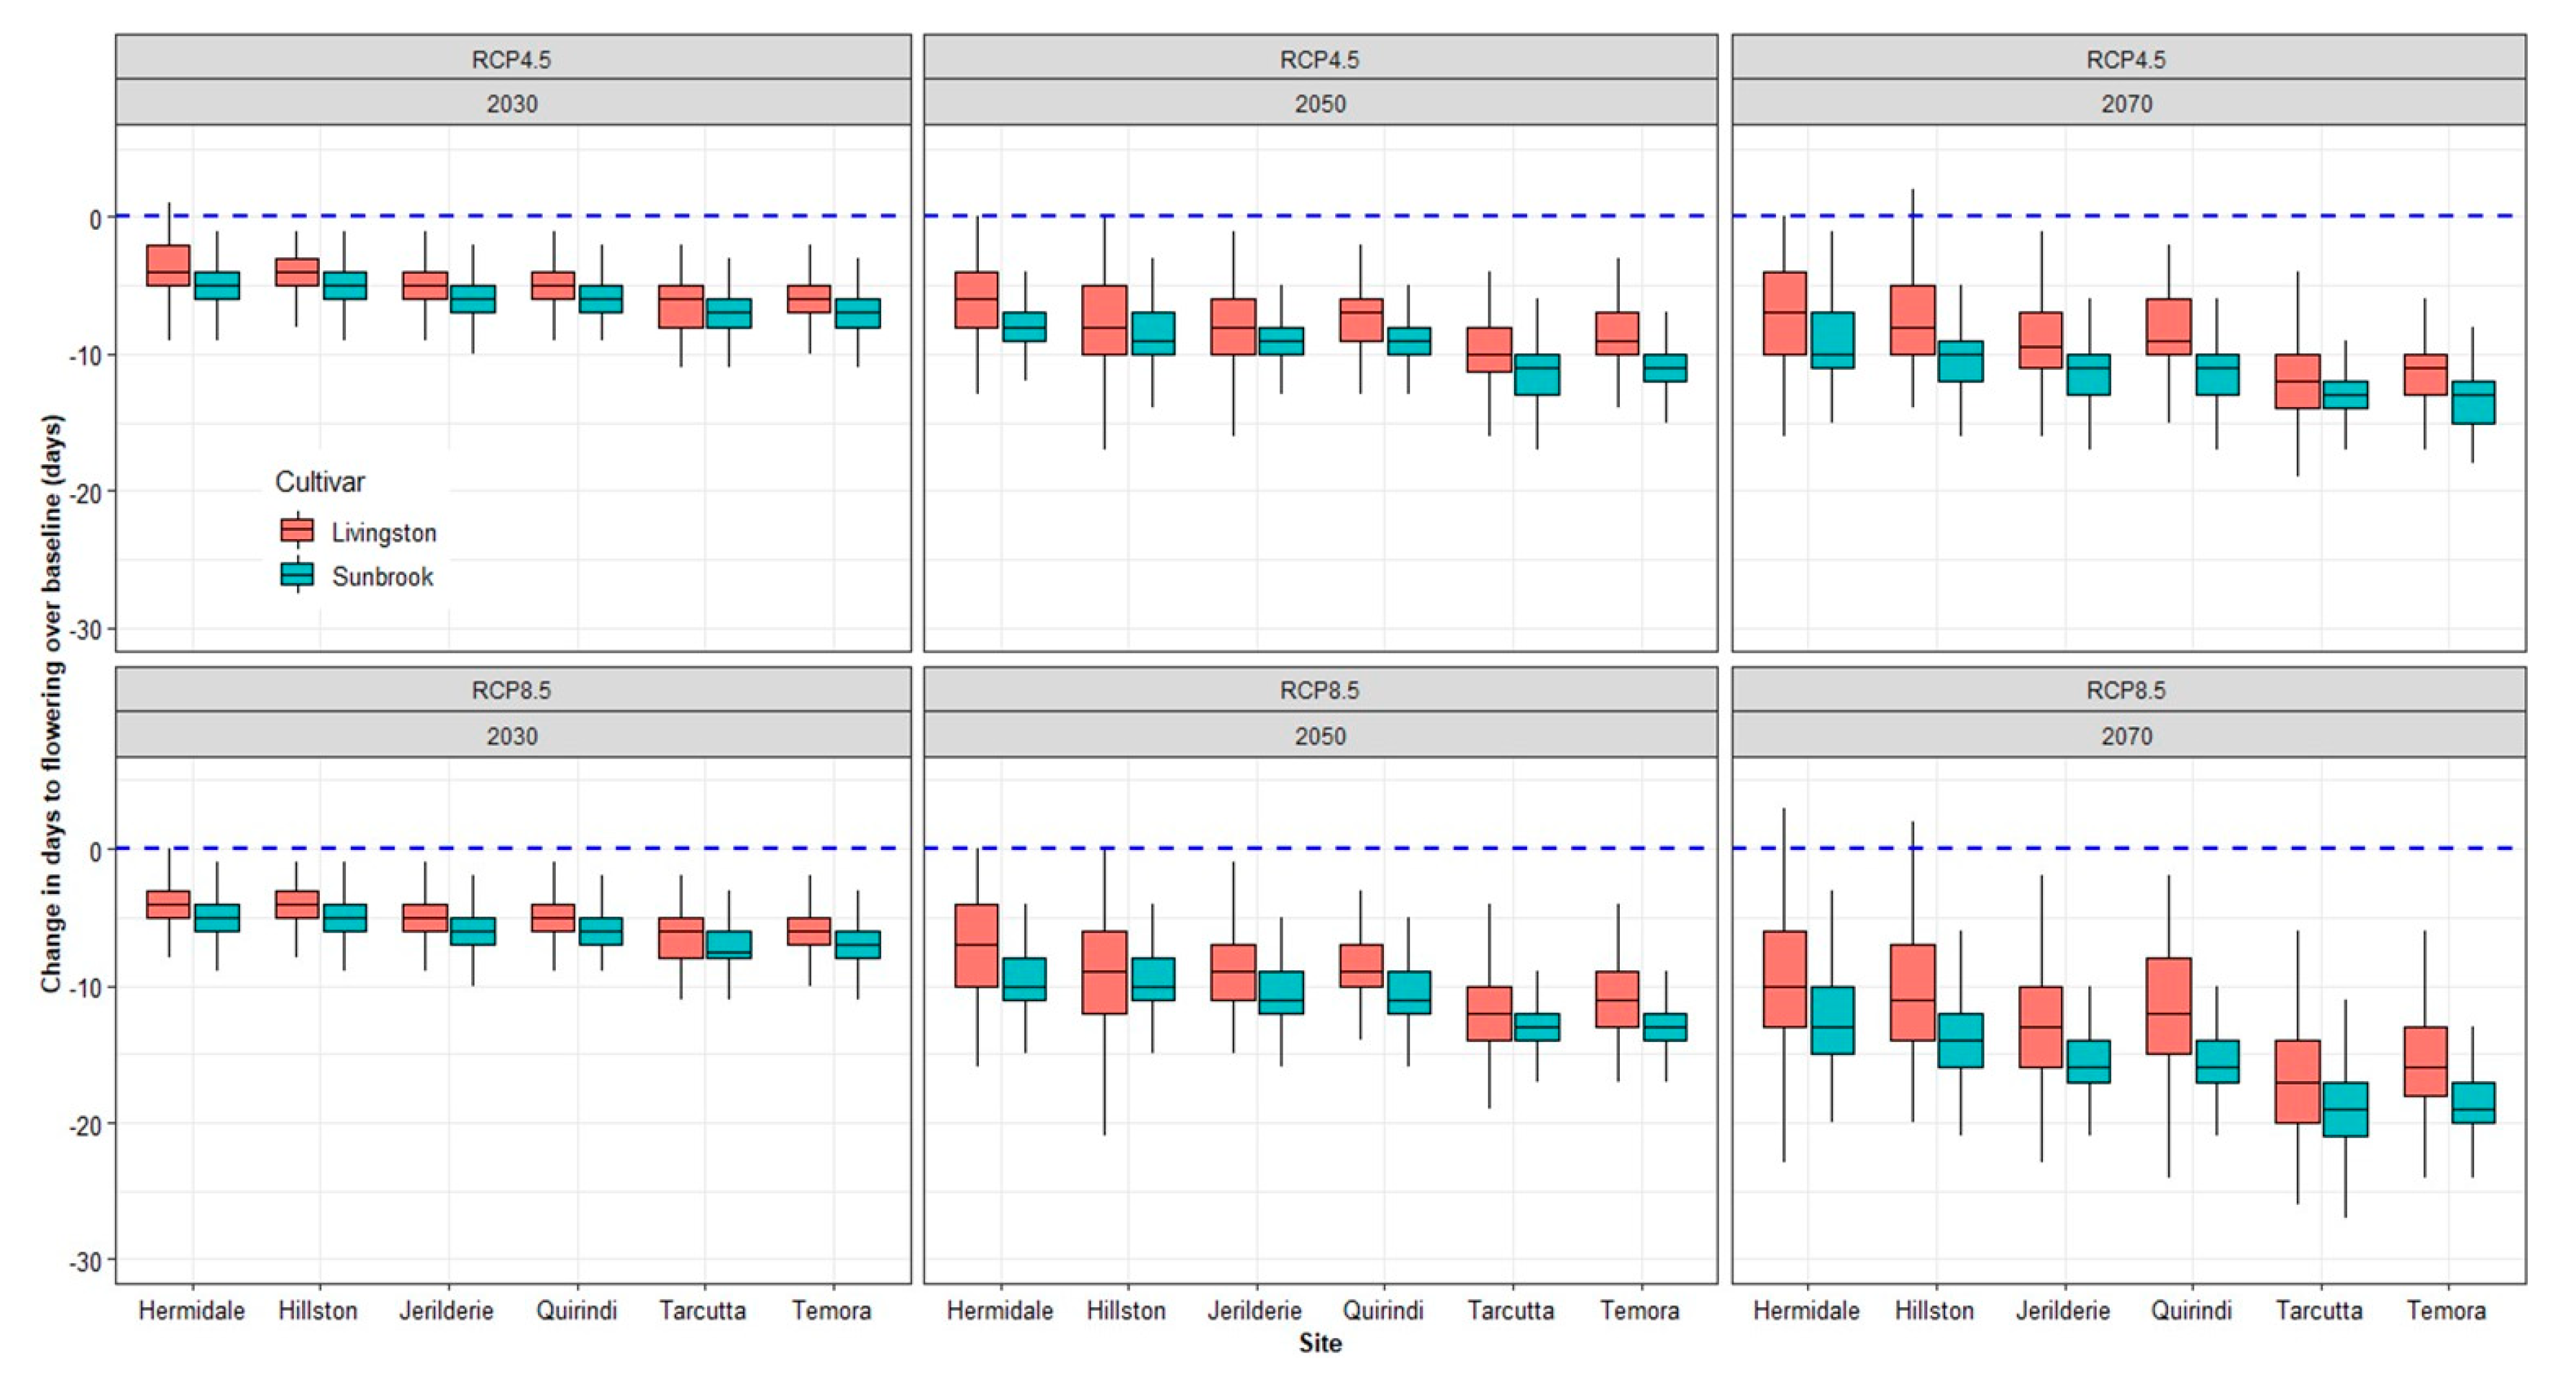
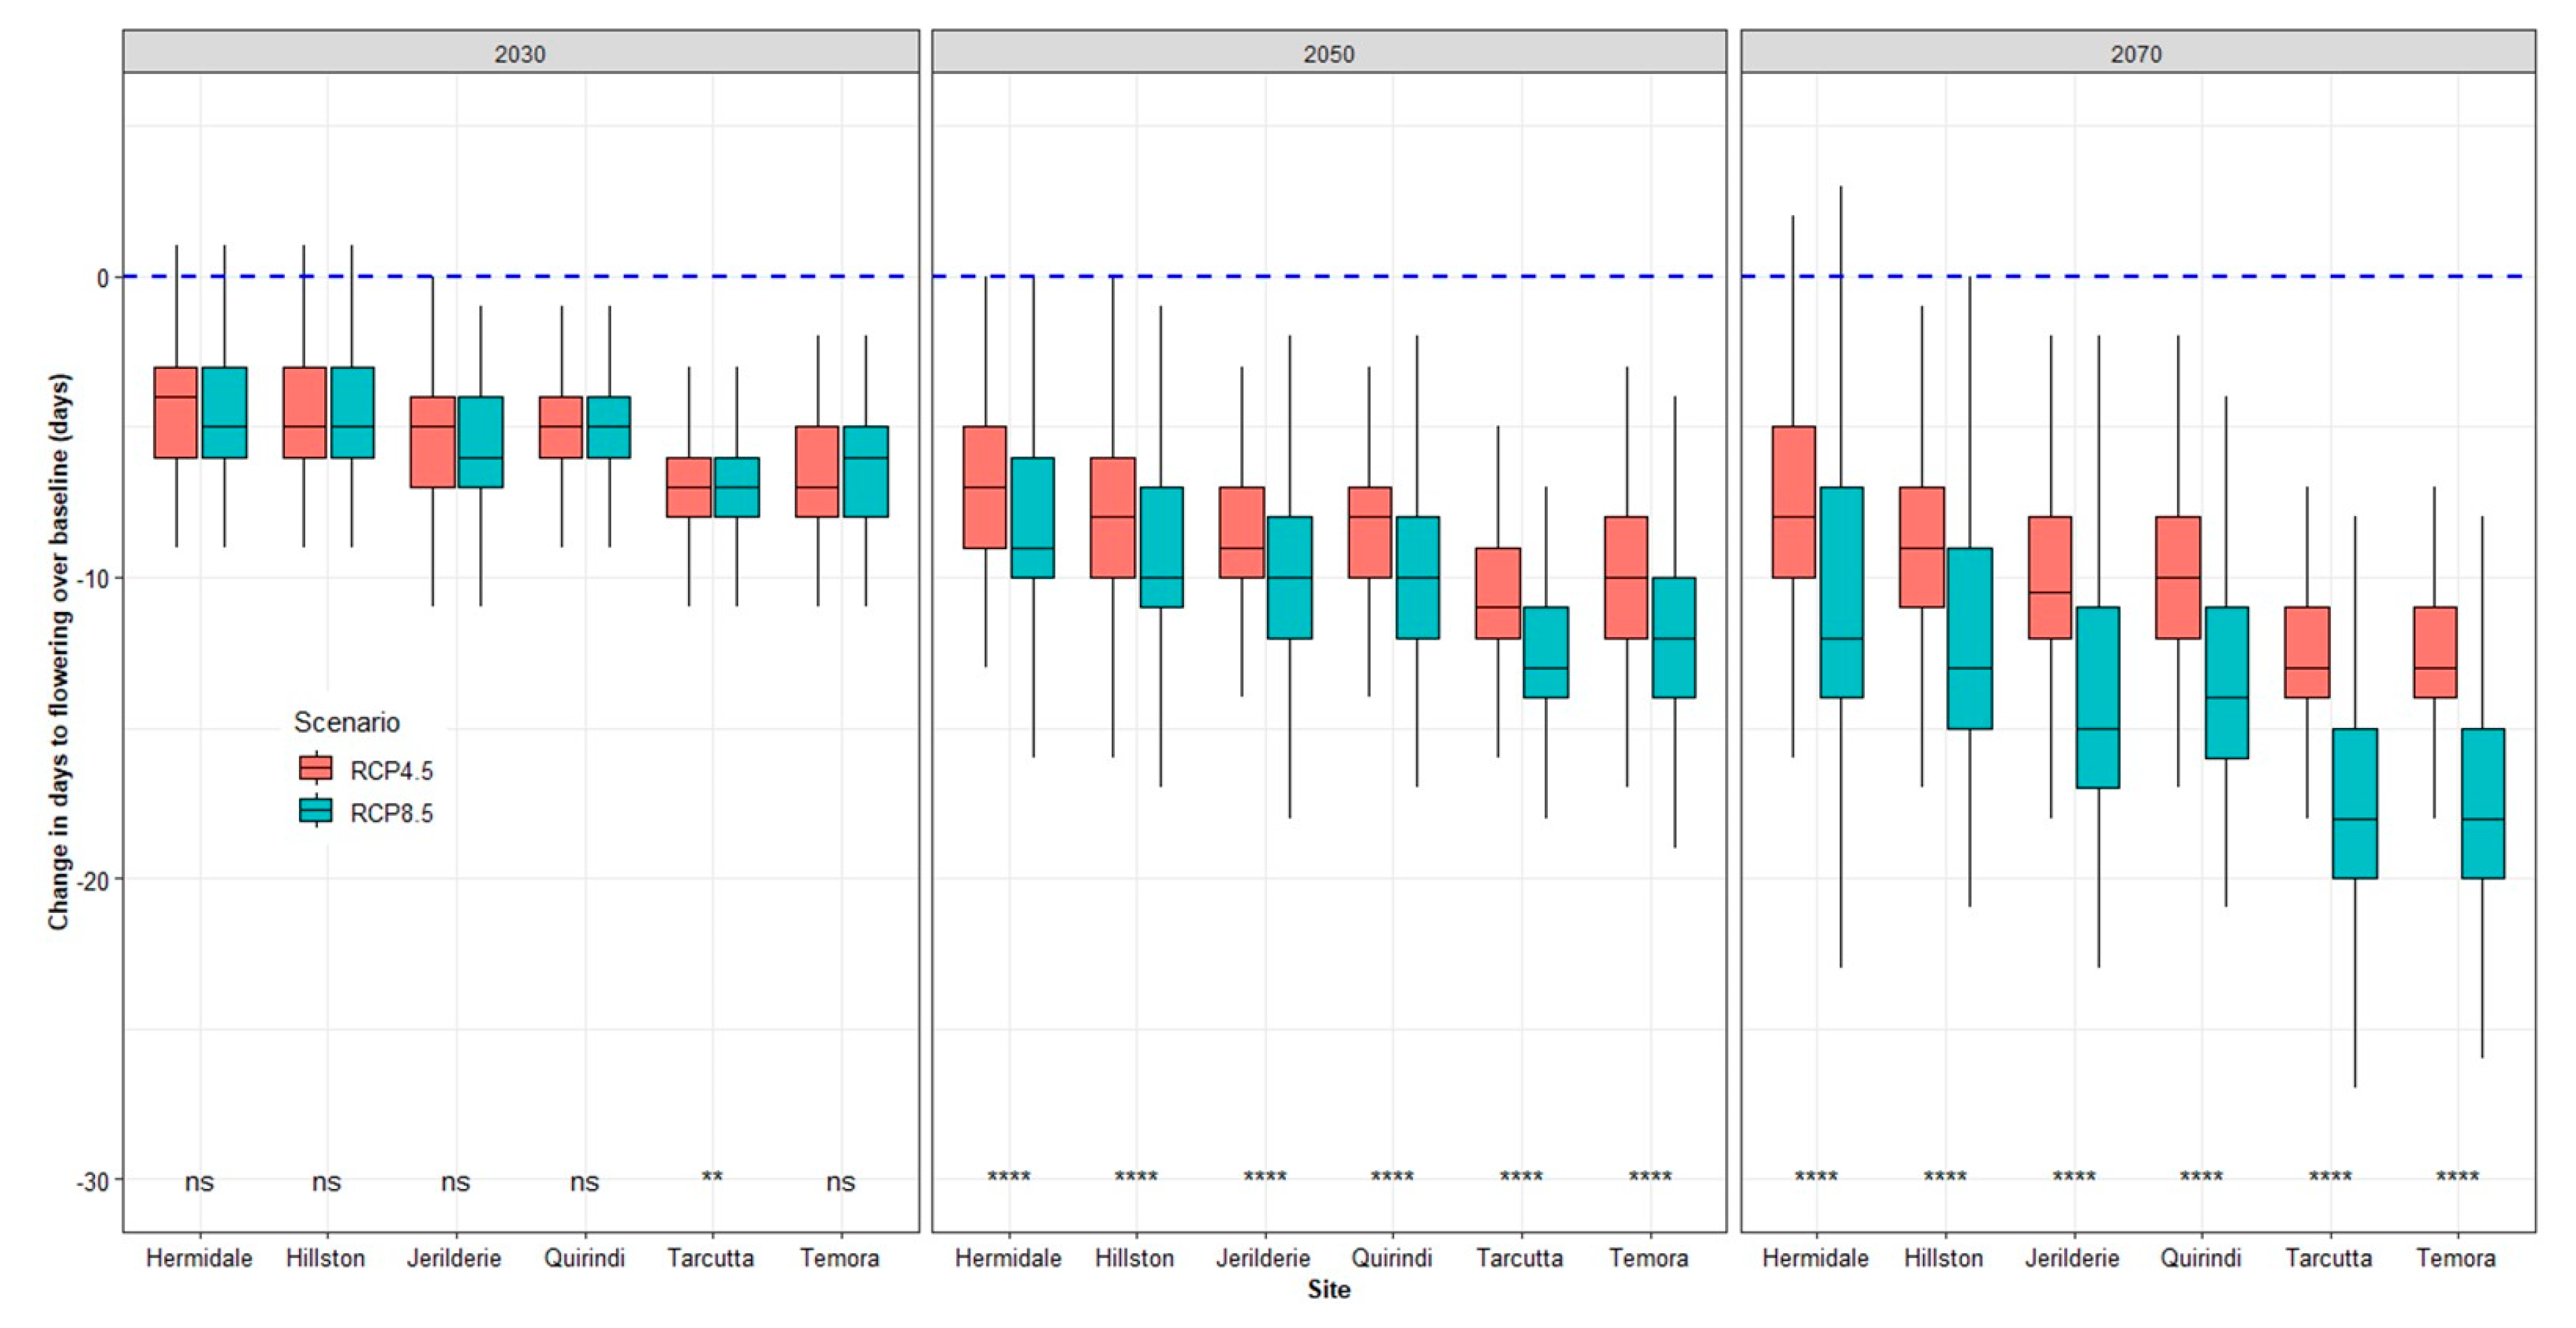
The reduction in the days to flowering (DTF) for different projection periods, emission scenarios and the two wheat cultivars is shown in Figure 7. The decrease in the DTF of Sunbrook would be higher than that of Livingston. The change in DTF of wheat for different projection periods and emission scenarios is shown in Figure 8. The difference between the DTF of the two emission scenarios increases with the projection period, the difference in 2070 being higher than that of the 2050. At Hermidale, by 2030, DTF would be reduced by 4 days both in RCP4.5 and RCP8.5. In 2050-RCP4.5, 2050-RCP8.5, 2070-RCP4.5, and 2070-RCP8.5, DTF would decrease by 7, 8, 8 and 11 days, respectively. For Temora in 2030, DTF would be reduced by 7 days both in RCP4.5 and RCP8.5, and in 2050-RCP4.5, 2050-RCP8.5, 2070-RCP4.5 and 2070-RCP−8.5, DTF would be reduced by 10, 12, 12 and 17 days, respectively. Days to flowering was more advanced in high rainfall sites compared to the low rainfall sites. For the intermediate emission scenario RCP4.5, for all the six sites, the average days to maturity would decrease by 12, 21 and 25 days in 2030, 2050 and 2070, respectively. Taking the average for all the sites and the two emission scenarios, the DTF would decrease by 5, 9, and 12 days in 2030, 2050, and 2070, respectively. Comparing the changes of DTF and DTM in the future climate, it can be seen that days to flowering is reduced only slightly compared to the days to maturity. This shows that it is the grain-filling period, after flowering, that is highly affected/shortened due to the changing climate.
3.3. Impact of Projected Climate Change on Crop Yield
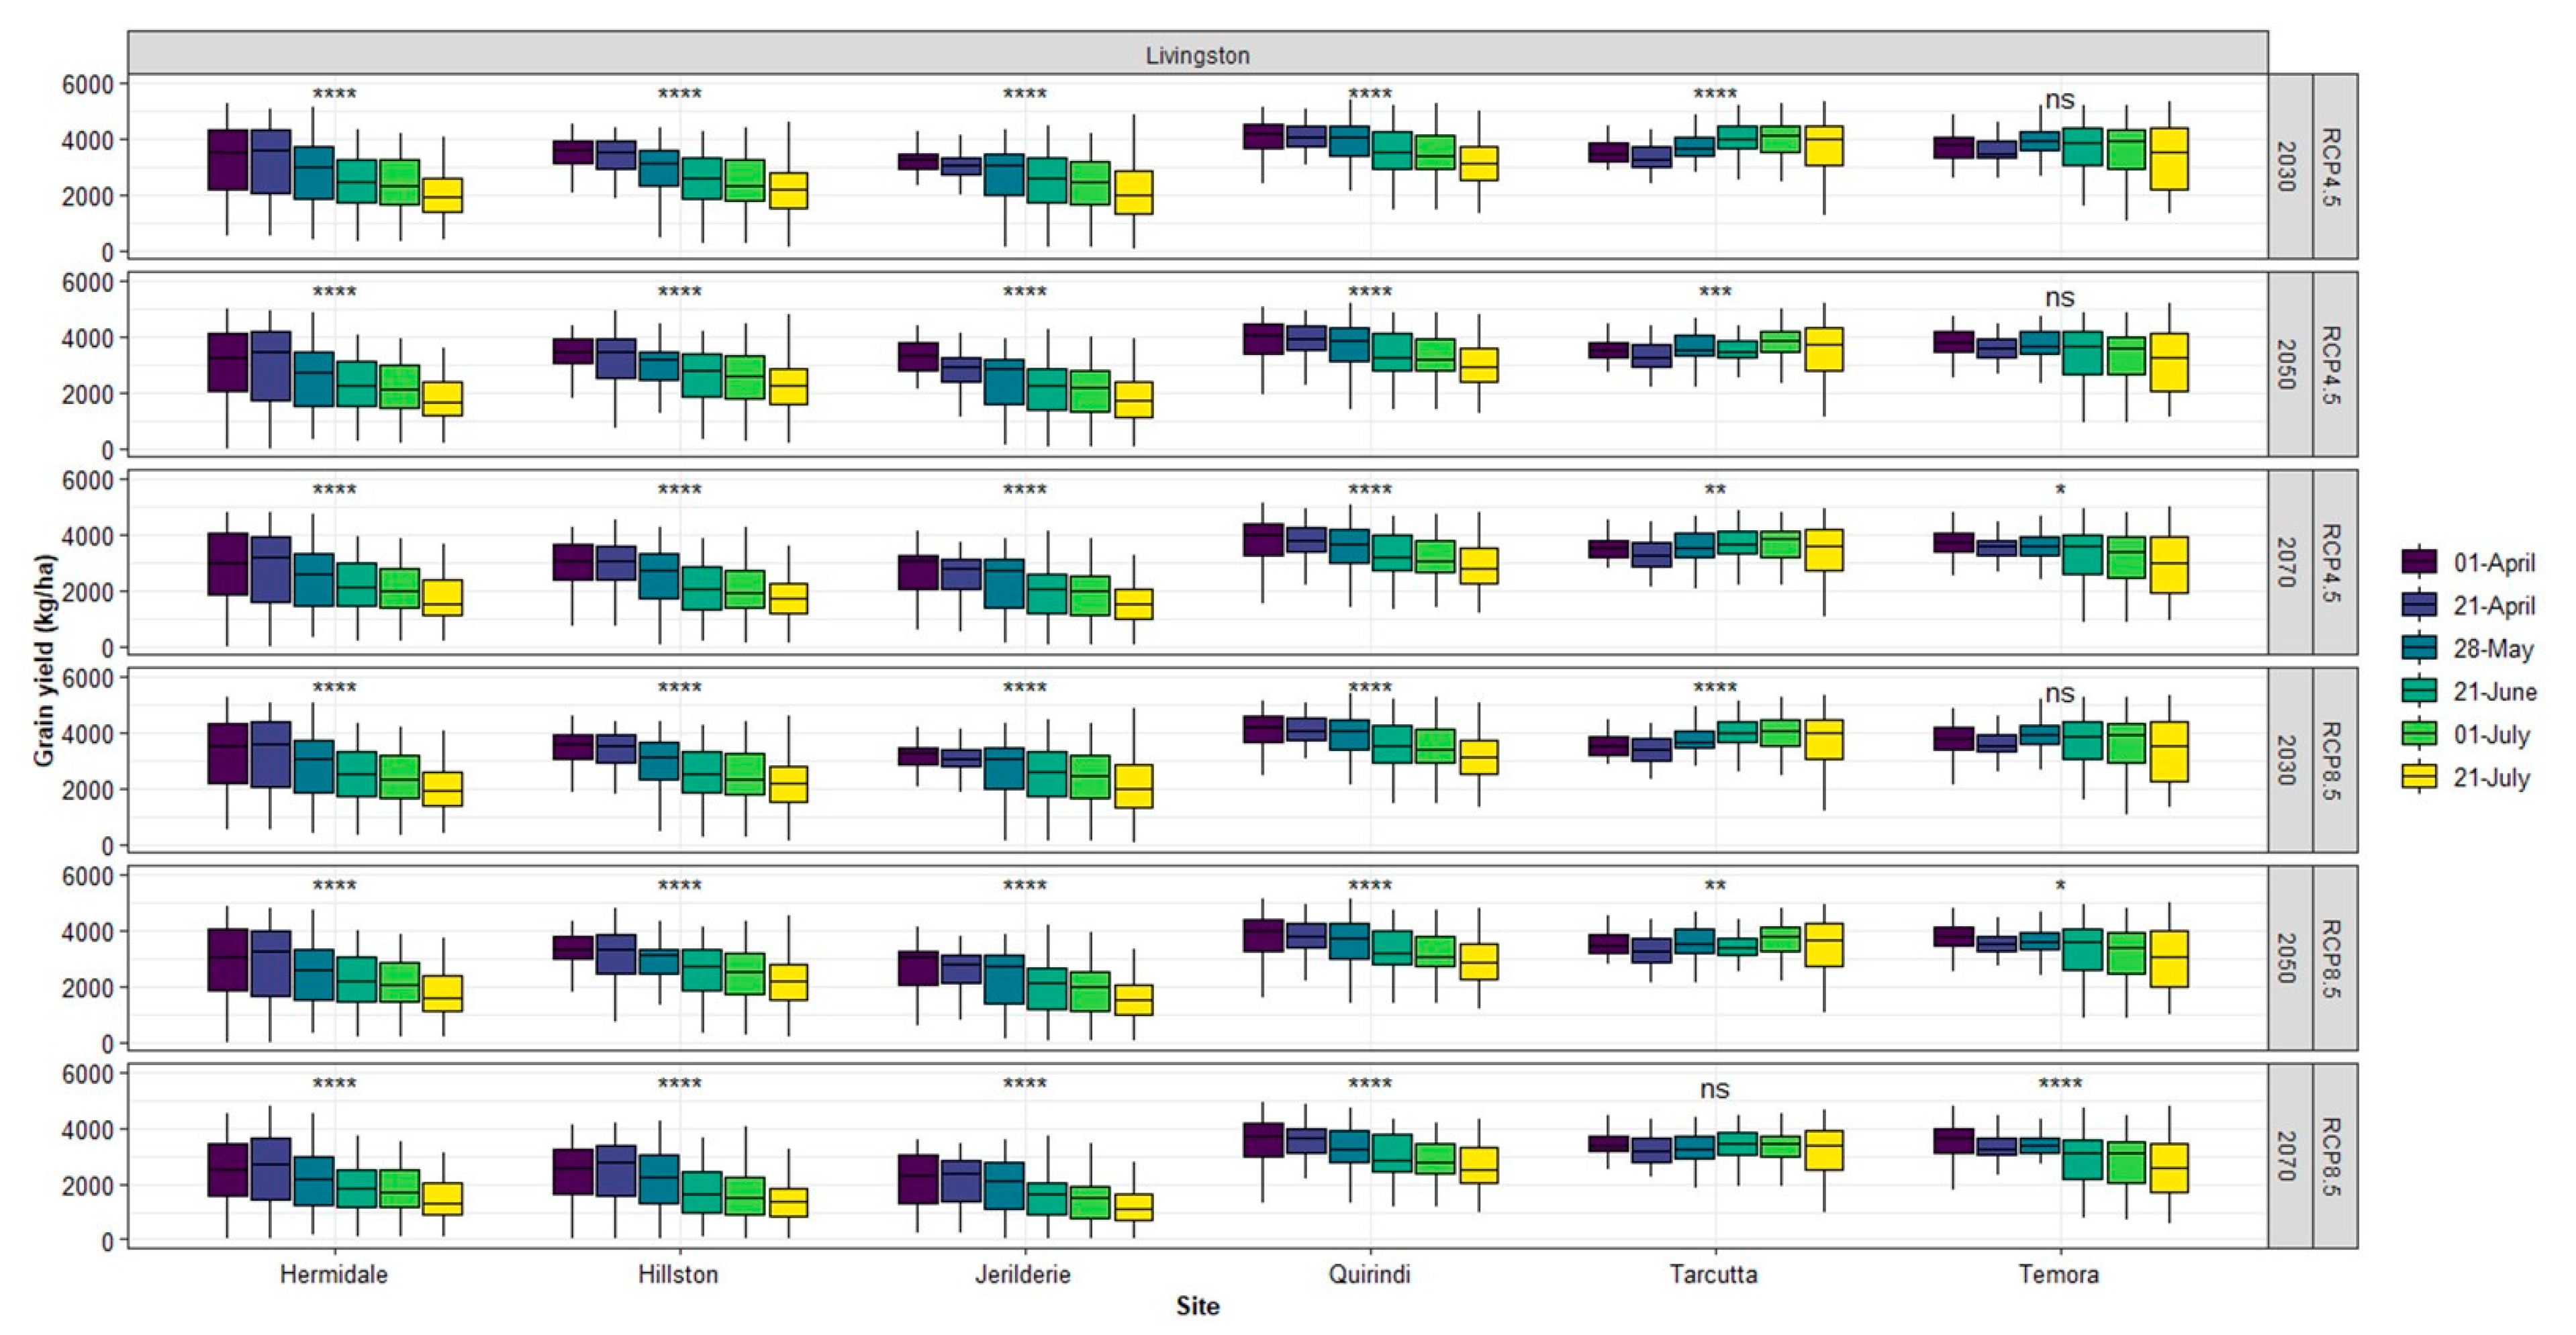
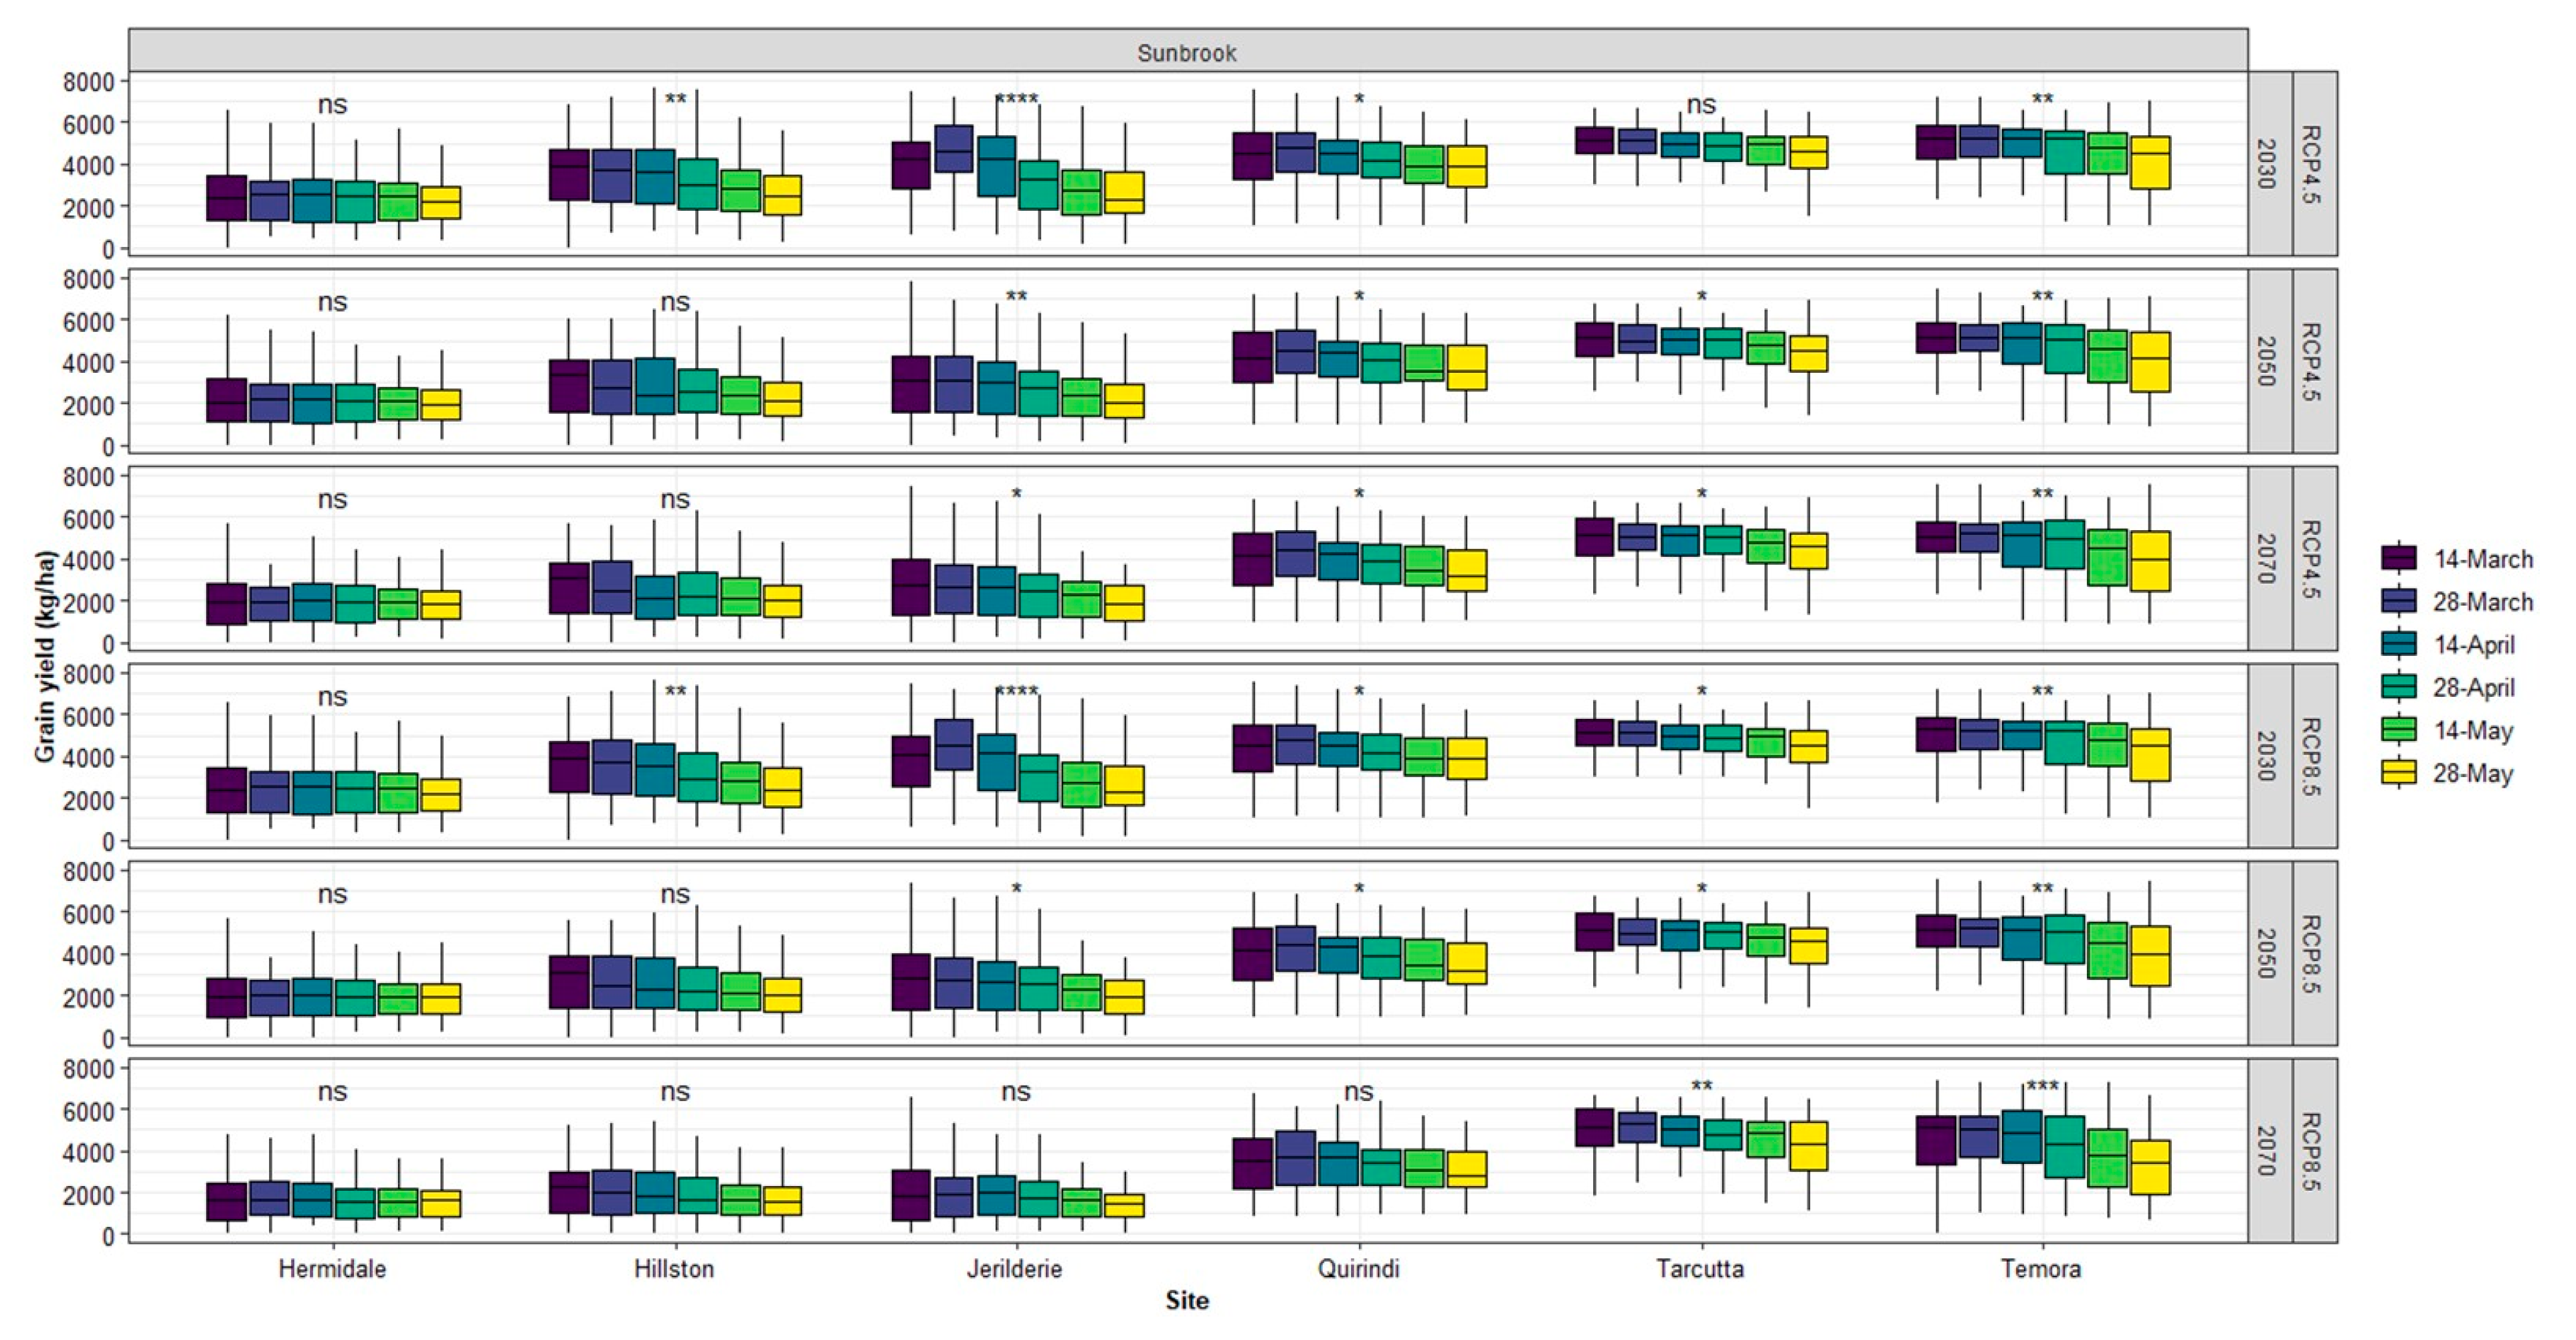
The yield of two wheat cultivars under two emission scenarios, three projection periods, and different sowing dates is shown in Figure 9 and Figure 10, respectively. The wheat yield would decrease in all the three projection periods and at all the sites except at Tarcutta. The long-season cultivar would have a low yield in the low-rainfall sites, while it performed well in the high-rainfall sites. Since it is the winter crop growing season (April to October) rainfall, not the total annual rainfall, that determines the yield. Hermidale would have a lower yield than Jerilderie, although it has a higher annual rainfall (Figure 2). The same is true for Quirindi and Tarcutta. In the future climate, the yield loss in the three low-rainfall environments (Hermidale, Hillston and Jerilderie) would be significantly higher than that of the high-rainfall environments (Quirindi, Tarcutta and Temora). The yield at Tarcutta would be the highest due to its relatively higher winter rainfall and temperate climate. The average yield and yield loss of the two cultivars was Livingston: baseline (3796 kg/ha), 2030 (3451 kg/ha, 9% less), 2050 (3145 kg/ha, 17% less), 2070 (2862 kg/ha, 25% less) and Sunbrook: baseline (4625 kg/ha), 2030 (4199 kg/ha, 9% less), 2050 (3806 kg/ha, 18% less), 2070 (3540 kg/ha, 24% less). The average yield of the cultivars, sites, and climate change scenarios in the baseline period, 2030, 2050 and 2070 projection periods would be 3836 kg/ha, 3496 kg/ha, 3221 kg/ha and 2953 kg/ha, respectively. These correspond to a reduction of 9%, 16% and 23%, respectively. In 2030, the yield decrease would be 8.7% and 9%, under RCP4.5 and RCP8.5, respectively. The respective yield decrease values would be 14.5% and 17.6% in 2050 and 18.6% and 27.4% in 2070. In 2030-RCP4.5 and 2030-RCP8.5, Livingston yield would decrease by 8.4% and 9.0%, respectively. The yield decrease in 2050-RCP4.5, 2050-RCP8.5, 2070-RCP4.5 and 2070-RCP8.5 would be 12.7%, 15.7%, 17.4% and 26.1%, respectively. For Sunbrook, these values would be 8.5%, 9.3%, 16%, 19%, 19.6% and 28.4%, respectively. Except for the long-season cultivar in the lowest incrop-rainfall site (Hermidale), early sowing would result in greater yield.
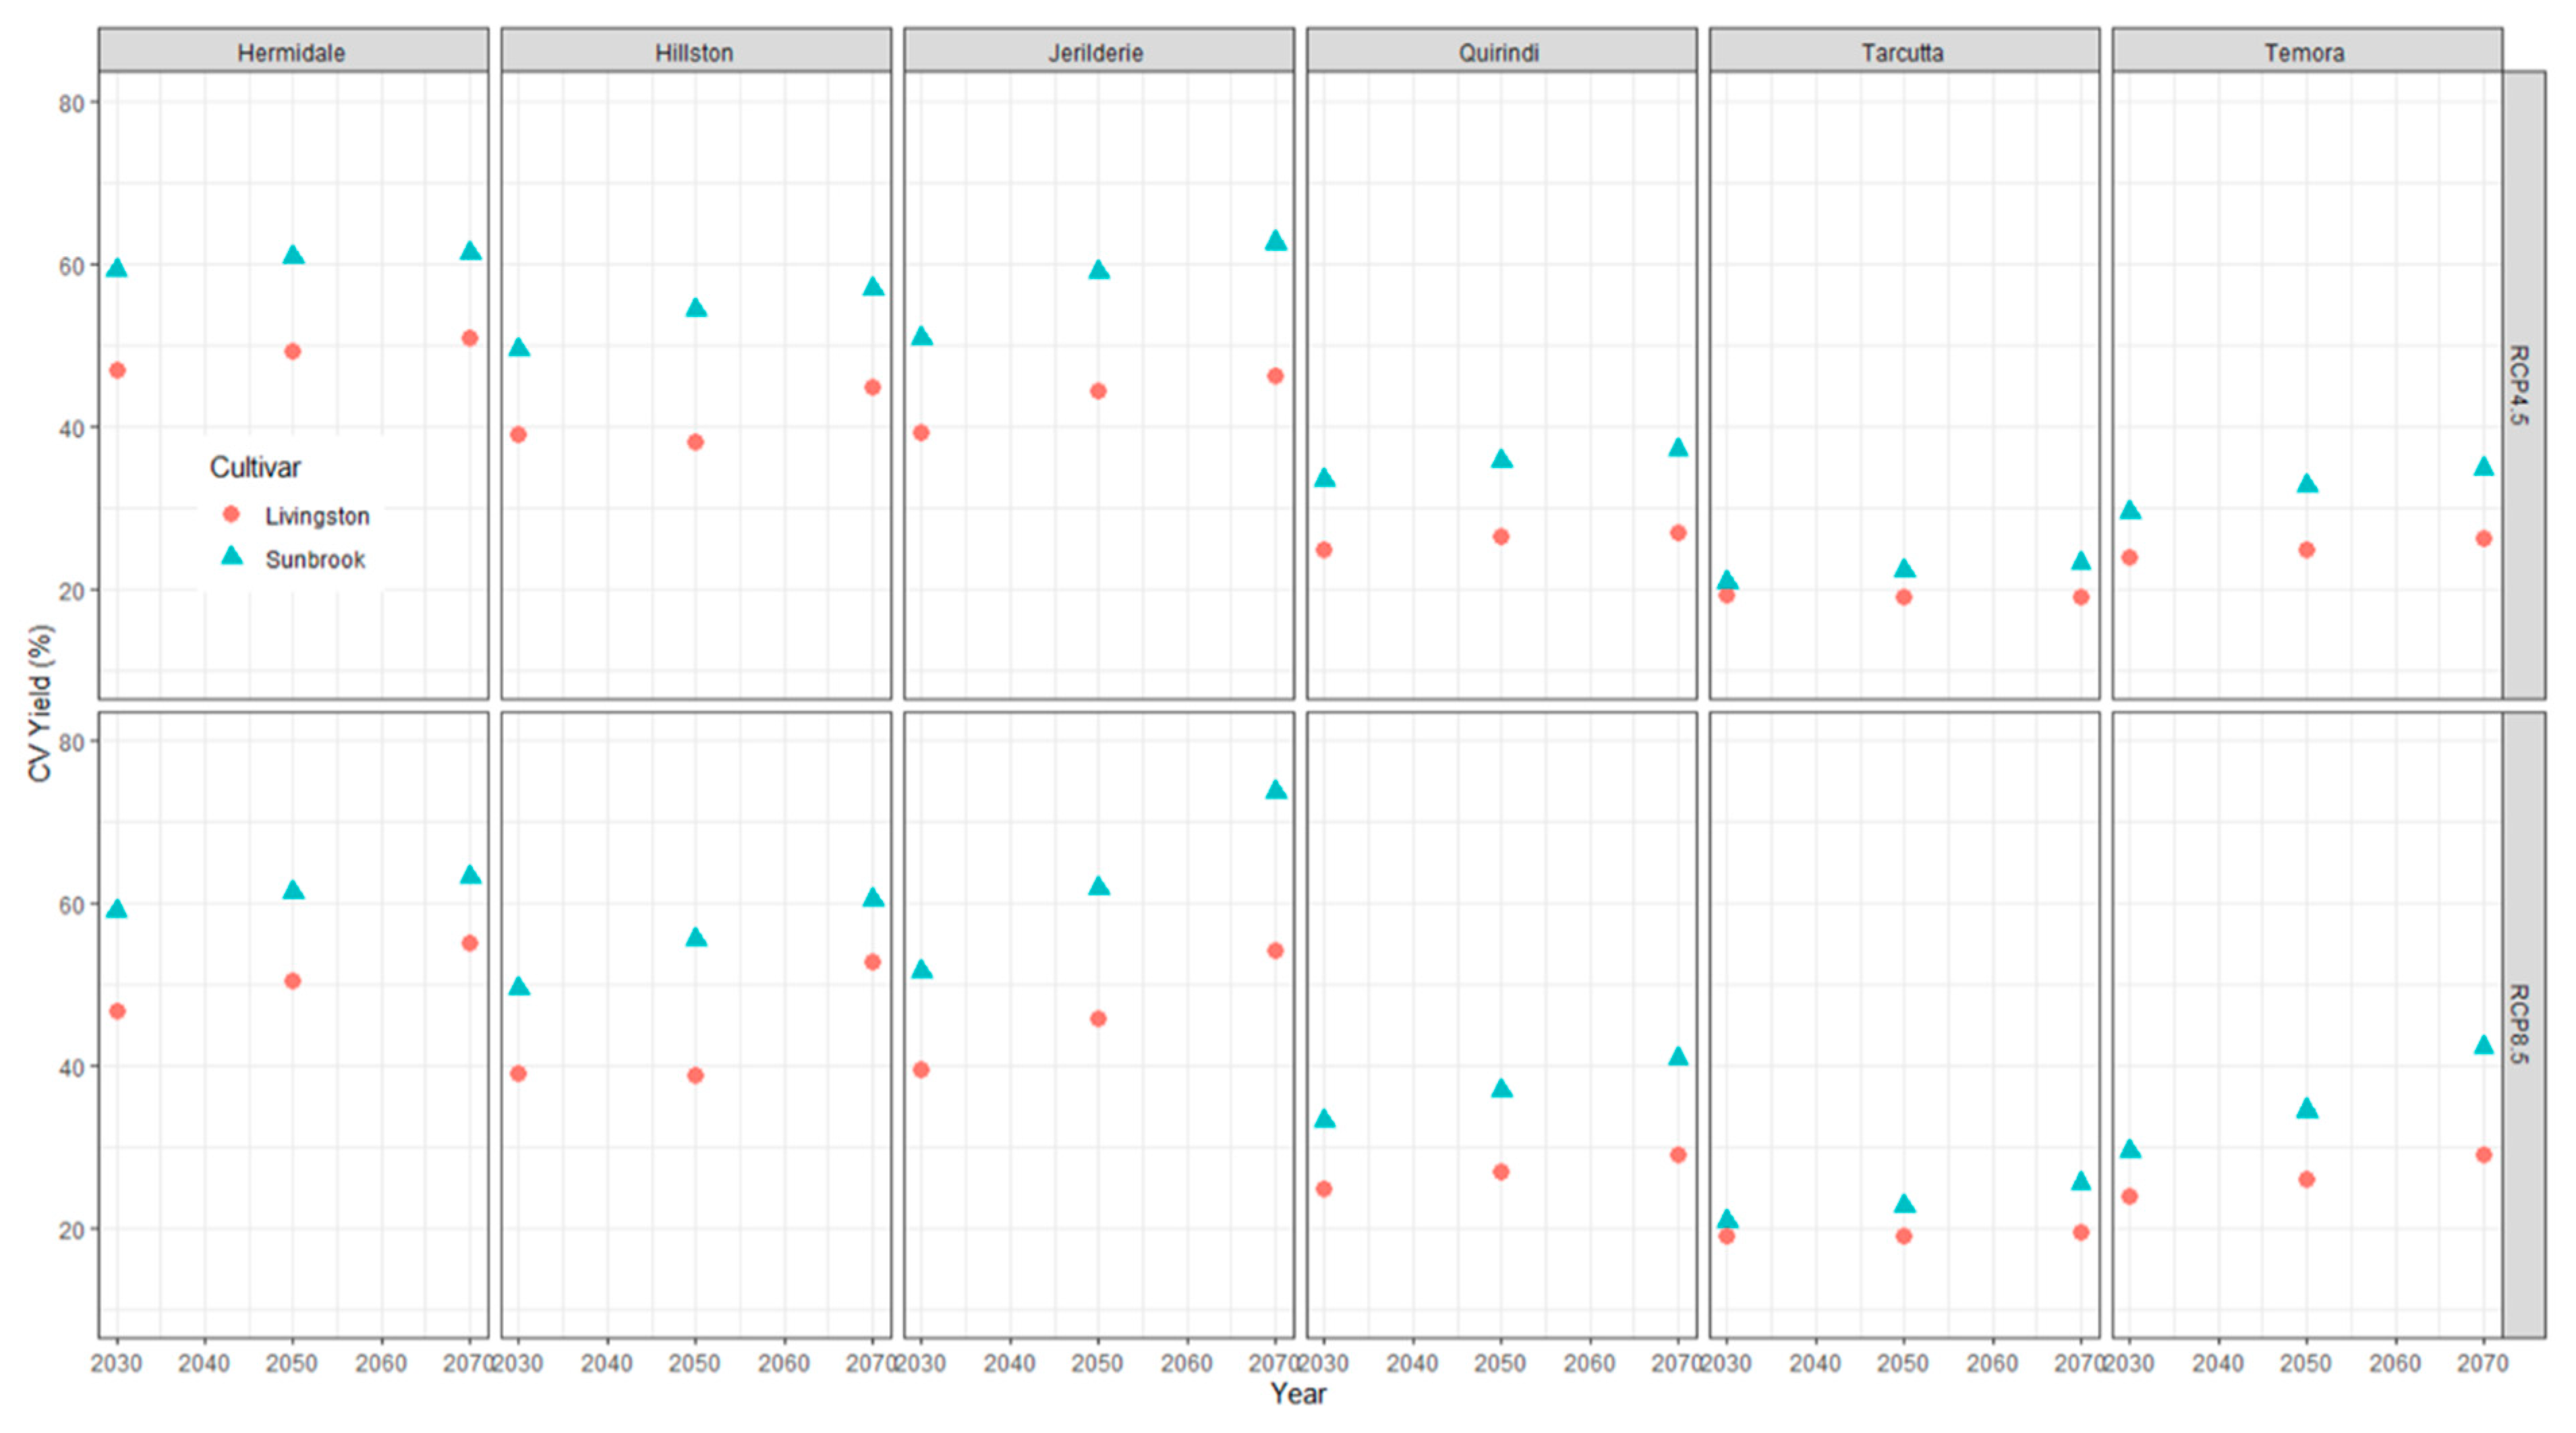
The coefficient of variation of the grain yield for the six locations, three projection periods and the two emission scenarios is shown in Figure 11. It shows how a crop production system can adapt to different environmental changes; high CV shows high inter-annual variability. The coefficient of variation would be higher for the long-season cultivar, higher emission scenario and medium and distant projection periods. Relative to the baseline period, the coefficient of variation of yield under the intermediate emission scenario RCP4.5 would increase as follows: Hermidale by 12%, 17% and 19% in 2030, 2050 and 2070, respectively; Hillston by 15%, 18% and 30% in 2030, 2050 and 2070, respectively; Jerilderie by 19%, 29% and 36% in 2030, 2050 and 2070, respectively; Quirindi by 10%, 17% and 20% in 2030, 2050 and 2070, respectively; Tarcutta by 12%, 22% and 25% in 2030, 2050 and 2070, respectively; and Temora by 16%, 27% and 35% in 2030, 2050 and 2070, respectively.
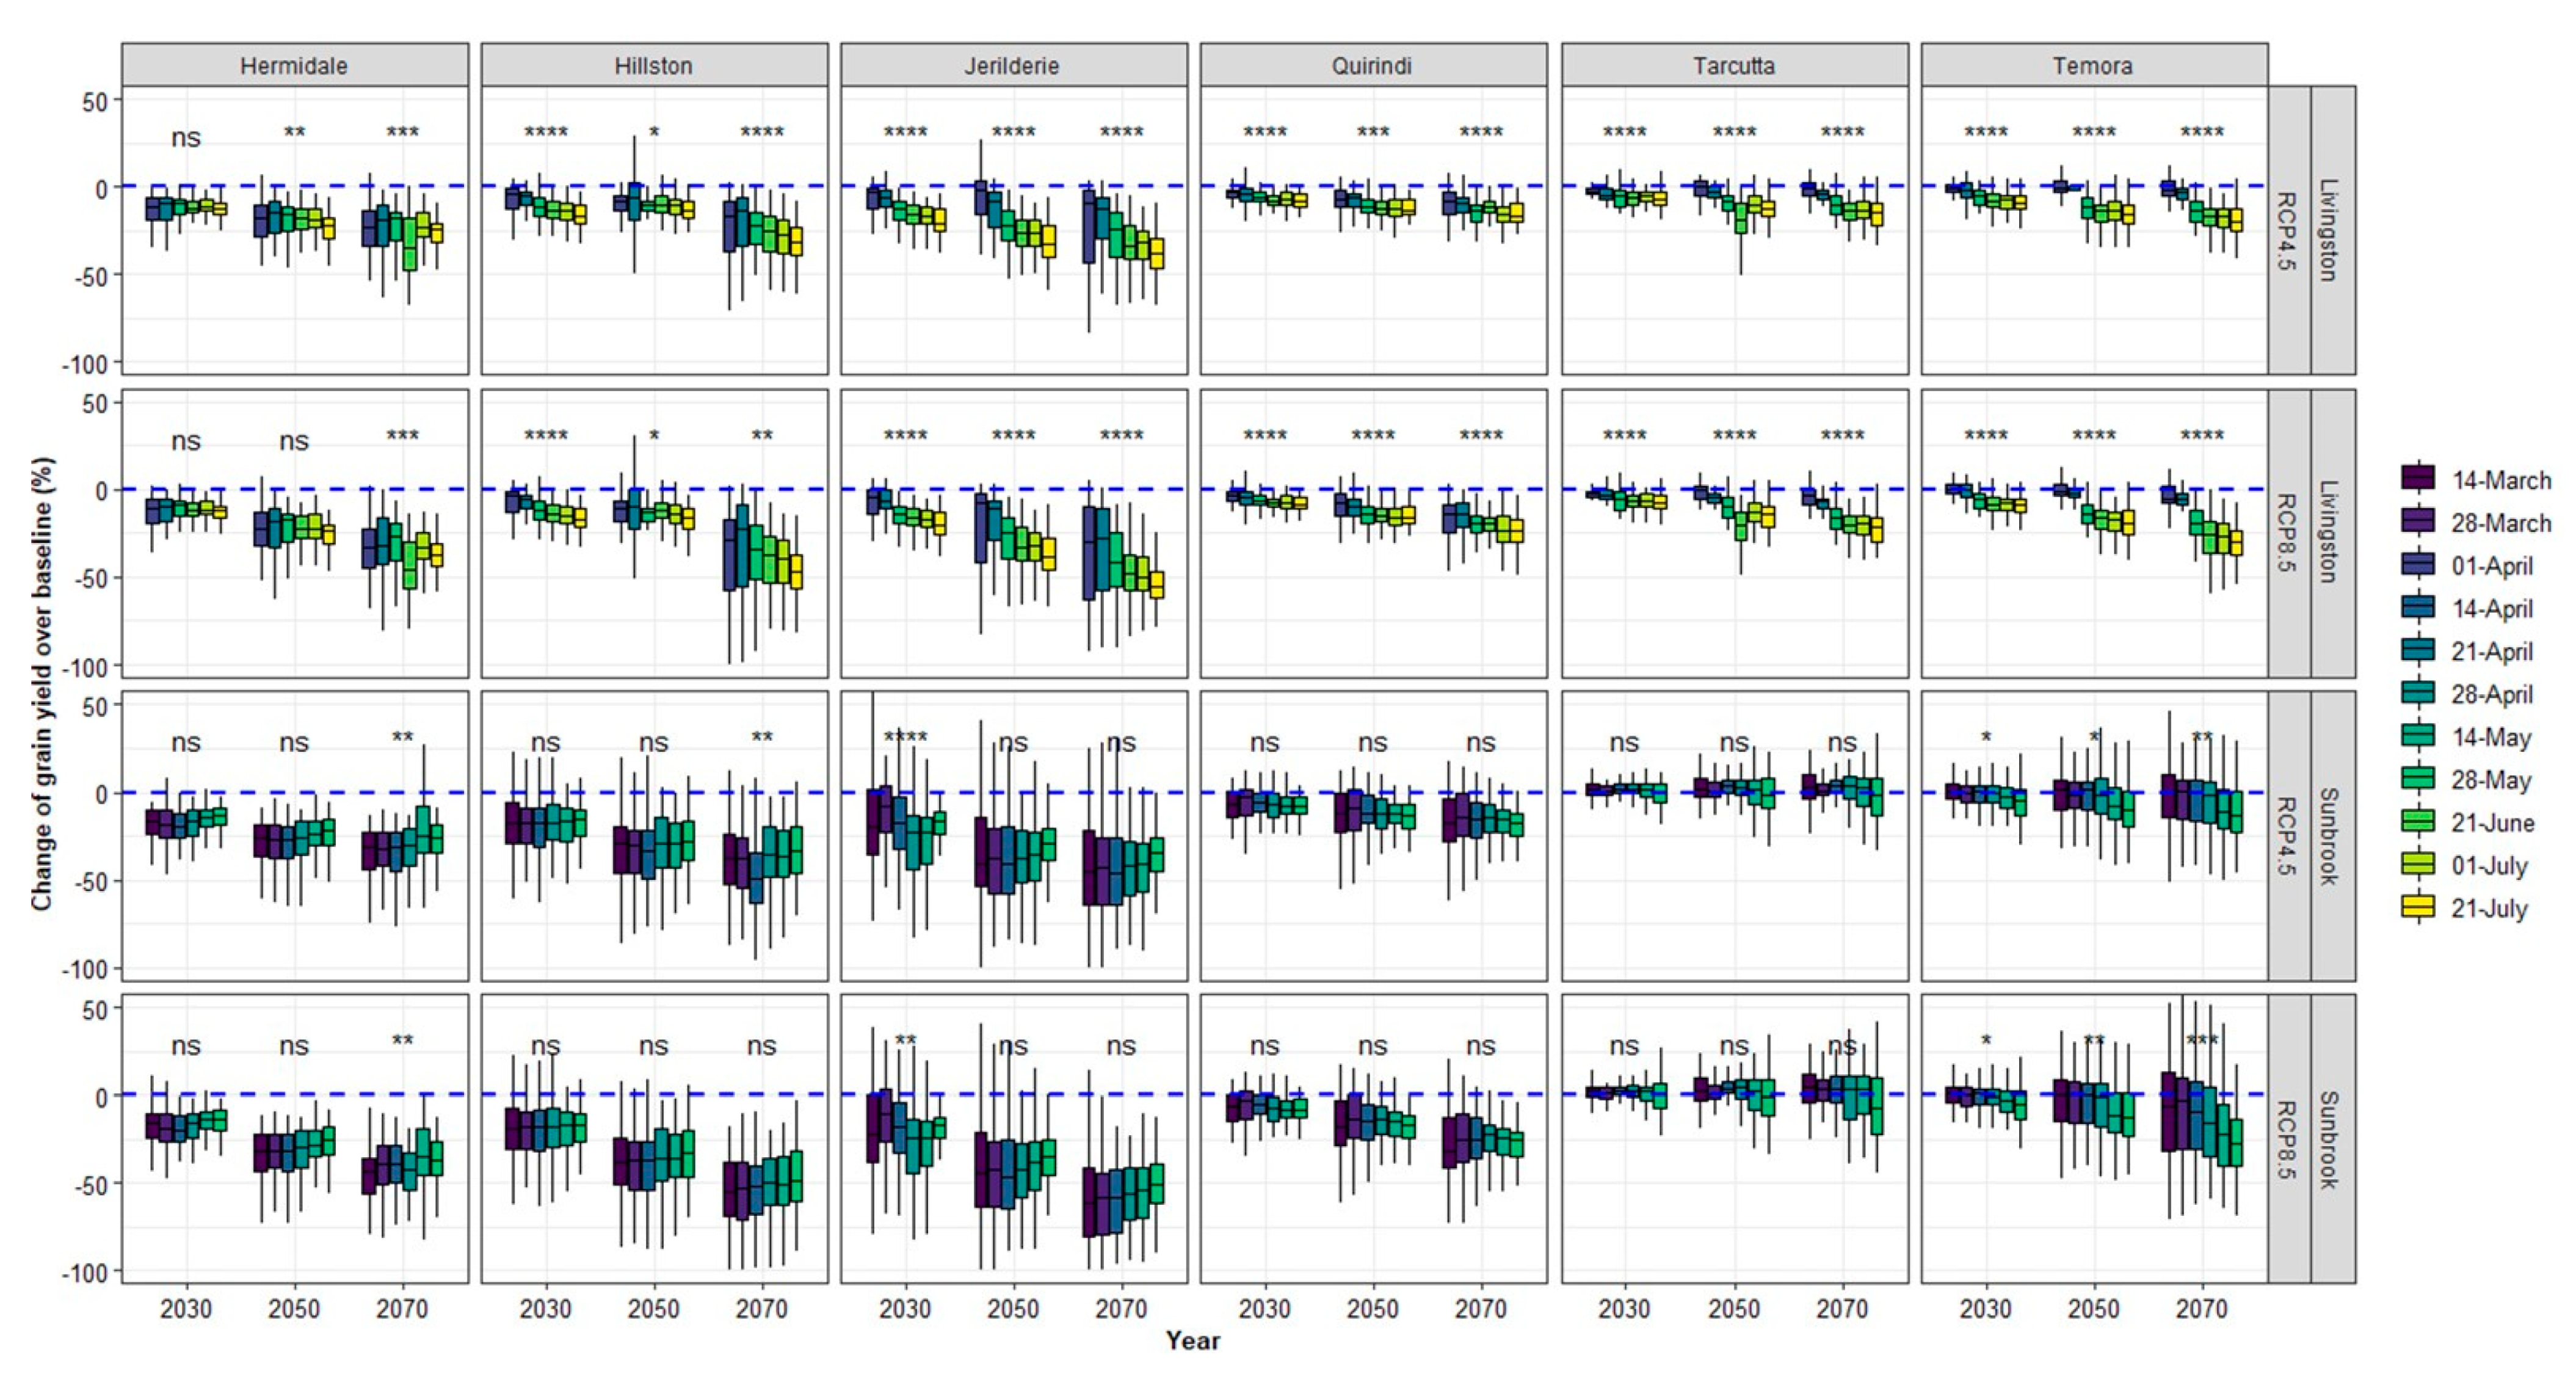
The change in grain yield, relative to the baseline, for different sowing dates in the projected periods, is shown in Figure 12. The potential sowing period used for the simulation was April-July for Livingston and March-May for Sunbrook. At Hermidale, under the intermediate emission scenario RCP4.5, the average grain yield over the sowing window considered in this study is projected to decrease by 13%, 21% and 26% for Livingston and 18%, 27% and 30% for Sunbrook in 2030, 2050 and 2070, respectively. In 2030, the yield of Sunbrook sown in the 2nd week of March would decrease by 13%, and when sown in the 2nd week of May, the yield would decrease by 16%. In 2050 and 2070, irrespective of the sowing date, the yield loss would be high, 27% and 30% in 2050 and 2070, respectively.
At Hillston, in the future climate, early sowing at Livingston would result in less yield loss. In the intermediate scenario RCP4.5, the yield loss for Livingston sown in the 1st week of April vs. the 1st week of July would be 9 vs. 15% (2030) and 21 vs. 29% (2070). For Sunbrook, irrespective of the sowing dates, the yield loss would be high; yield loss of 19%, 31%, 37% in 2030, 2050, and 2070, respectively. At Jerilderee, for RCP4.5 in 2030, early sowing of Livingston results in only 8% yield loss when sown in the first week of April and 18% when sown in the first week of July. In 2050, these values would be 9% and 27%, respectively. Irrespective of the sowing date, Sunbrook yield loss would be high, with an average yield loss of 20%, 35% and 40% in 2030, 2050 and 2070, respectively. At Quirindi, for RCP4.5, early sowing at Livingston had lower yield loss compared to the late sowing: 5 vs. 8% in 2030, 9 vs. 12% in 2050, 11 vs. 15% in 2070. For Sunbrook, the sowing date would not have a significant effect, with the average yield decrease of 7%, 12% and 16% in 2030, 2050 and 2070, respectively. At Tarcutta, under the RCP4.5 scenario in 2030, Livingston yield decreases would be 2% when sown in the 1st week of April and 6% when sown in the 1st week of July. In 2050, the yield loss would be 1% when sown in the 1st week of April and 11% when sown in the 1st week of July. In 2070, the yield loss would be 2% when sown in the 1st week of April and 13% when sown in the 1st week of July. At Temora, in 2030-RCP4.5 for Livingston sown in the 1st week of April vs. 1st week of July, yield decrease would be 2 vs. 8% in 2030, 2 vs. 15% in 2050 and 3 vs. 19% in 2070. For Sunbrook sown in the 2nd week March vs. 4th week May, the yield decrease would be 0 vs. 5% in 2030, 1 vs. 9% in 2050 and 3 vs. 12% in 2070.
4. Discussion
4.1. Climate Change Projections and Impacts
There is a significant projected increase in air temperature, decrease in rainfall and increase in rainfall variability during the wheat growing season in eastern and south-eastern Australia. Under the intermediate emission scenario RCP4.5, the increase in mean temperature during the wheat growing season would be 0.79 °C, 1.43 °C and 1.98 °C in 2030, 2050 and 2070, respectively, and the decrease in rainfall would be 9%, 15% and 19%, respectively. These projections are in the ranges of values reported in other studies in the region. In NSW, [27,28] projected mean annual increases in temperature of 0.6 to 1.5 °C in 2030 and 2.2 to 2.5 °C in 2070 and annual rainfall decrease of 2.5 to 10% by 2030. Rainfall reduction of 9%, 16% and 26% were reported in 2030, 2060 and 2090 [8]; 3 to 10% reduction in rainfall in 2030 and 20% in 2070 [29]; winter and spring rainfall in NSW would decrease by 5 to 15 % in 2030 [30]. These changes in temperature and rainfall would have substantial effects on crop phenology and yield. The increased temperature would shorten the phenological stages, reducing the available time for light interception and carbon assimilation, leading to yield reduction under climate change [31]. High temperature accelerates crop growth and development, resulting in a short growing season [32]. The crop would have less nutrient uptake, less radiation interception, lower biomass production, and lower yield, assuming the harvest index would not change [33]. On average, the days to maturity would decrease by 12, 22 and 30 days in 2030, 2050 and 2070, respectively, and the days to flowering would decrease by 6, 9 and 12 days, respectively. The advancement of crop phenology increases progressively from drier to wetter sites. Anwar et al. [8] reported that the days to flowering of wheat would be shorter by 10, 18 and 29 days in 2030, 2060 and 2090, respectively, which was attributed to the projected temperature increases and rainfall changes. A shorter crop-growing period, particularly the grain-filling period, would be one of the major causes of yield loss in the future climate [33]. The significant impact of temperature increase due to climate change is not limited to specific crops and regions. Wang et al. [10] projected a 10 to 30 days shorter grain-filling phase and a decrease in maize yield. This is due to a positive correlation between the length of photosynthetic activity and the length of the grain-filling phase and grain yield [21]. Similarly, for maize in the USA, shortening of days to flowering by 17 days and yield loss by 13% was reported if temperature increases by 2 °C [34]. From six locations in NSW, Yang et al. [35] projected +3.4 to –14.7% change in wheat yield by 2030 as a result of shorter growth duration in which flowering and maturing time were reduced by 11 and 12 days, respectively. Yang et al. [36] also reported that for wheat in southern Portugal, under both RCPs, yield loss in 2030 would be 14% and in 2070 it would be 17% under RCP4.5 and 27% under RCP8.5 scenarios. A modelling study of the wheat belt of Australia has shown that increase in temperature of 2 °C could cause a yield reduction of up to 50% [37]. Anwar et al. [8] reported a percentage grain yield change of 0.50% for each percentage change in wetter sites compared to 0.90% grain yield changes in drier sites. Generally, warmer temperatures under climate change would shorten the development stages of crops and reduce crop yield since temperature determines the rate of plant growth and development.
4.2. Adaptation Strategies
The challenge to produce enough food and fibre for the fast-growing world population will be higher under the changing climate unless the farming system makes adaptation strategies and/or new technological breakthroughs are achieved. Since rainfed wheat production is vital for food security, adapting this cropping system to a drier and warmer future climatic condition is an important measure in the water-limited dryland farming system [38]. In the future climate, wheat would have a shorter time to flowering and to maturity. The suitability of short-season and long-season cultivars for low and high-rainfall environments differ. Therefore, adjusting sowing time and choosing the appropriate cultivar could be considered two of the agronomic approaches which can be used to minimise the impact of climate change on wheat yield. Short-season cultivars would be suitable for drier environments and long-season cultivars for high-rainfall environments. In the south-eastern NSW sites selected for this study, the wheat yield is expected to decrease in almost all sites, time of sowing, and cultivar combinations except for one site, Tarcutta, which has the highest growing season rainfall. An early sown short-season cultivar is the best choice for low winter-rainfall environments of Hermidale, Hillston and Jerilderie. Both short and long-season cultivars would be suitable for high rainfall environments of Quirindi, Tarcutta and Temora, although a long-season cultivar is a better choice. However, except at Tarcutta, none of the sowing dates offset the negative impacts of climate change on wheat yield. The yield reduction in the changing climate is related to the reduction in the phenological phases of flowering and maturity. Manipulating sowing time and variety so that the pre and post-anthesis periods coincide with non-moisture and heat stress periods is important to increase grain yield [39]. Unlike Sunbrook, which is a late flowering/maturing cultivar, Livingston is an early flowering/maturing cultivar, which is suitable for later sowing, especially under water-limited environments such as Hermidale, Hillston and Jerilderie, where a decrease in growing season rainfall was projected.
In the future climate, compared to the current sowing time, early sowing can result in less yield loss and can be considered as a mitigation strategy for the impacts of climate change. Earlier sowing results in higher yield due to less reduction in phenophases and use of a longer-season cultivar could minimise some of the negative effects of future climate change on wheat yield. In the future climate, short growing season wheat cultivars are viable for low-rainfall areas, such as Hillston and Jerilderie. For high rainfall areas, such as Tarcutta and Temora, both short and long season varieties are suitable. However, the use of long-season wheat varieties will be a suitable adaptation strategy for mitigating the impact of changing climate on wheat yield in high rainfall sites such as Tarcutta and Temora. Therefore, changing the sowing date can be used as one of the adaptations to minimise the negative impacts of climate change on wheat yield. Although the yield loss can be reduced using the right cultivar and early sowing, the yield loss is not reversed. This shows that other on-farm adaptation options such as crop breeding for the future climate and conservation farming with zero/minimum tillage, which increases water-use efficiency, are needed to reverse the negative impact of future climate change. In south-eastern Australia, in order to sow early, management strategies that improve capture and storage of summer fallow rain (e.g., weed control, stubble retention and no-till farming) need to be implemented [40]. The risk of heat and drought stress occurring during reproductive growth stages can be obtained by shifting sowing dates. Appropriate cultivar choice (e.g., long-season cultivar) can compensate for the reduced growth duration resulting from warmer temperatures [41]. Early sown crops develop a deeper root system that can access sub-soil water, develop a bigger canopy that reduces evaporative losses from the soil and increase transpiration efficiency [42]. In a low-rainfall environment of Western Australia, Sprigg et al. [43] also simulated that short-season wheat cultivars would have a higher yield than long-season cultivars in the near future projection period 2030. The use of long-season varieties with larger thermal requirements to moderate the impacts of increased temperature due to climate change might result in yield loss due to water deficit later in the season [44].
5. Conclusions
Under a medium emission scenario, relative to the baseline, there would be an increase in the average temperature of 0.79 °C, 1.43 °C and 1.80 °C, in 2030, 2050 and 2070, respectively, and the rainfall would decrease by 9% in 2030, 15% in 2050 and 19% in 2070. Taking the average for all the sites and the two emission scenarios, the days to flowering would decrease by 5, 9 and 12 days in 2030, 2050 and 2070, respectively, while the days to maturity would decrease by 12 days, 22 days and 30 days, in 2030, 2050 and 2070, respectively. These would result in a grain yield reduction of 9%, 16% and 23%, respectively.
The projected climate change, with rising air temperatures and changes in rainfall patterns, will become a threat to world food production unless adaptation strategies are taken. In the relatively wetter regions of Quirindi, Tarcutta and Temora, early sowing of the slow maturing wheat cultivar would result in lower yield reduction in the future climate. However, in the drier sites of Hermidale, Hillston and Jerilderie, irrespective of the sowing dates, the slow maturing cultivar results in significant yield loss. In the future scenario of decreasing winter rainfall, sowing early into stored soil water from summer fallow rain, could alleviate the impacts of the decline in in-crop (April–May) rainfall. In order to use out-of-season rainfall, soil water conservation practices should be encouraged in future crop management as the in-season rainfall declines. This highlights the importance of properly managing summer season fallow land using stubble and/or weed control, so that rainfall infiltration and storage is increased during the summer period [45]. In high-rainfall areas, late-maturing cultivars are effective in minimising the negative impacts of high temperature on grain yield. Generally, early-sown long-duration wheat cultivars will be a suitable adaptation strategy to mitigate the impact of climate change on wheat yield. However, in both low-rainfall and high-rainfall areas, quick maturing cultivars would have lower relative yield reduction. As changing the planting date is region- and variety-specific, its effectiveness may vary from region to region. Different GCMs and emission pathways may also respond differently. As a result, to increase the certainty of the strategy of shifting the sowing date, it should be tested for each specific region using an ensemble average of multiple GCMs.
Funding
This research was funded by the Graham Centre for Agricultural Innovation (an alliance between Charles Sturt University and NSW Department of Primary Industries)–CAT-2018. The APC was funded by Charles Sturt University.
Institutional Review Board Statement
Not applicable.
Informed Consent Statement
Not applicable.
Data Availability Statement
Data obtained from third party are available from the references cited for each data set in the manuscript.
Acknowledgments
The Consistent Climate Scenarios (CCS) Data were obtained from the Queensland Government SILO database. The SILO database is operated by DSITI—Department of Science, Information Technology and Innovation. David Luckett is acknowledged for the help with some of the aspects of R programming.
Conflicts of Interest
The author declares no conflict of interest.
References
- Workman, D. Wheat Exports by Country. Available online: http://www.worldstopexports.com/wheat-exports-country/ (accessed on 2 April 2020).
- Zeleke, K.T.; Nendel, C. Analysis of options for increasing wheat (Triticum aestivum L.) yield in south-eastern Australia: The role of irrigation, cultivar choice and time of sowing. Agric. Water Manag. 2016, 166, 139–148. [Google Scholar] [CrossRef]
- Scanlon, T.T.; Doncon, G. Rain, rain, gone away: Decreased growing-season rainfall for the dryland cropping region of the south-west of Western Australia. Crop. Past Sci. 2020, 71, 128–133. [Google Scholar] [CrossRef]
- Ainsworth, E.A.; Long, S.P. What have we learned from 15 years of free-air CO2 enrichment (FACE)? A meta-analytic review of the responses of photosynthesis, canopy properties and plant production to rising CO2. New Phytologist. 2005, 165, 351–372. [Google Scholar] [CrossRef]
- Tubiello, F.N.; Rosenzweig, C.; Goldberg, R.A.; Jagtap, S.; Jones, J.W. Effects of climate change on US crop production: Simulation results using two different GCM scenarios. Part I: Wheat, potato, maize, and citrus. Clim. Res. 2002, 20, 259–270. [Google Scholar] [CrossRef] [Green Version]
- Easterling, W.; Aggarwal, P.; Batima, P.; Brander, K.; Erda, L.; Howden, M.; Kirilenko, A.; Morton, J.; Soussana, J.F.; Schmidhuber, S.; et al. Food, fibre and forest products. In Climate Change 2007: Impacts, Adaptation and Vulnerability. Contribution of Working Group II to the Fourth Assessment Report of the Intergovernmental Panel on Climate Change; Parry, M.L., Canziani, O.F., Palutikof, J.P., van der Linden, P.J., Hanson, C.E., Eds.; Cambridge University Press: Cambridge, UK, 2007; pp. 273–313. [Google Scholar]
- Luo, Q.Y.; Bellotti, W.; Williams, M.; Bryan, B. Potential impact of climate change on wheat yield in South Australia. Agric. For. Meteorol. 2005, 132, 273–285. [Google Scholar] [CrossRef]
- Anwar, M.R.; Liu, D.; Farquharson, R.; Macadam, I.; Abadi, A.; Finlayson, J.; Wang, B.; Ramilan, T. Climate change impacts on phenology and yields of five broadacre crops at four climatologically distinct locations in Australia. Agric. Syst. 2015, 132, 133–144. [Google Scholar] [CrossRef] [Green Version]
- Ludwig, F.; Asseng, S. Climate change impacts on wheat production in a Mediterranean environment in Western Australia. Agric. Syst. 2006, 90, 159–179. [Google Scholar] [CrossRef]
- Wang, M.; Li, Y.; Ye, W.; Bornman, J.F.; Yan, X. Effects of climate change on maize production, and potential adaptation measures: A case study in Jilin Province. China Clim Res. 2011, 46, 223–242. [Google Scholar] [CrossRef] [Green Version]
- Wang, Y.P.; Connor, D.J. Simulation of optimal development for spring wheat at two locations in southern Australia under present and changed climate conditions. Agric. For. Meteorol. 1996, 79, 9–28. [Google Scholar] [CrossRef]
- Zunfu, L.; Feifei, L.; Guoquan, L. Adjusting sowing date and cultivar shift improve maize adaption to climate change in China. Mitig. Adapt. Strateg. Glob. Chang. 2019, 25, 87–106. [Google Scholar] [CrossRef]
- van Ittersum, M.K.; Howden, S.M.; Asseng, S. Sensitivity of productivity and deep drainage of wheat cropping systems in a Mediterranean environment to changes in CO2 temperature and precipitation. Agric. Ecosyst. Environ. 2003, 97, 255–273. [Google Scholar] [CrossRef]
- Diaz-Nieto, J.; Wiby, R.L. A comparison of statistical downscaling and climate change factor methods: Impacts on low lows in the river Thames, United Kingdom. Clim. Chang. 2005, 69, 245–268. [Google Scholar] [CrossRef]
- Moss, R.H.; Edmonds, J.A.; Hibbard, K.A.; Manning, M.R.; Rose, S.K.; Carter, T.R.; Emori, S.; Kainuma, M.; Kram, T. The next generation of scenarios for climate change research and assessment. Nature 2010, 463, 747–756. [Google Scholar] [CrossRef]
- Holzworth, D.P.; Huth, N.I.; Devoil, P.G.; Zurcher, E.J.; Herrmann, N.I.; Mclean, G.; Chenu, K.; Van Oosterom, E.J.; Snow, V.; Murphy, C. APSIM—Evolution towards a new generation of agricultural systems simulation. Environ. Model. Softw. 2014, 62, 327–350. [Google Scholar] [CrossRef]
- World Bank. Turn Down the Heat: Climate Extremes, Regional Impacts, and the Case for Resilience; 1818 H Street NW.; World Bank: Washington, DC, USA, 2013; Available online: www.worldbank.org (accessed on 6 May 2020).
- Randall, D.A.; Wood, R.A.; Bony, S.; Colman, R.; Fichefet, T.; Fyfe, J.; Kattsov, V.; Pitman, A.; Shukla, J.; Srinivasan, J.; et al. Climate models and their evaluation. In Climate Change; Solomon, S., Qin, D., Manning, M., Chen, Z., Marquis, M., Averyt, K.B., Eds.; The Physical Science Basis. Contribution of Working Group I to the Fourth Assessment Report of the Intergovernmental Panel on Climate Change; Cambridge University Press: Cambridge, UK, 2007; pp. 589–662. [Google Scholar]
- Zhang, X.; Cai, X. Climate change impacts on global agricultural water deficit. Geophys. Res. Lett. 2013, 40, 1111–1117. [Google Scholar] [CrossRef]
- Laurent, R.; Cai, X. A maximum entropy method for combining AOGCMs for regional intra-year climate change assessment. Clim. Chang. 2007, 82, 411–435. [Google Scholar] [CrossRef]
- Sacks, W.J.; Kucharik, C.J. Trends in crop management and phenology in the U.S. corn belt, and impacts on yields, evapotranspiration, and energy balance. Agric. For. Meteorol. 2011, 151, 882–894. [Google Scholar] [CrossRef]
- Asseng, S.; Jamieson, P.D.; Kimball, B.; Pinter, P.; Sayre, K.; Bowden, J.W.; Howden, S.M. Simulated wheat growth affected by rising temperature, increased water deficit and elevated atmospheric CO2. Field Crop. Res. 2004, 85, 85–102. [Google Scholar] [CrossRef]
- Van Vuuren, D.P.; Edmonds, J.; Kainuma, M.; Riahi, K.; Thomson, A.; Hibbard, K.; Hurtt, G.C.; Kram, T.; Krey, V.; Lamarque, J.; et al. The representative concentration pathways: An overview. Clim. Chang. 2011, 109, 5–31. [Google Scholar] [CrossRef]
- DSITI-The State of Queensland. Consistent Climate Scenarios User Guide—Addendum 1: Incorporation of AR5 models and Linear Mixed Effect State Space (LMESS) projection method—Version 1.0; DSITI-The State of Queensland: Sunnybank Hills, Australia, 2016.
- R-Core-Team. R: A Language and Environment for Statistical Computing; R Foundation for Statistical Computing: Vienna, Austria, 2018; Available online: https://www.r-project.org/ (accessed on 25 May 2019).
- McKenzie, N.; Jacquier, D.; Simon, D. The Australian Soil Resource Information System—Technical Specifications, Version 11. Australian Collaborative Land Evaluation Program. 2004. Available online: www.asris.csiro.au (accessed on 15 June 2019).
- Cai, W.; Cowan, T. Dynamics of late autumn rainfall reduction over south-eastern Australia. Geophys. Res. Lett. 2008, 35, 1–5. [Google Scholar] [CrossRef]
- CSIRO; BoM. State of the Climate—2012. Available online: http://www.csiro.au/resources/ (accessed on 2 October 2019).
- Hennessy, K.J.; Whetton, P.H.; Preston. Climate projections. In Adapting Agriculture to Climate Change: Preparing Australian Agriculture, Forestry and Fisheries for the Future; Stokes, C., Howden, M., Eds.; CSIRO: Collingwood, Victoria, Australia, 2010; pp. 13–20. [Google Scholar]
- CSIRO; BoM. Climate change in Australia. In Technical Report; Pearce, K.B., Holper, P.N., Hopkins, M., Bouma, W.J., Whetton, P.H., Hensessy, K.J., Eds.; CSIRO: Canberra, Australia, 2007; p. 148. [Google Scholar]
- Parent, B.; Tardieu, F. Temperature responses of developmental processes have not been affected by breeding in different ecological areas for 17 crop species. New Phytol. 2012, 194, 760–774. [Google Scholar] [CrossRef] [PubMed]
- Juknys, R.; Velicka, R.; Kanapickas, A.; Kriauciuniene, Z.; Masilionyte, L.; Vaguseviciene, I.; Pupaliene, R.; Klepeckas, M.; Sujetoviene, G. Projecting the impact of climate change on phenology of winter wheat in northern Lithuania. Int. J. Biometeorol. 2017, 61, 1765–1775. [Google Scholar] [CrossRef]
- Tao, F.; Yokozawa, M.; Zhang, Z. Modelling the impacts of weather and climate variability on crop productivity over a large area: A new process-based model development, optimization, and uncertainties analysis. Agric. For. Meteorol. 2009, 149, 831–850. [Google Scholar] [CrossRef]
- Lobell, D.B.; Hammer, G.L.; McLean, G.; Messina, C.; Roberts, M.J.; Schlenker, W. The critical role of extreme heat for maize production in the United States. Nat. Clim. Chang. 2013, 3, 497–501. [Google Scholar] [CrossRef]
- Yang, Y.; Liu, D.L.; Anwar, M.R.; Zuo, H.; Yang, Y. Impact of future climate change on wheat production in relation to plant-available water capacity in a semiarid environment. Theor. Appl. Climatol. 2014, 115, 391–410. [Google Scholar] [CrossRef]
- Yang, C.; Fraga, H.; van Leperen, W.; Trindade, H.; Santos, J.A. Effects of climate change and adaptation options on winter wheat yield under rainfed Mediterranean conditions in southern Portugal. Clim. Chang. 2019, 154, 159–178. [Google Scholar] [CrossRef] [Green Version]
- Asseng, S.; Foster, I.; Turner, N.C. The impact of temperature variability on wheat yields. Glob. Chang. Biol. 2011, 17, 997–1012. [Google Scholar] [CrossRef]
- Nouri, M.; Homaee, M.; Bannaya, M.; Hoogenboom, G. Towards shifting planting date as an adaptation practice for rainfed wheat response to climate change. Agric. Water Manag. 2017, 186, 108–119. [Google Scholar] [CrossRef]
- Luo, Q.; Trethowan, R.; Tan, D.K.Y. Managing the risk of extreme climate events in Australian major wheat production systems. Int. J. Biometeorol. 2018, 62, 1685–1694. [Google Scholar] [CrossRef]
- Kirkegaard, J.A.; Hunt, J.R.; McBeath, T.M.; Lilley, J.M.; Moore, A.; Verburg, K.; Ronertson, K.; Oliver, Y.; Ward, W.R.; Milroy, S.; et al. Improving water productivity in the Australian Grains industry—a nationally coordinated approach. Crop. Past. Sci. 2014, 65, 583–601. [Google Scholar] [CrossRef]
- Challinor, A.J.; Watson, J.; Lobell, D.B.; Howden, S.M.; Smith, D.R.; Chhetri, N. A meta-analysis of crop yield under climate change and adaptation. Nat. Clim. Chang. 2014, 4, 287–291. [Google Scholar] [CrossRef]
- Zeleke, K.T. Effect of sowing time, sowing rate and soil water regime on yield, water productivity and soil water dynamics of faba bean (Vicia faba L.). In Proceedings of the 19th Australian Agronomy Conference, Wagga, Australia, 25–29 August 2019. [Google Scholar]
- Sprigg, H.; Belford, R.; Milroy, S.; Bennett, S.J.; Bowran, D. Adaptations for growing wheat in the drying climate of Western Australia. Crop. Past Sci. 2014, 65, 627–644. [Google Scholar] [CrossRef]
- Siebert, S.; Ewert, F. Spatio-temporal patterns of phenological development in Germany in relation to temperature and day length. Agric. For. Meteorol. 2014, 152, 44–57. [Google Scholar] [CrossRef]
- Zeleke, K.T. Fallow management increases soil water and nitrogen storage. Agric. Water Manag. 2017, 186, 12–20. [Google Scholar] [CrossRef]
Figure 1.
Study sites selected to evaluate the impact of climate change and adaptation strategies in New South Wales (NSW), Australia.
Figure 1.
Study sites selected to evaluate the impact of climate change and adaptation strategies in New South Wales (NSW), Australia.

Figure 2.
Rainfall distribution of the study sites: (a) annual rainfall, (b) monthly rainfall distribution, (c) and (d) proportions of rainfall in the winter crop growing months and the rest of the months in mm and percent, respectively (http://www.bom.gov.au/ accessed on 6 May 2020).
Figure 2.
Rainfall distribution of the study sites: (a) annual rainfall, (b) monthly rainfall distribution, (c) and (d) proportions of rainfall in the winter crop growing months and the rest of the months in mm and percent, respectively (http://www.bom.gov.au/ accessed on 6 May 2020).

Figure 3.
Pacific Indian Index and Global Warming clusters based on CMIP5 GCM models. The name of the four GCM composite models generated by averaging are circled and the composite used in this study (HP) is circled with solid line [24].
Figure 3.
Pacific Indian Index and Global Warming clusters based on CMIP5 GCM models. The name of the four GCM composite models generated by averaging are circled and the composite used in this study (HP) is circled with solid line [24].

Figure 4.
Percentage change in rainfall under two emission scenarios (RCP4.5 and RCP8.5) and three future climate projection periods at six wheat-producing sites in NSW, Australia. The level of difference between the two emission scenarios are shown (ns = no significant difference; * = significantly different at p < 0.05; **** = significantly different at p < 0.0001).

Figure 5.
Change in days to maturity (DTM) of two wheat cultivars under two emission scenarios (RCP4.5, RCP8.5) and three future climate projection periods (2030, 2050, 2070) at six wheat-producing sites of New South Wales in the Australian-grain belt.
Figure 5.
Change in days to maturity (DTM) of two wheat cultivars under two emission scenarios (RCP4.5, RCP8.5) and three future climate projection periods (2030, 2050, 2070) at six wheat-producing sites of New South Wales in the Australian-grain belt.

Figure 6.
Comparison of the DTM f under two emission scenarios, three projection periods, and six sites of NSW, Australia. The level of difference between the two emission scenarios is shown (ns = no significant difference; **** = significantly different at p < 0.0001).
Figure 6.
Comparison of the DTM f under two emission scenarios, three projection periods, and six sites of NSW, Australia. The level of difference between the two emission scenarios is shown (ns = no significant difference; **** = significantly different at p < 0.0001).

Figure 7.
The change in days to flowering (DTF) of two wheat cultivars under two emission scenarios (RCP4.5 and RCP8.5) and three future climate projection periods (2030, 2050, and 2070) at six wheat-producing sites of New South Wales in the Australian-grain belt.
Figure 7.
The change in days to flowering (DTF) of two wheat cultivars under two emission scenarios (RCP4.5 and RCP8.5) and three future climate projection periods (2030, 2050, and 2070) at six wheat-producing sites of New South Wales in the Australian-grain belt.

Figure 8.
Comparison of the DTF under two emission scenarios, three projection periods, and six sites of NSW, Australia. The level of difference between the two emission scenario is shown (ns = no significant difference; ** = significantly different at p < 0.01; **** = significantly different at p < 0.0001).

Figure 9.
Grain yield of a short-season wheat cultivar Livingston sown at different sowing dates at six contrasting wheat-producing sites under two emission scenarios and three projection periods in NSW, Australia. The level of difference between the two emission scenario is shown (ns = no significant difference; * = significantly different at p < 0.05; ** = significantly different at p < 0.01; **** = significantly different at p < 0.0001).

Figure 10.
Grain yield of a long-season wheat cultivar Sunbrook sown at different sowing dates at six wheat-producing sites under two emission scenarios and three projection periods in NSW, Australia. The level of difference between the two emission scenario is shown (ns = no significant difference; * = significantly different at p < 0.05; ** = significantly different at p < 0.01; **** = significantly different at p < 0.0001).

Figure 11.
The coefficient of variation grain yield of two wheat cultivars under two emission scenarios and three projection periods of the six wheat-producing sites in NSW, Australia.
Figure 11.
The coefficient of variation grain yield of two wheat cultivars under two emission scenarios and three projection periods of the six wheat-producing sites in NSW, Australia.

Figure 12.
The percentage change in grain yield of two wheat cultivars under two emission scenarios (RCP4.5 and RCP8.5) and three future climate projection periods at six wheat-producing sites in NSW, Australia. The level of difference between the two emission scenarios is shown. The level of difference between the two emission scenario is shown (ns = no significant difference; * = significantly different at p < 0.05; ** = significantly different at p < 0.01; *** = significantly different at p < 0.001;**** = significantly different at p < 0.0001).


Table 1.
Simulation design: study sites, climate scenarios at different projection periods, wheat cultivars and potential sowing dates.
Table 1.
Simulation design: study sites, climate scenarios at different projection periods, wheat cultivars and potential sowing dates.
| Sites | Climate Projects | Emission Scenarios | Wheat Cultivars | Sowing Dates | |
|---|---|---|---|---|---|
| Livingston | Sunbrook | ||||
| Hermidale | 2030 | RCP4.5 | Livingston | April Week 1 | March Week 2 |
| Hillston | 2050 | RCP8.5 | Sunbrook | April Week 4 | March Week 4 |
| Jerilderie | 2070 | May Week 3 | April Week 2 | ||
| Quirindi | June Week 3 | April Week 4 | |||
| Tarcutta | July Week 1 | May Week 2 | |||
| Temora | July Week 3 | May Week 4 | |||
Publisher’s Note: MDPI stays neutral with regard to jurisdictional claims in published maps and institutional affiliations. |
© 2021 by the author. Licensee MDPI, Basel, Switzerland. This article is an open access article distributed under the terms and conditions of the Creative Commons Attribution (CC BY) license (http://creativecommons.org/licenses/by/4.0/).
Share and Cite
MDPI and ACS Style
Zeleke, K. Simulating Agronomic Adaptation Strategies to Mitigate the Impacts of Climate Change on Wheat Yield in South-Eastern Australia. Agronomy 2021, 11, 337. https://doi.org/10.3390/agronomy11020337
AMA Style
Zeleke K. Simulating Agronomic Adaptation Strategies to Mitigate the Impacts of Climate Change on Wheat Yield in South-Eastern Australia. Agronomy. 2021; 11(2):337. https://doi.org/10.3390/agronomy11020337
Chicago/Turabian StyleZeleke, Ketema. 2021. "Simulating Agronomic Adaptation Strategies to Mitigate the Impacts of Climate Change on Wheat Yield in South-Eastern Australia" Agronomy 11, no. 2: 337. https://doi.org/10.3390/agronomy11020337
Note that from the first issue of 2016, this journal uses article numbers instead of page numbers. See further details here.