Article

Consensus Genetic Linkage Map Construction Based on One Common Parental Line for QTL Mapping in Wheat

1
Australia-China Joint Centre for Wheat Improvement, Agricultural Sciences, College of Science, Health, Engineering and Education, Murdoch University, 90 South Street, Murdoch, WA 6150, Australia
2
The Key Laboratory for Quality Improvement of Agricultural Products of Zhejiang Province, College of Agriculture and Food Science, Zhejiang A&F University, Linan, Hangzhou 311300, China
3
Institute of Food Science and Technology, Chinese Academy of Agricultural Sciences, Beijing 100193, China
4
Institute of Crop Science, College of Agriculture and Biotechnology, Zhejiang University, Hangzhou 310058, China
5
Institute of Food Crops, Nanjing Branch of Chinese National Center for Rice Improvement, Jiangsu Academy of Agricultural Sciences, Nanjing 210014, China
*
Author to whom correspondence should be addressed.
These authors contributed equally to the work.
Agronomy 2021, 11(2), 227; https://doi.org/10.3390/agronomy11020227
Submission received: 17 December 2020 / Revised: 21 January 2021 / Accepted: 22 January 2021 / Published: 26 January 2021
(This article belongs to the Special Issue Novel Breeding Technologies in Cereal Crops)

Abstract

:
The consensus map is used for the verification of marker order, quantitative trait locus (QTL) mapping and molecular marker-assisted selection (MAS) in wheat breeding. In this study, a wheat consensus genetic map named as Sp7A_G7A, was constructed using 5643 SNP markers in two double haploid (DH) populations of Spitfire × Bethlehem-7AS (Sp7A) and Gregory × Bethlehem-7AS (G7A), covering 4376.70 cM of 21 chromosomes (chr) with an average interval of 0.78 cM. The collinearity of the linkage maps with the consensus map of Con_map_Wang2014 and the physical map of wheat reference genome (IWGSC RefSeq v1.0) were analyzed based on the Spearman rank correlation coefficients. As results, the three constructed genetic maps of Sp7A, G7A and Sp7A_G7A showed high collinearity with the Con_map_Wang2014 and the physical map, and importantly, the collinearity level between our constructed maps and the wheat physical map is higher than that between the Con_map_Wang2014 and the physical map. The seed coat color QTL detected in both populations under multiple environments were on the region (745.73–760.14 Mbp) of the seed color gene R-B1/Tamyb10-B1 (TraesCS3B02G515900, 3B: 757,918,264–757,920,082 bp). The validated consensus map will be beneficial for QTL mapping, positional cloning, meta-QTL analysis and wheat breading.

1. Introduction

Common wheat (Triticum aestivum L.) (2n = 6x = 42, AABBDD) is an allohexaploid species derived from the hybridization of diploid Aegilops tauschii (2n = 2x =14, DD) and tetraploid wild emmer (2n = 4x =28, AABB) 10,000 years ago [1]; it is one of the four most important crops grown world-wide, supplying food for 35% of the world population [2]. Intense breeding activities for improving wheat varieties especially on yields over the past century have been carried out to meet the demand of the gradually increasing human population. Molecular markers have been widely used as an efficient tool for genetic analysis and positional cloning of plant species during the last three decades. Meanwhile, molecular marker-assisted (MAS) breeding has been increasingly used for the decreasing costs of marker assays and provided a faster and more efficient breeding strategy for a long-term breeding process [3,4,5,6,7]. QTL mapping and genome wide association study (GWAS) are major strategies to identify quantitative trait loci (QTL) underlying many important agronomic and economical traits [5,8,9,10,11].
Genetic linkage maps play an important role in genetic studies, including, but not limited to: QTL or gene mapping, MAS, positional cloning, epistasis dissection, physical and genetic map integration, and genome assembly [8,12,13,14]. With the development of different types of DNA markers and sequencing techniques, a great progress has been made in the linkage maps of common wheat, the markers from restriction fragment length polymorphisms (RFLP) [15], through random amplified polymorphic DNA (RAPD) markers [16], amplified fragment length polymorphisms (AFLPs) [17] and simple sequence repeats (SSRs) [18], to high-throughput marker systems including diversity array technology (DArT) [19,20], genotyping-by-sequencing (GBS) [21,22] and single nucleotide polymorphisms (SNPs) [23,24] were widely used in the construction of genetic map in wheat. Recently, with the development of microarray of markers and the reduction of sequencing cost, high-throughput SNP markers have been more and more widely used in the construction of wheat genetic map and QTL mapping. Zhai et al. [25] constructed a high-density genetic linkage map with 10,816 SNP and SSR markers for QTL analysis of spike morphological traits and plant height in winter wheat. Wen et al. [14] constructed a high-density SNP-based consensus map integrating genetic maps from four recombinant inbred line populations of wheat using 90K Infinium iSelect SNP assay, with 29,692 SNP markers covering 2906.86 cM. Liu et al. [26] constructed a high-density genetic map with a wheat 55 K SNP array, containing 12,109 SNP markers spanning 3021.04 cM across the 21 wheat chromosomes, which was highly consistent with the physical map and useful for QTL mapping.
QTL mapping with linkage map based on a single mapping population is often limited by the genetic background and a low level of polymorphism [27]. However, the consensus map, integrating genetic information of different populations, provides more polymorphic markers, higher marker density and greater genome coverage for mapping without the need for additional genotyping. Meanwhile, it is very useful for the verification of marker order, the correction of multiple alignment markers, and the identification of chromosomal rearrangements such as translocations, inversions, and duplications [14,28,29,30,31]. Several consensus maps were constructed and effectively used in QTL desertion, position cloning and MAS, including the maps based on SSR markers [32], and millions of SNP markers genotyped by high-throughput sequencing technology or SNP array like 55 K, 90 K, 660 K, and 820 K for wheat [14,21,28,29,30,31].
The wheat 90 K Infinium iSelect SNP array, a currently useful genotyping strategy for wheat, was widely used in wheat researches, including genetic diversity, QTL analysis, GWAS, and MAS breeding [10,11,14,24,33,34]. In this study, Sp7A and G7A, derived from the crosses of Spitfire × Bethlehem-7AS and Gregory × Bethlehem-7AS respectively, shared one common parent (Bethlehem-7AS), which were genotyped using 12 K Targeted Genotyping-By-Sequencing (tGBS) and 90 K Infinium iSelect SNP array, respectively. A high-density consensus map was constructed using two DH populations to validate the chromosomal locations of mapped SNPs, and to increase the marker density in the map as a reference resource for genetic studies, QTL mapping and MAS breeding. In addition, in order to validate the effectiveness of consensus map in this study, the quality of the linkage map, and the detected QTLs for seed coat color parameters in wheat were evaluated. The present high-density consensus map will be helpful in QTL mapping and position cloning for important traits and MAS in wheat breeding.

2. Materials and Methods

2.1. Plant Material and Field Trials

Two DH populations derived from the crosses Spitfire × Bethlehem-7AS (191 lines) and Gregory × Bethlehem-7AS (218 lines) were used in the construction of linkage maps and consensus map. Spitfire is a medium yield variety with high grain protein content and nitrogen use efficiency (NUE), while Gregory produces high grain yield with low protein content [35]. Bethlehem-7AS is the 7AS chromosome arm substitution line (CASL) of Bethlehem (wild emmer), which is one of Israeli common cultivar with high protein content and good yield [36].
Based on the seed availability, in 2017, 120 lines of G7A DH population, in a completely randomized design with two repeats were planted in Wongan Hills (G7A_W) and Manjimup (Sp7A_M) of Western Australia while 112 lines of Sp7A in Wongan Hills (Sp7A_W), Katanning (Sp7A_K) and a glasshouse (Sp7A_GH, One replicate) at Murdoch University. Local practices of cultivation approaches were followed. In the glasshouse experiment, fertilizers were mixed with the potting mix soil before sowing [37], the pots were arranged based on a randomized complete block design and were rotated once fortnight to avoid the influence of the pot position. The glasshouse temperature was controlled at 25 °C/11 °C (day/night). Each pot was watered to 70% field capacity daily with demineralized water. After harvesting, seeds for each DH line were collected for trait measurement.

2.2. DNA Extraction and Genotyping

DNA was extracted from a single plant of each DH line of Sp7A (191 lines) and G7A (218 lines) together with their parents according to a modified method of Zhou et al. [38]. The DNA concentration was measured by Nanodrop (Thermo Scientific, Waltham, MA, USA). The populations were genotyped using 12 K tGBS and 90 K wheat Infinium iSelect SNP arrays in Sp7A and G7A, respectively. SNP allele clustering and genotype calling were performed using the polyploid version of GenomeStudio software (Illumina, http://www.illumina.com). Genotype calling was performed using a default clustering algorithm as initially described in Wang et al. [24]. Genotyping data were corrected and filtered according to the following rules: SNP markers with low calling rate (<80%) were deleted together with distorted markers and double-cross markers. Afterwards, 2367 SNPs for the population of Sp7A and 3555 SNPs for the population of G7A were used to construct the single linkage maps, respectively. The physical positions of SNP markers were obtained by blasting the SNP-flanking sequences against the reference genome sequences of Chinese Spring released by the International Wheat Genome Sequencing Consortium (IWGSC RefSeq v1.0, http://www.wheatgenome.org/) with a filtering threshold of E-value < 1 × 10⁻¹⁰. For a specific marker with multiple physical positions, the position matching the linkage group of Wang et al. [24] and this study was chosen as the physical locations of the marker, which corrected the location information of the marker.

2.3. Construction the Single and Consensus Map

The QTL IciMapping V4.1 software [39] was used to group with LOD thresholds ≥ 3.0, then the SNP markers for the construction of individual linkage map for each population were ordered using “nnTwoOpt” algorithm. The consensus map of this study was constructed using MergeMap [40] to calculate the consensus marker orders of linkage groups according to the individual maps. Firstly, individual linkage maps were converted to acyclic graphs (DAGs) internally [41], and then, a consensus graph was merged on the basis of shared vertices, finally, each consensus DAG was simplified and linearized using a mean distance approximation to produce the final consensus map.

2.4. Map Validation

In order to confirm the marker order in the present consensus map, marker assignments to linkage group were compared with the corresponding positions in the consensus map constructed by Wang et al. [24] (Con_map_Wang2014) and the putative physical positions in the wheat genome reference (IWGSC RefSeq v1.0, http://www.wheatgenome.org/). The quality of the constructed individual linkage maps and consensus map were evaluated by the marker order consistency between our consensus map and Con_map_Wang2014, the collinearity between the linkage maps in this study and the wheat reference genome, the heat map and the uniform distribution of recombination fractions on the genome. The collinearity was evaluated by the Spearman rank correlation coefficient calculated by the R function cor.test. The heat maps of recombination fractions were constructed by the package “pheatmap” for R program (https://cran.r-project.org/web/packages/pheatmap/index.html).

2.5. Seeds Coat Color Parameters Measurement

Five hundred seeds of each DH line in the different replication for the three environments were used to measure the seeds coat color parameters L, a, and b with a SeedCount SC6000R analyser, a digital imaging systems specifically designed for the grain industry (Next Instruments, Ltd., Condell Park, NSW, Australia), using the Commission Internationale de l’Éclairage (CIE) L, a and b color system, respectively [42]. “L” designates the lightness of the sample (100 for white and 0 for black), “a” designates redness when positive or greenness when negative, and “b” designates yellowness when positive or blueness when negative. Each sample was scanned for three times, the mean values were used for statistical analysis and further analysis. Statistical analysis was carried out using SPSS 22.0 program (IBM SPSS Statistics, Chicago, IL, USA).

2.6. Inclusive Composite Interval Mapping of QTLs for Seeds Coat Color

QTL mapping was conducted to analyze the QTLs for seed coat color parameters using Inclusive Composite Interval Mapping (ICIM) [43] implemented by QTL IciMapping 4.1.0.0 (available at www.isbreeding.net). The walk speed for genome-wide scanning was set at 1 cM. The significant QTLs were calculated based on 1000 permutations at the 0.05 probability level at LOD threshold 3.

2.7. Common QTL across the Two DH Populations

Due to the differences in the two individual linkage maps, it was difficult to directly detect common QTLs across the two DH populations based on the QTL or marker position in each linkage map. Therefore, we assigned each QTL of the two population to the consensus map and the physical map. If the flanking markers of one QTL were 5 cM or 20 Mbp apart from the flanking markers of another QTL on both sides, the two QTLs were declared as common QTLs. The detected QTL was named as q + trait name + chromosome + the number of QTL on the chromosome, such as “qCIE-a-3B-1”. “qCIE-a” indicated one QTL for seeds color parameters redness (CIE-a) in wheat, and “3B-1” indicates the first QTL on chromosome 3B [44]. Compared with the previously reported QTLs or gene for seeds coat color, the common QTLs in this study were used to validate the correctness and affection of the linkage maps and consensus map.

3. Results

3.1. Construction of the Individual Maps and Consensus Map

After stringent filtration as described above, 2367 (Sp7A) and 3555 (G7A) SNP markers were used to construct the linkage maps, the details of the markers and the linkage maps were listed in the Table S1.
For Sp7A, 2367 SNP markers were grouped into 21 linkage groups corresponding to the 21 wheat chromosomes, covering 2838.18 cM across the whole genomes with an average interval of 1.20 cM; total map length for each chromosome ranged from 85.94 cM (Chr3D) to 186.92 cM (Chr5A), and chromosomes 5B and 6D showed the minimum (0.63 cM) and maximum (5.70 cM) average marker-intervals, respectively (Table 1 and Table S1, Figure S1.
For G7A, 3555 SNP markers were grouped into 21 linkage groups corresponding to the 21 wheat chromosomes, covering 4381.92 cM across the whole genomes with an average interval of 1.23 cM. Total map length for each chromosome ranged from 120.40 cM (Chr4B) to 297.22 cM (Chr7D), and chromosomes 7A and 5D showed the minimum (0.66 cM) and maximum (6.58 cM) average marker-intervals, respectively (Table 1 and Table S1, Figure S2.
MergeMap [40] was used to construct the consensus map by calculating the consensus marker orders of linkage groups according to the individual maps. For Sp7A_G7A, totally 5643 SNP markers were grouped into 21 linkage groups corresponding to the 21 wheat chromosomes, covering 4387.01 cM across the whole genomes with an average interval of 0.78 cM; total map length for each chromosome ranged from 121.97 cM (Chr4B) to 294.27 cM (Chr7D), and chromosomes 7A and 5D showed the minimum (0.43 cM) and maximum (3.49 cM) average marker-intervals, respectively (Table 1 and Table S1, Figure 1).

3.2. Evaluation of the Individual Maps and Consensus Map
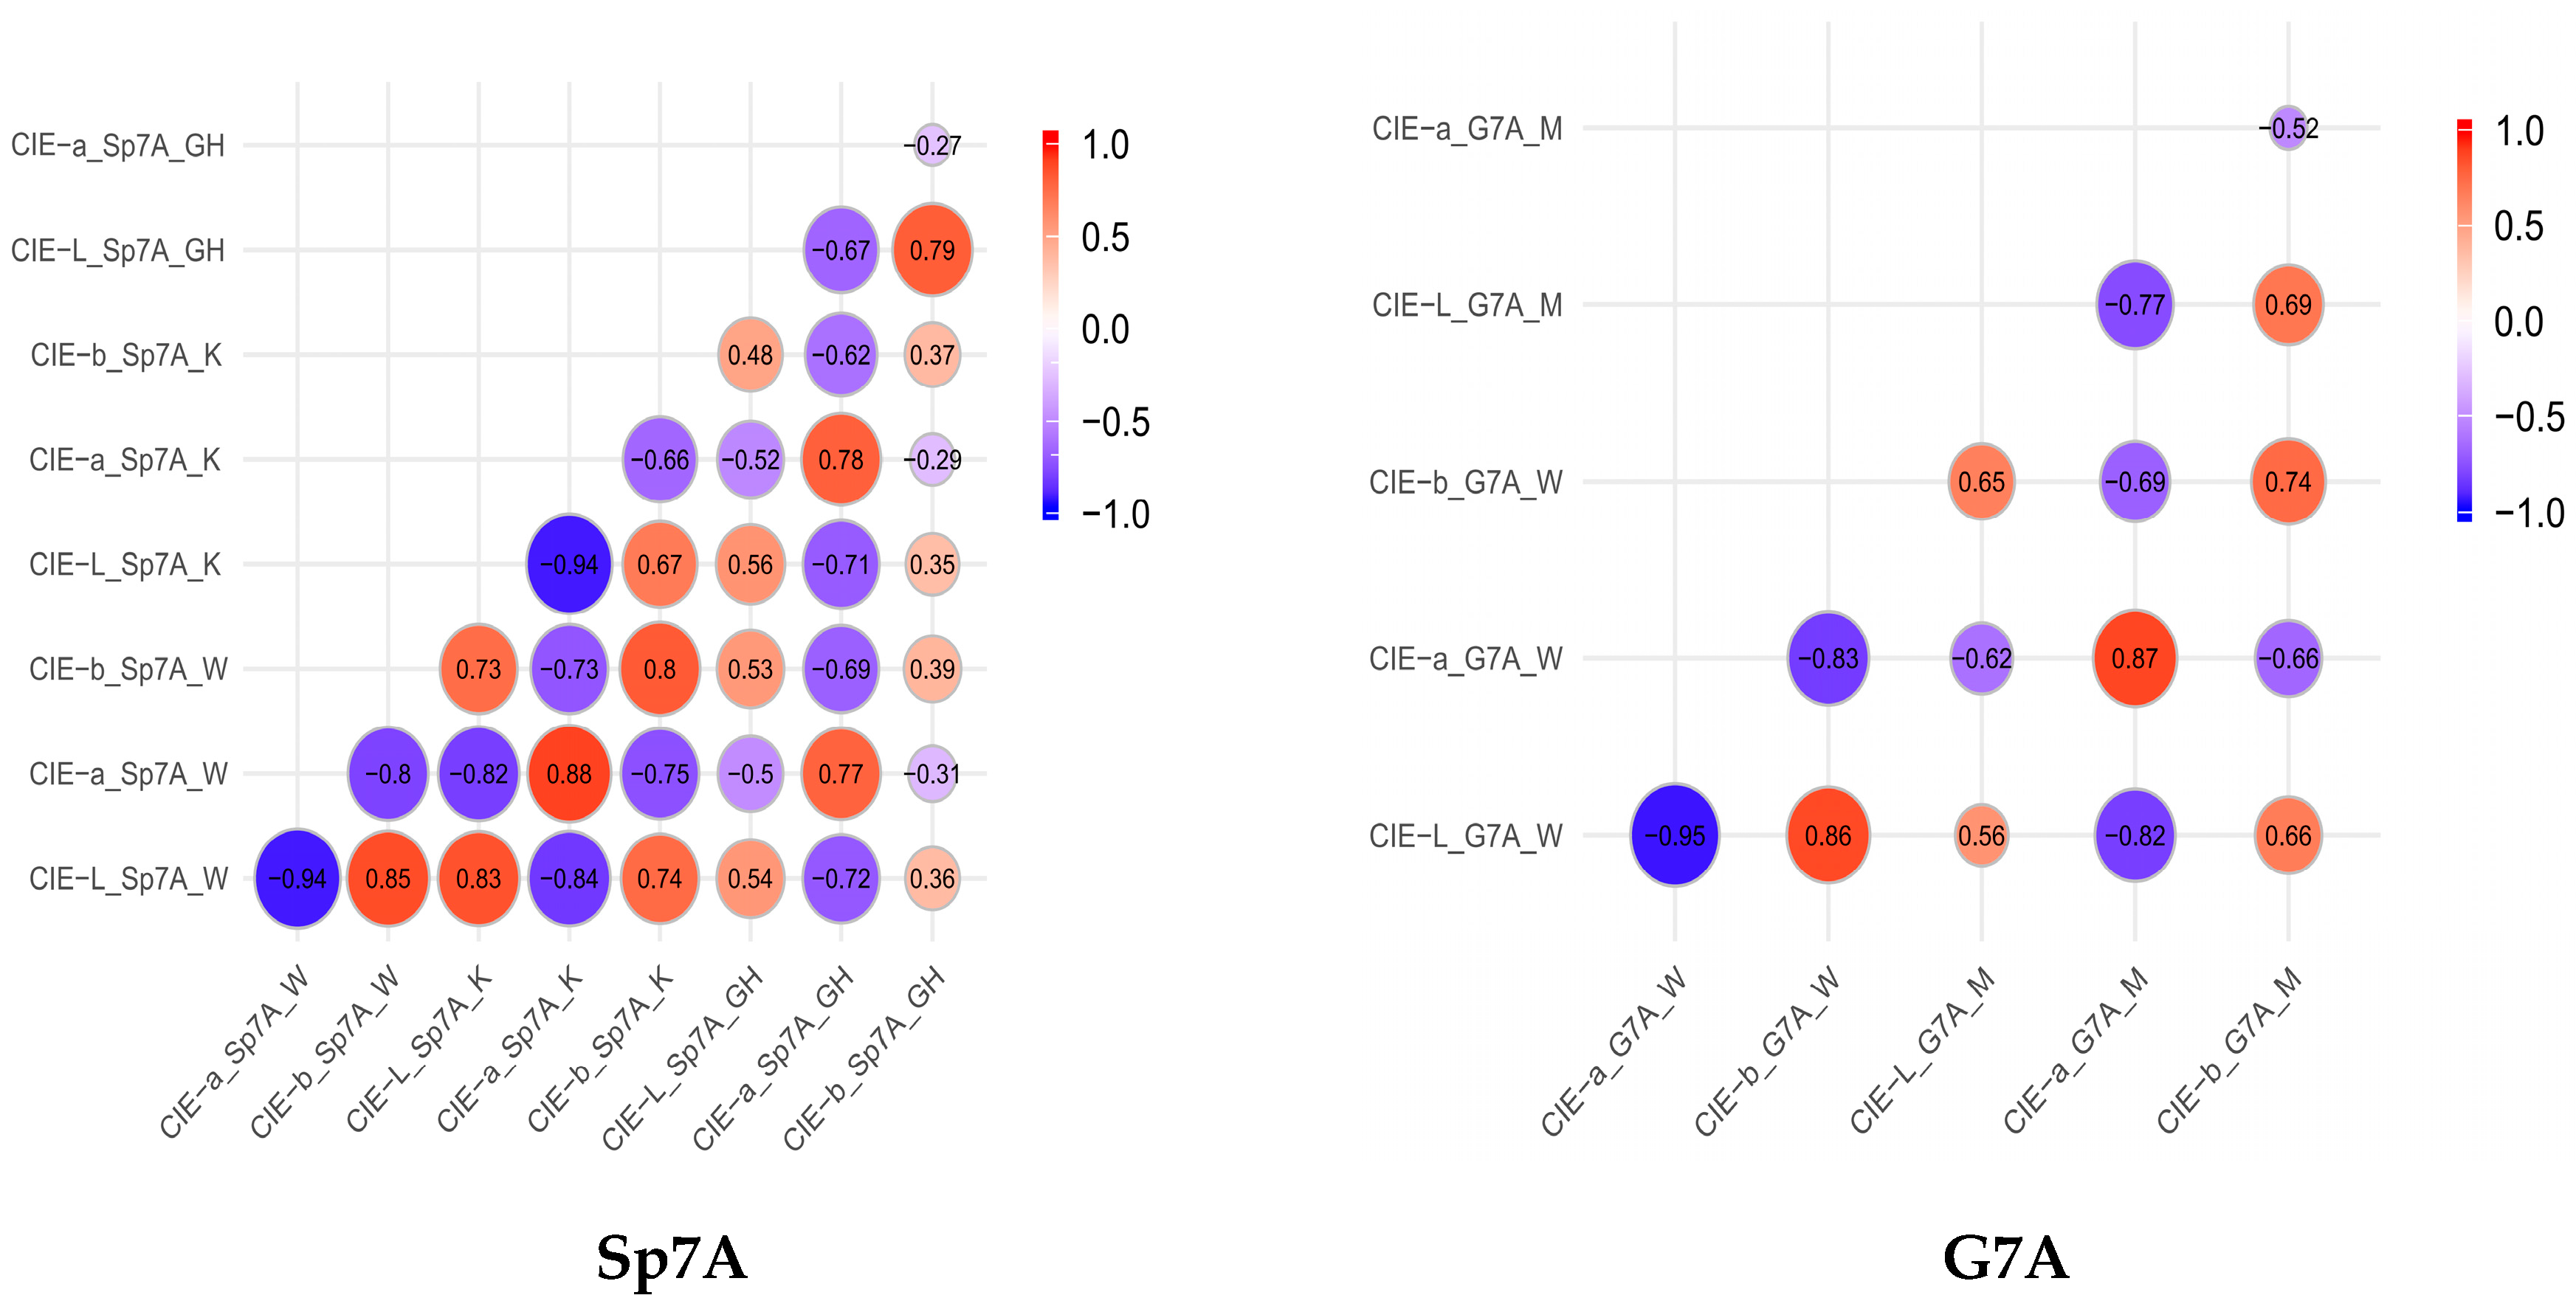
3.2.1. Heat Map

To estimate the quality of the linkage maps, the pair-wise recombination rates (r) of the SNP markers for Sp7A and G7A were calculated, and the heat maps were generated, respectively (Figure S3). The value for the recombination rate was indicated by different colors ranging from yellow (lower) to purple (higher). As shown in Figure S3, the colors on and near diagonal lines for all the chromosomes are yellow, indicating that they have low recombination or high linkage disequilibrium, and the squares of different size along the diagonal lines indicate the existence of different sizes of LD blocks or linkage regions. From the marker density of different chromosomes, the Figure S3 shows the large variations of the recombination rate for different chromosomes in Sp7A and G7A.

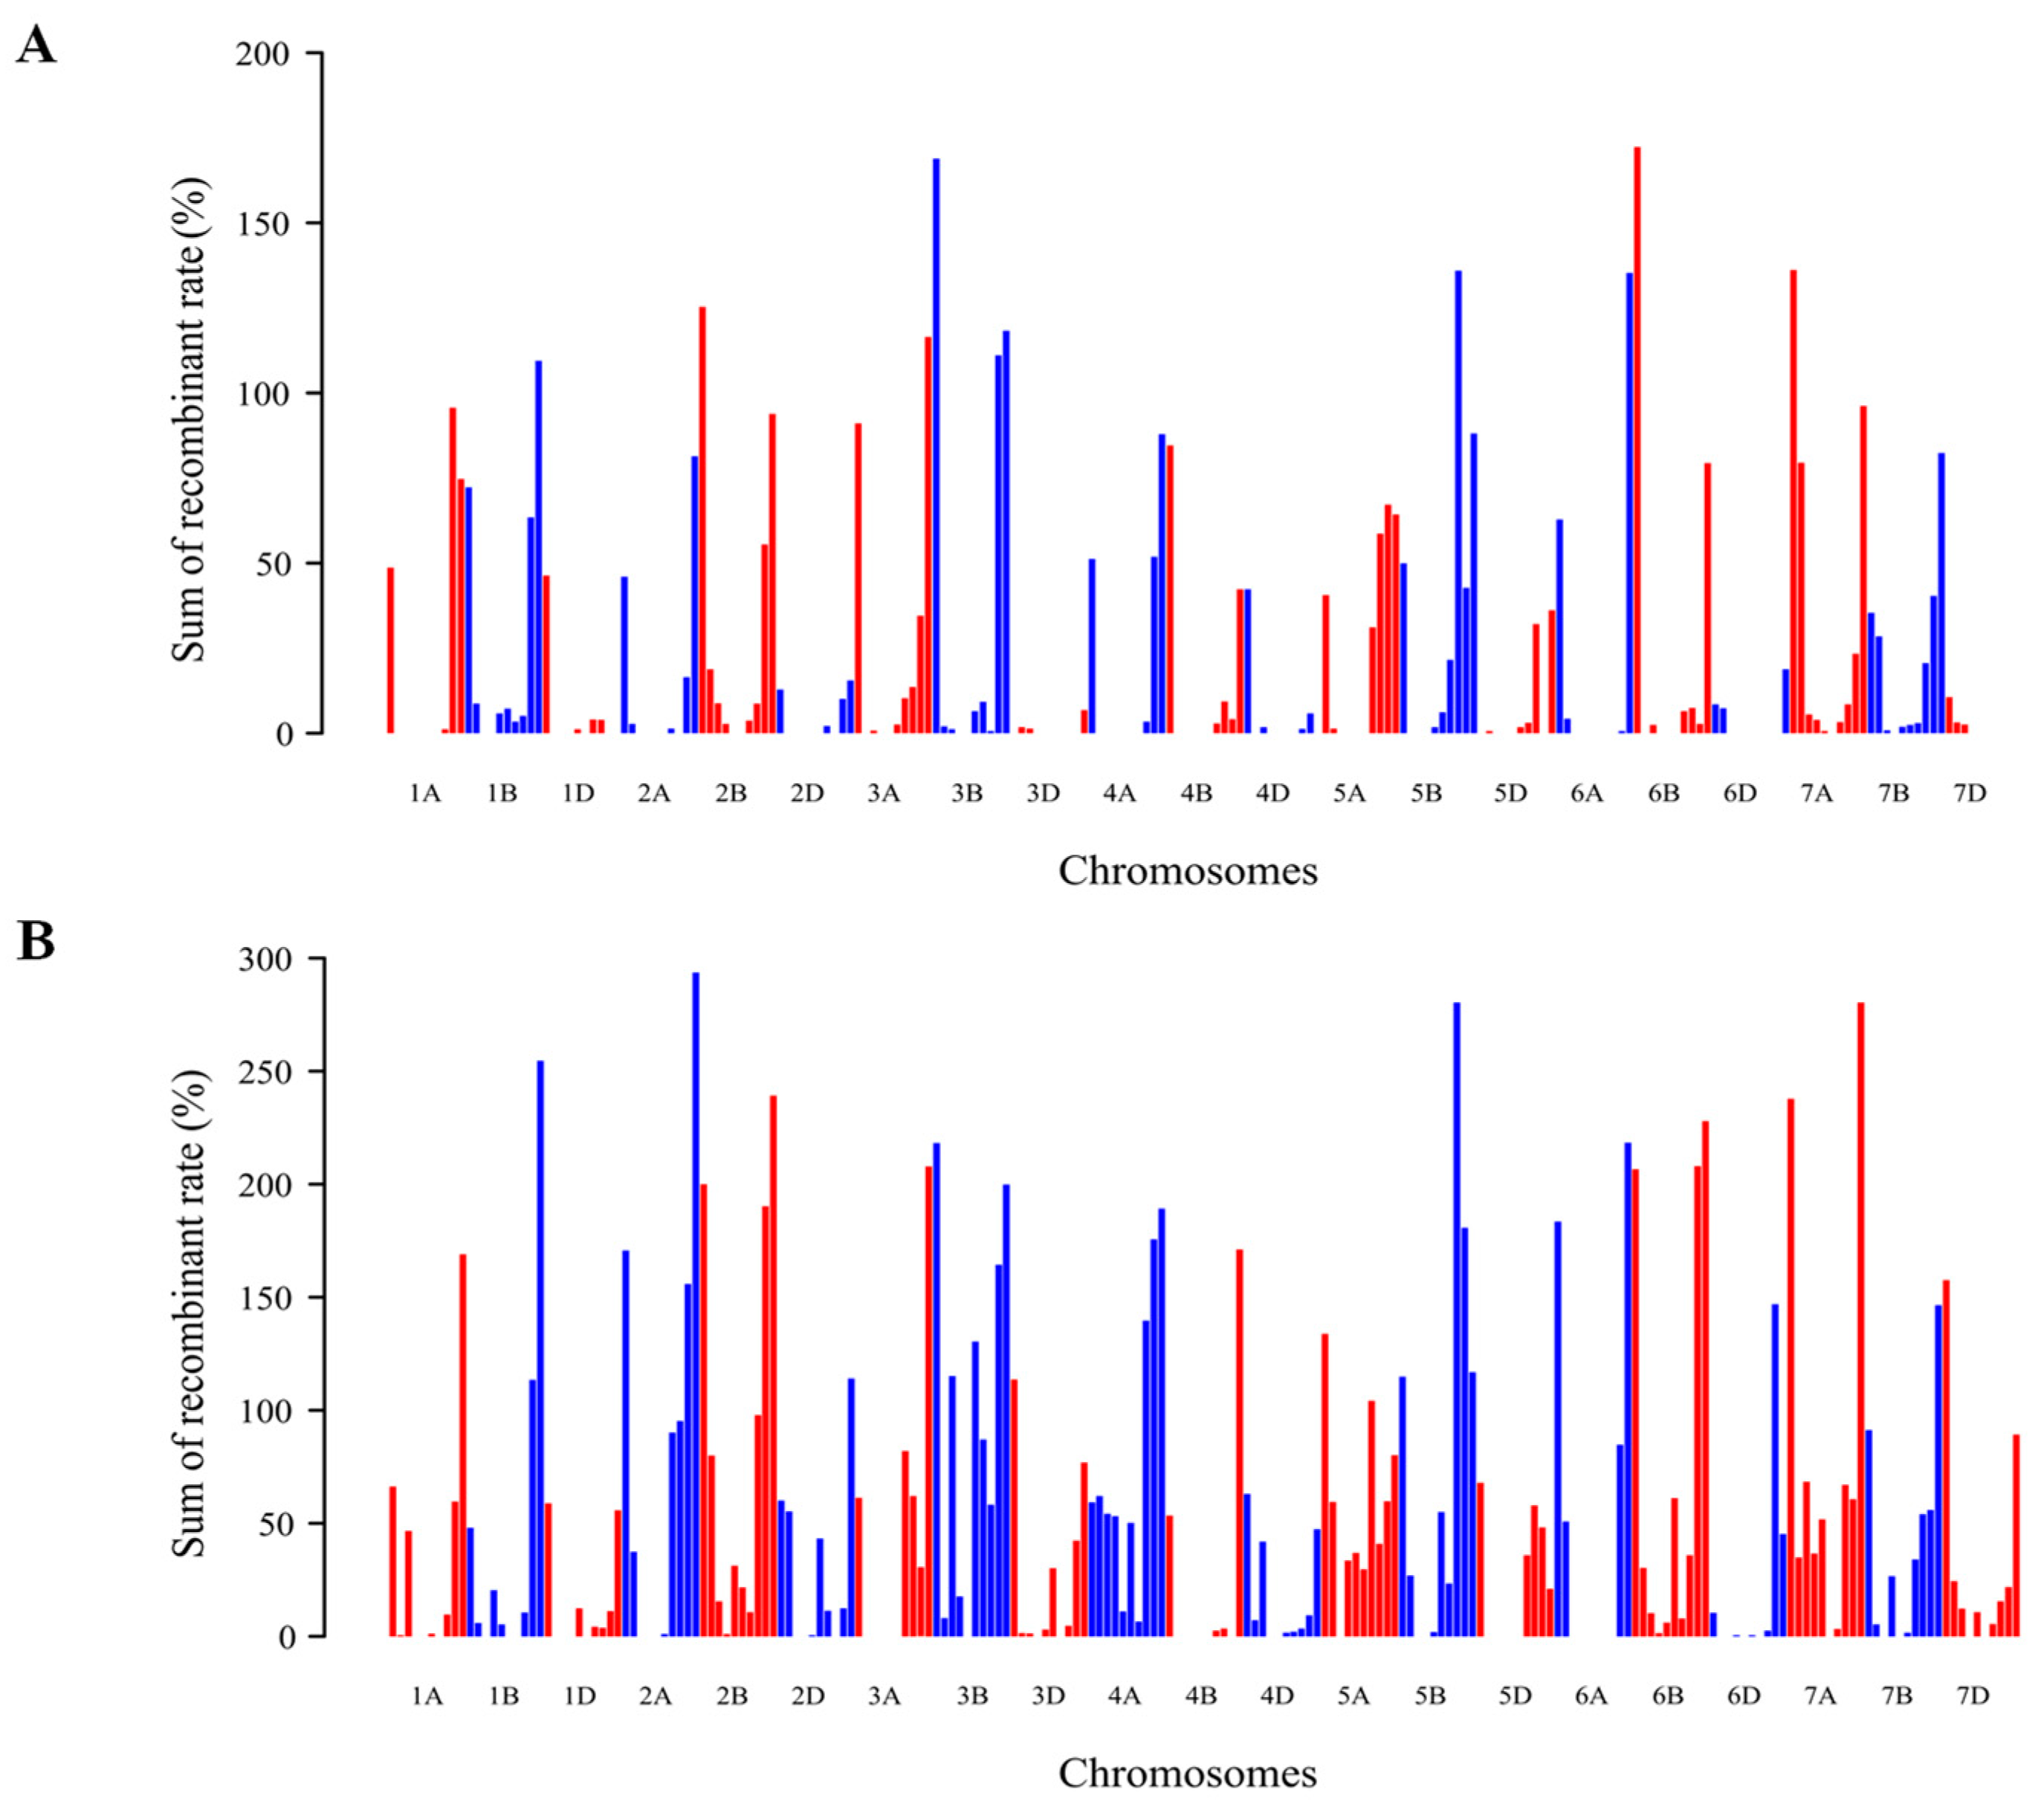
3.2.2. Similar Recombination Patterns in Wheat Genome

The similar recombination trends showed in constructed genetic maps of Sp7A and G7A, in which the recombination rate of chromosome arms in the distal is higher than that in the proximal, while D genome showed the lowest recombination rate. In the genetic maps of Sp7A and G7A, each chromosome was divided into 10 intervals according to its physical positions. In each interval, the recombination rate between adjacent markers was calculated, and the sum of all the recombinant rates in each interval was presented in Figure 2. The results show that the recombination rates in the intervals near the two ends of each chromosome were high and in the middle region were low (Figure 2). This result is consistent with those in previous studies that the recombination rates along chromosome arms show higher in high-recombination regions of distal than in low-recombination regions of proximal [45,46].

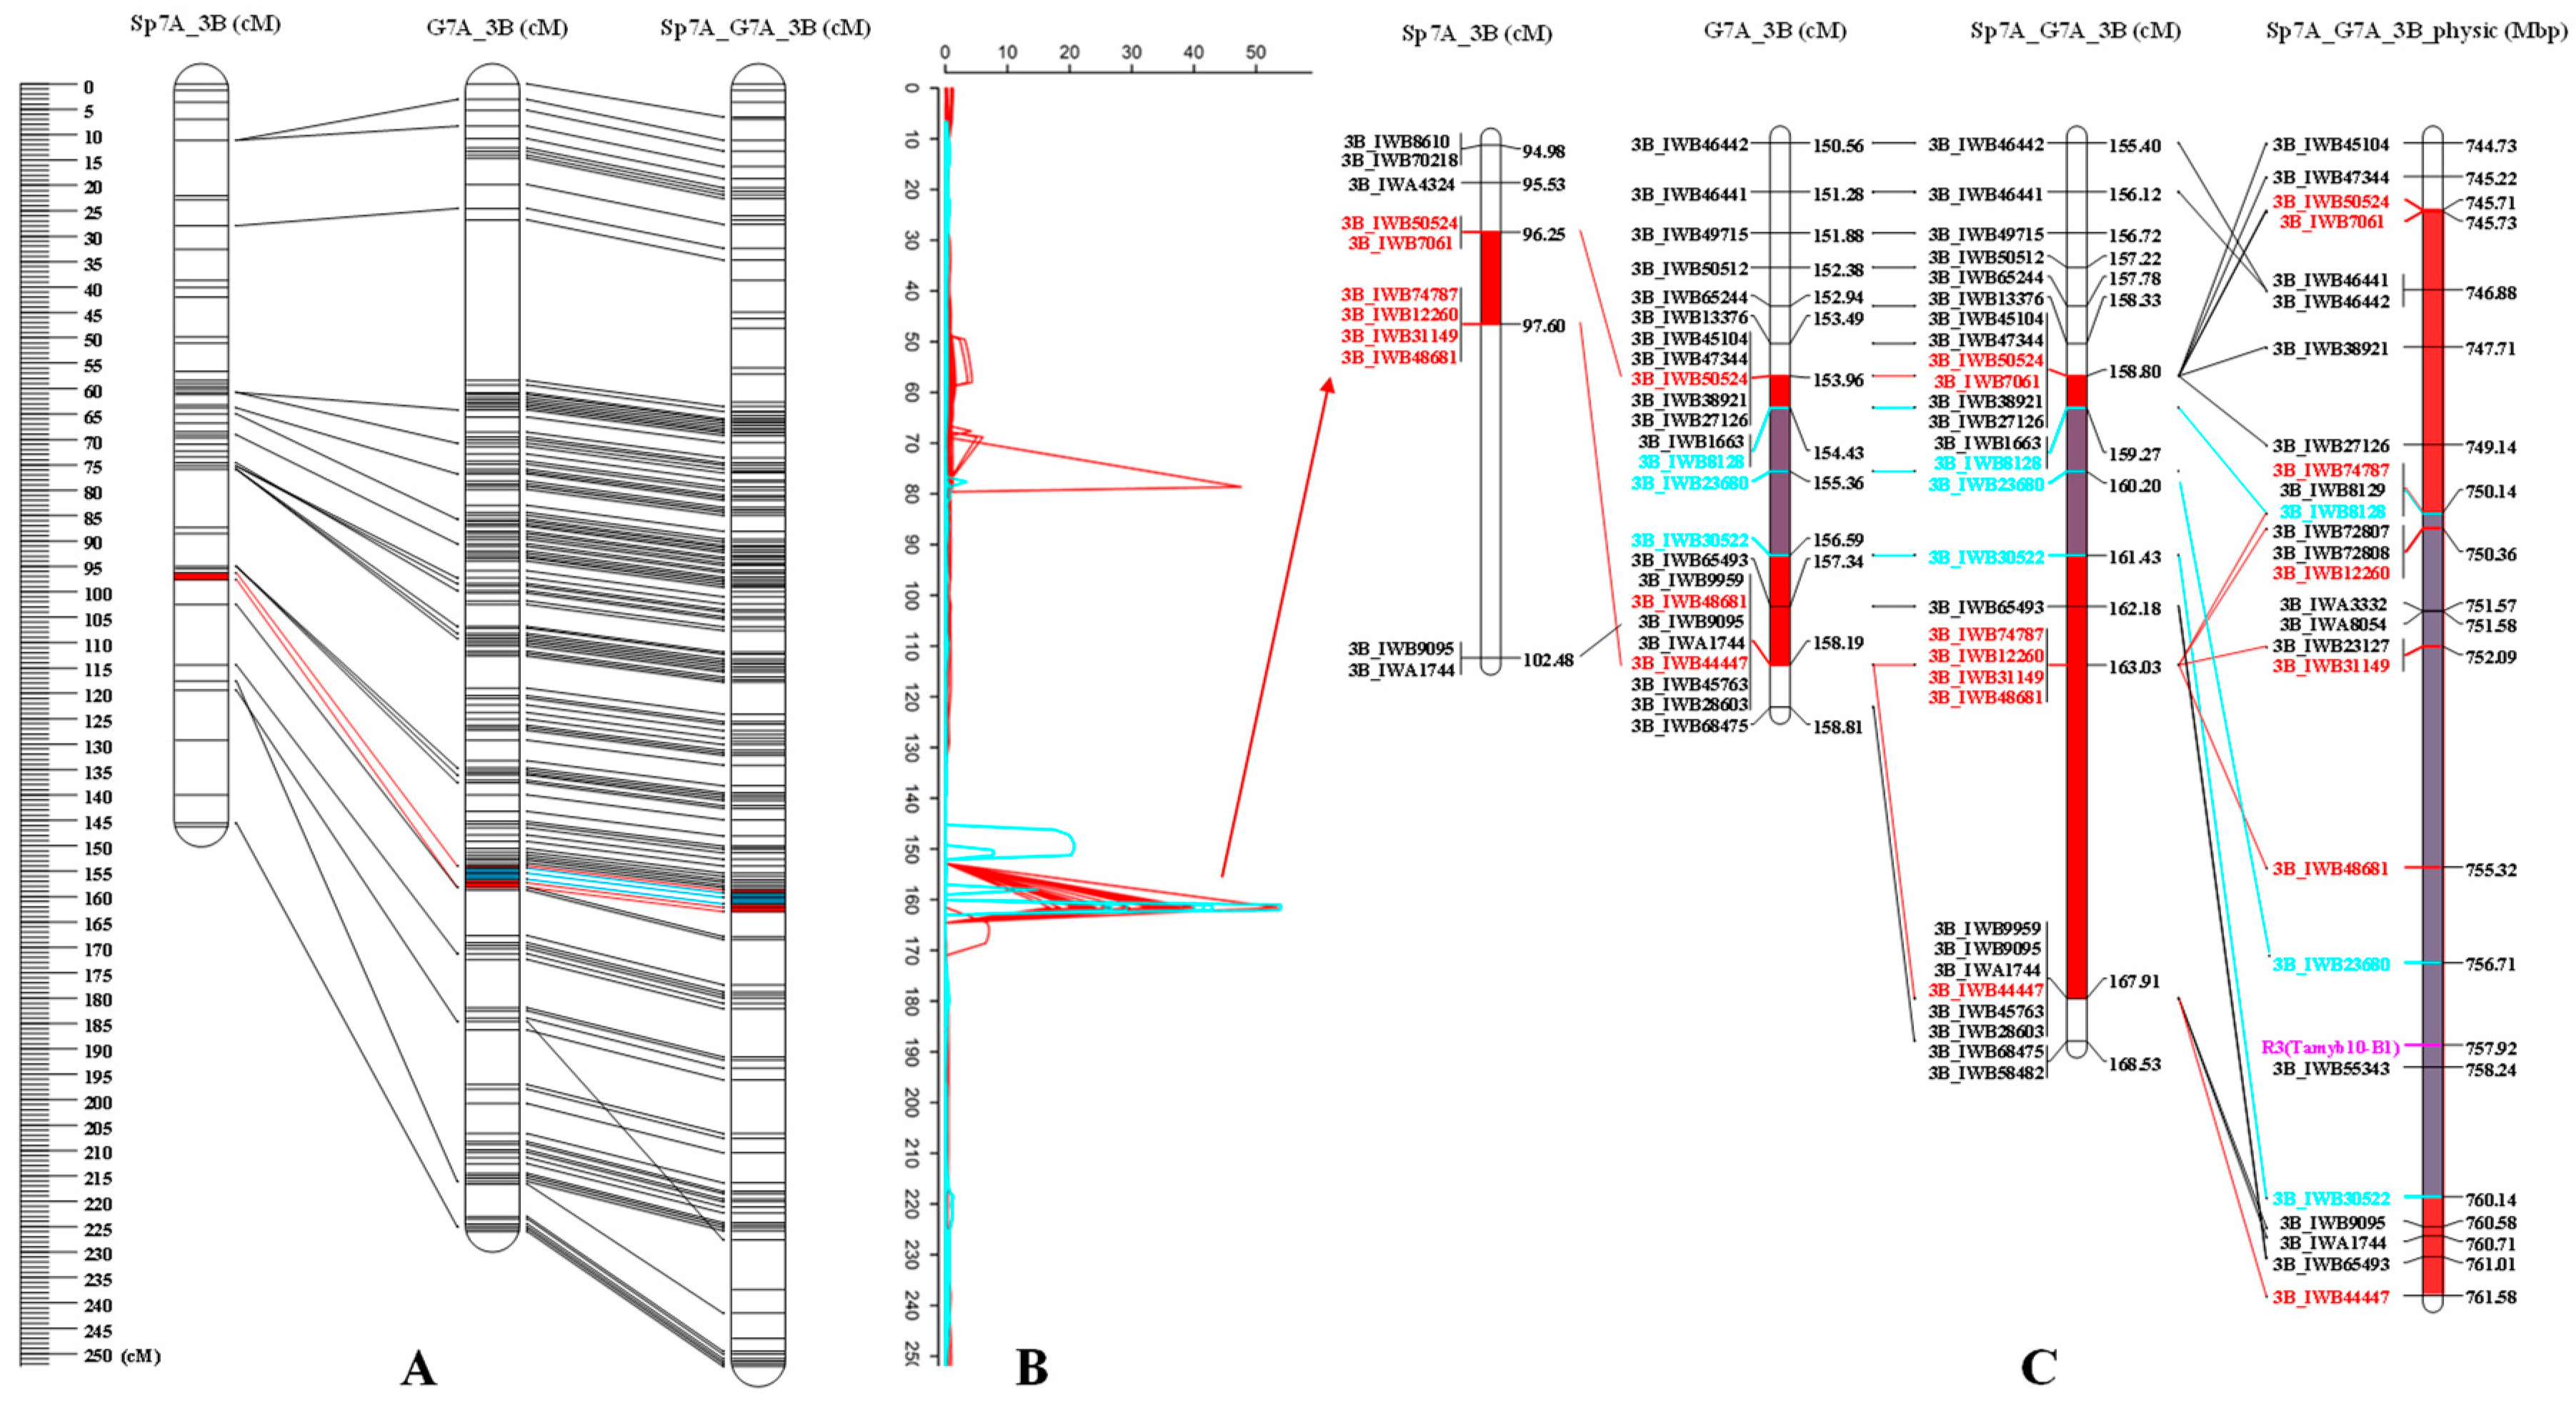
3.2.3. The Collinearity of Linkage Maps with the Previous Reported Map and the Wheat Reference Genome

To evaluate the collinearity of the linkage maps in current study with the previously reported consensus map of Con_map_Wang2014 and the physical map of wheat reference genome (IWGSC RefSeq v1.0), the genetic Spearman rank correlation coefficient for each chromosome was calculated according to genetic orders of the shared markers between the three linkage maps in the present study and Con_map_Wang2014, respectively (Table 1), and the Spearman rank correlation coefficient of each chromosome was calculated between the genetic and the physical orders of the markers for the three linkage maps, respectively (Table 1). The consecutive curves and the circos graph of collinearity among genetic map, Con_map_Wang2014 and the physical map were showed in Figures S4 and S5 and Figure 3, respectively. The linkage maps of Sp7A, G7A, and the consensus map of Sp7A_G7A constructed in this study showed high collinearity with Con_map_Wang2014 and the physical map of wheat genome (Figures S4 and S5 and Figure 3).
Among all the twenty-one Spearman rank correlation coefficients between the linkage map of Sp7A and Con_map_Wang2014, 12 were larger than 0.90, ranging from 0.369 (Chr6D) to 0.989 (Chr6A) showing high collinearity (Table 1, Figure S4A,C). A larger correlation coefficient revealed between the linkage map of Sp7A and the wheat reference genome with 19 larger than 0.90, 13 larger than 0.99, and ranging from 0.174 (Chr6D) to 1.000 (Chr4A, Chr5A, Chr6A, and Chr7A) (Table 1, Figure S4B,C)
Similarly, the high collinearity presented between the linkage map of G7A and Con_map_Wang2014. There were 12 Spearman rank correlation coefficients larger than 0.90, ranging from 0.107 (Chr6D) to 0.996 (Chr1A and Chr4B) (Table 1, Figure S5A,C). It is also noticed that a higher collinearity between the linkage map of G7A and physical map with 18 correlation coefficients larger than 0.90, ranging from 0.151 (Chr6D) to 0.999 (Chr7D) (Table 1, Figure S5B,C).
Similar results showed consensus map of Sp7A_G7A. The higher collinearity displayed between Sp7A_G7A and the physical map. Among all the twenty-one Spearman rank correlation coefficients between Sp7A_G7A and Con_map_Wang2014, 11 were larger than 0.90, ranging from 0.190 (Chr6D) to 0.987 (Chr4B) (Table 1, Figure 3A,C), whereas 18 were larger than 0.90 between Sp7A_G7A and the physical map, ranging from 0.148 (Chr6D) to 0.9950 (Chr7D) (Table 1, Figure 3B,C).
The high collinearity showed the high degree of marker order consistency among three constructed genetic maps of current study, Con_map_Wang2014 and the physical map of wheat reference genome IWGSC RefSeq v1.0. It is noteworthy that the collinearity between the linkage maps of this study and physical map was higher than that between the consensus map of Wang et al. [24] and the physical map (Table 1). One interesting phenomenon on Chr6D was found that the collinearity among the three linkage maps and Con_map_Wang2014 as well as physical map was much lower in both two populations (Table 1, Figures S4 and S5 and Figure 3).

3.3. QTL Mapping for Seeds Coat Color Traits in Wheat

3.3.1. Phenotypic Variation

The seeds coat color parameters (including: Brightness (L), redness (a), and yellowness (b)) were measured by SeedCount SC6000R analyser (Next Instruments, Ltd., Australia). The large color variations were observed in both populations in all environments (Table 2). For Sp7A, across all three environments, the average brightness was 50.72, ranging from 43.20 to 59.90, while the redness was 6.33, ranging from 3.60 to 9.50 and yellowness was 18.27 varied from 13.90 to 24.70. For G7A, across two environments, the average brightness was 51.00, ranging from 44.20 to 57.60 while the redness averaged 6.38, ranging from 3.6 to 8.6 and yellowness was 19.47 varied from 15.90 to 23.05. The broad-sense heritability of three seed coat color parameters was calculated for two populations in different environments (Table 2). The result showed high heritability (>90%) in both populations and environments, indicating the high genetic variations within the populations. The correlation analysis of the seeds coat color parameters in different populations was showed in Figure 4. The three parameters (redness, yellowness, brightness) of seeds coat color showed high correlation with each other in the two populations at different environments. The parameter redness (a) was negatively correlated with yellowness (b) and brightness (L), while b was positively correlated to L. In addition, the correlations coefficients among the three parameters of seed coat color for the two populations were similar in different environments, indicating the stability of seed coat color and the accuracy of the measurement.

3.3.2. QTL Analysis for Seeds Coat Color in Two Populations

For the DH population of Sp7A, in the three trials (Sp7A_K, Sp7A_W and Sp7A_GH), a total of 11 significant QTLs were detected (Table 3, Figure 5), which included five QTLs of brightness (L), three QTLs for each redness (a) and yellowness (b), respectively. One stable QTL qCIE-L-3B-2 located at 97 cM of Chr3B of Sp7A, were co-detected for brightness in three environments with LOD value ranging from 20.72 to 36.12, explaining 41.0–72.3% of phenotypic variation. Stable QTL qCIE-a-3B-1 located at 59–61 cM, were detected for redness in Sp7A_K and Sp7A_W with LOD value of 4.22–47.59, explaining 4.2–50.2% of phenotypic variation, moreover, stable QTL qCIE-a-3B-2 located at 97 cM same as qCIE-L-3B-2, were detected for redness in three environments with LOD value of 34.39–53.50, explaining 30.0–80.5% of phenotypic variation. Stable QTL qCIE-b-3B-1 were detected at 97 cM for yellowness in three environments with LOD value of 7.05–24.02, explaining 14.5–63.6% of phenotypic variation (Table 3, Figure 5).
For the DH population of G7A, in the two field trials (G7A_W and G7A_M), a total of 9 significant QTLs were detected (Table 3, Figure 5). Four QTLs were for each brightness and redness, while one QTL for yellowness. One stable QTL qCIE-L-3B-2 located at 145–156 cM of Chr3B in G7A, were co-detected for brightness in two environments with LOD value ranging from 7.71 to 41.60, explaining 35.9–70.7% of phenotypic variation. In three environments, QTL qCIE-a-3B-2 and qCIE-b-3B-1 located at 143–156 cM were detected with LOD value over 15, explaining 57.6–84.1% and 58.7–68.0% of phenotypic variations, respectively (Table 3, Figure 5).
Overall, QTL qCIE-L-3B-2, qCIE-a-3B-2 and qCIE-b-3B-1 were co-detected with a large LOD value and PVE% in single environment, which were located at 97 cM and 143–156 cM on Chr3B in both Sp7A and G7A populations, collinear to the same region 149–160 cM of consensus map and 745.73–760.14 Mbp of wheat genome (Table 3, Figure 5). L, a, and b, 3 parameters of seeds coat color, showed high correlation with each other (Figure 4), therefore, the region of the three QTLs was significantly associated with seed coat color. Moreover, one gene R-B1/Tamyb10-B1 (TraesCS3B02G515900, 3B: 757,918,264–757,920,082 bp) located in the region of the QTLs for seeds color of this study (Figure 5), was reported to control seed coat color in wheat [47,48].

4. Discussion

4.1. Consensus Map Increased the Mapping Resolution

MergeMap [40] was used to construct the consensus map by calculating the consensus marker orders of linkage groups according to the individual map. The consensus map (Sp7A_G7A) from the two populations had an average interval of 0.78 cM between two adjacent markers, lower than that observed in the two individual maps, which was 1.20 cM for Sp7A and 1.23 cM for G7A). Overlapping regions between individual maps were enriched by additional markers, the gaps between adjacent markers were observed smaller in Sp7A_G7A, and the density of Sp7A_G7A was also increased. High consistency of marker order among Sp7A_G7A of this study and the Con_map_Wang2014 as well as the physical map was confirmed by pairwise Spearman rank correlation coefficients, respectively, which evaluated the degree of marker order correspondence (Table 1). Therefore, either the marker orders of individual maps or consensus map were proved more reliable. The percentages of the three sub-genome lengths (A = 37.2%, B = 30.2%, D = 32.6%) in the present consensus map were closer to those (A = 34.1%, B = 31%, D = 34.9%) in Wang et al. [24].

4.2. The Collinearity of the Consensus Map

The collinearity of the linkage maps in current study with the Con_map_Wang2014 and the physical map of wheat reference genome (IWGSC RefSeq v1.0) was evaluated through Spearman rank correlation coefficient (Table 1, Figures S4 and S5 and Figure 3). Most chromosomes showed high collinearity among three constructed genetic maps of current study, the Con_map_Wang2014 and the physical map. Moreover, the collinearity between our constructed maps and the physical map of wheat is higher than that between the Con_map_Wang2014 and the physical map (Table 1), which illustrated that the linkage maps and the consensus map of our study were reliable for further study including QTL mapping and MSA. In this study, the collinearity of Chr6D between the linkage maps for the two populations and the physical maps was low, suggesting a chromosomal inversion existing on Chr6D. It may also be caused by fewer markers on Chr6D. More polymorphic markers are needed to confirm the order on 6D. Similar result had been reported in Ma et al. [49]. The collinear analysis is a useful tool to validate the correctness of the constructed maps, to help with the correction of the exact marker location and to find chromosomal rearrangement including inversion.

4.3. Application of the Integrated Consensus Map

The current linkage maps have been validated in two aspects. Firstly, the linkage map was verified based on its characteristic analysis, including the heat map of recombination, the distribution of recombination fractions on the genome, and the marker order consistency between our consensus map and Con_map_Wang2014 as well as the collinearity between the linkage maps in this study and the physical map of wheat reference genome (Table 1, Figures S4 and S5 and Figure 3). Secondly, the linkage map was validated by the QTL co-location for seeds coat color in the two populations based on the constructed individual genetic maps and consensus map.
Wheat seeds coat color, associated with pre-harvest sprouting (PHS), is a very important trait for wheat breeding. Red-grained wheats are usually more tolerant to PHS than the white-grained wheats [50,51]. R-B1/Tamyb10-B1 (TraesCS3B02G515900, 3B: 757,918,264–757,920,082 bp), on chromosome 3B, controls seeds coat color and shows multiple effects on wheat PHS resistance by accumulating red pigment catechins that inhibit seed germination [47,52]. Many papers of QTL mapping and cloning have co-located the QTL or gene for seeds coat color on chromosome 3B around or at the physical region of Tamyb10-B1 [48,53,54]. In this study, we detected the QTLs for seeds coat color parameters (L, a, and b) in the similar region (745.73–760.14 Mbp) on Chr3B both in the two populations and multiple environments based on the individual DH population map and consensus map with high LOD values of 7.71–53.99, explaining 14.5–84.1% of phenotypic variation (Table 3, Figure 5), moreover, the consensus map narrowed the co-located region to (750.14–760.14 Mbp) (Figure 5). This is further proof that the accuracy of the individual Sp7A and G7A map, and consensus map, and those maps are reliable and functional for QTL mapping. The SNP markers on the consensus map are derived from genes, and will be beneficial to association mapping, meta-QTL analysis and positional cloning, and utilized in wheat breeding.

5. Conclusions

A total of 5643 SNP markers in two DH populations were grouped into 21 linkage groups corresponding to the 21 wheat chromosomes for constructing a consensus genetic map, covering 4376.70 cM across the whole genomes with an average interval of 0.78 cM. The relatively high collinearity of linkage maps with the Con_map_Wang2014 and the physical map of wheat reference genome, and the QTLs for seeds coat color parameters detected in this study validated the quality of the linkage maps. The two single genetic maps of Sp7A and G7A, and the consensus map of Sp7A_G7A will be very useful for QTL mapping, positional cloning, meta-QTL analysis and wheat breading.

Supplementary Materials

The following are available online at https://www.mdpi.com/2073-4395/11/2/227/s1. Figure S1. The genetic linkage map constructed by 2367 SNP markers in a DH population derived from a cross between Spitfire and Bethlehem-7AS. Figure S2. The genetic linkage map constructed by 3555 SNP markers in a DH population derived from a cross between Gregory and Bethlehem-7AS. Figure S3. The heat map of the matrices of pair-wise recombination fractions indicated by SNP markers for each chromosome. (A) The DH population of Sp7A; (B) the DH population of G7A; the axes of X (horizontal) and Y (vertical) represent the markers on each chromosome, the diagonal indicates that the recombination rate of the same marker is 0.0, and the cell color indicates the recombination rate of the two markers. Figure S4. The circos graph and the consecutive curves of collinearity among the genetic linkage map of Sp7A, Con_map_Wang2014 and the physic map of wheat genome (IWGSC RefSeq v1.0). (A) The circos graph of collinearity among the genetic linkage map of Sp7A, Con_map_Wang2014 and the physic map, (a) the chromosomes and the physical location scale of wheat; (b) Physic map of the SNP markers using in the Sp7A; (c) the collinearity between the linkage map of Sp7A and the physic map; (d) the linkage map of Sp7A; (e) the collinearity between the linkage map of Sp7A and Con_map_Wang2014; (f) the consensus map of Wang et al. (Con_map_Wang2014); (B) the consecutive curves of collinearity between the linkage map of Sp7A and the physic map; (C) the consecutive curves of collinearity between the linkage map of Sp7A and Con_map_Wang2014. Figure S5. The circos graph and the consecutive curves of collinearity among the genetic linkage map of G7A, Con_map_Wang2014 and the physic map of wheat genome (IWGSC RefSeq v1.0). (A) The circos graph of collinearity among the genetic linkage map of G7A, Con_map_Wang2014 and the physic map, (a) the chromosomes and the physical location scale of wheat; (b) Physic map of the SNP markers using in the G7A; (c) the collinearity between the linkage map of G7A and the physic map; (d) the linkage map of G7A; (e) the collinearity between the linkage map of G7A and Con_map_Wang2014; (f) the consensus map of Wang et al. (2014) (Con_map_Wang2014); (B) the consecutive curves of collinearity between the linkage map of G7A and the physic map; (C) the consecutive curves of collinearity between the linkage map of G7A and Con_map_Wang2014. Table S1. The details of the markers, the linkage maps of individual maps for Sp7A and G7A populations and the consensus map.

Author Contributions

W.M. and S.I. conceived the study; X.H., M.S., G.T., J.R., and J.Z. prepared the DNA for genotyping; X.H., Y.Z. (Yun Zhao), S.I., G.T., Y.J., and J.Z. conducted the experiments and phenotyping measurements; X.H., Y.Z. (Yingquan Zhang) and J.Z. constructed the linkage map; X.H. and Y.Z. (Yingquan Zhang) analyzed and data and conducted the QTL; X.H. visualized the results; X.H. and Y.Z. (Yingquan Zhang) wrote the draft; W.M. and J.Z. revised the manuscript. All authors have read and agreed to the published version of the manuscript.

Funding

This project was funded by the Australian Grains Research & Development Corporation (GRDC) project UMU00048 and Murdoch University internal research funds.

Acknowledgments

We would like to thank the PhD candidate student Jian-Fang Zuo at Huazhong Agricultural University for helping the data analysis and sharing the R scripts for results visualization. This work was supported by Murdoch University and the Department of Primary Industries and Regional Development (DPIRD), Western Australia. We thank Dean Diepeveen and his colleagues in DPIRD, and Hugo. Alsono-Cantabrana and Rowan Maddern from the GRDC for their support and assistance. We thank Sue Broughton from the DPIRD for constructing the six DH populations used in this study.

Conflicts of Interest

The authors declare no conflict of interest.

References

  1. Dubcovsky, J.; Dvorak, J. Genome plasticity a key factor in the success of polyploid wheat under domestication. Science 2007, 316, 1862–1866. [Google Scholar] [CrossRef] [Green Version]
  2. International Wheat Genome Sequencing Consortium. A chromosome-based draft sequence of the hexaploid bread wheat (Triticum aestivum) genome. Science 2014, 345, 1251788. [Google Scholar] [CrossRef] [PubMed]
  3. Tester, M.; Langridge, P. Breeding technologies to increase crop production in a changing world. Science 2010, 327, 818–822. [Google Scholar] [CrossRef] [PubMed]
  4. Qureshi, N.; Kandiah, P.; Gessese, M.K.; Nsabiyera, V.; Wells, V.; Babu, P.; Wong, D.; Hayden, M.; Bariana, H.; Bansal, U. Development of co-dominant KASP markers co-segregating with Ug99 effective stem rust resistance gene Sr26 in wheat. Mol. Breed. 2018, 38, 97. [Google Scholar] [CrossRef]
  5. Jia, A.; Ren, Y.; Gao, F.; Yin, G.; Liu, J.; Guo, L.; Zheng, J.; He, Z.; Xia, X. Mapping and validation of a new QTL for adult-plant resistance to powdery mildew in Chinese elite bread wheat line Zhou8425B. Theor. Appl. Genet. 2018, 131, 1063–1071. [Google Scholar] [CrossRef] [PubMed]
  6. Nsabiyera, V.; Bariana, H.S.; Qureshi, N.; Wong, D.; Hayden, M.J.; Bansal, U.K. Characterisation and mapping of adult plant stripe rust resistance in wheat accession Aus27284. Theor. Appl. Genet. 2018, 131, 1459–1467. [Google Scholar] [CrossRef] [PubMed]
  7. Yang, Y.; Basnet, B.R.; Ibrahim, A.M.H.; Rudd, J.C.; Chen, X.M.; Bowden, R.L.; Xue, Q.W.; Wang, S.C.; Johnson, C.D.; Metz, R.; et al. Developing KASP markers on a major stripe rust resistance QTL in a popular wheat TAM 111 using 90k array and genotyping-by-sequencing SNPs. Crop. Sci. 2019, 59, 165–175. [Google Scholar] [CrossRef]
  8. Zuo, J.F.; Niu, Y.; Cheng, P.; Feng, J.Y.; Han, S.F.; Zhang, Y.H.; Shu, G.; Wang, Y.; Zhang, Y.M. Effect of marker segregation distortion on high density linkage map construction and QTL mapping in Soybean (Glycine max L.). Heredity 2019, 123, 579–592. [Google Scholar] [CrossRef] [Green Version]
  9. Hu, X.; Ren, J.; Ren, X.; Huang, S.; Sabiel, S.A.; Luo, M.; Nevo, E.; Fu, C.; Peng, J.; Sun, D. Association of agronomic traits with snp markers in durum wheat (Triticum turgidum L. durum (Desf.)). PLoS ONE 2015, 10, e0130854. [Google Scholar] [CrossRef] [Green Version]
  10. Zhu, Y.; Wang, S.; Wei, W.; Xie, H.; Liu, K.; Zhang, C.; Wu, Z.; Jiang, H.; Cao, J.; Zhao, L.; et al. Genome-wide association study of pre-harvest sprouting tolerance using a 90K SNP array in common wheat (Triticum aestivum L.). Theor. Appl. Genet. 2019, 132, 2947–2963. [Google Scholar] [CrossRef]
  11. Shi, W.; Hao, C.; Zhang, Y.; Cheng, J.; Zhang, Z.; Liu, J.; Yi, X.; Cheng, X.; Sun, D.; Xu, Y.; et al. A combined association mapping and linkage analysis of kernel number per spike in common wheat (Triticum aestivum L.). Front. Plant. Sci. 2017, 8, 1412. [Google Scholar] [CrossRef] [PubMed] [Green Version]
  12. Yu, K.; Liu, D.; Wu, W.; Yang, W.; Sun, J.; Li, X.; Zhan, K.; Cui, D.; Ling, H.; Liu, C.; et al. Development of an integrated linkage map of einkorn wheat and its application for QTL mapping and genome sequence anchoring. Theor. Appl. Genet. 2017, 130, 53–70. [Google Scholar] [CrossRef] [PubMed]
  13. Xia, Z.; Tsubokura, Y.; Hoshi, M.; Hanawa, M.; Yano, C.; Okamura, K.; Ahmed, T.A.; Anai, T.; Watanabe, S.; Hayashi, M. An integrated high-density linkage map of soybean with RFLP, SSR, STS, and AFLP markers using a single F2 population. DNA Res. 2007, 14, 257–269. [Google Scholar] [CrossRef] [PubMed] [Green Version]
  14. Wen, W.; He, Z.; Gao, F.; Liu, J.; Jin, H.; Zhai, S.; Qu, Y.; Xia, X. A high-density consensus map of common wheat integrating four mapping populations scanned by the 90K SNP array. Front. Plant. Sci. 2017, 8, 1389. [Google Scholar] [CrossRef] [Green Version]
  15. Chao, S.; Sharp, P.J.; Worland, A.J.; Warham, E.J.; Koebner, R.M.; Gale, M.D. RFLP-based genetic maps of wheat homoeologous group 7 chromosomes. Theor. Appl. Genet. 1989, 78, 495–504. [Google Scholar] [CrossRef]
  16. Vierling, R.A.; Nguyen, H.T. Use of RAPD markers to determine the genetic diversity of diploid, wheat genotypes. Theor. Appl. Genet. 1992, 84, 835–838. [Google Scholar] [CrossRef]
  17. Hartl, L.; Mohler, V.; Zeller, F.J.; Hsam, S.L.; Schweizer, G. Identification of AFLP markers closely linked to the powdery mildew resistance genes Pm1c and Pm4a in common wheat (Triticum aestivum L.). Genome 1999, 42, 322–329. [Google Scholar] [CrossRef]
  18. Röder, M.S.; Korzun, V.; Wendehake, K.; Plaschke, J.; Tixier, M.-H.; Leroy, P.; Ganal, M.W. A microsatellite map of wheat. Genetics 1998, 149, 2007–2023. [Google Scholar]
  19. Akbari, M.; Wenzl, P.; Caig, V.; Carling, J.; Xia, L.; Yang, S.; Uszynski, G.; Mohler, V.; Lehmensiek, A.; Kuchel, H.; et al. Diversity arrays technology (DArT) for high-throughput profiling of the hexaploid wheat genome. Theor. Appl. Genet. 2006, 113, 1409–1420. [Google Scholar] [CrossRef]
  20. Semagn, K.; Bjornstad, A.; Skinnes, H.; Maroy, A.G.; Tarkegne, Y.; William, M. Distribution of DArT, AFLP, and SSR markers in a genetic linkage map of a doubled-haploid hexaploid wheat population. Genome 2006, 49, 545–555. [Google Scholar] [CrossRef] [Green Version]
  21. Li, C.; Bai, G.; Chao, S.; Wang, Z. A high-density SNP and SSR consensus map reveals segregation distortion regions in wheat. Biomed. Res. Int. 2015, 830618. [Google Scholar] [CrossRef] [PubMed] [Green Version]
  22. Poland, J.A.; Brown, P.J.; Sorrells, M.E.; Jannink, J.L. Development of high-density genetic maps for barley and wheat using a novel two-enzyme genotyping-by-sequencing approach. PLoS ONE 2012, 7, e32253. [Google Scholar] [CrossRef] [PubMed] [Green Version]
  23. Colasuonno, P.; Gadaleta, A.; Giancaspro, A.; Nigro, D.; Giove, S.; Incerti, O.; Mangini, G.; Signorile, A.; Simeone, R.; Blanco, A. Development of a high-density SNP-based linkage map and detection of yellow pigment content QTLs in durum wheat. Mol. Breed. 2014, 34, 1563–1578. [Google Scholar] [CrossRef]
  24. Wang, S.; Wong, D.; Forrest, K.; Allen, A.; Chao, S.; Huang, B.E.; Maccaferri, M.; Salvi, S.; Milner, S.G.; Cattivelli, L.; et al. Characterization of polyploid wheat genomic diversity using a high-density 90,000 single nucleotide polymorphism array. Plant. Biotechnol. J. 2014, 12, 787–796. [Google Scholar] [CrossRef] [PubMed] [Green Version]
  25. Zhai, H.J.; Feng, Z.Y.; Li, J.; Liu, X.Y.; Xiao, S.H.; Ni, Z.F.; Sun, Q.X. QTL analysis of spike morphological traits and plant height in winter wheat (Triticum aestivum L.) using a high-density SNP and SSR-based linkage map. Front. Plant. Sci. 2016, 7, 1617. [Google Scholar] [CrossRef]
  26. Liu, J.; Luo, W.; Qin, N.; Ding, P.; Zhang, H.; Yang, C.; Mu, Y.; Tang, H.; Liu, Y.; Li, W.; et al. A 55 K SNP array-based genetic map and its utilization in QTL mapping for productive tiller number in common wheat. Theor. Appl. Genet. 2018, 131, 2439–2450. [Google Scholar] [CrossRef]
  27. Galeano, C.H.; Fernandez, A.C.; Franco-Herrera, N.; Cichy, K.A.; McClean, P.E.; Vanderleyden, J.; Blair, M.W. Saturation of an intra-gene pool linkage map: Towards a unified consensus linkage map for fine mapping and synteny analysis in common bean. PLoS ONE 2011, 6, e28135. [Google Scholar] [CrossRef] [Green Version]
  28. Maccaferri, M.; Cane, M.A.; Sanguineti, M.C.; Salvi, S.; Colalongo, M.C.; Massi, A.; Clarke, F.; Knox, R.; Pozniak, C.J.; Clarke, J.M.; et al. A consensus framework map of durum wheat (Triticum durum Desf.) suitable for linkage disequilibrium analysis and genome-wide association mapping. BMC Genom. 2014, 15, 873. [Google Scholar] [CrossRef] [Green Version]
  29. Maccaferri, M.; Ricci, A.; Salvi, S.; Milner, S.G.; Noli, E.; Martelli, P.L.; Casadio, R.; Akhunov, E.; Scalabrin, S.; Vendramin, V. A high-density, SNP-based consensus map of tetraploid wheat as a bridge to integrate durum and bread wheat genomics and breeding. Plant. Biotechnol. J. 2015, 13, 648–663. [Google Scholar] [CrossRef]
  30. Marone, D.; Laido, G.; Gadaleta, A.; Colasuonno, P.; Ficco, D.B.; Giancaspro, A.; Giove, S.; Panio, G.; Russo, M.A.; De Vita, P.; et al. A high-density consensus map of A and B wheat genomes. Theor. Appl. Genet. 2012, 125, 1619–1638. [Google Scholar] [CrossRef] [Green Version]
  31. Yu, L.X.; Barbier, H.; Rouse, M.N.; Singh, S.; Singh, R.P.; Bhavani, S.; Huerta-Espino, J.; Sorrells, M.E. A consensus map for Ug99 stem rust resistance loci in wheat. Theor. Appl. Genet. 2014, 127, 1561–1581. [Google Scholar] [CrossRef] [PubMed] [Green Version]
  32. Somers, D.J.; Isaac, P.; Edwards, K. A high-density microsatellite consensus map for bread wheat (Triticum aestivum L.). Theor. Appl. Genet. 2004, 109, 1105–1114. [Google Scholar] [CrossRef] [PubMed]
  33. Chen, J.; Zhang, F.; Zhao, C.; Lv, G.; Sun, C.; Pan, Y.; Guo, X.; Chen, F. Genome-wide association study of six quality traits reveals the association of the TaRPP13L1 gene with flour colour in Chinese bread wheat. Plant. Biotechnol. J. 2019, 17, 2106–2122. [Google Scholar] [CrossRef] [PubMed] [Green Version]
  34. Turuspekov, Y.; Plieske, J.; Ganal, M.; Akhunov, E.; Abugalieva, S. Phylogenetic analysis of wheat cultivars in Kazakhstan based on the wheat 90 K single nucleotide polymorphism array. Plant. Genet. Resour. C 2017, 15, 29–35. [Google Scholar] [CrossRef]
  35. Brill, R.; Gardner, M.; Fettell, N.; Martin, P.; Haskins, B.; McMullen, G. Grain Protein Concentration of Several Commercial Wheat Varieties. 2012. Available online: https://www.agronomyaustralia.org (accessed on 5 November 2020).
  36. Millet, E.; Rong, J.K.; Qualset, C.O.; Mcguire, P.E.; Bernard, M.; Sourdille, P.; Feldman, M. Grain yield and grain protein percentage of common wheat lines with wild emmer chromosome-arm substitutions. Euphytica 2014, 195, 69–81. [Google Scholar] [CrossRef]
  37. Zhang, J.; Huang, S.; Fosu-Nyarko, J.; Dell, B.; McNeil, M.; Waters, I.; Moolhuijzen, P.; Conocono, E.; Appels, R. The genome structure of the 1-FEH genes in wheat (Triticum aestivum L.): New markers to track stem carbohydrates and grain filling QTLs in breeding. Mol. Breed. 2008, 22, 339–351. [Google Scholar] [CrossRef]
  38. Zhou, J.; Bruns, M.A.; Tiedje, J.M. DNA recovery from soils of diverse composition. Appl. Environ. Microbiol. 1996, 62, 316–322. [Google Scholar] [CrossRef] [Green Version]
  39. Meng, L.; Li, H.H.; Zhang, L.Y.; Wang, J.K. QTL IciMapping: Integrated software for genetic linkage map construction and quantitative trait locus mapping in biparental populations. Crop. J. 2015, 3, 269–283. [Google Scholar] [CrossRef] [Green Version]
  40. Wu, Y.; Bhat, P.R.; Close, T.J.; Lonardi, S. Efficient and accurate construction of genetic linkage maps from the minimum spanning tree of a graph. PLoS Genet. 2008, 4, e1000212. [Google Scholar] [CrossRef]
  41. Yap, I.V.; Schneider, D.; Kleinberg, J.; Matthews, D.; Cartinhour, S.; McCouch, S.R. A graph-theoretic approach to comparing and integrating genetic, physical and sequence-based maps. Genetics 2003, 165, 2235–2247. [Google Scholar]
  42. Oliver, J.; Blakeney, A.; Allen, H. Measurement of flour color in color space parameters. Cereal Chem 1992, 69, 546–551. [Google Scholar]
  43. Li, H.; Ribaut, J.M.; Li, Z.; Wang, J. Inclusive composite interval mapping (ICIM) for digenic epistasis of quantitative traits in biparental populations. Theor. Appl. Genet. 2008, 116, 243–260. [Google Scholar] [CrossRef] [PubMed]
  44. McCouch, S.R.; Chen, X.; Panaud, O.; Temnykh, S.; Xu, Y.; Cho, Y.G.; Huang, N.; Ishii, T.; Blair, M. Microsatellite marker development, mapping and applications in rice genetics and breeding. In Oryza: From Molecule to Plant; Springer: Berlin/Heidelberg, Germany, 1997; pp. 89–99. [Google Scholar]
  45. Akhunov, E.D.; Goodyear, A.W.; Geng, S.; Qi, L.L.; Echalier, B.; Gill, B.S.; Gustafson, J.P.; Lazo, G.; Chao, S.; Anderson, O.D.; et al. The organization and rate of evolution of wheat genomes are correlated with recombination rates along chromosome arms. Genome Res. 2003, 13, 753–763. [Google Scholar] [CrossRef] [PubMed] [Green Version]
  46. Dvorak, J.; Yang, Z.L.; You, F.M.; Luo, M.C. Deletion polymorphism in wheat chromosome regions with contrasting recombination rates. Genetics 2004, 168, 1665–1675. [Google Scholar] [CrossRef] [PubMed] [Green Version]
  47. Kohyama, N.; Chono, M.; Nakagawa, H.; Matsuo, Y.; Ono, H.; Matsunaka, H. Flavonoid compounds related to seed coat color of wheat. Biosci. Biotechnol. Biochem. 2017, 81, 2112–2118. [Google Scholar] [CrossRef] [PubMed] [Green Version]
  48. Himi, E.; Noda, K. Red grain colour gene (R) of wheat is a Myb-type transcription factor. Euphytica 2005, 143, 239–242. [Google Scholar] [CrossRef]
  49. Ma, J.; Stiller, J.; Wei, Y.; Zheng, Y.-L.; Devos, K.M.; Doležel, J.; Liu, C. Extensive pericentric rearrangements in the bread wheat (Triticum aestivum L.) genotype “Chinese Spring” revealed from chromosome shotgun sequence data. Genome Biol. Evol. 2014, 6, 3039–3048. [Google Scholar] [CrossRef]
  50. Lin, M.; Zhang, D.D.; Liu, S.B.; Zhang, G.R.; Yu, J.M.; Fritz, A.K.; Bai, G.H. Genome-wide association analysis on pre-harvest sprouting resistance and grain color in US winter wheat. BMC Genom. 2016, 17, 794. [Google Scholar] [CrossRef] [Green Version]
  51. Himi, E.; Mares, D.J.; Yanagisawa, A.; Noda, K. Effect of grain colour gene (R) on grain dormancy and sensitivity of the embryo to abscisic acid (ABA) in wheat. J. Exp. Bot. 2002, 53, 1569–1574. [Google Scholar] [CrossRef] [Green Version]
  52. Himi, E.; Nisar, A.; Noda, K. Colour genes (R and Rc) for grain and coleoptile upregulate flavonoid biosynthesis genes in wheat. Genome 2005, 48, 747–754. [Google Scholar] [CrossRef]
  53. Himi, E.; Maekawa, M.; Miura, H.; Noda, K. Development of PCR markers for Tamyb10 related to R-1, red grain color gene in wheat. Theor. Appl. Genet. 2011, 122, 1561–1576. [Google Scholar] [CrossRef] [PubMed]
  54. Kumar, A.; Kumar, J.; Singh, R.; Garg, T.; Chhuneja, P.; Balyan, H.; Gupta, P. QTL analysis for grain colour and pre-harvest sprouting in bread wheat. Plant. Sci. 2009, 177, 114–122. [Google Scholar] [CrossRef]
Figure 1. The consensus map constructed by 5643 SNP markers in two double haploid (DH) populations of Spitfire × Bethlehem-7AS (Sp7A) and Gregory × Bethlehem-7AS (G7A).
Agronomy 11 00227 g001
Figure 2. The cumulative recombination rate of the interval recombinant fractions on 21 chromosomes for the two DH populations. (A) The DH population of Sp7A; (B) The DH population of G7A; The red and blue lines represent different chromosomes.
Agronomy 11 00227 g002
Figure 3. The circos graph and the consecutive curves of collinearity among the consensus map of Sp7A_G7A, Con_map_Wang2014 and the physical map of wheat genome (IWGSC RefSeq v1.0). (A) The circos graph of collinearity among Sp7A_G7A, Con_map_Wang2014 and the physical map. (a) The chromosomes and the physical location scale of wheat; (b) Physical map of the SNP markers using in Sp7A_G7A, Con_map_Wang2014; (c) The collinearity between the consensus map of Sp7A_G7A and the physical map; (d) The consensus map of Sp7A_G7A; (e) The collinearity between Sp7A_G7A and Con_map_Wang2014; (f) The consensus map of Wang et, al. (Con_map_Wang2014); (B) The consecutive curves of collinearity between Sp7A_G7A and the physical map; (C) The consecutive curves of collinearity between Sp7A_G7A and Con_map_Wang2014.
Agronomy 11 00227 g003
Figure 4. The correlation of the three parameters brightness (L), redness (a), and yellowness (b) of seeds coat color in the two DH populations Sp7A and G7A.
Agronomy 11 00227 g004
Figure 5. QTL co-located for brightness (L), redness (a), and yellowness (b) of seeds coat color parameters on chromosome 3B in the two DH populations and multiple environments. (A) The genetic linkage map of Chr3B for Sp7A, G7A and Sp7A_G7A, the lines showed the collinearity; (B) The LOD graph of QTL mapping for Sp7A and G7A; (C) the enlarged QTL located region of seeds coat color parameters on Chr3B of Sp7A, G7A, Sp7A_G7A and the corresponding physical region; The red and cyan region is the QTL location region of seeds coat color parameters for Sp7A and G7A, respectively.
Agronomy 11 00227 g005
Table 1. Description of basic characteristics for two individual maps and the constructed consensus map.
MapSp7A aG7A bSp7A_G7A c
Chr.Marker No.Map Length (cM)Interval Length (cM) dColl 1 eColl 2 fColl 3 gMarker No.Map Length (cM)Interval Length (cM) dColl 1 eColl 2 fColl 3 gMarker No.Map Length (cM)Interval Length (cM) dColl 1 eColl 2 fColl 3 g
1A148121.420.820.9510.9890.933164218.691.330.9960.9780.968299220.960.740.9710.9820.955
1B185132.900.720.9470.9970.943127134.231.060.9050.9230.801309136.510.440.9110.9540.896
1D2789.833.330.8940.9950.90265151.092.320.9320.9830.93389157.951.770.9370.9900.936
2A93122.131.310.8900.9990.893181273.221.510.9080.9530.884256262.651.030.8910.9640.886
2B218155.920.720.8820.9950.885341242.900.710.8770.9520.890537243.320.450.8780.9670.889
2D39143.013.670.8410.9780.85687244.122.810.7340.9600.696121241.582.000.7750.9600.751
3A165153.970.930.9141.0000.909191197.281.030.9640.9650.951325193.090.590.9450.9800.940
3B173146.160.840.9510.9770.922279225.960.810.9090.9040.904427251.990.590.9240.9320.910
3D1685.945.370.5880.9970.58287132.021.520.6730.5000.573101141.671.400.7280.5090.555
4A71155.412.190.9701.0000.969282249.150.880.8610.9170.786339244.360.720.8800.9330.818
4B7898.001.260.9770.9950.97895120.401.270.9960.9830.988164116.390.710.9870.9850.982
4D1693.915.870.9820.9790.99143146.033.400.8620.9200.87354145.172.690.8710.9330.884
5A233186.920.800.9451.0000.945182247.141.360.9780.9610.962387244.580.630.9600.9890.957
5B213134.290.630.9360.9790.914225235.871.050.9170.9670.901422232.680.550.9220.9710.904
5D37179.874.860.5340.4230.84339256.646.580.7090.9900.74574258.213.490.6790.8200.822
6A100123.921.240.9891.0000.990195223.791.150.8910.9260.878277220.120.790.9210.9550.918
6B118120.871.020.9110.9770.883226166.000.730.9310.8780.943333162.660.490.9270.9040.922
6D32182.405.700.3690.1740.91546188.294.090.1070.1510.93675186.972.490.1900.1480.933
7A233161.340.690.8591.0000.859376248.200.660.8150.9550.772574244.780.430.8240.9690.794
7B147135.420.920.9080.9980.909242183.680.760.9220.9680.910377176.790.470.9250.9740.916
7D25114.554.580.4520.9900.44782297.223.620.8470.9990.852103294.272.860.7500.9950.745
Genome
A10431025.110.980.9310.9980.92815711657.471.060.9160.9510.88624571630.540.660.9130.9670.8954
B1132923.560.820.9310.9880.91915351309.040.850.9230.9390.90525691320.340.510.9250.9550.9171
D192889.514.630.6660.7910.7914491415.413.150.6950.7860.8016171425.822.310.7040.7650.8037
Whole23672838.181.200.8420.9260.87935554381.921.230.8440.8920.86456434376.700.780.8470.8960.872
a the linkage map of Spitfire × Bethlehem-7AS (Sp7A); b the linkage map of Gregory × Bethlehem-7AS (G7A); c the consensus map of this study (Sp7A_G7A); d Average interval length (cM); e The Collinearity between the linkage map of this study and the consensus map of Wang et al. [24] (Con_map_Wang2014); f The Collinearity between the linkage map of this study and the physical map of wheat genome (IWGSC RefSeq v1.0.); g The Collinearity between the Con_map_Wang2014 and the physical map of wheat genome (IWGSC RefSeq v1.0.).
Table 2. Phenotypic characteristics of three parameters brightness (L), redness (a), and yellowness (b) for seed coat color in all the two DH populations and their parents.
DH Populations aTrials bTraits cParentsDH LinesH2 (%) h
P1 (%) dP2 (%) eMean (%)SD fCV (%) gMin (%)Max (%)
Sp7ASp7A_WCIE-L53.6047.1351.122.725.3245.7056.2093.82
CIE-a5.007.906.231.2019.294.108.0096.62
CIE-b19.6017.4318.361.337.2315.3021.4092.57
Sp7A_KCIE-L54.8048.8351.592.745.3145.2057.2093.43
CIE-a4.657.306.041.1819.443.608.6095.01
CIE-b20.5517.3518.841.447.6715.6022.7091.33
Sp7A_GHCIE-L 49.453.396.8643.2059.90
CIE-a 6.721.2418.414.509.50
CIE-b 17.601.9310.9513.9024.70
G7AG7A-WCIE-L57.2047.1352.162.905.5645.6057.6094.26
CIE-a5.307.906.111.4022.913.608.6096.07
CIE-b22.6017.4319.231.457.5415.9023.0593.34
G7A_MCIE-L 49.842.164.3344.2054.60
CIE-a 6.640.6810.245.408.20
CIE-b 19.711.326.7017.0023.00
a DH population: Sp7A, Spitfire × Bethlehem-7AS, G7A, Gregory × Bethlehem-7AS; b The DH population and the trials, Sp7A_W, Sp7A population at Wongan Hills (2017), Sp7A_K, Sp7A population at Katanning (2017), Sp7A_GH, Sp7A population at glasshouse at Murdoch university (2017), G7A_W, G7A population at Wongan Hills (2017), G7A_M, G7A population at Manjimup (2018); c The three parameters L, a and b of the seed coat color measured by SeedCount SC6000R analyser; d P1, the female of the DH population, for Sp7A, P1 is Spitfire, for G7A, P1 is Gregory; e P2, the male of the DH population, Sp7A and G7A share the same P2, Bethlehem-7AS; f Standard deviation; g Coefficient of variation (CV); h Broad-sense heritability (H2).
Table 3. Quantitative trait locus (QTL) detected for brightness (L), redness (a), and yellowness (b) of seeds coat color parameters in the two DH populations and multiple environments.
QTLChr.Left MarkerRight MarkerSp7A (cM) aG7A (cM) bSp7A_G7A (cM) cPhysic (Mbp) dTrials eLODPVE (%) fAdd
qCIE-a-2B-12B2B_IWB728422B_IWB3605 6385.565.11–65.32G7A_W14.213.10.26
qCIE-a-2B-22B2B_IWB256632B_IWB36919 7396.565.47–91.84G7A_WP5.473.10.25
2B2B_IWB256632B_IWB36919 75102.5565.47–91.84G7A_W24.332.40.22
qCIE-a-3A-13A3A_IWB280283A_IWB73101 118114.23699.69–686.78G7A_W23.541.9−0.20
qCIE-a-3B-13B3B_IWB217713B_IWB7147859 65.3378.6–71.8Sp7A_KP4.224.2−0.21
3B3B_IWA59603B_IWB6601160 66.37114.72–112.27Sp7A_W25.114.5−0.24
3B3B_IWA59603B_IWB6601160 66.37114.72–112.27Sp7A_WP6.045.5−0.25
3B3B_IWB218463B_IWA588061 75.95237.34–190.47Sp7A_K147.5950.2−1.21
qCIE-a-3B-23B3B_IWB70613B_IWB7478797 159.81745.73–750.14Sp7A_K137.6930.0−0.92
3B3B_IWB70613B_IWB7478797 159.81745.73–750.14Sp7A_GH53.5075.9−1.09
3B3B_IWB70613B_IWB7478797 159.81745.73–750.14Sp7A_W134.3973.5−1.03
3B3B_IWB70613B_IWB7478797 159.81745.73–750.14Sp7A_K235.0980.5−1.07
3B3B_IWB70613B_IWB7478797 159.81745.73–750.14Sp7A_W239.9079.6−1.00
3B3B_IWB70613B_IWB7478797 159.81745.73–750.14Sp7A_KP36.7478.6−0.91
3B3B_IWB70613B_IWB7478797 159.81745.73–750.14Sp7A_WP39.5377.0−0.93
3B3B_IWB497153B_IWB50512 152156.29744.58–744.42G7A_M14.8457.6−0.51
3B3B_IWB81283B_IWB23680 155159.29750.14–756.71G7A_W253.9983.9−1.32
3B3B_IWB236803B_IWB30522 156160.28756.71–760.14G7A_W143.0777.7−1.29
3B3B_IWB236803B_IWB30522 156160.28756.71–760.14G7A_WP53.9284.1−1.29
qCIE-a-4B-14B4B_IWB556674B_IWB4526177 81.11645.3–651.99Sp7A_GH3.192.0−0.18
qCIE-b-3B-13B3B_IWB70613B_IWB7478797 159.81745.73–750.14Sp7A_K118.4954.81.05
3B3B_IWB70613B_IWB7478797 159.81745.73–750.14Sp7A_W122.8519.81.02
3B3B_IWB70613B_IWB7478797 159.81745.73–750.14Sp7A_K216.8754.61.04
3B3B_IWB70613B_IWB7478797 159.81745.73–750.14Sp7A_W223.1162.81.02
3B3B_IWB70613B_IWB7478797 159.81745.73–750.14Sp7A_KP21.5359.51.09
3B3B_IWB70613B_IWB7478797 159.81745.73–750.14Sp7A_WP24.0263.61.02
3B3B_IWB486813B_IWB909599 163.87755.32–760.58Sp7A_GH7.0514.50.79
3B3B_IWB313243B_IWB34252 143147.39744.22–696.24G7A_M20.7758.71.18
3B3B_IWB81283B_IWB23680 155159.29750.14–756.71G7A_W125.8063.41.17
3B3B_IWB81283B_IWB23680 155159.29750.14–756.71G7A_W226.2664.11.19
3B3B_IWB81283B_IWB23680 155159.29750.14–756.71G7A_WP29.2668.01.18
qCIE-b-4B-14B4B_IWA38744B_IWB3441353 57.1506.15–527.3Sp7A_W134.5639.3−1.44
qCIE-b-4D-14D4D_IWB551854D_IWA46571 77.48379.24–438.26Sp7A_GH5.6411.30.70
qCIE-L-1D-11D1D_IWB650701D_IWB10914 353610.43–11.66G7A_W26.004.70.67
1D1D_IWB650701D_IWB10914 353610.43–11.66G7A_WP4.633.70.57
qCIE-L-2B-12B2B_IWB92002B_IWB7238047 61.1554.55–58.33Sp7A_WP3.714.1−0.54
qCIE-L-2B-22B2B_IWB256632B_IWB36919 7676.5165.47–91.84G7A_WP4.213.6−0.57
2B2B_IWB369192B_IWB70041 7880.1891.84–91.26G7A_W23.732.7−0.51
qCIE-L-3B-13B3B_IWB370063B_IWA342650 56.1248.89–52.73Sp7A_K13.615.70.59
3B3B_IWB370063B_IWA342650 56.1248.89–52.73Sp7A_KP4.305.40.58
qCIE-L-3B-23B3B_IWB70613B_IWB7478797 159.81745.73–750.14Sp7A_K124.2663.11.94
3B3B_IWB70613B_IWB7478797 159.81745.73–750.14Sp7A_GH20.7241.02.17
3B3B_IWB70613B_IWB7478797 159.81745.73–750.14Sp7A_W122.2759.62.01
3B3B_IWB70613B_IWB7478797 159.81745.73–750.14Sp7A_K226.3571.52.37
3B3B_IWB70613B_IWB7478797 159.81745.73–750.14Sp7A_W236.1272.32.51
3B3B_IWB70613B_IWB7478797 159.81745.73–750.14Sp7A_KP29.6668.12.05
3B3B_IWB70613B_IWB7478797 159.81745.73–750.14Sp7A_WP32.9571.72.25
3B3B_IWB342523B_IWB23127 145149.39696.24–752.09G7A_M7.7135.91.28
3B3B_IWB81283B_IWB23680 155159.29750.14–756.71G7A_W241.6070.72.62
3B3B_IWB81283B_IWB23680 155159.29750.14–756.71G7A_WP40.1270.72.51
3B3B_IWB236803B_IWB30522 156160.28756.71–760.14G7A_W126.8564.92.36
qCIE-L-4D-14D4D_IWA74274D_IWB5518570 73.99359.64–379.24Sp7A_GH3.685.40.79
qCIE-L-7A-17A7A_IWB257577A_IWB299873 124.52199.01–147.07Sp7A_GH4.386.50.87
qCIE-L-7B-17B7B_IWB120147B_IWB9796 163156.54708.95–712.74G7A_W24.393.2−0.56
a The genetic position of the QTLs detected on the linkage map of Spitfire × Bethlehem-7AS (Sp7A); b The genetic position of the QTLs detected on the linkage map of Gregory × Bethlehem-7AS (G7A); c The collinear genetic position of the detected QTLs for the two population on the consensus map constructed by the linkage map of Sp7A and G7A (Sp7A_G7A); d The corresponding physical region of the detected QTLs for the two population on the physical map of wheat genome (IWGSC RefSeq v1.0); e The DH population and the trials, Sp7A_W, Sp7A population at Wongan Hills (2017), Sp7A_K, Sp7A population at Katanning (2017), Sp7A_GH, Sp7A population at glasshouse at Murdoch university (2017), G7A_W, G7A population at Wongan Hills (2017), G7A_M, G7A population at Manjimup (2018), the “1, 2, P” behind the trials means the replicate 1, replicate 2 and the mean of the two replicates; f The Proportion of phenotypic variation explained by QTL.
Publisher’s Note: MDPI stays neutral with regard to jurisdictional claims in published maps and institutional affiliations.

