Article

Root Fungal Endophytes and Microbial Extracellular Enzyme Activities Show Patterned Responses in Tall Fescues under Drought Conditions

1
USDA-ARS, U.S. Dairy Forage Research Center, 1925 Linden Dr., Madison, WI 53706, USA
2
School of Integrative Plant Science, Cornell University, 135 Plant Science, Ithaca, NY 14850, USA
3
Department of Entomology, Cornell University, AgriTech, Geneva, NY 14456, USA
*
Author to whom correspondence should be addressed.
Agronomy 2020, 10(8), 1076; https://doi.org/10.3390/agronomy10081076
Submission received: 19 June 2020 / Revised: 17 July 2020 / Accepted: 23 July 2020 / Published: 26 July 2020
(This article belongs to the Special Issue Drivers of Microbial Diversity and Roles in Agroecosystems)

Abstract

:
Plant response to water stress can be modified by the rhizosphere microbial community, but the range of responses across plant genotypes is unclear. We imposed drought conditions on 116 Festuca arundinacea (tall fescue) accessions using a rainout shelter for 46 days, followed by irrigation, to stimulate drought recovery in 24 days. We hypothesized that prolonged water deficit results in a range of phenotypic diversity (i.e., green color index) across tall fescue genotypes that are associated with distinct microbial taxonomic and functional traits impacting plant drought tolerance. Microbial extracellular enzyme activities of chitinase and phenol oxidase (targeting chitin and lignin) increased in rhizospheres of the 20 most drought tolerant genotypes. Lower rates of fungal (dark septate) endophyte root infection were found in roots of the most drought tolerant genotypes. Bacterial 16S rRNA gene and fungal ITS sequencing showed shifts in microbial communities across water deficit conditions prior to drought, during drought, and at drought recovery, but was not patterned by drought tolerance levels of the plant host. The results suggest that taxonomic information from bacterial 16S rRNA gene and fungal ITS sequences provided little indication of microbial composition impacting drought tolerance of the host plant, but instead, microbial extracellular enzyme activities and root fungal infection results revealed patterned responses from drought.

1. Introduction

Microbiome influence on plant growth and development is a growing area of active research. Previous articles have demonstrated a role for the microbiome in drought tolerance [1,2]. However, identifying specific shifts in the soil microbial community across plant genotypes is a challenge. Plant genotype effects on microbial community composition are often obscured by the large shifts provoked by environmental conditions [3,4,5,6].
Tall fescue is a grass species that readily associates with fungal endophytes, including mycorrhizal and dark septate fungi, and is of high economic and environmental value for its potential to withstand climate change impacts [7]. The interest in tall fescue as a drought tolerant turf and forage species has led to the production of many cultivated genotypes (Bonos et al., 2004; Karcher et al., 2008), and a large body of research that characterizes physiological [8], nutritional [9], and symbiotic [10,11,12] aspects of drought tolerance. These traits makes tall fescue an ideal model for investigations of soil microbial shifts corresponding to drought tolerance.
Although foliar endophytes of tall fescue have been well studied, there is considerably little known about the contributions of root fungal endophytes or the soil microbial community to drought tolerance responses. In particular, investigations of dark septate fungal endophytes (DSE) in tall fescue are lacking. DSE have been shown to be comparable to mycorrhizal fungi in terms of abundance and function, and there is evidence of DSE modification of mycorrhizal fungi growth [13,14,15,16]. DSE are presented in this study as an indicator of the endophytic portion of the eukaryotic microbial community.
Profiling of the bacterial and fungal rhizosphere communities, in relation to drought, could help elucidate rhizosphere microbiome mediation of drought tolerance among tall fescue genotypes. Identifying patterns of microbial community structure and function specific to grass genotype tolerance to drought would support the development of microbial community phenotyping as a selection trait in plant breeding programs. This, in turn, may provide a means to help reinforce the expression of desirable plant traits that include drought tolerance, among others [17]. Microbial components of plant systems provide an additional target for addressing the challenges posed by climate change and food production [18,19,20,21]. Tall fescue specifically, as a drought tolerant turf and forage grass, is well-suited to addressing these challenges.
In this study, we grouped genotypes by their performance in a functional category (drought tolerance) to investigate the role of the microbial community in population-level variation of that trait. This experiment examines 116 tall fescue genotypes planted in a sandy loam under simulated drought. Genotypes were categorized as low-, medium-, or high-tolerance in response to the drought, based on a common turf quality breeding selection trait—Dark green color index (DGCI). Plant drought tolerance, bacterial and fungal community composition, and potential extracellular enzyme activity were assessed at pre-drought, during peak drought, and post-drought recovery, with the goal of identifying key shifts in microbial traits corresponding to drought tolerance. Dark septate endophyte infection rates were measured at the start of the study. We hypothesized that rhizosphere microbial structure and function shift across different levels of drought tolerance in tall fescue, upon undergoing drought conditions and recovery from drought. Specifically, we expected that the more drought tolerant genotypes would show the enrichment of a set of microbial taxa in the rhizosphere corresponding with greater root endophyte presence and the enhanced production of extracellular enzymes relevant to nitrogen and phosphorus mineralization.

2. Materials and Methods

2.1. Design and Field Conditions

A total of 116 genotypes of tall fescue were established into unreplicated 1 m2 plots of Arkport sandy loam soil randomly arranged at the Cornell University Bluegrass Lane field research site in Ithaca, NY (42.4570° N, 76.4685° W) in a layout observing the National Turfgrass Evaluation Program guidelines. Individual plots were separated from one another by 1″ thick wooden boards to a depth of 1 m. Plots were broadcast seeded at a rate sufficient to create a full canopy in each plot. Following establishment, tall fescue stands received no irrigation. Applied fertilizer corresponded to 151–270 lbs/acre phosphorous, 151–240 lbs/acre potassium, and 1.1–2.0 lbs/1000 sq ft nitrogen for the period from 2012 until 2014. Plants were mowed to a height of approximately 7.6 cm when height exceeded 11.4 cm. Drought conditions were based on [22]. To initiate the simulated drought period, the experimental area was saturated with 2.5 cm of irrigation per day for three consecutive days to create uniformly wet conditions. A moveable rainout shelter was used to exclude rainwater from plots while still allowing light penetration (Supplemental Figure S1). This shelter was deployed over plots during rain events and withdrawn under dry conditions to prevent excessively high temperatures beneath the shelter. Drought was imposed on the plots in July 2014 and ended 15 days after the first genotype was less than 20% green by area (peak drought), which was 46 days after the start of the drought. Following the drought, a recovery period was initiated whereby the plots received a single dose of 5 cm irrigation to stimulate drought recovery and 2.5 cm of irrigation per week thereafter until the study’s conclusion, which was 26 days later.

2.2. Field Measurements and Sampling

This study was designed to test for differences in microbial community structure and function across drought tolerance groups, not between individual genotypes. All measures within plots are taken in triplicate at different locations and averaged unless otherwise specified.
Digital photographs were taken with a lightbox and camera at the start of drought, peak drought, and weekly during recovery. These photographs were analyzed for percent dark green color index (DGCI) with Sigmascan Pro (Systat Software, San Jose, CA, USA) [23,24]. Volumetric water content of the soil was taken with a Field Scout TDR 300 moisture probe (Spectrum Technologies, Inc., Aurora, IL, USA). Soil samples were obtained for downstream analysis at the start of the experiment, at peak drought, and at the end of the recovery period with a 2.5 cm soil sampling probe. Two 10 cm-long cores were obtained from each plot, above ground biomass was removed, and the cores were homogenized and stored at −20 °C.

2.3. Fungal Endophyte Quantification

The full root systems from each soil core were carefully washed under running water to remove soil particles and then placed into the 1-mm pore Biopsy cassettes (Tissue Tek®, Electron Microscopy Sciences, Hatfield, PA, USA). Root samples were stained using the ink-vinegar method [25]. Briefly, roots were cleared in 20% (w/v) KOH at room temperature for 40 min. They were then washed with water and transferred to distilled white vinegar (5% acetic acid) for at least 3 h to ensure they were adequately acidified for staining. Acidified roots were transferred to 5% ink-vinegar solution (Parker Quink Permanent black-blue ink: distilled white vinegar in the ratio of 95:5) to stain for 30 min and then dipped for 1 s into 0.5% KOH to remove excess staining. A total of 15 to 20 stained roots per sample were mounted on slides with PVLG (a mixture of 100 mL lactic acid, 100 mL water, 10 mL glycerol and 16 g polyvinyl alcohol powder). Each slide was scanned methodically at 200× magnification and increased to 400× magnification at a minimum of 150 intersections per sample. The following fungal structures indicative of DSE infection were recorded: (1) fungal hyphae with frequent septa and melanized walls, and (2) microsclerotia consisting of clusters of melanized circular or elliptical cells. DSE infection rate was quantified as the percentage of observations with DSE structures [26].

2.4. Potential Soil Extracellular Enzyme Activity

Potential soil extracellular enzyme activity was used as a measurement for microbial function in substrate depolymerization. However for phosphatase activity, the measurements capture both the potential microbial and plant root secretions. The enzymes assayed included N-acetyl glucosaminidase (NAG), leucine aminopeptidase (LAP), acid phosphatase (AP), beta-glucosidase (BGC), and phenol oxidase (PO). Many extracellular enzymes play important roles in depolymerizing organic matter and facilitating microbial access to carbon and nitrogen, or solubilizing phosphorus for direct biological uptake [27]. The enzymes, N-acetyl glucosaminidase (chitinase), leucine aminopeptidase, acid phosphatase, and beta-glucosidase were measured by fluorometric quantification and phenol oxidase was quantified by absorption. We used 4-methylumbelliferone- and 7-amino-4-methylcoumarin-labeled substrates (200 µM), and L-3,4-dihydroxyphenylalanine (25 mM) substrate to provide quantifiable fluorescence, and color for the quantification of oxidation [28,29]. Soil slurries were prepared from 5 g fresh soil in 150 mL sodium bicarbonate buffer (50 mM, pH 7) and homogenized with an immersion blender for 1 min. Hydrolytic enzyme assays were conducted in black 96-well microplates with 4 technical replicates per sample and oxidative assays were carried out in transparent-bottom 96-well microplates with 5 technical replicates per sample. Standard curves were made for each soil sample (soil slurry+4-methylumbelliferone or 7-amino-4-methylcoumarin standard of 0, 2.5, 5, 10, 25, 50 µM). A 200 µL volume of soil slurry and 50 µL of 4-methylumbelliferone or 7-amino-4-methylcoumarin standards were added into wells of standard plate, and 200 µL of soil slurry and 50 µL of the labeled substrate into wells of substrate plate. Plates were incubated in the dark at 25 °C for 3 h and fluorescence was measured immediately after removal from the incubator with a BioTek Synergy HT microplate reader (BioTek Industries, Inc., Winooski, VT, USA) (ex: 365 nm, em: 450 nm). The oxidative enzyme plate contained a buffer blank (250 µL buffer), a L-3,4-dihydroxyphenylalanine blank (200 µL buffer + 50 µL L-3,4-dihydroxyphenylalanine), sample blank (200 µL slurry + 50 µL buffer) and the sample wells (200 µL slurry + 50 µL L-3,4-dihydroxyphenylalanine). Oxidative plates were incubated in the dark at 25 °C for 3 h and absorbance was measured at 460 nm with the BioTek microplate reader. Potential activities were calculated from equations based on previous work [28,30].

2.5. Microbiome 16S rRNA and ITS Gene Sequencing

Soil DNA was extracted in duplicate from frozen samples using the PowerSoil DNA Isolation Kit (MO BIO Laboratories, Inc., Carlsbad, CA, USA). Approximately 0.15 g of soil from each sample was used for isolation of soil DNA. Duplicates were pooled and quantification was performed with the standard dsDNA quantification protocol for Picogreen (Thermo Fisher Scientific, Inc., Waltham, MA, USA). All pipetting for DNA extraction was conducted with an Eppendorf epMotion 5075 pipetting robot (Eppendorf AG, Hamburg, Germany). We amplified 16S rRNA gene sequences in duplicate from the extracted DNA. We used PCR primers targeting 16S rRNA gene variable region 4 (515F/806R) for downstream paired-end Illumina barcoded sequencing [31]. Amplicons were quantified with Picogreen and 200 ng of each sample were pooled and purified with the desalting protocol of the Qiagen Qia Quick spin filter purification kit (QIAGEN Inc., Valencia, CA, USA). For internal transcribed spacer (ITS) amplifications, we used the primers ITS1F (5′-CTTGGTCATTTAGAGGAAGTAA-3′) and 58A2R (5′-CTGCGTTCTTCATCGAT-3′) with the required adaptors attached as described above [32,33]. Reactions occurred in 20 µL volumes, using 8 µL of 5 PRIME HotMasterMix (5 PRIME Inc., Gaithersburg, MD, USA), 0.5 µL of each primer from 10 µM solutions, and 1 µL DMSO. PCR cycling conditions for ITS amplifications were as follows: 94 °C for 3 min; 35 cycles of 94 °C for 20 s, 45 °C for 30 s and 72 °C for 45 s; with a final elongation at 72 °C for 5 min. Amplicon pool was submitted to the Cornell Life Sciences Sequencing Core with custom sequencing primers [31].

2.6. Sequence Data Processing

For 16S rRNA gene sequence analysis, reads were truncated at the first low-quality base and quality filtered to remove those with an average quality score below 25, fewer than 200 nt, ambiguous bases, primer mismatches, erroneous barcodes, and homopolymer runs exceeding six bases. Paired-end 16S reads were joined and then demultiplexed within the QIIME software package (Qiime.org) [34]. Paired-end ITS sequences were demultiplexed and joined in the “dada2” package [35]. Quality filtering of all joined sequences was conducted in “dada2” using default parameters. A sequence table of single nucleotide variants (SNV) was compiled from reads and taxonomy was assigned to all reads using 16S (RDP) and ITS (UNITE) training sets by the rdp classifier within the “phyloseq” package [36,37]. Sequences matching phiX, plant chloroplast, or mitochondrial 16S rRNA were filtered from the dataset.

2.7. Statistics

Drought tolerance groups were established by assigning a score of 1 or −1 to the samples falling within the upper and lower quartile of dark green color index (DGCI) values. All others received a score of 0. This was done on three distributions: DGCI at peak drought, DGCI weekly increase during recovery, and DGCI at the end of recovery. These three scores were then summed to create a 7-point (−3 to +3) scoring system for relative drought tolerance in our experimental system. Scores of −3 and −2 were categorized as low tolerance, −1, 0, and 1 were categorized as medium tolerance, and 2 and 3 were categorized as high tolerance (Supplementary Figure S2). All statistical analyses were conducted in R v3.2 [38]. Analysis of variance (ANOVA) and repeated-measures were performed with the “aov” function. Significance between groups was determined by Tukey HSD at an α-level of 0.05 and visualized with package “multcompView”. Beta diversity measures (between-sample diversity) were computed in the “phyloseq” package from weighted UniFrac distances to elucidate abundance of taxa. The resulting distance matrix was used to create principal coordinates plots [39,40]. Differential abundance by log2-fold-change and significance of taxa shifts were computed using the “DESeq2” package [41]. The DESeq2 inputs for drought tolerance associated shifts were samples of the high- or low- tolerance group compared to the medium-tolerance group to identify taxa shifts associated with an increase or decrease in drought tolerance from the experimental population mean. The DESeq2 inputs for experiment phase associated shifts were Initial samples compared to each Drought and Recovery samples. Regression-based analysis of microbiome association with enzyme activity was done in the “OMiAT” R package [42]. All plots were created with R package ggplot2 or ggtern for ternary plots. Venn diagrams were created with the Bioinformatics & Evolutionary Genomics Venn diagram tool at http://bioinformatics.psb.ugent.be/webtools/Venn/.

3. Results

3.1. Drought Tolerance Groups

Plants exhibited sufficient variation in drought tolerance, as determined by DGCI, to establish low-, medium-, and high-tolerance groups. Volumetric water content at peak drought was used to identify plots that received water during the drought through edge effects or rainout shelter leaks. After elimination by water content (>9% VWC), there were 112 genotypes remaining from an initial set of 116, with the high-tolerance group containing 20 genotypes, the low-tolerance group containing 26 genotypes, and the medium tolerance group containing the remaining 66.

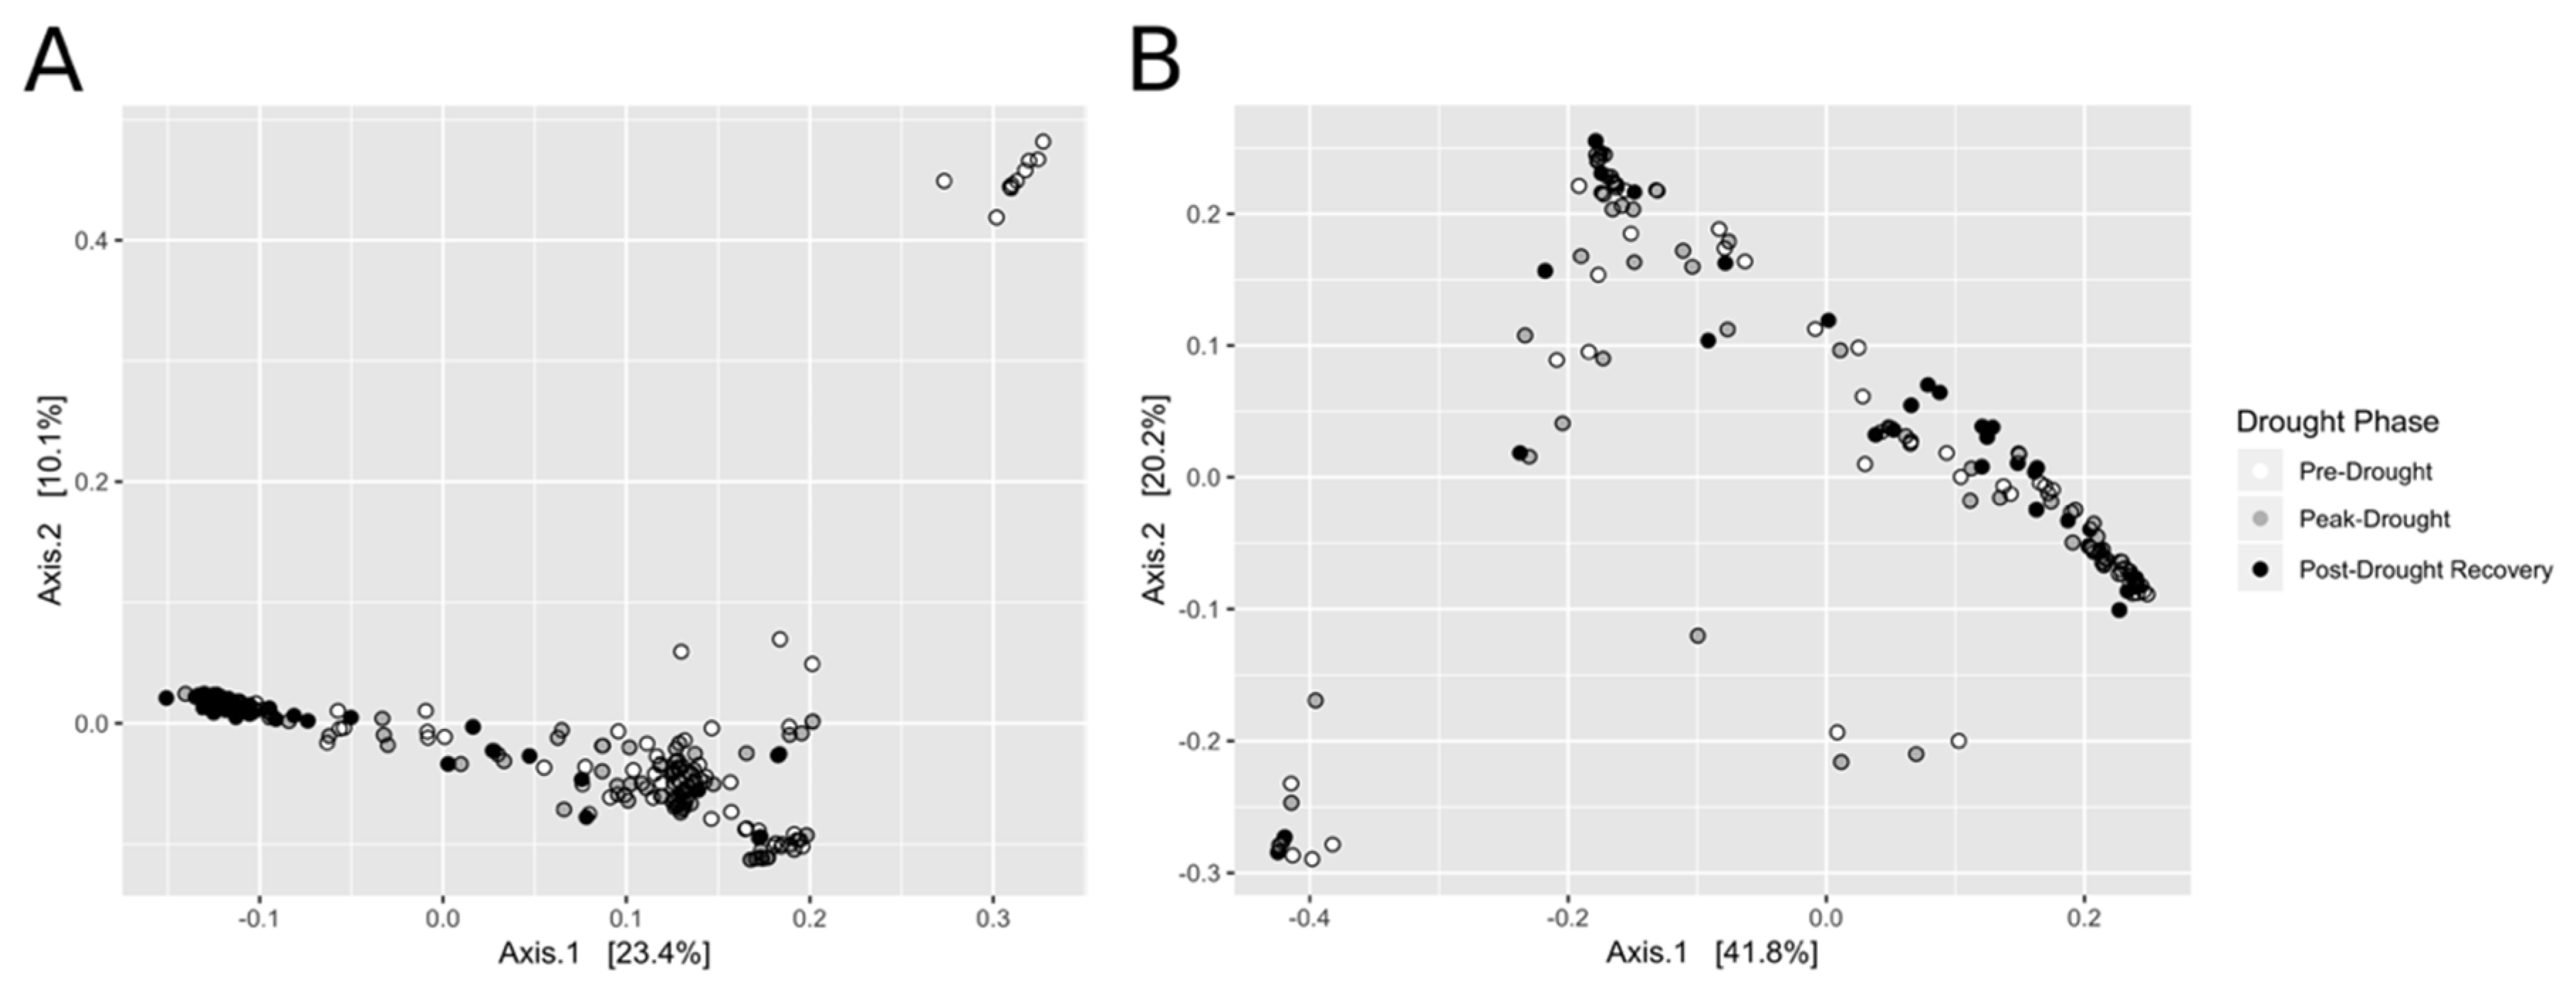
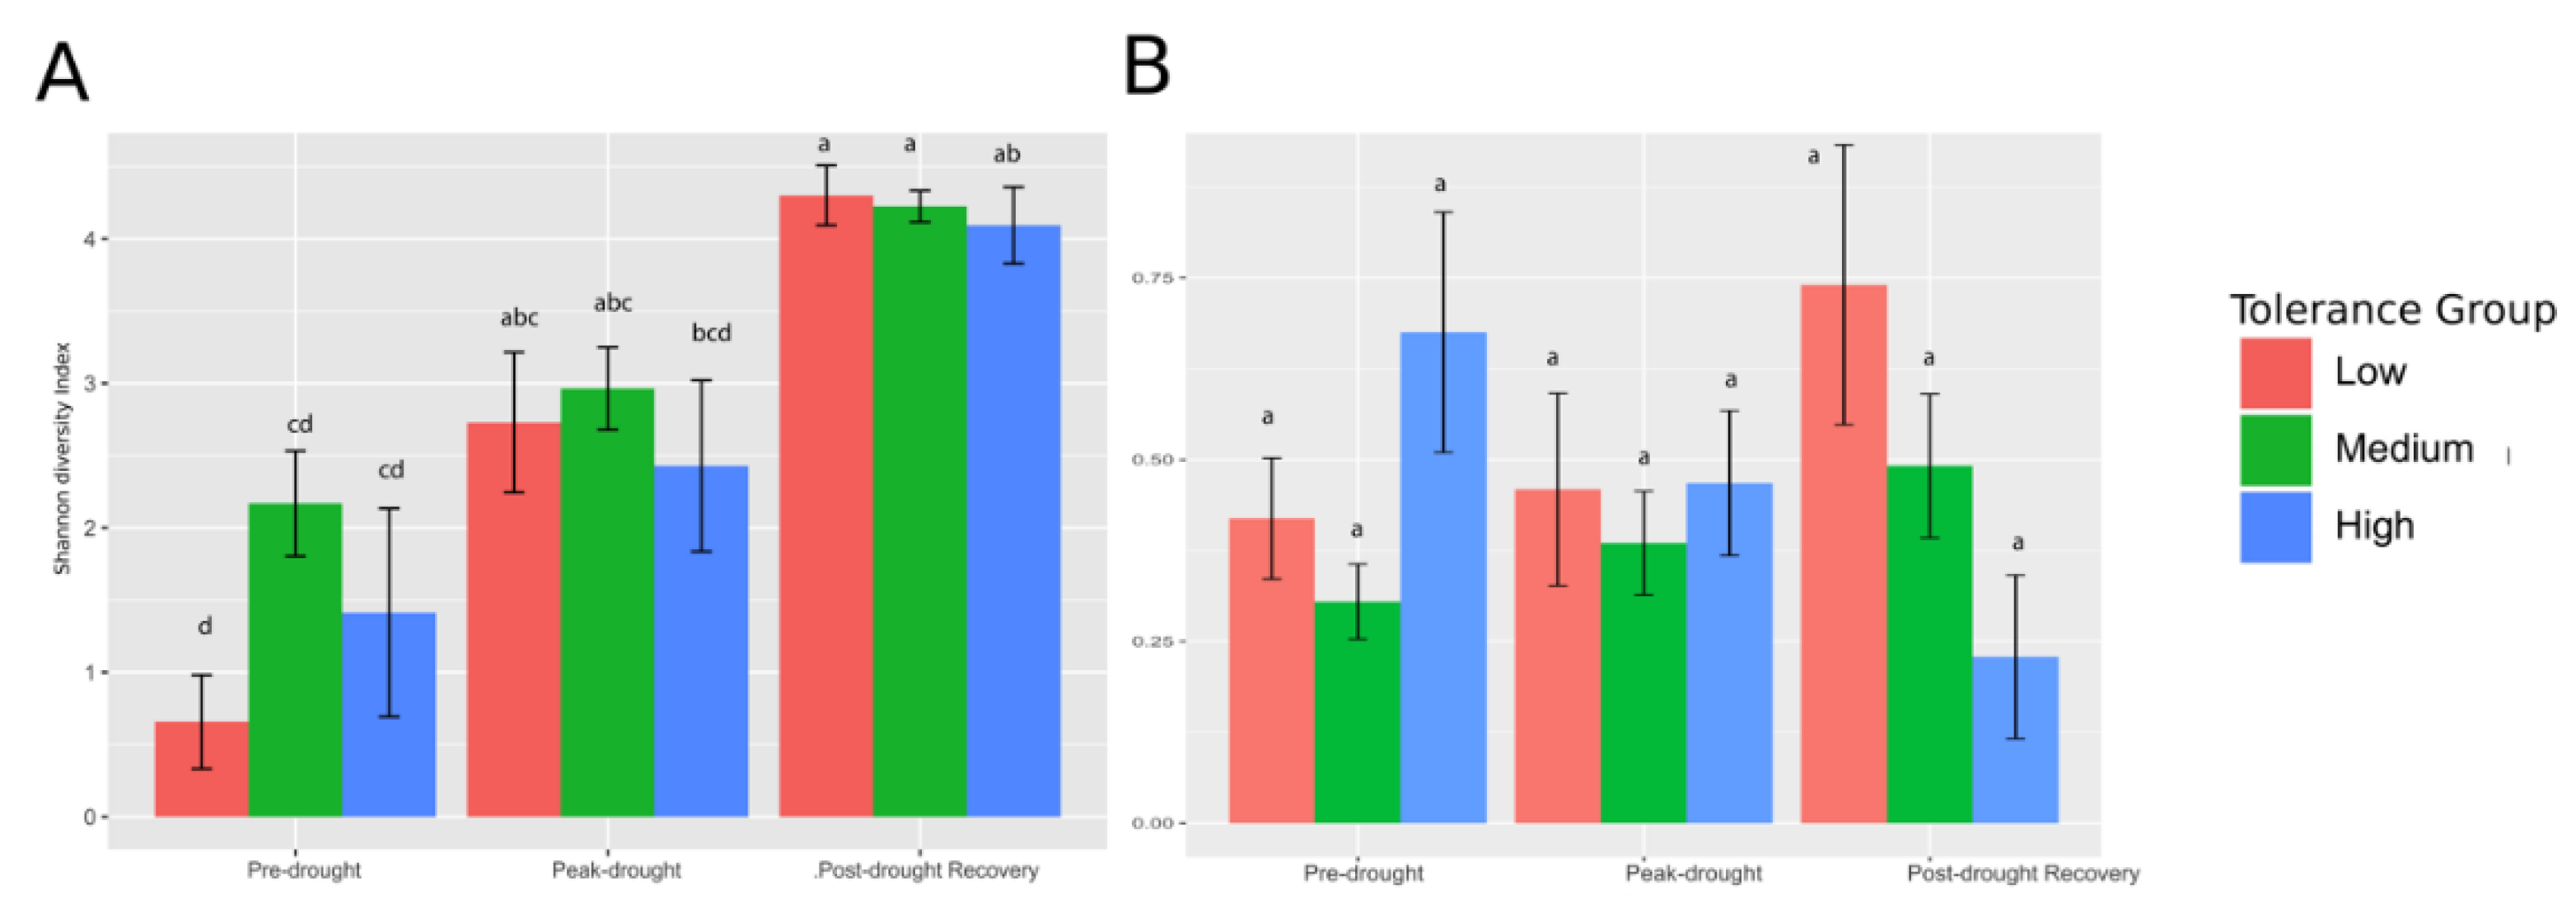
3.2. Bacterial (16S rRNA Gene) and Fungal (ITS) Sequencing

Soil microbial community analysis revealed strong, but inconsistent, effects of drought phase (pre-drought, peak drought, and post-drought recovery) on community composition, as shown by principal coordinates analysis (PCoA) generated from weighted UniFrac distances (Figure 1). However, there were no discernable differences in bacterial or fungal composition when distinguished by drought tolerance groups (Supplemental Figure S3). PERMANOVA of beta dispersion indicated a significant (p < 0.001) difference in UniFrac distance for drought phase, but not for drought tolerance (p = 0.77). The same pattern holds true in fungi with significant differences between drought phases (p < 0.001), but not between tolerance groups (p = 0.31) [43]. There is greater variability in samples during the pre-drought and peak drought stages, but a convergence of the overall bacterial OTU fingerprint of the different drought tolerance genotypes upon post-drought recovery, as indicated by the solid black circles on the PCoA plots (Figure 1A). Fungal patterns were similar, but with a reduced convergence of recovery samples (Figure 1B). The similarity in community structure between drought tolerance levels is supported by DESeq2 analysis of differential abundance. No bacterial or fungal taxa significantly differed in abundance between drought tolerance groups after correcting for multiple comparisons.
Higher resolution taxonomic analysis of the drought tolerance groups revealed 68 bacterial OTUs unique to the high tolerance group and none unique to the low tolerance group, with 309 OTUs shared between the groups, as shown in the Venn diagram (Supplemental Figure S4). In contrast, the fungal OTUs showed only five OTUs unique to the high tolerance group, nine in the low tolerance group, and 10 OTUs shared in both the low and high drought tolerance groups. The full list of OTUs unique to the high and low tolerance groups is provided in Supplemental Table S1.
Bacterial diversity increased overall upon drought recovery across all drought tolerance levels, as seen using Shannon’s diversity index (Figure 2A). Fungal diversity did not differ significantly across drought conditions, but did display a numerical decrease in diversity in the high tolerance group in response to drought and recovery from drought (Figure 2B).

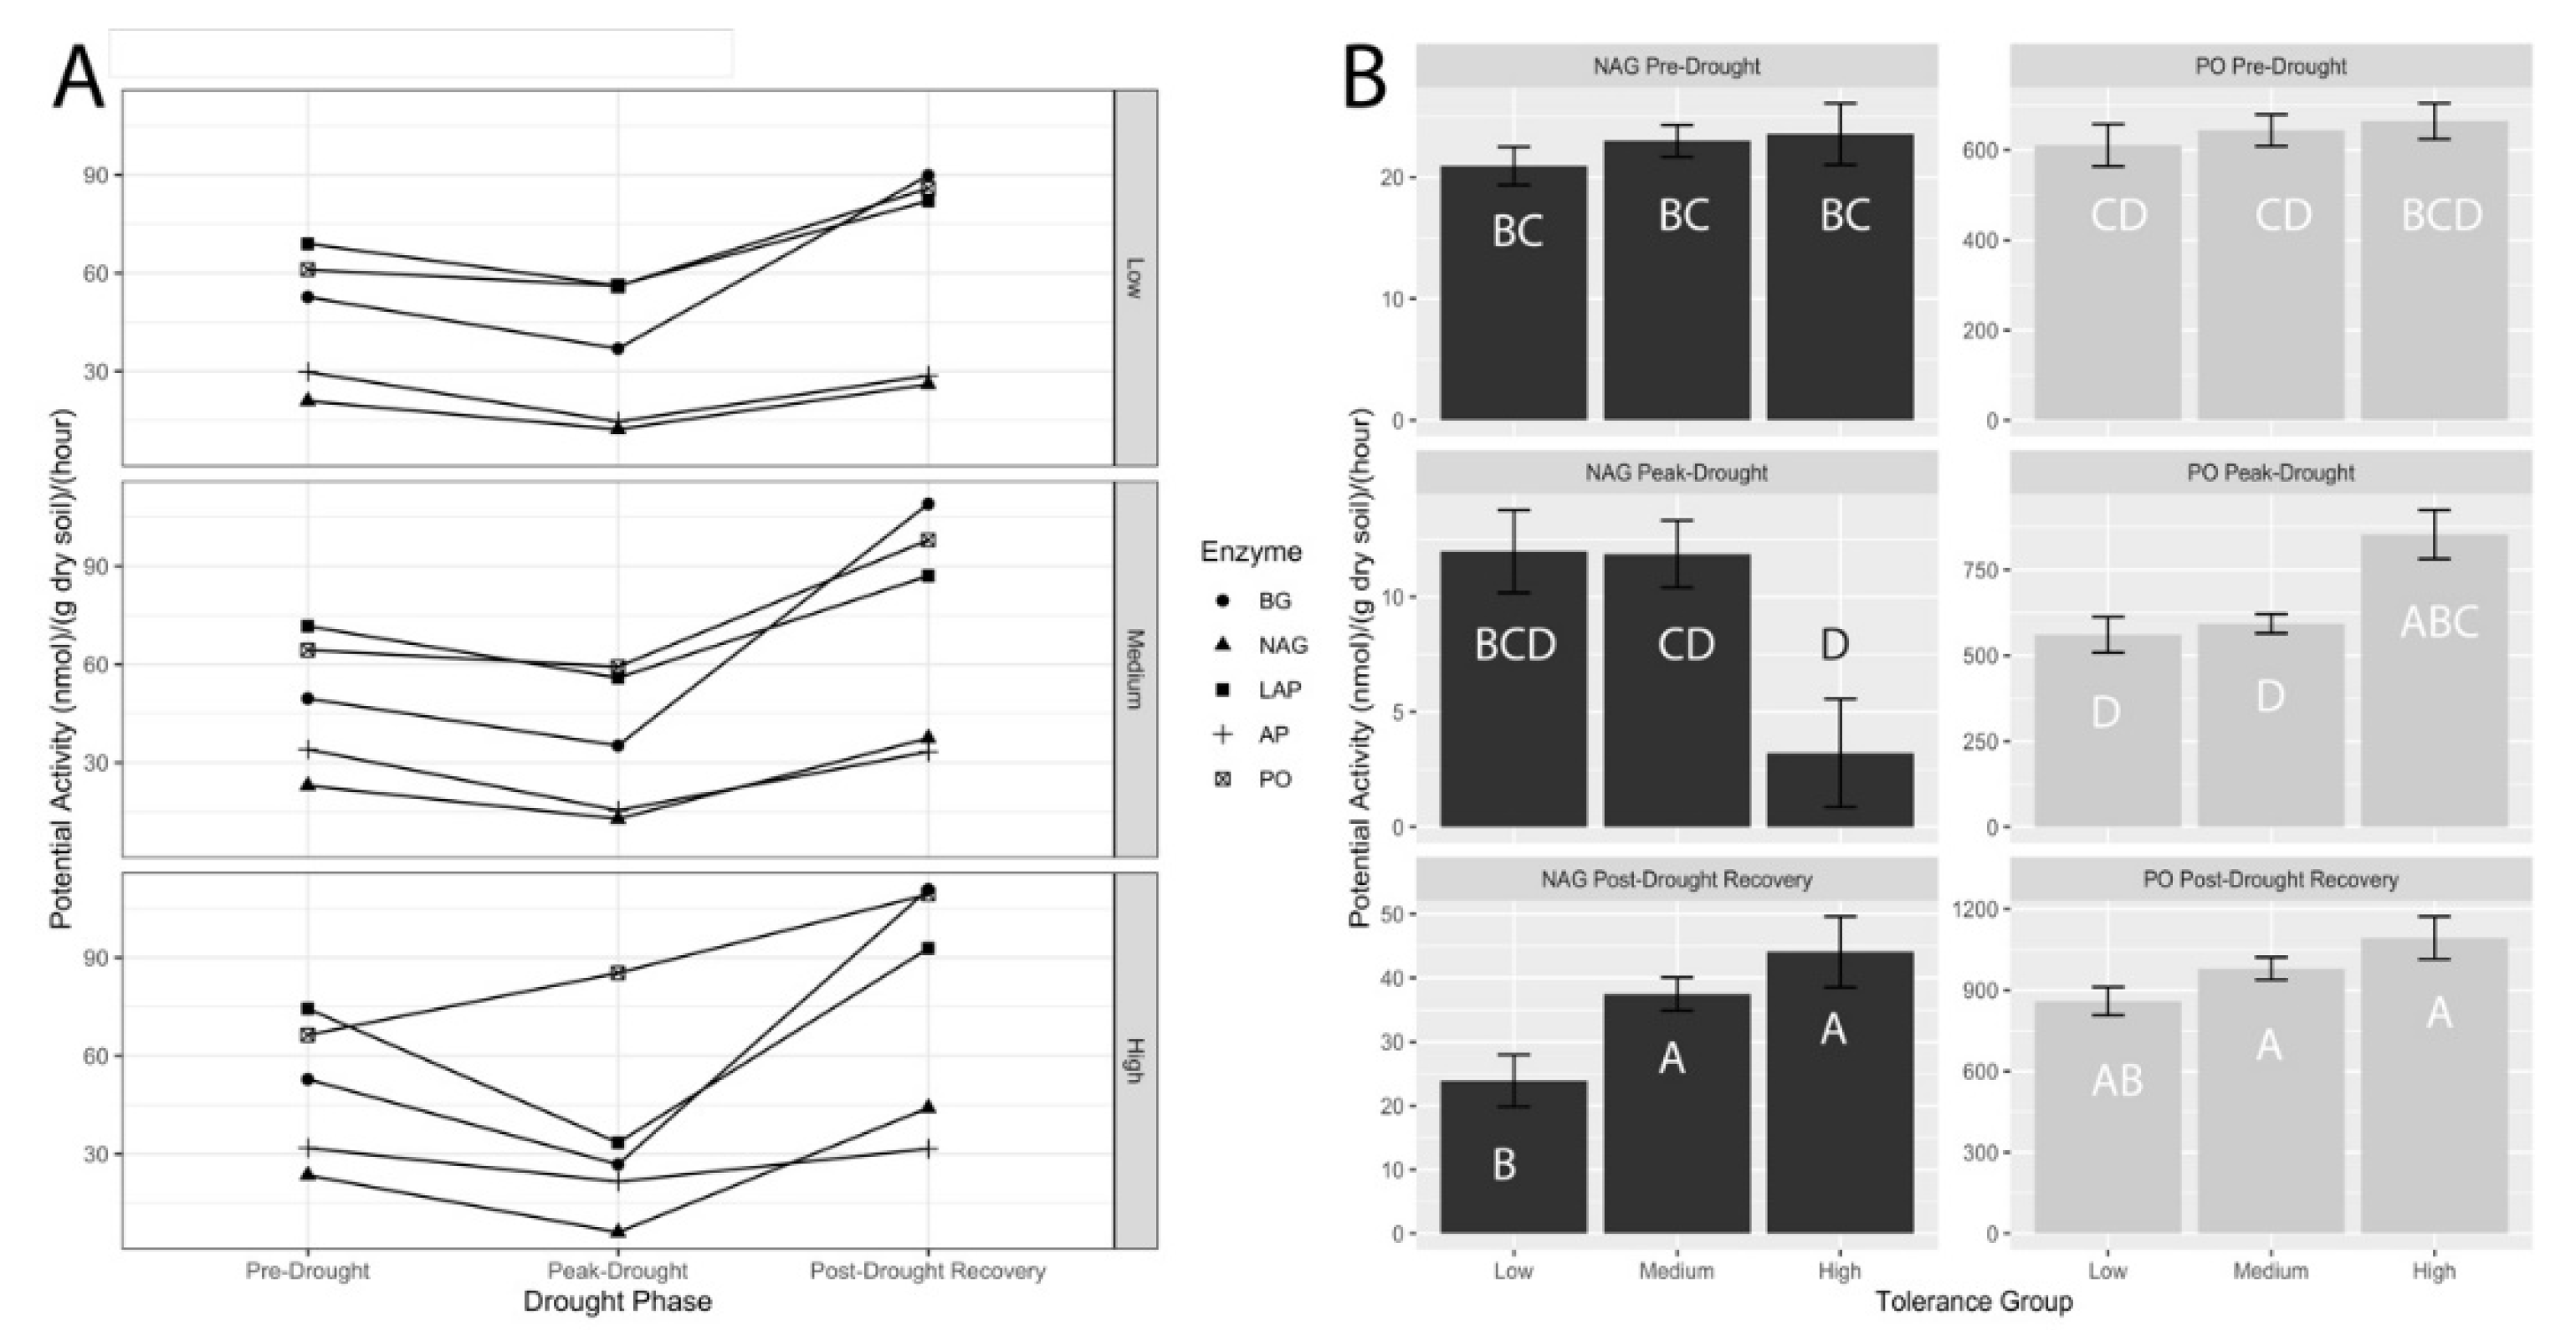
3.3. Potential Extracellular Enzyme Activities

Comparisons of potential extracellular enzyme activities of five different enzymes revealed a general trend of declining activity from pre-drought to peak drought, and a rebound during post-drought recovery (p < 0.05) (Figure 3A). This trend was more pronounced in the Medium and High tolerance groups, with N-acetyl glucosaminidase (NAG or chitinase), leucine aminopeptidase (LAP), beta-glucosidase (BGC), and phenol oxidase (PO) all recovering to significantly greater activities than in the pre-drought period. Phenol oxidase showed a significant increase in activity levels by drought tolerance groups (p < 0.05), with the most drought tolerant genotypes exhibiting the highest potential activities during peak drought (Figure 3B). Chitinase activity levels were significantly greater in the medium and high tolerance groups compared to the drought susceptible genotypes during the post-drought recovery stage and the highest tolerance fescues showed the most dramatic recovery from peak-drought to recovery.

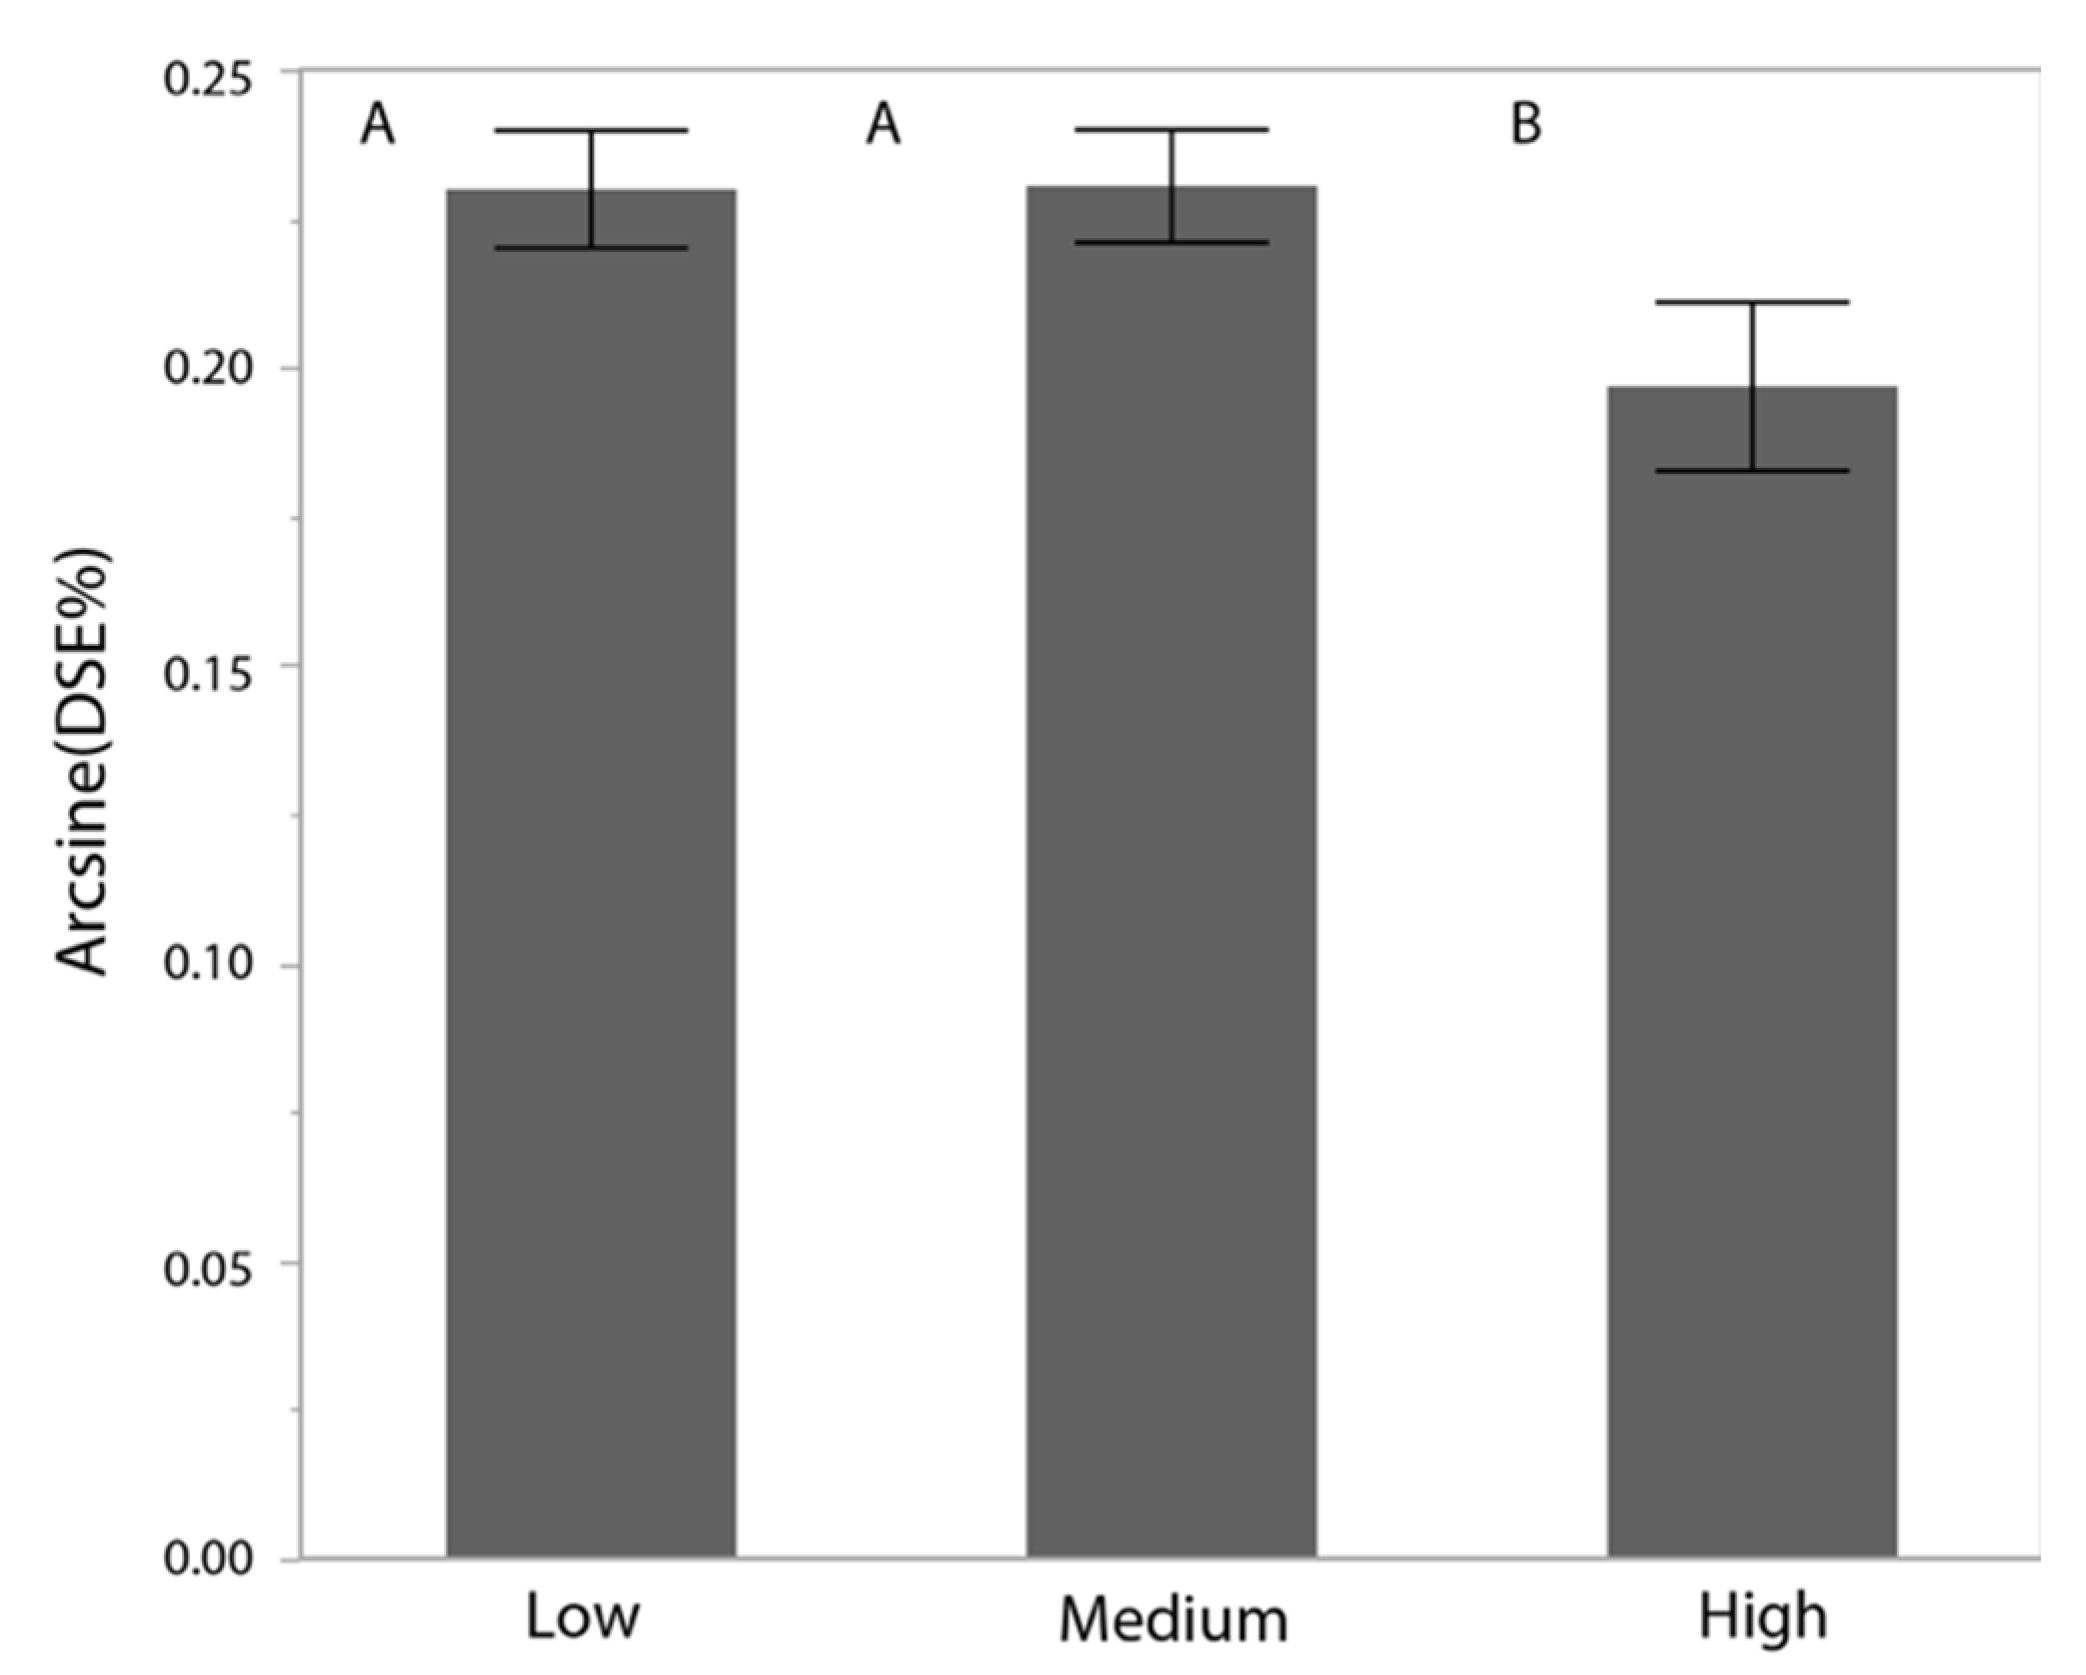
3.4. Dark Septate Endophyte Infection Rates

The DSE infection rate was lowest in the high drought tolerance genotypes (Arcsine-transformed DSE% 0.196 ± 0.02 SE). Higher infection rates were found in the low- and medium- drought tolerance groups (Arcsine-transformed DSE% 0.23 ± 0.01 SE) (Figure 4).

4. Discussion

In this study, we investigated the microbial communities found in tall fescue rhizospheres and the presence of dark septate endophytic fungi of roots associated with drought. Greater drought tolerance corresponded with increases in potential chitinase activity during the recovery phase, weeks after drought conditions ended. In contrast, phenol oxidase activities increased in the rhizosphere of genotypes that were the most tolerant to drought conditions during the two weeks of peak drought conditions, and not during the recovery phase. Both chitinase and phenol oxidase are enzymes associated with nitrogen mineralization. The shift toward greater activity of these enzymes under drought conditions or during recovery from drought could be related to nitrogen demands, as a means to cope with drought and hasten recovery [44].
The production of extracellular enzymes provides a major mechanism by which microorganisms gain access to limiting nutrients bound in soil organic matter. Groups of microorganisms can produce extracellular enzymes in response to nitrogen-limiting conditions by depolymerizing soil organic matter for direct uptake of released nitrogen by microorganisms and nearby plant roots [45,46,47,48,49]. Bacteria and fungi both produce extracellular enzymes, and the increase in chitinase and phenol oxidase activities may signal a role in drought tolerance or recovery. Previous studies have shown that fungal and bacterial biomass and extracellular enzyme production often respond differently to drought and that they show distinct enzyme partitioning [50,51,52,53,54]. The interest in the role of drought in ecosystem functioning has not revealed a consistent response of microbial communities and extracellular enzyme activities to drought and recovery. Responses appear to differ largely by seasonality and ecosystem studied [55,56].
Originally, we expected differences in microbiome function to be accompanied by shifts in microbial community composition and dark septate endophyte occurrences in roots. However, increases in extracellular enzyme activity in drought tolerant genotypes were not accompanied by clear changes in the relative abundances of the rhizosphere microorganisms. Instead, the composition of the microbial community was driven primarily by the different phases of drought conditions (pre-drought, peak drought, and post-drought recovery). After weeks of recovery from the drought period, there was a convergence of the microbial communities in weighted UniFrac distance ordinations showing bacterial communities indistinguishable across the tolerance gradient. This trend was less pronounced, but still present for fungi. The microbial community responded to drought with a significant increase in diversity of only the bacterial community after weeks of recovery from drought. A drought study conducted in sorghum plots showed a decline in diversity when plants were subjected to drought, but diversity was reestablished upon recovery from drought [17]. Generalization of these trends is difficult, however, as a recent review on the topic by one of the authors highlights the context-dependent variability in microbiome responses to drought [57].
Despite no major differences in microbial abundance by drought tolerance, comparison of presence and absence of genera revealed sets of OTUs unique to the high and low drought tolerant genotypes. The high drought tolerance group was associated with the occurrences of bacterial OTUs belonging to the genera Sulfuritalea, Methylobacterium, Aminobacter, Acidiphilium, Blastobacter, Sphingobium, and Aciditerrimonas, among others (68 in total). Previous studies have shown shifts in Sphingobacteriales in response to salinity-induced water stress [58]. Aciditerrimonas has been observed in a metagenomic survey of desert soil [59]. Other observed genera have not been previously described in connection with plant drought tolerance. The low drought tolerance group consisted of no unique bacterial OTUs. The fungi, in contrast, showed fewer OTUs that are unique to high drought tolerance; these include OTUs in the Pyrenochaetopsis, Dactylella, and Magnaporthiopsis genera. Pyrenochaetopsis is a genus containing members of varying lifestyles including saprophytes, endosymbionts, and pathogens [60]. Previous work has also described members of Dactylella capable of capturing nematodes, which presents a potential avenue for alteration of plant stress response via pathogen mitigation [61]. Low-abundance-associated genera include Acremonium, Conocybe, Funneliformis, and Cyathus. Acremonium is the fungal endophyte most-commonly associated with tall fescue and its deleterious effects on livestock and insect pathogens as well as drought tolerance [62]. Conocybe is also a toxin-producing, grass-associated taxon and Funneliformis is a mycorrhizal genus [63]. The presence of these genera in the low-tolerance group may indicate a greater level of fungal symbiosis.
We did observe changes in the presence of dark septate endophytes in roots of the most drought tolerant genotypes. In this case, it was in contrary to our hypothesis whereby a decline in the presence of dark septate endophytes corresponded with higher drought tolerance. The dark septate endophytes are common in semiarid grasslands, and function similarly to arbuscular mycorrhizal fungi (AMF) in their ability to increase plant growth and abiotic stress tolerance [13]. Based on previous studies, greater association with dark septate endophytes was expected to increase plant drought tolerance [64,65]. The lower colonization rates in the high drought tolerance group suggests a fitness cost associated with heavier dark septate endophyte infection during drought; however, there are no published studies we are aware of that support this idea. In addition, most symbiotic relationships are mutually punitive; each participant may withhold their contribution to the mutualism in the absence of the other participant’s contribution [66].
The increase in potential chitinase and phenol oxidase activities is also contrary to expectations given the decrease in dark septate endophytes. These endophytes are capable of degrading a wide variety of substrates through extracellular enzyme production [67]. However, the increase in extracellular enzyme activity is likely attributable to the bacterial or non-dark septate fungal community. A study looking at drought in grassland soils revealed patterns of summer drought very similar to those observed in this summer drought experiment in tall fescue. Namely, the increase of many extracellular enzyme activities to greater than pre-drought levels following drought recovery [56].

5. Conclusions

The results suggest that the soil microbial community may play a role in tall fescue tolerance to drought, despite little to no systematic differences in microbial composition based on 16S rRNA gene and ITS sequencing. Specifically, the role of rhizosphere microbial function in influencing soil extracellular enzyme activity, nitrogen mineralization, and possibly plant nitrogen utilization should be given more attention in studies on plant drought tolerance and recovery. Attention in subsequent studies should also take into account seasonality and disentangling respective contributions from fungal and bacterial communities within the microbiome.
Here, we have shown that current methods of profiling may not be sufficient to observe plant genotype-specific changes to the microbiome without also accounting for variation in microbiome function (extracellular enzyme activity) in the absence of microbial compositional shifts across levels of drought tolerance by tall fescue. This highlights the need for inclusion of methods that capture additional microbiome traits, other than those characterized by16S rRNA gene and ITS sequencing. In particular, assessment of microbial function via extracellular enzyme activity, other relevant metabolic activities, and transcriptomics/proteomics will be necessary for further elucidating the role of the rhizosphere microbiome in plant abiotic stress tolerance. The decline in dark septate endophytes in the roots of the most drought tolerant genotypes necessitates further examination, given that other researchers have reported a positive relationship between root endophytes and drought tolerance of the host plant.

Supplementary Materials

The following are available online at https://www.mdpi.com/2073-4395/10/8/1076/s1, Figure S1: Experimental plots at the Cornell University rainout shelter, Figure S2: Drought tolerance groups, Figure S3: Principal Coordinates Analysis of Weighted UniFrac Distances by Drought Tolerance, Figure S4: Venn Diagram of Unique OTUs by High and Low Drought Tolerance, Table S1: High and low drought tolerance-associated genera.

Author Contributions

K.W. and H.G. conducted and analyzed all dark septate endophyte work. L.C. conducted ITS sequencing and analysis. M.P. provided tall fescues plots, rain out shelter, and turfgrass-related experimental design components. K.P.-B. collected and analyzed 16S sequence data, extracellular enzyme activities, and plant/soil measurements. L.C. conducted the ITS sequence prep work and analysis. J.K.-K. and M.P. conceived, planned, and coordinated work. J.K.-K. and K.P.-B. wrote the paper. All authors read and provided feedback on the manuscript. All authors have read and agreed to the published version of the manuscript.

Funding

This work was funded by the National Science Foundation Integrative Graduate Education and Research Traineeship (IGERT) and a grant from New York State Agriculture and Markets, administered by the New York Greengrass Association and the Turfgrass Environmental Stewardship Fund.

Acknowledgments

We thank Terry Bell, Stacey Lee, and Jeff Barlow for their help with sample preparation of the soils for DNA analysis. We are grateful for funding by the National Science Foundation Integrative Graduate Education and Research Traineeship (IGERT), a grant from New York State Agriculture and Markets, administered by the New York Greengrass Association and the Turfgrass Environmental Stewardship Fund, and use of the tall fescue genotypes from the 2012 National Turfgrass Evaluation Program national study.

Conflicts of Interest

The authors declare that the research was conducted in the absence of any commercial or financial relationships that could be construed as a potential conflict of interest.

Data Availability

The raw data supporting the conclusions of this manuscript will be made available by the authors, without undue reservation, to any qualified researcher.

References

  1. Zolla, G.; Badri, D.V.; Bakker, M.G.; Manter, D.K.; Vivanco, J.M. Soil microbiomes vary in their ability to confer drought tolerance to Arabidopsis. Appl. Soil Ecol. 2013, 68, 1–9. [Google Scholar] [CrossRef]
  2. Lau, J.A.; Lennon, J.T. Rapid responses of soil microorganisms improve plant fitness in novel environments. Proc. Natl. Acad. Sci. USA 2012, 109, 14058–14062. [Google Scholar] [CrossRef] [Green Version]
  3. Peiffer, J.A.; Spor, A.; Koren, O.; Jin, Z.; Tringe, S.G.; Dangl, J.L.; Buckler, E.S.; Ley, R.E. Diversity and heritability of the maize rhizosphere microbiome under field conditions. Proc. Natl. Acad. Sci. USA 2013, 110, 6548–6553. [Google Scholar] [CrossRef] [PubMed] [Green Version]
  4. Lundberg, D.S.; Lebeis, S.L.; Paredes, S.H.; Yourstone, S.; Gehring, J.; Malfatti, S.; Tremblay, J.; Engelbrektson, A.; Kunin, V.; Del Rio, T.G.; et al. Defining the core Arabidopsis thaliana root microbiome. Nature 2012, 488, 86–90. [Google Scholar] [CrossRef] [Green Version]
  5. Bulgarelli, D.; Rott, M.; Schlaeppi, K.; van Themaat, E.V.; Ahmadinejad, N.; Assenza, F.; Rauf, P.; Huettel, B.; Reinhardt, R.; Schmelzer, E.; et al. Revealing structure and assembly cues for Arabidopsis root-inhabiting bacterial microbiota. Nature 2012, 488, 91–95. [Google Scholar] [CrossRef] [PubMed]
  6. Weinert, N.; Piceno, Y.; Ding, G.C.; Meincke, R.; Heuer, H.; Berg, G.; Schloter, M.; Andersen, G.; Smalla, K. PhyloChip hybridization uncovered an enormous bacterial diversity in the rhizosphere of different potato cultivars: Many common and few cultivar-dependent taxa. FEMS Microbiol. Ecol. 2011, 75, 497–506. [Google Scholar] [CrossRef] [PubMed]
  7. Newman, J.A.; Abner, M.L.; Dado, R.G.; Gibson, D.J.; Brookings, A.; Parsons, A.J. Effects of elevated CO2, nitrogen and fungal endophyte-infection on tall fescue: Growth, photosynthesis, chemical composition and digestibility. Glob. Chang. Biol. 2003, 9, 425–437. [Google Scholar] [CrossRef]
  8. Salehi, M.; Salehi, H.; Niazi, A.; Ghobadi, C. Convergence of goals: Phylogenetical, morphological, and physiological characterization of tolerance to drought stress in tall fescue (Festuca arundinacea schreb.). Mol. Biotechnol. 2014, 56, 248–257. [Google Scholar] [CrossRef]
  9. Huang, B. Nutrient accumulation and associated root characteristics in response to drought stress in tall fescue cultivars. HortScience 2001, 36, 148–152. [Google Scholar] [CrossRef] [Green Version]
  10. Bacon, C.W. Abiotic stress tolerances (moisture, nutrients) and photosynthesis in endophyte-infected tall fescue. Agric. Ecosyst. Environ. 1993, 44, 123–141. [Google Scholar] [CrossRef]
  11. Elmi, A.A.; West, C.P. Endophyte infection effects on stomatal conductance, osmotic adjustment and drought recovery of tall fescue. New Phytol. 1995, 131, 61–67. [Google Scholar] [CrossRef]
  12. Swarthout, D.; Harper, E.; Judd, S.; Gonthier, D.; Shyne, R.; Stowe, T.; Bultman, T. Measures of leaf-level water-use efficiency in drought stressed endophyte infected and non-infected tall fescue grasses. Environ. Exp. Bot. 2009, 66, 88–93. [Google Scholar] [CrossRef]
  13. Mandyam, K.; Jumpponen, A. Seeking the elusive function of the root-colonising dark septate endophytic fungi. Stud. Mycol. 2005, 53, 173–189. [Google Scholar] [CrossRef] [Green Version]
  14. Jumpponen, A. Dark septate endophytes—Are they mycorrhizal? Mycorrhiza 2001, 11, 207–211. [Google Scholar] [CrossRef]
  15. Scervino, J.M.; Gottlieb, A.; Silvani, V.A.; Pérgola, M.; Fernández, L.; Godeas, A.M. Exudates of dark septate endophyte (DSE) modulate the development of the arbuscular mycorrhizal fungus (AMF) Gigaspora rosea. Soil Biol. Biochem. 2009, 41, 1753–1756. [Google Scholar] [CrossRef]
  16. Knapp, D.G.; Pintye, A.; Kovács, G.M. The dark side is not fastidious-dark septate endophytic fungi of native and invasive plants of semiarid sandy areas. PLoS ONE 2012, 7, e32570. [Google Scholar] [CrossRef] [Green Version]
  17. Xu, L.; Naylor, D.; Dong, Z.; Simmons, T.; Pierroz, G.; Hixson, K.K.; Kim, Y.M.; Zink, E.M.; Engbrecht, K.M.; Wang, Y.; et al. Drought delays development of the sorghum root microbiome and enriches for monoderm bacteria. Proc. Natl. Acad. Sci. USA 2018, 115, E4284–E4293. [Google Scholar] [CrossRef] [Green Version]
  18. Owen, D.; Williams, A.P.; Griffith, G.W.; Withers, P.J. Use of commercial bio-inoculants to increase agricultural production through improved phosphrous acquisition. Appl. Soil Ecol. 2015, 86, 41–54. [Google Scholar] [CrossRef]
  19. Glick, B.R. Plant Growth-Promoting Bacteria: Mechanisms and Applications. Scientifica 2012, 2012, 1–15. [Google Scholar] [CrossRef] [Green Version]
  20. Bashan, Y. Inoculants of plant growth-promoting bacteria for use in agriculture. Biotechnol. Adv. 1998, 16, 729–770. [Google Scholar] [CrossRef]
  21. Berendsen, R.L.; Pieterse, C.M.; Bakker, P.A. The rhizosphere microbiome and plant health. Trends Plant Sci. 2012, 17, 478–486. [Google Scholar] [CrossRef] [PubMed]
  22. Karcher, D.E.; Richardson, M.D.; Hignight, K.; Rush, D. Drought tolerance of tall fescue populations selected for high root/shoot ratios and summer survival. Crop Sci. 2008, 48, 771–777. [Google Scholar] [CrossRef]
  23. Richardson, M.D.; Karcher, D.E.; Purcell, L.C. Quantifying turfgrass cover using digital image analysis. Crop Sci. 2001, 41, 1884–1888. [Google Scholar] [CrossRef]
  24. Karcher, D.E.; Richardson, M.D. Quantifying turfgrass color using digital image analysis. Crop Sci. 2003, 43, 943–951. [Google Scholar] [CrossRef]
  25. Vierheilig, H.; Coughlan, A.P.; Wyss, U.R.; Piché, Y. Ink and vinegar, a simple staining technique for arbuscular-mycorrhizal fungi. Appl. Environ. Microbiol. 1998, 64, 5004–5007. [Google Scholar] [CrossRef] [Green Version]
  26. McGonigle, T.P.; Miller, M.H.; Evans, D.G.; Fairchild, G.L.; Swan, J.A. A new method which gives an objective measure of colonization of roots by vesicular-arbuscular mycorrhizal fungi. New Phytol. 1990, 115, 495–501. [Google Scholar] [CrossRef]
  27. Sinsabaugh, R.L.; Hill, B.H.; Shah, J.J. Ecoenzymatic stoichiometry of microbial organic nutrient acquisition in soil and sediment. Nature 2009, 462, 795–798. [Google Scholar] [CrossRef]
  28. Saiya-Cork, K.R.; Sinsabaugh, R.L.; Zak, D.R. The effects of long term nitrogen deposition on extracellular enzyme activity in an Acer saccharum forest soil. Soil Biol. Biochem. 2002, 34, 1309–1315. [Google Scholar] [CrossRef]
  29. German, D.P.; Weintraub, M.N.; Grandy, A.S.; Lauber, C.L.; Rinkes, Z.L.; Allison, S.D. Optimization of hydrolytic and oxidative enzyme methods for ecosystem studies. Soil Biol. Biochem. 2011, 43, 1387–1397. [Google Scholar] [CrossRef]
  30. German, D.P.; Chacon, S.S.; Allison, S.D. Substrate concentration and enzyme allocation can affect rates of microbial decomposition. Ecology 2011, 92, 1471–1480. [Google Scholar] [CrossRef]
  31. Caporaso, J.G.; Lauber, C.L.; Walters, W.A.; Berg-Lyons, D.; Huntley, J.; Fierer, N.; Owens, S.M.; Betley, J.; Fraser, L.; Bauer, M.; et al. Ultra-high-throughput microbial community analysis on the Illumina HiSeq and MiSeq platforms. ISME J. 2012, 6, 1621–1624. [Google Scholar] [CrossRef] [PubMed] [Green Version]
  32. Gardes, M.; Bruns, T.D. ITS primers with enhanced specificity for basidiomycetes-application to the identification of mycorrhizae and rusts. Mol. Ecol. 1993, 2, 113–118. [Google Scholar] [CrossRef] [PubMed]
  33. Burke, D.J.; Martin, K.J.; Rygiewicz, P.T.; Topa, M.A. Ectomycorrhizal fungi identification in single and pooled root samples: Terminal restriction fragment length polymorphism (TRFLP) and morphotyping compared. Soil Biol. Biochem. 2005, 37, 1683–1694. [Google Scholar] [CrossRef]
  34. Caporaso, J.G.; Kuczynski, J.; Stombaugh, J.; Bittinger, K.; Bushman, F.D.; Costello, E.K.; Fierer, N.; Pena, A.G.; Goodrich, J.K.; Gordon, J.I.; et al. QIIME allows analysis of high-throughput community sequencing data. Nat. Methods 2010, 7, 335–336. [Google Scholar] [CrossRef] [PubMed] [Green Version]
  35. Callahan, B.J.; McMurdie, P.J.; Rosen, M.J.; Han, A.W.; Johnson, A.J.; Holmes, S.P. DADA2: High-resolution sample inference from Illumina amplicon data. Nat. Methods 2016, 13, 581–583. [Google Scholar] [CrossRef] [Green Version]
  36. Lan, Y.; Wang, Q.; Cole, J.R.; Rosen, G.L. Using the RDP classifier to predict taxonomic novelty and reduce the search space for finding novel organisms. PLoS ONE 2012, 7, e32491. [Google Scholar] [CrossRef] [Green Version]
  37. Kõljalg, U.; Nilsson, R.H.; Abarenkov, K.; Tedersoo, L.; Taylor, A.F.; Bahram, M.; Bates, S.T.; Bruns, T.D.; Bengtsson-Palme, J.; Callaghan, T.M.; et al. Towards a unified paradigm for sequence-based identification of fungi. Mol. Ecol. 2014, 22, 5271–5277. [Google Scholar] [CrossRef] [Green Version]
  38. R Core Team. R: A Language and Environment for Statistical Computing; R Core Team: Vienna, Austria, 2013; ISBN 3-900051-07-0. [Google Scholar]
  39. Lozupone, C.; Knight, R. UniFrac: A new phylogenetic method for comparing microbial communities. Appl. Environ. Microbiol. 2005, 71, 8228–8235. [Google Scholar] [CrossRef] [Green Version]
  40. Lozupone, C.; Lladser, M.E.; Knights, D.; Stombaugh, J.; Knight, R. UniFrac: An effective distance metric for microbial community comparison. ISME J. 2011, 5, 169–172. [Google Scholar] [CrossRef] [Green Version]
  41. Love, M.I.; Huber, W.; Anders, S. Moderated Estimation of Fold Change and Dispersion for RNA-Seq Data with DESeq2. Genome Biol. 2014, 15, 550. [Google Scholar] [CrossRef] [Green Version]
  42. Koh, H.; Blaser, M.J.; Li, H. A powerful microbiome-based association test and a microbial taxa discovery framework for comprehensive association mapping. Microbiome 2017, 5, 45. [Google Scholar] [CrossRef] [PubMed] [Green Version]
  43. Anderson, M.J. Permutational Multivariate Analysis of Variance (PERMANOVA). In Wiley StatsRef: Statistics Reference Online; John Wiley & Sons, Ltd.: Hoboken, NJ, USA, 2017; pp. 1–15. [Google Scholar]
  44. Waraich, E.A.; Ahmad, R.; Ashraf, M.Y. Role of mineral nutrition in alleviation of drought stress in plants. Aust. J. Crop Sci. 2011, 5, 764. [Google Scholar]
  45. Burns, R.G. Enzyme activity in soil: Location and a possible role in microbial ecology. Soil Biol. Biochem. 1982, 14, 423–427. [Google Scholar] [CrossRef]
  46. Burns, R.G.; Dick, R. Enzymes in the Environment: Activity, Ecology, and Applications; Dekker, M., Ed.; CRC Press: Boca Raton, FL, USA, 2002. [Google Scholar]
  47. Gallo, M.; Amonette, R.; Lauber, C.; Sinsabaugh, R.L.; Zak, D.R. Microbial community structure and oxidative enzyme activity in nitrogen-amended north temperate forest soils. Microb. Ecol. 2004, 48, 218–229. [Google Scholar] [CrossRef] [PubMed] [Green Version]
  48. Sinsabaugh, R.L.; Osgood, M.P.; Findlay, S. Enzymatic Models for Estimating Decomposition Rates of Particulate Detritus. J. N. Am. Benthol. Soc. 1994, 13, 160–169. [Google Scholar] [CrossRef]
  49. Sinsabaugh, R.L. Phenol oxidase, peroxidase and organic matter dynamics of soil. Soil Biol. Biochem. 2010, 42, 391–404. [Google Scholar] [CrossRef]
  50. Alster, C.J.; German, D.P.; Lu, Y.; Allison, S.D. Microbial enzymatic responses to drought and to nitrogen addition in a southern California grassland. Soil Biol. Biochem. 2013, 64, 68–79. [Google Scholar] [CrossRef] [Green Version]
  51. Duarte, S.; Mora-Gómez, J.; Romaní, A.M.; Cássio, F.; Pascoal, C. Responses of microbial decomposers to drought in streams may depend on the environmental context. Environ. Microbiol. Rep. 2017, 9, 756–765. [Google Scholar] [CrossRef]
  52. Gionchetta, G.; Oliva, F.; Menéndez, M.; Lopez Laseras, P.; Romaní, A.M. Key role of streambed moisture and flash storms for microbial resistance and resilience to long-term drought. Freshw. Biol. 2019, 64, 306–322. [Google Scholar] [CrossRef]
  53. Baldrian, P.; Šnajdr, J.; Merhautová, V.; Dobiášová, P.; Cajthaml, T.; Valášková, V. Responses of the extracellular enzyme activities in hardwood forest to soil temperature and seasonality and the potential effects of climate change. Soil Biol. Biochem. 2013, 56, 60–68. [Google Scholar] [CrossRef]
  54. Upton, R.N.; Bach, E.M.; Hofmockel, K.S. Belowground response of prairie restoration and resiliency to drought. Agric. Ecosyst. Environ. 2018, 266, 122–132. [Google Scholar] [CrossRef]
  55. Ouyang, Y.; Li, X. Effect of repeated drying-rewetting cycles on soil extracellular enzyme activities and microbial community composition in arid and semi-arid ecosystems. Eur. J. Soil Biol. 2020, 98, 103187. [Google Scholar] [CrossRef]
  56. Hammerl, V.B.; Grant, K.; Pritsch, K.; Jentsch, A.; Schloter, M.; Beierkuhnlein, C.; Gschwendtner, S. Seasonal effects of extreme weather events on potential extracellular enzyme activities in a temperate grassland soil. Front. Environ. Sci. 2019, 6, 157. [Google Scholar] [CrossRef]
  57. Naylor, D.; Coleman-Derr, D. Drought Stress and Root-Associated Bacterial Communities. Front. Plant Sci. 2018, 8, 2223. [Google Scholar] [CrossRef] [PubMed]
  58. Mapelli, F.; Marasco, R.; Rolli, E.; Barbato, M.; Cherif, H.; Guesmi, A.; Ouzari, I.; Daffonchio, D.; Borin, S. Potential for plant growth promotion of rhizobacteria associated with Salicornia growing in Tunisian hypersaline soils. BioMed Res. Int. 2013, 2013. [Google Scholar] [CrossRef] [Green Version]
  59. Sivakala, K.K.; Jose, P.A.; Anandham, R.; Thinesh, T.; Jebakumar, S.R.; Samaddar, S.; Chatterjee, P.; Sivakumar, N.; Sa, T. Spatial physiochemical and metagenomic analysis of desert environment. J. Microbiol. Biotechnol. 2018, 28, 1517–1526. [Google Scholar] [CrossRef]
  60. de Gruyter, J.; Woudenberg, J.H.; Aveskamp, M.M.; Verkley, G.J.; Groenewald, J.Z.; Crous, P.W. Systematic reappraisal of species in Phoma section Paraphoma, Pyrenochaeta and Pleurophoma. Mycologia 2010, 102, 1066–1081. [Google Scholar] [CrossRef]
  61. Olatinwo, R.; Yin, B.; Becker, J.O.; Borneman, J. Suppression of the Plant-Parasitic Nematode Heterodera schachtii by the Fungus Dactylella oviparasitica. Phytopathology 2006, 96, 111–114. [Google Scholar] [CrossRef] [Green Version]
  62. Hoveland, C.S. Importance and economic significance of the Acremonium endophytes to performance of animals and grass plant. Agric. Ecosyst. Environ. 1993, 44, 3–12. [Google Scholar] [CrossRef]
  63. Hutchison, L.J.; Madzia, S.E.; Barron, G.L. The presence and antifeedant function of toxin-producing secretory cells on hyphae of the lawn-inhabiting agaric Conocybe lactea. Can. J. Bot. 1996, 74, 431–434. [Google Scholar] [CrossRef]
  64. Porras-Alfaro, A.; Herrera, J.; Sinsabaugh, R.L.; Odenbach, K.J.; Lowrey, T.; Natvig, D.O. Natvig. Novel root fungal consortium associated with a dominant desert grass. Appl. Environ. Microbiol. 2008, 74, 2805–2813. [Google Scholar] [CrossRef] [PubMed] [Green Version]
  65. Barrow, J.R. Atypical morphology of dark septate fungal root endophytes of Bouteloua in arid southwestern USA rangelands. Mycorrhiza 2003, 13, 239–247. [Google Scholar] [CrossRef] [PubMed]
  66. Egas, M.; Riedl, A. The economics of altruistic punishment and the maintenance of cooperation. Proc. Biol. Sci. 2008, 275, 871–878. [Google Scholar] [CrossRef] [PubMed] [Green Version]
  67. Caldwell, B.A.; Jumpponen, A.; Trappe, J.M. Utilization of Major Detrital Substrates by Dark-Septate, Root Endophytes. Mycologia 2000, 92, 230. [Google Scholar] [CrossRef]
Figure 1. PCoA of Weighted UniFrac Distances by Drought Condition Stages. Principal coordinates plots of weighted UniFrac distance matrices illustrate patterns between sample groups. Ordinations are colored by drought condition phases and represent microbiome fingerprints of (A) bacterial 16S rRNA gene sequences and (B) fungal ITS sequences. The ordinations show, in a color gradient from white, to gray, to black, experiment phases (pre-drought, peak drought, and post-drought recovery, respectively). A convergence in the microbial communities are evident in the post-drought recovery stage for both bacteria and fungi.
Agronomy 10 01076 g001
Figure 2. Shannon Diversity of Bacterial and Fungal Communities. Histograms of mean Shannon Diversity Indices at pre-drought, peak drought, and post-drought recovery stages for (A) bacteria and (B) fungi. Coloring denotes drought tolerance groups ‘Low’ (Red), ‘Medium’ (Green), and ‘High’ (Blue). Connecting letters denote significant difference at alpha-level 0.05 and are unique to each (A) and (B).
Agronomy 10 01076 g002
Figure 3. Potential Extracellular Enzyme Activities. The enzymes, N-acetyl glucosaminidase (chitinase) is indicated by NAG, leucine aminopeptidase is indicated by LAP, acid phosphatase is indicated by AP, and beta-glucosidase is indicated by BG. The enzyme activities were measured by fluorometric quantification, whereas phenol oxidase (indicated by PO) was quantified by absorption. AP and PO have been scaled to 1/10th activity in 3A to allow comparison of all enzymes together. (A) reports enzyme activity rates at the stages prior to drought, during drought, and after drought. In (B) the bar charts report the chitinase and phenol oxidase potential activities by drought tolerance level. Connecting letters indicate significance at alpha-level 0.05 and are specific to chitinase and phenol oxidase data. Error bars are standard errors of the mean.
Agronomy 10 01076 g003
Figure 4. Arcsine-transformed Dark Septate Endophyte Infection-rates by Tolerance Group. Histogram of Arcsine-transformed dark septate fungal endophyte infection-rates between drought tolerance groups (Low, Medium, and High drought tolerance). Infection rates were determined by dividing the number of infected root cells by the total number of cells observed through microscopy. Connecting letters report indicates significance at alpha-level 0.05. Error bars are standard error of the mean.
Agronomy 10 01076 g004

