1. Introduction
Intensive agronomic practices in cropping systems, such as deep tillage, high rates of synthetic fertilizers, and simplified crop rotation can be the cause of negative impacts on agricultural soils with loss of soil organic matter and nutrients, and in general on both soil and plant health [
1,
2].
In recent years, strategies of the European Commission’s (EC) “Farm to Fork” (F2F) and “Biodiversity” have released a regulatory path aimed to make food systems fair, healthy, and environmentally friendly, preventing the negative effects of intensive agriculture by a circular economy approach, integrated nutrient management plans, and improved pest management [
3,
4]. The transition to sustainable agriculture in the EU is driven by new technologies, research, innovation, and the dissemination of knowledge with reference to phytosanitary aspects, soil health protection, and carbon sequestration. The restoration and/or maintenance of soil fertility through the integration of circular and low-impact agronomic techniques is considered prodromal of sustainability in agriculture. The EU Soil Strategy 2030 sets out a framework and concrete measures to protect and restore soils and their biodiversity [
5]. The EU Carbon Farming Initiative has examined the actions needed to implement schemes that incentivize farmers to store carbon in the soil as a new source of income [
6].
In a sustainable agro-ecosystem management strategy, the adoption of conservation soil tillage and organic fertilization techniques can contribute substantially to the EC goals, since they can save energy, protect the physical and chemical characteristics of soil as well as microbial population and its biodiversity, and contribute to reducing greenhouse gas emissions [
7,
8,
9]. In particular, the use of compost from various feedstock has proven to be a valuable practice by a circular economy approach for increasing and maintaining soil organic matter, with nutritional benefits due to the provision of nutrients and positive effects on yield, health, and quality for many crops [
10].
In Central Italy, the rotations of durum wheat (
Triticum durum Desf.) with potato and other horticultural crops are specialized and traditional agricultural practices. Despite the efforts of the professional categories involved in durum wheat cultivation in optimizing the production process, there are still many critical issues linked above all to the excesses in mineral fertilization, to the energy and environmental costs of traditional tillage such as ploughing often performed in-depth, and to losses due to pests difficult to prevent, such as
Fusarium head blight (caused by
Fusarium spp.) on wheat. In this view, durum wheat producers are currently under pressure to maintain profitability against criticisms represented by high fertilizer costs and increasing quality demands of the pasta industry [
11]. Crop quantity and quality parameters are mainly determined by the genotype, the environment (weather and soil) interactions, and by crop management [
12]. The N-fertilization rate, type of nitrogen, and timing of its application are important factors to increase wheat yield and quality [
13,
14,
15]. In this study we hypothesized that a conservation soil tillage approach and organic fertilization could enhance growth, yield, and yield components of durum wheat in the Mediterranean environment. The specific objective of this study was to assess the effects of different soil tillage practices (plough; subsoil; spading) and fertilization managements (mineral vs. compost) on plant growth dynamics and the final productivity of durum wheat growing in the Mediterranean environment.
2. Materials and Methods
2.1. Study Site
This study was carried out at the experimental farm of the University of Tuscia, located in Viterbo, central Italy (45°25′ N and 12°6′ E, 310 m a.s.l) over three-year consecutive growing seasons of 2019/2020, 2020/2021 and 2021/2022. The study was part of a long-term experiment that started in 2018, where a rainfed farming system is the standard practice. Historical climate data (over the last 30 years) showed an average of 500 mm rainfall in the area during the durum wheat growing season (November to June). Most of the rainfall is distributed during autumn and winter (55%). Moreover, the lowest mean monthly temperature of 1 °C is recorded in January and the highest mean monthly temperature of 25 °C is noted in June. The soil is classified as a
Typic Xerofluvent, and the surface horizon, 0-30 cm soil depth, contained 760 g kg
−1 sand, 130 g kg
−1 silt, and 110 g kg
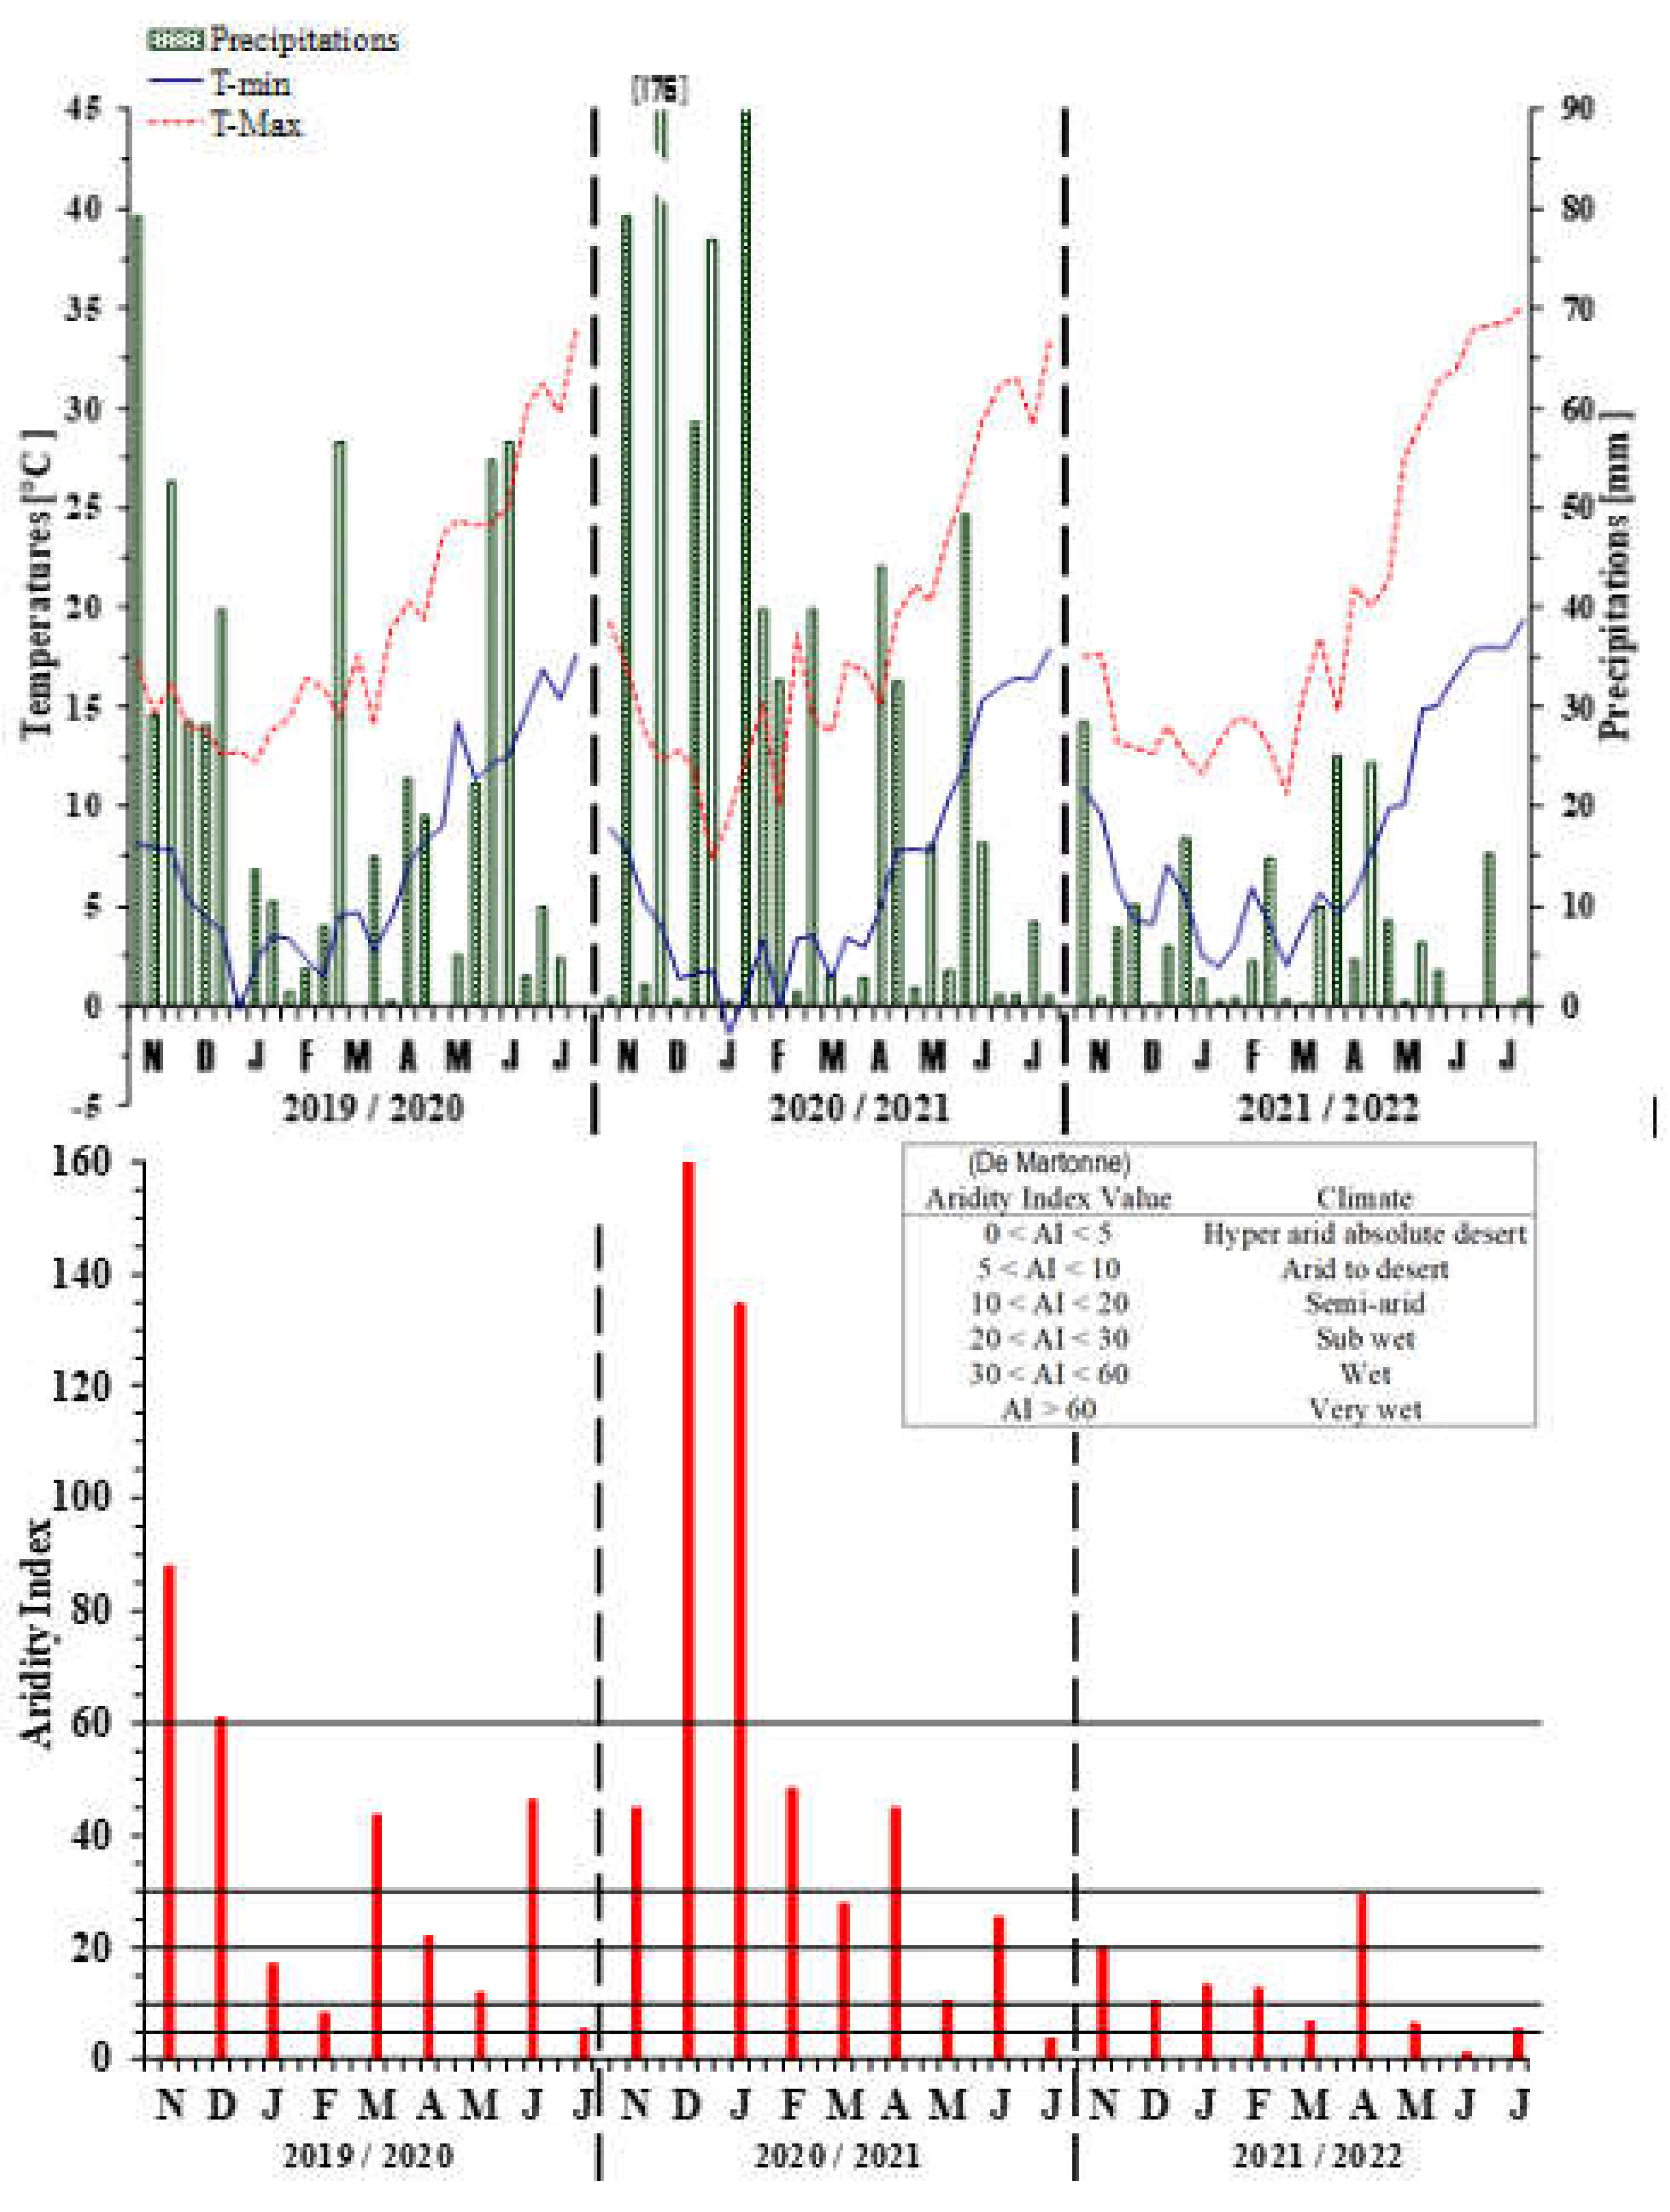
−1 clay (loamy sand), with a pH of 6.9. In addition, the soil contained 0.97% and 0.12% of total organic C and N content, respectively. Precipitation and minimum and maximum daily temperatures during the study were recorded from a meteorological station located approximately 100 m from the experimental fields. The monthly aridity index (AI) was calculated according to Mancinelli et al. [
16] throughout the study period (
Figure 1).
2.2. Experimental Design and Crop Management
A factorial randomized complete block design with three replications was established and repeated for three consecutive years. The size of each experimental plot was 60 m2 (6 × 10 m), with a 3 m distance between plots to allow for equipment operations. The trials were under wheat–potato–wheat rotation system. The treatments in this study included three soil tillage techniques and two fertilization managements. The conventional soil tillage (P), the common practice applied by the local farmer in the study area, and two alternative tillage systems [subsoil tillage (R), and spading machine (S)] were compared. Mineral fertilization management (M) was performed as the traditional practice of the area, while compost (O) was used as an organic fertilization source.
The seedbed was prepared following the first autumn precipitations before sowing. The conventional tillage practice (P) consisted of moldboard ploughing at 30 cm soil depth, while subsoil tillage (R) and spading machine (S) as minimum tillage practices at 20 cm depth. In total, 100 kg of inorganic N ha−1 was applied; 50% was applied at the beginning of the tillering stage in January as calcium nitrate, and 50% at the beginning of the stem elongation stage in March as ammonium nitrate. Organic fertilization management was applied to provide the same amount of nitrogen as the traditional farming system.
Certified compost from urban waste (ACEA Ambiente, Orvieto, Italy) with chemical, physical and biological characteristics in agreement with the Italian Legislative Decree 75/201017 was used and applied each year at the dose of 25 t ha
−1. The physical and chemical properties of compost are reported in
Table 1. Durum wheat was sown in late November to early December in all experimental trials with a conventional sowing machine. The cultivar Antalis, a winter durum wheat widely used in the region, was sown at a ratio of 450 seeds m
−2, with row spacing of 12.5 cm and at a depth of 3–4 cm. Harvesting was carried out with a Walter Wintersteiger cereal plot combine-harvester at the stage of full maturity.
2.3. Soil Sampling and Analysis
In each growing season, five soil samples per plot were randomly taken in the central area and mixed to obtain a uniform and representative sample. The soil samples were taken at a depth of 0–30 cm in each plot. All the samples were air dried, sieved with a 2 mm mesh sieve, and stored at 4 °C. Subsequently, soil analyses were performed. Total organic carbon (TOC) and total nitrogen (TN) contents were determined using the dry combustion method with Thermo Soil NC—Flash EA1112 Elemental Analyzer (Thermo Fisher Scientific, Bath, UK). Each sample was pre-treated with a 10% HCl solution to eliminate carbonates.
2.4. Data Collection and Analysis
In this study, a Chlorophyll Concentration Meter (MC-100) was used to calculate the chlorophyll concentration (CC) for monitoring crop nutrient status. The MC-100 is calibrated to measure chlorophyll concentration in leaves with units of µmol per m
2. In addition, the relationship between relative indices of chlorophyll content and chlorophyll concentration is different for different plant species. The MC-100 involves specific equations with generic coefficients for different species, including wheat, which was used in this study. Moreover, a comparative study was conducted to compare different sensors of leaf chlorophyll estimation methods including MC-100 and SPAD-502 [
17], and they reported that MC-100 was the most effective one regarding its estimation accuracy. Ten readings, one reading per plant were collected and then averaged for each plot. The measurement area of MC-100 is 64 mm
2. Measurements were taken at 110, 130, 150, and 170 days after sowing (DAS) of 2021 and 2022 growing seasons.
In addition, to achieve significant information about crop status, high throughput imaging techniques are recently widely used as non-destructive methods to examine plant reactions to the climatic conditions during the crop growing season. It has been reported that green area (GA) was used to estimate the photosynthesis area of the canopy. One picture was taken per plot, holding the camera about 1 m above the plant canopy in the vertical direction. Digital images were collected using a Nikon D750 digital camera. The zoom was set at a focal length of 50 mm and F/8 aperture representing an area of 1 m
2. The image size was 3000 × 2000 pixels saved in JPG format. Pictures were analyzed using BreedPix 0.2 software [
18], developed for digital image processing to provide values from GA for each image. GA is the percentage of pixels with a hue range from 60 to 180 (GA = pixels with 60° < Hue < 180°) [
19,
20]. This index showed differences in biomass and yield production [
18,
21]. Images were collected at 130, 150, and 170 DAS, during sunny days between 10 h and 12 h solar time, in the 2021 and 2022 growing seasons.
At wheat physiological maturity stage, the aboveground biomass of the wheat plants from eight 1 m long adjacent rows, corresponding to a 1 m2 area per plot, was manually cut at ground level and analyzed for determining the yield components. The number of fertile and sterile spikes per m2, number of spikelets per spike, and number of kernels per spike were evaluated. Tiller fertility was calculated as the ratio between the number of fertile spikes and the total number of spikes per m2. Thousand kernels weight (TKW) was calculated as the mean weight of five sets of 100 kernels per plot. To determine the dry weight, samples from all plant materials were oven dried at 65 °C until constant weight. The harvest index (HI) of each plot was calculated as the ratio between kernel weight and the total aboveground biomass. Grain yields were determined by harvesting with a Walter Wintersteiger cereal plot combine harvester.
2.5. Statistical Analysis
All collected data were statistically analyzed using the JMP statistical software package 4.0 (JMP Statistical Discovery, Cary, NC, USA). Repeated measure analysis of variance, two-way factorial analysis of variance was used in this study. In addition, a linear regression analysis was performed to identify the relationships between final grain yield with the chlorophyll concentration (CC) and the green area (GA) measured at different time points. Mean values were compared adopting the Fisher’s protected least significant difference (LSD) at p < 0.05.
3. Results
3.1. Weather Conditions and Aridity Index during Durum Wheat Growing Seasons
During the three-year period of the study, climate conditions varied considerably in comparison with historical data over the last 30 years. The total rainfall was 550 mm, 770 mm, and 177 mm during wheat growing seasons in 2020, 2021, and 2022, respectively. The 2021 season was wet (exceptionally rainy) with above-average rainfall, while 2020 was drier but with normal-average rainfall. The 2022 season was intensively dry with below-average rainfall.
During the cold periods of the wheat growing cycle, plants received sufficient water for germination and good early vigor in all three growing seasons of the study. The wheat vegetative cycle in the trial area occurred from December to March, while the reproductive cycle occurred during April and May. In the three-year study, there was about 110, 285, 50, and 160 mm of rainfall during the vegetative cycle in 2020, 2021, 2022, and the long-term period, respectively. During the vegetative cycle, the total rainfall in both seasons 2020 and 2022 was about 30% and 70% less than the average over the last 30 years, respectively, while in season 2021 rainfall was about 40% higher than the historical average. During the reproductive cycle (April-May), the total rainfall was about 70 mm, equal in both seasons 2020 and 2022 (40% less than the historical average), which was less than season 2021 (100 mm) (13% less than the historical average).
Air temperatures follow the long-term average trend and gradually decrease after durum wheat sowing until February, and then air temperatures gradually increased, reaching the highest temperature before the wheat crop harvesting. Minimum and maximum temperatures tended to gradually increase from March to June. In winter, minimum temperatures dropped to 0 °C in January 2020 and February 2021, while reaching the lowest temperature during the study, −2 °C in January 2021. The temperatures were higher during the reproductive period in the first and last growing seasons. Particularly, the maximum temperatures were 20 °C, 17 °C, 19 °C, and 17 °C in April 2020, April 2021, April 2022, and April 1992-2022, respectively. The same case in May, the maximum temperatures were 24 °C, 22 °C, 26 °C, and 21 °C in May 2020, May 2021, May 2022, and May 1992-2022, respectively.
The aridity index has been calculated by various indicators, and some include both temperature and precipitation, to better express the climatic conditions and determine crop water requirements. Differences in AI were noticed over the years. It can be noticed that 2021 was in the wet or very wet category during all season, except in May when the semi-arid condition was recorded. On the other side, 2022 was in the dry or semi-arid category during all season, except April when a wet condition was recorded. The 2020 season had higher frequent fluctuations in AI during the season. It can be described by a wet autumn and dry cold winter followed by a wet spring.
3.2. Leaf Chlorophyll Concentration and Green Area Index
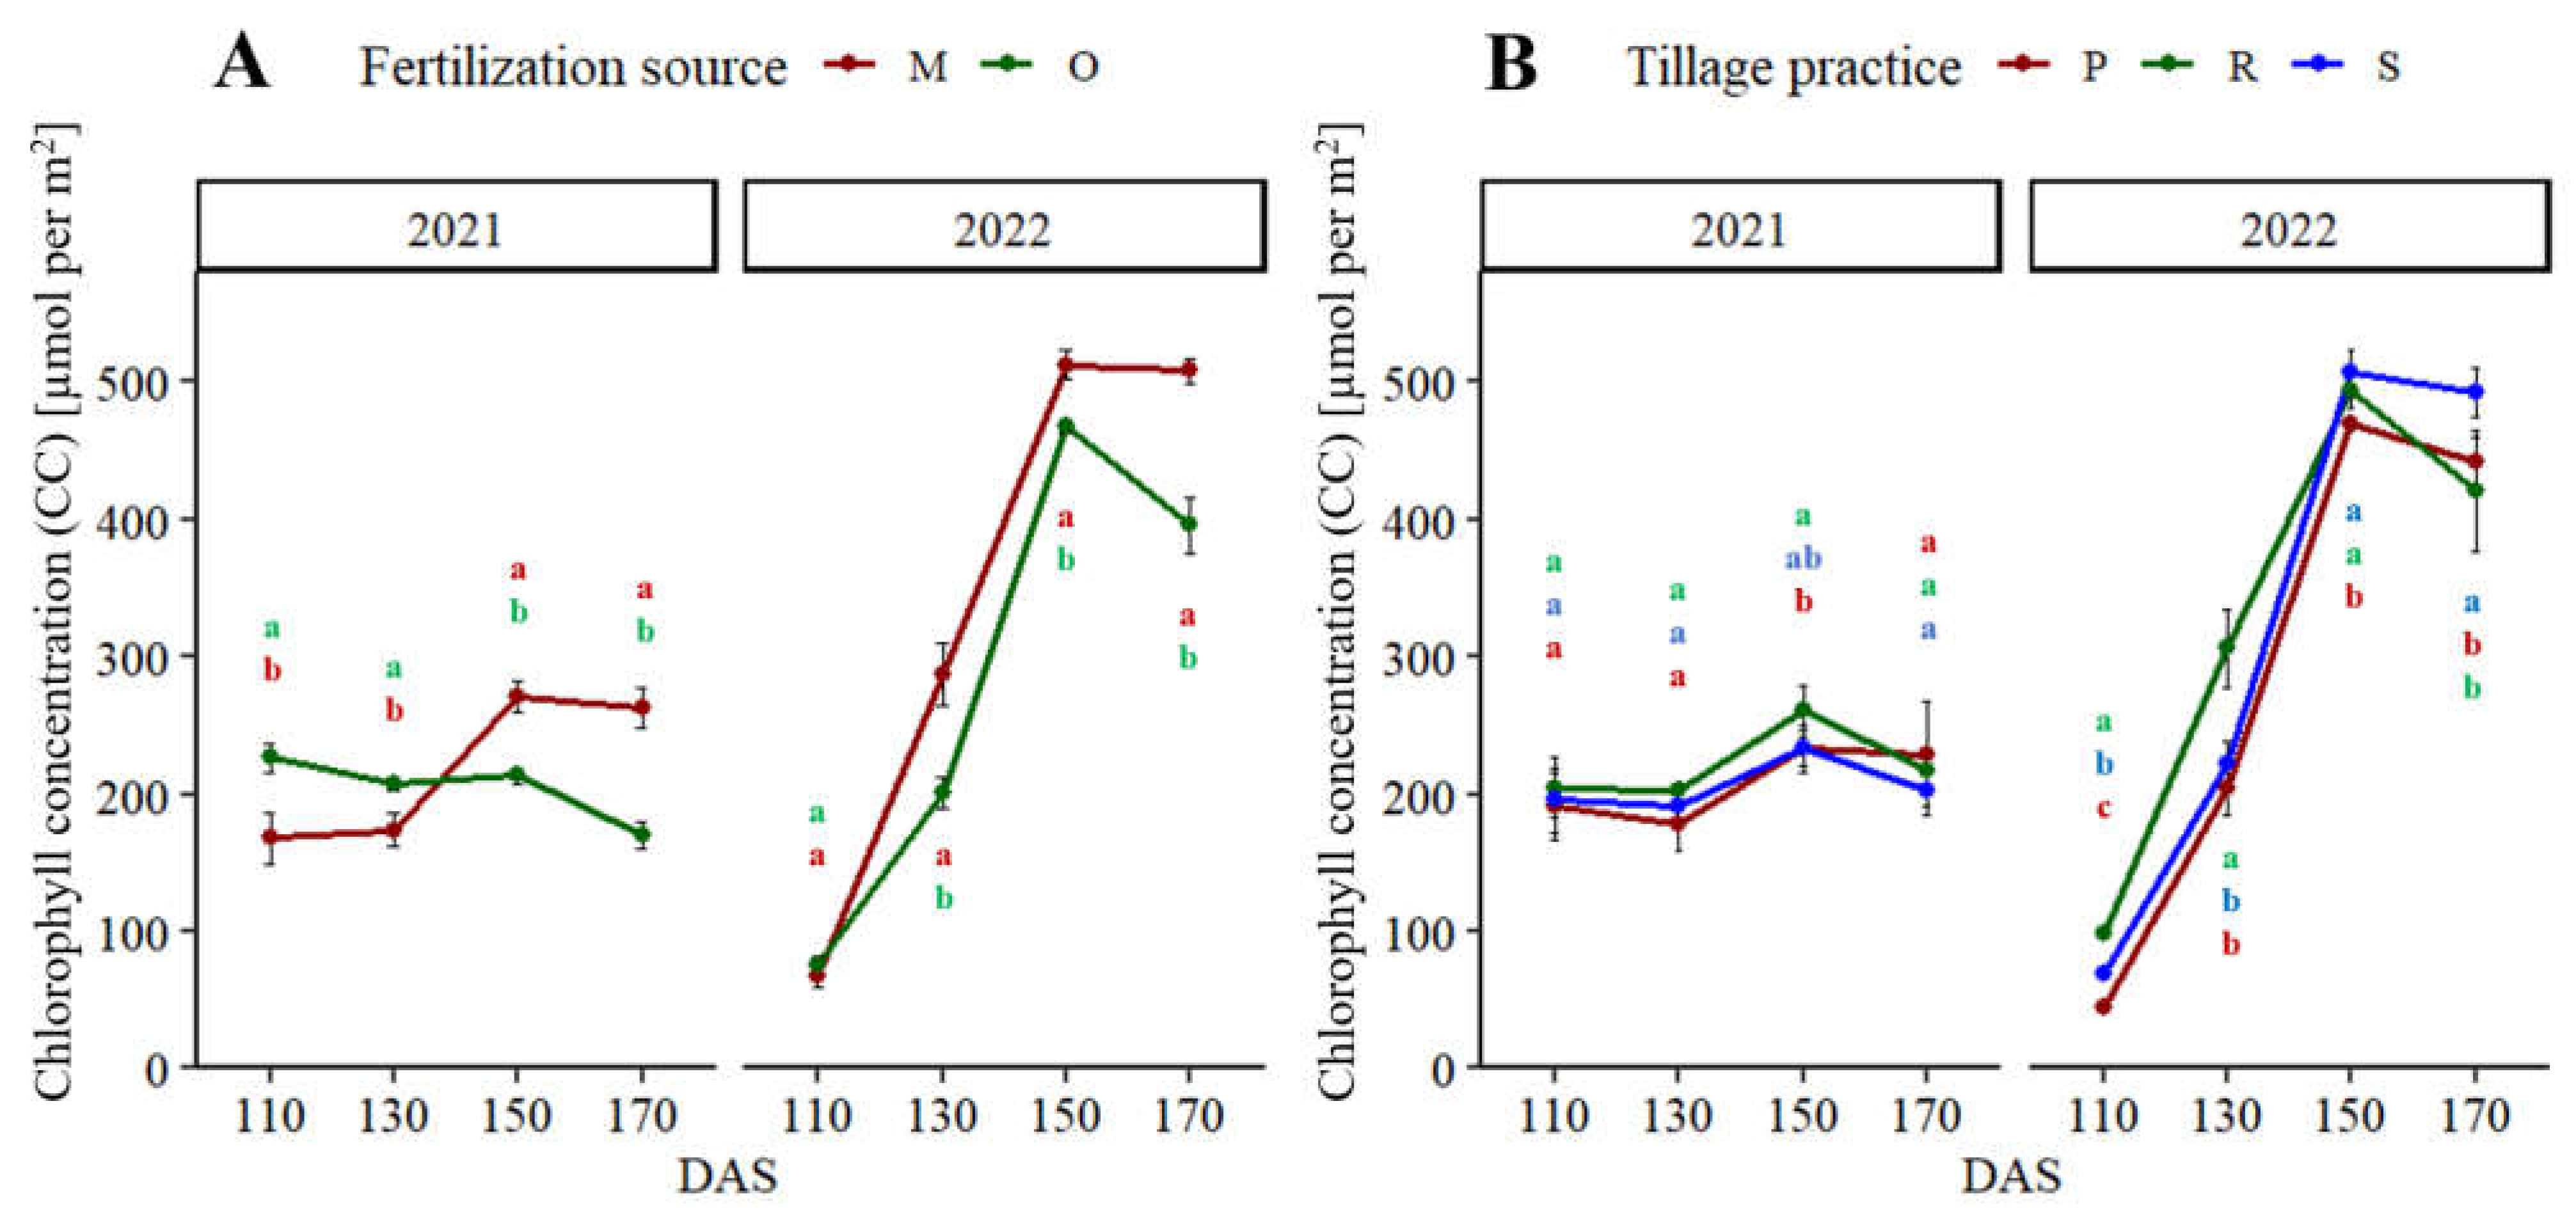
The effect of different soil tillage and fertilization management on CC measured in leaves of wheat plants at 110, 130, 150, and 170 days after sowing (DAS) of 2021 and 2022 growing seasons is shown in
Figure 2. The seasonal change in leaf chlorophyll concentration was observed from March at the end of vegetative growth stages until the end of reproductive stages in May. Different seasonal dynamics were observed for the CC in both growing seasons. In season 2021, CC slowly increased under M management after 130 DAS, reaching its maximum at 150 DAS and continuing to be the same at 170 DAS. However, O remained stable during 110, 130, and 150 DAS and slowly decreased at the end after 170 DAS. CC was similar under both fertilizer managements at 110 DAS in season 2022 before rapidly increasing after 130 DAS, reaching its maximum at 150 DAS for both nutrient sources. Significant differences were detected between soil tillage practices at each time point in 2022, while only at 150 DAS in 2021.
The range of CC in season 2021 (from 100 to 300) was less than the range in season 2022 (from 50 to 600) under all treatment combinations. Lower CC values were observed in 2022 than in 2021 growing seasons at 110 DAS, while higher at 150 and 170 DAS. Differences in CC due to fertilization management were observed at all time points in both years, except at 110 DAS only in 2022. The highest difference between both fertilizer sources in both years was found at 170 DAS. O performed better than M at 110 and 130 DAS only in season 2021, while there were no significant differences between fertilizers at 110 DAS in season 2022 (
Figure 2). In comparison with P, R tended to be higher at 110, 130, and 150 DAS in both growing seasons. However, significant differences were detected between R and the conventional practice P at 150 DAS in 2021 and earlier at 130 and 150 DAS in 2022. No significant differences were detected between P and S at all time points in 2021, while S performed significantly better at 150 and 170 DAS in 2022 (
Figure 2).
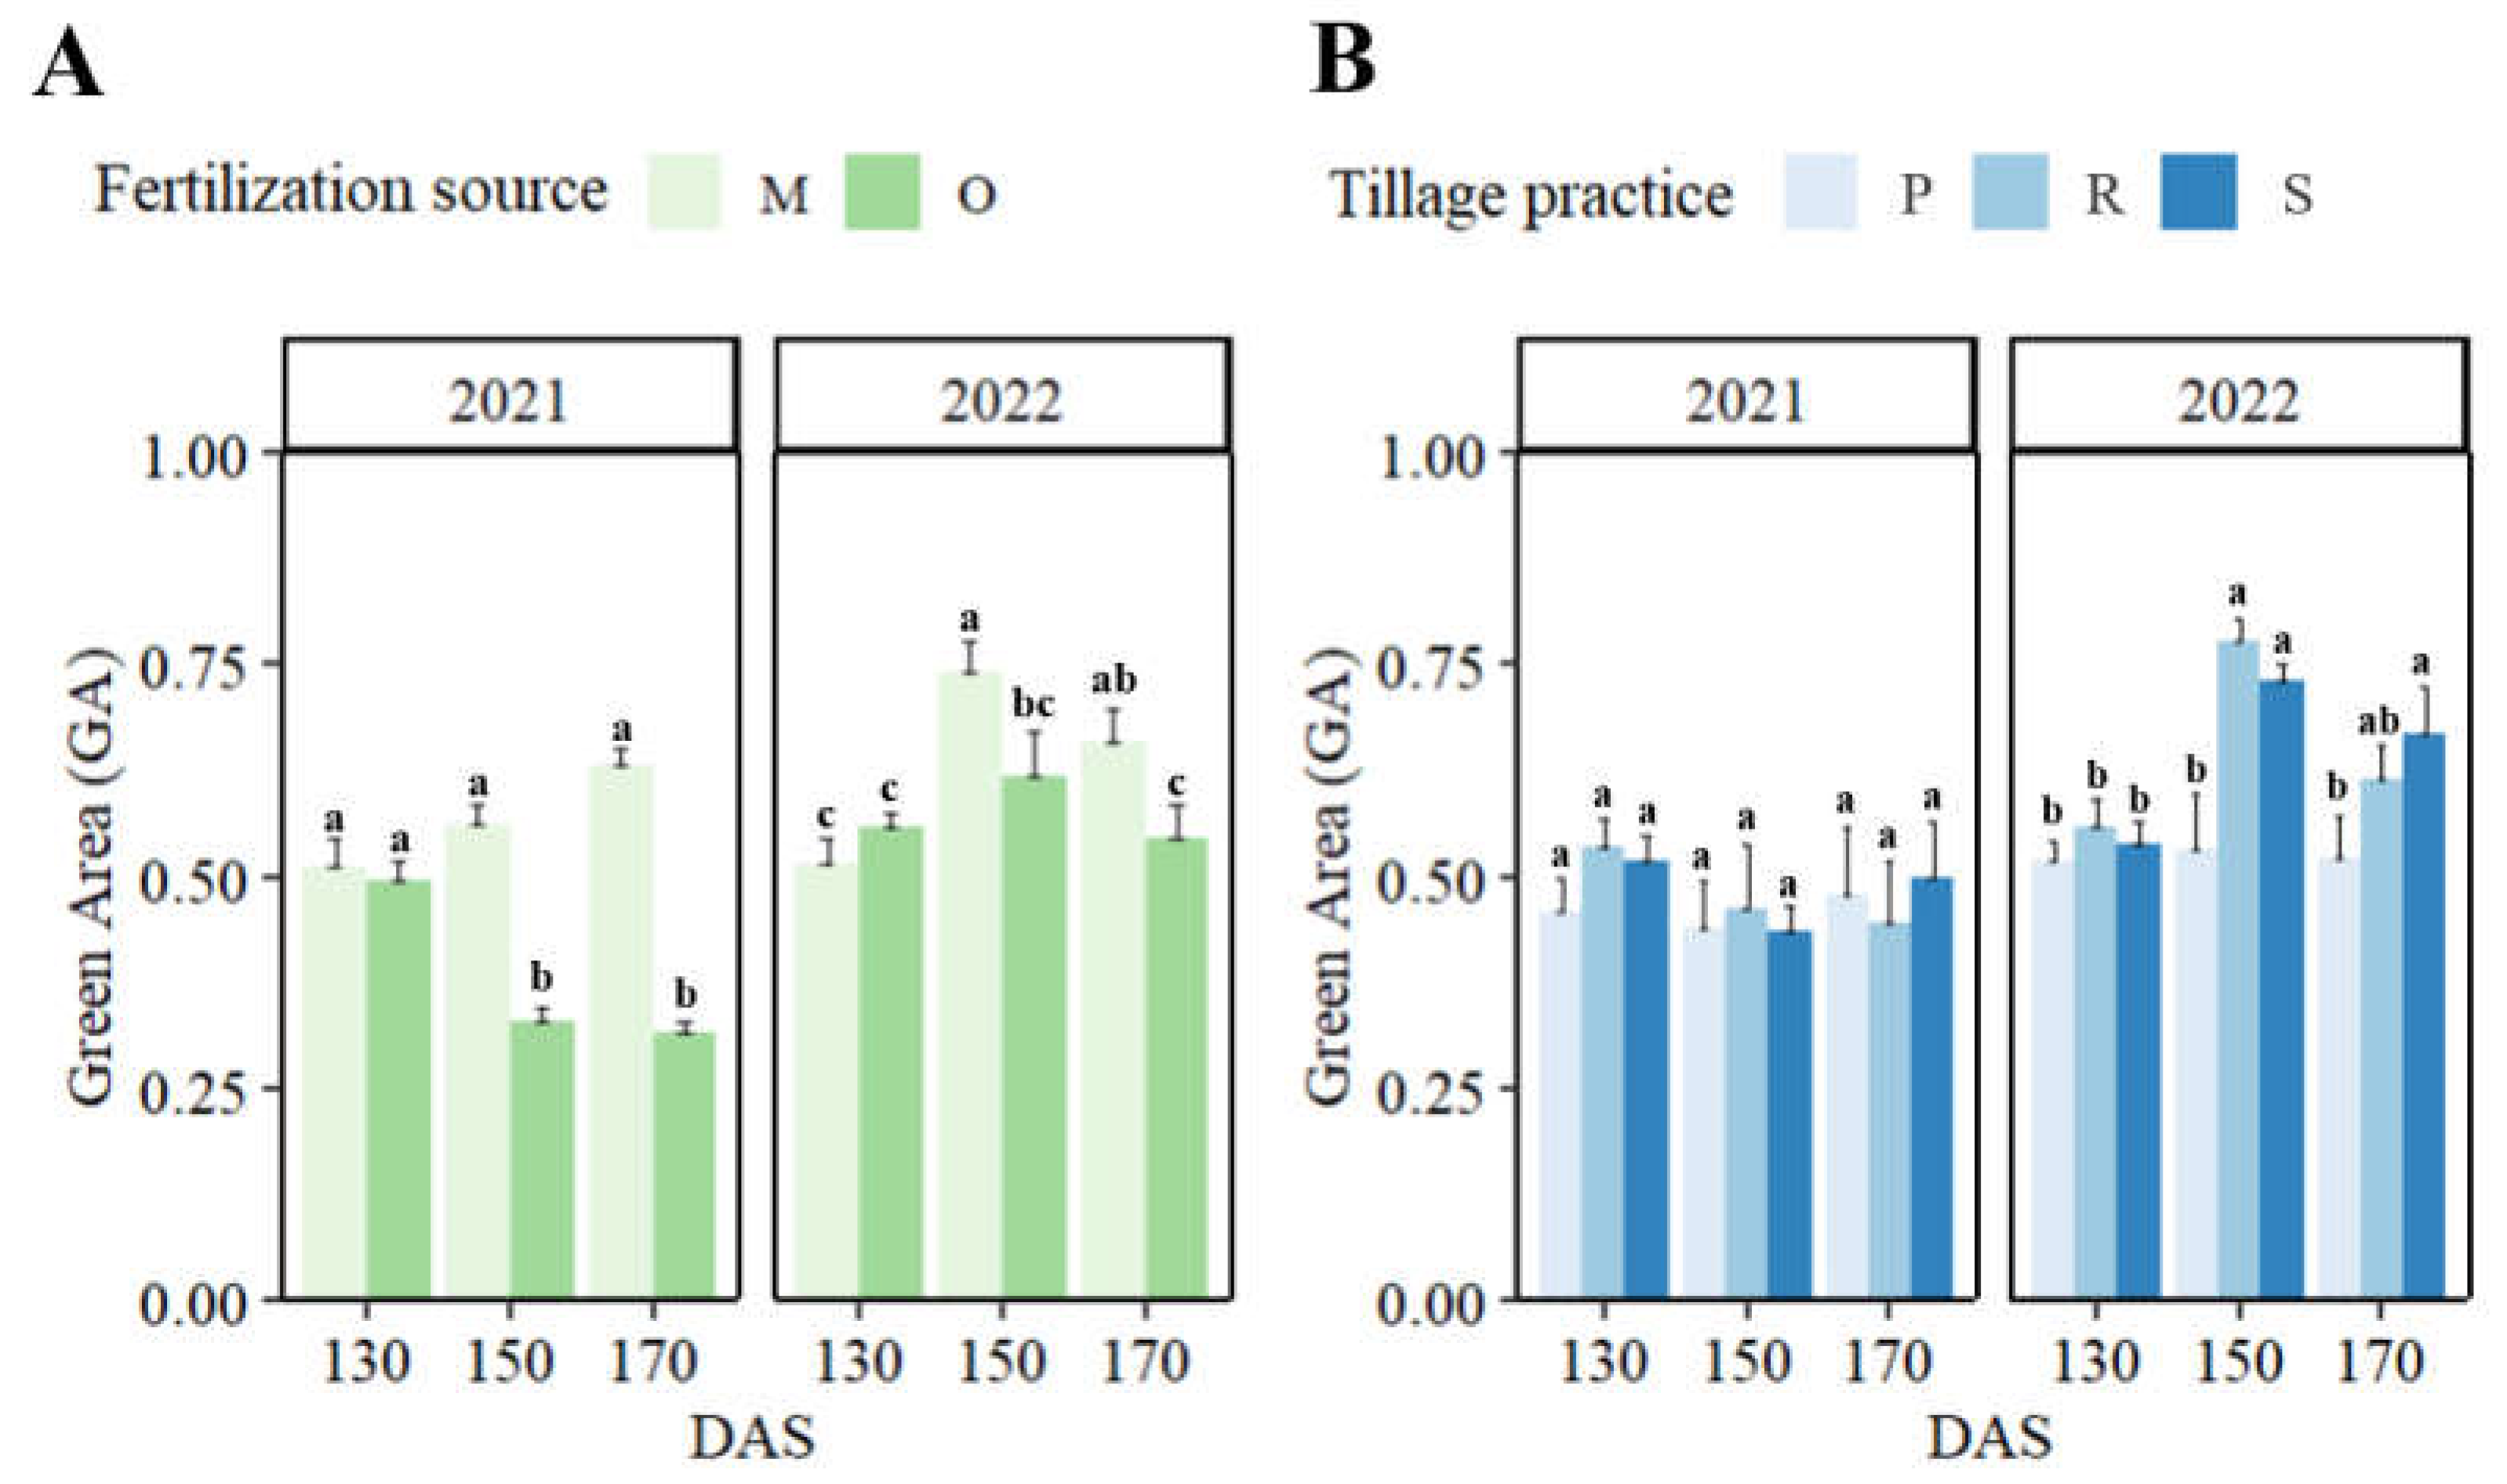
In addition, soil tillage and fertilization management significantly affected the green area index (GA) during both durum wheat growing seasons. Significant differences between fertilization treatments for GA were observed at 150 and 170 DAS in both growing seasons (
Figure 3). The inorganic fertilizer performed better than the organic fertilizer in both seasons. Moreover, significant differences were also detected at 150 and 170 DAS between tillage practices, but only in the 2022 growing season. In this study, GA was able to detect differences between fertilizer treatments in both seasons. It was not able to detect differences between tillage systems in 2021, however, the R and S tended to be higher than P at 130 DAS.
3.3. Crop Yield and Yield Components
Due to non-significant year by treatment interactions for most of the variables evaluated, the focus of the study was on the main effects of each factor. Average yield production and yield components in the three growing seasons and under different soil tillage and fertilization managements are reported in
Table 2. Fertilization source had a significant impact on both grain yield and straw production, while tillage system only affected grain production. Mineral fertilizers (M) as a nutrient source resulted in 18% and 11% advantage compared with compost (O), in terms of grain yield and straw production, respectively. On the other hand, both conservation tillage systems, subsoil (R) and spading machine (S) led to 13% higher grain yield in comparison with the conventional practice (P). Moreover, significant impacts were detected between the growing seasons on grain yield and consequently HI. The average production in the 2020 and 2022 growing seasons was about 40% and 30% higher in terms of grain yield and HI, respectively, both in comparison with the 2021 season.
In comparison with compost, M led to a positive significant impact on the number of spikes per m
2 and the number of kernels per spike, and a negative impact on thousand kernels weight (TKW). The number of spikes and number of kernels per spike increased by about 24% and 9%, respectively, when using M. Although the total biomass production in terms of grain and straw was higher using M in comparison with O, TKW was significantly higher by about 5% when using organic fertilizer (
Table 3).
Different amounts combined with different distributions of rainfall contributed to different durum wheat responses, as was noticed by highly significant effects between years for all yield components characteristics. As reported previously, both seasons 2020 and 2022 were not significantly different in terms of grain yield and HI. In addition, climate conditions in both seasons affected significantly and positively wheat productions in comparison with season 2021. However, significant differences were found between the three growing seasons on all yield components measurements in this study. The tiller fertility (%), number of spikelets per spike, and number of kernels per spike were the highest in the last season 2022, followed by season 2020, and these components were the worst in 2021. Different trends between years on their effect on the number of spikes per m2 and TKW. In 2021, the highest number of spikes per m2 was detected compared with the other two seasons. While TKW was the highest in 2020 followed by 2021, and the lowest in 2022.
3.4. Relationships between CC and GA Readings at Different Growth Stages against Grain Yield
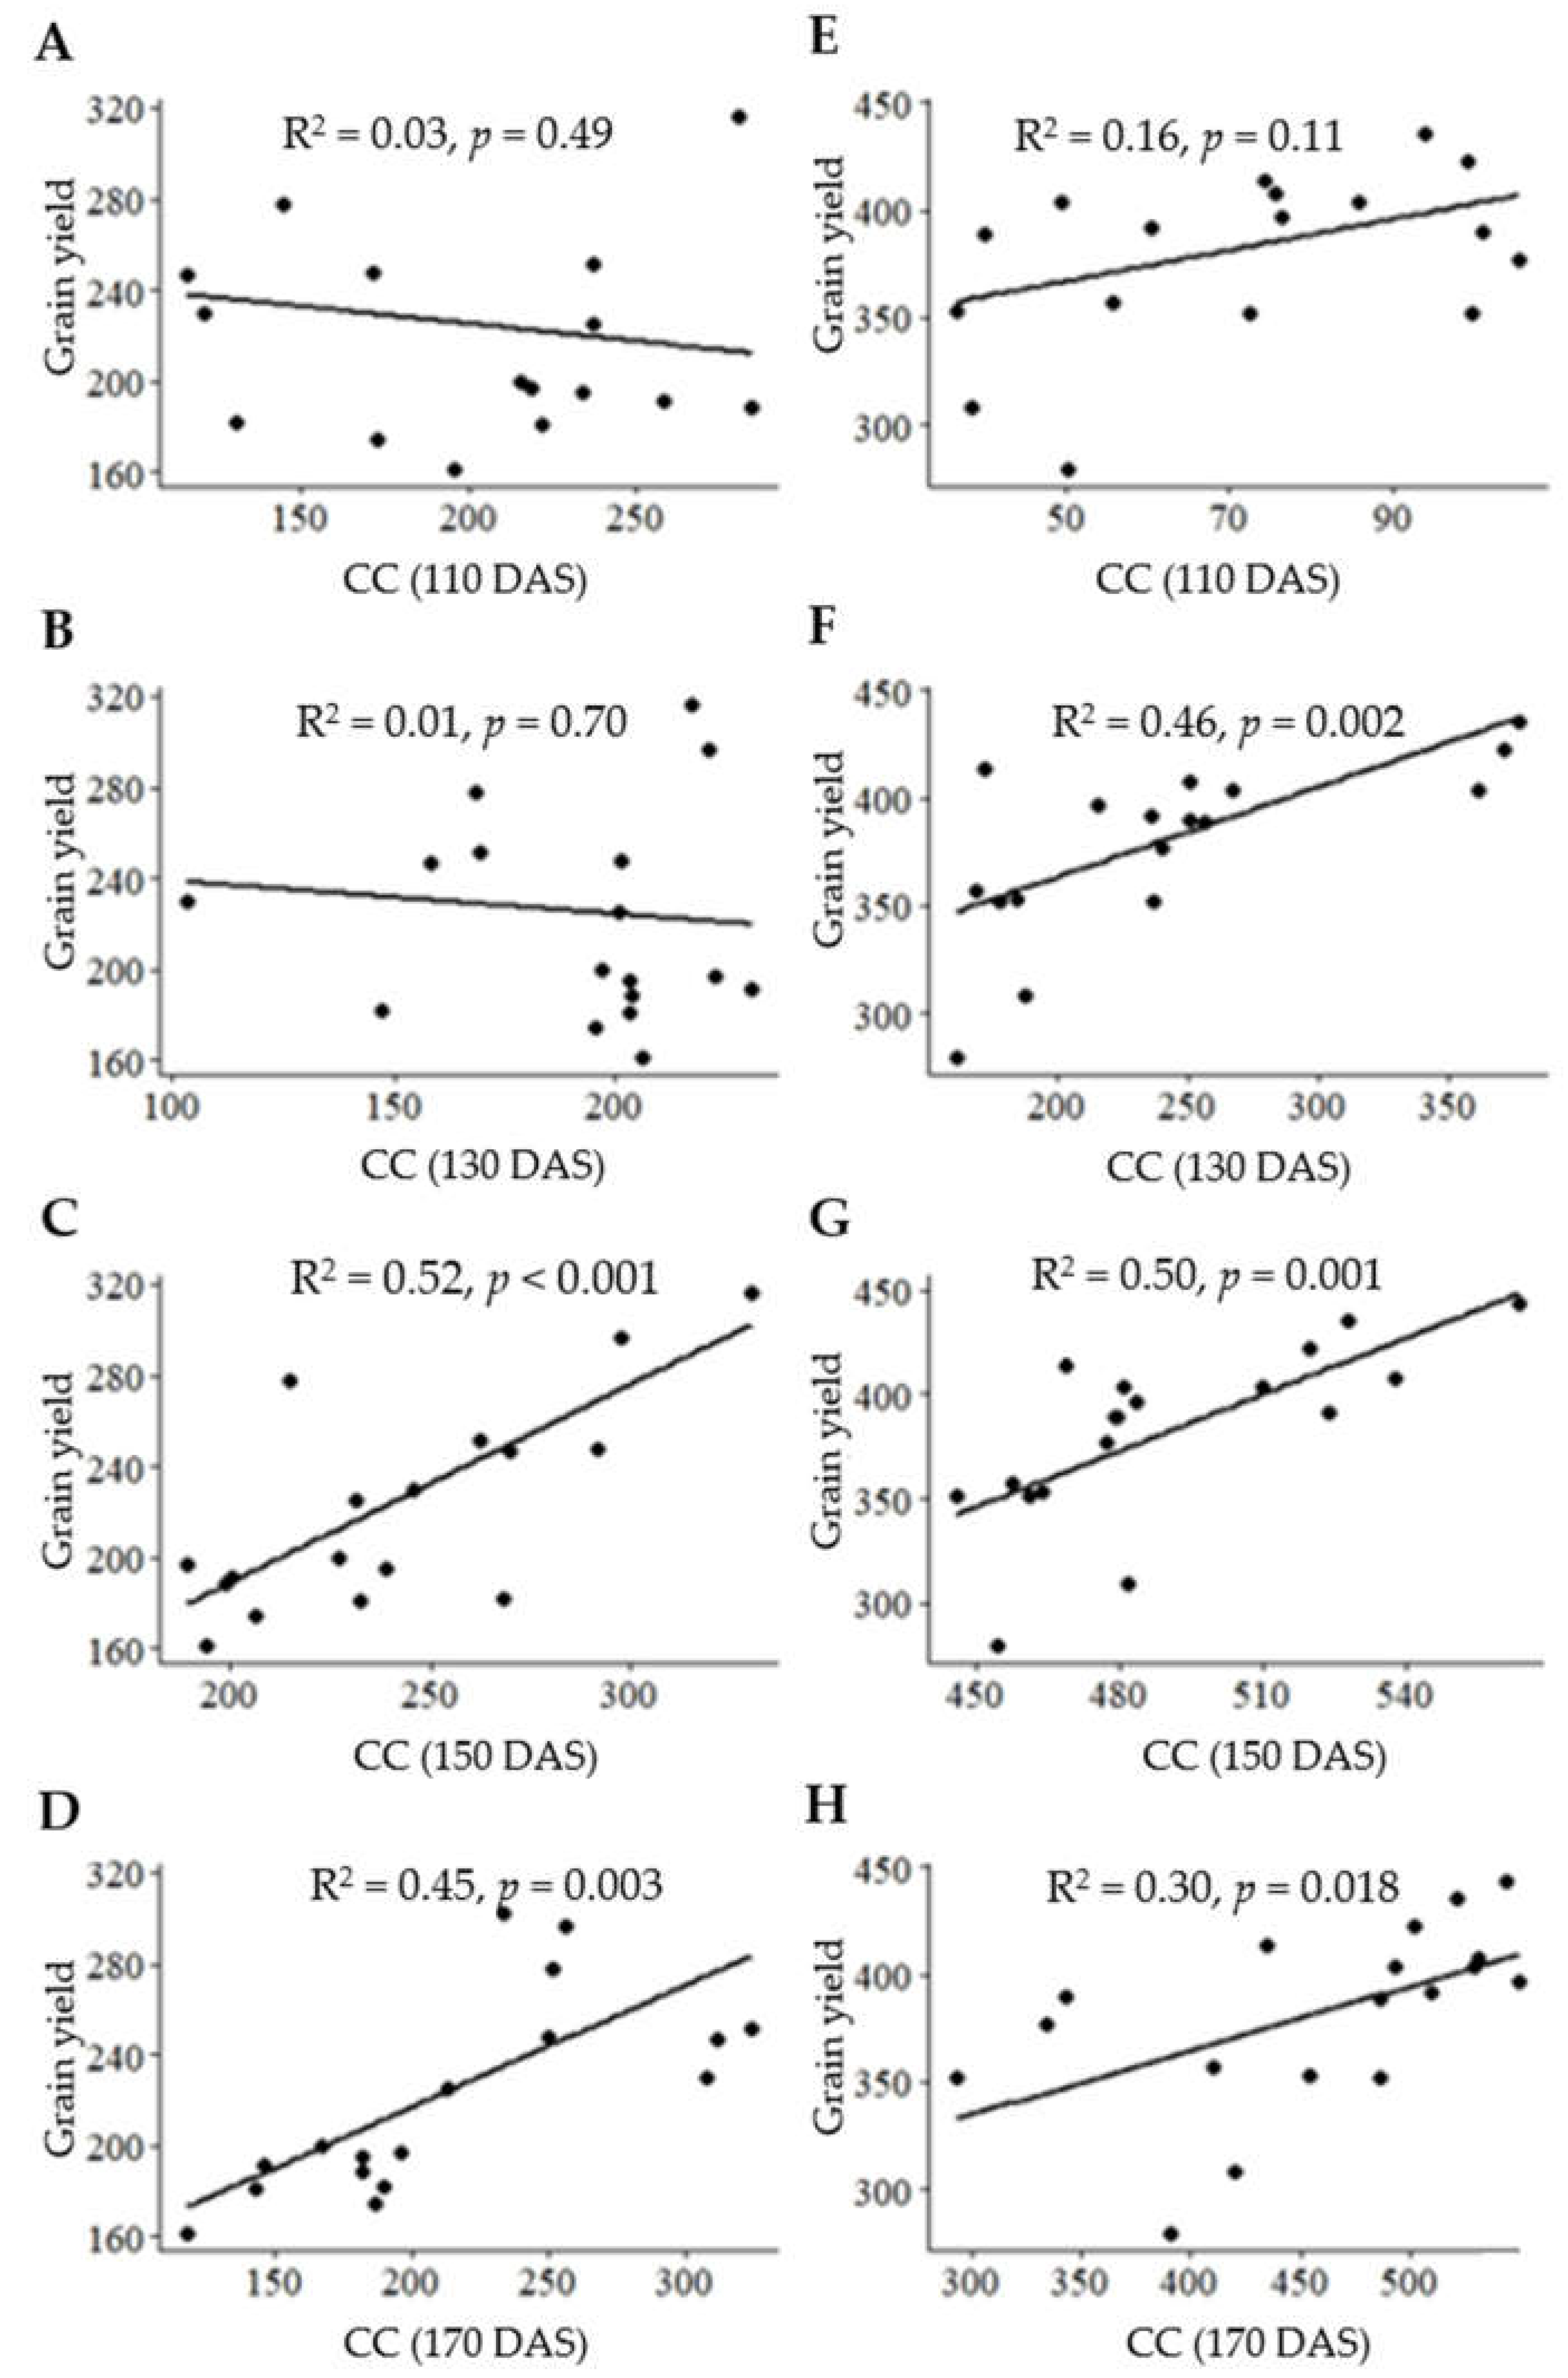
CC values and grain yields of durum wheat under different farming practices were examined during two cropping seasons. The scatter plots showing the collected CC values at different dates against crop grain yield are displayed in
Figure 4. Significant positive relationships were detected between grain yield and CC values in each growing season (
Figure 4). In 2021, significant relationships were detected between grain yield and CC values at 150 and 170 DAS, while earlier at 130, 150, and 170 DAS in 2022. However, the strongest relationship (R
2 = 0.5,
p < 0.001) was observed at 150 DAS in both growing seasons.
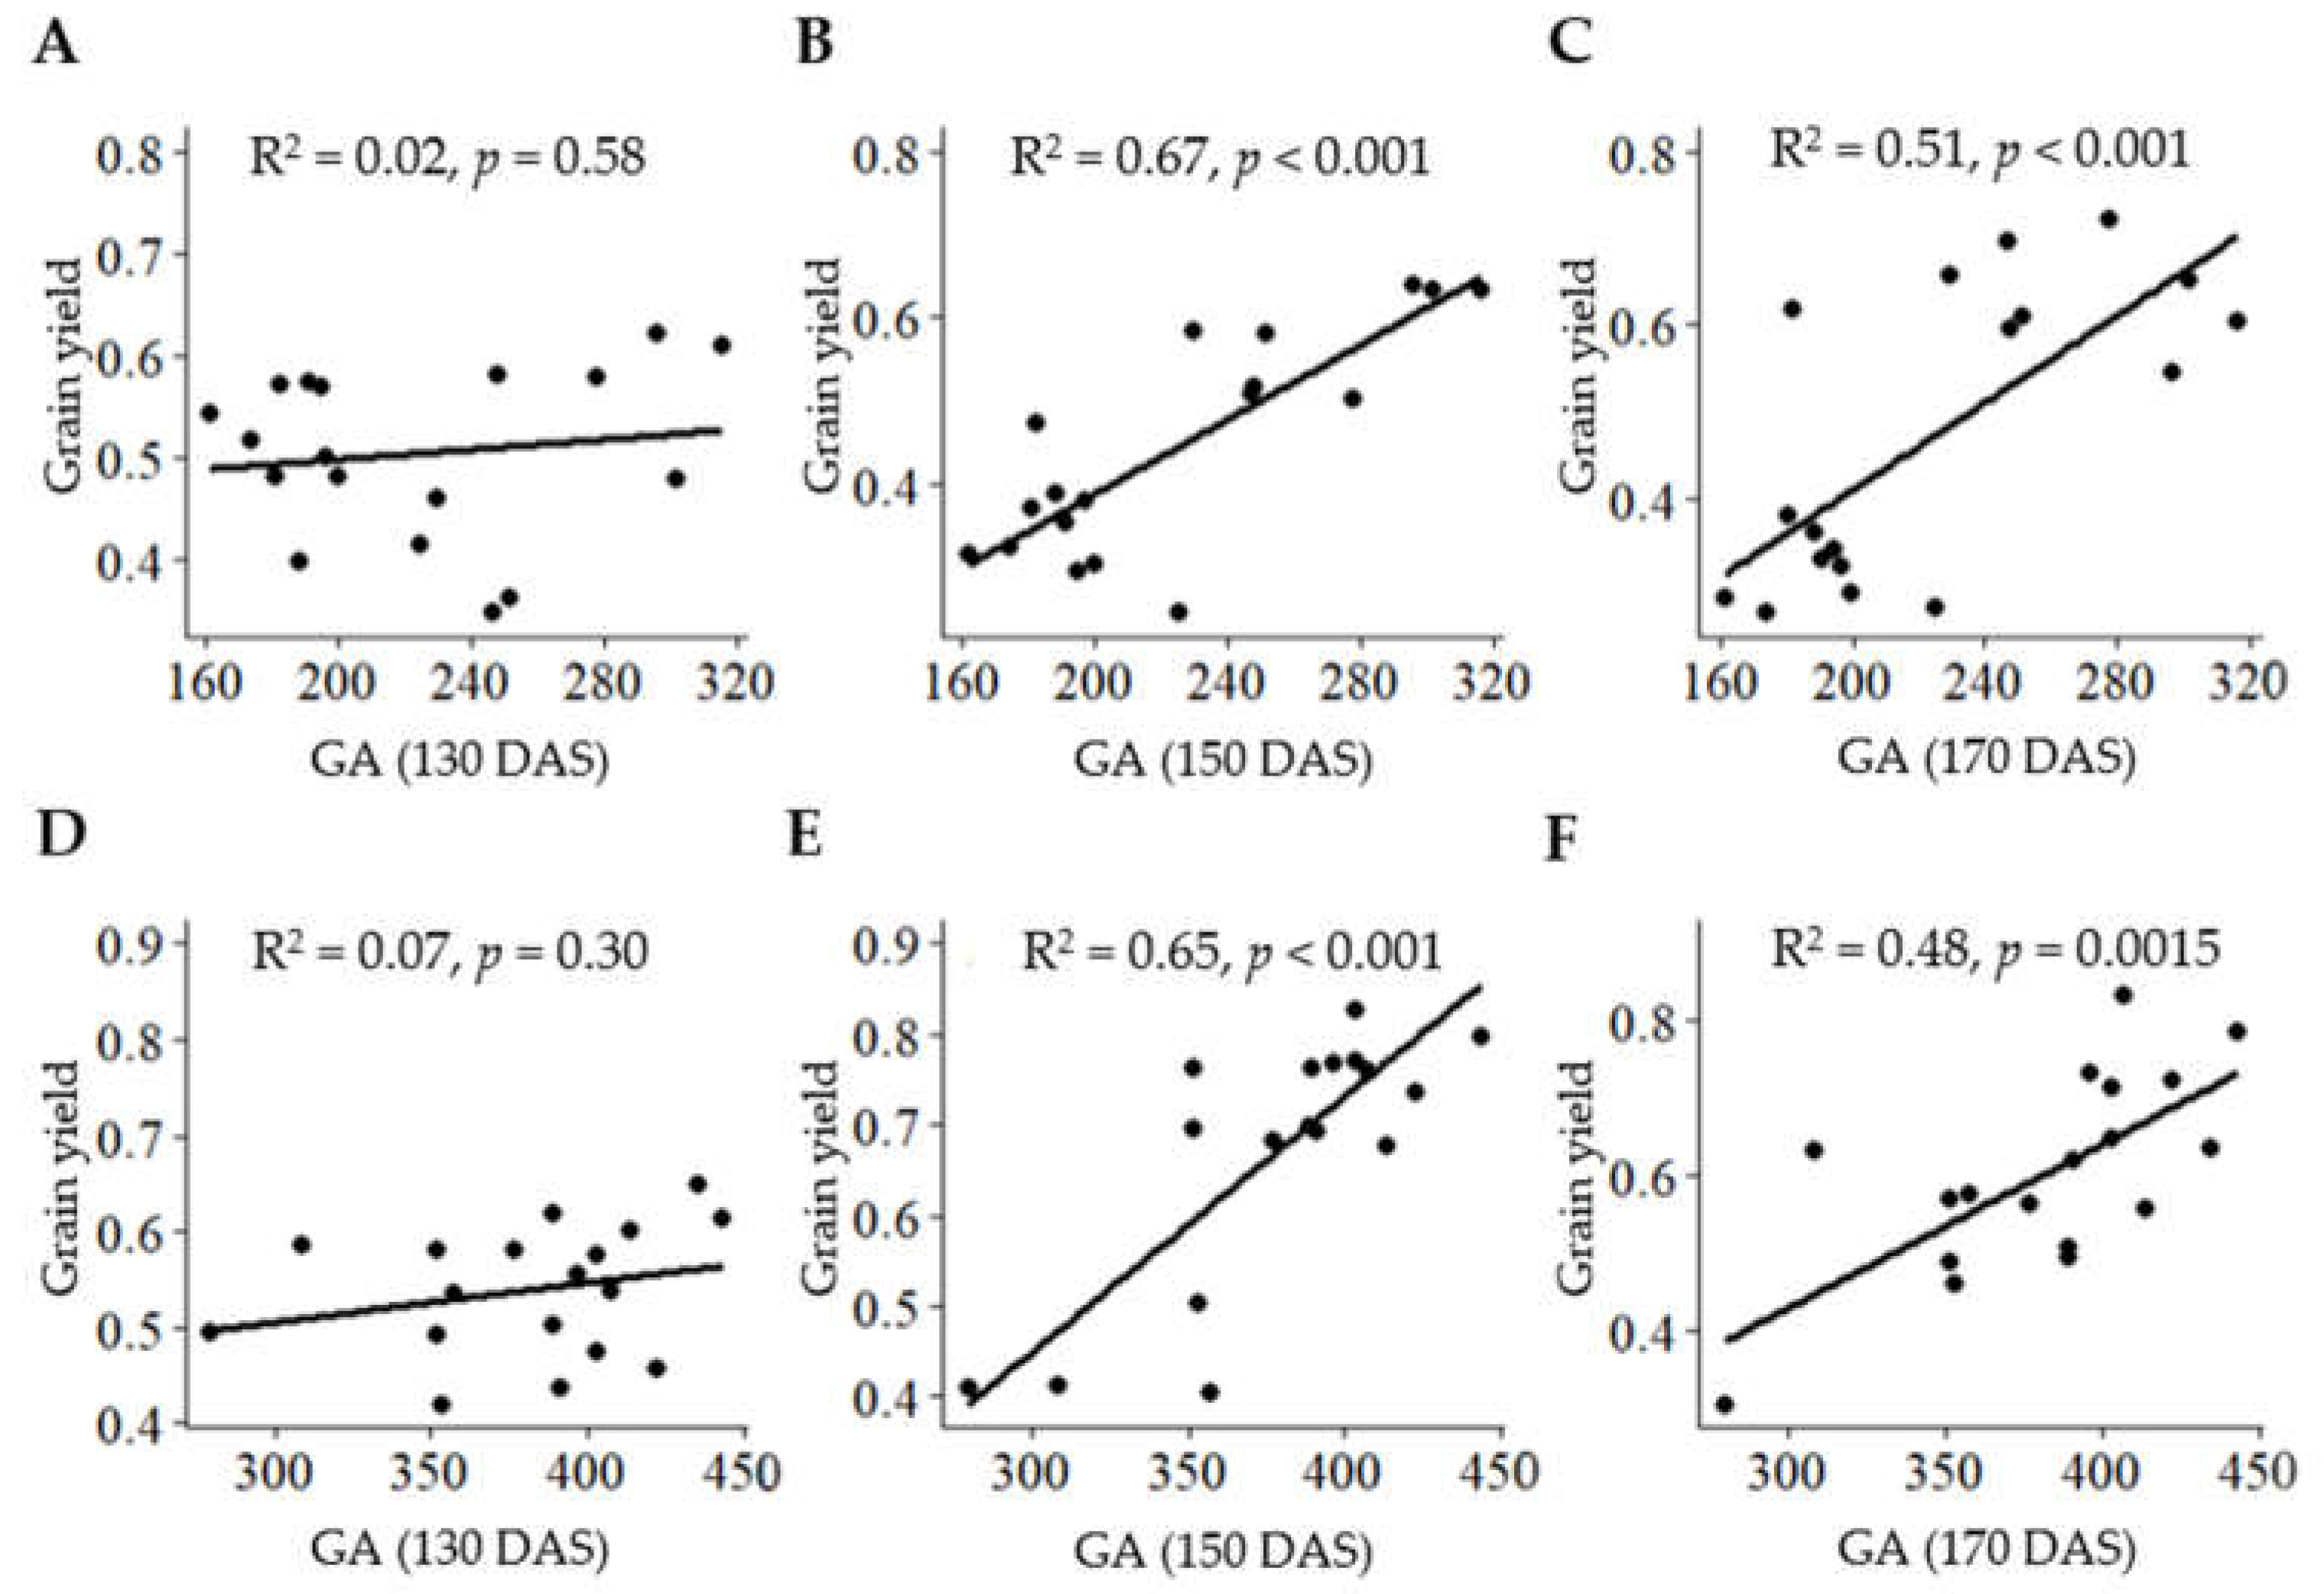
GA and grain yields of durum wheat under different farming practices were examined during two cropping seasons. The scatter plots showing GA values at different dates against crop grain yield are displayed in
Figure 5. Significant positive relationships were detected between grain yield and GA values in both years. In both growing seasons, significant relationships were detected between grain yield and GA values at 150 and 170 DAS. The strongest relationship (R
2 = 0.5,
p < 0.001) was observed at 150 DAS in both growing seasons (
Figure 5).
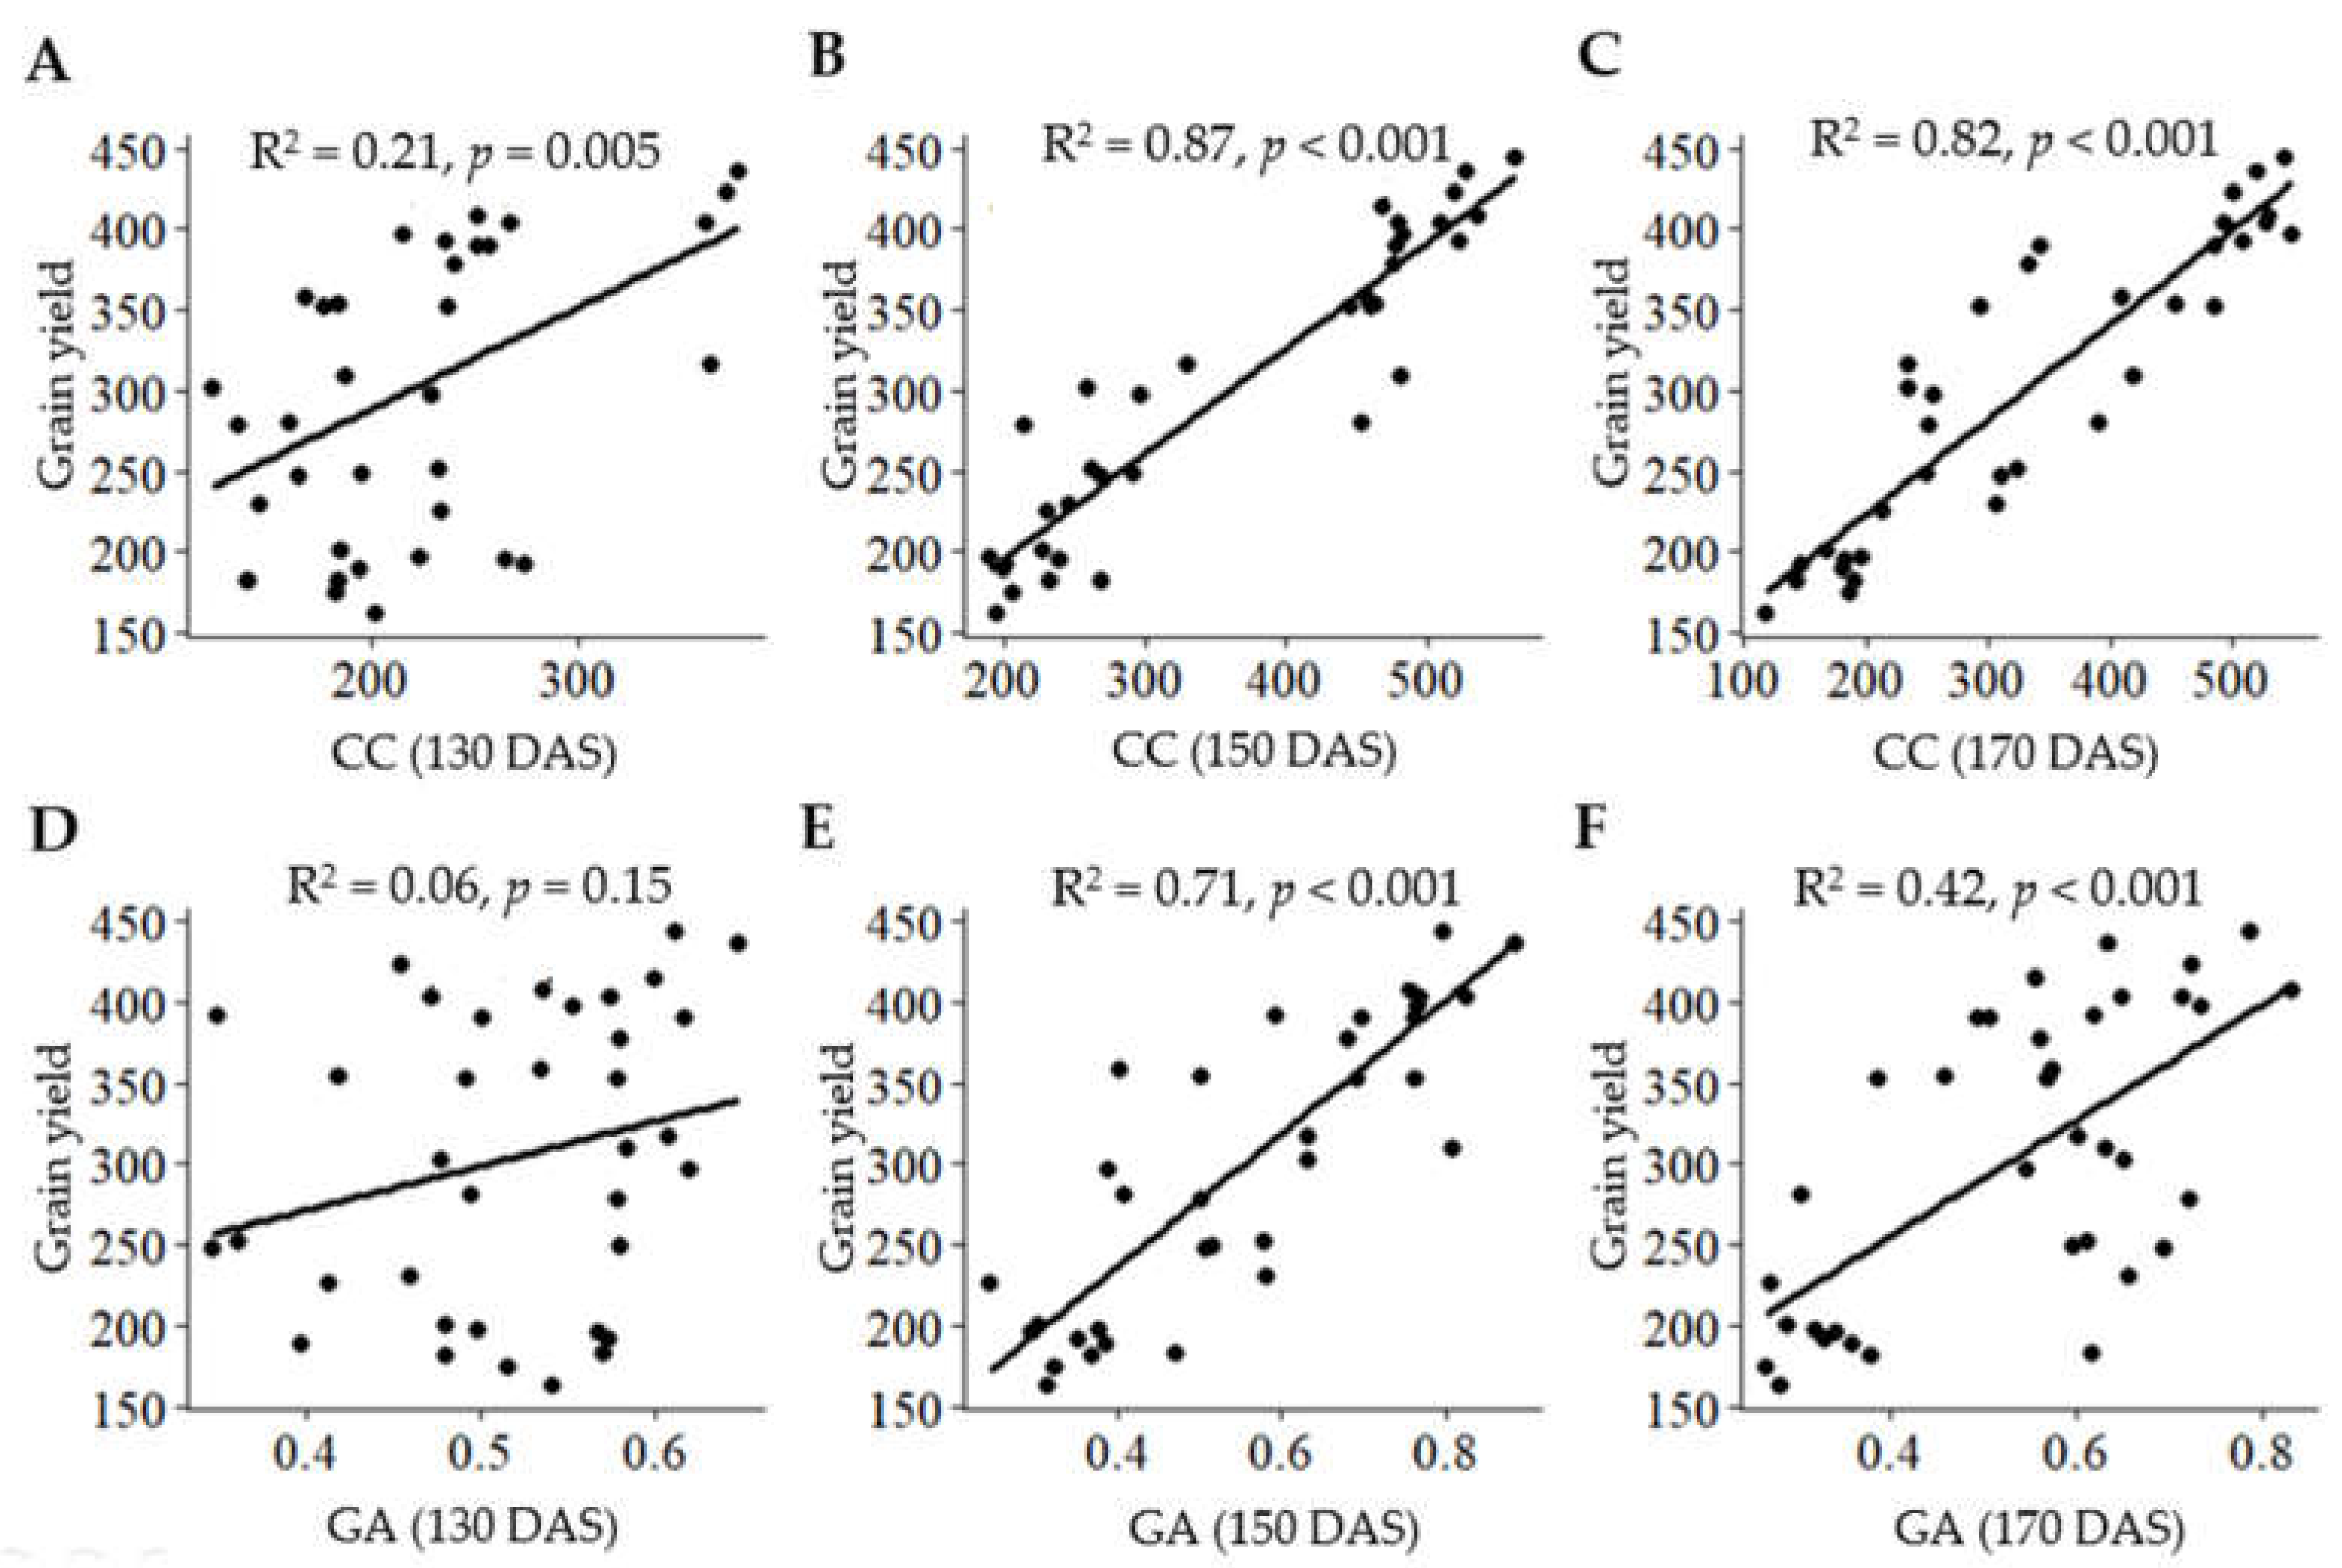
The analysis of the two years together revealed the strongest relationship between CC and grain yield (R
2 = 0.87,
p < 0.001), and between GA and grain yield (R
2 = 0.71,
p < 0.001) which was observed at 150 DAS (
Figure 6). In addition, significant positive relationships were detected between grain yield and CC values at 130, 150 and 170 DAS, while only significant relationships between grain yield and GA values were identified at 150 and 170 DAS (
Figure 6).
3.5. Soil Attributes
Overall, significant effects were detected for both tillage and fertilization management on the total carbon % in soil. However, no significant effects were detected for the total N %. Mineral fertilizers provide large amounts of nutrients, mainly N, P, and K, that plants need to grow strong. While organic sources such as compost increased organic carbon for healthy soils, in this study, higher total carbon in the soil was detected under O compared with M, regardless of the soil tillage system. Moreover, reduced tillage practices represented by subsoil or spading machine have increased total organic carbon compared to conventional practices.
4. Discussion
The variability of climate conditions significantly influenced grain yield production and harvest index (HI), which was statistically higher in both 2020 and 2022, than in 2021. However, this positive impact on grain yield was mainly due to high TKW in 2020, while due to higher tiller fertility (%), higher number of spikelets per spike, and higher number of kernels per spike in 2022. These quantity parameters were the lowest in 2021 when the highest number of spikes per m
2 was observed. A higher number of spikes per m
2 (more than 500 spikes m
−1) was associated with a high number of sterile spikes (90% tiller fertility) in 2021. The total amount of rainfall during the vegetative stages in 2021 was higher than the historical average by about 40%, leading to elongation of the vegetative stage, expressed with a high number of tillers. It should be mentioned that the minimum temperature dropped to −4 °C in the spring in the first week of April 2021, which might have a harmful effect on crop grain yield. Moreover, in both 2020 and 2022, wheat plants experienced dry conditions during the vegetative growth stages. Interestingly, a little but sufficient rainfall during the reproductive period (April) in 2022 growing season was positively related to higher crop yield production. It should be mentioned that the Antalis cultivar used in this study is especially suitable for hard environments of Italian dry farming [
22].
In this study, grain yield was improved by conservation tillage. On average, subsoil tillage and spading machine promoted around 13% higher yield than the conventional tillage practice. Similarly, Tabiehzad et al. [
23] indicated higher wheat grain yield under subsoil tillage compared with the conventional practice. Moreover, it was reported [
24] that crop rotation and conservation tillage practices such as subsoil practice resulted in increasing crop grain yield in comparison with conventional tillage. Subsoil tillage conserved water and enhanced water use efficiency and wheat crop yield [
25]. The spading machine represented an optimal option to maintain satisfactory durum wheat yield under the same conditions of the study [
26]. Moreover, higher soil organic carbon, water content, and water-stable aggregates when using spading machine compared with plough was reported [
27].
The number of spikes per m
2 was found to be significantly higher under R than P, which showed the same performance observed for grain yield production. Lopez-Bellido et al. [
15] reported that the main effect of soil tillage on crop yield is the number of ears per m
2. This was the only yield component that showed significant differences between soil tillage practices in this study. This could be related to the fact that tillage practice is more associated with the number of tillers and spikes per unit area. However, Montemurro et al. [
28] found no differences between conventional and reduced tillage techniques on that parameter, as in the case between P and S, even if S tended to be higher in this study. Conservation tillage systems are valuable options in the Mediterranean basin for sustainable crop production. In this study, conservation tillage practices performed better than the conventional practices, which might be explained by the medium-term adoption of conservation tillage techniques, as this is the 4th year since the experiment started.
In addition, it was reported by [
28,
29] that fertilization sources had a great impact on wheat fertility under Mediterranean conditions. This was observed in this study by significant impacts of the inorganic fertilizer effect on both grain yield and straw production. It was also found that this positive impact of M was mainly due to increasing the number of spikes per m
2 and the number of kernels per spike. A higher number of kernels per m
2 was one of the main reasons for these impacts on grain yield [
28]. On the other side, a smaller kernel number was reported when depending on O, while increased kernel size was observed in comparison with M. Interestingly, thousand kernels weight (TKW) as a grain quality parameter was positively affected by O compared with M fertilizer. Montemurro et al. [
28] compared several N sources on wheat yield components and found that TKW, when using compost (O), was higher than the inorganic fertilizer. The same treatments under the same conditions were compared [
30], and high TKW related to organic fertilizers was also detected. The application of organic fertilizer negatively affected grain production and most of the yield components in comparison with the inorganic fertilizer, although it presented an increase in TKW as a grain quality parameter and the total carbon in the soils.
Wheat plants receiving inorganic fertilizer (M) at 150 and 170 DAS in 2021, and earlier at 130, 150, and 170 DAS in 2022 showed higher CC values compared to the organic fertilizer (O), thus giving the higher grain yield. Significantly higher grain yield reduction occurred in treatments using sole organic fertilizers might be related to N supply in organic treatment, as it is generally limited due to slow N mineralization compared to crop N demand. Moreover, significant positive relationships were detected between grain yield and CC values in both years, from 150 until 170 DAS in 2021, and 130 until 170 DAS in 2022. However, the strongest relationship (R
2 = 0.5,
p < 0.001) was observed at 150 DAS in both growing seasons. It has been reported in several studies that the flowering stage is the most critical time regarding the effect on the final crop yield. Islam et al. [
31] reported that this relationship between leaf chlorophyl content and grain yield became stronger at the reproductive period of crops. In addition, Monostori et al. [
32] reported chlorophyll content indications at the heading growth stage could deliver a precise and accurate estimate of the final yield in wheat crop. The study highlights that the maintenance of optimal leaf chlorophyl concentration (CC) around heading time is essential to obtain higher grain yield under study conditions.
As shown previously, the results reflect a positive strong linear relationship between GA and grain yield in each growing season. Significant associations were detected between grain yield and GA only at 150 and 170 DAS. Yousfi et al. [
33] found that the vegetation index GA was significantly associated with the grain yield of durum and bread wheats at the heading and grain filling stages, and they highlighted GA as a valuable tool to assess crop development under Mediterranean conditions. Jansone et al. [
34] indicated a positive significant association between GA and wheat grain yield at the grain filling stage. However, del Pozo et al. [
35] reported that RGB-derived vegetation indices such as GA have less ability to capture the characteristics of green biomass after the booting stage. In this study, the maintenance of canopy vigor and crop biomass (GA) around 150 days, regardless of growth stage, is essential to obtain a higher grain yield.
5. Conclusions
The results obtained in this study indicate that conservation tillage systems are valuable options in the Mediterranean basin for sustainable crop production. The study highlights the importance of conservation tillage practices such as subsoil and using spading machine, combined with rotation cropping systems to enhance crop productivity and the total carbon in the soils, compared with the traditional ploughing tillage.
Grain yield reduction was observed when depending on compost as an organic fertilizer compared with mineral fertilizers. However, higher TKW could be achieved under organic management. Furthermore, organic fertilizer led to an increase in soil quality through higher total carbon content in the soil in comparison with inorganic fertilizers, especially when the compost application is repeated over time.
Both MC-100 and high throughput imaging techniques as non-destructive low-cost methods were successfully able to detect differences between treatments and reported a strong association with wheat grain yield under different fertilizer and soil tillage managements. In addition, they could be used as a successful tool to examine plant reactions to climatic conditions during crop growing seasons.
Although differences in both the amount and distribution of rainfall between the different years of the study, year interactions with treatments, apart from relation of certain yield components, were not significant for crop yield production and yield components. This may suggest that treatments included in this study are more affected by site-specific adaptation of farming management such as water and nutrient management, rather than different climate conditions.


 ,
, 


