Article

Soil Bacteria Mediate Soil Organic Carbon Sequestration under Different Tillage and Straw Management in Rice-Wheat Cropping Systems

1
International Magnesium Institute, College of Resources and Environment, Fujian Agriculture and Forestry University, Fuzhou 350002, China
2
Key Laboratory of Genetics and Germplasm Innovation of Tropical Special Forest Trees and Ornamental Plants, College of Forestry, Hainan University, Ministry of Education, Haikou 570228, China
3
State Key Laboratory of Hydraulic Engineering Simulation and Safety, School of Civil Engineering, Tianjin University, 135 Yaguan Road, Jinnan District, Tianjin 300350, China
4
College of Forestry, Fujian Agriculture and Forestry University, Fuzhou 350002, China
5
Kaifeng Academy of Agriculture and Forestry, Kaifeng 475004, China
6
MOA Key Laboratory of Crop Ecophysiology and Farming System in the Middle Reaches of the Yangtze River, College of Plant Science & Technology, Huazhong Agricultural University, Wuhan 430070, China
*
Author to whom correspondence should be addressed.
These authors contributed equally to this work.
Agriculture 2022, 12(10), 1552; https://doi.org/10.3390/agriculture12101552
Submission received: 11 August 2022 / Revised: 21 September 2022 / Accepted: 22 September 2022 / Published: 26 September 2022
(This article belongs to the Special Issue Innovative Conservation Cropping Systems and Practices)

Abstract

:
Soil organic carbon (SOC) largely influences soil quality and sustainability. The effects of no-till (NT) and crop straw return practices (SR) on soil organic carbon sequestration have been well documented. However, the mechanism of soil bacterial community in regulating soil organic carbon under NT and SR remains unclear. In this study, we investigated the impacts of tillage (conventional tillage (CT) and NT) and crop straw return practices (crop straw removal (NS) and SR) on topsoil layer (0–5 cm) bacterial community, CH4 and CO2 emissions and SOC fractions in rice-wheat cropping system. Overall, in the wheat season following the annual rice-wheat rotation in two cycles, NT significantly increased SOC by 4.4% for 1–2 mm aggregates in the 0–5 cm soil layer, but decreased CO2 emissions by 7.4%. Compared with NS, SR notably increased the contents of SOC in the topsoil layer by 6.5% and in macro-aggregate by 17.4% in 0–5 cm soil layer, and promoted CH4 emissions (by 22.3%) and CO2 emissions (by 22.4%). The combination of NT and NS resulted in relatively high SOC and low CH4 emissions along with high bacterial community abundance. The most abundant genus under different treatments was Gp6, which significant impacted SOC and MBC. Bacterial communities like Subdivision3 had the most impact on CH4 emissions. Structural equation modeling further suggested that the soil bacterial community indirectly mediated the SOC through balancing SOC in 1–2 mm aggregates and CH4 emissions. This study provides a new idea to reveal the mechanism of short-term tillage and straw return on SOC.

1. Introduction

Enhancing soil organic carbon storage is vital to achieving sustainable agriculture and alleviating the negative impacts of climate change [1,2,3,4,5]. Tillage and straw return practices greatly affect the storage of organic carbon in the soil [6,7,8]. Conventional intensive tillage (CT), which accompanies removing crop straw from the field, results in soil organic carbon decline, soil structural degradation, and greenhouse gas (GHG) emission increase [7,9,10]. On the contrary, no-till (NT) and crop straw return (SR) are regarded as effective ways to increase soil organic carbon (SOC) sequestration [11,12,13].
Compared with CT, NT can increase SOC content by improving soil aggregation and decreasing CH4 and CO2 emissions in the topsoil layer [14,15]. NT reduces soil disturbance, prevents the soil macro-aggregate from being destroyed, provides better physical protection for SOC, and slows down SOC decomposition [2,16]. Moreover, NT can increase the input of organic residues in soil surface, which can be broken down by soil microbes and thus provide microbial binding agents for macroscopic aggregates to form [17,18]. NT can also reduce soil temperature and enhance soil humidity, which leads to the decline in microbial activity and the emissions of CH4 and CO2, reducing the loss of SOC [19,20]. However, the effect of NT on SOC content was regulated by complex biochemical processes, such as the GHG emissions and the formation of soil aggregate, and thus consistent conclusions were not obtained [6,21]. The soil microbial regulation mechanism of NT affecting SOC content is still unclear.
Crop straw is a source of organic carbon, and crop straw return is shown to result in enhancing SOC sequestration. Compared to no straw (NS), SR may have positively influenced the SOC content in the topsoil layer by elevating organic carbon input and improving soil microbial community and aggregate stability [9,12,22]. However, straw return also stimulates GHG emissions [17,23], which may offset the positive effects of SR on SOC sequestration [12]. Studies reported that soil microbial community [21], soil aggregate size [7,18] and GHG emissions [24] are closely related to SOC sequestration [25]. Yet, no experiment has so far been conducted to reveal the relationships among soil microbial community, the SOC in soil aggregates, GHG emissions and SOC sequestration as influenced by SR. Further study is needed to reveal the soil microbial regulation mechanism of SR affecting SOC sequestration.
The objectives of this study were to evaluate the effects of NT and SR on SOC content and soil microbial communities in a rice-wheat cropping system and to reveal the mechanisms that enable soil bacterial communities to regulate SOC under NT and SR. Therefore, we studied the effects of tillage (CT and NT) and crop straw return practices (NS and SR) on soil bacterial communities, CH4 and CO2 emissions, crop yields, and SOC aggregates in rice-wheat cropping systems. During the experiment, we found that tillage and straw return management had significant effects on SOC content in the 0–5 cm soil layer after two cycles of the rice-wheat rotation, but no significant effect on soil SOC in the 5–10 cm and 10–20 cm soil layers. Therefore, we focused on the 0–5 cm soil layer in this study. We hypothesized that soil bacteria could mediate SOC content through affecting soil aggregate SOC and CH4 emissions under tillage and straw return management.

2. Materials and Methods

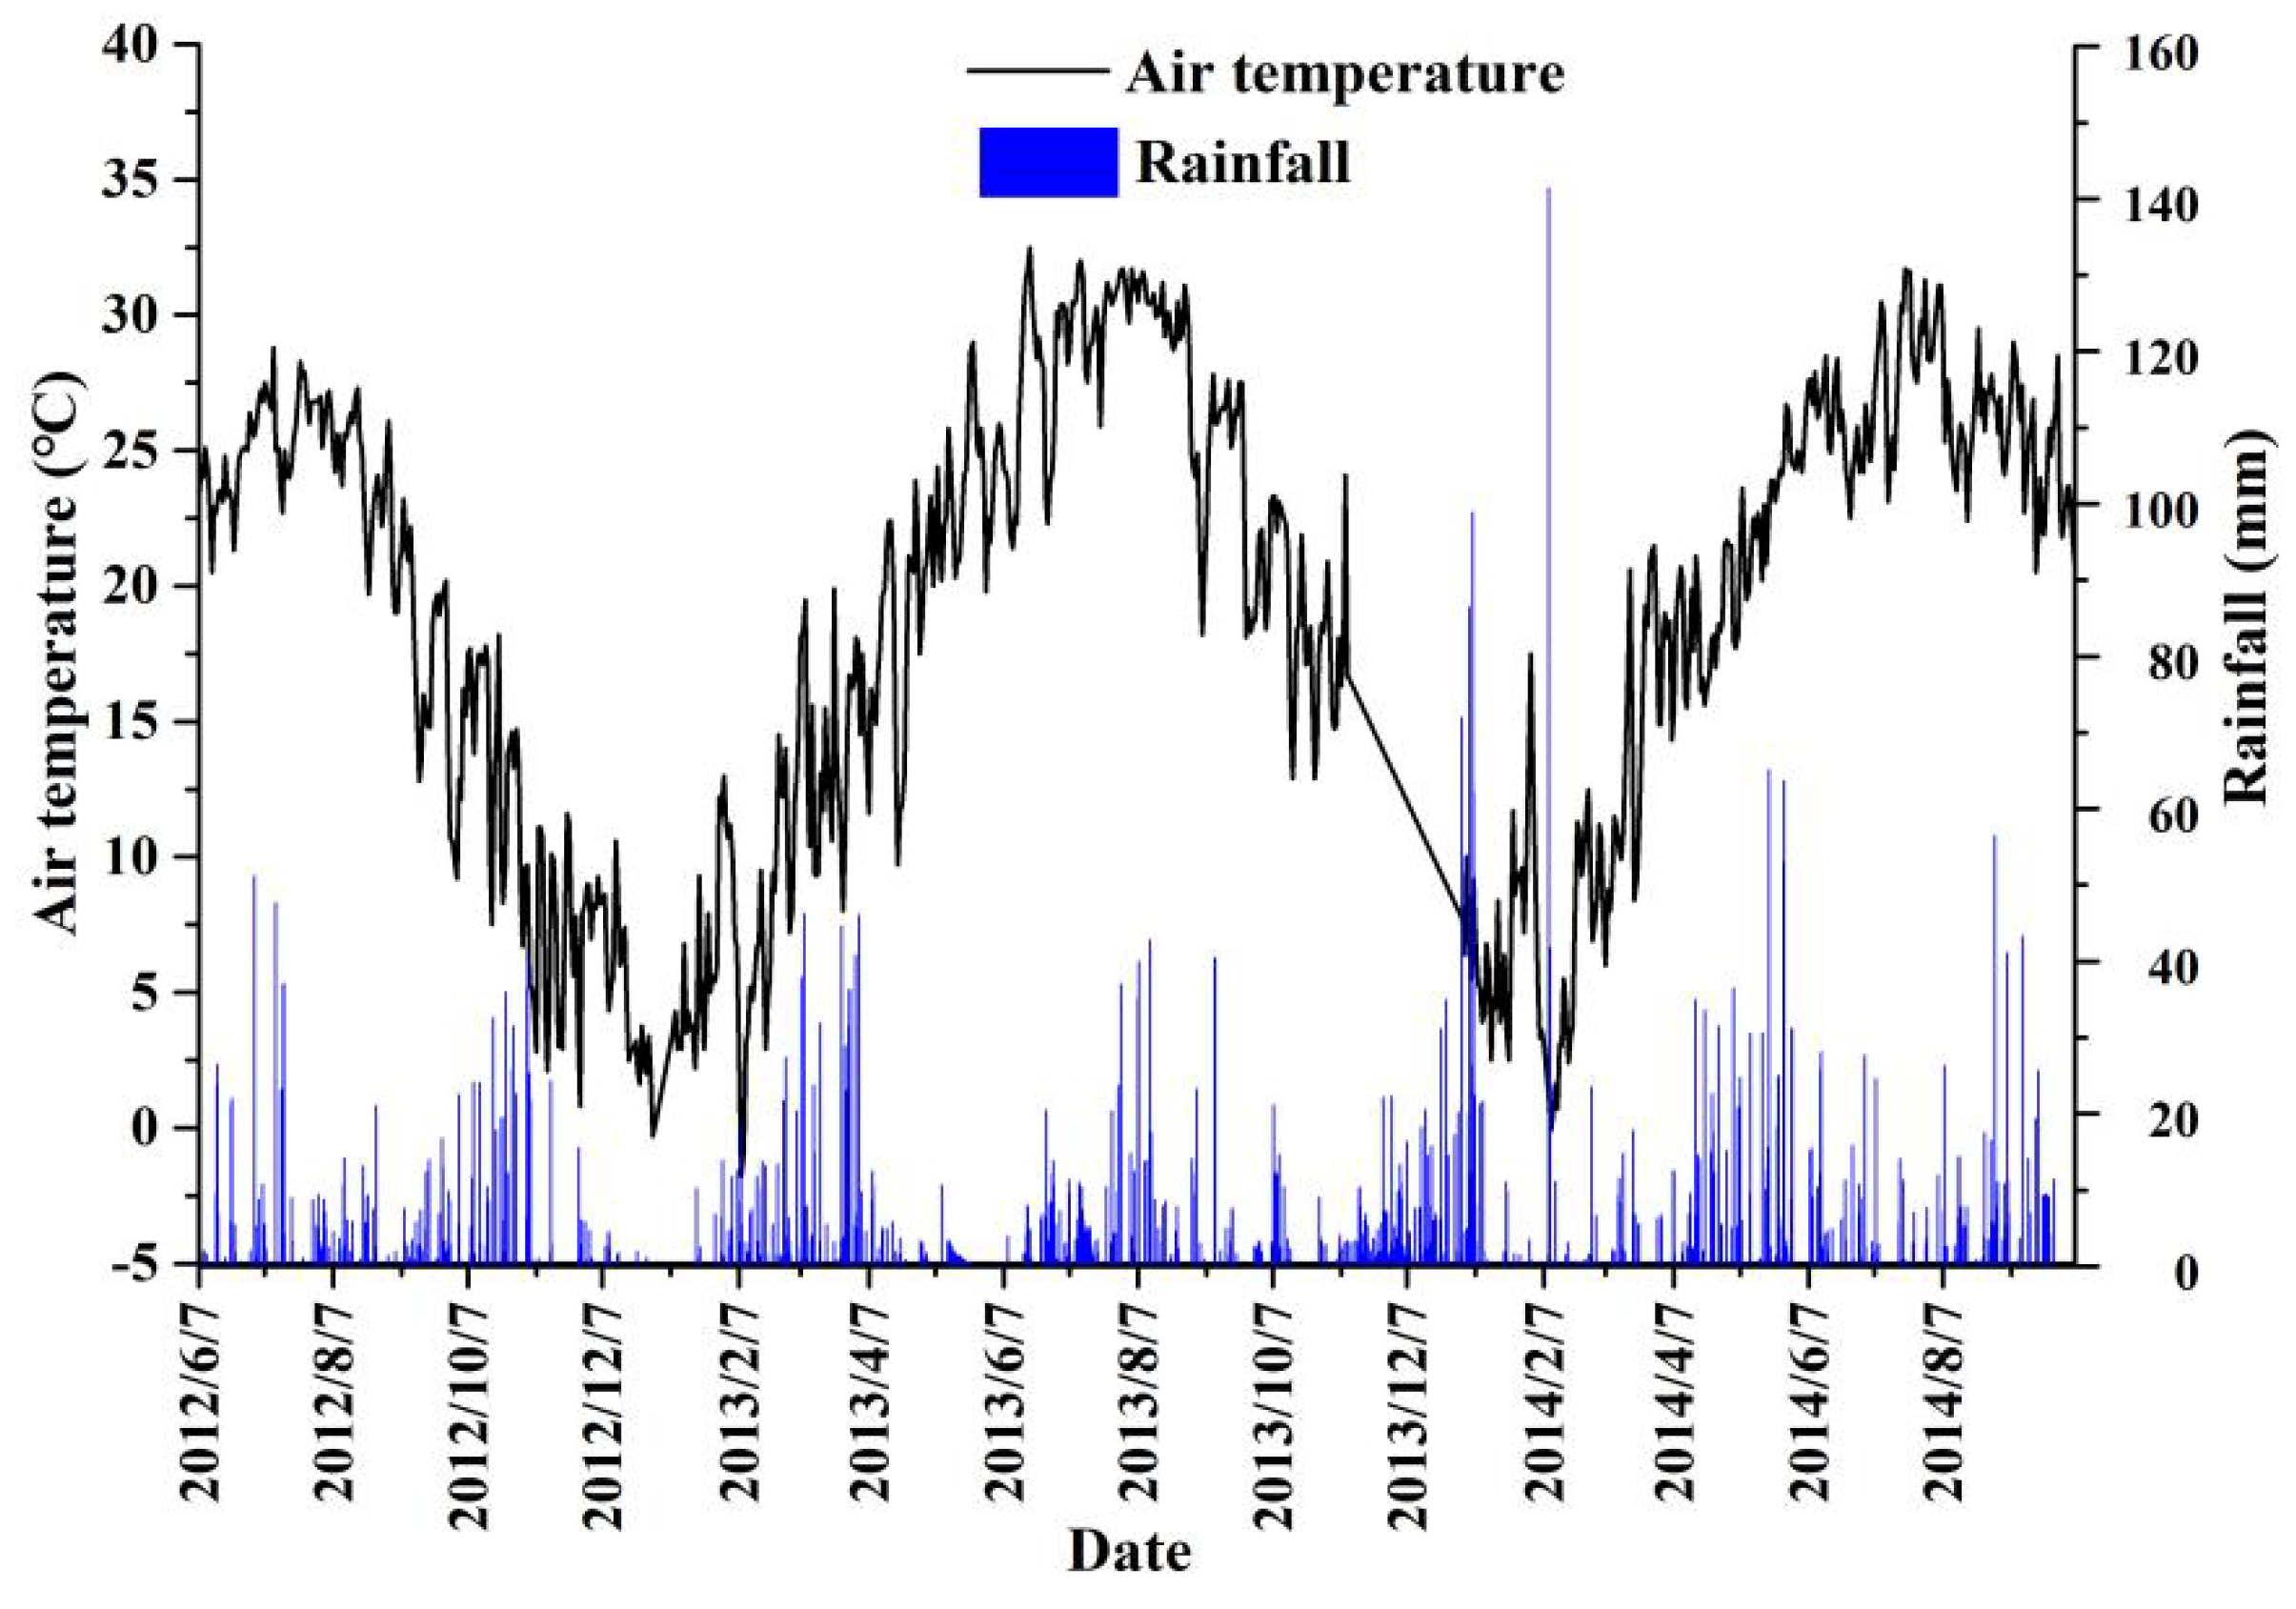
2.1. Experimental Site

The experiment site lies at Dafashi Town (30°01′ N, 115°34′ E), Hubei province, China, and was established in June 2012. The area has a humid mid-subtropical monsoon climate, in which the annual mean air temperature is 16.8 °C, and the average annual precipitation from 2012 to 2014 is 1408.7 mm (Figure 1). The experimental soil (0–20 cm) is a silty clay loam (containing clay 40%, sandy 25%, and silt 40%), which is defined as Gleysol (FAO classification). Besides, the total organic carbon content is 1.64%, total nitrogen content is 0.24%, the pH is 5.9, and the bulk density is 1.20 g cm−3. This site has been dominated by a cropping system of rice (HHZ, Oryza sativa L.) and wheat (ZM9023, Triticum aestivum L.).

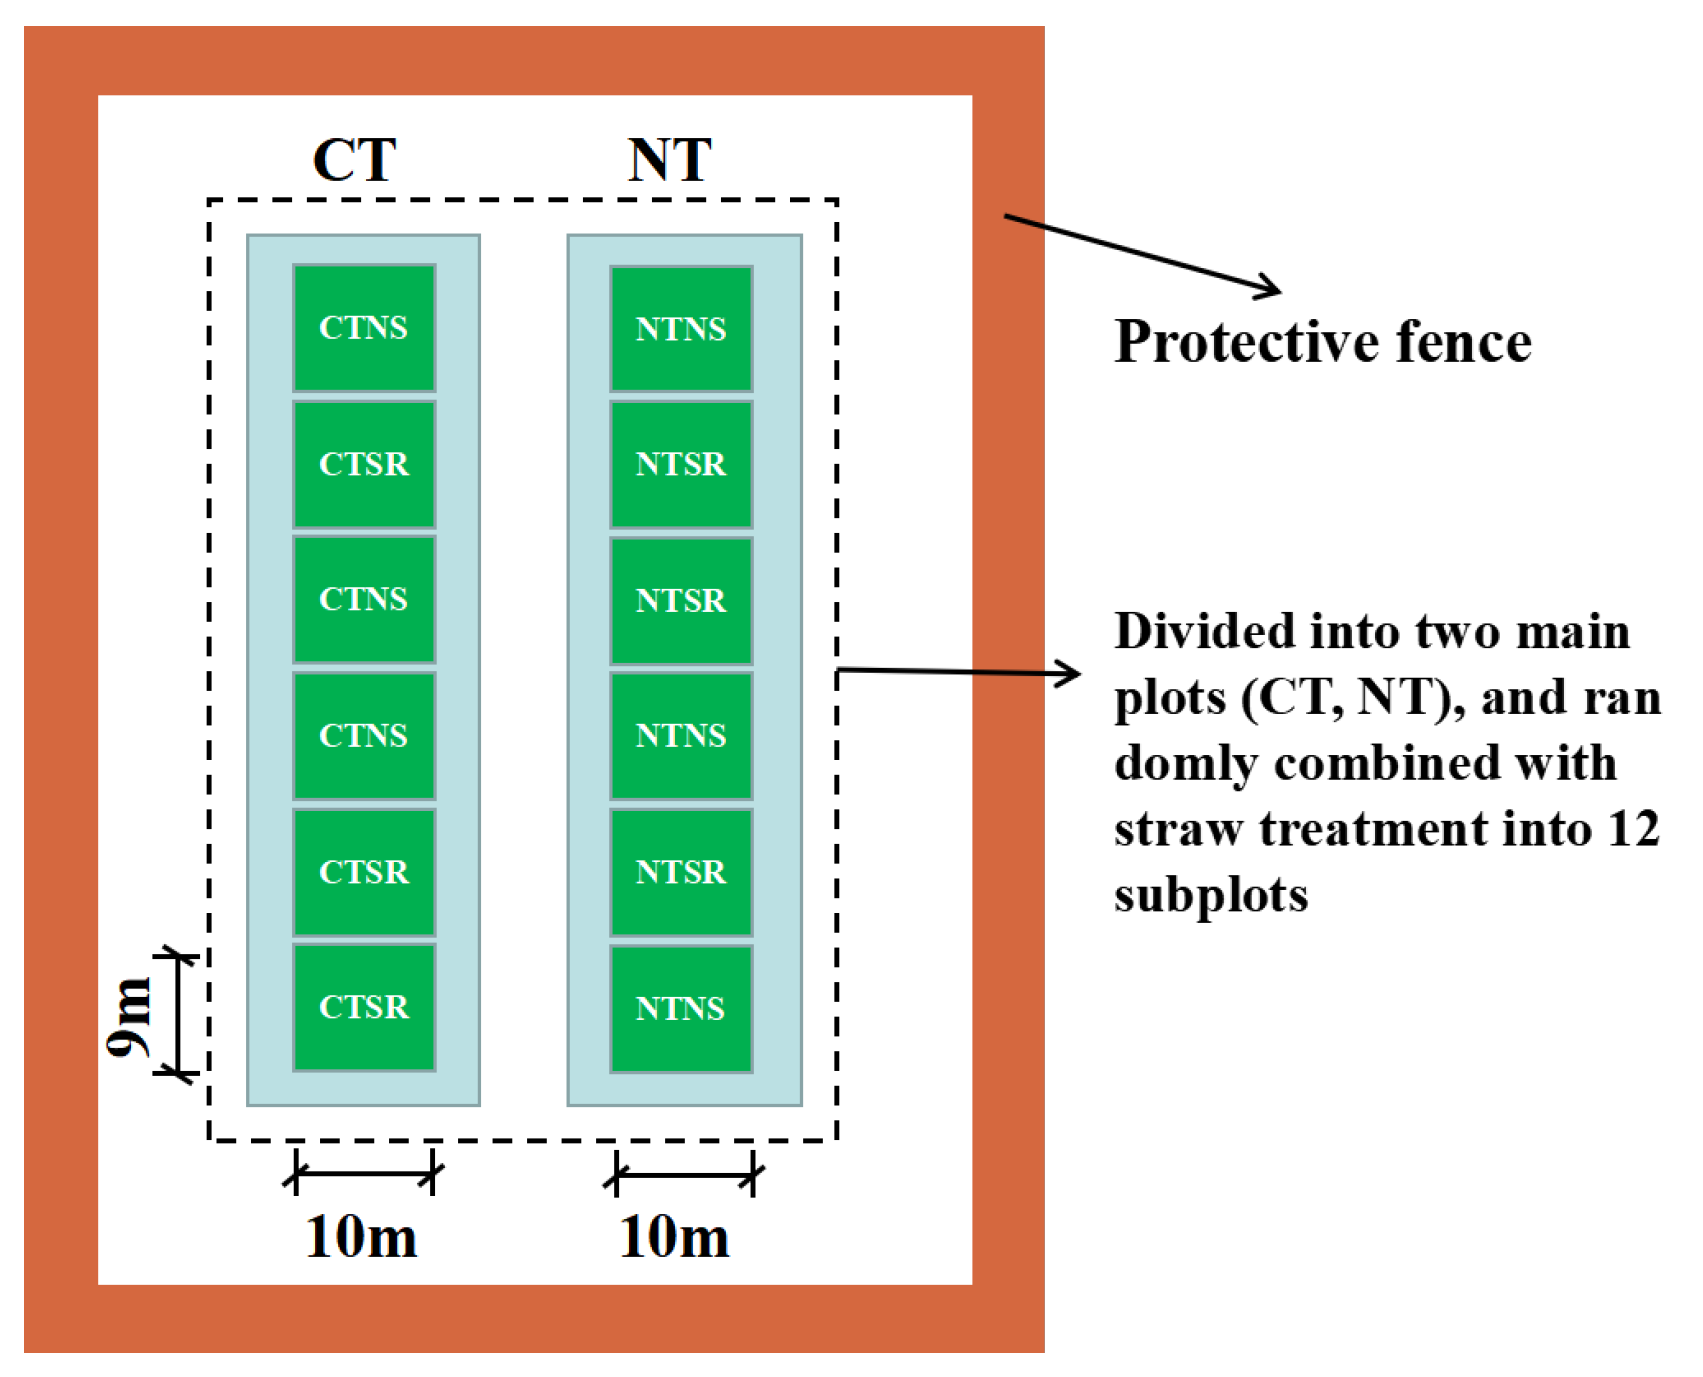
2.2. Experimental Design

This experiment was set up in a split-plot design, where tillage (CT and NT) and straw treatment (NS and SR) were set as the main plot and subplots, respectively (Figure 2). Four treatments including: (i) CTNS; (ii) CTSR; (iii) NTNS; and (iv) NTSR were arranged, and each treatment was conducted in triplicates. The area of each plot was 90 m2 (9 m × 10 m). Under CT treatment, the soil was moldboard plowed twice in one year at a depth of 20 cm before planting rice and wheat. Moldboard plowing was omitted in NT treatment. Crop straw was removed from the field for both CTNS and NTNS treatments. A 6 cm length of crop straw harvested from each plot, was covered on the soil surface under NTSR treatment and incorporated into the soil under CTSR treatment. For all treatments, crop stubbles were kept in the fields. Rice was thrown manually at the rate of 190,000 seedlings per hectare in June and reaped in October. Wheat was directly sown at 150 kg ha−1 in October and harvested in May the following year.
For all treatments, weeds were controlled by spraying 30% chlorpromazine emulsifiable oil containing 10% fenorim. The application rate of chemical fertilizer was 180 kg N ha−1, 90 kg P2O5 ha−1 and 180 kg K2O ha−1 in rice season and was 144 kg N ha−1, 72 kg P2O5 ha−1, and 144 kg K2O ha−1 in wheat season. Commercial compound fertilizer (N:P2O5:K2O = 15%:15%:15%) were used in rice and wheat seasons. P and K fertilizers were applied immediately as basal fertilizers after throwing or sowing. N fertilizers were applied with four splits (seedling stages: tillering stages: jointing stages: booting stages = 25:10:6:9) for the rice season, and three splits (seedling stages: tillering stages: boosting stages = 5:3:2) for the wheat season. During the rice growing season, the depth of waterlogging was kept at 8 cm, except for during the tillering and maturing stages. The wheat season was not irrigated, except after sowing.

2.3. Soil Sampling and Physicochemical Analysis

Soil samples were collected in May and October after the rice and wheat harvests from 2012 to 2014. The soil samples were taken from eight locations in each plot at a depth of 0–20 cm using a soil sampler with a diameter of 5 cm, before being divided into three categories (0–5 cm, 5–10 cm and 10–20 cm depths). Then part of soil samples in 0–5 cm soil layer were separated into the 1–2 mm, 0.25–1 mm, 0.053–0.25 mm, and <0.053 mm aggregate with a nest of sieves mounted (including 1 mm, 0.25 mm, and 0.053 mm). These soil samples were used to measure SOC, soil microbial biomass carbon (MBC) and dissolved organic carbon (DOC). The remaining soil samples were placed at −20 °C for DNA extraction.
The dry-sieving method was used to separate soil aggregates following the descriptions of Garzia-Bengoetxea et al. [26]. In the present study, the dry sieving method was used as the mechanical pressure exerted from outside is the main cause of soil aggregate destruction, and compared with the wet sieving method, the dry sieving method is less destructive to the soil. Furthermore, drying at a low temperature of 4 °C minimizes the effect on the soil microbial community and activities. Retsch AS200 control (Retsch Technology, Düsseldorf, Germany) was used to separate soil aggregates. Air-dried soil fragments (5 mm) were prepared for separation, and soil samples were separated into 1–2 mm, 0.25–1 mm, 0.053–0.25 mm and <0.053 mm soil aggregates by mechanical shaking (amplitude 1.5 mm) for 2 min.
The SOC content was measured with a FlashEA 1112 elemental analyzer (Thermo Finnigan, Milan, Italy). Fumigation-extraction method was used to measure MBC. MBC was calculated as the ratio of differences in organic carbon extracted from fumigated and non-fumigated soil and the conversion coefficient was 0.38. DOC could be measured by the methods of Jiang et al. [27].

2.4. Phospholipid Fatty Acid Pattern

Phospholipid fatty acids were extracted from a 3 g freeze-dried soil sample using the methods of Frostegård et al. [28]. Briefly, lipids were extracted in a single-phase chloroform–methanol–phosphate buffer system in a ratio of 1:2:0.8 (v/v/v). A stream of N2 was used for drying the different phases. Separation of extracts was performed on solid phase extraction columns (Supelco Inc., Bellefonte, PA, USA). The phospholipid fractions were saponified and methylated to fatty acid methyl esters. Internal standard 19:0 fatty acid methyl esters were added to calculate the absolute amount of fatty acid methyl esters before measurement. We employed a gas chromatograph/mass spectrometry system (6890–5973N series GC/MS Agilent Technologies, Palo Alto, CA, USA) outfitted with a Flame Ionization Detector and HP-5 capillary column (30 m × 0.25 mm × 0.25 μm) with ultra-purified helium as carrier gas for the extraction. The quantification of fatty acid methyl esters was performed.

2.5. Measurement of Crop Grain Yields

Crop grains harvested from the 2012 rice season to the 2014 rice season were measured at the central position in each plot using a 5 m2 frame. The rice and wheat grains were air dried, weighed, and adjusted to 14.0% and 12.5% moisture content, respectively.

2.6. Measurement of CH4 and CO2 Emissions

Static closed steel chamber method was used to monitor soil CH4 emission [14]. After the crop straw was returned to fields, continuous gas sampling was conducted until the crop harvest. The inner diameter of the chamber was 34 cm and the height of the chamber was 50 or 120 cm (depending on the rice height). To mix the air in the chambers well, four fans were installed on the top of the chamber. During sampling, two rings were placed in each plot, the chambers were placed temporarily in the groove of rings, and water was added to create a sealed environment. After 0, 5, 10 and 15 min of chamber closure (according to the IGAC recommendations [29]), gas samples were gathered from each chamber. The gas samples were collected using a syringe (20 mL) at the chamber’s headspace, and then transferred to 20 mL vacuum glass bottles. The gas samples were collected between 9:00 and 11:00 am once every 7–10 and 10–15 days (recommended by Buendia et al. [30]) in rice and wheat seasons, respectively. A chromatograph equipped with a flame ionization detector (Shimadzu GC-14B) was used to measure CH4 fluxes [31].
The measurement of soil CO2 flux was conducted according to the method proposed by Li et al. [31]. The CO2 fluxes were measured three times for each plot with an 8100–103 short-term chamber connected to a LI-8100A soil CO2 flux system (Li-Cor Inc., Lincoln, NE, USA). The final value of soil CO2 flux was obtained by averaging the values of three separate measurements. The calculation of CH4 and CO2 fluxes was based on the linear variation in CH4 and CO2 fluxes [32]. The cumulative seasonal CH4 and CO2 emissions were derived by sequentially accumulating emissions from each of the two adjacent measurement intervals [31].

2.7. High-Throughput Sequencing

According to the instructions, the FastDNA kit for soil (MP Bio-medicals, Santa Ana, CA, USA) was used to extract DNA from the soil samples and then stored at −20 °C. The bacterial hypervariable regions, including V3, V4 and V5 of 16S rDNA, were amplified by PCR using primers 357F (5′-CCTACGGGAGGCAGCAG-3′) and 926R (5′-CCGTCAATTCMTTTRAGT-3′) [33]. The forward primer was modified to include the FLX-titanium adaptor “B” sequence (5′-CCTATCCCCTGTGTGCCTTGGCAGTCTCAG-3′), and the reverse primer was linked with the 454 FLX-titanium adaptor “A” (5′-CCATCTCATCCCTGCGTGTCTCCGACTCAG-3′) [21].
DNA samples (10 ng) were applied as templates in the polymerase chain reaction. Polymerase chain reaction was conducted at 95 °C for 3 min, 94 °C for 30 s, 55 °C for 45 s, 72 °C for 1 min with 25 cycles and a final extension step of 72 °C for 7 min. Polymerase Chain Reaction Purification Kit (Axygen Bio, Union City, California, CA, USA) was used for purification of polymerase chain reaction products. The amplitudes from each sample were then combined in equimolar concentrations into one tube prior to 454 pyrophosphate sequencing. Pyrophosphate sequencing was performed by Shanghai Personal Biotechnology Co., Ltd. using the 454 GS-FLX Titanium System (Roche, Switzerland). To ensure analytical accuracy, the Quantitative Insights into Microbial Ecology (QIIME) pipeline [34] was employed to fetch high quality sequences, following the descriptions of Fierer et al. [35]. The unique sequence set was classified into operational taxonomic units OTUs (a threshold of 97% pairwise identity) by the QIIME implementation. Extraction of the longest sequences of the most abundant OTUs was used as a proxy for taxonomic identification for comparison with the Green Gene Database (release 13.8 http://greengenes.secondgenome.com/ (accessed on 10 January 2012)).

2.8. Statistical Analysis

All data were expressed as means and standard deviations of three replicates. The main effects and interactions of tillage and straw returning were conducted using general linear model analysis of variance with SAS 9.0 (SAS Institute 1999) designed for split plot with tillage practice and straw returning methods as fixed factors and replicates as random factors. The least significant difference test was conducted to examine whether the influence of tillage practices, straw return practices, or their interactions were significant at the level of 0.05. To test the effect of experimental treatments on bacterial composition, redundancy analysis was performed using the “vegan” package in R v. 3.1.2 (R Development Core Team, 2014) [36].
Structural equation modeling was performed to reveal the influence paths of tillage and straw return practices on SOC content from the perspectives of the soil bacterial community, DOC, microbial biomass carbon, CH4 and SOC in 1–2 mm aggregates. The use of structural equation modeling allowed the testing of complex path-relation networks. It should be noted that only the data for the 2013 rice season and 2014 wheat seasons were selected [37]. In the model, tillage (0 = no-till and 1 = tillage) and straw return (0 = straw removal and 1 = straw return) were considered as categorical variables. This approach allowed us to compare the effect of tillage and straw return practices on SOC content. Redundancy analysis results for bacterial communities in order level (relative abundance > 0.5%), were used as ‘bacteria community’ in the model. A ‘robust’ maximum likelihood estimation procedure of AMOS 20.0 (IBM SPSS, Chicago, IL, USA) software was conducted for the analysis. The chi-square test, goodness of fit index, comparative fit index, and root square mean error of approximation were used for testing the overall goodness of the fit of the model.

3. Results

3.1. Soil Organic Carbon

Tillage and straw return management significantly changed the SOC content in the 0–5 cm soil layer (p < 0.05, Table S1). Compared with CT treatment, NT treatment significantly increased SOC content in the 2013 wheat season (5.7%), 2013 rice season (15.3%) and 2014 rice season (4.4%). In comparison with NS treatment, SR treatment markedly enhanced SOC content in the 2012 rice season (6.6%), 2013 wheat season (8.3%), 2013 rice season (9.1%), 2014 wheat season (6.5%) and 2014 rice season (8.3%). Compared with CTNS, NTNS markedly increased SOC in the 2013 rice season, 2014 wheat season and 2014 rice season by 15.6%, 2.9% and 4.4%, respectively. In comparison with CTSR, NTSR significantly enhanced SOC in the 2013 wheat season, 2013 rice season and 2014 rice season by 7.1%, 15.1% and 4.5%, respectively. Interaction of tillage and straw return practices showed no remarkable effects on SOC content.

3.2. Distribution of Soil Aggregates

Tillage and straw returning methods had a significant effect on the distribution of soil aggregates in the soil layer within the topsoil layer (Table S2). Compared with CT treatment, NT treatment significantly increased the percentage of 1–2 mm soil aggregates in the 2014 wheat season (4.1%) (p < 0.05), whereas, there was a markedly reduced percentage of soil aggregates < 0.053 mm in the 2013 rice season (18.9%). Compared with NS treatment, SR treatment resulted in an increased the proportion of 1–2 mm soil aggregates in both wheat and rice seasons of 2013 (5.4%, 4.4%), and in the wheat season of 2014 (5.6%) (p < 0.05), but decreased the proportion of soil aggregates <0.053 mm in the 2014 wheat season (21%) (p < 0.05). NTNS significantly increased the proportion of 1–2 mm soil aggregates by 6.3% in the 2014 wheat season, and markedly reduced the percentage of soil aggregates < 0.053 mm in the 2013 rice season (7.6%) and 2014 wheat season (20.2%) compared to CTNS. NTSR, respectively, increased the proportion of 1–2 mm soil aggregates by 2.8%, 4.7%, 2.1% in the 2013 wheat season, 2013 rice season, 2014 wheat season, and markedly reduced the percentage of soil aggregates < 0.053 mm in 2013 rice season (29.9%) compared to CTSR. Interaction of tillage practices and straw returning methods showed no significant difference.

3.3. Soil Organic Carbon Content within Aggregates

Tillage and straw return practices greatly influenced the SOC content of aggregates in the 0–5 cm soil layer (Table 1). Compared to CT treatment, NT treatment increased the SOC content in 1–2 mm aggregates in the 2013 wheat season (17%), 2013 rice season (19.9%) (p < 0.05, Table 1). Higher SOC content in 0.25–1 mm aggregates was also observed under NT treatment than under CT treatment in the 2013 wheat (14.6%) and rice seasons (13.4%) (p < 0.05). Compared with NS treatment, SR treatment led to higher SOC content in 1–2 mm aggregates in the 2013 rice season (17.2%), and 2014 wheat season (17.4%) (p < 0.05). Moreover, higher SOC content in 0.25–1 mm aggregates was found in the 2013 rice season (7%) and 2014 wheat season (6.2%) under SR treatment than under NS treatment (p < 0.05). Compared to CTNS, NTNS significantly increased the SOC content in 1–2 mm aggregates in the 2013 rice season by 17.0%. Moreover, there were also significant differences in the SOC content of 0.25–1 mm aggregates in the 2013 rice season (16.5%), and in the 2014 wheat season (3.6%) between CTNS and NTNS. NTSR, respectively, increased the SOC content in 1–2 mm aggregates by 17.9%, 22.4%, 8.3% in the 2013 wheat season, 2013 rice season and 2014 wheat season, and enhanced SOC content in 0.25–1 mm aggregates in the 2013 rice season (10.6%) and 2014 wheat season (4.1%) relative to CTSR. In other soil layers, there was no remarkable difference between treatments. Interaction of tillage and straw return practices remarkably influenced the SOC content in 1–2 mm aggregates in the 2014 wheat season (p < 0.05).

3.4. Soil Dissolved Organic Carbon and Microbial Biomass Carbon

Tillage and straw returning methods had significant effects on DOC contents in the 0–5 cm soil layer (Table S3). Compared to CT treatment, NT treatment markedly increased the DOC contents in both wheat seasons and rice seasons in 2014 (12.3%, 8.8%) (Table S3, p < 0.05). Similarly, higher DOC contents were found in both wheat and rice seasons in 2013 (23.7%, 23.8%) and 2014 (18.5%, 13%) (p < 0.05) under the SR treatment than under the NS treatment. Compared with CTNS, NTNS showed a significant increase in the DOC contents in the 2013 rice season (3.3%) as well as in the 2014 wheat (13.4%) and rice seasons (10.4%). NTSR showed significantly higher DOC contents in both wheat and rice seasons in 2013 (16.5%, 13.8%) and 2014 (11.4%, 7.4%) relative to CTSR. The interaction between NT and SR remarkably influenced the DOC during the whole 2013 season.
Relative to CT treatment, NT treatment significantly increased the MBC contents in the 0–5 cm soil layer in both wheat and rice seasons in 2013 (15.1%, 14.3%) and 2014 (21.5%, 39.8%) (Table S4, p < 0.05). SR treatment also resulted in higher MBC contents in both wheat and rice seasons in 2013 (27.8%, 18.1%) and 2014 (26.6%, 20.1%) (p < 0.05) than NS treatment. Compared to CTNS, NTNS displayed a statistically significant improvement in MBC contents for both the 2013 (19.2%, 6.9%) and 2014 wheat and rice seasons (5.7%, 33.2%). NTSR also showed an improvement in the 2013 wheat season (12.0%), 2013 rice season (21.0%), 2014 wheat season (35.8%) and 2014 rice season (45.5%) against CTSR. Interactions of tillage and straw returning practices had significant effects on MBC contents with the exception of the 2012 and 2013 wheat seasons (p < 0.05).

3.5. Greenhouse Gas Emissions

Relative to CT treatment, NT treatment remarkably decreased CH4 emissions during the 2014 rice seasons (15.6%) (p < 0.05) (Table 2). SR treatment resulted in higher CH4 emissions during the rice (by 34.0–91.2%) and wheat (by 22.1–22.3%) seasons throughout all three experimental years (p < 0.05). Compared with CTSR, NTSR showed a significant reduction in CH4 emissions in the 2013 wheat season (18.0%), 2014 wheat season (10.8%), and 2014 rice season (16.6%). However, the NTNS showed the lowest CH4 emissions among all treatments in whole seasons. Interaction of tillage and straw return practices showed no significant effects on CH4 emissions.
Compared with CT treatment, NT treatment lowered CO2 emissions in the 2014 wheat (7.2%) and rice reasons (21.4%) (p < 0.05) (Table 3). SR treatment induced more CO2 emissions (p < 0.05) than NS treatment in the 2012 rice season (91.2%), 2013 wheat (22.1%) and rice seasons (40.8%), and 2014 wheat (22.3%) and rice seasons (34.0%). Compared with CTNS, NTNS markedly elevated CO2 emissions in the 2012 rice season by 19.3%, whereas, it reduced CO2 emissions in the 2013 rice season by 22.7% and 2014 rice season by 10.9%. NTSR had lower CO2 emissions in the 2012 rice season, 2013 rice season, 2014 rice season (by 9.7%, 14.6% and 28.5%, respectively) against CTSR. Interaction of tillage and straw return practices showed a significant effect on CO2 emissions only in the 2012 rice seasons and 2014 rice seasons (p < 0.05). Meanwhile, the combination of NT and NS can reduce CO2 emissions compared to other treatments.

3.6. Soil Microbial Community

Tillage and straw returning methods significantly influenced bacterial biomass in 0–5 cm soil layer (Table S5). Compared with CT treatment, NT treatment increased the bacterial biomass in the 2013 rice seasons (35.6%) and 2014 wheat seasons (56.2%) (p < 0.05). SR treatment led to higher bacterial biomass than NS treatment in the 2013 wheat season (76.5%), 2013 rice season (54.9%), 2014 wheat season (75.7%), 2014 rice season (59.7%) (p < 0.05). Compared with CTNS, NTNS had a greater impact on bacterial biomass in the 2013 rice season (33.1%), and in the 2014 wheat season (38.3%), while for fungi, NTNS had a significant reduction in the 2013 wheat season (25.2%). Compared to CTSR, NTSR had a greater effect on microorganisms in both wheat and rice seasons in 2013 (70.1%, 37.1%) and 2014 (67%,75%), while for fungi, NTSR showed a significant improvement in the 2013 wheat season (23.8%). The interaction of tillage and straw return practices had a significant effect on bacterial biomass in the 2014 wheat season (p < 0.05). Tillage and straw returning practices had no significant effects on fungal biomass in the 2013 wheat seasons (Table S5). The fungal PLFAs were not detected in the 2013–2014 rice seasons.

3.7. Soil Bacterial Community

Soil bacterial community was mainly composed of phylum Acidobacteria, Verrucomicrobia and Proteobacteria in the 2013 rice season (Table S6), while it was mainly composed of phylum Acidobacteria, Chloroflexi and Proteobacteria in the 2014 wheat season (Table S7).
In the 2013 rice season, compared with CT treatment, NT treatment affected the abundance of Gp1 (17.7%), Gp18 (−19.4%), Gp4 (65.2%), Gp16 (21.6%), Dehalogenimonas (29.1%), Caulobacterales (27.6%), Desulfuromonadales (33.0%), Myxococcales (42.8%), and Legionellale (−9.7%) (Table S6, p < 0.05). Compared with NS treatment, SR treatment significantly affected the abundance of Gp18 (−16.3%), Gp4 (48.1%), Gp17 (16.4%), Chlamydiales (−26.0%), Caulobacterales (19.7%), Burkholderiales (−37.6%) (p < 0.05). Compared with CTNS, NTNS significantly increased the abundance of Rhizobiales (7.0%), Burkholderiales (13.4%), and Spartobacteria_genera_incertae_sedis (46.2%), whereas, it markedly decreased the abundance of order Gp1 (1.5%), Gp18 (25.2%), Gp4 (38.3%), and Dehalogenimonas (17.2%). Compared with CTSR, NTSR significantly elevated the abundance of Gp4 (267%), Holophagales (85.4%), Dehalogenimonas (103.4%), Chlamydiales (33.9%), Caulobacterales (50.9%), Burkholderiales (27.8%), and Spartobacteria_genera_incertae_sedis (30.5%), whereas it significantly reduced the abundance of order Gp1 (32.0%) and Rhizobiales (17.2%). Interaction of tillage and straw return practices significantly affected the abundance of Gp1, Gp18, Gp4, Gp17, Holophagales, Dehalogenimonas, Chlamydiales, Caulobacterales, Syntrophobacterales, and Spartobacteria_genera_incertae_sedis (p < 0.05). NTSR showed the highest or the lowest bacterial community richness compared with the NTNS and CTSR.
In the 2014 wheat season, NT treatment led to a higher abundance of Myxococcales (206.3%) than CT treatment (Table S7, p < 0.05). In comparison with NS treatment, SR treatment brought out higher enrichment of Gp4 (573.9%), Gp10 (502.4%), Gp18 (97.5%), Sphingobacteriales (164.7%) Gp7 (303.8%), Sphingobacteriales (164.7%), Flavobacteriales (89.4%), and Myxococcales (173.2%), while it decreased the abundance of Gemmatimonadales (47.8%) and Rhodospirillales (42.0%) (p < 0.05). Compared with CTNS, NTNS significantly increased the abundance of order Myxococcales (176.0%), whereas it markedly decreased the abundance of order Xanthomonadales (5.5%). Compared with CTSR, NTSR significantly increased the abundance of Gp4 (161.9%), Gp10 (429.1%), Gp18 (106.2%), Gp7 (145.9%), Xanthomonadales (17.7%), and Myxococcales (218.1%). The interplay of tillage and straw return practices significantly influenced the abundance of Gp18 and Flavobacteriales (p < 0.05).

3.8. Crop Grain Yields and Their Relationship with Soil Properties

Crop grain yields in this study were reported in our previous study (Table S8) [2]. NT treatment significantly reduced crop yields by 8.8% in the 2014 wheat season compared to CT treatment (p < 0.05). SR treatment showed no significant difference relative to NS. There was no significant difference in grain yields between NTNS and CTNS. NTSR had a remarkable increase in crop yields in the 2014 wheat season compared to CTSR (19.1%, p < 0.05). Interaction of tillage and straw return practices showed a significant effect on crop yields in the 2014 wheat season (p < 0.05). A significant correlation was observed between DOC and crop yields (Table S9).

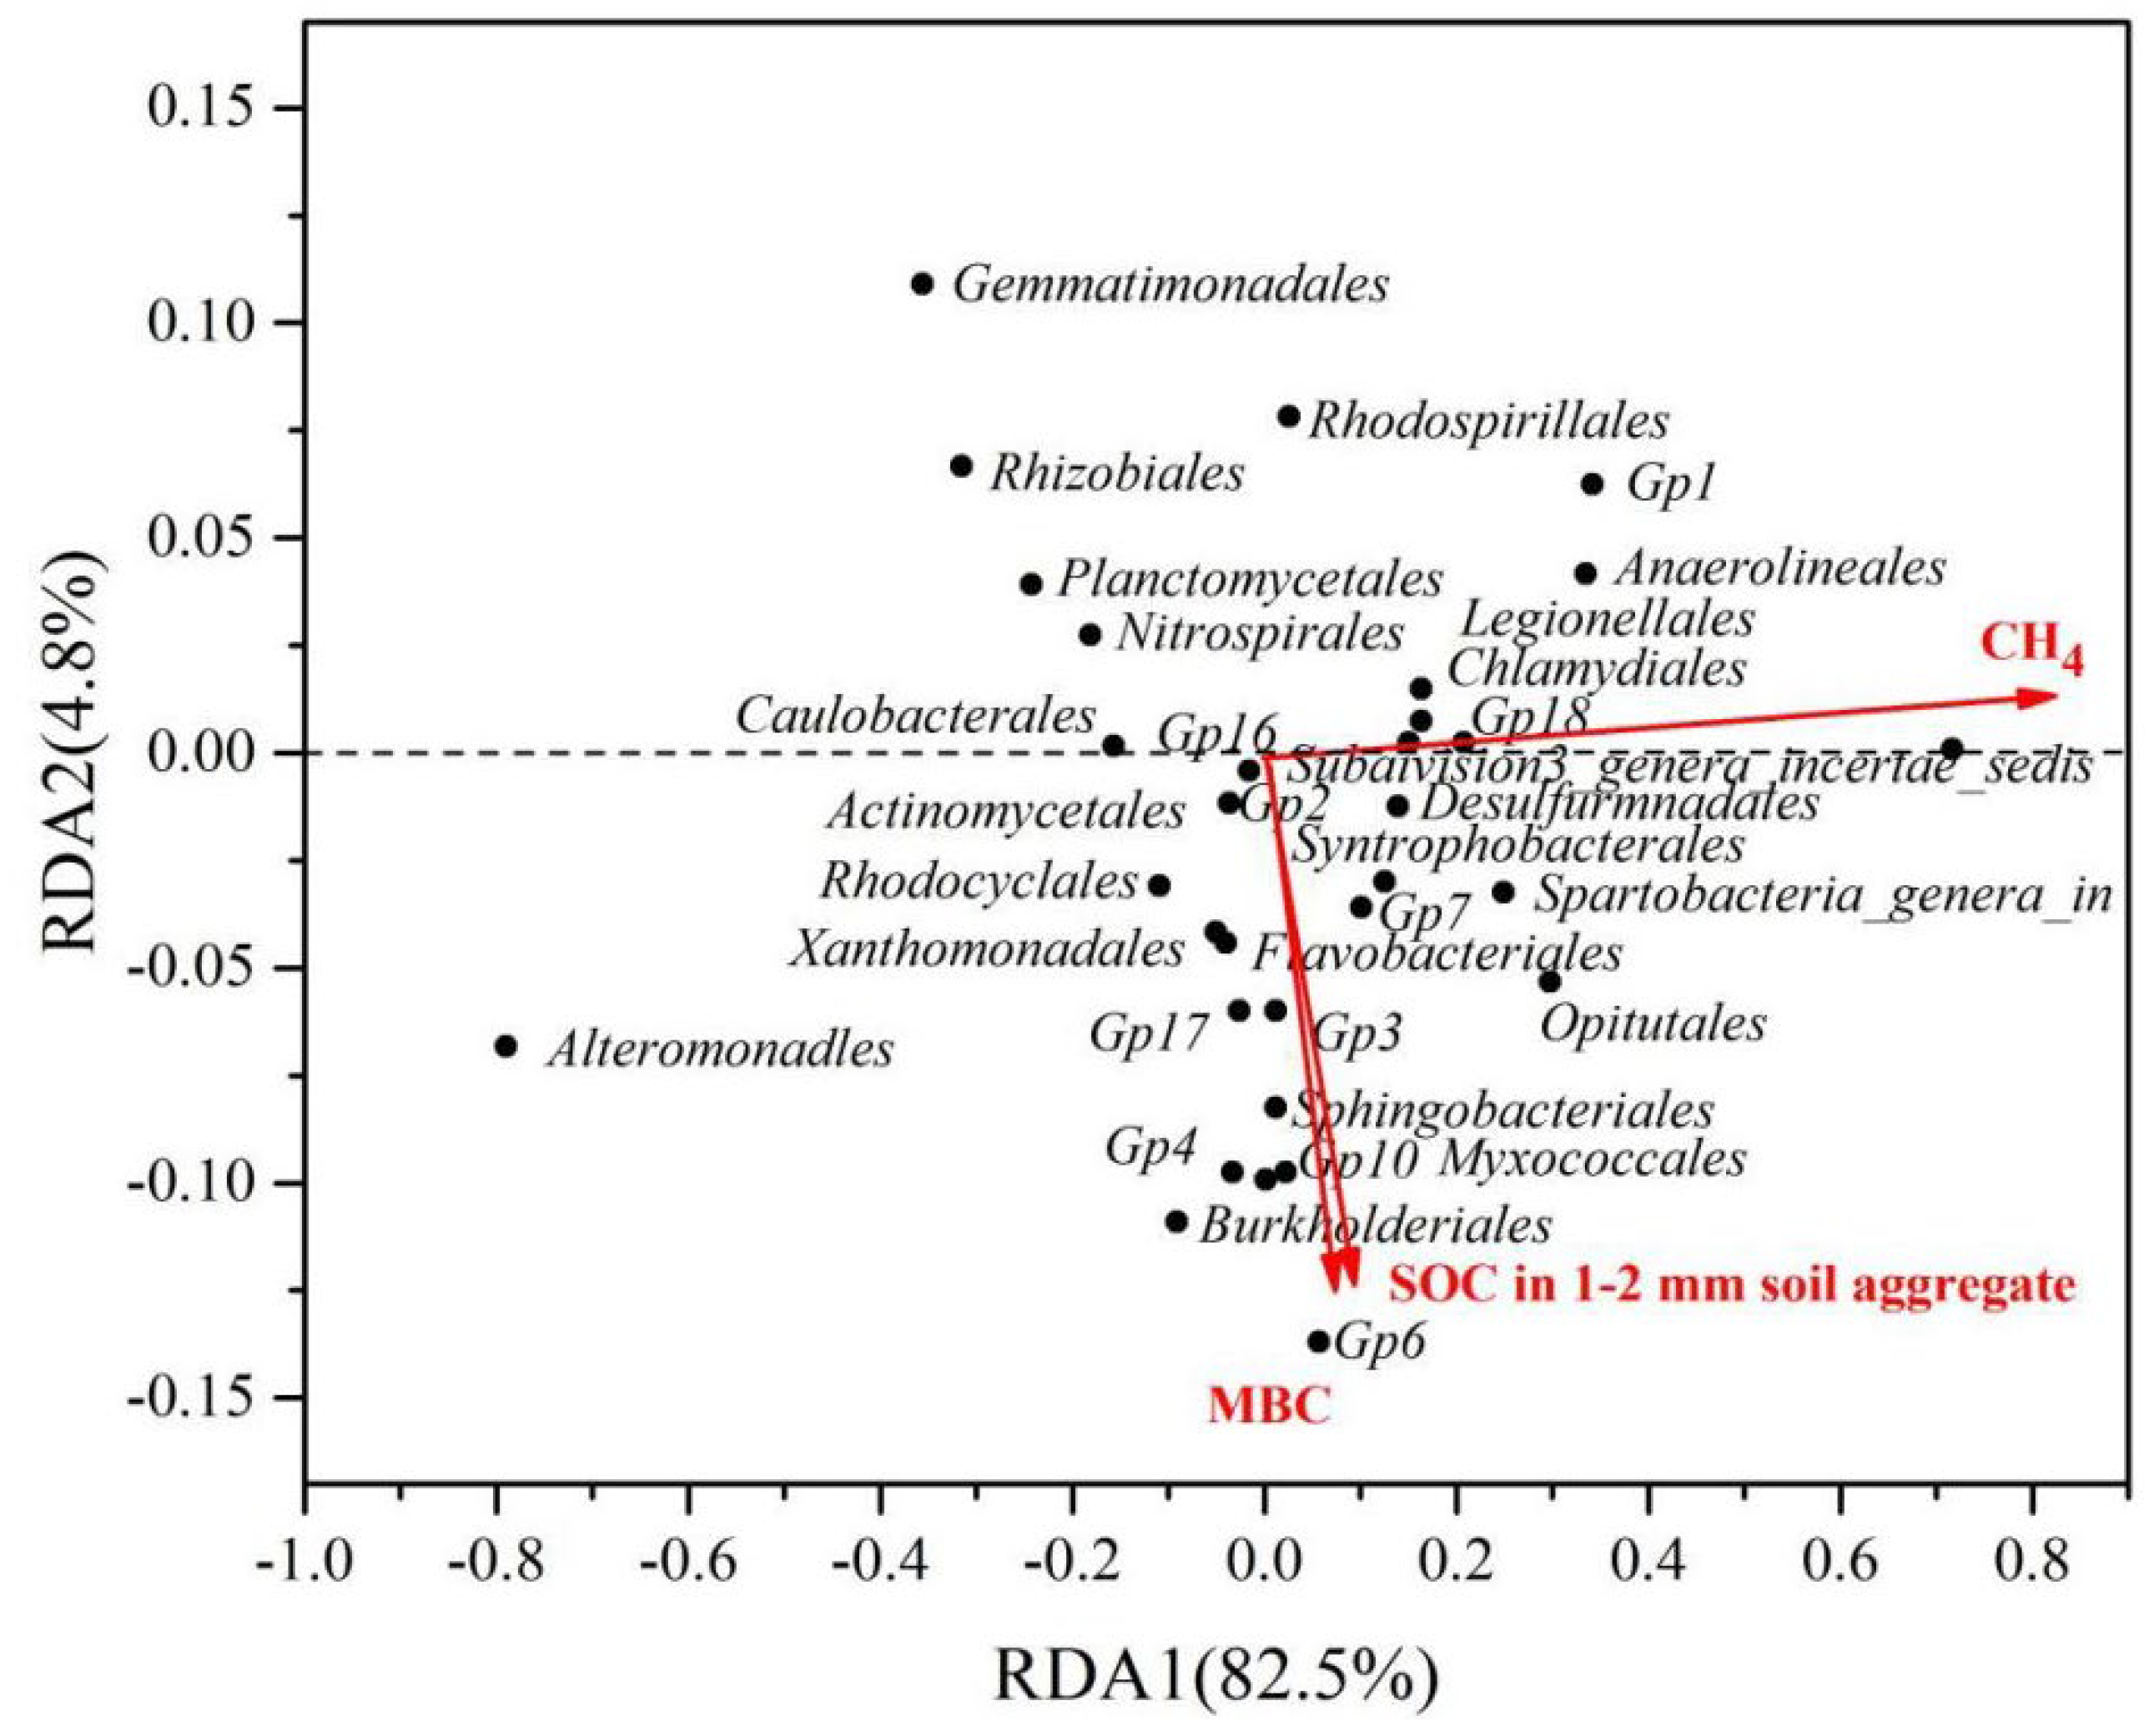
3.9. Relationship of Bacterial Community with Yield, Soil Aggregates and Soil Organic Carbon Fractions

Redundancy analysis (RDA) showed that soil bacterial community was considerably influenced by SOC content in 1–2 mm aggregates, MBC and CH4 emissions (Figure 3, p < 0.05). MBC and SOC in 1–2 mm aggregates were closely related to Gp6, Burkholderiales, Gp10, Sphingobacteriales, Myxococcales, Gp16, Flavobacteriales, Gp2, Gp3, and Xanthomonadales. CH4 emissions were closely related to Subdivision3_genera_incertae_sedis, Gp18, Caulobacterales, Gp16, and Chlamydiales. Besides, no significant correlation were found between crop yield and microbial community.
The structural equation modeling revealed that the predictors could explain 85.0% of the variances in SOC content (Figure 4). Soil bacterial community mediated SOC under tillage and straw systems through affecting SOC in 1–2 mm aggregates and CH4 emissions.

4. Discussion

4.1. Impact of NT and Straw Return on SOC Content in Aggregates

NT can enhance SOC content by promoting the SOC sequestration in macro-aggregate [7,38,39]. In this study, a higher proportion of 1–2 mm soil aggregates (Table S2), and more SOC content in 1–2 mm aggregates, were found under NT than under CT (Table 1). Tillage operations breaks soil macro-aggregates and results in SOC losses [40]. Conversely, NT keeps soil undisturbed, which is conducive for accelerating the formation of macro-aggregate, and reduces the degradation rate of SOC [41]. Moreover, NT can provide more physical protection for soil aggregates and promote the longevity of newly-formed macro-aggregates, leading to stabilization of SOC in the micro-aggregates formed within stable macro-aggregates [42,43].
As an essential organic matter source, SR can promote the formation of soil macro-aggregates and increase SOC content. Previous studies have well reported that SR can increase SOC content by increasing the input of organic carbon input [12,43]. In this work, higher SOC content in the topsoil layer (0–5 cm) was observed under SR than under NS (Table S1), which may be due to higher SOC sequestrated in 1–2 mm aggregates (Table S2). Straw degradation generates a large number of organic matter particles, contributing to the formation of macro-aggregates and the accumulation of SOC in macro-aggregate [7,17,44,45].
Some studies reported that interaction of tillage and straw return practices significantly affected SOC, possibly as NT can promote the accumulation of straw on the soil surface, thus enhancing SOC sequestration in the topsoil [21]. Similarly, we also found that both under NS or SR conditions, NT caused higher SOC in 1–2 mm and 0.25–1 mm aggregates than CT (Table 1). Moreover, the interaction of tillage and straw return practices significantly affected SOC in 1–2 mm aggregates in the 2014 wheat season (Table 1), suggesting that under straw return condition, NT can further promote SOC sequestration in 1–2 mm aggregates [7,21]. However, the interaction of tillage and straw return practices had no significant effect on SOC in other aggregates sizes (Table 1), possibly as 1–2 mm soil aggregates are more sensitive than soil aggregates of other smaller sizes [2,21].

4.2. Effect of NT and Straw Return on Greenhouse Gas Emissions

Emissions of CH4 and CO2 are important pathways of carbon loss from agricultural soil [24,31,46]. In this study, NT treatment reduced CH4 and CO2 emissions compared with CT treatment (Table 2 and Table 3). CH4 emissions are primarily affected by the availability of organic matter and oxygen [12,17,46]. NT decreases soil disturbance and improves gas diffusion, inhibiting the growth of methanogenic bacteria and reducing the production of CH4 [23]. NT also can enhance soil moisture, reduce soil temperature, slow the organic residue degradation, and reduce the activity of soil microorganisms, thus reducing CH4 and CO2 emissions [12,19,20].
In contrast, straw return promoted CH4 and CO2 emissions (Table 2 and Table 3) mainly by providing a large number of organic carbon for soil microorganisms [12,46]. Moreover, anaerobic degradation of crop residues can reduce soil Eh, thus increasing methanogenic populations and enhancing CH4 emissions [17,47,48]. Nevertheless, a large number of straw-derived carbon can be sequestrated in soil by the formation of resistant organic matter, which may offset the losses of SOC caused by CH4 and CO2 emissions.
In this study, the interaction of tillage and straw return practices had no effect on CH4 and CO2 emissions in the experiment (Table 2 and Table 3), which may be due to SR and NT having the opposite effect on CH4 emissions. SR significantly enhanced CH4 and CO2 emissions, whereas, NT was found to have reduced CH4 and CO2 (Table 2). We also found that CTNS had no significant effect on CH4 emissions relative to NTNS, while NTSR had lower CH4 emissions than NTNS (Table 2). The reason may be the fact that NT leads to more straw being accumulated in the soil surface, which has better oxygen available than topsoil layers, thus inhibiting the production of CH4 from the soil [17,48]. Besides, CTNS had higher CO2 emissions than NTNS, and CTSR also had more CO2 emissions than NTSR. This can be attributed to there being a lower soil temperature under NT than under CT, thus leading to a decrease in the activity of soil microorganisms, and subsequently to a decrease in CO2 emissions [19,20].

4.3. Effects of NT and Straw Return on Bacterial Community

Microorganisms play a key role in regulating SOC turnover and sequestration [49]. The bacterial community accounts for the majority of soil microorganisms in the rice-wheat cropping system (Table S5) [50], which is probably due to the long-term flooding of the field during the rice season resulting in the formation of an anaerobic environment, inhibiting the growth of the soil fungal community [21]. The bacterial community is sensitive to tillage and straw management [51]. Common dominant bacteria such as Phylum Actinobacteria, Proteobacteria and Actinobacteria are recognized to be remarkable plant biomass decomposers [52,53,54]. In this study, Phylum Acidobacteria, Verrucomicrobia and Proteobacteria phylum were dominated in the 2013 rice season (Table S5) and phylum Acidobacteria, Chloroflexi and Proteobacteria phylum were dominated in the 2014 wheat season (Table S6).
We found that NT significantly affected the bacterial community in the 2013 rice season and 2014 wheat season (Tables S5 and S6). NT can enhance some bacterial abundance related to the decomposition of crop residue [52,54,55], for example, phylum Actinobacteria (including order Gp4, Gp16), phylum Chloroflex (including order Dehalococcoidetes), phylum Proteobacteria (including order Myxococcales), phylum Alphaproteobacteria (including order Caulobacterales), phylum Chloroflexi (including order Dehalococcoidates), and phylum (including Desulfuromonadales and Myxococcales) (Tables S5 and S6). This is probably due to the fact that NT can provide more available substrates and nutrients for soil microorganisms [56]. However, we also found NT decreased the abundance of bacteria such as order GP1 and Gp18 in 2013 rice season (Table S5), which may be due to Gp1 and Gp18 benefitting from a poor nutrition condition [57].
Straw return can input a large quantity of straw-derived carbon into soil, and thus affect the bacterial community [56,58,59]. In this study, straw return observably affected the bacterial community in the 2013 rice season and 2014 wheat season (Tables S6 and S7). Generally, SR can tend to increase the abundance of the bacterial community as SR can provide more metabolic substrates for bacteria [12]. SR can improve soil properties, such as soil permeability and water holding capacity, and provide comfortable habitat conditions for bacteria, thus improving the bacterial community [12,59]. However, in this study, SR decreased the abundance of some within the bacterial community, such as order Caulobacterales, which may be due to SR increasing the availability of oxygen and thus inhibiting the growth of Caulobacterales in the 2013 rice season [60]. SR also decreased the abundance of order Gp18 in the 2013 rice season, which is probably due to the fact that order Gp1 and Gp18 could benefit from a poor nutrition condition [57].
In this study, the interaction of tillage and straw return practices significantly influenced the abundance of the bacterial community in 0–5 cm soil layer, such as order Gp1, Gp18, Gp4, Gp17, Holophagales, Dehalogenimonas, Chlamydiales, Caulobacterales, Syntrophobacterales, and Spartobacteria_genera_incertae_sedis (Tables S6 and S7). SR and NT tended to increase the abundance of the soil bacterial community, and the combination of SR and NT can provide better habitat conditions, such as higher availability of oxygen and greater organic carbon for the soil bacterial community [12,59]. However, some within the bacterial community, such as order G16 and Rhodospirillales, were not significantly affected by the interaction (Tables S6 and S7). This can be attributed to high diversity of soil bacterial community, and the difference in the preference of soil microorganisms regarding habitat conditions, such as oxygen availability and carbon and nitrogen sources. Moreover, crop rotation can also reduce the interaction effect of tillage and straw return practices on the soil bacterial community [21,26].

4.4. Effect of NT and Straw Return on Crop Yields

The effect of NT and SR on crop yields was discussed in our previous study [2]. In this study, NT had no significant effect on grain yields during 2012–2014, except that NT significantly reduced crop yields in the 2014 wheat season (Table S8). In general, less than five years of continuous NT is not enough to change crop yields [2,61]. Lower yields under NT than under CT in the 2014 wheat season can be attributed to high rainfall during the growth season of wheat (Figure 1). NT can promote the accumulation of straw residue on the soil surface, and enhance the soil anaerobic condition in the case of high rainfall, inhabiting the growth of wheat under NT [2,62,63,64]. Moreover, NT can decrease crop yield and may be due to decreased productive tillers and increased weed growth [2].
On the contrary, straw return often increases crop yields, as SR can enhance the input level of organic matter, thus improving soil nutrient conditions [61]. In this study, SR had no effect on crop yields (Table S8). The reason may be the fact that a long time is required, usually, for straw to be degraded and then change soil physical-chemical properties. Therefore, short-term straw return may have little effect on crop yields [2].
In this study, the interaction of tillage and straw return practices had no effect on crop yields, except in the 2014 wheat season (Table S8). Generally, the interaction of long-term tillage and straw return can increase crop yield, as long-term NT or SR can promote straw residue input into the soil, thus providing more nutrition for crops [3]. However, short-term NT and SR cannot significantly change crop yields [11].

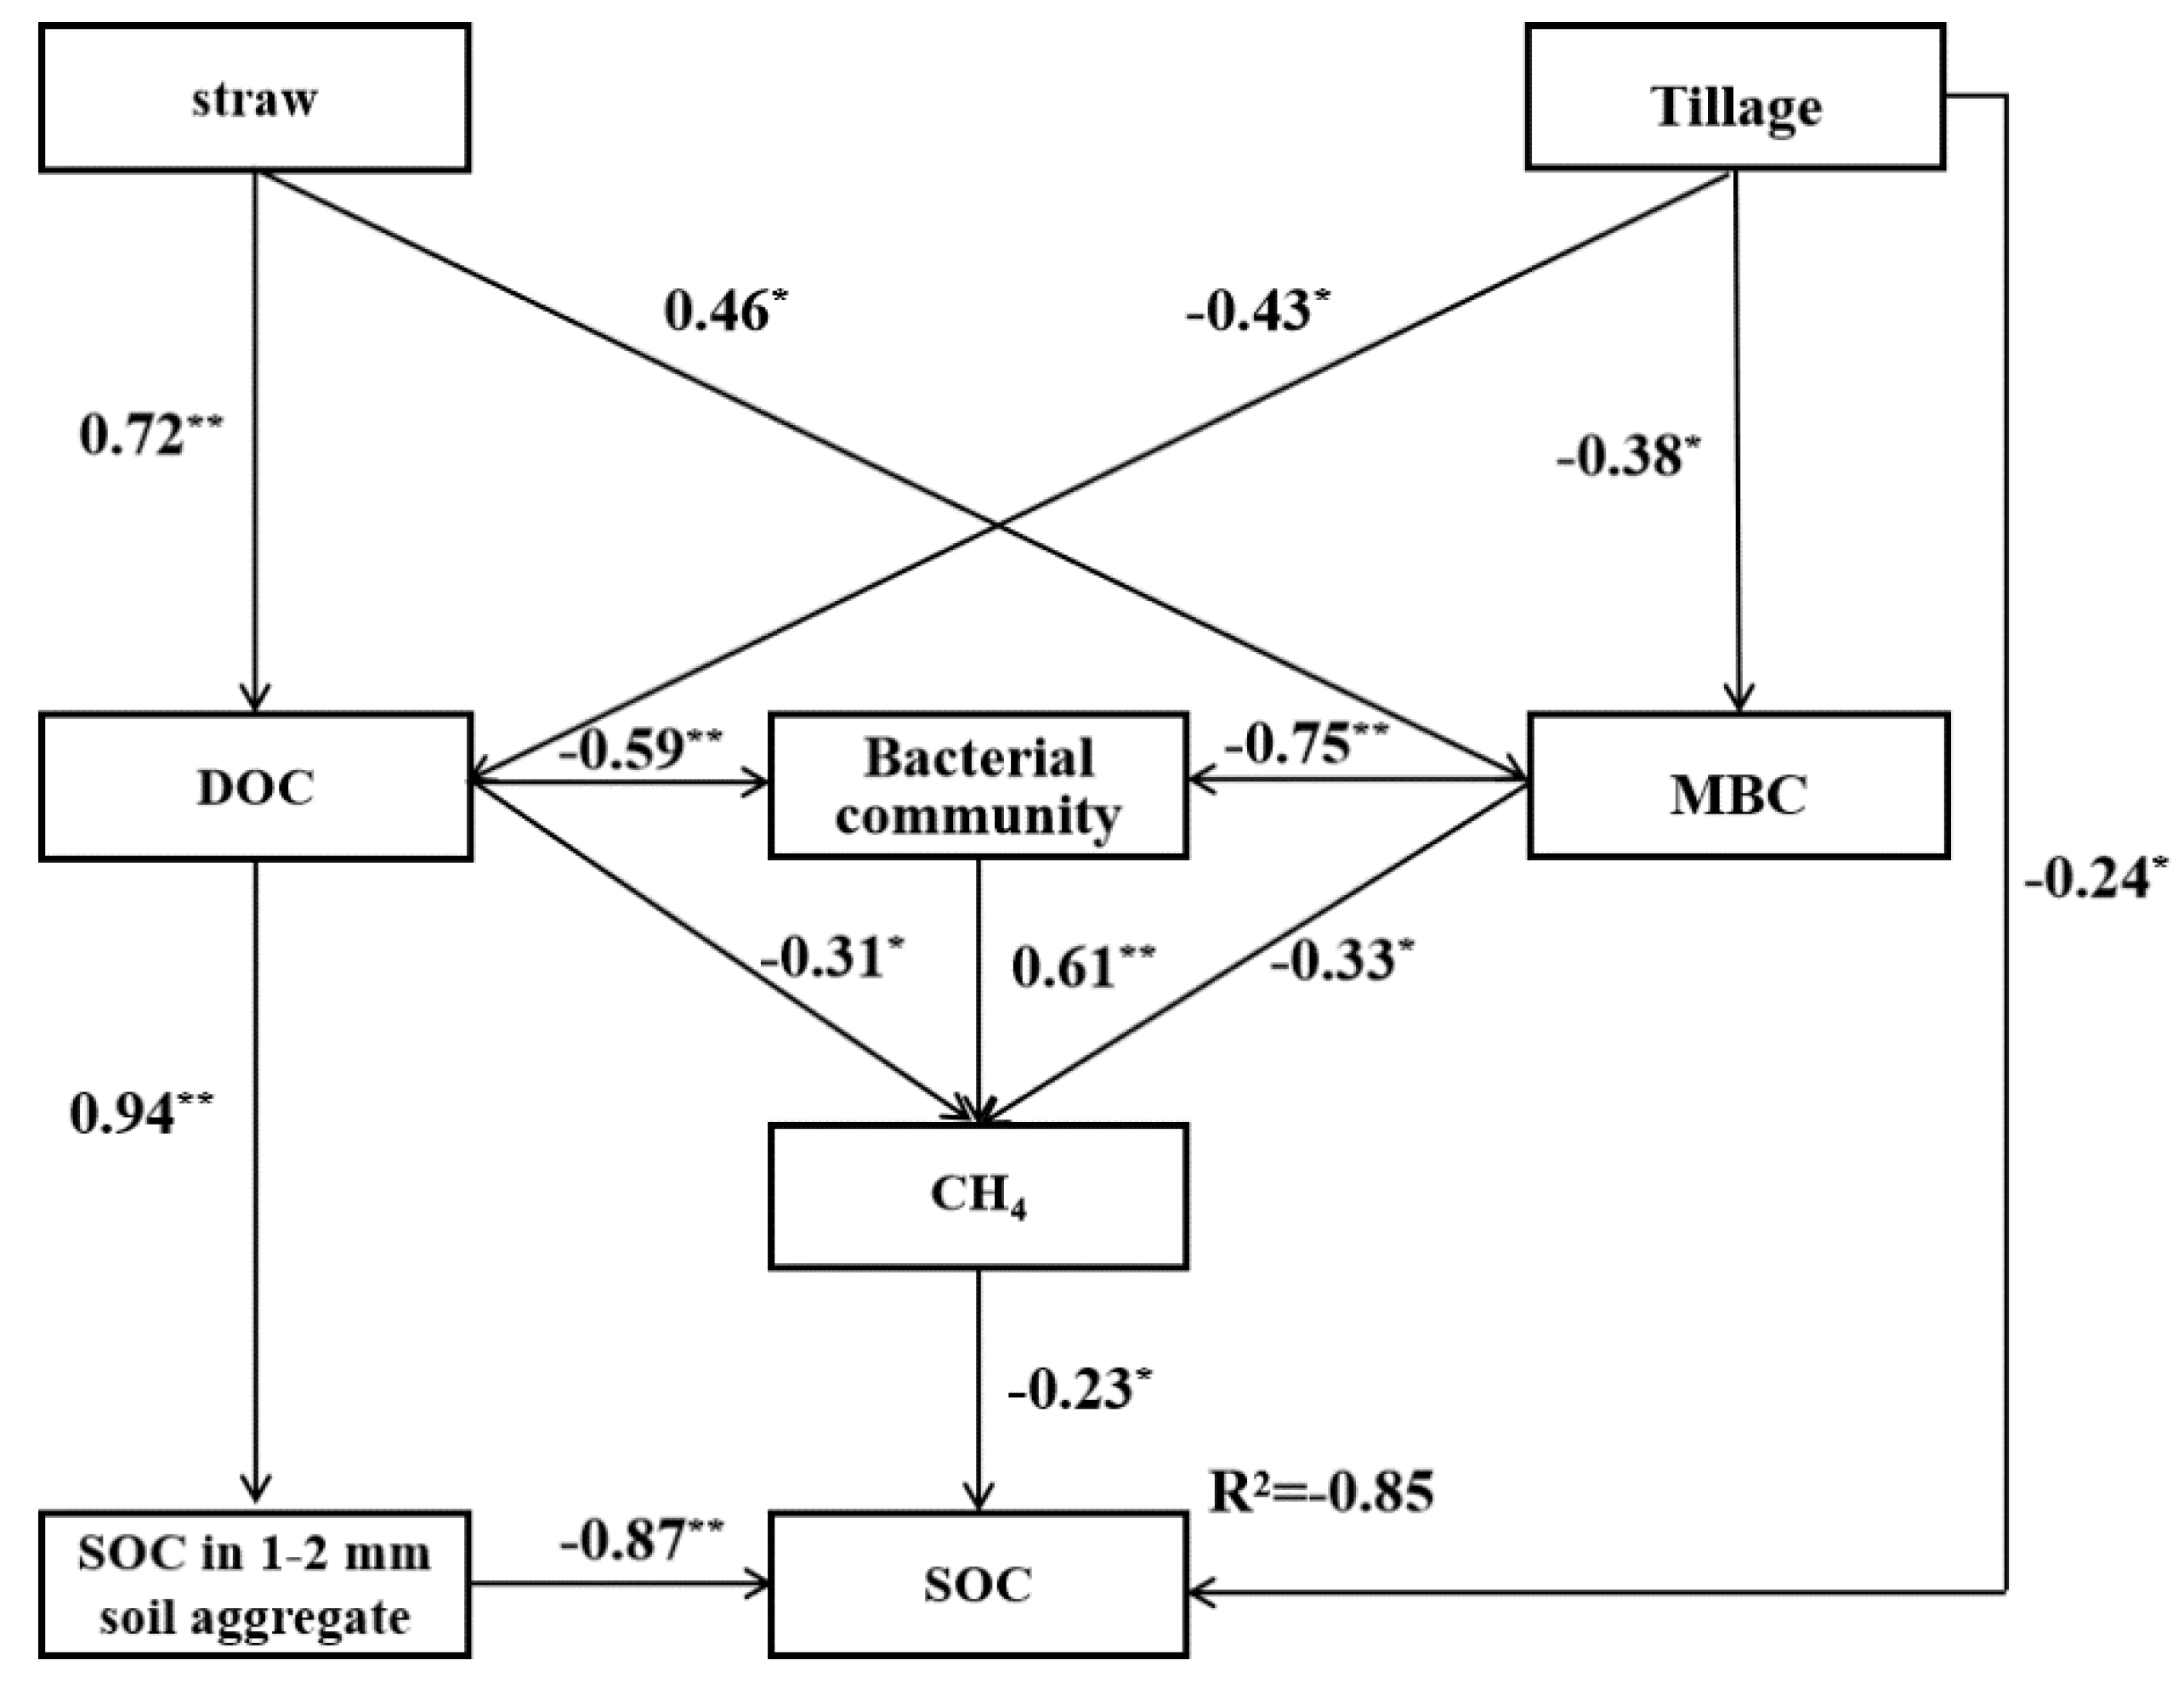
4.5. Relationships between Soil Organic Carbon and Bacterial Community under Different Tillage and Straw Return Practices

The soil bacterial community largely contributes to aggregates stabilization and SOC sequestration [25,41]. In this study, the bacterial community (such as Gp6, Gp10, Gp16, Gp18), Planctomycetes (including Burkholderiales and Subdivision3_genera_incertae_sedis) and Actinobacteria (such as Sphingobacteriales) were significantly affected by MBC and SOC in 1–2 mm macro-aggregates (Figure 3), which may be due to the fact that bacteria can metabolize organic matter and be stabilized as microbial residues in organic mineral complexes [53,54]. During the process of the decomposition of organic matter, a large quantity of broken organic carbon is released, contributing to the formation of soil macro-aggregates [64].
We found that the bacterial community, such as Subdivision3_genera_incertae_sedis, Gp18, and Caulobacterales, observably affected CH4 emissions (Figure 3). It was reported that the bacterial community could affect CH4 emissions through changing the availability of oxygen and organic carbon for methanogens [65,66,67]. The bacterial community can provide organic carbon for methanogens by degrading crop residue and thus enhance CH4 emissions [67,68]. Besides, methanotrophic bacteria are important mediators for CH4 consumption, which plays a significant role in controlling CH4 emissions [69]. Therefore, the bacterial community may contribute to the shift in SOC content in macro-aggregates and CH4 emissions, thus affecting the dynamics of SOC [17,41].
In this study, structural equation modeling analysis showed that SOC in 1–2 mm aggregates and CH4 emissions jointly affected SOC sequestration under tillage and straw return systems (Figure 4), suggesting that SOC content was regulated by the balance between the SOC sequestration in 1–2 mm aggregates and the SOC losses induced by CH4 emissions. Compared with CT, NT enhanced the formation of macro-aggregates (Table S2) and the accumulation of SOC in 1–2 mm aggregates (Table 1), while it reduced CH4 emissions (Table 2), resulting in an increase in SOC content in the topsoil layer [32,41,42]. Compared with NS, SR promoted the losses of SOC induced by CH4 emissions compared with NS (Table 2), and accelerated an increase in SOC sequestration in 1–2 mm aggregates (Table 1). Moreover, part of the straw could be sequestrated in soil by forming recalcitrant organic matter [7], which leads to increase in SOC content. Therefore, it can be concluded that both NT and SR increased SOC content, which may be the results of the balance between SOC accumulation in 1–2 mm aggregates and CH4 emissions.

5. Conclusions

Both NT and SR increased SOC content in 0–5 cm topsoil layers in a rice-wheat cropping system. Our study indicates that NT and SR increased SOC content in 1–2 mm soil aggregates. NT resulted in lower CO2 and CH4 emissions compared with CT. However, SR increased CO2 and CH4 emissions compared to NS. Bacterial communities (such as Gp6, Gp10, Gp16 and Gp18), had significant relationships with SOC in 1–2 mm aggregates and MBC. Bacterial communities like Subdivision3_genera_incertae_sedis, Gp18, and Caulobacterales had the most effect on CH4 emissions. Our study highlights that 4.4–15.3% of increase in SOC contents under NT and straw return were mainly due to the balance between SOC accumulation in 1–2 mm soil aggregates and CH4 emissions in rice and wheat cropping systems.

Supplementary Materials

The following supporting information can be downloaded at: https://www.mdpi.com/article/10.3390/agriculture12101552/s1, Table S1: Changes of soil organic carbon contents (g kg−1) under different tillage and straw return practices from (2012–2014); Table S2: Changes in aggregate composition (%) under different tillage and straw return practices in 0–5 cm soil layer (2012–2014); Table S3: Changes of dissolved organic carbon (g kg−1) contents in 0–5 cm soil layer under different tillage and straw return practices during 2012–2014; Table S4: Changes of soil microbial biomass carbon (mg kg−1) contents in 0–5 cm soil layer under different tillage and straw return practices during 2012–2014; Table S5: Soil bacterial and fungal PLFA under different tillage practices and residue returning methods in 0–5 cm soil layer (2013–2014); Table S6: The change in bacterial community at order level (relative abundance > 0.5%) under different tillage and straw return practice in 2013 rice season; Table S7: The change in bacterial community at order level (relative abundance > 0.5%) under different tillage and straw return practice in 2014 wheat season. Bacterial community; Table S8: The change in bacterial community at order level (relative abundance > 0.5%) under different tillage and straw return practice in 2014 wheat season. Bacterial community; Table S9: The relationship between crop yield and soil properties.

Author Contributions

Data curation and writing-original draft preparation, L.G.; methodology, W.L. and Z.L.; review and editing, J.S. and J.L.; investigation, P.W.; formal analysis, X.T. and Y.L.; validation, C.L.; supervision, C.L. All authors have read and agreed to the published version of the manuscript.

Funding

This research is funded by the Key Research and Development Project of Hubei Province (2021BBA224), the Hainan Provincial Natural Science Foundation of China (320RC470, 2019RC111), and Priming Scientific Research Foundation of Hainan University (KYQD(ZR)1982).

Institutional Review Board Statement

Not applicable.

Data Availability Statement

Not applicable.

Conflicts of Interest

The authors declare no conflict of interest in this manuscript.

References

  1. Fiorini, A.; Boselli, R.; Maris, S.C.; Santelli, S.; Perego, A.; Acutis, M.; Brenna, S.; Tabaglio, V. Soil type and cropping system as drivers of soil quality indicators response to no-till: A 7-year field study. Appl. Soil Ecol. 2020, 155, 103646. [Google Scholar] [CrossRef]
  2. Guo, L.; Zhang, L.; Liu, L.; Sheng, F.; Cao, C.; Li, C. Effects of long-term no tillage and straw return on greenhouse gas emissions and crop yields from a rice-wheat system in central China. Agric. Ecosyst. Environ. 2021, 322, 107650. [Google Scholar] [CrossRef]
  3. Berhane, M.; Xu, M.; Liang, Z.; Shi, J.; Wei, G.; Tian, X. Effects of long-term straw return on soil organic carbon storage and sequestration rate in North China upland crops: A meta-analysis. Glob. Chang. Biol. 2020, 26, 2686–2701. [Google Scholar] [CrossRef] [PubMed]
  4. Zeraatpisheh, M.; Ayoubi, S.; Mirbagheri, Z.; Mosaddeghi, M.R.; Xu, M. Spatial prediction of soil aggregate stability and soil organic carbon in aggregate fractions using machine learning algorithms and environmental variables. Geoderma Reg. 2021, 27, e00440. [Google Scholar] [CrossRef]
  5. Ajami, M.; Heidari, A.; Khormali, F.; Gorji, M.; Ayoubi, S. Environmental factors controlling soil organic carbon storage in loess soils of a subhumid region, northern Iran. Geoderma 2016, 281, 1–10. [Google Scholar] [CrossRef]
  6. Christopher, S.F.; Lal, R.; Mishra, U. Regional Study of No-Till Effects on Carbon Sequestration in the Midwestern United States. Soil Sci. Soc. Am. J. 2009, 73, 207–216. [Google Scholar] [CrossRef]
  7. Six, J.; Paustian, K. Aggregate-associated soil organic matter as an ecosystem property and a measurement tool. Soil Biol. Biochem. 2014, 68, A4–A9. [Google Scholar] [CrossRef]
  8. Wu, Q.-X.; Du, B.; Jiang, S.-C.; Zhang, H.-W.; Zhu, J.-Q. Side Deep Fertilizing of Machine-Transplanted Rice to Guarantee Rice Yield in Conservation Tillage. Agriculture 2022, 12, 528. [Google Scholar] [CrossRef]
  9. Akhtar, K.; Wang, W.; Ren, G.; Khan, A.; Feng, Y.; Yang, G. Changes in soil enzymes, soil properties, and maize crop productivity under wheat straw mulching in Guanzhong, China. Soil Tillage Res. 2018, 182, 94–102. [Google Scholar] [CrossRef]
  10. Modak, K.; Biswas, D.R.; Ghosh, A.; Pramanik, P.; Das, T.K.; Das, S.; Kumar, S.; Krishnan, P.; Bhattacharyya, R. Zero tillage and residue retention impact on soil aggregation and carbon stabilization within aggregates in subtropical India. Soil Tillage Res. 2020, 202, 104649. [Google Scholar] [CrossRef]
  11. Mathew, R.P.; Feng, Y.; Githinji, L.; Ankumah, R.; Balkcom, K.S. Impact of No-Tillage and Conventional Tillage Systems on Soil Microbial Communities. Appl. Environ. Soil Sci. 2012, 2012, 1–10. [Google Scholar] [CrossRef]
  12. Jin, V.L.; Schmer, M.R.; Stewart, C.E.; Sindelar, A.J.; Varvel, G.E.; Wienhold, B. Long-term no-till and stover retention each decrease the global warming potential of irrigated continuous corn. Glob. Chang. Biol. 2017, 23, 2848–2862. [Google Scholar] [CrossRef] [PubMed]
  13. Shakoor, A.; Shahbaz, M.; Farooq, T.H.; Sahar, N.E.; Shahzad, S.M.; Altaf, M.M.; Ashraf, M. A global meta-analysis of greenhouse gases emission and crop yield under no-tillage as compared to conventional tillage. Sci. Total Environ. 2021, 750, 142299. [Google Scholar] [CrossRef]
  14. Li, G.; Bian, S.; Lu, X.; Yang, T.; Lei, G.H. Field test on extruding soil caused of PHC pipe pile driving by static pressure for improving soft foundation of widened embankment. Rock Soil Mech. 2013, 34, 1089–1096. [Google Scholar]
  15. Kan, Z.-R.; Liu, Q.-Y.; Virk, A.L.; He, C.; Qi, J.-Y.; Dang, Y.P.; Zhao, X.; Zhang, H.-L. Effects of experiment duration on carbon mineralization and accumulation under no-till. Soil Tillage Res. 2021, 209, 104939. [Google Scholar] [CrossRef]
  16. Bandyopadhyay, P.K.; Saha, S.; Mani, P.K.; Mandal, B. Effect of organic inputs on aggregate associated organic carbon concentration under long-term rice–wheat cropping system. Geoderma 2010, 154, 379–386. [Google Scholar] [CrossRef]
  17. Liu, C.; Lu, M.; Cui, J.; Li, B.; Fang, C. Effects of Straw Carbon Input on Carbon Dynamics in Agricultural Soils: A Meta-Analysis. Glob. Chang. Biol. 2014, 20, 1366–1381. [Google Scholar] [CrossRef] [PubMed]
  18. Hidalgo, C.; Merino, A.; Osorio-Hernández, V.; Etchevers, J.D.; Figueroa, B.; Limon-Ortega, A.; Aguirre, E. Physical and chemical processes determining soil organic matter dynamics in a managed vertisol in a tropical dryland area. Soil Tillage Res. 2019, 194, 104348. [Google Scholar] [CrossRef]
  19. Regina, K.; Alakukku, L. Greenhouse gas fluxes in varying soils types under conventional and no-tillage practices. Soil Tillage Res. 2010, 109, 144–152. [Google Scholar] [CrossRef]
  20. Ruan, L.; Philip Robertson, G. Initial nitrous oxide, carbon dioxide, and methane costs of converting conservation reserve program grassland to row crops under no-till vs. conventional tillage. Glob. Chang. Biol. 2013, 19, 2478–2489. [Google Scholar] [CrossRef]
  21. Guo, L.-J.; Lin, S.; Liu, T.-Q.; Cao, C.-G.; Li, C.-F. Effects of Conservation Tillage on Topsoil Microbial Metabolic Characteristics and Organic Carbon within Aggregates under a Rice (Oryza sativa L.)–Wheat (Triticum aestivum L.) Cropping System in Central China. PLoS ONE 2016, 11, e0146145. [Google Scholar] [CrossRef] [Green Version]
  22. Zhao, X.; Virk, A.L.; Ma, S.-T.; Kan, Z.-R.; Qi, J.-Y.; Pu, C.; Yang, X.-G.; Zhang, H.-L. Dynamics in soil organic carbon of wheat-maize dominant cropping system in the North China Plain under tillage and residue management. J. Environ. Manag. 2020, 265, 110549. [Google Scholar] [CrossRef] [PubMed]
  23. Ussiri, D.A.; Lal, R.; Jarecki, M.K. Nitrous oxide and methane emissions from long-term tillage under a continuous corn cropping system in Ohio. Soil Tillage Res. 2009, 104, 247–255. [Google Scholar] [CrossRef]
  24. Pareja-Sánchez, E.; Cantero-Martínez, C.; Álvaro-Fuentes, J.; Plaza-Bonilla, D. Tillage and nitrogen fertilization in irrigated maize: Key practices to reduce soil CO2 and CH4 emissions. Soil Tillage Res. 2019, 191, 29–36. [Google Scholar] [CrossRef]
  25. Duan, M.; Long, Y.; Fan, H.; Ma, L.; Han, S.; Li, S.; Wei, B.; Wang, L. Fenlong-Ridging Promotes Microbial Activity in Sugarcane: A Soil and Root Metabarcoding Survey. Agriculture 2022, 12, 244. [Google Scholar] [CrossRef]
  26. Gartzia-Bengoetxea, N.; González-Arias, A.; Merino, A.; de Arano, I.M. Soil organic matter in soil physical fractions in adjacent semi-natural and cultivated stands in temperate Atlantic forests. Soil Biol. Biochem. 2009, 41, 1674–1683. [Google Scholar] [CrossRef]
  27. Jiang, P.; Xu, Q.; Xu, Z.; Cao, Z. Seasonal changes in soil labile organic carbon pools within a Phyllostachys praecox stand under high rate fertilization and winter mulch in subtropical China. For. Ecol. Manag. 2006, 236, 30–36. [Google Scholar] [CrossRef]
  28. Frostegård, Å.; Tunlid, A.; Bååth, E. Phospholipid Fatty Acid Composition, Biomass, and Activity of Microbial Communities from Two Soil Types Experimentally Exposed to Different Heavy Metals. Appl. Environ. Microbiol. 1993, 59, 3605–3617. [Google Scholar] [CrossRef]
  29. Neue, H.U.; Sass, R.L. Global Measurement Standardization of Methane Emissions from Irrigated Rice Cultivation: A Report of the Rice Cultivation and Trace Gas Exchange Activity (RICE) of the International Global Atmospheric Chemistry (IGAC) Project; Massachusetts Institute of Technology: Cambridge, MA, USA, 1994; pp. 1–6. Available online: http://www.worldcat.org/title/197230180?__cf_chl_tk=DkYxejo5hvH01DTFE3XL_W_Aq7RcOSe3nCs2nFFzE9E-1664118918-0-gaNycGzNBqU (accessed on 10 August 2022).
  30. Buendia, L.; Neue, H.; Wassmann, R.; Lantin, R.; Javellana, A.; Arah, J.; Wang, Z.; Wanfang, L.; Makarim, A.; Corton, T.; et al. An efficient sampling strategy for estimating methane emission from rice field. Chemosphere 1998, 36, 395–407. [Google Scholar] [CrossRef]
  31. Li, C.; Zhang, Z.; Guo, L.; Cai, M.; Cao, C. Emissions of CH4 and CO2 from double rice cropping systems under varying tillage and seeding methods. Atmos. Environ. 2013, 80, 438–444. [Google Scholar] [CrossRef]
  32. Zhang, Z.; Guo, L.; Liu, T.; Li, C.; Cao, C. Effects of tillage practices and straw returning methods on greenhouse gas emissions and net ecosystem economic budget in rice–wheat cropping systems in central China. Atmos. Environ. 2015, 122, 636–644. [Google Scholar] [CrossRef]
  33. Zhao, J.; Carmody, L.A.; Kalikin, L.M.; Li, J.; Petrosino, J.F.; Schloss, P.; Young, V.; Lipuma, J.J. Impact of Enhanced Staphylococcus DNA Extraction on Microbial Community Measures in Cystic Fibrosis Sputum. PLoS ONE 2012, 7, e33127. [Google Scholar] [CrossRef] [PubMed]
  34. Caporaso, J.; Kuczynski, J.; Stombaugh, J.; Bittinger, K.; Bushman, F.; Costello, E.K.; Fierer, N.; Peña, A.G.; Goodrich, J.K.; Gordon, J.I.; et al. QIIME allows integration and analysis of high-7 throughput community sequencing data. Nat. Methods 2010, 7, 335–336. [Google Scholar] [CrossRef] [PubMed]
  35. Fierer, N.; Hamady, M.; Lauber, C.L.; Knight, R. The influence of sex, handedness, and washing on the diversity of hand surface bacteria. Proc. Natl. Acad. Sci. USA 2008, 105, 17994–17999. [Google Scholar] [CrossRef] [PubMed]
  36. Oksanen, J.; Kindt, R.; Legendre, P.; O’Hara, B.; Stevens, M.H.H.; Oksanen, M.J.; Suggests, M.A.S.S. The vegan package. Community Ecol. Package 2007, 10, 719. [Google Scholar]
  37. Grace, J.B.; Michael Anderson, T.; Smith, M.D.; Seabloom, E.; Andelman, S.J.; Meche, G.; Weiher, E.; Allain, L.K.; Jutila, H.; Sankaran, M.; et al. Does species diversity limit productivity in natural grassland communities? Ecol. Lett. 2007, 10, 680–689. [Google Scholar] [CrossRef]
  38. Borie, F.; Rubio, R.; Rouanet, J.; Morales, A.; Borie, G.; Rojas, C. Effects of tillage systems on soil characteristics, glomalin and mycorrhizal propagules in a Chilean Ultisol. Soil Tillage Res. 2006, 88, 253–261. [Google Scholar] [CrossRef]
  39. Biswakarma, N.; Pooniya, V.; Zhiipao, R.; Kumar, D.; Verma, A.; Shivay, Y.; Lama, A.; Choudhary, A.; Meena, M.; Bana, R.J.A.; et al. Five years integrated crop management in direct seeded rice–zero till wheat rotation of north-western India: Effects on soil carbon dynamics, crop yields, water productivity and economic profitability. Agric. Ecosyst. Environ. 2021, 318, 107492. [Google Scholar] [CrossRef]
  40. Balota, E.L.; Colozzi Filho, A.; Andrade, D.S.; Dick, R.P. Long-term tillage and crop rotation effects on microbial biomass and C and N mineralization in a Brazilian Oxisol. Soil Tillage Res. 2004, 77, 137–145. [Google Scholar] [CrossRef]
  41. Trivedi, P.; Delgado-Baquerizo, M.; Jeffries, T.C.; Trivedi, C.; Anderson, I.C.; Lai, K.; McNee, M.; Flower, K.; Pal Singh, B.; Minkey, D.; et al. Soil aggregation and associated microbial communities modify the impact of agricultural management on carbon content. Environ. Microbiol. 2017, 19, 3070–3086. [Google Scholar] [CrossRef]
  42. Jia, S.; Liang, A.; Zhang, S.; Chen, X.; McLaughlin, N.B.; Sun, B.; Zhang, X.; Wu, D. Effect of tillage system on soil CO2 flux, soil microbial community and maize (Zea mays L.) yield. Geoderma 2021, 384, 114813. [Google Scholar] [CrossRef]
  43. Kan, Z.-R.; He, C.; Liu, Q.-Y.; Liu, B.-Y.; Virk, A.L.; Qi, J.-Y.; Zhao, X.; Zhang, H.-L. Carbon mineralization and its temperature sensitivity under no-till and straw returning in a wheat-maize cropping system. Geoderma 2020, 377, 114610. [Google Scholar] [CrossRef]
  44. Kan, Z.-R.; Ma, S.-T.; Liu, Q.-Y.; Liu, B.-Y.; Virk, A.L.; Qi, J.-Y.; Zhao, X.; Lal, R.; Zhang, H.-L. Carbon sequestration and mineralization in soil aggregates under long-term conservation tillage in the North China Plain. CATENA 2020, 188, 104428. [Google Scholar] [CrossRef]
  45. Emde, D.; Hannam, K.D.; Most, I.; Nelson, L.M.; Jones, M.D. Soil organic carbon in irrigated agricultural systems: A meta-analysis. Glob. Chang. Biol. 2021, 27, 3898–3910. [Google Scholar] [CrossRef] [PubMed]
  46. Tan, Y.; Wu, D.; Bol, R.; Wu, W.; Meng, F. Conservation farming practices in winter wheat–summer maize cropping reduce GHG emissions and maintain high yields. Agric. Ecosyst. Environ. 2019, 272, 266–275. [Google Scholar] [CrossRef]
  47. Ma, J.; Xu, H.; Yagi, K.; Cai, Z. Methane emission from paddy soils as affected by wheat straw returning mode. Plant Soil 2008, 313, 167–174. [Google Scholar] [CrossRef]
  48. Akter, M.; Deroo, H.; Kamal, A.M.; Kader, M.A.; Verhoeven, E.; Decock, C.; Boeckx, P.; Sleutel, S. Impact of irrigation management on paddy soil N supply and depth distribution of abiotic drivers. Agric. Ecosyst. Environ. 2018, 261, 12–24. [Google Scholar] [CrossRef]
  49. Lin, Q.; Wang, S.; Li, Y.; Riaz, L.; Yu, F.; Yang, Q.; Han, S.; Ma, J. Effects and mechanisms of land-types conversion on greenhouse gas emissions in the Yellow River floodplain wetland. Sci. Total Environ. 2022, 813, 152406. [Google Scholar] [CrossRef]
  50. Acosta-Martínez, V.; Dowd, S.; Sun, Y.; Allen, V. Tag-encoded pyrosequencing analysis of bacterial diversity in a single soil type as affected by management and land use. Soil Biol. Biochem. 2008, 40, 2762–2770. [Google Scholar] [CrossRef]
  51. Ondreičková, K.; Piliarová, M.; Bušo, R.; Hašana, R.; Schreiber, L.; Gubiš, J.; Kraic, J. The Structure and Diversity of Bacterial Communities in Differently Managed Soils Studied by Molecular Fingerprinting Methods. Sustainability 2018, 10, 1095. [Google Scholar] [CrossRef]
  52. Lewin, G.R.; Carlos, C.; Chevrette, M.G.; Horn, H.A.; McDonald, B.R.; Stankey, R.J.; Fox, B.G.; Currie, C.R. Evolution and ecology of Actinobacteria and their bioenergy applications. Annu. Rev. Microbiol. 2016, 70, 235. [Google Scholar] [CrossRef]
  53. Francioli, D.; Schulz, E.; Lentendu, G.; Wubet, T.; Buscot, F.; Reitz, T. Mineral vs. Organic Amendments: Microbial Community Structure, Activity and Abundance of Agriculturally Relevant Microbes Are Driven by Long-Term Fertilization Strategies. Front. Microbiol. 2016, 7, 1446. [Google Scholar] [CrossRef] [PubMed] [Green Version]
  54. Zhu, J.; Peng, H.; Ji, X.; Li, C.; Li, S. Effects of reduced inorganic fertilization and rice straw recovery on soil enzyme activities and bacterial community in double-rice paddy soils. Eur. J. Soil Biol. 2019, 94, 103116. [Google Scholar] [CrossRef]
  55. Luo, Y.; Iqbal, A.; He, L.; Zhao, Q.; Wei, S.; Ali, I.; Ullah, S.; Yan, B.; Jiang, L. Long-Term No-Tillage and Straw Retention Management Enhances Soil Bacterial Community Diversity and Soil Properties in Southern China. Agronomy 2020, 10, 1233. [Google Scholar] [CrossRef]
  56. Miura, T.; Niswati, A.; Swibawa, I.G.; Haryani, S.; Gunito, H.; Arai, M.; Yamada, K.; Shimano, S.; Kaneko, N.; Fujie, K. Shifts in the composition and potential functions of soil microbial communities responding to a no-tillage practice and bagasse mulching on a sugarcane plantation. Biol. Fertil. Soils 2016, 52, 307–322. [Google Scholar] [CrossRef]
  57. Yu, C.; Hu, X.; Deng, W.; Li, Y.; Han, G.; Xiong, C. Response of Bacteria Community to Long-Term Inorganic Nitrogen Application in Mulberry Field Soil. PLoS ONE 2016, 11, e0168152. [Google Scholar] [CrossRef]
  58. Dong, W.; Liu, E.; Yan, C.; Tian, J.; Zhang, H.; Zhang, Y. Impact of no tillage vs. conventional tillage on the soil bacterial community structure in a winter wheat cropping succession in northern China. Eur. J. Soil Biol. 2017, 80, 35–42. [Google Scholar] [CrossRef]
  59. Sun, M.; Chen, B.; Wang, H.; Wang, N.; Ma, T.; Cui, Y.; Luan, T.; Chun, S.; Liu, C.; Wang, L. Microbial Interactions and Roles in Soil Fertility in Seasonal Freeze-Thaw Periods under Different Straw Returning Strategies. Agriculture 2021, 11, 779. [Google Scholar] [CrossRef]
  60. Yamada, T.; Imachi, H.; Ohashi, A.; Harada, H.; Hanada, S.; Kamagata, Y.; Sekiguchi, Y. Bellilinea caldifistulae gen. nov., sp. nov. and Longilinea arvoryzae gen. nov., sp. nov., strictly anaerobic, filamentous bacteria of the phylum Chloroflexi isolated from methanogenic propionate-degrading consortia. Int. J. Syst. Evol. Microbiol. 2007, 57, 2299–2306. [Google Scholar] [CrossRef]
  61. Xia, L.; Lam, S.K.; Wolf, B.; Kiese, R.; Chen, D.; Butterbach-Bahl, K. Trade-offs between soil carbon sequestration and reactive nitrogen losses under straw return in global agroecosystems. Glob. Chang. Biol. 2018, 24, 5919–5932. [Google Scholar] [CrossRef]
  62. Arunrat, N.; Sansupa, C.; Kongsurakan, P.; Sereenonchai, S.; Hatano, R. Soil Microbial Diversity and Community Composition in Rice–Fish Co-Culture and Rice Monoculture Farming System. Biology 2022, 11, 1242. [Google Scholar] [CrossRef]
  63. Rezgui, C.; Trinsoutrot-Gattin, I.; Benoit, M.; Laval, K.; Wassila, R.A. Linking changes in the soil microbial community to C and N dynamics during crop residue decomposition. J. Integr. Agric. 2021, 20, 3039–3059. [Google Scholar] [CrossRef]
  64. Guo, L.-J.; Zhang, Z.-S.; Wang, D.-D.; Li, C.-F.; Cao, C.-G. Effects of short-term conservation management practices on soil organic carbon fractions and microbial community composition under a rice-wheat rotation system. Biol. Fertil. Soils 2015, 51, 65–75. [Google Scholar] [CrossRef]
  65. Dubey, S.K.; Singh, A.; Singh, R.; Upadhyay, S. Changes in methanogenic population size and CH4 production potential in response to crop phenology in tropical rice field. Soil Biol. Biochem. 2013, 57, 972–978. [Google Scholar] [CrossRef]
  66. Fan, X.; Yu, H.; Wu, Q.; Ma, J.; Xu, H.; Yang, J.; Zhuang, Y. Effects of fertilization on microbial abundance and emissions of greenhouse gases (CH4 and N2O) in rice paddy fields. Ecol. Evol. 2016, 6, 1054–1063. [Google Scholar] [CrossRef]
  67. Glissmann, K.; Weber, S.; Conrad, R. Localization of processes involved in methanogenic degradation of rice straw in anoxic paddy soil. Environ. Microbiol. 2001, 3, 502–511. [Google Scholar] [CrossRef]
  68. Ortiz-Cornejo, N.L.; Romero-Salas, E.A.; Navarro-Noya, Y.E.; González-Zúñiga, J.C.; Ramirez-Villanueva, D.A.; Vásquez-Murrieta, M.S.; Verhulst, N.; Govaerts, B.; Dendooven, L.; Luna-Guido, M. Incorporation of bean plant residue in soil with different agricultural practices and its effect on the soil bacteria. Appl. Soil Ecol. 2017, 119, 417–427. [Google Scholar] [CrossRef]
  69. Conrad, R. Microbial ecology of methanogens and methanotrophs. Adv. Agron. 2007, 96, 1–63. [Google Scholar]
Figure 1. Average daily temperature and rainfall at the experimental site from 2012 to 2014 [2].
Agriculture 12 01552 g001
Figure 2. Design drawing of field experiment. Note: CT, conventional tillage; NT, no tillage; CTNS, conventional intensive tillage with straw removal; CTSR, conventional intensive tillage with straw return; NTNS, no tillage with straw removal; NTSR, no-tillage with straw return.
Agriculture 12 01552 g002
Figure 3. Redundancy analysis (RDA) ordination plot showing changes in bacterial community composition in 0–5 cm soil layer at order level (relative abundance > 0.5%) during the 2013 rice season and 2014 wheat season. SOC, soil organic C; MBC, microbial biomass C.
Agriculture 12 01552 g003
Figure 4. Selected structural equation modeling (data from 2013 rice season and 2014 wheat season were selected) for SOC in 0–5 cm soil layer (The chi-square test = 9.91; Goodness of fit index = 1.00; Comparative fit index = 0.91; Root square mean error of approximation = 0.00), based on the impact of tillage and straw return practices and SOC fractions. Values related to the solid arrows stand for the path coefficients. R2 indicates the proportion of variance explained. Significance levels are as follows: * p < 0.05; ** p < 0.01. Straw indicates straw systems; DOC indicates dissolved organic carbon; MBC indicates microbial biomass carbon; SOC indicates soil organic carbon.
Agriculture 12 01552 g004
Table 1. SOC contents (g kg−1) of aggregate fractions under different tillage and straw return practices (2012–2014).
Crop SeasonSoil Aggregate FractionCTNSCTSRNTNSNTSRTSRT × SR
2012 rice season1–2 mm17.03 ± 1.05 a18.97 ± 0.60 a18.61 ± 2.39 a21.14 ± 1.70 ans nsns
0.25–1 mm15.60 ± 0.32 a17.07 ± 0.76 a14.16 ± 0.03 a16.94 ± 1.66 ansns ns
0.053–0.25 mm19.67 ± 1.08 a16.49 ± 1.72 a20.62 ± 0.3 a16.85 ± 2.00 ansnsns
<0.053 mm17.97 ± 1.09 a19.49 ± 1.04 a18.72 ± 0.43 a18.00 ± 0.38 ansnsns
2013 wheat season1–2 mm16.32 ± 1.00 c18.20 ± 0.29 bc18.92 ± 0.91 b 21.45 ± 0.63 a*nsns
0.25–1 mm17.52 ± 0.55 a 18.52 ± 0.65 a19.77 ± 0.12 a21.53 ± 1.76 a * nsns
0.053–0.25 mm20.79 ± 1.62 a21.59 ± 0.98 a23.42 ± 1.91 a26.14 ± 3.05 ansnsns
<0.053 mm15.02 ± 1.34 a16.59 ± 1.54 a16.97 ± 1.75 a19.79 ± 1.45 ansnsns
2013 rice season1–2 mm16.14 ± 0.67 c18.46 ± 0.28 bc18.88 ± 0.43 b22.60 ± 1.36 a**ns
0.25–1 mm18.06 ± 0.43 c19.87 ± 0.18 b21.04 ± 0.46 ab21.98 ± 0.36 a**ns
0.053–0.25 mm16.90 ± 0.84 a16.93 ± 1.82 a18.23 ± 0.50 a19.65 ± 1.00 ansnsns
<0.053 mm15.51 ± 1.19 a16.92 ± 1.95 a20.18 ± 0.81 a18.81 ± 0.77 ansnsns
2014 wheat season1–2 mm16.25 ± 0.12 c18.34 ± 0.18 b16.30 ± 0.07 c19.87 ± 0.34 ans**
0.25–1 mm20.66 ± 0.33 c21.89 ± 0.19 ab21.40 ± 0.55 bc22.78 ± 0.14 ans*ns
0.053–0.25 mm17.49 ± 0.88 a18.22 ± 0.82 a18.75 ± 0.85 a19.63 ± 1.37 ansnsns
<0.053 mm17.72 ± 4.40 a17.83 ± 2.02 a16.99 ± 3.11 a17.67 ± 1.63 ansnsns
Different letters in the columns denote statistical differences in the means of the variables between treatments by the least significant difference test (p < 0.05). * p < 0.05; ns, not significant. CTNS, conventional intensive tillage with straw removal; CTSR, conventional intensive tillage with straw return; NTNS, no tillage with straw removal; NTSR, no-tillage with straw return. T, tillage; SR, straw return practices. T × SR, the interactions between tillage and straw return. Values are mean ± standard deviation (n = 3).
Table 2. Seasonal CH4 emissions (kg hm−2) under different tillage and straw return practices (2012–2014) (has been published by Guo et al. [2]).
Treatment201220132014
Rice SeasonWheat SeasonRice SeasonWheat SeasonRice Season
CTNS400 ± 7.51 b4.86 ± 0.98 c475 ± 21.7 b5.39 ± 0.54 c167 ± 11.37 b
CTSR560 ± 30.73 a16.91 ± 0.37 a645 ± 12.0 a15.95 ± 0.99 a202 ± 13.68 a
NTNS391 ± 21.16 b3.99 ± 0.42 c445 ± 7.7 b4.81 ± 0.46 c140 ± 10.60 b
NTSR632 ± 27.09 a12.53 ± 2.23 b610 ± 9.7 a12.33 ± 0.60 b162 ± 2.35 b
Tnsns nsns*
SR*****
T × SRns nsns ns ns
Different letters in the columns denote statistical differences in the means of the variables between treatments by the least sign difference test (p < 0.05). * p < 0.05; ns, not significant. CTNS, conventional intensive tillage with straw removal; CTSR, conventional intensive tillage with straw return; NTNS, no tillage with straw removal; NTSR, no-tillage with straw return. T, tillage; SR, straw return practices. T × SR, the interactions between tillage and straw return. Values are mean ± standard deviation (n = 3).
Table 3. Seasonal CO2 emissions (kg hm−2) under different tillage and straw return practices (2012–2014) (has been published by Guo et al. [2]).
Treatment201220132014
Rice SeasonWheat SeasonRice SeasonWheat SeasonRice Season
CTNS2230 ± 92 d5282 ± 123 b4833 ± 397 b3982 ± 84 bc4283 ± 50 c
CTSR4914 ± 27 a6695 ± 408 ab6503 ± 308 a4989 ± 123 a6332 ± 154 a
NTNS2660 ± 86 c6090 ± 298 ab3734 ± 116 c3799 ± 124 c3817 ± 88 d
NTSR4438 ± 47 b7193 ± 939 a5557 ± 265 b4525 ± 452 ab4525 ± 162 b
Tnsnsns**
SR** ***
T × SR*nsnsns*
Different letters in the columns denote statistical differences in the means of the variables between treatments by the least sign difference test (p < 0.05). *, p < 0.05; ns, not significant. CTNS, conventional intensive tillage with straw removal; CTSR, conventional intensive tillage with straw return; NTNS, no tillage with straw removal; NTSR, no-tillage with straw return. T, tillage; SR, straw return practices. T × SR, the interactions between tillage and straw return. Values are mean ± standard deviation (n = 3).
Publisher’s Note: MDPI stays neutral with regard to jurisdictional claims in published maps and institutional affiliations.

