
The Dessau Grassland Experiment—Impact of Fertilization on Forage Quality and Species Assembly in a Species-Rich Alluvial Meadow

 , , and
Abstract
:1. Introduction
2. Materials and Methods
2.1. Study Area
2.2. Experimental Design and Sampling
2.3. Species Groups
2.4. Statistical Analyses
3. Results
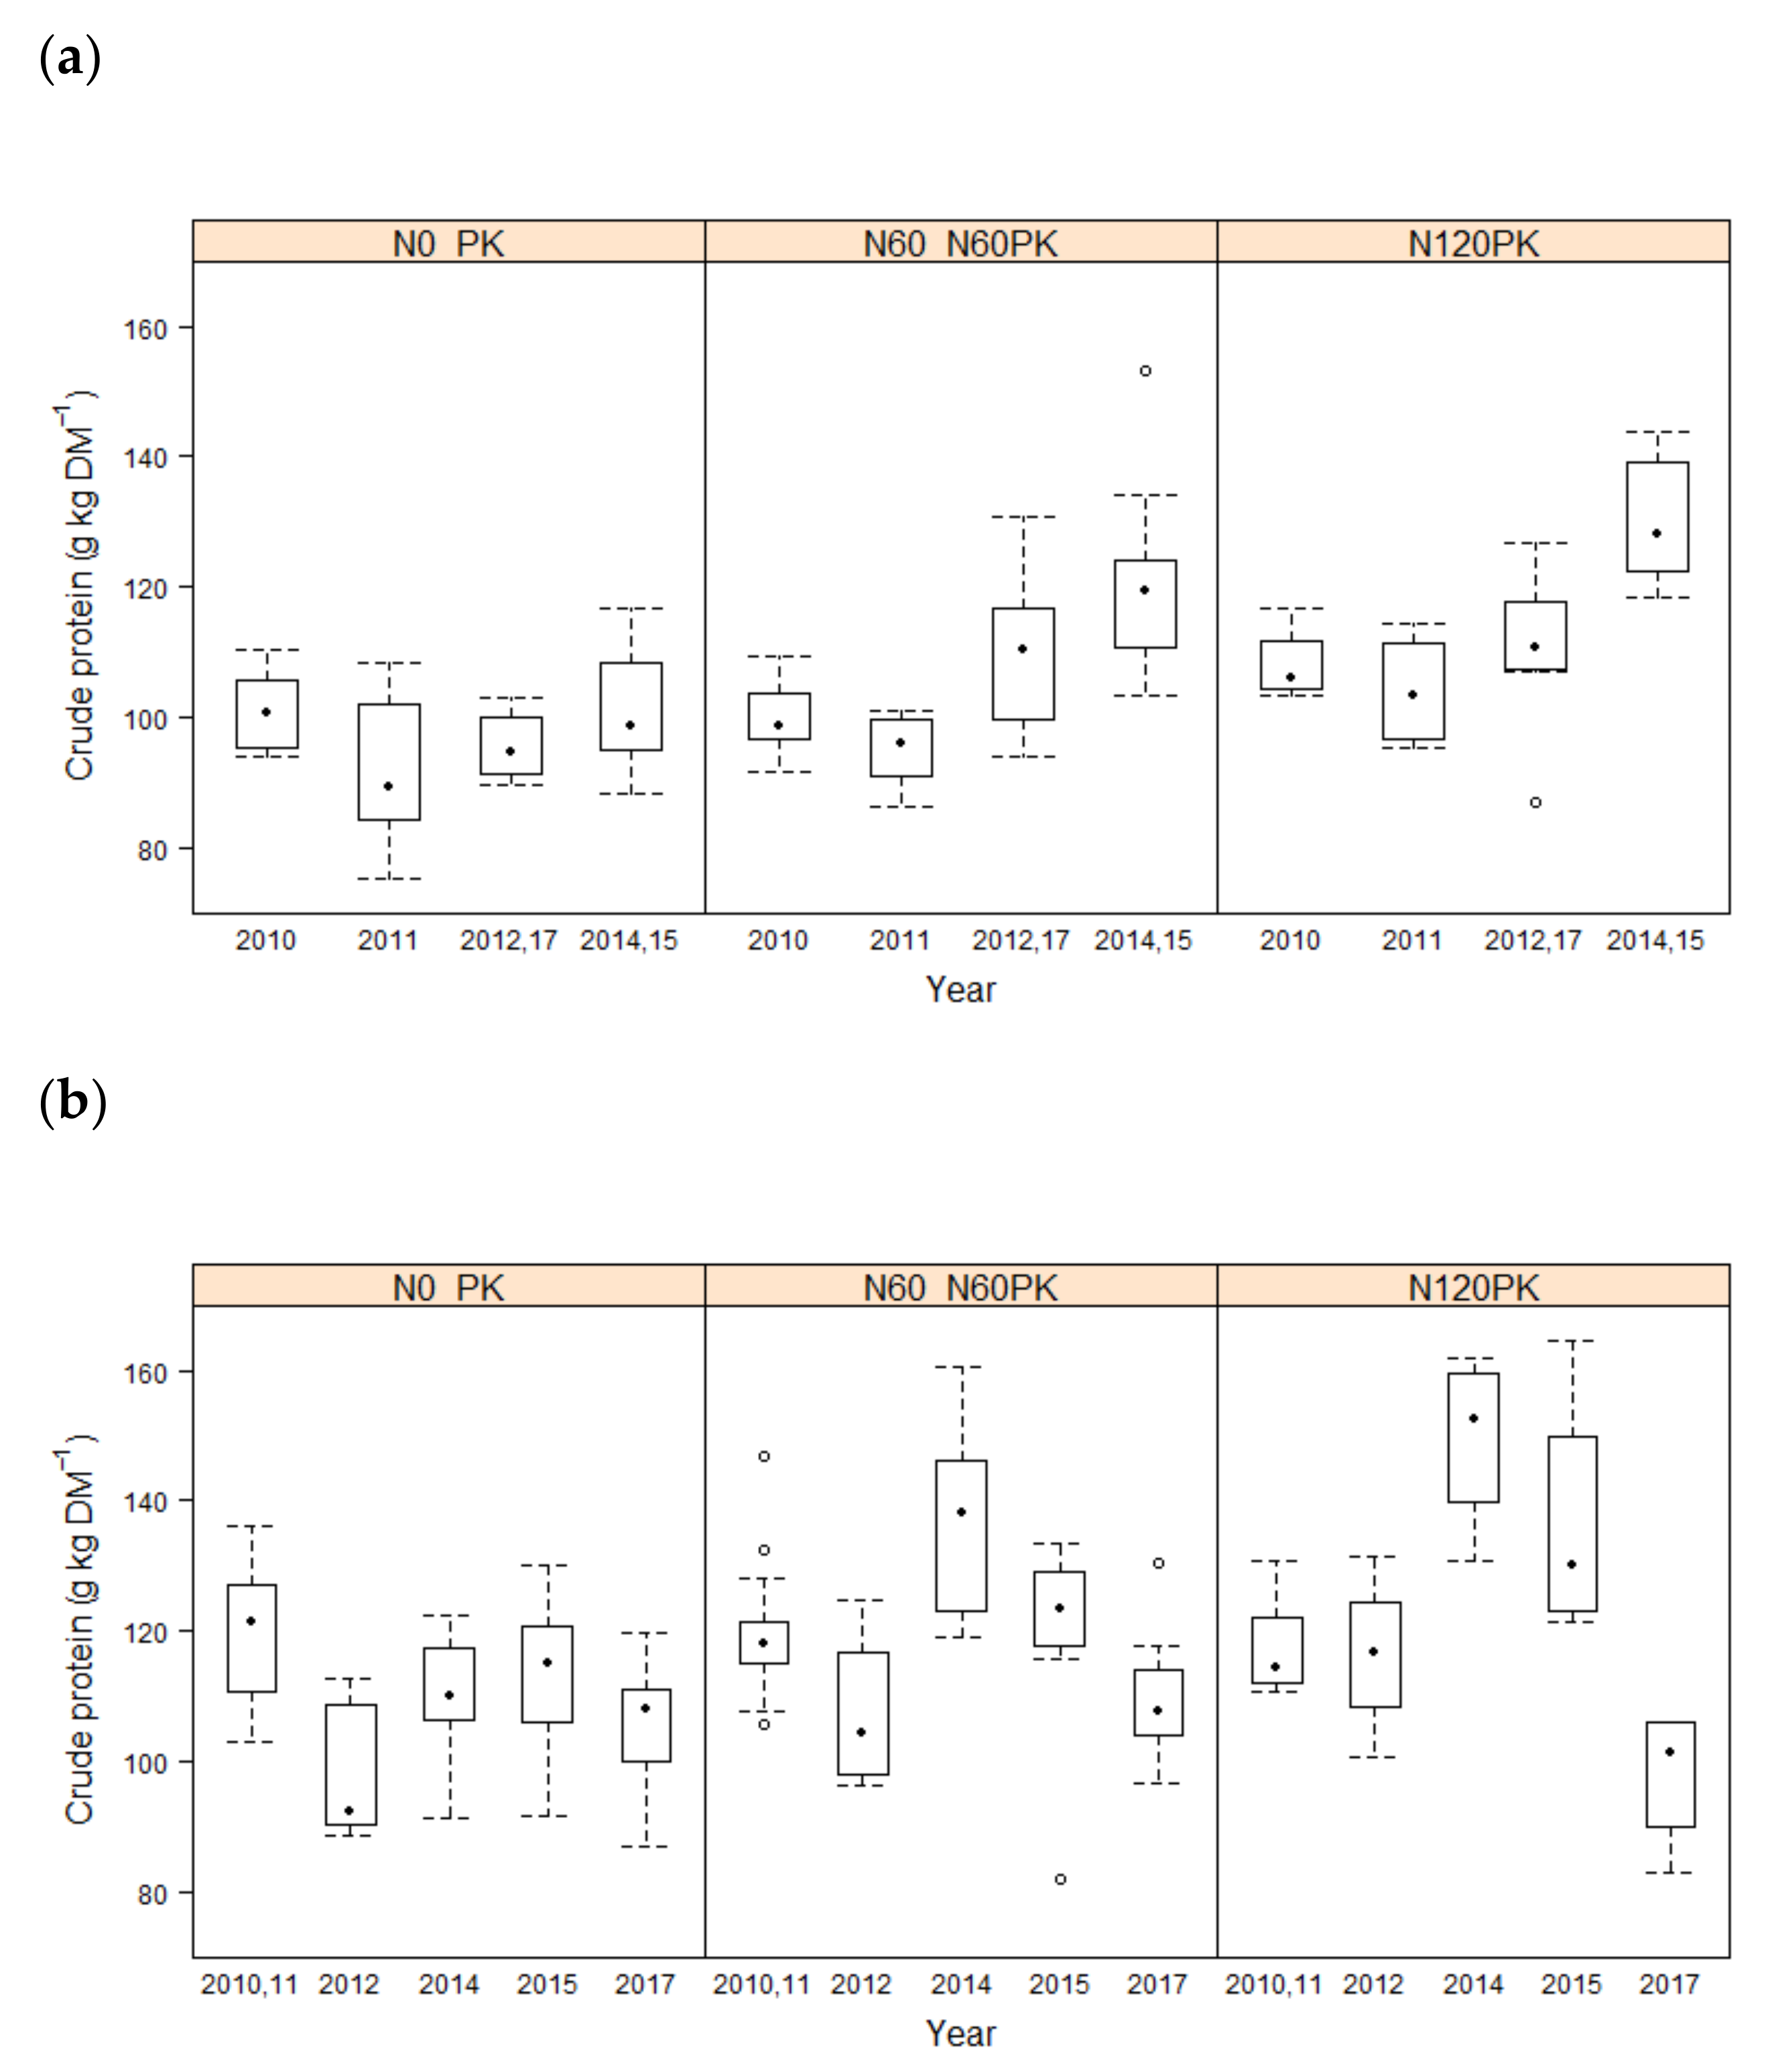
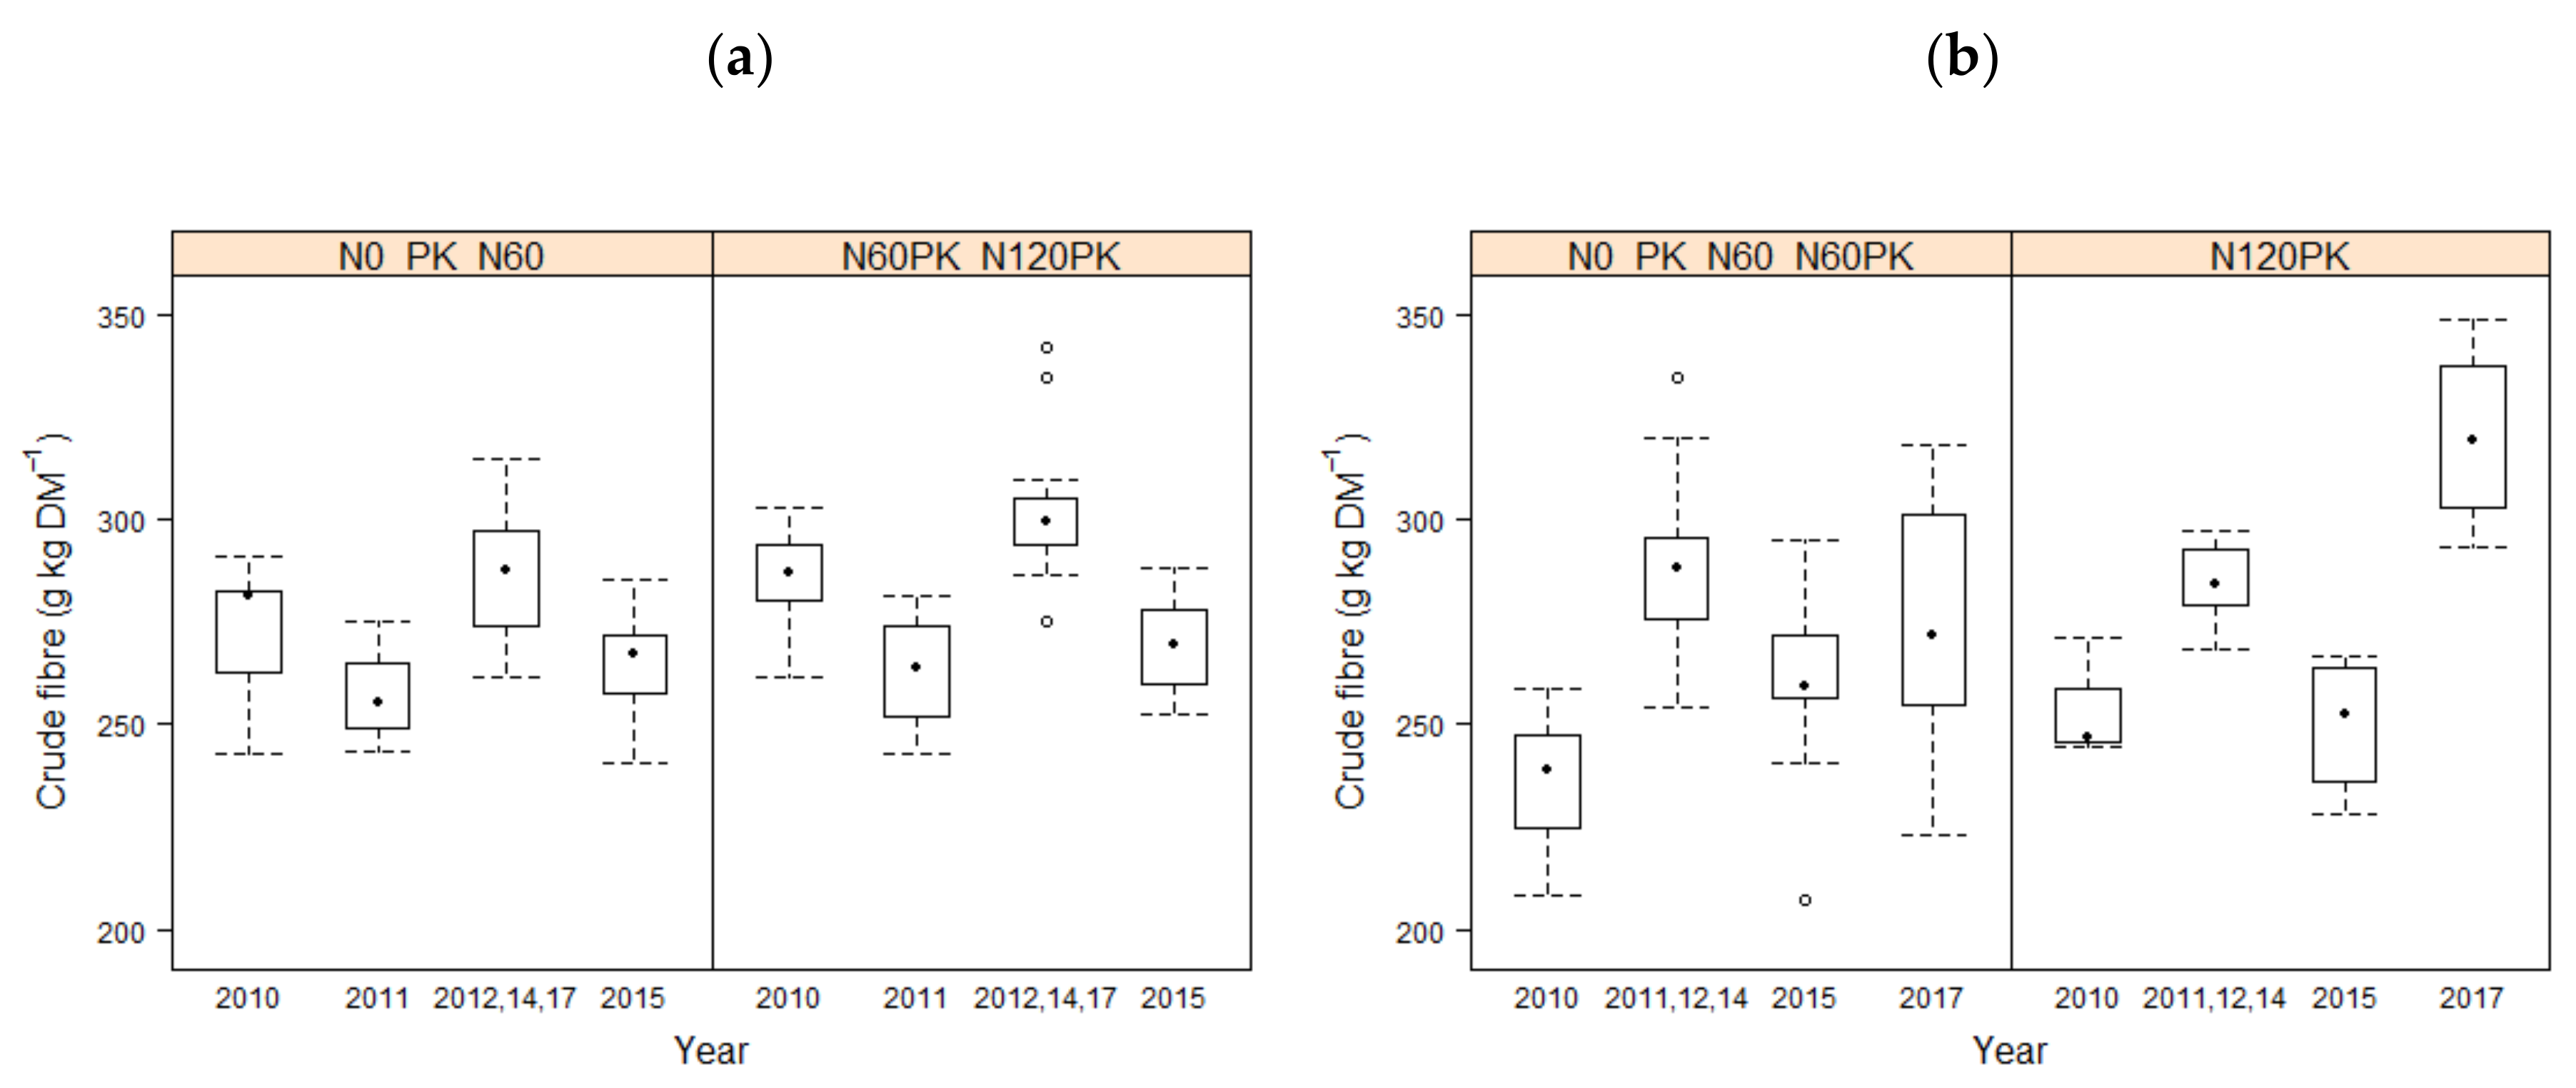
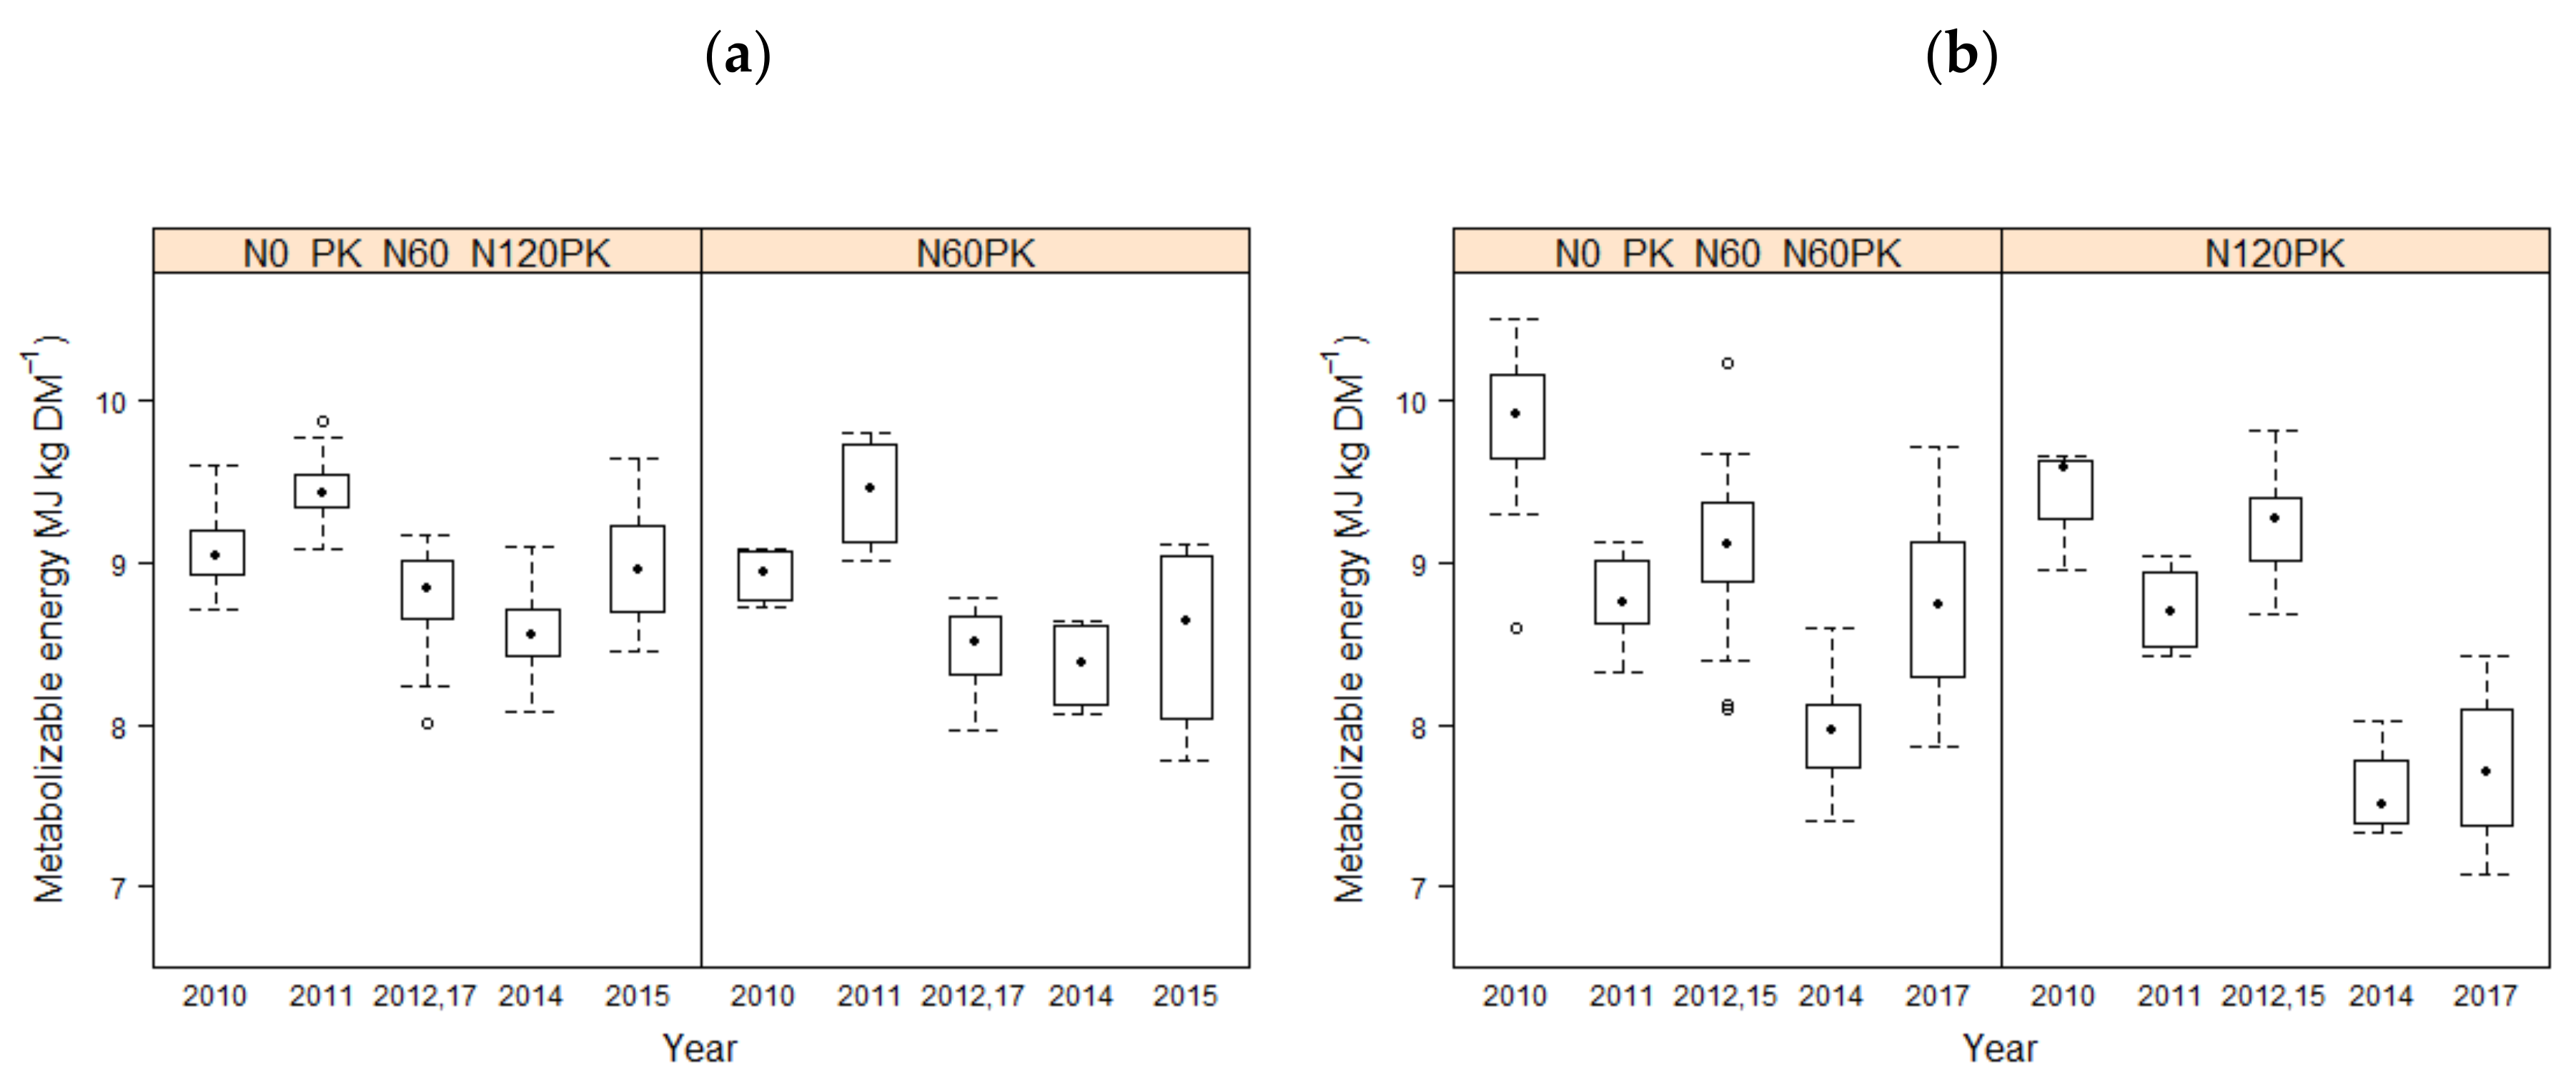
3.1. Forage Quality
3.2. Species Assembly
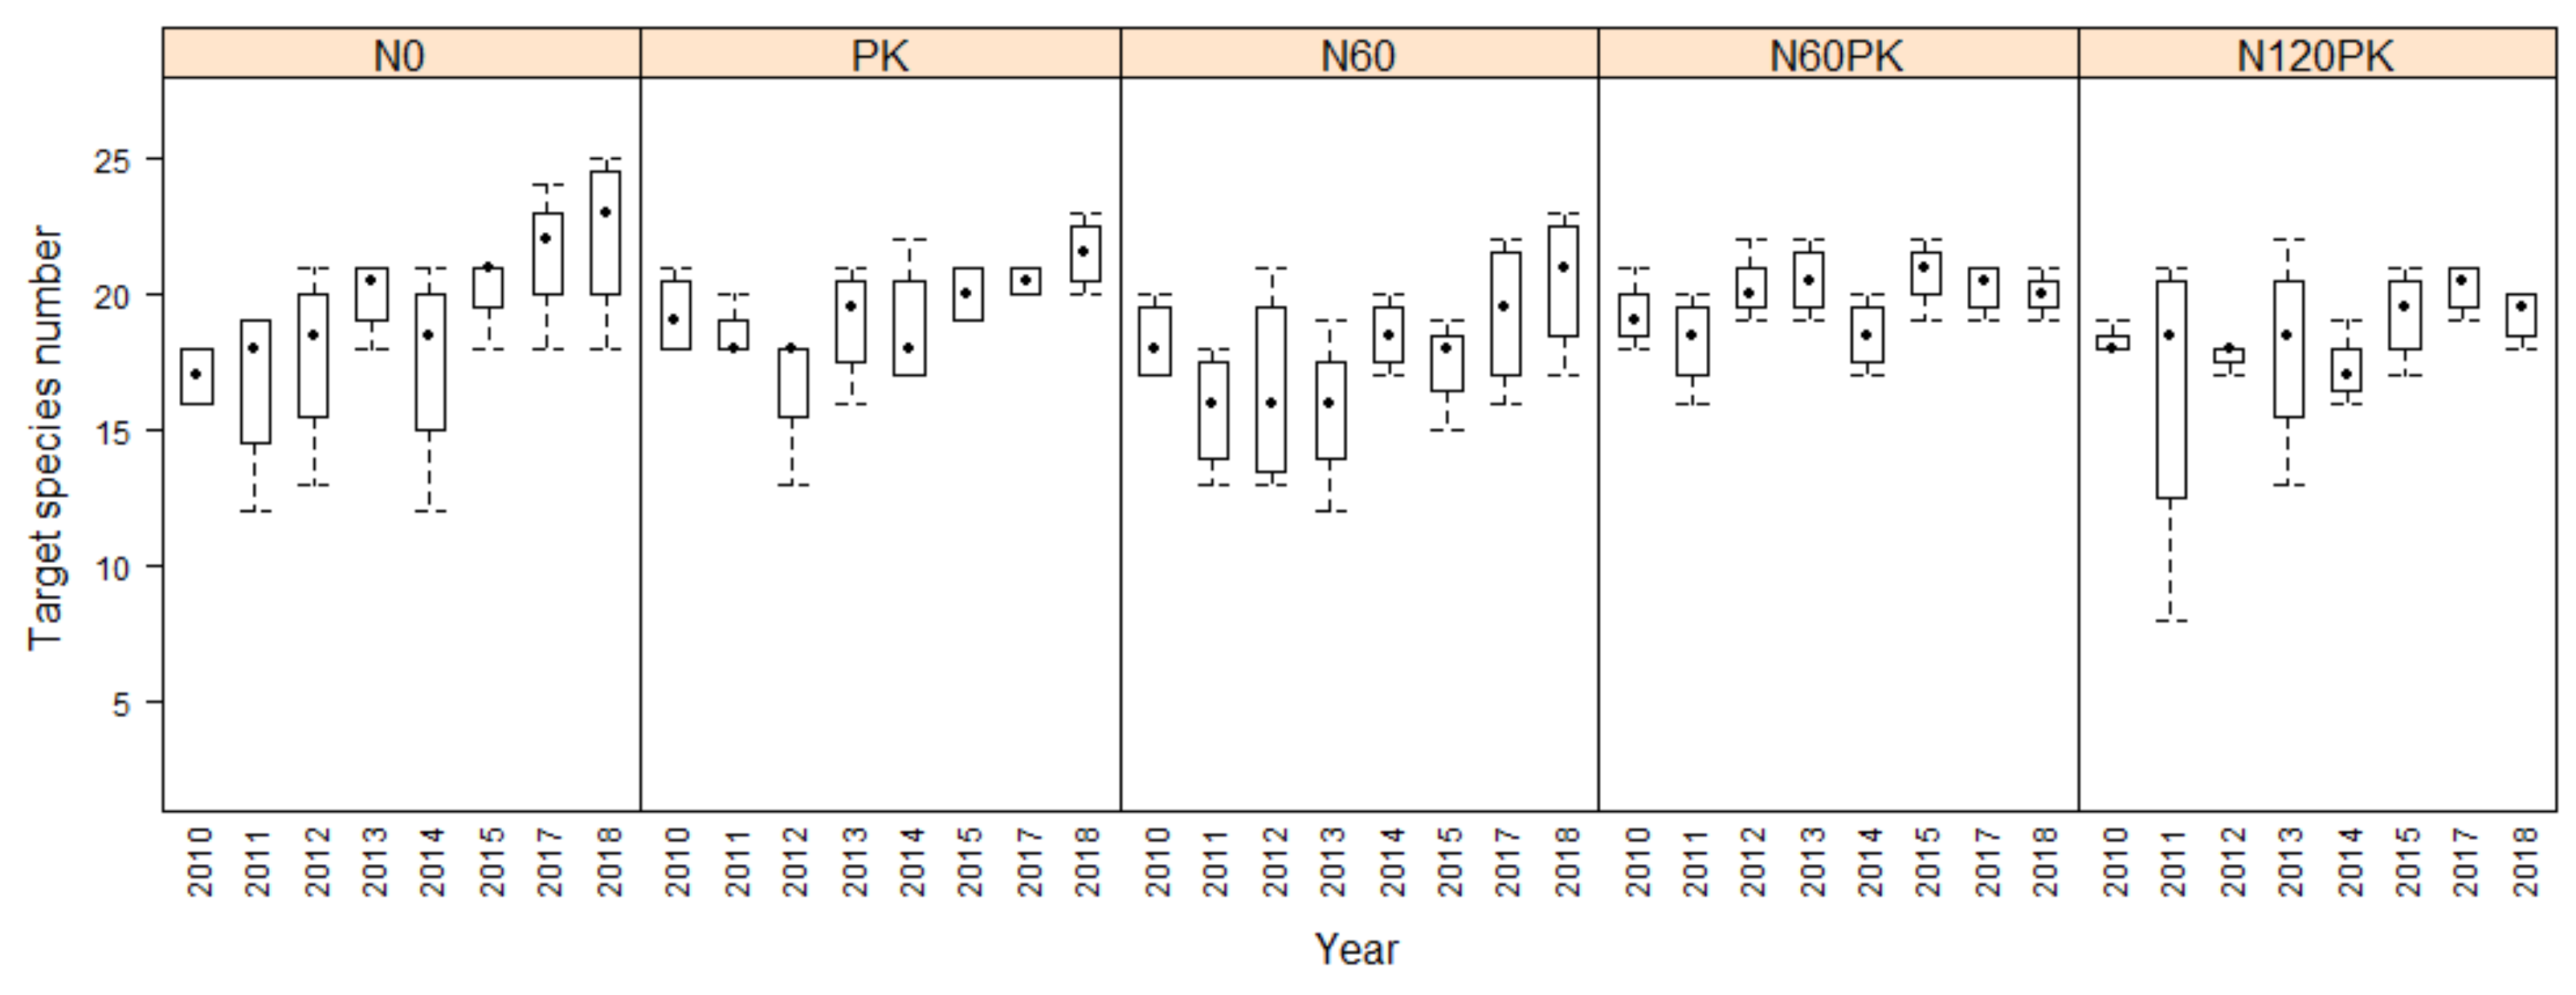
3.2.1. Development of Target Species Number
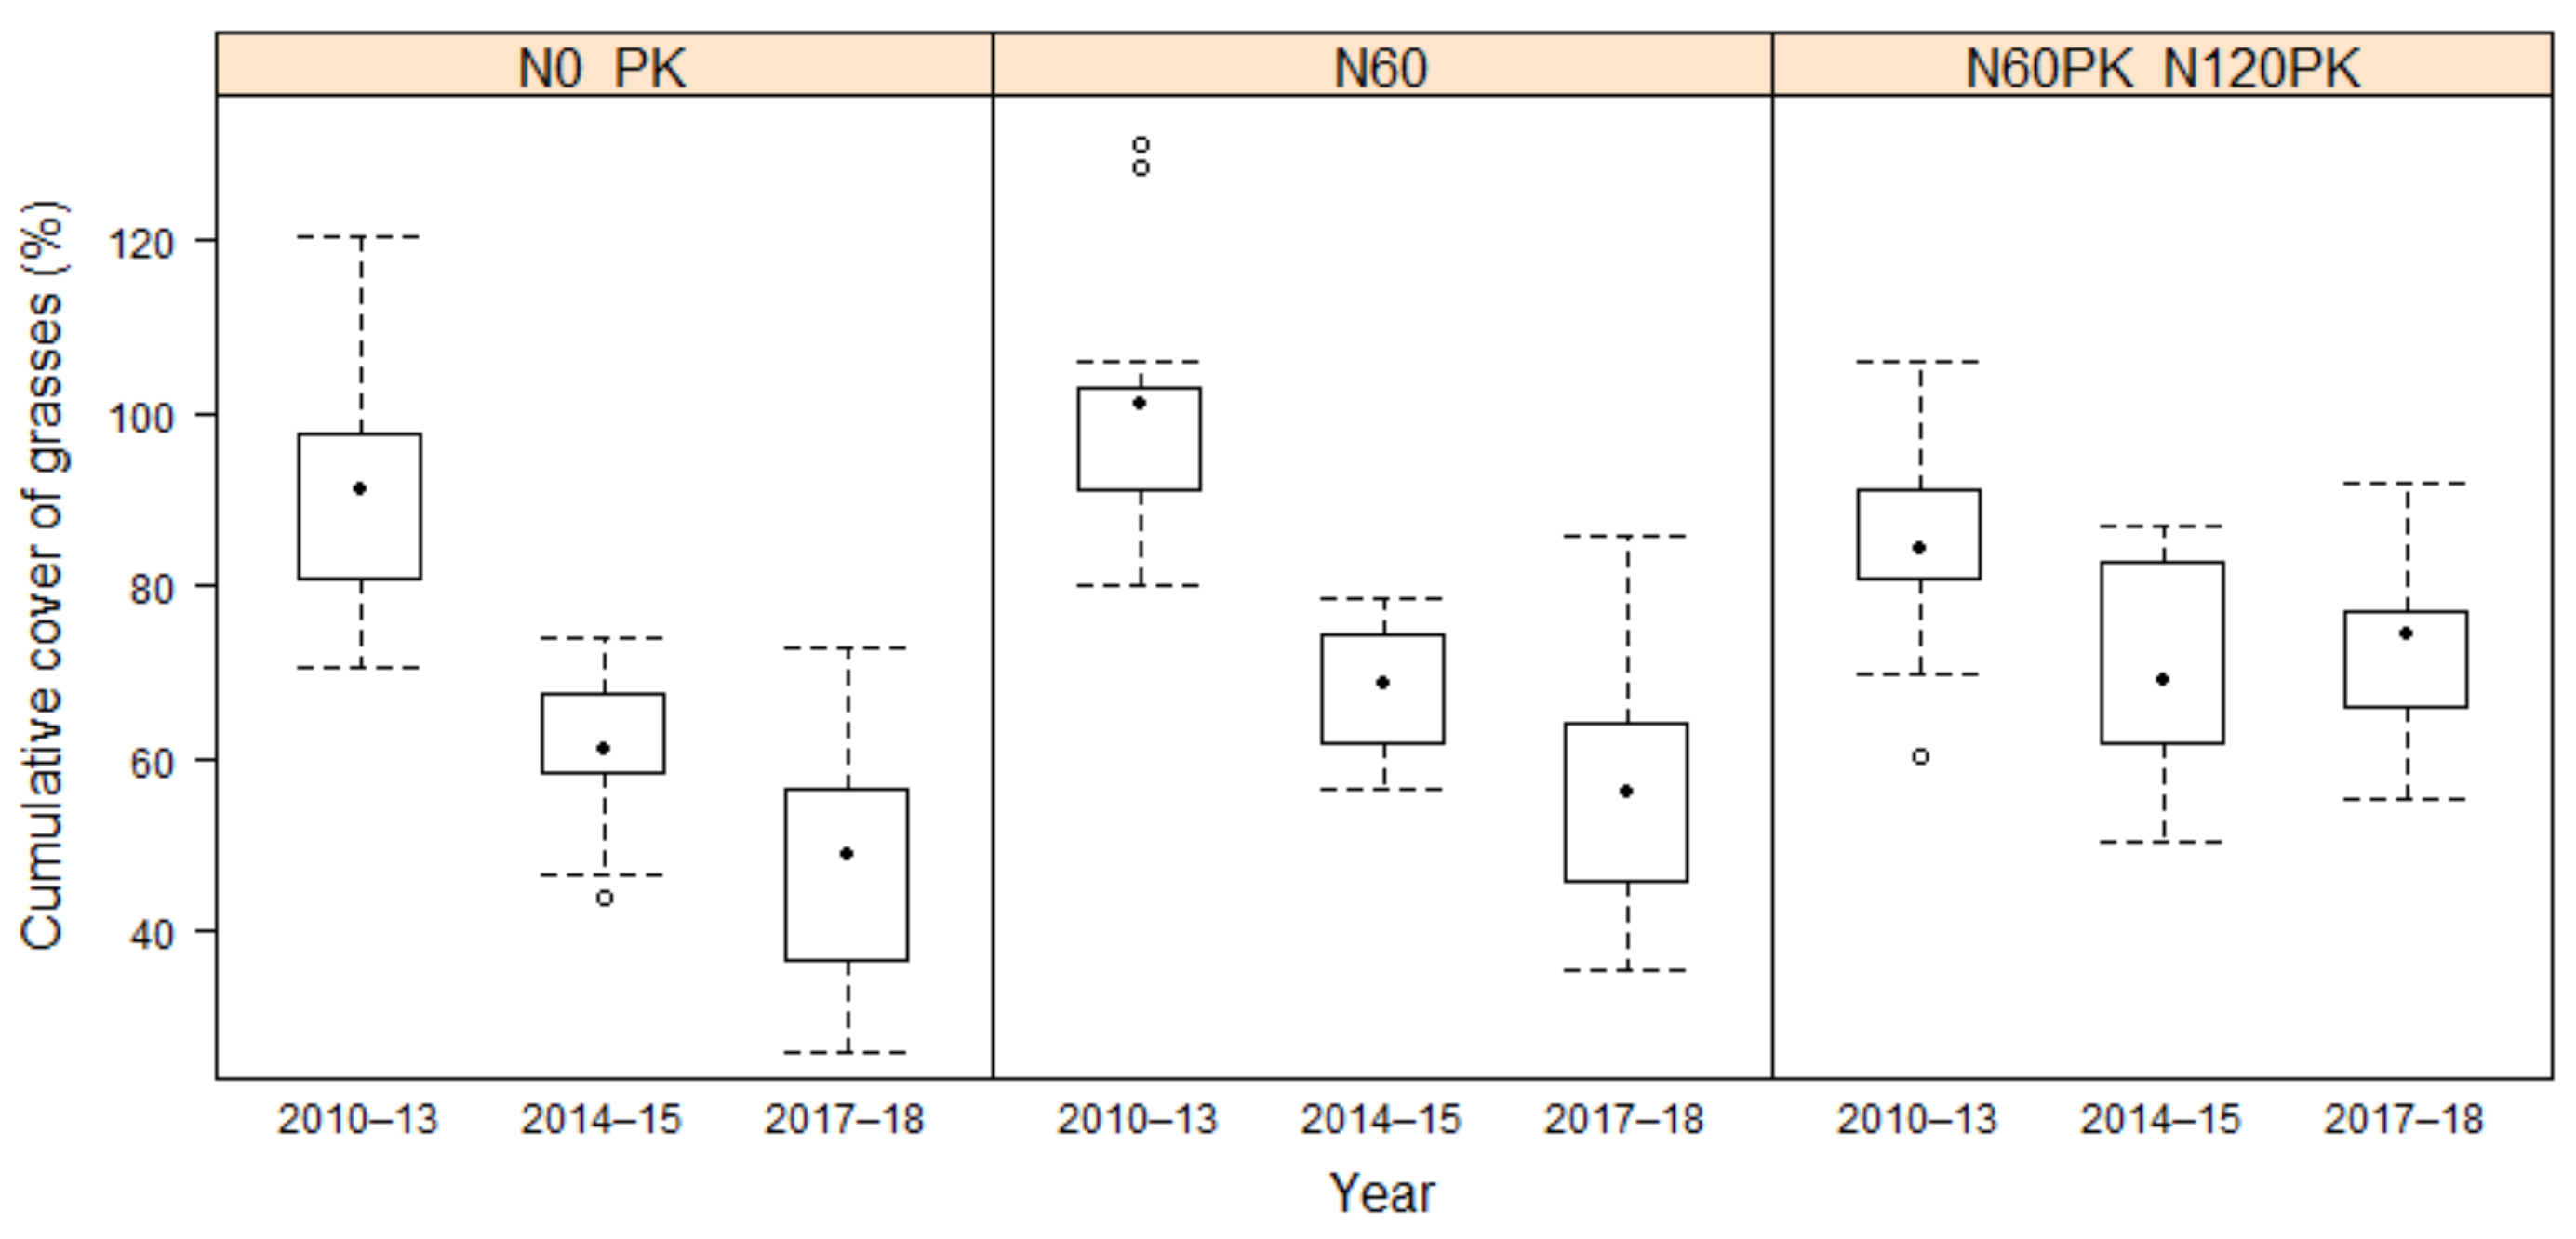
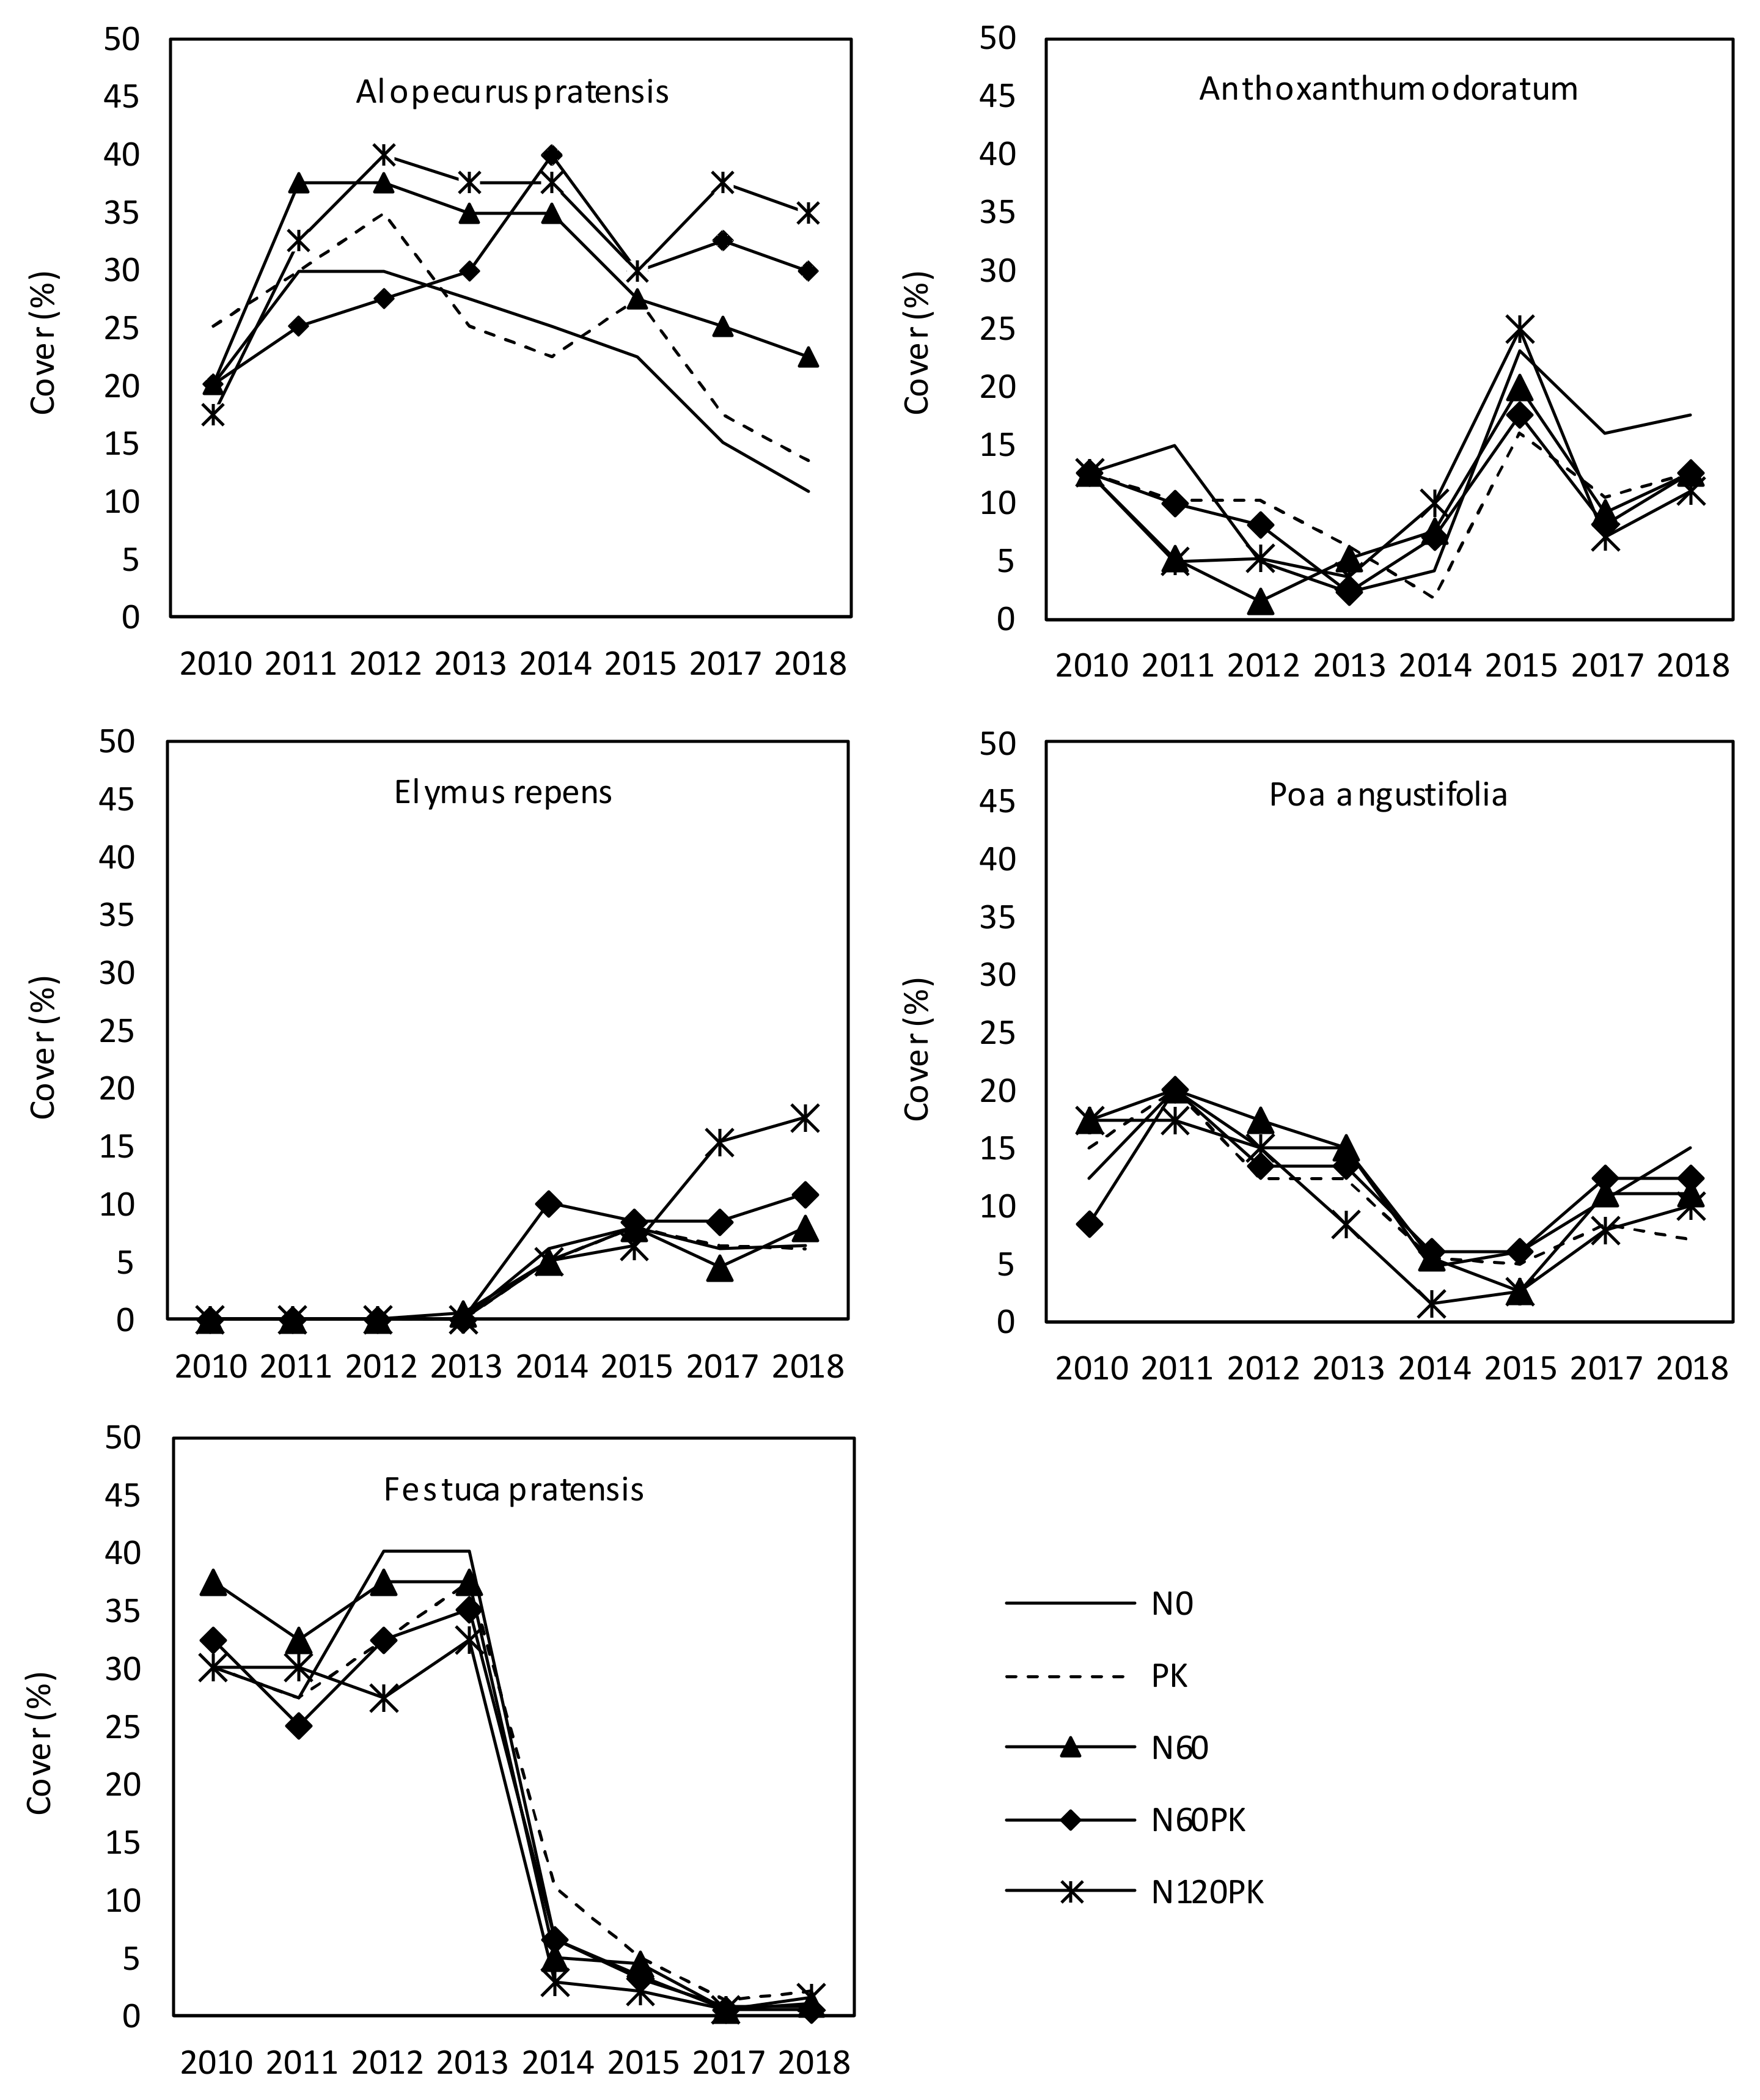
3.2.2. Development of Grass Cover
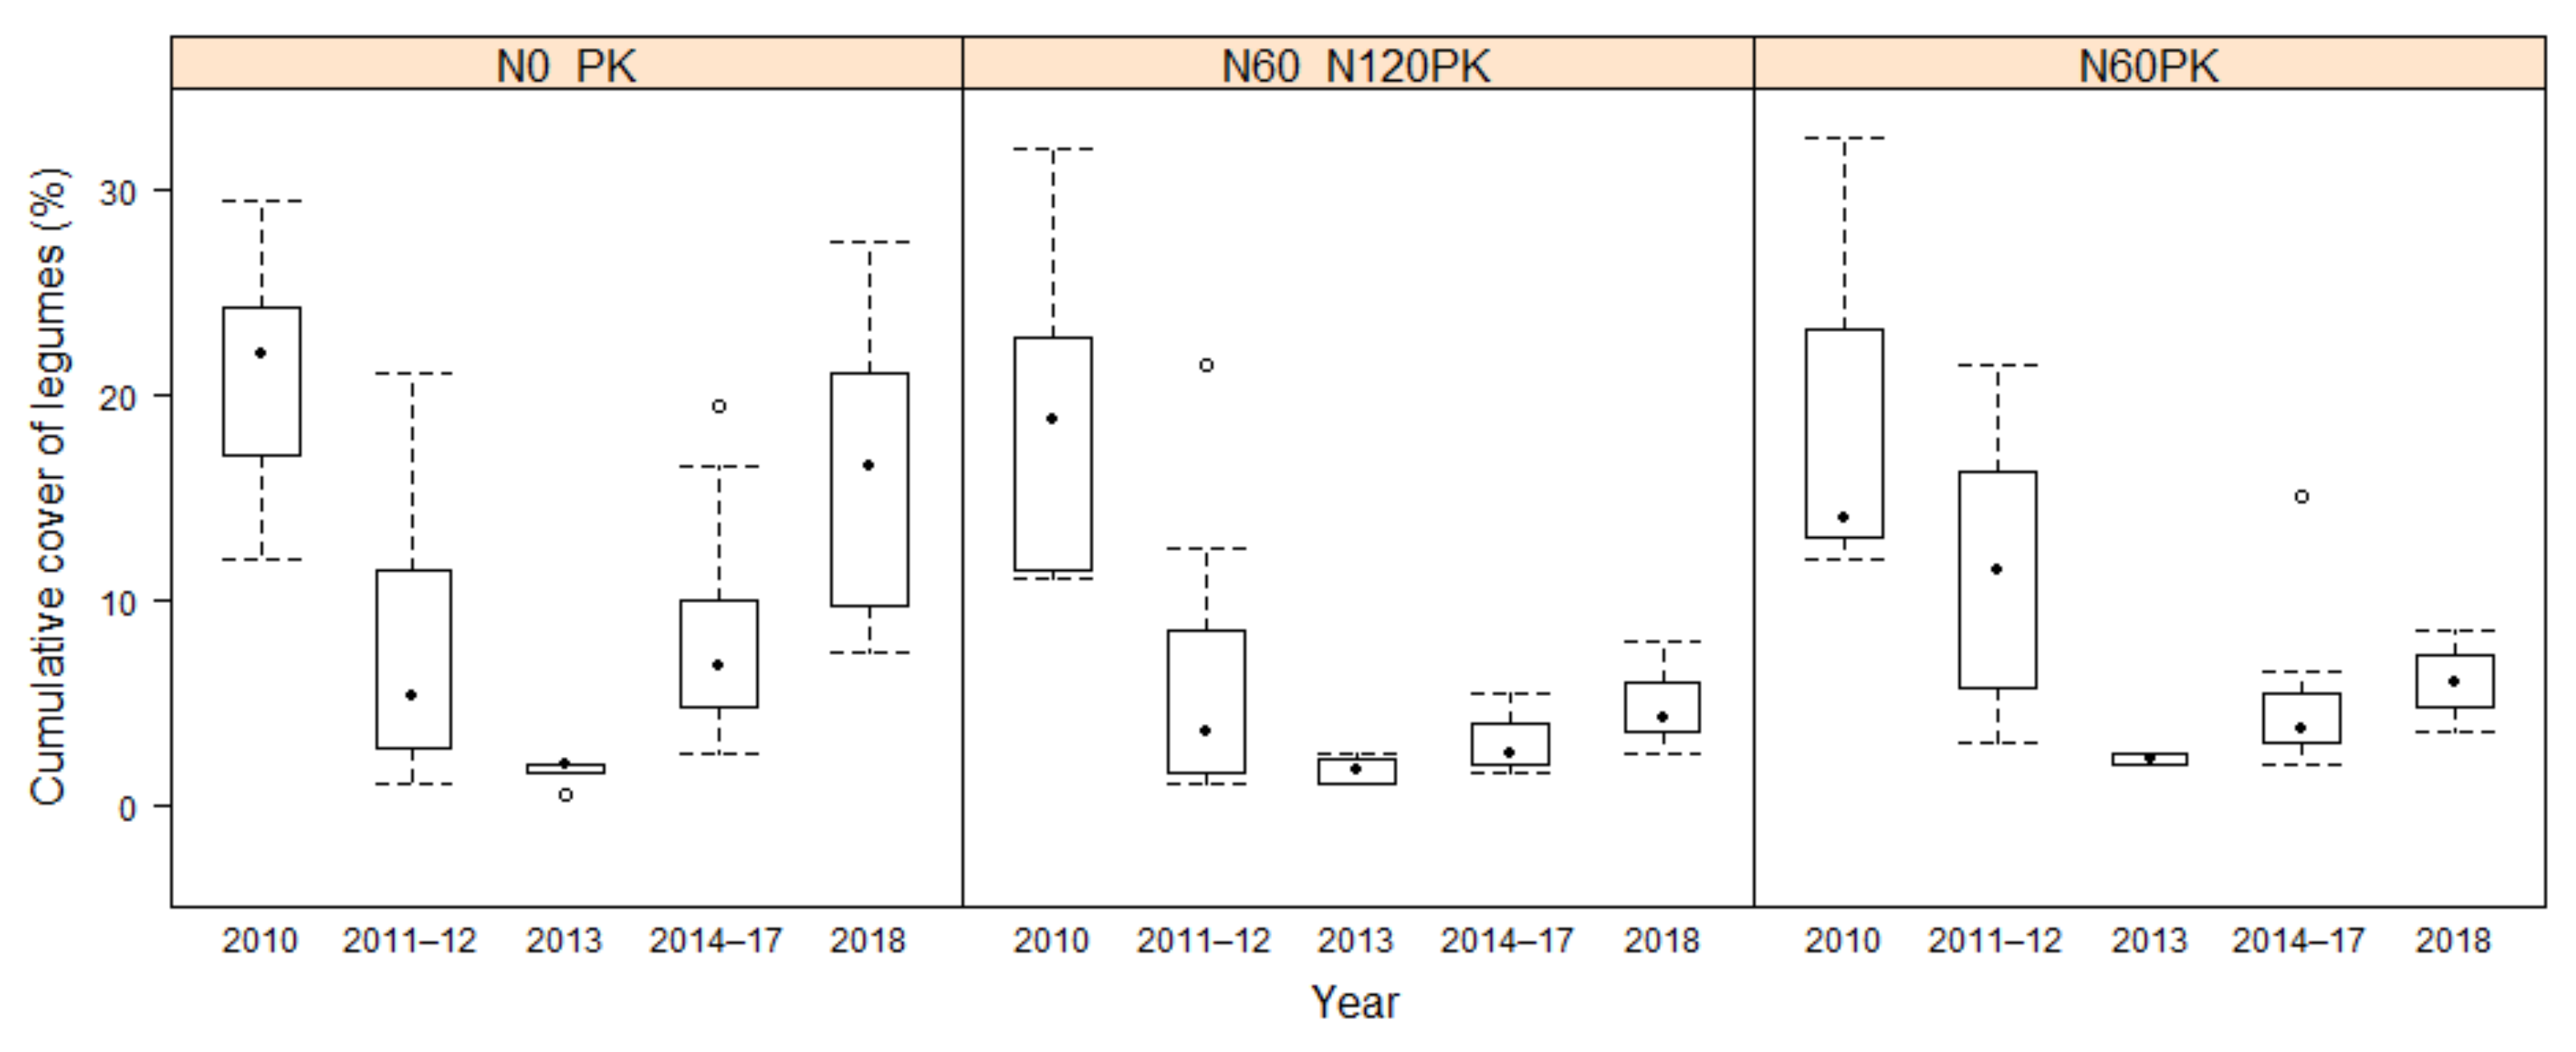
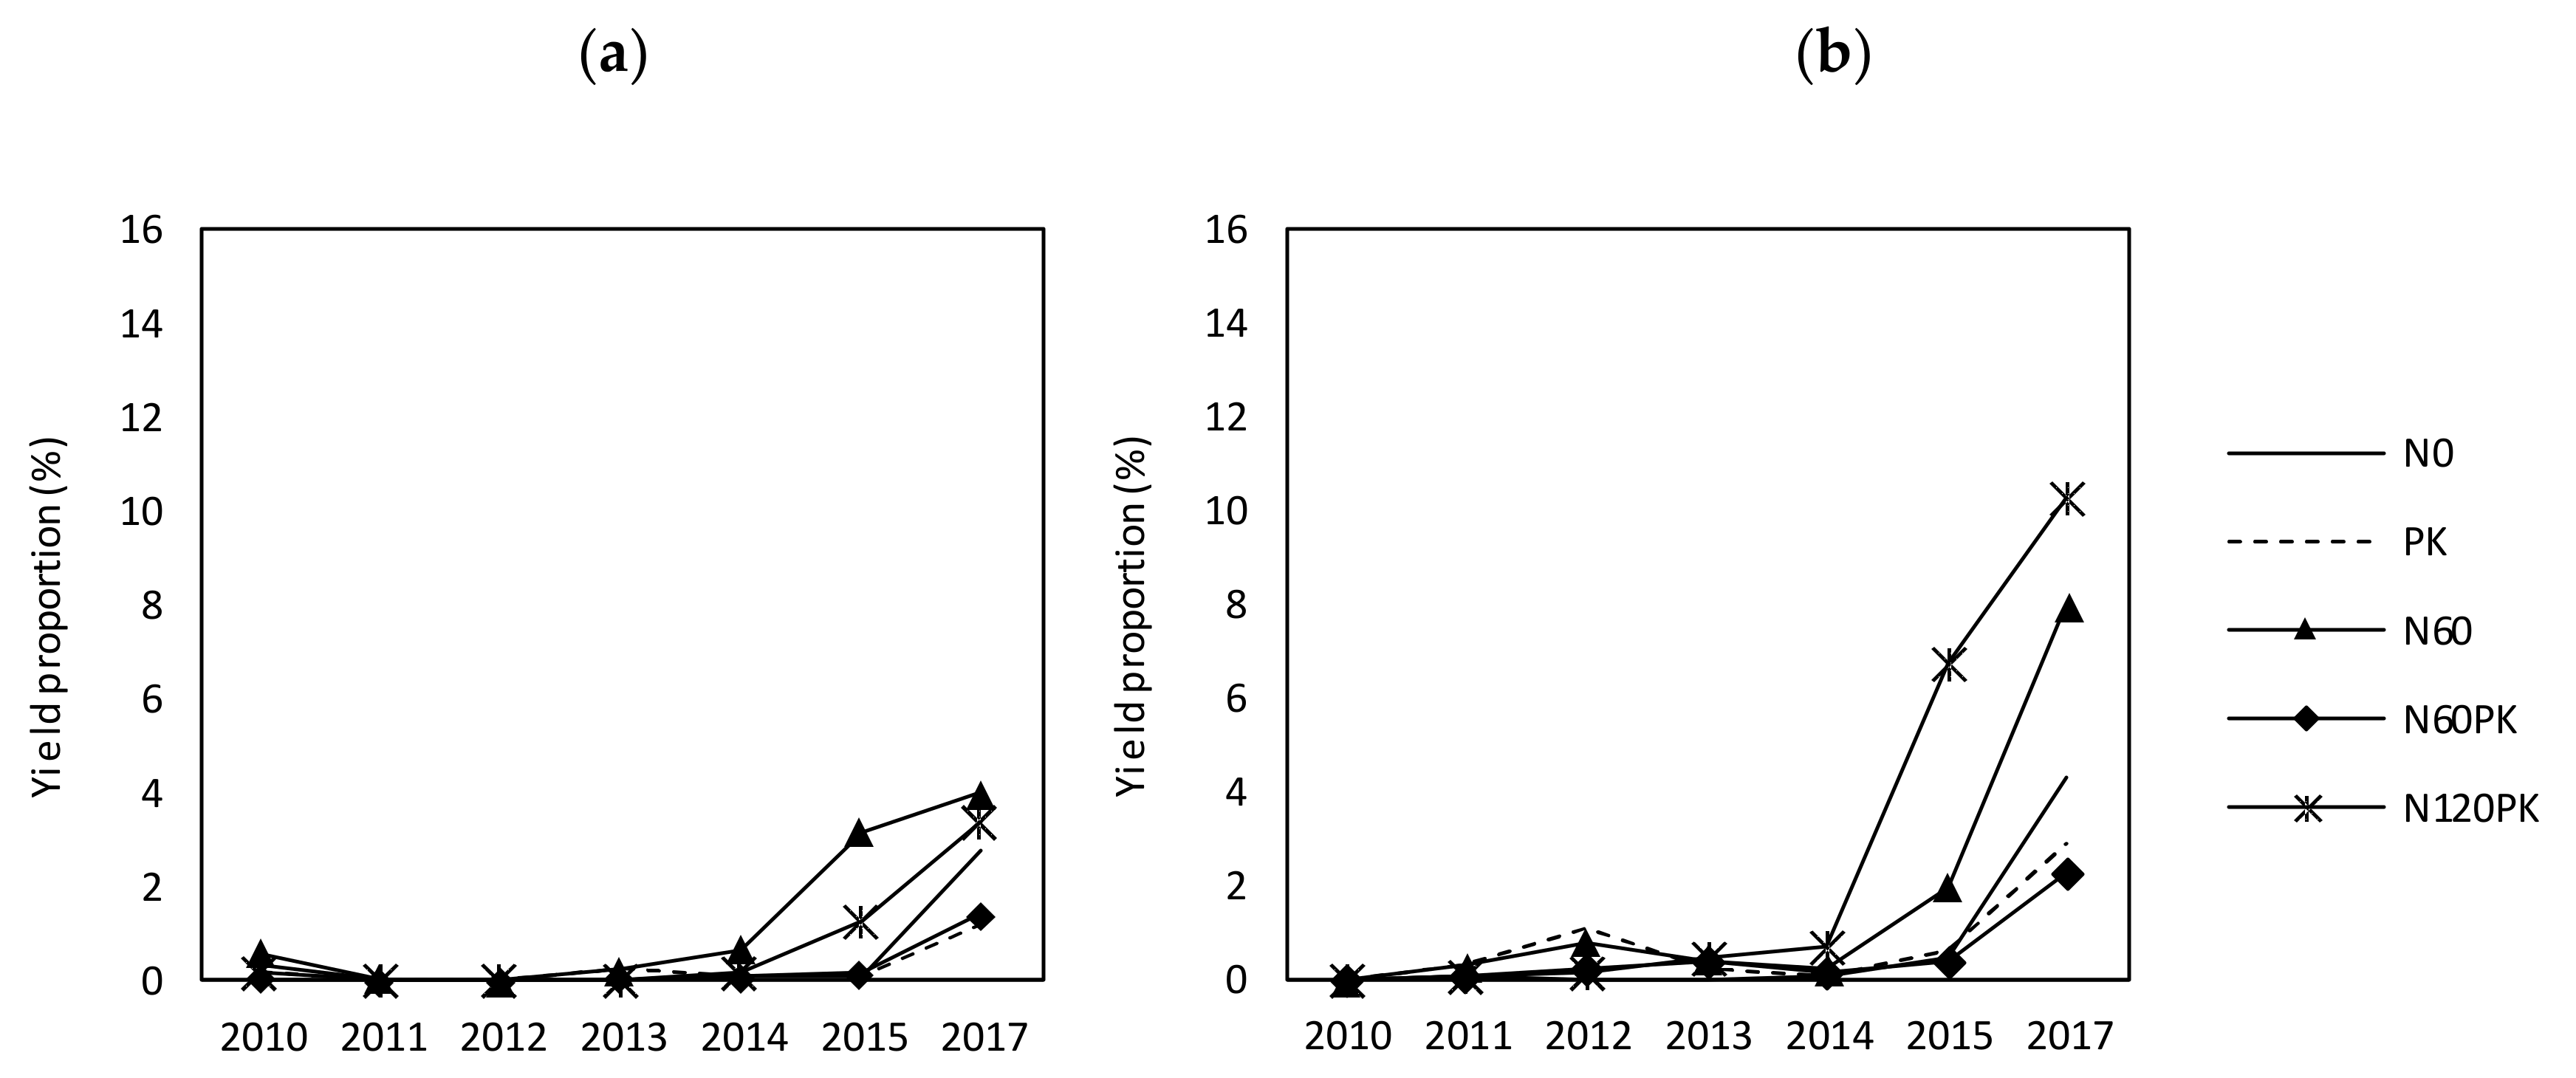
3.2.3. Development of Legume Cover
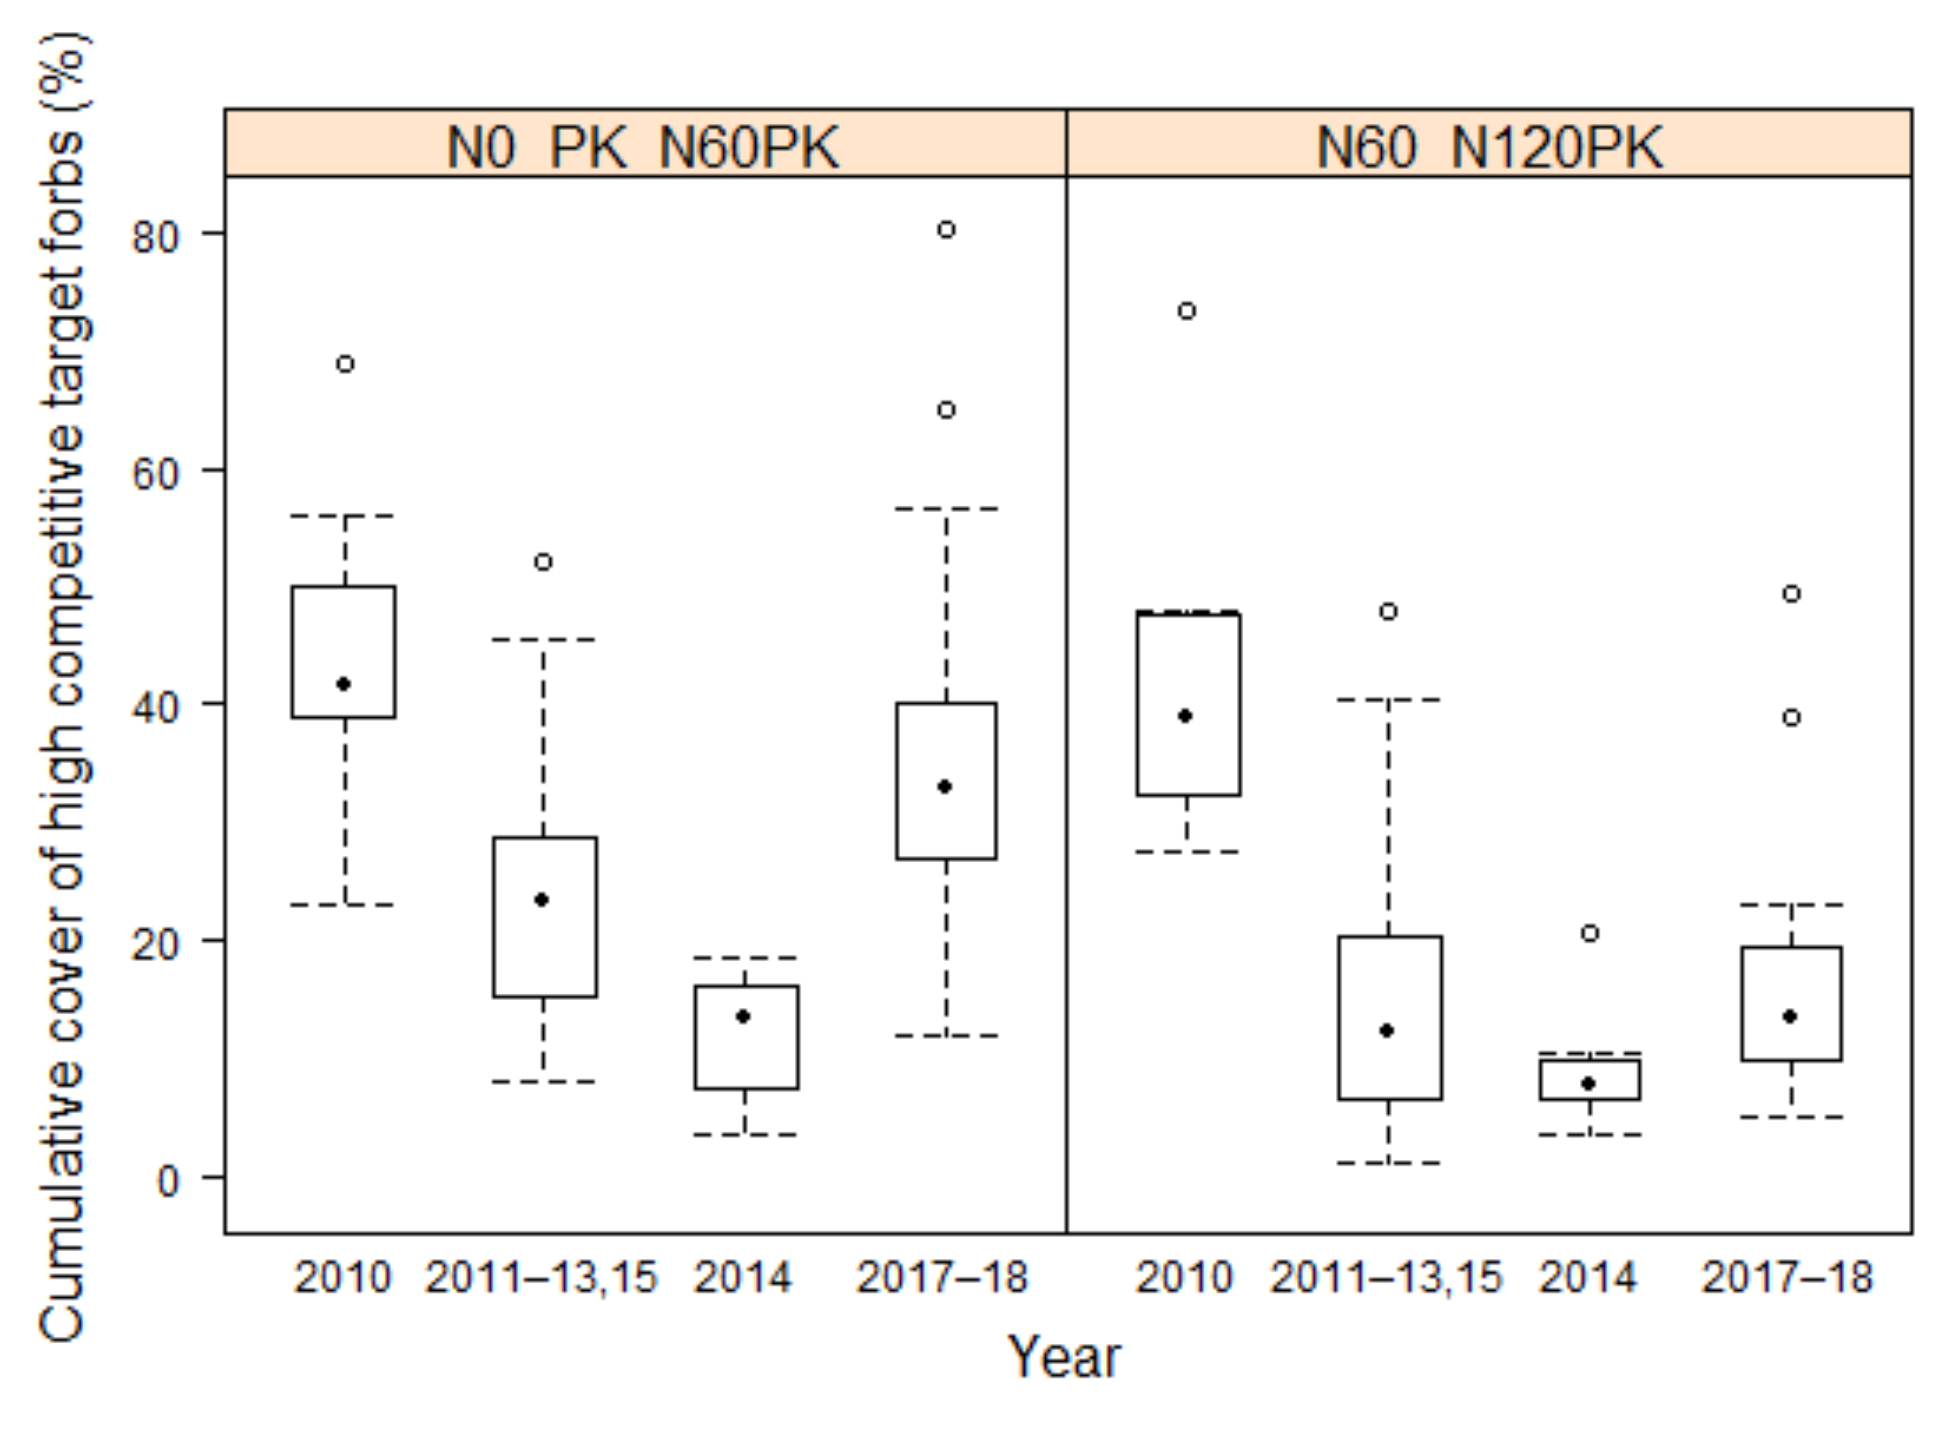
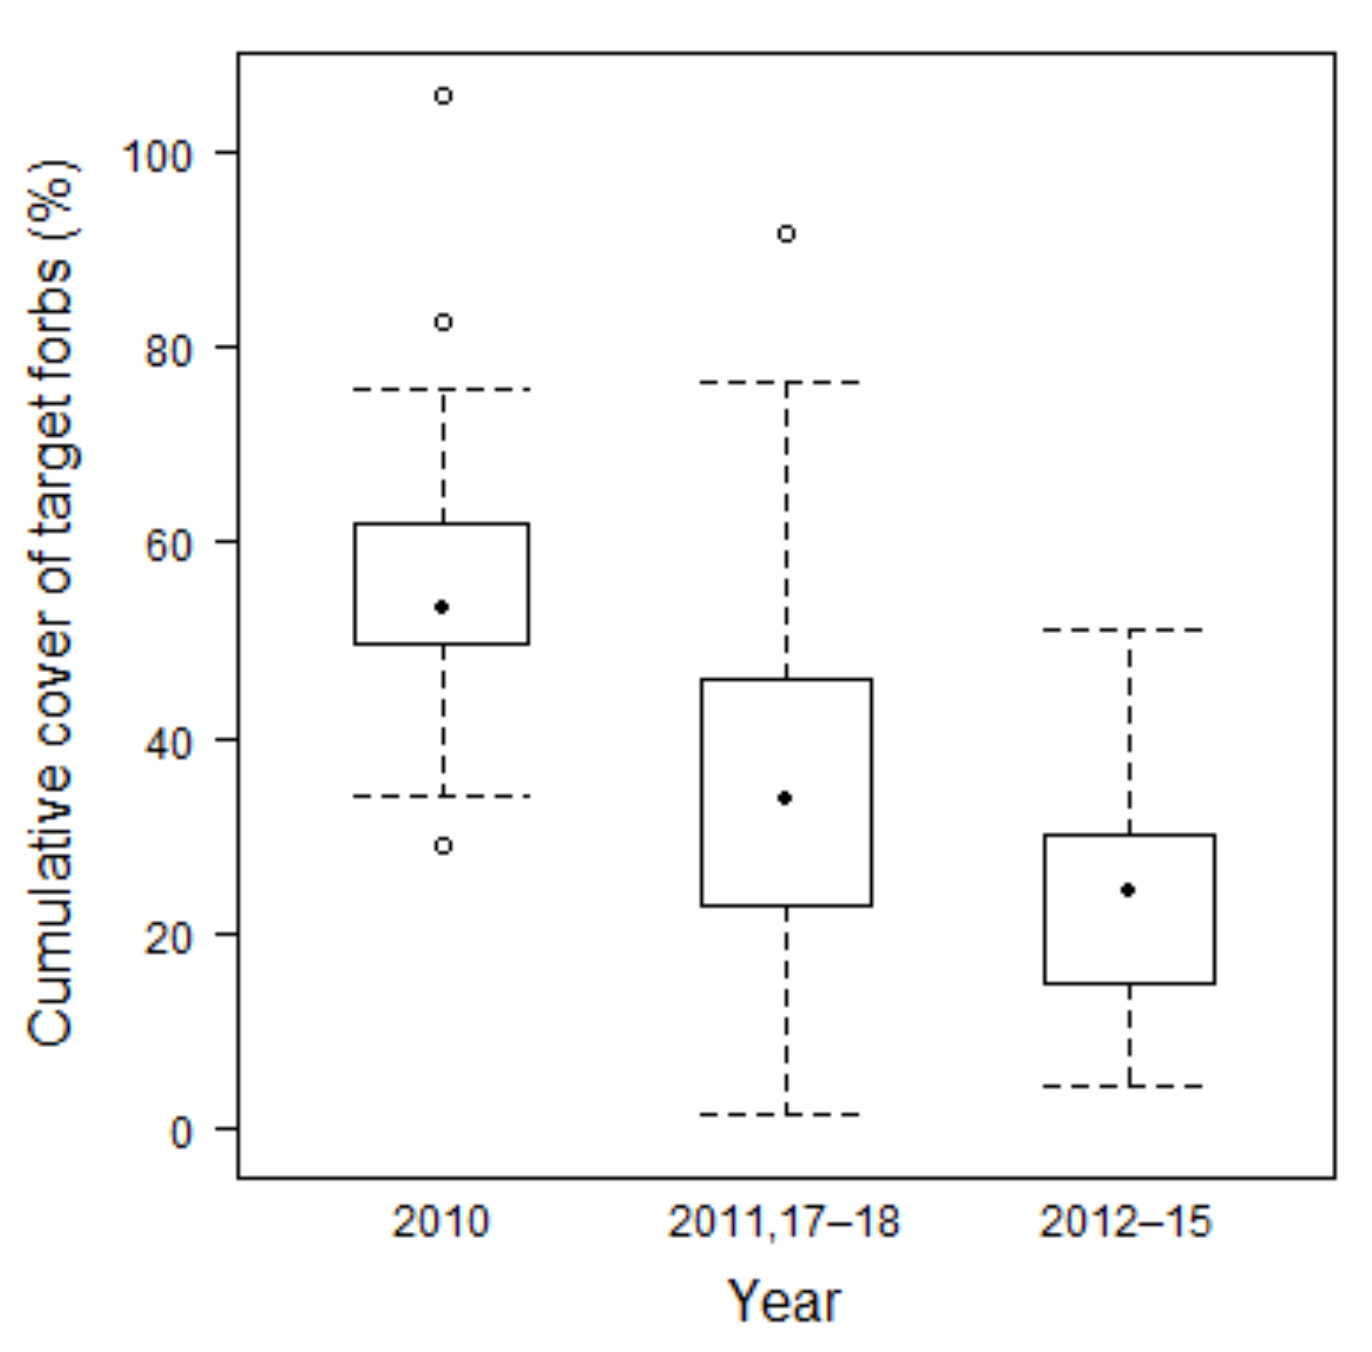
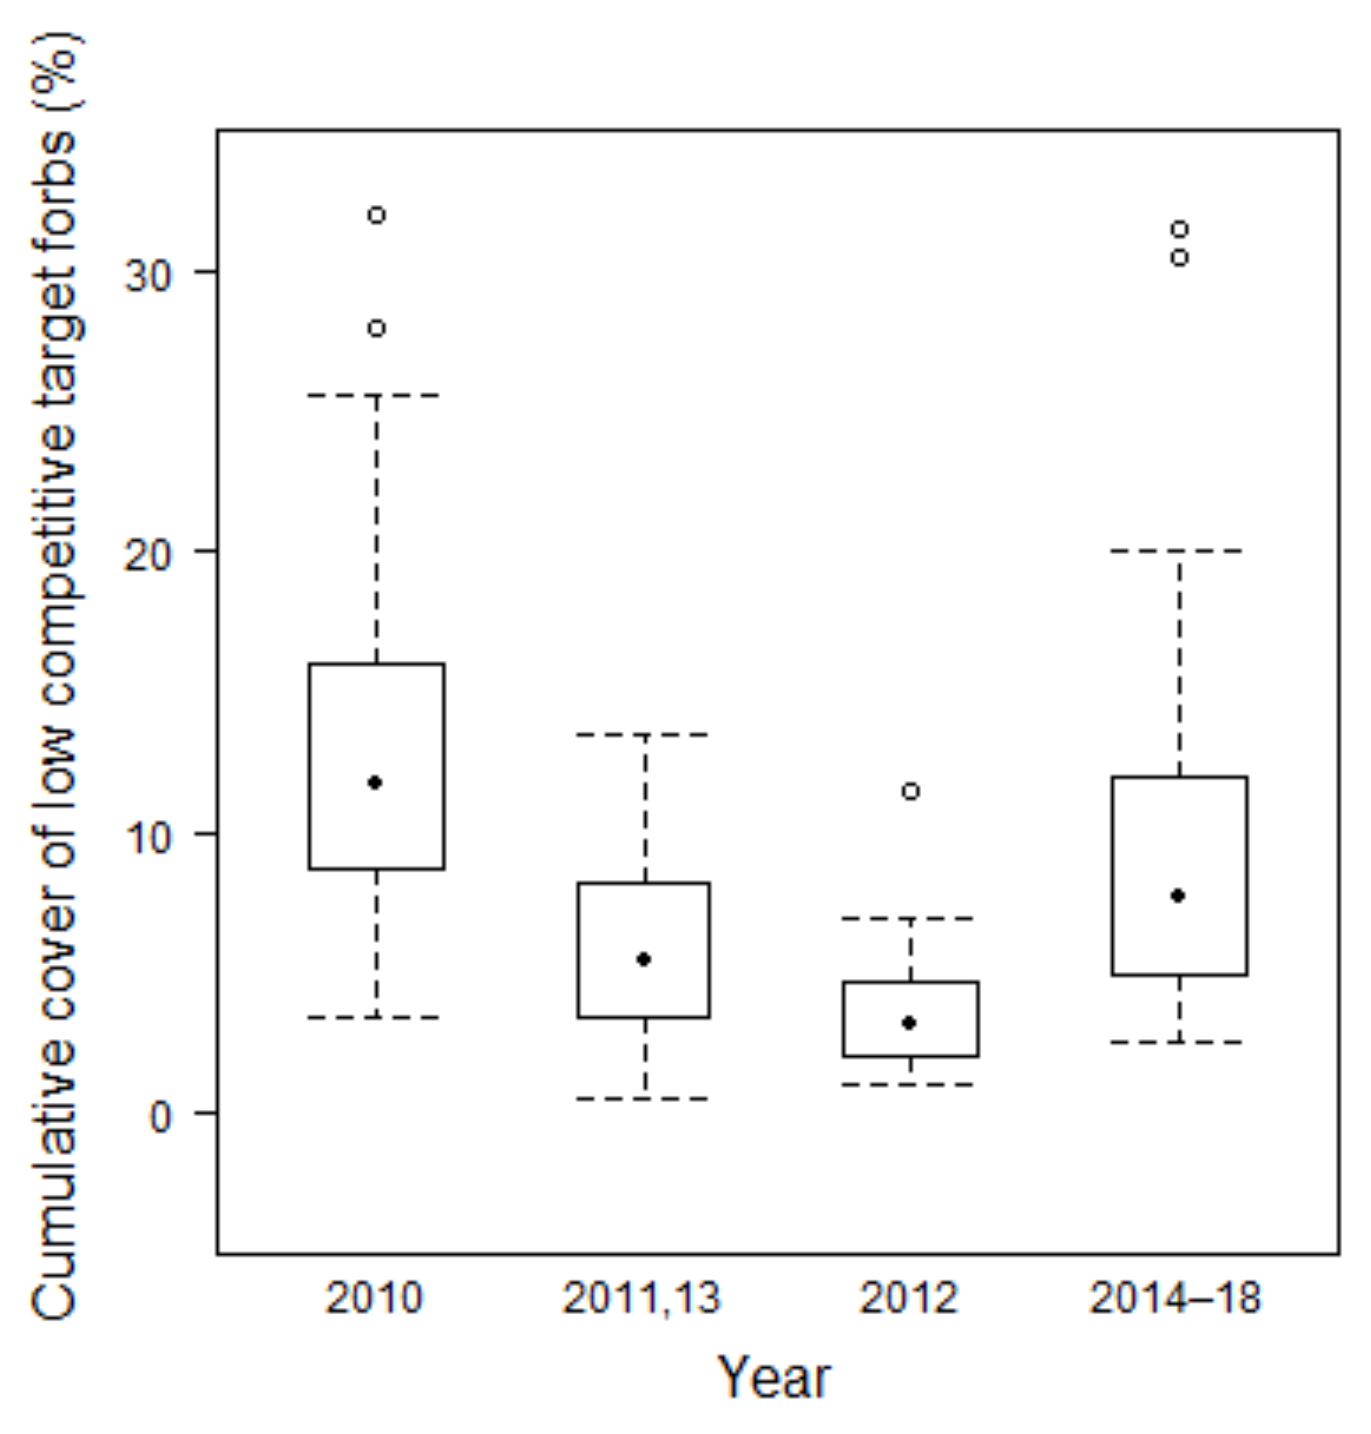
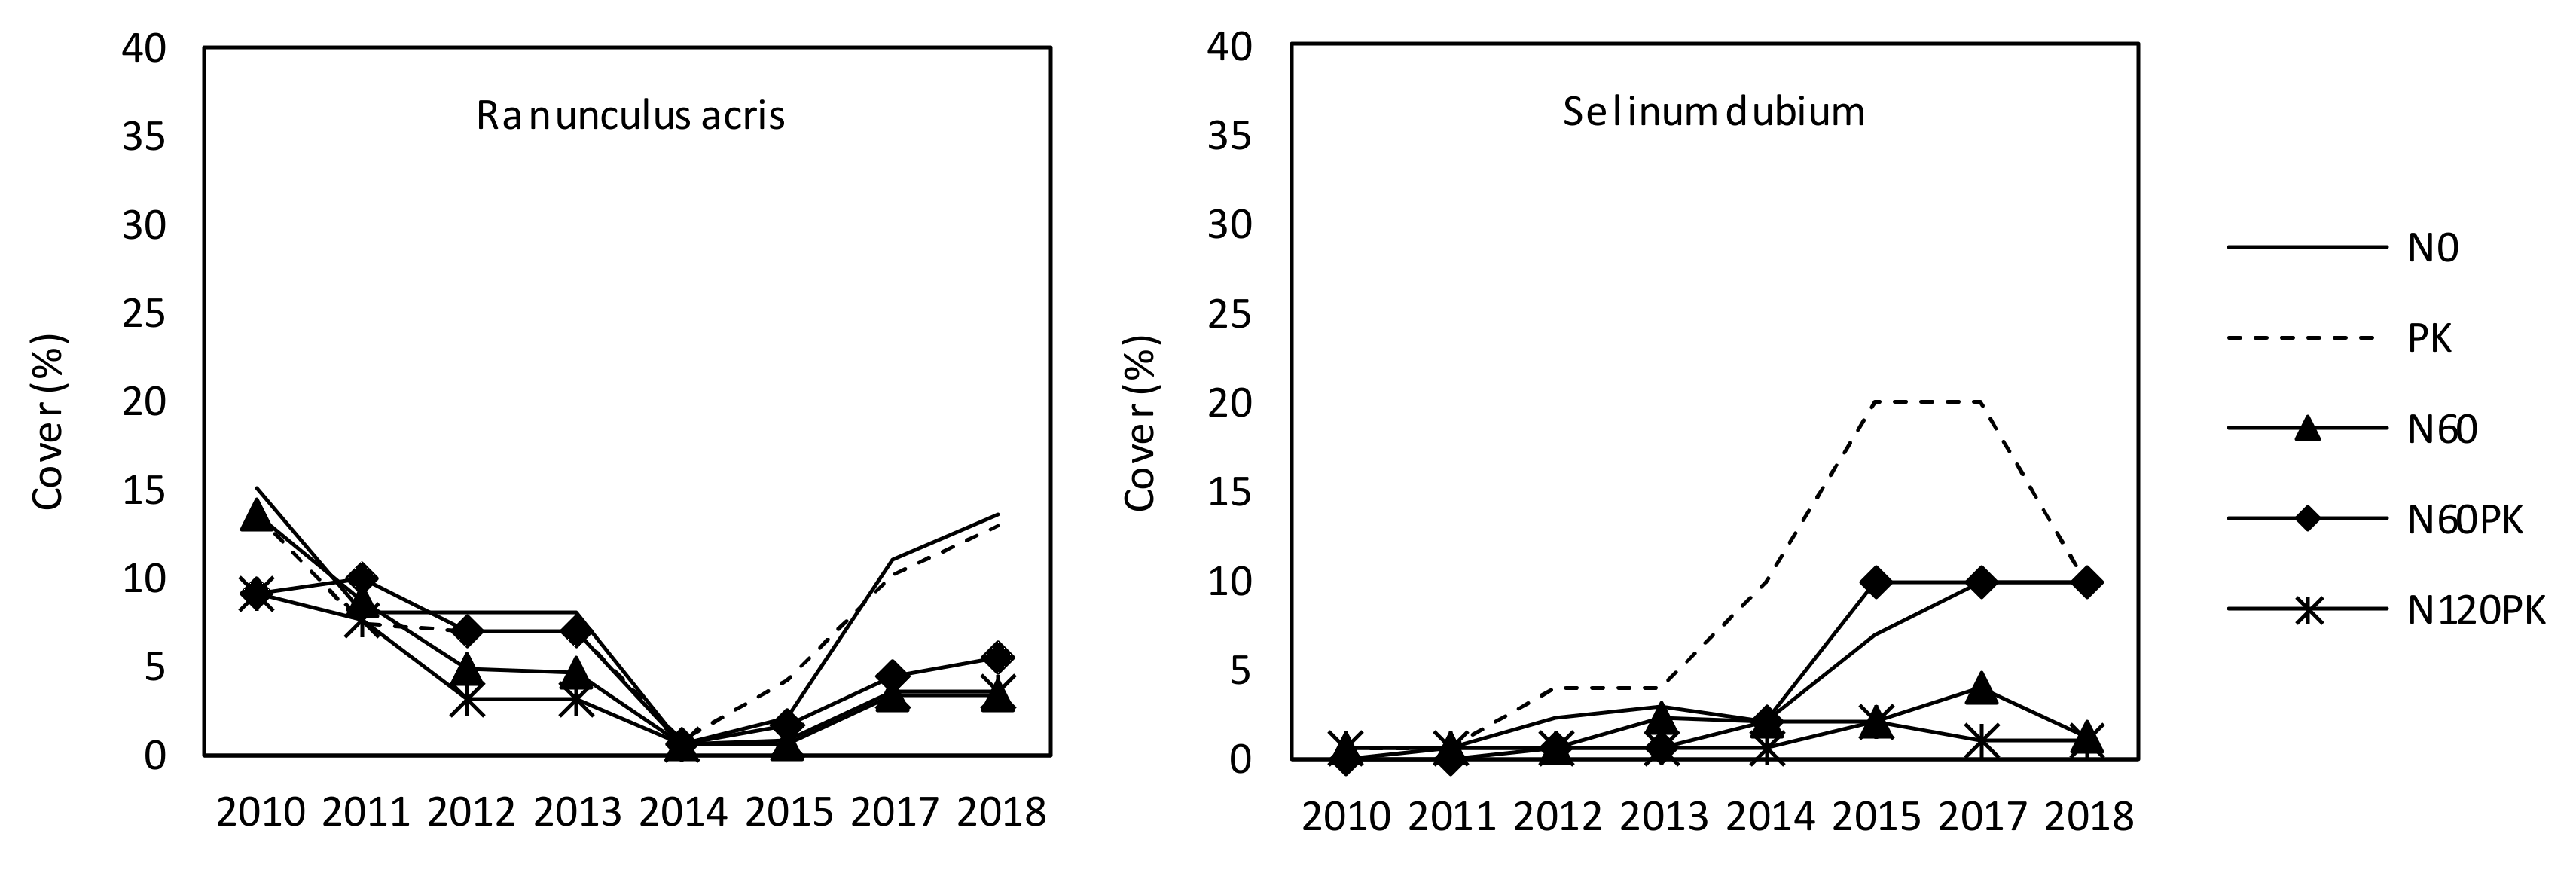
3.2.4. Development of Target Forbs Cover
4. Discussion
4.1. Effect of Fertilization on Forage Quality Parameters
4.2. Effect of Fertilization on Species Assembly
4.2.1. Grass and Legume Performance and Legume Cycle
4.2.2. Target Species Number and Target Forbs Cover
5. Conclusions
Supplementary Materials
Author Contributions
Funding
Data Availability Statement
Acknowledgments
Conflicts of Interest
Appendix A


| Year | 2010 | 2011 | 2012 | 2014 | 2015 | 2017 | ||||||
| Cut | First | Second | First | Second | First | Second | First | Second | First | Second | First | Second |
| Crude fiber (g kg DM−1) | ||||||||||||
| N0 | 268 (18.8) | 242 (17.8) | 257 (9.2) | 291 (7.8) | 295 (8.1) | 278 (19.3) | 292 (4.5) | 281 (15.7) | 267 (13.0) | 267 (17.4) | 280 (20.9) | 266 (36.5) |
| PK | 285 (4.5) | 241 (5.3) | 259 (10.1) | 290 (9.8) | 289 (13.1) | 292 (4.1) | 284 (23.4) | 297 (35.2) | 262 (14.7) | 254 (32.6) | 278 (9.2) | 275 (30.5) |
| N60 | 269 (12.1) | 227 (17.9) | 257 (13.9) | 287 (12.6) | 288 (11) | 288 (9.2) | 293 (14.8) | 279 (12.6) | 268 (15.1) | 268 (18.3) | 284 (17.8) | 270 (27.9) |
| N60PK | 282 (15.4) | 237 (14.1) | 258 (18.3) | 286 (9.1) | 306 (24.1) | 284 (12.0) | 300 (4.5) | 286 (19.8) | 271 (10.0) | 258 (13.8) | 305 (4.7) | 293 (20.2) |
| N120PK | 289 (9.7) | 254 (14.7) | 268 (9.6) | 284 (5.9) | 297 (5.4) | 286 (10.9) | 293 (12.9) | 284 (11.6) | 268 (15.7) | 250 (17.6) | 308 (19.9) | 320 (23.6) |
| Crude protein (g kg DM−1) | ||||||||||||
| N0 | 101 (6.1) | 124 (4.5) | 90 (15.1) | 121 (16.5) | 96 (5.9) | 102 (10.9) | 110 (8.5) | 113 (6.3) | 100 (5.1) | 116 (3.9) | 99 (4.2) | 107 (11.1) |
| PK | 102 (6.7) | 116 (7.6) | 94 (9.3) | 120 (13.7) | 92 (1.2) | 94 (8.9) | 97 (5.1) | 107 (12.6) | 99 (8.9) | 110 (17.7) | 96 (4.9) | 104 (11.6) |
| N60 | 99 (7.5) | 115 (3.1) | 96 (4.7) | 124 (16.4) | 111 (12.7) | 105 (8.1) | 121 (5.3) | 132 (11.5) | 118 (9.1) | 124 (7.5) | 117 (10.5) | 115 (11.5) |
| N60PK | 101 (3.5) | 118 (9.2) | 94 (6.2) | 121 (7.6) | 113 (14.9) | 110 (13.8) | 126 (22.1) | 142 (17.2) | 114 (8.5) | 115 (22.4) | 101 (6.5) | 105 (6.4) |
| N120PK | 108 (6.0) | 120 (4.6) | 104 (8.9) | 116 (9.6) | 104 (11.3) | 116 (12.6) | 130 (8.9) | 150 (13.6) | 131 (11.7) | 137 (19.6) | 118 (8.3) | 98 (10.9) |
| Metabolizable energy (MJ kg DM−1) | ||||||||||||
| N0 | 9.2 (0.3) | 9.6 (0.8) | 9.5 (0.1) | 8.7 (0.3) | 8.7 (0.2) | 9.3 (0.3) | 8.5 (0.1) | 8.1 (0.5) | 8.8 (0.4) | 9.2 (0.4) | 9.0 (0.2) | 9.0 (0.6) |
| PK | 9.0 (0.1) | 10.1 (0.3) | 9.5 (0.2) | 8.8 (0.2) | 8.6 (0.3) | 9.0 (0.2) | 8.5 (0.5) | 7.9 (0.3) | 9.1 (0.4) | 9.1 (0.8) | 8.8 (0.3) | 8.9 (0.4) |
| N60 | 9.3 (0.2) | 9.9 (0.5) | 9.5 (0.3) | 8.9 (0.2) | 9.0 (0.2) | 9.3 (0.3) | 8.7 (0.4) | 8.1 (0.4) | 8.9 (0.4) | 8.9 (0.5) | 8.9 (0.2) | 8.6 (0.5) |
| N60PK | 8.9 (0.2) | 10.0 (0.2) | 9.4 (0.4) | 8.9 (0.2) | 8.5 (0.4) | 9.3 (0.3) | 8.4 (0.3) | 7.8 (0.2) | 8.5 (0.6) | 8.9 (0.6) | 8.4 (0.2) | 8.4 (0.4) |
| N120PK | 8.9 (0.2) | 9.4 (0.4) | 9.3 (0.2) | 8.7 (0.3) | 8.9 (0.2) | 9.1 (0.3) | 8.6 (0.1) | 7.6 (0.3) | 9.0 (0.4) | 9.4 (0.4) | 8.4 (0.3) | 7.7 (0.6) |


| Target forbs (including legumes) | Prunella vulgaris | Viola stagnina |
| Achillea millefolium (hc) | Ranunculus acris (hc) | Target grasses |
| Allium angulosum | Ranunculus auricomus | Agrostis capillaris |
| Cardamine pratensis | Ranunculus polyanthemos (hc) | Alopecurus pratensis |
| Centaurea jacea (hc) | Rumex acetosa (hc) | Anthoxanthum odoratum |
| Daucus carota | Sanguisorba officinalis (hc) | Carex acuta |
| Euphorbia esula | Selinum dubium (hc) | Carex disticha |
| Galium album (hc) | Senecio aquaticus | Carex nigra |
| Galium boreale | Silaum silaus (hc) | Carex praecox |
| Inula salicina | Thalictrum flavum (hc) | Deschampsia cespitosa |
| Lathyrus pratensis (hc) | Trifolium pratense (hc) | Luzula campestris |
| Leucanthemum ircutianum (hc) | Veronica chamaedrys | Poa angustifolia |
| Lotus corniculatus | Veronica maritima (hc) | Poa trivialis |
| Lychnis flos-cuculi | Vicia sepium (hc) |
| Sum Sq | Mean Sq | NumDF | DenDF | F Value | p | |
|---|---|---|---|---|---|---|
| Year | 25.8 | 12.9 | 2 | 138 | 62.5 | <0.001 |

| Sum Sq | Mean Sq | NumDF | DenDF | F Value | p | |
|---|---|---|---|---|---|---|
| Year | 26.1 | 8.7 | 3 | 137 | 29.2 | <0.001 |


References
- Isselstein, J.; Jeangros, B.; Pavlů, V. Agronomic aspects of biodiversity targeted management of temperate grasslands in Europe—A review. Agron. Res. 2005, 3, 139–151. [Google Scholar]
- Peyraud, J.-L.; Peeters, A. The role of grassland based production system in the protein security. In Grassland Science in Europe—The Multiple Roles of Grassland in the European Bioeconomy, Proceedings of the 26th General Meeting of the European Grassland Federation (EGF), Trondheim, Norway, 4–8 September 2016; Höglind, M., Bakken, A.K., Hovstad, K.A., Kallioniemi, E., Riley, H., Steinshamn, H., Østrem, L., Eds.; Norwegian Institue of Bioeconomy Research: Wageningen, The Netherlands, 2016; Volume 21, pp. 29–43. [Google Scholar]
- Bengtsson, J.; Bullock, J.M.; Egoh, B.; Everson, C.; Everson, T.; O’Connor, T.; O’Farrell, P.J.; Smith, H.G.; Lindborg, R. Grasslands-more important for ecosystem services than you might think. Ecosphere 2019, 10, e02582. [Google Scholar] [CrossRef]
- Garland, G.; Banerjee, S.; Edlinger, A.; Oliveira, E.; Herzog, C.; Wittwer, R.; Philippot, L.; Maestre, F.; Van der Heijden, M. A closer look at the functions behind ecosystem multifunctionality: A review. J. Ecol. 2020, 109, 1–14. [Google Scholar] [CrossRef]
- Manning, P.; van der Plas, F.; Soliveres, S.; Allan, E.; Maestre, F.T.; Mace, G.; Whittingham, M.J.; Fischer, M. Redefining ecosystem multifunctionality. Nat. Ecol. Evol. 2018, 2, 427–436. [Google Scholar] [CrossRef]
- Zhao, Y.; Liu, Z.; Wu, J. Grassland ecosystem services: A systematic review of research advances and future directions. Landsc. Ecol. 2020, 35, 793–814. [Google Scholar] [CrossRef]
- Boval, M.; Dixon, R.M. The importance of grasslands for animal production and other functions: A review on management and methodological progress in the tropics. Animal 2012, 6, 748–762. [Google Scholar] [CrossRef] [Green Version]
- Berauer, B.J.; Wilfahrt, P.A.; Reu, B.; Schuchardt, M.A.; Garcia-Franco, N.; Zistl-Schlingmann, M.; Dannenmann, M.; Kiese, R.; Kühnel, A.; Jentsch, A. Predicting forage quality of species-rich pasture grasslands using vis-NIRS to reveal effects of management intensity and climate change. Agric. Ecosyst. Environ. 2020, 296, 106929. [Google Scholar] [CrossRef]
- Orford, K.A.; Murray, P.J.; Vaughan, I.P.; Memmott, J. Modest enhancements to conventional grassland diversity improve the provision of pollination services. J. Appl. Ecol. 2016, 53, 906–915. [Google Scholar] [CrossRef] [PubMed] [Green Version]
- Dengler, J.; Janišová, M.; Török, P.; Wellstein, C. Biodiversity of Palaearctic grasslands: A synthesis. Agric. Ecosyst. Environ. 2014, 182, 1–14. [Google Scholar] [CrossRef] [Green Version]
- Van Dijk, G. The status of semi-natural grasslands in Europe. In The Conservation of Lowland Dry Grassland Birds in Europe, Reading, 20–22 March 1991; Goriup, P.D., Batten, L.A., Norton, J.A., Eds.; JNCC Publication: Newbury, UK, 1991; pp. 15–36. [Google Scholar]
- Wesche, K.; Krause, B.; Culmsee, H.; Leuschner, C. Fifty years of change in Central European grassland vegetation: Large losses in species richness and animal-pollinated plants. Biol. Conserv. 2012, 150, 76–85. [Google Scholar] [CrossRef]
- Diekmann, M.; Andres, C.; Becker, T.; Bennie, J.; Blueml, V.; Bullock, J.; Culmsee, H.; Fanigliulo, M.; Hahn, A.; Heinken, T.; et al. Patterns of long-term vegetation change vary between different types of semi-natural grasslands in Western and Central Europe. J. Veg. Sci. 2019, 30, 187–202. [Google Scholar] [CrossRef] [Green Version]
- Council of the European Commission. Council directive 92/43/EEC of 21 May 1992 on the conservation of natural habitats and of wild fauna and flora. Off. J. Eur. Union L 1992, 206, 7–49. [Google Scholar]
- European Commission. Interpretation Manual of European Union Habitats—EUR 27; European Commission, DG Environment, Nature and Conservation: Brussels, Belgium, 2007. [Google Scholar]
- Šeffer, J.; Janák, M.; Šefferová Stanová, V. Management Models for Habitats in Natura 2000 Sites. 6440 Alluvial Meadows of River Valleys of the Cnidion Dubii; European Commission Technical Report 2008: 17/24. European Commission, 2008; p. 20, ISBN 978-92-79-08337-2. Available online: https://ec.europa.eu/environment/nature/natura2000/management/habitats/pdf/6440_Alluvial_meadows.pdf (accessed on 21 January 2021).
- Hölzel, N.; Donath, T.W.; Bissels, S.; Otte, A. Auengrünlandrenaturierung am hessischen Oberrhein -Defizite und Erfolge nach 15 Jahren Laufzeit. Schriftenr. Veg. 2002, 36, 131–137. [Google Scholar]
- Bischoff, A.; Warthemann, G.; Klotz, S. Succession of floodplain grasslands following reduction in land use intensity: The importance of environmental conditions, management and dispersal. J. Appl. Ecol. 2009, 46, 241–249. [Google Scholar] [CrossRef]
- Bischoff, A.; Hoboy, S.; Winter, N.; Warthemann, G. Hay and seed transfer to re-establish rare grasslandspecies and communities: How important are date andsoil preparation? Biol. Conserv. 2018, 221, 182–189. [Google Scholar] [CrossRef]
- Bundesamt für Naturschutz (BfN). Ergebnisse Nationaler FFH-Bericht 2019, Erhaltungszustände und Gesamttrends der Lebensraumtypen (LRT) in der Atlantischen Biogeographischen Region. 2019. Available online: https://www.bfn.de/fileadmin/BfN/natura2000/Dokumente/nat_bericht_LRT_EHZ_Gesamttrend_ATL_20190830.pdf (accessed on 21 January 2021).
- Bundesamt für Naturschutz (BfN). Ergebnisse Nationaler FFH-Bericht 2019, Erhaltungszustände und Gesamttrends der Lebensraumtypen (LRT) in der Kontinentalen Biogeographischen Region. 2019. Available online: https://www.bfn.de/fileadmin/BfN/natura2000/Dokumente/nat_bericht_LRT_EHZ_Gesamttrend_KON_20190830.pdf (accessed on 21 January 2021).
- Franke, C. Grünland an der unteren Mittelelbe. Vegetationsökologie und landwirtschaftliche Nutzbarkeit. Diss. Bot. 2003, 370, 1–181. [Google Scholar]
- Mrkvička, J.; Veselá, M. Influence of fertilization rates on species composition, quality and yields of the meadow fodder. Rostl. Vyrob. 2002, 48, 494–498. [Google Scholar] [CrossRef] [Green Version]
- Pavlů, V.; Hejcman, M.; Pavlů, L.; Gaisler, J.; Nežerková, P. Effect of continuous grazing on forage quality, quantity and animal performance. Agric. Ecosyst. Environ. 2006, 113, 349–355. [Google Scholar] [CrossRef]
- Hrabě, F.; Knot, P. The effect of trophism level and exploitation intensityon the production characteristics of grassland community dominated by Festuca arundinacea Schreb. Plant Soil Environ. 2011, 57, 160–165. [Google Scholar] [CrossRef] [Green Version]
- Štýbnarová, M.; Mičová, P.; Mrak-Fiala, P.; Karabcová, H.; Látal, O.; Pozdíšek, J. Effect of Organic Fertilizers on Botanical Composition of Grassland, Herbage Yield and Quality. Agric. Poľnohospodárstvo 2014, 59, 87–97. [Google Scholar] [CrossRef] [Green Version]
- Ludewig, K.; Donath, T.W.; Zelle, B.; Eckstein, R.L.; Mosner, E.; Otte, A.; Jensen, K. Effects of reduced summer precipitation on productivity and forage quality of floodplain meadows at the Elbe and the Rhine river. PLoS ONE 2015, 10, e0124140. [Google Scholar] [CrossRef]
- Pornaro, C.; Basso, E.; Macolino, S. Pasture botanical composition and forage quality at farm scale: A case study. Ital. J. Agron. 2019, 14, 214–221. [Google Scholar] [CrossRef]
- Schaub, S.; Finger, R.; Leiber, F.; Probst, S.; Kreuzer, M.; Weigelt, A.; Buchmann, N.; Scherer-Lorenzen, M. Plant diversity effects on forage quality, yield and revenues of semi-natural grasslands. Nat. Commun. 2020, 11, 768. [Google Scholar] [CrossRef] [Green Version]
- Ranta, M.; Rotar, I.; Vidican, R.; Malinas, A.; Ranta, O.; Lefter, N. Influence of the UAN Fertilizer Application on Quantitative and Qualitative Changes in Semi-Natural Grassland in Western Carpathians. Agronomy 2021, 11, 267. [Google Scholar] [CrossRef]
- Scotton, M.; Sicher, L.; Kasal, A. Semi-natural grasslands of the Non Valley (Eastern Italian Alps): Agronomic and environmental value of traditional and new Alpine hay-meadow types. Agric. Ecosyst. Environ. 2014, 197, 243–254. [Google Scholar] [CrossRef]
- Loucougaray, G.; Dobremez, L.; Gos, P.; Pauthenet, Y.; Nettier, B.; Lavorel, S. Assessing the Effects of Grassland Management on Forage Production and Environmental Quality to Identify Paths to Ecological Intensification in Mountain Grasslands. Environ. Manag. 2015, 56, 1039–1052. [Google Scholar] [CrossRef] [PubMed]
- Honsova, D.; Hejcman, M.; Klaudisova, M.; Pavlů, V.; Kocourkova, D.; Hakl, J. Species composition of an alluvial meadow after 40 years of applying nitrogen, phospohorus and potassium fertilizer. Preslia 2007, 79, 245–258. [Google Scholar]
- Hrevušová, Z.; Hejcman, M.; Pavlů, V.; Hakl, J.; Klaudisová, M.; Mrkvička, J. Long-term dynamics of biomass production, soil chemical properties and plant species composition of alluvial grassland after the cessation of fertilizer application in the Czech Republic. Agric. Ecosyst. Environ. 2009, 130, 123–130. [Google Scholar] [CrossRef]
- Vargová, V.; Kovačiková, Z.; Michalec, M. Effects of rates and nutrient ratios on production and quality of phytomass at fertiliser application to an alluvial meadow. Agriculture 2012, 58, 1–10. [Google Scholar] [CrossRef] [Green Version]
- Hejcman, M.; Sochorová, L.; Pavlů, V.; Štrobach, J.; Diepolder, M.; Schellberg, J. The Steinach Grassland Experiment: Soil chemical properties, sward height and plant species composition in three cut alluvial meadow after decades-long fertilizer application. Agric. Ecosyst. Environ. 2014, 184, 76–87. [Google Scholar] [CrossRef]
- Gillet, F.; Mauchamp, L.; Badot, P.-M.; Mouly, A. Recent changes in mountain grasslands: A vegetation resampling study. Ecol. Evol. 2016, 6, 2333–2345. [Google Scholar] [CrossRef] [Green Version]
- Dindová, A.; Hakl, J.; Hrevušová, Z.; Nerušil, P. Relationships between long-term fertilization management and forage nutritive value in grasslands. Agric. Ecosyst. Environ. 2019, 279, 139–148. [Google Scholar] [CrossRef]
- Kacorzyk, P.; Głąb, T. Effect of ten years of mineral and organic fertilization on the herbage production of a mountain meadow. J. Elem. 2017, 22, 219–233. [Google Scholar] [CrossRef]
- Buxton, D.R. Quality-related characteristics of forages as influenced by plant environment and agronomic factors. Anim. Feed Sci. Technol. 1996, 59, 37–49. [Google Scholar] [CrossRef]
- Wilman, D.; Williams, S.P. A comparison of grass/white clover and grass silages offered to dairy cows as the sole feed. Grass Forage Sci. 1993, 48, 231–237. [Google Scholar] [CrossRef]
- Lüscher, A.; Mueller-Harvey, I.; Soussana, J.F.; Rees, R.M.; Peyraud, J.L. Potential of legume-based grassland–livestock systems in Europe: A review. Grass Forage Sci. 2014, 69, 206–228. [Google Scholar] [CrossRef] [PubMed]
- Schwinning, S.; Parsons, A.J. Interactions between grasses and legumes: Understanding variability in species composition. In Legumes in Sustainable Farming Systems, British Grassland Society Occasional Symposium No 30, Proceedings of Joint Conference of BGS and SFS Initiative, SAC, Craibstone, Aberdeen, 2–4 September 1996; Younie, D., Ed.; British Grassland Society (BGS) Hurley: Reading, UK, 1996; pp. 153–163. [Google Scholar]
- Herben, T.; Mayerová, H.; Skálová, H.; Hadincová, V.; Pecháčková, S.; Krahulec, F. Long-term time series of legume cycles in a semi-natural montane grassland: Evidence for nitrogen-driven grass dynamics? Funct. Ecol. 2017, 31, 1430–1440. [Google Scholar] [CrossRef]
- Soons, M.B.; Hefting, M.M.; Dorland, E.; Lamers, L.P.M.; Versteeg, C.; Bobbink, R. Nitrogen effects on plant species richness in herbaceous communities are more widespread and stronger than those of phosphorus. Biol. Conserv. 2017, 212, 390–397. [Google Scholar] [CrossRef]
- Galka, A.; Zarzynski, J.; Kopec, M. Effect of different fertilization regimes on species composition and habitat in a long-term grassland experiment. Grassl. Sci. Eur. 2005, 10, 132–135. [Google Scholar]
- Socher, S.A.; Prati, D.; Boch, S.; Müller, J.; Klaus, V.H.; Hölzel, N.; Fischer, M. Direct and productivity-mediated indirect effects of fertilization, mowing and grazing on grassland species richness. J. Ecol. 2012, 100, 1391–1399. [Google Scholar] [CrossRef]
- Allan, E.; Manning, P.; Alt, F.; Binkenstein, J.; Blaser, S.; Grassein, F.; Klaus, V.; Kleinebecker, T.; Morris, E.; Oelmann, Y.; et al. Land use intensification alters ecosystem multifunctionality via loss of biodiversity and changes to functional composition. Ecol. Lett. 2015, 18, 834–843. [Google Scholar] [CrossRef] [PubMed]
- Humbert, J.-Y.; Dwyer, J.M.; Andrey, A.; Arlettaz, R. Impacts of nitrogen addition on plant biodiversity in mountain grasslands depend on dose, application duration and climate: A systematic review. Glob. Chang. Biol. 2015, 22, 110–120. [Google Scholar] [CrossRef]
- Korevaar, H.; Geerts, R. Long-term effects of nutrients on productivity and species-richness of grasslands: The Ossekampen Grassland Experiment. In Proceedings of the Conference Valuing Long-Term Sites and Experiments for Agriculture and Ecology, Newcastle, UK, 27–28 May 2015; Peacock, S., Smith, B.M., Stockdale, E.A., Watson, C., Eds.; Association of Applied Biologists: Warwick, UK, 2015; Volume 128, pp. 253–256. [Google Scholar]
- Müller, I.B.; Buhk, C.; Lange, D.; Entling, M.H.; Schirmel, J. Contrasting effects of irrigation and fertilization on plant diversity in hay meadows. Basic Appl. Ecol. 2016, 17, 576–585. [Google Scholar] [CrossRef]
- Molina, C.D.; Tognetti, P.M.; Graff, P.; Chaneton, E.J. Mowing does not redress the negative effect of nutrient addition on alpha and beta diversity in a temperate grassland. J. Ecol. 2021, 109, 1501–1510. [Google Scholar] [CrossRef]
- Hejcman, M.; Klaudisová, M.; Schellberg, J.; Honsová, D. The Rengen Grassland Experiment: Plant species composition after 64 years of fertilizer application. Agric. Ecosyst. Environ. 2007, 122, 259–266. [Google Scholar] [CrossRef]
- John, H.; Dullau, S.; Baasch, A.; Tischew, S. Re-introduction of target species into degraded lowland hay meadows: How to manage the crucial first year? Ecol. Eng. 2016, 86, 223–230. [Google Scholar] [CrossRef]
- Busch, V.; Klaus, V.H.; Schäfer, D.; Prati, D.; Boch, S.; Müller, J.; Chisté, M.; Mody, K.; Blüthgen, N.; Fischer, M.; et al. Will I stay or will I go? Plant species specific response and tolerance to high land-use intensity in temperate grassland ecosystems. J. Veg. Sci. 2019, 30, 674–686. [Google Scholar] [CrossRef]
- Grime, J.P. Plant Strategies and Vegetation Processes; Wiley & Sons: New York, NY, USA, 1979; ISBN 9780471996927. [Google Scholar]
- Hautier, Y.; Niklaus, P.A.; Hector, A. Competition for light causes plant biodiversity loss after eutrophication. Science 2009, 324, 636–638. [Google Scholar] [CrossRef] [Green Version]
- Schubert, R. Prodromus der Pflanzengesellschaften Sachsen-Anhalts. Mitt. Florist. Kart. Sachsen-Anhalt 2001, 2, 1–688. [Google Scholar]
- Burkart, M. River corridor plants (Stromtalpflanzen) in Central European lowland: A review of a poorly understood plant distribution pattern. Glob. Ecol. Biogeogr. 2001, 10, 449–468. [Google Scholar] [CrossRef]
- Jäger, E.J. (Ed.) Rothmaler—Exkursionsflora von Deutschland. Gefäßpflanzen: Grundband, 21st ed.; Springer Spektrum: Berlin, Germany, 2017; ISBN 978-3-662-49707-4. [Google Scholar]
- Deutsches Institut für Normung. DIN ISO 10390:2005-02 Soil quality—Determination of pH; Beuth: Berlin, Germany, 2005; p. 7. [Google Scholar]
- Deutsches Institut für Normung. DIN 51721:2001-08 Testing of Solid Fuels—Determination of Carbon Content and Hydrogen Content—Radmacher-Hoverath Method; Beuth: Berlin, Germany, 2001; p. 5. [Google Scholar] [CrossRef]
- Deutsches Institut für Normung. DIN 51722-1:1990-07 Testing of Solid Fuels; Determination of Nitrogen Content; Semi-Micro Kjeldahl Method, Beuth: Berlin, Germany, 1990; p. 7. [Google Scholar] [CrossRef]
- VDLUFA. Methodenbuch der VDLUFA Band I. Die Untersuchung von Böden, 4th ed.; Verband Deutscher Landwirtschaftlicher Untersuchungs-und Forschungsanstalten (VDLUFA): Darmstadt, Germany, 1991; ISBN 978-3-941273-13-9. [Google Scholar]
- Landesanstalt für Landwirtschaft und Gartenbau Sachsen-Anhalt (LLG). Richtwertsammlung Düngerecht, Abgestimmt mit den Ländern Brandenburg, Mecklenburg- Vorpommern, Sachsen und Thüringen- Gültig für Sachsen-Anhalt. Teil 2. Tabellen 9–15; Landesanstalt für Landwirtschaft und Gartenbau Sachsen-Anhalt: Halle (Saale), Germany, 2019; Available online: https://llg.sachsen-anhalt.de/fileadmin/Bibliothek/Politik_und_Verwaltung/MLU/LLFG/Dokumente/04_themen/pfl_ernaehr_duengung/Richtwerte/2019_rw_teil5_duengerecht.pdf (accessed on 14 December 2020).
- Londo, G. The decimal scale for releves of permanent quadrats. Vegetatio 1976, 33, 61–64. [Google Scholar] [CrossRef]
- Voigtländer, G.; Voss, N. Methoden der Grünlanduntersuchung und -Bewertung. Grünland, Feldfutter, Rasen; Ulmer: Stuttgart, Germany, 1979; ISBN 9783800130436. [Google Scholar]
- VDLUFA. Methodenbuch der VDLUFA Band III. Die Chemische Untersuchung von Futtermitteln, 3rd ed.; Verband Deutscher Landwirtschaftlicher Untersuchungs-und Forschungsanstalten (VDLUFA): Darmstadt, Germany, 2004; ISBN 978-3-941273-14-6. [Google Scholar]
- Losand, B.; Pries, M.; Menke, A.; Tholen, E.; Gruber, L.; Hertwig, F.; Jilg, T.; Kluth, H.; Spiekers, H.; Steingaß, H.; et al. Schätzung des Energiegehaltes in Grasprodukten—Bericht zum Stand neuer Ableitungen. In Proceedings of the Forum angewandte Forschung in der Rinder- und Schweinefütterung, Fulda, Germany, 28–29 March 2007; pp. 105–109. [Google Scholar]
- Schuboth, J.; Frank, D. Kartieranleitung Lebensraumtypen Sachsen-Anhalt. Teil Offenland. Zur Kartierung der Lebensraumtypen nach Anhang I der FFH-Richtlinie; Landesamt für Umweltschutz Sachsen-Anhalt: Halle (Saale), Germany, 2010. [Google Scholar]
- Grime, J.P.; Hodgson, J.G.; Hunt, R. Comparative Plant Ecology. A Functional Approach to Common British Species; Unwin Hyman: London, UK, 1988; ISBN 978-0-412-74170-8. [Google Scholar]
- R Development Core Team. R: A Language and Environment for Statistical Computing; R Foundation for Statistical Computing: Vienna, Austria, 2021; Available online: http://cran.r-project.org (accessed on 8 January 2021).
- Bates, D.; Mächler, M.; Bolker, B.; Walker, S. Fitting linear mixed-effects models using lme4. J. Statist. Softw. 2015, 67, 1–48. [Google Scholar] [CrossRef]
- Warton, D.I.; Hui, F.K.C. The arcsine is asinine: The analysis of proportions in ecology. Ecology 2011, 92, 3–10. [Google Scholar] [CrossRef] [Green Version]
- Crawley, M.J. The R book, 2nd ed.; Wiley & Sons: Chichester, UK, 2013; ISBN 978-0-470-97392-9. [Google Scholar]
- Bayerische Landesanstalt für Landwirtschaft (LfL). Gruber Tabelle zur Fütterung der Milchkühe, Zuchtrinder, Mastrinder, Schafe, Ziegen; LfL-Informationen Freising-Weihenstephan, Bayerische Landesanstalt für Landwirtschaft: Freising, Germany, 2019. [Google Scholar]
- Ineichen, S.; Marquardt, S.; Kreuzer, M.; Reidy, B. Forage quality of species-rich mountain grasslands subjected to zero, PK and NPK mineral fertilization for decades. Grass Forage Sci. 2020, 75, 385–397. [Google Scholar] [CrossRef]
- Schellberg, J.; Möseler, B.M.; Kühbauch, W.; Rademacher, I.F. Long-term effects of fertilizer on soil nutrient concentration, yield, forage quality and floristic composition of a hay meadow in the Eifel mountains, Germany. Grass Forage Sci. 1999, 54, 195–207. [Google Scholar] [CrossRef]
- Larter, N.; Nagy, J.A. Seasonal and annual variability in the quality of important forage plants on Banks Island, Canadian High Arctic. Appl. Veg. Sci. 2001, 4, 115–128. [Google Scholar] [CrossRef]
- Blöschl, G.; Kiss, A.; Viglione, A.; Barriendos, M.; Böhm, O.; Brázdil, R.; Coeur, D.; Demarée, G.; Llasat, M.C.; Macdonald, N.; et al. Current European flood-rich period exceptional compared with past 500 years. Nature 2020, 583, 560–566. [Google Scholar] [CrossRef]
- Peters, A.; Filley, S.; Hulting, A. Forage Value of Pasture Weeds in Southwestern Oregon; Beef Research Report 2010; Oregon State University: Corvallis, OR, USA, 2010; Volume 26, p. 6. [Google Scholar]
- Pannach, H.; Biosphere Reserve Mittelelbe, Dessau, Germany. Personal Communication. 2021. [Google Scholar]
- Kidd, J.; Manning, P.; Simkin, J.; Peacock, S.; Stockdale, E. Impacts of 120 years of fertilizer addition on a temperate grassland ecosystem. PLoS ONE 2017, 12, e0174632. [Google Scholar] [CrossRef]
- Witwicki, D.L.; Munson, S.M.; Thoma, D.P. Effects of climate and water balance across grasslands of varying C3 and C4 grass cover. Ecosphere 2016, 7, e01577. [Google Scholar] [CrossRef]
- Güsewell, G. Responses of wetland graminoids to the relative supply of nitrogen and phosphorus. Plant Ecol. 2005, 176, 35–55. [Google Scholar] [CrossRef]
- Oelmann, Y.; Broll, G.; Hölzel, N.; Kleinebecker, T.; Vogel, A.; Schwartze, P. Nutrient impoverishment and limitation of productivity after 20 years of conservation management in wet grasslands of north-western Germany. Biol. Conserv. 2009, 142, 2941–2948. [Google Scholar] [CrossRef]
- Pavlů, V.; Gaisler, J.; Pavlů, L.; Hejcman, M.; Ludvíková, V. Effect of fertiliser application and abandonment on plant species composition of Festuca rubra grassland. Acta Oecol. Montrouge 2012, 45, 42–49. [Google Scholar] [CrossRef]
- Ringselle, B.; De Cauwer, B.; Salonen, J.; Soukup, J. A Review of Non-Chemical Management of Couch Grass (Elymus repens). Agronomy 2020, 10, 1178. [Google Scholar] [CrossRef]
- Schwinning, S.; Parsons, A.J. Analysis of the co-existence mechanisms for grasses and legumes in grazing systems. J. Ecol. 1996, 84, 799–813. [Google Scholar] [CrossRef]
- Pavlů, V.; Schellberg, J.; Hejcman, M. Cutting frequency vs. N application: Effect of a 20-year management in Lolio-Cynosuretum grassland. Grass Forage Sci. 2011, 66, 501–515. [Google Scholar] [CrossRef]
- Holúbek, I.; Petrovič, F. An economic analysis of permanent and oversown grasslands based on the data from research experiments. Ekológia 2011, 30, 122–132. [Google Scholar] [CrossRef]
- Hopkins, A.; Holz, B. Grassland for agriculture and nature conservation: Production, quality and multi-functionality. Agron. Res. 2006, 4, 3–20. [Google Scholar]
- Weggler, K.; Thumm, U.; Elsaesser, M. Development of Legumes After Reseeding in Permanent Grassland, as Affected by Nitrogen Fertilizer Applications. Agriculture 2019, 9, 207. [Google Scholar] [CrossRef] [Green Version]
- Opitz, V.; Boberfeld, W.; Laser, H. Einfluss von Lotus corniculatus auf die Nutzungselastizität bestandsprägender Gräser der Extensiv-Weiden (Effect of Lotus corniculatus on the elasticity of forage utilization of dominant grass species in extensive pastures). Pflanzenbauwissenschaften 1999, 3, 88–93. [Google Scholar]
- Raus, J.; Knot, P.; Skládanka, J.; Kvasnovský, M.; Sochorec, M.; Mejía, J.E.A.; Hrabě, F. Effect of Cutting Pattern and Fertilization Level on Species Diversity and Evaluation of Grassland Quality. Acta Univ. Agric. Silvic. Mendel. Brun. 2014, 62, 1087–1093. [Google Scholar] [CrossRef] [Green Version]
- Beltman, B.; Willems, J.H.; Güsewell, S. Flood events overrule fertiliser effects on biomass production and species richness in riverine grasslands. J. Veg. Sci. 2007, 18, 625–634. [Google Scholar] [CrossRef]
- Tallowin, J.; Jefferson, R. Hay production from lowland semi-natural grasslands: A review of implications for ruminant livestock systems. Grass Forage Sci. 2008, 54, 99–115. [Google Scholar] [CrossRef]
- Kirkham, F.W.; Tallowin, J.R.B.; Dunn, R.M.; Bhogal, A.; Chambers, B.J.; Bardgett, R.D. Ecologically sustainable fertility management for the maintenance of species-rich hay meadows: A 12-year fertilizer and lime experiment. J. Appl. Ecol. 2014, 51, 152–161. [Google Scholar] [CrossRef] [Green Version]
- Van Dobben, H.F.; Wieger Wamelink, G.W.; Slim, P.A.; Kamiński, J.; Piórkowski, H. Species-rich grassland can persist under nitrogen-rich but phosphorus-limited conditions. Plant Soil 2017, 41, 451–466. [Google Scholar] [CrossRef] [Green Version]
- Dickson, T.L.; Mittelbach, G.G.; Reynolds, H.L.; Gross, K.L. Height and clonality traits determine plant community responses to fertilization. Ecology 2014, 95, 2443–2452. [Google Scholar] [CrossRef] [Green Version]


| Treatment | pH Value | Phosphorus (mg kg) | Potassium (mg kg) | Total Carbon (%) | Total Nitrogen (%) |
|---|---|---|---|---|---|
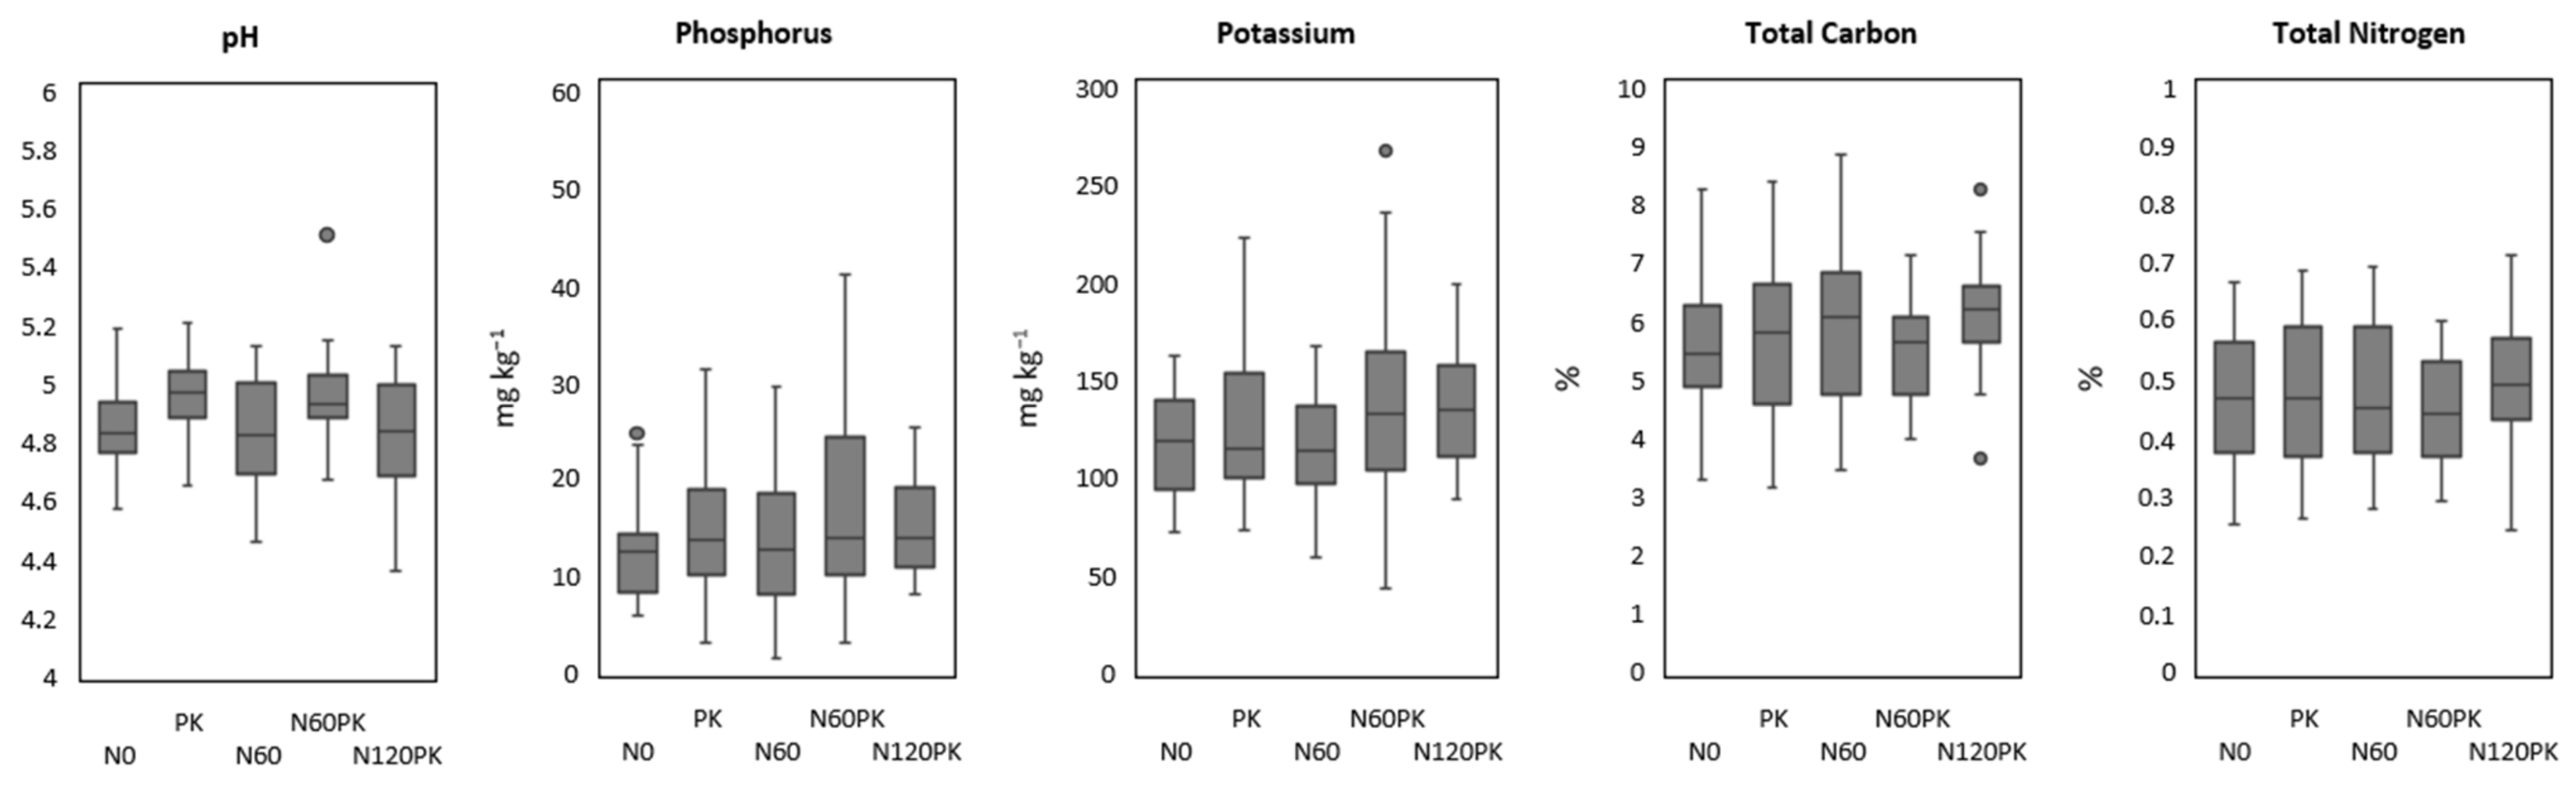
| N0 | 4.84 (0.14) | 9.50 (2.65) | 105.00 (20.90) | 5.23 (0.91) | 0.46 (0.10) |
| PK | 4.92 (0.14) | 13.75 (6.24) | 111.50 (21.08) | 5.43 (1.23) | 0.48 (0.12) |
| N60 | 4.84 (0.14) | 10.75 (6.24) | 121.75 (19.05) | 5.80 (1.33) | 0.50 (0.13) |
| N60PK | 4.96 (0.05) | 13.50 (7.77) | 126.25 (18.87) | 5.48 (0.71) | 0.47 (0.08) |
| N120PK | 4.83 (0.17) | 10.50 (0.58) | 127.25 (17.91) | 5.90 (0.80) | 0.50 (0.08) |
| N0 | PK | N60 | N60PK | N120PK | ||
|---|---|---|---|---|---|---|
| Crude fiber | First cut | 257–295 | 259–289 | 257–293 | 258–307 | 268–308 |
| (g kg DM−1) | Second cut | 242–291 | 241–297 | 228–288 | 237–293 | 250–320 |
| Crude protein | First cut | 90–110 | 92–101 | 96–121 | 94–126 | 104–131 |
| (g kg DM−1) | Second cut | 102–124 | 94–120 | 105–132 | 105–142 | 98–150 |
| Metabolizable energy | First cut | 8.5–9.5 | 8.5–9.5 | 8.7–9.5 | 8.4–9.4 | 8.4–9.3 |
| (MJ kg DM−1) | Second cut | 8.1–9.6 | 7.9–10.1 | 8.1–9.9 | 7.8–10.0 | 7.6–9.4 |
| Sum Sq | Mean Sq | NumDF | DenDF | F value | p | |
|---|---|---|---|---|---|---|
| First cut | ||||||
| Fertilizer | 2385.9 | 1192.9 | 2 | 19.6 | 15.1 | <0.001 |
| Year | 5736.8 | 1912.3 | 3 | 91.0 | 24.1 | <0.001 |
| Fertilizer × Year | 1947.3 | 324.6 | 6 | 91.0 | 4.1 | 0.001 |
| Second cut | ||||||
| Fertilizer | 2538.6 | 1269.3 | 2 | 15.7 | 10.6 | 0.001 |
| Year | 9408.6 | 2352.2 | 4 | 87.3 | 19.6 | <0.001 |
| Fertilizer × Year | 5255.9 | 657.0 | 8 | 87.3 | 5.5 | <0.001 |
| Sum Sq | Mean Sq | NumDF | DenDF | F value | p | |
|---|---|---|---|---|---|---|
| First cut | ||||||
| Fertilizer | 2348.9 | 2348.9 | 1 | 15 | 17.0 | <0.001 |
| Year | 21,407.3 | 7135.8 | 3 | 97 | 51.7 | <0.001 |
| Second cut | ||||||
| Fertilizer | 1702.5 | 1702.5 | 1 | 23.9 | 5.9 | 0.023 |
| Year | 24,466.3 | 8155.4 | 3 | 94.4 | 28.3 | <0.001 |
| Fertilizer × Year | 6627.1 | 2209.0 | 3 | 94.4 | 7.7 | <0.001 |
| Sum Sq | Mean Sq | NumDF | DenDF | F Value | p | |
|---|---|---|---|---|---|---|
| First cut | ||||||
| Fertilizer | 0.6 | 0.6 | 1 | 15 | 8.8 | 0.01 |
| Year | 10.6 | 2.7 | 4 | 96 | 35.8 | <0.001 |
| Second cut | ||||||
| Fertilizer | 1.8 | 1.8 | 1 | 18.6 | 12.6 | 0.022 |
| Year | 28.0 | 7.0 | 4 | 92.2 | 48.2 | <0.001 |
| Fertilizer × Year | 2.9 | 0.7 | 4 | 92.2 | 5.0 | 0.001 |
| Sum Sq | Mean Sq | NumDF | DenDF | F Value | p | |
|---|---|---|---|---|---|---|
| Fertilizer | 1.0 | 0.5 | 2 | 15.3 | 6.5 | 0.001 |
| Year | 19.7 | 9.9 | 2 | 134.0 | 134.7 | <0.001 |
| Fertilizer × Year | 4.3 | 1.1 | 4 | 134.0 | 14.7 | <0.001 |
| Sum Sq | Mean Sq | NumDF | DenDF | F Value | p | |
|---|---|---|---|---|---|---|
| Fertilizer | 4.3 | 2.1 | 2 | 17.0 | 6.2 | 0.009 |
| Year | 58.0 | 14.5 | 4 | 128.0 | 42.3 | <0.001 |
| Fertilizer × Year | 10.7 | 1.3 | 8 | 128.0 | 3.8 | <0.001 |
| Sum Sq | Mean Sq | NumDF | DenDF | F Value | p | |
|---|---|---|---|---|---|---|
| Fertilizer | 1.1 | 1.1 | 1 | 19.6 | 5.4 | 0.031 |
| Year | 33.4 | 11.1 | 3 | 134.0 | 52.9 | <0.001 |
| Fertilizer × Year | 3.5 | 1.2 | 3 | 134.0 | 5.6 | 0.001 |
Publisher’s Note: MDPI stays neutral with regard to jurisdictional claims in published maps and institutional affiliations. |
© 2021 by the authors. Licensee MDPI, Basel, Switzerland. This article is an open access article distributed under the terms and conditions of the Creative Commons Attribution (CC BY) license (https://creativecommons.org/licenses/by/4.0/).
Share and Cite
Dullau, S.; Rydgren, K.; Kirmer, A.; Jäger, U.G.; Meyer, M.H.; Tischew, S. The Dessau Grassland Experiment—Impact of Fertilization on Forage Quality and Species Assembly in a Species-Rich Alluvial Meadow. Agriculture 2021, 11, 339. https://doi.org/10.3390/agriculture11040339
Dullau S, Rydgren K, Kirmer A, Jäger UG, Meyer MH, Tischew S. The Dessau Grassland Experiment—Impact of Fertilization on Forage Quality and Species Assembly in a Species-Rich Alluvial Meadow. Agriculture. 2021; 11(4):339. https://doi.org/10.3390/agriculture11040339
Chicago/Turabian StyleDullau, Sandra, Knut Rydgren, Anita Kirmer, Urs Georg Jäger, Maren Helen Meyer, and Sabine Tischew. 2021. "The Dessau Grassland Experiment—Impact of Fertilization on Forage Quality and Species Assembly in a Species-Rich Alluvial Meadow" Agriculture 11, no. 4: 339. https://doi.org/10.3390/agriculture11040339