Article

Estimation of Tunisian Greenhouse Gas Emissions from Different Livestock Species

1
Higher Agriculture School of Mograne, 1121 Mograne, University of Carthage Tunisia, Zaghouan 1100, Tunisia
2
Laboratory of Animal and Forage Production, National Institute of Agronomic Research of Tunis, Street Hédi Karray, El Manzah 1004, University of Carthage, Carthage 1054, Tunisia
3
Higher Agriculture Institute of Chott Meriam (ISCM), Department of Animal Resources, Agri-food and Rural Development, University of Sousse, Sousse 4047, Tunisia
4
Agronomic National Institute of Tunisia (INAT), Unity of Ecosystem Research and Aquatic Ressources, 43 Street Charles Nicolle, Tunis-Mahrajène 1082, University of Carthage, Carthage 1054, Tunisia
5
Gooding County Extension, University of Idaho, 203 Lucy Lane, Gooding, ID 83330, USA
6
Department of Animal and Veterinary Sciences, University of Idaho, PO Box 1827, Twin Falls, ID 83303, USA
7
Higher Agriculture School of Mateur, Mateur, Bizerte 7030, University of Carthage, Carthage 1054, Tunisia
8
Instituto de Ganadería de Montaña (IGM), CSIC-Universidad de León, Departamento de Producción Animal, Universidad de León, E-24007 León, Spain
9
Agronomy Laboratory, Street Hédi Karray, National Institute of Agronomic Research of Tunis, El Manzah 1004, University of Carthage, Carthage 1054, Tunisia
10
Ministry of Agriculture, Maritime Fisheries and Hydraulic Ressources, 30 Street Alain Savarey, Tunis 1002, Tunisia
*
Authors to whom correspondence should be addressed.
Authors contributing equally to the fulfillment of this work.
Agriculture 2020, 10(11), 562; https://doi.org/10.3390/agriculture10110562
Submission received: 19 October 2020 / Revised: 31 October 2020 / Accepted: 5 November 2020 / Published: 20 November 2020
(This article belongs to the Section Farm Animal Production)

Abstract

:
This study aimed to determine the emissions of methane (CH4) and nitrous oxide (N2O) from seven Tunisian livestock species and their evolution over eleven consecutive years (2008–2018). The species of animals used were cattle (dairy and others), sheep, goats, camelids, horses, donkeys and mules, and poultry. The estimations of CH4 and N2O emissions were based on the Intergovernmental Panel on Climate Change (IPCC) guidelines for national inventories, using Tier 1 and Tier 2 approaches, with its default emission factors (EFs). The Tier 2 approach was applied only for the calculation of EF to estimate CH4 emissions related to livestock manure management. CH4 emission represented more than 92% of the total greenhouse gas (GHG) from livestock emissions. Moreover, 53% of the total CH4 emissions from livestock were derived from cattle, followed by sheep, goats, other mammals (camelids, horses, mules, and donkeys), and poultry. During the period covered by the study (2008–2018), a slight and continuous decrease of both livestock population and total GHG emissions was observed, mainly in terms of CH4. In mammals, CH4 emissions were greater than N2O emissions, whereas in poultry, N2O emissions were up to 2.6 times greater than CH4 emissions. The aggressive drive of the government to increase cattle and sheep production might affect CH4 emissions in the future. Therefore, periodic estimations of GHG emissions from livestock are required to follow the time trends for more rational decision-making regarding livestock and GHG emissions policies.

1. Introduction

In many African countries, agriculture remains the largest economic sector. It supplies up to 50% of household food requirements and up to 50% of household incomes [1,2]. In Tunisia, about 20% of the population is employed in agriculture, which accounts for about 10% of the country’s gross domestic product, and about 10 to 12% of total exports [3,4]. As such, agriculture is essential for the overall economy. On the other hand, the agricultural sector (crop and livestock production) contributes globally to about 11% of global greenhouse gas (GHG) emissions, accounting for 5.4 Gt CO2e in 2012 [5]. About 60% of the total agricultural emissions are due to livestock emission sources. Enteric fermentation is considered the biggest contributor (about 63%) of livestock emissions, followed by manure management (12%) and application of dung and urine on pasture (25%) [5]. Other emissions related to livestock include energy use in livestock supply chains, GHG emissions in feed production, and emissions from land use changes [6]. While total GHG emissions from livestock production in developed countries as a whole have declined in recent decades, emissions in most developing countries have increased significantly [5] and are expected to increase in the coming decades. As a response to GHG emissions and their impact on climate change, Tunisia is expected to see an increase in droughts. This will particularly affect rain fed cereal farmland, which is expected to decrease from a current average land area of 1.5 million hectares to about 1 million hectares in 2030, i.e., a reduction of approximately 30% [7]. Likewise, in the event of successive extreme droughts, the land area used for cereal crops and arboriculture (mainly in regions in the centre and the south) will decrease by 200,000 and 800,000 hectares, respectively. Lastly, the livestock population would decrease by about 80% in the centre and the south, and 20% in the north, owing to the loss of grasslands and grazing areas. Tunisia is aware of these challenges and has carried out five complete GHG inventory operations in 1994, 2000, 2010, 2011, and 2012.
According to the last inventory, Tunisia’s GHG net emissions reached 32,600 Gg of CO2 equivalent (Gg CO2e) in 2012 [8,9]. CO2 was the major gas emitted (69%) followed by CH4 (21.9%) and N2O (7.9%). The energy sector was the largest contributor to net GHG emissions, with 27,023 Gg CO2e, representing 83% of the 2012 national net emissions. More than 90% of the emissions attributable to energy are due to combustion (92%) [8,9]. Given the relatively major importance of the agriculture sector in Tunisia [3], total GHG emissions from the agriculture, forestry, and other land use (AFOLU) sector in Tunisia in 2012 were 6568, 2636, and 1945 Gg CO2e as CO2, CH4, and N2O, respectively. However, some cultivated land (mainly olive groves and arboriculture) and forests contribute to the absorption of 14,028 Gg CO2 from the atmosphere. Therefore, although gross GHG emissions from AFOLU account for 24% (11,149 Gg CO2e) of the total emissions in Tunisia, overall, this sector is considered a net GHG absorber, with a final balance of minus 2900 Gg CO2e (negative emission indicating a net absorption of CO2) [8,9]. However, carbon sequestration is only in the form of CO2, so that regarding other GHGs, AFOLU contributes to 37% and 76% of the CH4 and N2O total emissions in Tunisia, respectively. As for the structure of GHG emissions within the AFOLU sector, livestock-related emissions account for 26% of agricultural GHG emissions, whereas the contributions from other agricultural activities were estimated as 32% from wood use (mainly wood-energy) and 26% from land use (mainly carbon losses in grasslands) [8,9]. Measurement of livestock GHG emissions and its evolution is relevant for the estimation of total GHG emissions [6,10]. Better characterization of livestock GHG emissions can assist scientists and policy makers in targeting solutions and design efforts to mitigate GHG emissions [10]. The national inventory of GHGs from Tunisia reported to the United Nations Framework Convention on Climate Change (UNFCCC) [8,9] does not specify which GHG emissions correspond to CH4 or N2O, and how these emissions can be assigned to each animal species farmed in the country. This information is required to identify gaps of knowledge to achieve more accurate estimations and issues that can be targeted to implement mitigation or adaptation measures. Generally, the estimation of GHG is based on 2006 Intergovernmental Panel on Climate Change (IPCC) guidelines [11] using Tier 1 or Tier 2 approaches. Wilkes et al. [6] reported that, among 140 developing countries, 119 use a Tier 1 approach, and only 21 countries use a Tier 2 approach. Tier 1 methodologies use fixed values for GHG emissions per head of livestock, so changes in total emissions are responsive only to changes in animal numbers and populations. However, Tier 2 methodologies require enhanced classification of different types of livestock and data on livestock weight, weight gain, feed digestibility, level of production, and other factors. Tier 2 methodologies are supposed to better capture the management of GHG emissions and to provide higher precision. In Tunisia, a developing country, to the best of our knowledge, there is no study carried out on the quantification of GHGs issued from the different livestock species. Therefore, the objective of our study was to calculate the GHG emissions, mainly CH4 and N2O, from the Tunisian livestock sector, estimating the emissions from each farm animal species (ruminants, camelids, equines, and poultry) using the Tier 1 and Tier 2 (when feasible) methods of the 2006 IPCC guidelines. The study used data from eleven consecutive years (2008–2018) in order to examine the trend in GHG emissions from livestock over this period. This would be the first comprehensive and differentiated assessment of emissions in the country, and may be a fundamental and initial step firstly to evaluate the reliability of the estimations and to identify the gaps in the assumptions made and the limitations in the calculations, aiming at refining the approaches used to improve the accuracy of such estimations. Secondly, once more reliable estimations are available, in the medium term, it could be possible to make decisions on the proposal of mitigation and adaptation strategies that could be implemented to reduce the environmental impact of GHG emissions.

2. Material and Methods

It is pertinent to mention that GHG emissions were estimated from the total domestic livestock species annually present in the whole country, irrespectively of region localization, climatic conditions, and production system.

2.1. Country Geographic Situation and Climatic Data

Tunisia is a North African country covering an area of 164,000 km2 with 1300 km of coastline on the Mediterranean Sea and about 11 million inhabitants in 2014. The country is located between longitudes 7° and 12° east and latitudes 32° and 38° north. The relatively high latitude of Tunisia within Africa and its geographical stretch from South to North conferred to the country the following climatic zones: humid to sub-humid in the extreme north; sub-humid to semi-arid in the northwest and the Cap Bon region; and semi-arid to arid in central Tunisia and desert in the south. Consequently, temperatures vary widely between regions. In the northern coastal region, average temperatures range from a minimum of 10 °C in the winter months (i.e., December–February) to a maximum of 27 °C in the summer months (i.e., June–August), while in the central-western and southern regions, temperatures range from 11 °C (in winter) to 32 °C (in summer). Thus, Tunisia is considered one of the most exposed countries to climate change in the Mediterranean area [12]. It faces risks associated with temperature increases, reduced precipitation, rising sea levels, and more frequent extreme weather phenomena (floods and droughts). During the last 30 years, the temperature has increased by an average of 0.4 °C per decade and, during the same period, the average annual precipitation has decreased by about 3%.

2.2. Estimation of Animal Population and GHG Emissions

For the livestock production sector, activity data present the head numbers of the different species/category of domestic livestock in Tunisia based on data provided by the Ministry of agriculture [4]. We identified the following species: cattle (dairy and non-dairy cattle), sheep, goats, camelids, equines (horses, mules and donkeys), and poultry.
Estimation of the average annual population (AAPT) corresponding to each animal species/category T was determined by the following equation:
AAP T = NDA T 365 × NAPA T
where NDAT is the number of days alive and NAPAT is the number of animals produced annually of each species/category T.

2.2.1. Methane (CH4) Emissions

Estimation of CH4 emissions derived from enteric fermentation was based on the multiplication of numbers of livestock heads by the corresponding emission factors (EFs) provided by IPCC 2006 [11]. In our present study, estimation was carried out only at the Tier 1 level as there are a lack of advanced data to implement a specific Tier 2 methodology. The Tier 1 method can be applied for the livestock, except for cattle, where data issued from East Europe (dairy cows) and Latin America (other cows) were used. The general equation for estimating livestock methane emissions is as follows:
CH 4 = T E F T × N T 10 6
where CH4 is the emission of methane (Gg CH4.year−1) for a defined population, EF(T) is the emission factor for animal species/category T (kg CH4.head−1.year−1), and N(T) is the number of heads of livestock species/category T (AAPT from Equation (1)). Equation (2) was applied to calculate the annual CH4 emission derived either from enteric fermentation or from manure management. Emission factors used to calculate CH4 from enteric fermentation (EFenteric) for sheep, goats, equines (horses, donkeys, and mules), and camelids correspond to those proposed by IPCC [11] for developing countries (Table 1).
However, EF used to estimate CH4 emissions related to manure management of animals (EFmanure) was calculated following the Tier 2 method using Equation (3), and corresponding values are presented in Table 1:
E F T = V S T × 365 × B O T × 0.67 × S , k M C F S , k 100 × M S T , S , k
where EF(T) is the emission factor of CH4 from manure management of animal category/species T (kg CH4.head−1.year−1); VS(T) is the daily amount of volatile solids excreted per animal of category T (kg dry matter.animal−1.day−1); 365 days per year−1 (the basis for calculating VS annual production); BO(T) is the maximum capacity of CH4 production from manure produced by animal category T (m3 CH4. kg−1 VS excreted); 0.67 kg m3 is a conversion factor of m3 CH4 to kg CH4; MCF(S,k) is the methane conversion factor (%) for each manure management system S in the climatic region k; and MS(T,S,k) is the fraction (%) of total manure from each animal category T handled using manure management system S in the climatic region k. The value for factor MCF(S,k) was 1.5%, as proposed by IPCC [11], for regions where the average annual temperature is 24 °C and excretions of animals waste on pastures are not managed.

2.2.2. N2O Emissions from the Manure Management

Nitrous oxide is either produced directly in manure by nitrification and denitrification processes, indirectly by nitrogen volatilization as ammonia and further deposition, and by manure nitrogen lixiviation. N2O emissions were calculated according to the IPCC Guidelines [11] as follows:

Direct N2O Emissions from the Manure Management (N2OD (MM))

Direct N2O emissions from manure management (N2OD(mm)) were calculated according to the following equation:
N 2 O D m m = S T N T × N e x T × M S T , S × E F S × 44 28
where N(T) is the number of animals of species/category T (AAPT from Equation (1)); MS(T,S) is the fraction of total annual nitrogen excretion for each animal species/category T that was processed with manure management system S (dimensionless, as proposed by [11], these values for each animal category were assumed to be equal to the fraction of manure from a livestock category with the manure management system in a climatic region (MS(T,S,k)) already provided in Table 1); and Nex(T) is the annual average nitrogen excretion per head of animal species/ category T (kg N.head−1.year−1), calculated as follows:
N e x T = N r a t e T × T A M 1000 × 365
where Nrate(T) is the default nitrogen excretion rate (kg N.(1000 kg animal mass)−1.day−1), and TAM is the typical animal mass for animal category T. Both values are provided in the IPCC 2006 Guidelines [11]. The values of the Nex(T) for animals in developing countries are listed in Table 2. EF(S) is the default emission factor for direct N2O emissions from manure management system S (Table 2); 44/28 is the conversion of N2O-N emissions to N2O emissions.
Indirect N2O Emissions due to N Volatilization during Manure Management (N2OM (MMS))
N 2 O G m m = N v o l a t i l i s a t i o n M M S × E F M M S × 44 28
where N2OG(mm) is the indirect N2O emission due to N volatilization during manure management in kg N2O.year−1, EFMMS is the default emission factor for indirect N2O due to N volatilization during manure management from manure management system S (the corresponding default emission factor value is 0.01), and Nvolatilization–MMS is the N losses due to volatilization during manure management in system S and determined according to Equation (7), and values are given in Table 2:
N v o l a t i l i s a t i o n M M S = S T N T × N e x T × M S T , S × F r a c G a s M S 100 T , S
where FracGasMS is the percentage (%) of manure nitrogen for animal species/category T, which volatilizes as NH3 and NOx in manure management system S.

2.3. Calculation

The national inventory of Tunisian greenhouse gas emissions/removals was conducted in accordance with IPCC 2006 Guidelines [11] and covered all the direct gases listed by these guidelines. It also included indirect gases, referenced in EMEP (European Monitoring and Evaluation Programme)/EEA (European Environment Agency) air pollutant emission inventory guidebook.
The emissions are presented in original units (Gigagrams, Gg) for all direct and indirect gases, but are also expressed in Gg CO2 equivalent (Gg CO2e), for all direct gases, by converting these direct gases according to their global warming potential (GWP). The GWPs used for direct GHGs in inventory development are assumed to be 25 for CH4 and 298 for N2O [13].

3. Results

3.1. Livestock Population Distribution

Analysis of recent surveys along the studied period (2008–2018) indicates a large diversity in the composition of the national livestock population (Table 3). Poultry accounts for more than 20 million heads in 2018, mainly from broilers (50%). For the remaining population categories, sheep are the most dominant species, with an average of 6.5 million, followed by 1.2 million goats, 401 thousand dairy cattle, and 234 thousand other cattle in 2018. Camelids and equines (horses, donkeys, and mules) represent 214 thousand (2018). It is pertinent to also mention that, within cattle species, dairy cattle are the most dominant and account for 65%.
Except for poultry, the total numbers of all animal categories have generally followed a slight decrease ranging between 11% (dairy cattle and sheep), 21% (other cattle), and 20% (goats) from 2008 to 2018. During the same period, poultry recorded an increase of about 34%.

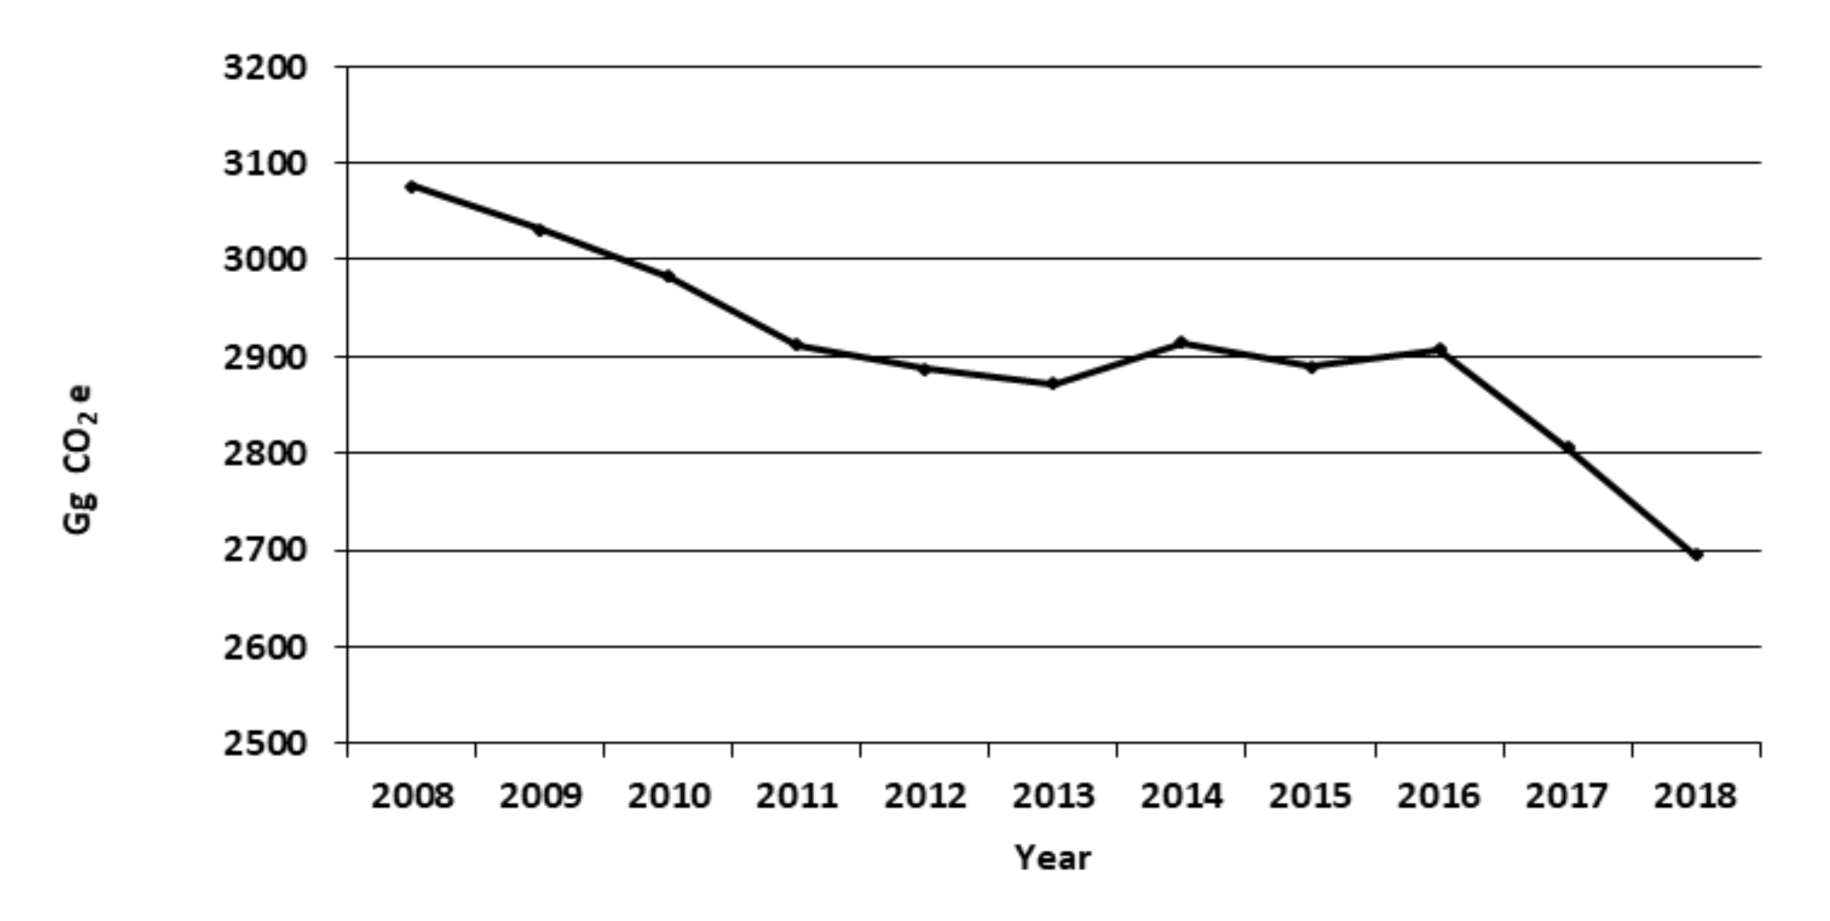
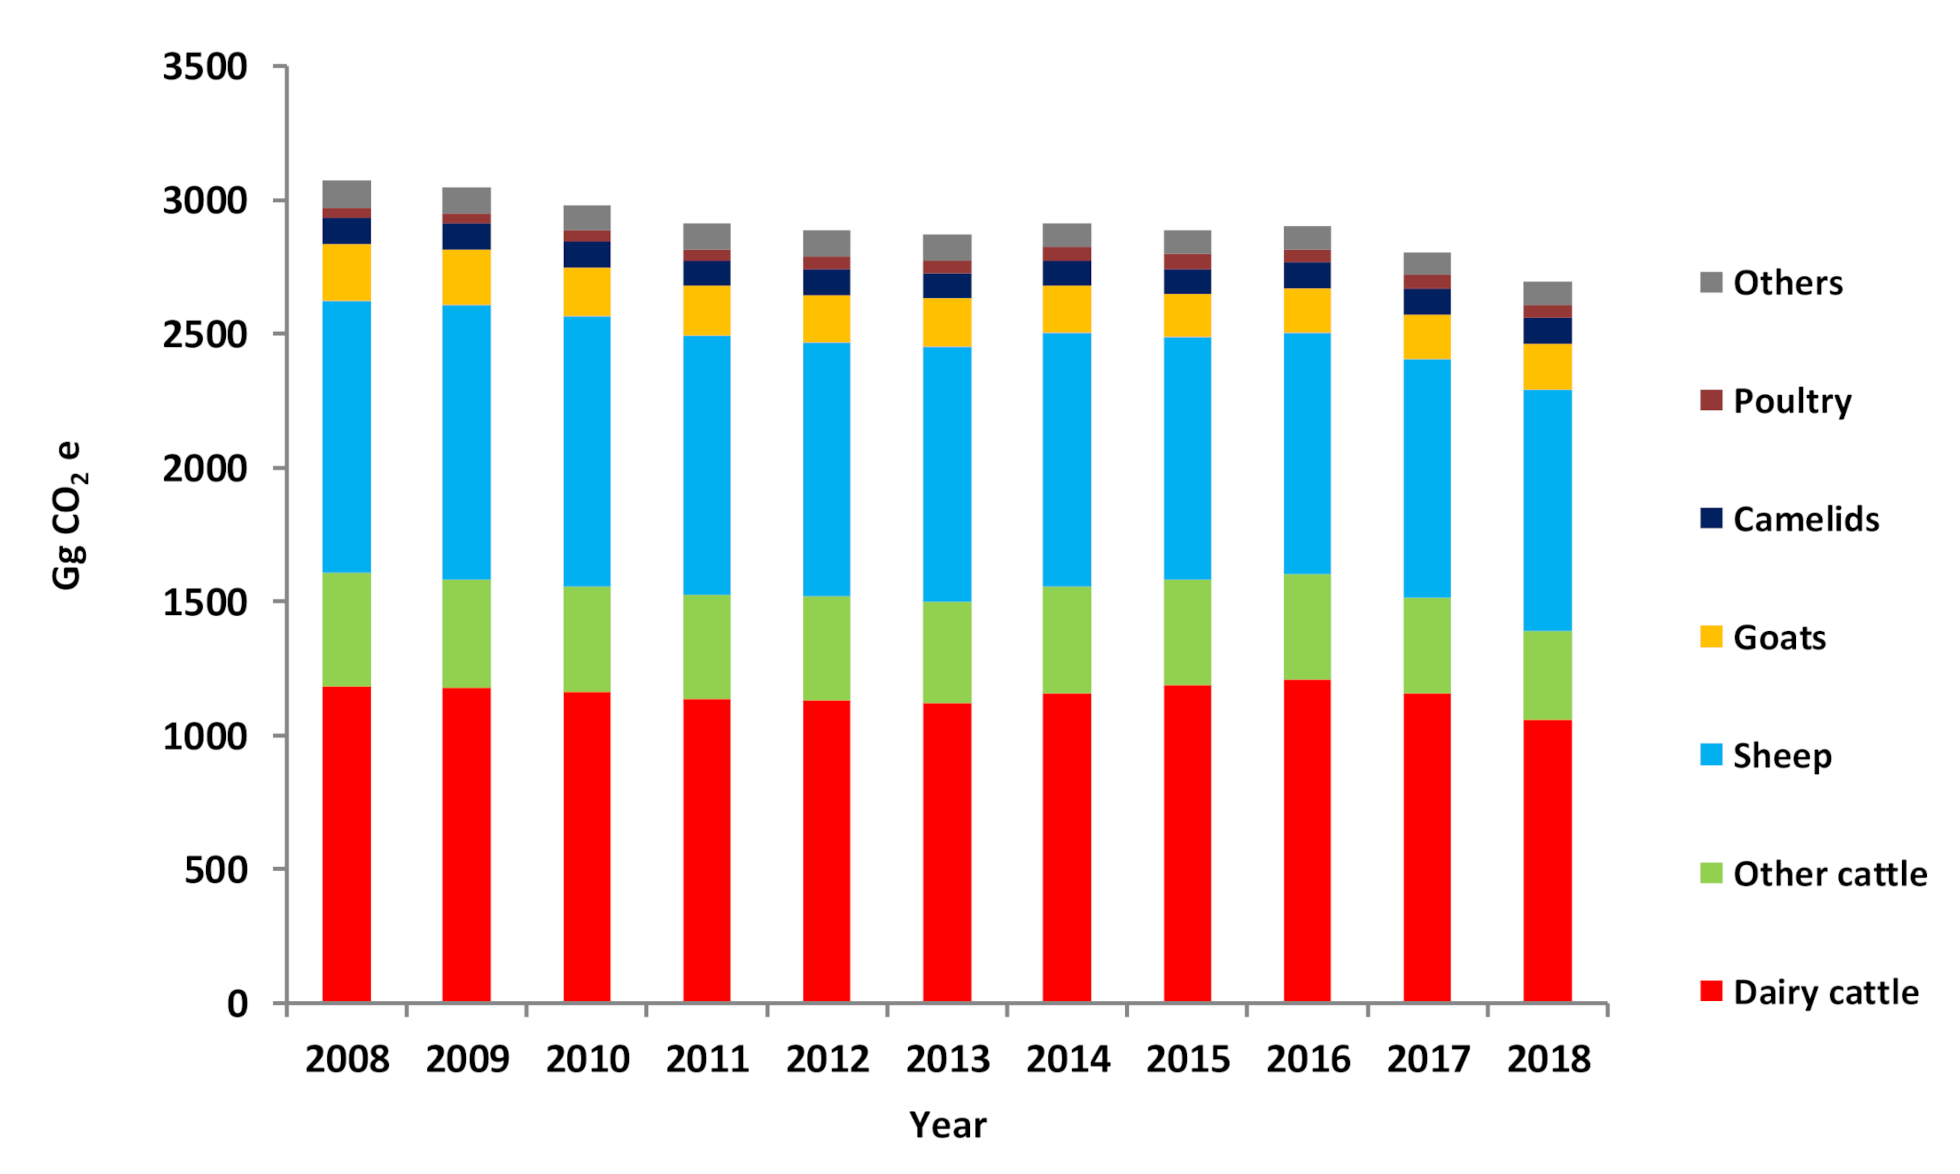
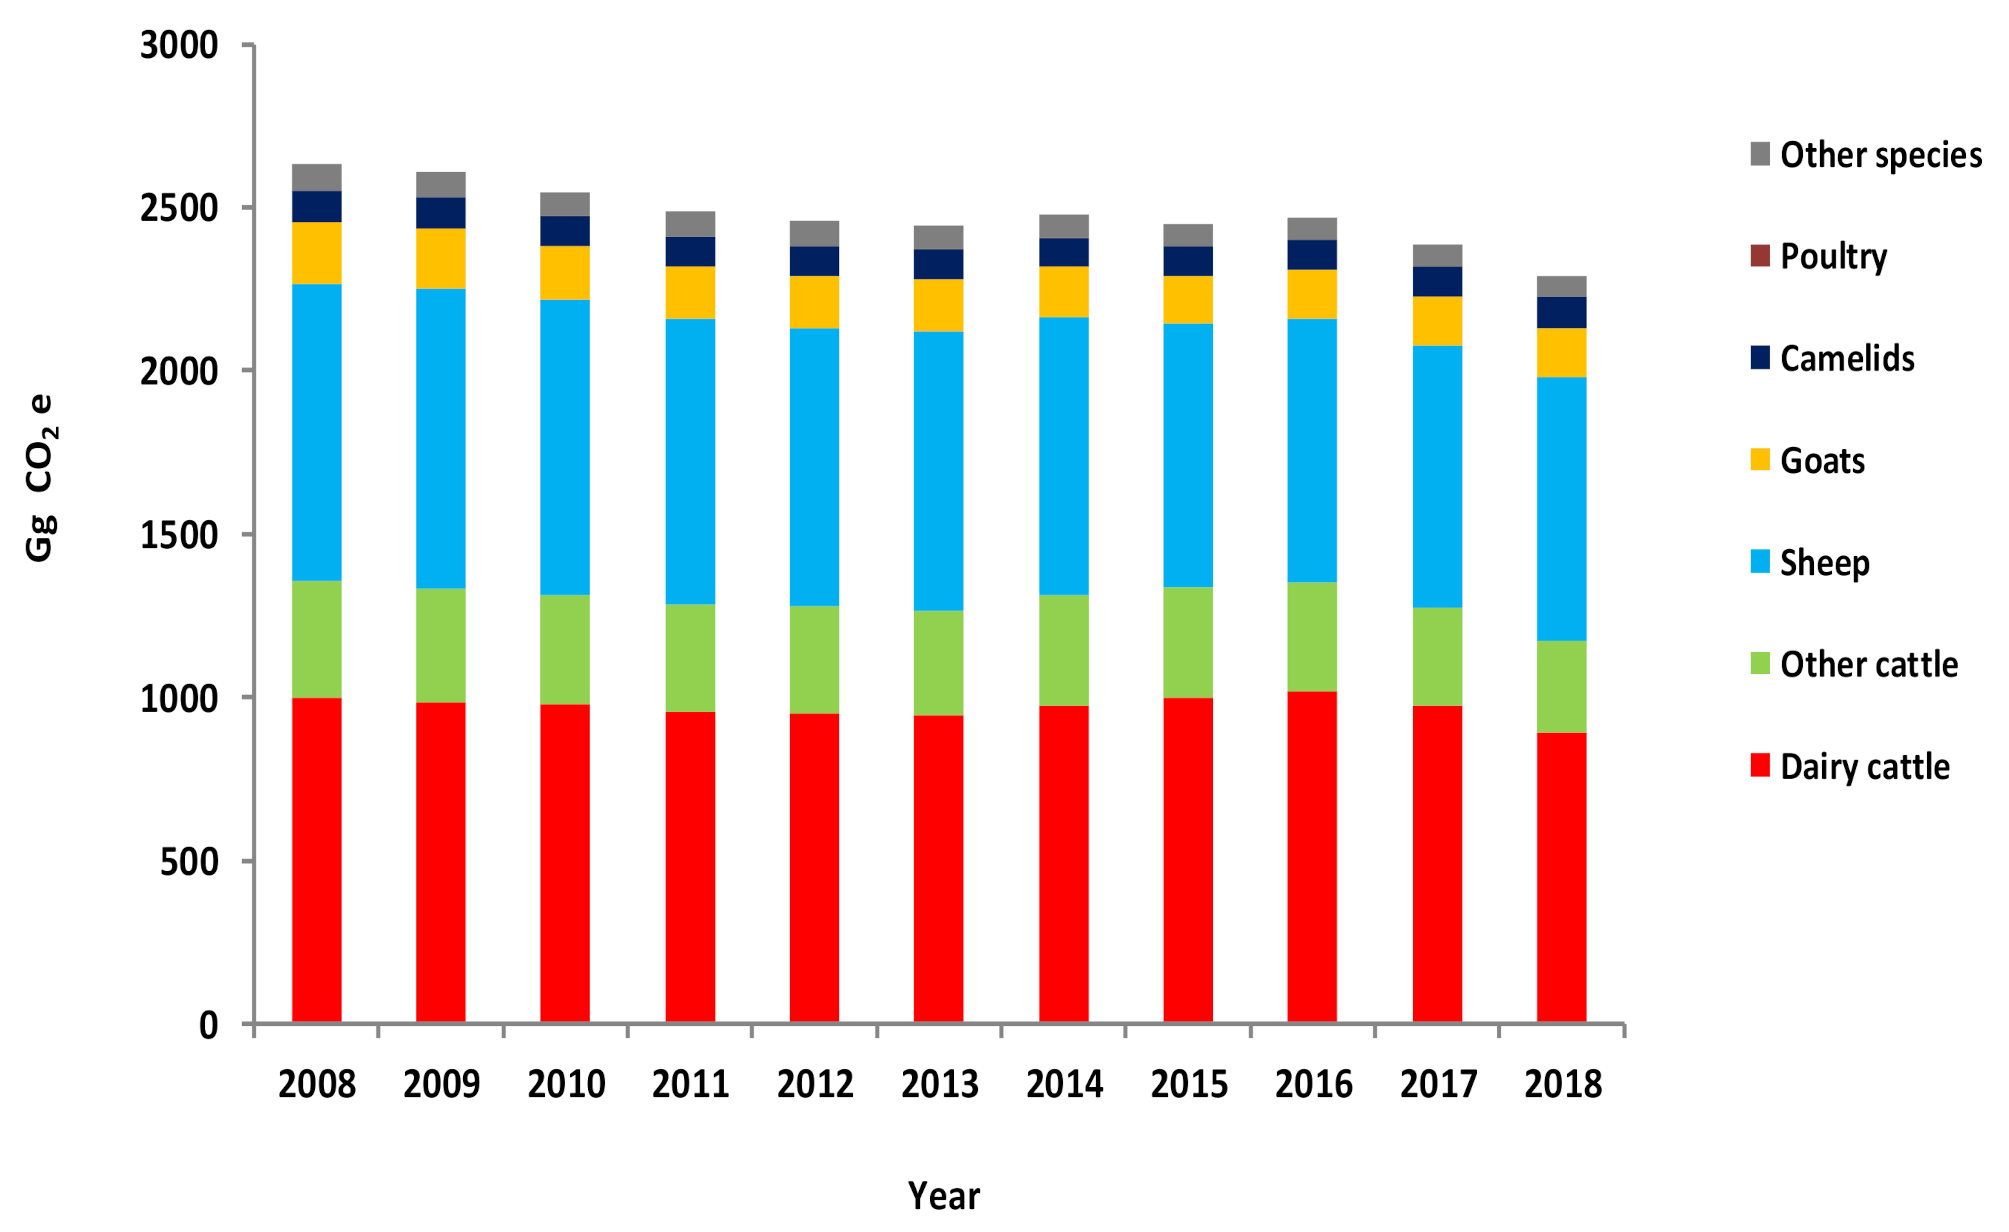
3.2. Total Greenhouse Gas Emissions (GHGs)

As depicted in Figure 1, total GHG emissions from Tunisian livestock decreased from 3076 Gg (CO2e) in 2008 to 2695 Gg (CO2e) in 2018. A continuous decrease was observed from 2008 to 2013 (6.6%) and from 2016 to 2018 (7.3%).
More than 50% of the total GHG emissions were from cattle (Figure 2), followed by sheep (32%), goats (7%), camelids (3%), others (3%), and poultry (1%).

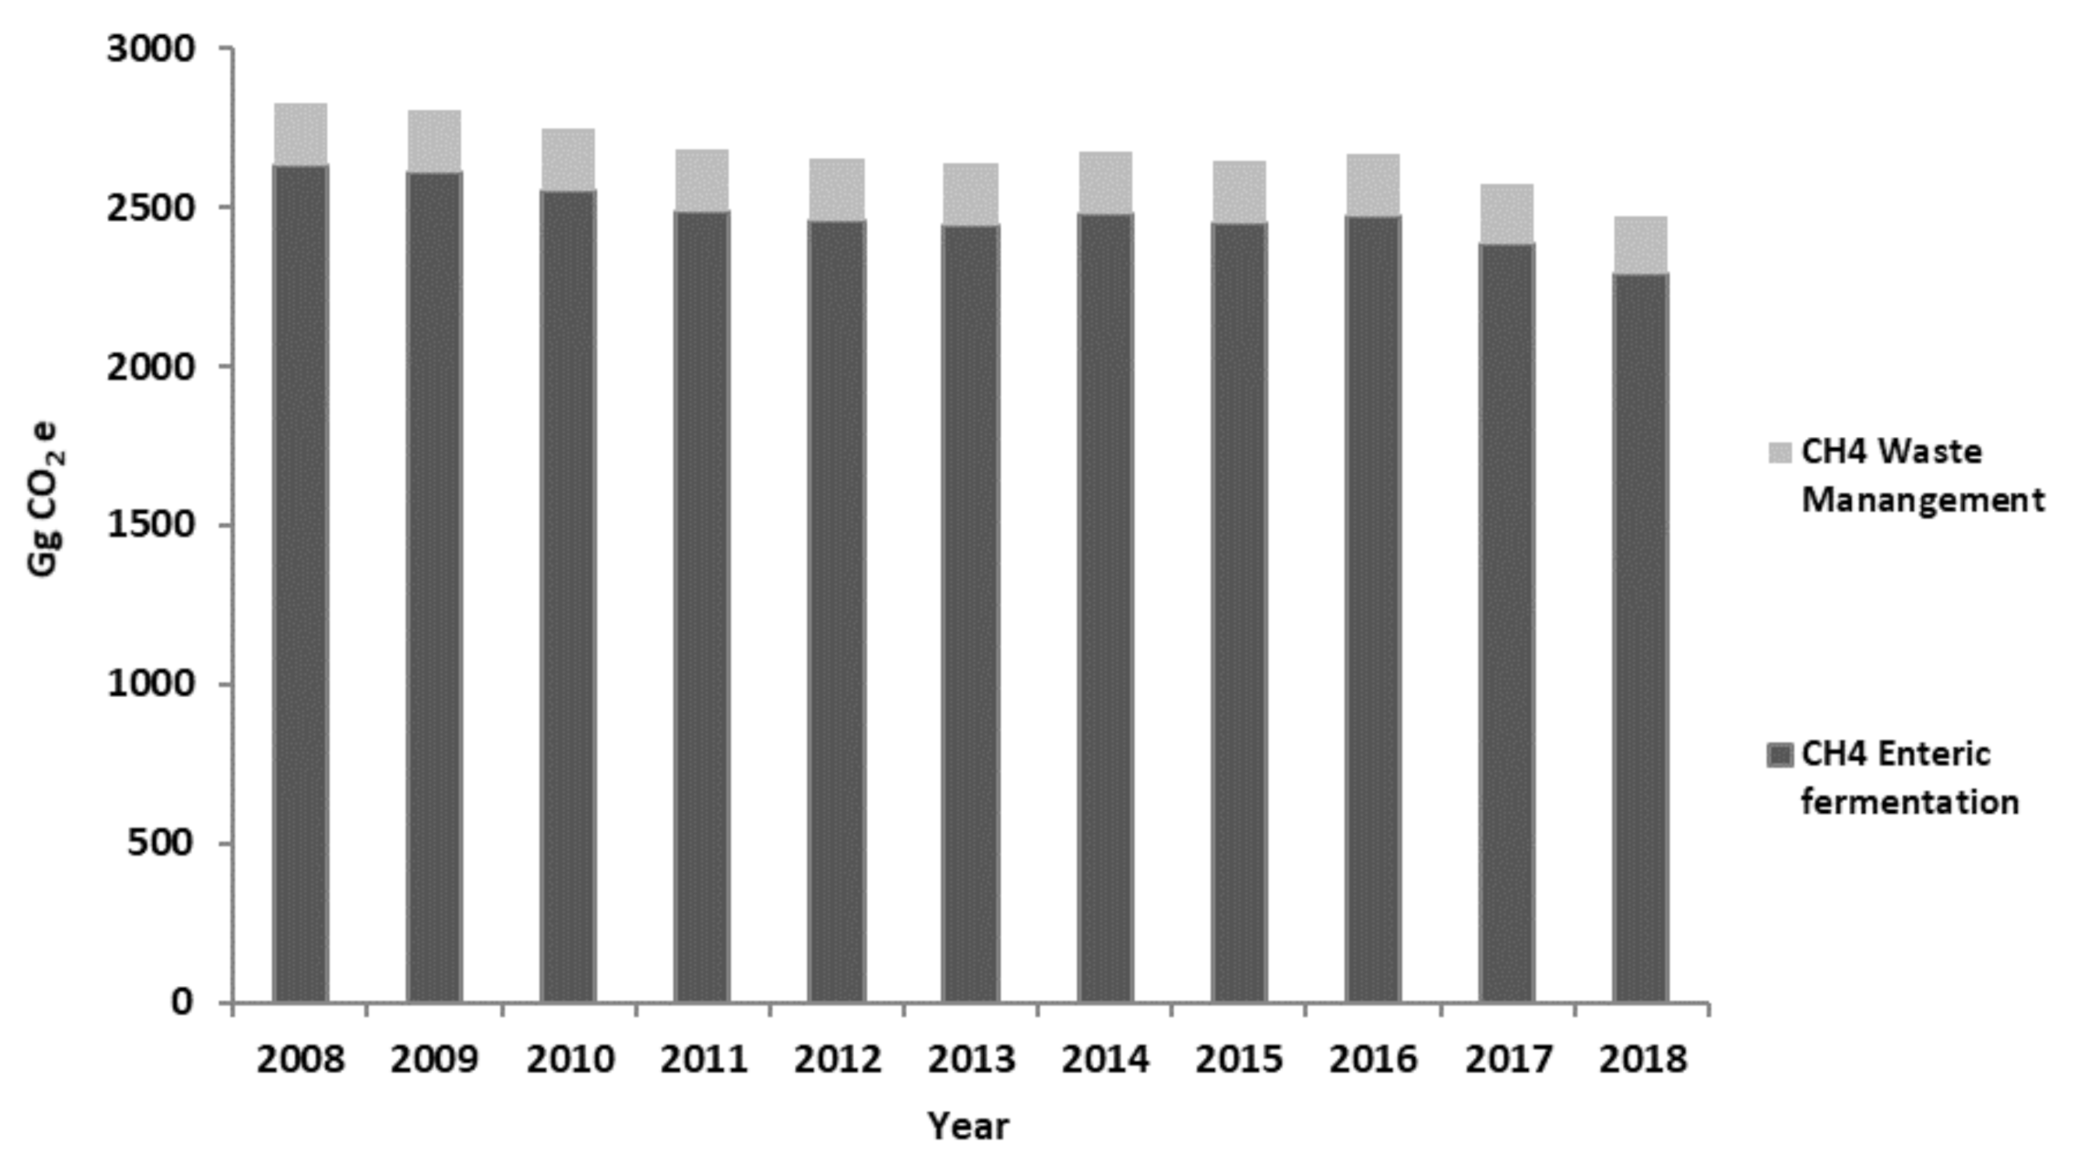
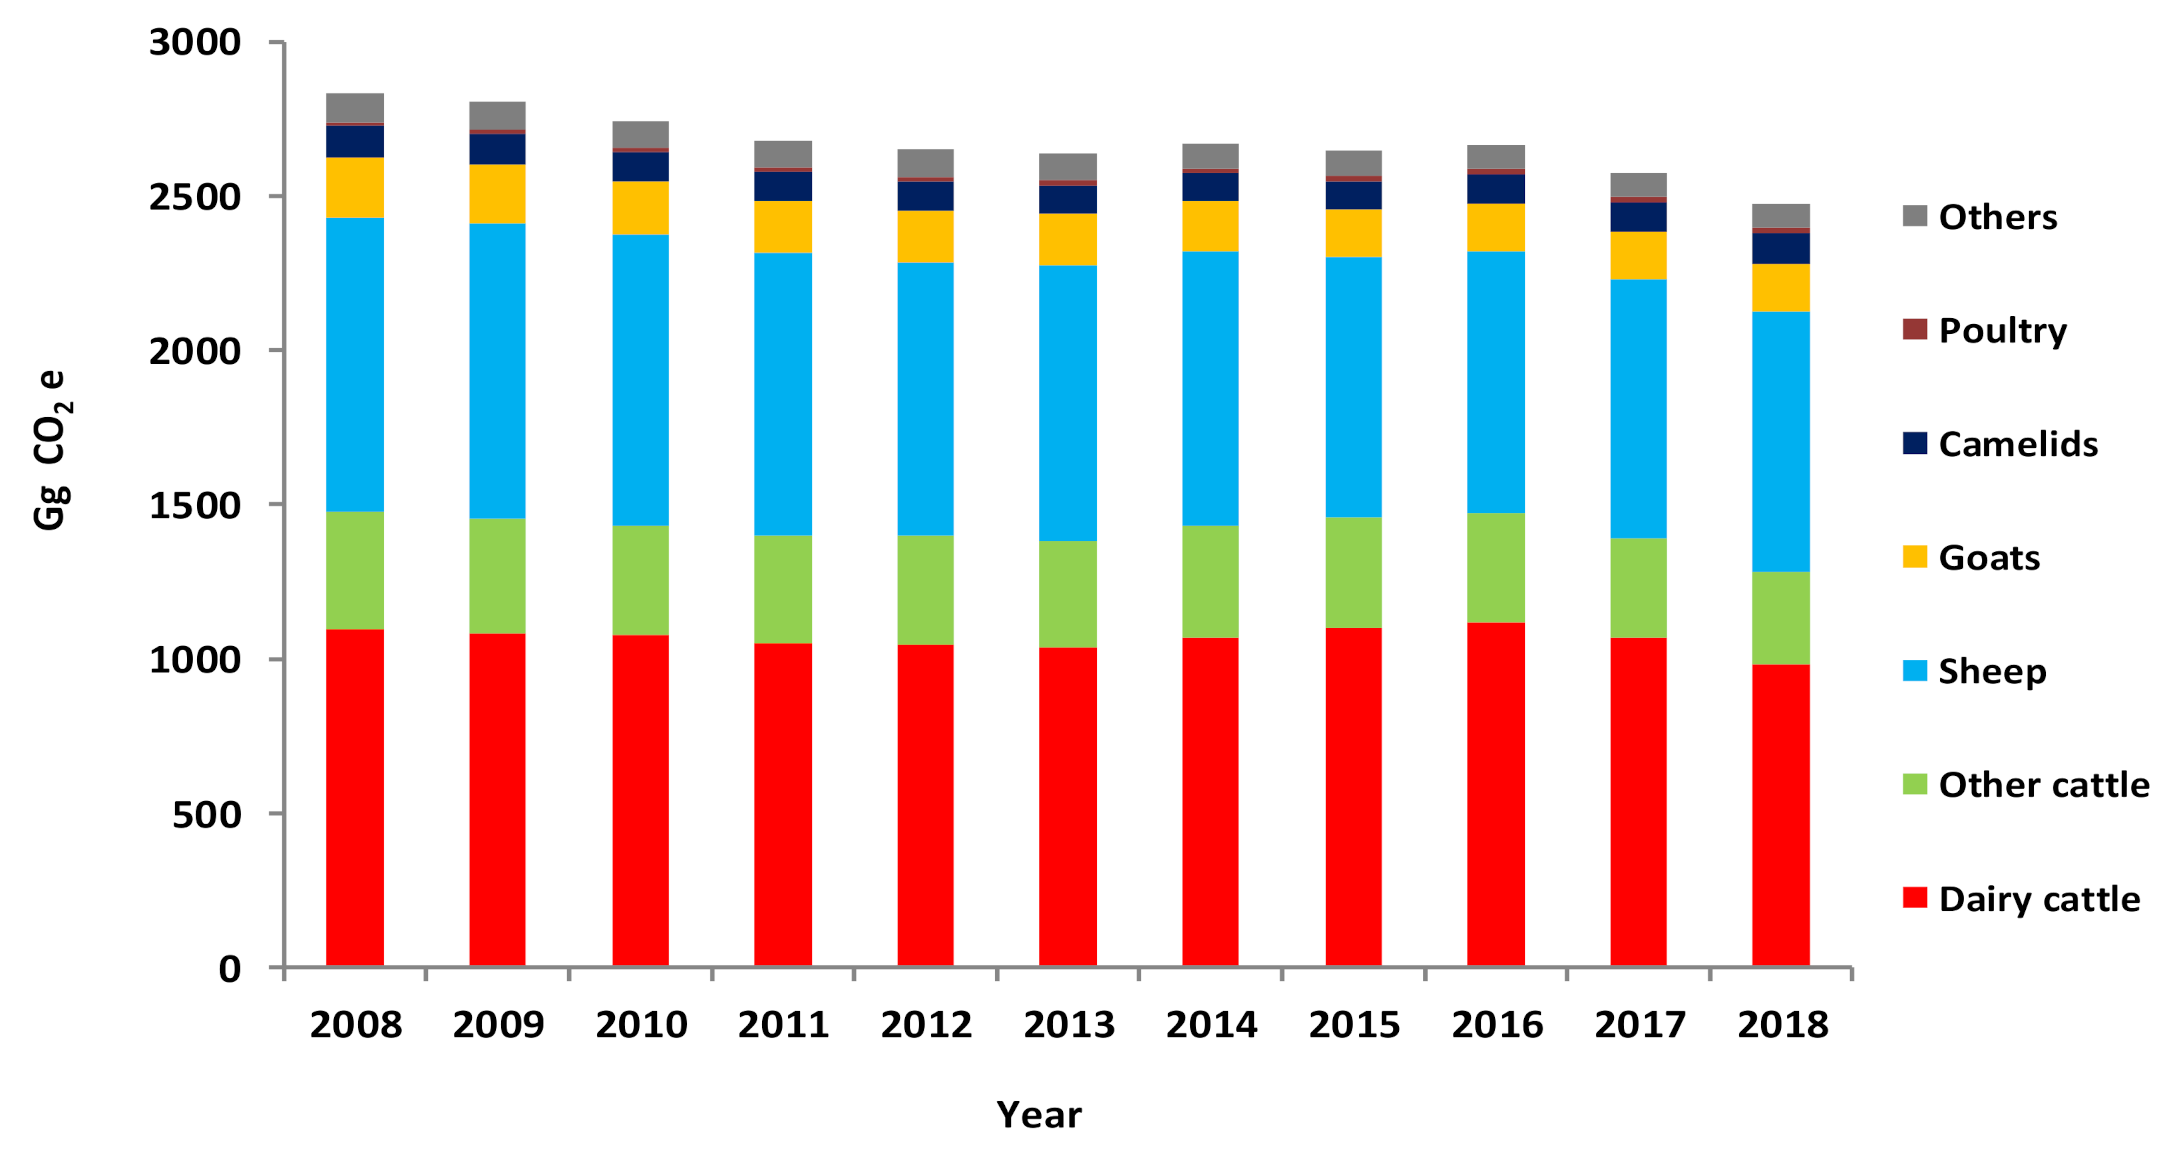
3.3. Methane Emissions

Figure 3 shows the estimated CH4 emissions from Tunisian livestock farming. CH4 represents about 92% of the total GHGs. Total CH4 emissions in 2008 were 113 Gg, or 2832 CO2e (Figure 3) as determined using GWP for a 100-year time horizon from IPCC 2006 [11]. A steady decrease in total CH4 emissions was observed from 2008 onwards, so that emissions in 2018 were 13% lower than those estimated in 2008, mainly due to the decrease in CH4 from enteric fermentation (Figure 3). It is worth mentioning that about 85% of the total CH4 produced comes from enteric fermentation.
Cattle (dairy and others) and small ruminants (sheep and goats) are the first animal species producers of CH4, participating with more than 52% and 40% of the total CH4 emissions, respectively (Figure 4); these were followed by camelids and equines (horses, donkeys, and mules), which participated with less than 1% from the total CH4 emissions. CH4 emissions from poultry are considered negligible.
The same ranking was observed in CH4 derived from the enteric fermentation (Figure 5), as it represents the largest part of GHG emissions. The CH4 emissions are estimated at 78, 46, 5, and 5 kg CH4.head−1.year−1 for cattle, sheep, goats, and camelids, respectively.

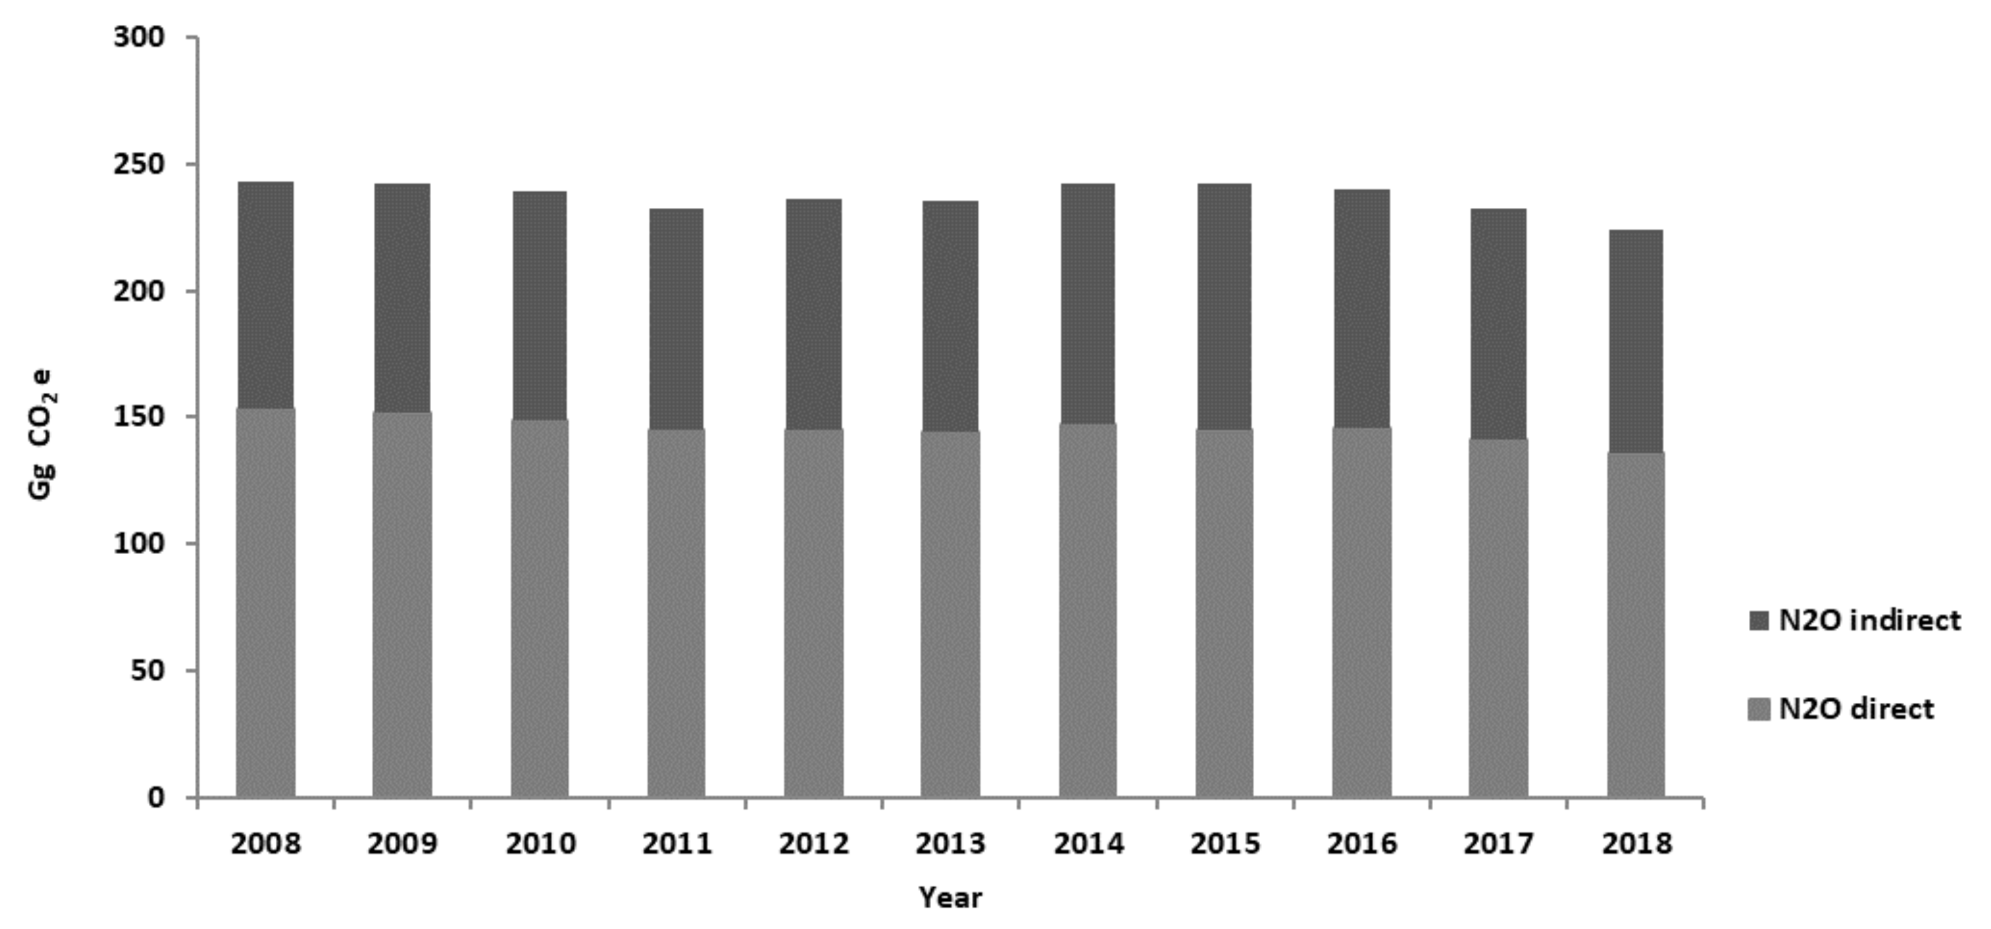
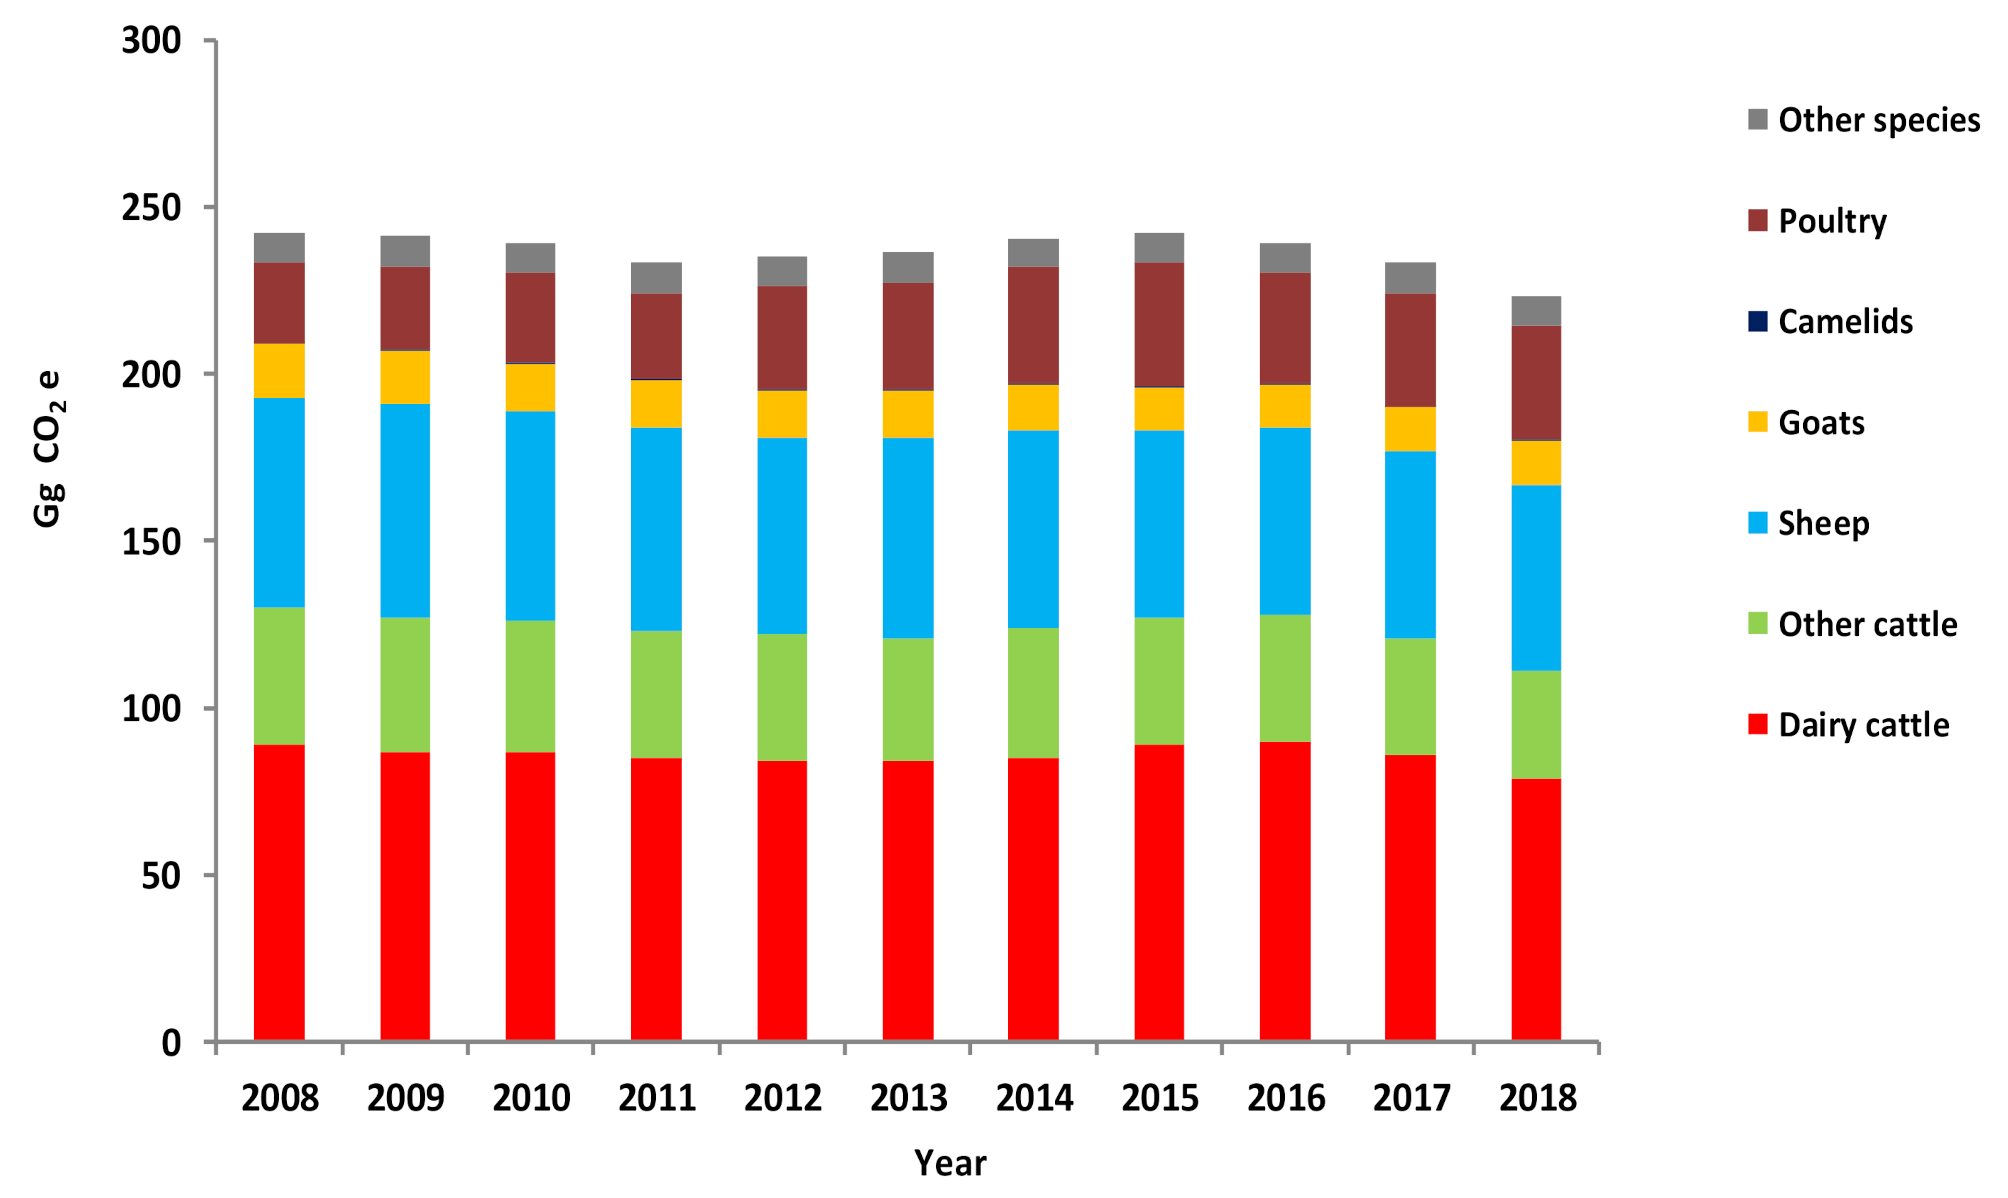
3.4. Nitrous Emissions

Total nitrous emissions (direct and indirect N2O) were low (<250 Gg CO2e) and rather invariable within a narrow range during the studied period (Figure 6). They represent about 8% of the total GHG. Moreover, direct N2O emissions from manure represent about 60% of the total nitrous emissions.
Cattle (dairy and others) contribute with more than 50% of the total N2O emissions (Figure 7), followed by small ruminants (>30%), poultry (>10%), and other species (<4%).

4. Discussions

4.1. Total GHG Emissions from Tunisian Livestock

It is well established that livestock production contributes up to 14.5% of the world’s annual anthropogenic GHG emissions [14,15]. From the calculations used in our study, it can be estimated that livestock emissions would contribute to 37% of the total CH4 and to 10% of the total N2O emissions reported in the last inventory of gross and net GHG emissions in Tunisia in 2012 [8,9]. Our estimations show some inconsistencies with the Tunisian 2012 GHG inventory [8,9], because these values unrealistically represent 100% and 12% of the CH4 and N2O emissions attributed to Tunisian AFOLU in 2012 [8,9], indicating that our CH4 emissions may be overestimated and N2O emissions underestimated when compared with the values communicated in 2012. It may be too speculative to conclude which values reflect reality more accurately, and the inconsistency should be interpreted considering the most likely different methods used for the estimations (not described in the 2012 inventory). Nevertheless, it seems clear that livestock is a main contributor to CH4 and a minor contributor to N2O total and AFOLU emissions in Tunisia.
GHG emissions derived from Tunisian livestock varied slightly, decreasing from 3076 to 2695 Gg CO2e during the studied period (2008–2018). A continuous decrease of about 7% was noted between 2008–2013 and 2015–2018. This trend was expected as the size of the animal stock decreased in the same period (Table 3). Therefore, this declining trend has to be interpreted carefully because GHG emissions were based exclusively on the average annual population of each animal category, and other factors may influence the volume of the emissions. As animal production systems become more intensive, the animal numbers are decreased, but the feed intake and the amount of product obtained per head are increased, so it can be expected that the volume of gas emitted per animals will also be also increased. Therefore, the emission factors should be adjusted, introducing the likely impact on the total estimations of the weight of intensification of animal production on individual gas emissions.
Data reported from other countries show that emissions are directly related to the total livestock stock and agricultural production systems, thus emissions of 24,700 Gg CO2e have been estimated in India [16], of 13,046 Gg CO2e in Algeria [17], and of 12,000 Gg CO2e in Vietnam [18]. The estimations also depend on the IPCC emission factors applied for each animal species in each studied country. It is also pertinent to mention that GWP of CH4 and N2O over one 100-year time horizon differs between the IPCC 1997 [19], IPCC 2013 [20], and UNFCCC [13]. In our study, IPCC 2006 [11] was followed as it is most commonly used in the literature for estimating livestock GHG emissions. The warming potential of CH4 was 25 CO2e, while N2O was 298 CO2e. These GWPs are lower than those considered by the latest IPCC 2013 [20], of 34 CO2e for CH4 and 310 CO2e for N2O. The UNFCCC [13] stated that CH4 emissions have a GWP of 21 CO2e and N2O of 310 CO2e over a 100-year time horizon.
Moreover, a detailed analysis of our estimations in Tunisia indicates a mosaic in livestock composition, and it is expected that GHG emissions would show a large variability between animal species (Figure 2). Among categories, poultry followed by sheep and goats were the species with the higher number of individuals. Even though, cattle (dairy and other categories) are the highest contributors (>50%) to GHG emissions (as expected considering the mass per animal, the number of animals in the country, and their rumination CH4 emissions), followed by sheep (32%), goats (7%), camelids (7%), equines (horses, donkeys, and mules; 7%), and poultry (<2%). In line with our results, Gerber et al. [14] reported that beef and dairy cattle, accounting for 65% of the total livestock, are the species that produce the highest GHG emissions. Chhabra et al. [16] found that bovine (cattle and buffaloes) are the predominant contributors with 91% of GHG emissions in India, owing to their huge population in this country, followed by sheep, goats, and others. Likewise, a study conducted in Indonesia [21] reported that cattle are the major contributors to GHG emissions during the 2005–2015 period. However, a study published by Sallaye [17] in Algeria revealed that sheep were the first contributors to GHG emissions in that country, followed by dairy cattle, goats, and camelids. This could be due to the large population of Algerian sheep as compared with the other animal species.
Emission factors are a very critical element to the accuracy of the estimations in the calculations of emission per animal and could explain some of the variation among results reported in the literature. As compared with other animal species, the relatively high emissions derived from cattle, sheep, and goats could be explained by the prevalence of CH4 emissions from ruminal microbial fermentation, the imbalanced rations coupled with the low nutritive value of the feed available, as well as the lower efficiency and productivity of these animals in developing countries as compared with non-ruminants. This may be, probably, due to an excessive loss of nutrients, energy, and organic matter [11]. Therefore, GHG emissions from livestock farming seem to also be dependent on some external factors such as feeding practices, housing systems, and manure management systems [14,15,18]. In this context, it is suggested that, in order to obtain more accurate emissions’ estimations, there is an urgent need to get a characterization of each animal species, livestock production system, data on the feed and ration composition for each animal species, and proportions of produced manure in each management system. Actually, these data are not currently well documented for emissions’ inventory purposes in Tunisia. Improving the quantity and quality of databases and research related to livestock farming would be a useful tool to enhance emissions’ monitoring in the livestock sector.

4.2. Methane Emissions

For ruminants, methanogenesis in the rumen is an essential metabolic process to maintain a steady state of fermentation as it scavenges the molecular hydrogen generated mainly during the carbohydrate fermentation process. CH4 is a natural by-product of the ruminant digestion process, acting as a hydrogen sink. Ruminal methanogenesis is influenced by animal species, age, management, and mainly by the quality and quantity of feedstuffs administered to the animals. The CH4 production resulting from enteric fermentation contributes about 20% of the total global CH4 [15,22]. It is well established that the countries with the highest contribution of CH4 emissions related to livestock production are India, China, Brazil, and the United States [23,24,25].
In our study, GHG emissions from Tunisian livestock were mainly as CH4 (92%) as compared with N2O (8%) (Figure 3). Chhabra et al. [16] reported total GHG emissions from Indian livestock of about 247,200 Gg CO2e, with CH4 representing 99.8% and N2O emissions only 0.2%. Similarly, Moeletsi et al. [26] reported a high contribution (>90%) of CH4 emissions versus N2O (10%) from the South African livestock. The relative contribution of each gas to the total emissions may differ slightly owing to differences among countries in the livestock numbers or in the farming and manure management practices and, therefore, in the emission factors used in each case. In this study, dairy cattle were the highest contributors to total CH4 production (40%), followed by sheep (34%), other cattle (13%), goats (7%), and camelids (4%). However, a study on Algerian livestock’s GHG emissions [17] reported that sheep, the most important livestock in that country, were the highest contributors of CH4 produced from enteric fermentation (53%), followed by dairy cattle (29%), goats (9%), and camelids (6%). The amount of CH4 emissions depends not only on the number of animals of each species, but also on other factors such as ruminant breed, type of production (dairy or meat), diet quality influencing ruminal microbiota and fermentation processes [15,27], and production systems and regional characteristics (e.g., climate and landscape) [11]. In this context, Food and Agriculture Organization (FAO) [28] reported that confined systems would increase CO2 emissions because of greater fossil fuel use and relatively less use of solar energy. In Tunisia, 40% of total milk, 20% of red meat (mostly cattle), and more than 80% of white meat and eggs (poultry) are produced in intensive systems. Moreover, higher individual CH4 emissions were recorded in cattle (78 kg.year−1.head−1), followed by camelids (46 kg.year−1.head−1), equines (horses, donkeys, and mules: 16 kg.head−1.year−1), sheep (5 kg. head−1.year−1), and goats (5 kg. head−1.year−1). Lower emissions were recorded in developed countries [29], where the average individual CH4 emissions were reported to be 55, 50, 8, and 5 kg.head−1.year−1 for cows, buffalo, sheep, and goats, respectively. Negligible emissions of CH4 (0.4%) are expected from poultry, being generated mostly from manure management. In Africa, it is estimated that CH4 emissions will increase by about 42% in 2030 (11,100 Gg of CH4.year−1) as compared with production in 2000 (7800 Gg of CH4. year−1). This is related to the expected increase in the livestock population owing to the increasing demand for foods of animal origin. If such a positive correlation between livestock population and CH4 emissions follows continuously, it would be expected that global CH4 emissions would increase by 60% by 2030 [30]. Reports from FAO [28,31] have revealed that, worldwide, enteric fermentation and manure storage emissions have been increasing for the main livestock species. Nevertheless, the adoption of suitable feeding practices and comprehensive manure and nutrients’ management could significantly reduce methane emissions [32,33].
During the animal digestive process, the enteric fermentation converts the ingested feed into digestible feed and releases CH4 through belching [24,34]. Therefore, this end product is considered as an energy loss [15,22] and represents the second-largest source of emissions (39% in the total GHG) after feed production and processing, followed by manure storage (10% of the total GHG) and processing and transportation of animal products (6%). In our study, enteric fermentation accounted for 85% of the total CH4 emissions, predominately generated from cattle and sheep. These emissions could be reduced if feed composition, feed intake, and feed energy content are modified [35,36] by formulating rations that are more balanced or using feed additives. In line with these suggestions, Dourmad et al. [37] and Yan et al. [38] suggested that increasing the feed energy value could reduce methane emissions.
Contrary to the high contribution from enteric fermentation, manure management accounted only for 7% of total GHGs and 15% of total CH4 livestock emissions, ranging from 181 to 200 Gg CO2e during the studied period (2008–2018). Similar importance of enteric fermentation was observed earlier on Indian [16] and Algerian [17] livestock. The results reported on GHG production from Vietnam’s livestock [18] revealed that CH4 emissions from enteric fermentation and manure management were at the same order of magnitude.
On the other hand, it is pertinent to note that bovines, particularly dairy cattle, contributed the bulk of the methane emission from enteric fermentation (52%), followed by sheep (35%), goats (6%), and camelids (3%). The main reason for the highest emissions issued from cattle, mainly dairy cattle, recorded in our present study is attributed to the high population of this species coupled with a relatively high EF used (89 kg.head−1.year−1 for dairy cattle and 63 kg.head−1.year−1 for non-dairy cattle). Truong et al. [18] noted a large contribution of cattle CH4 from enteric fermentation. Moeletsi et al. [26] found that, in South Africa, methane from enteric fermentation in dairy cattle contributed less to the total methane emission than non-dairy cattle and sheep. It appears, therefore, that EF is a critical element to the accuracy of estimations in emissions’ inventory.
Patra [39] and Moeletsi et al. [26] estimated enteric CH4 emissions using Tier 1 methodology in India and South Africa, respectively, and obtained rates of animal contributions that are widely different from those reported in the current study. Such differences could be due to the animal species and herd composition, and the approach followed for the calculation. In this context, Moeletsi et al. [26] reported that, as compared with Tier 1 methodology, utilization of country-specific emission factors gave rise to an increase of total CH4 emissions from enteric fermentation by about 37%. It appears, therefore, that the uncertainty in the Tier 1 method is high [40]. This would be expected if we bear in mind that the emission factors are not based on country-specific conditions, and the activity data used in this approach include data from non-intensive agricultural countries [6,40]. However, in developed countries, the IPCC default values can overestimate emissions of some sections of the livestock population [40,41]. Considering these variations and discrepancies, IPCC has encouraged the derivation and use of specific-for-purpose emission factors to provide more accurate estimations of the emissions from each country [41].

4.3. Nitrous Oxide Emissions

Besides methane, Tunisian livestock also contributed a small amount of annual N2O emissions, ranging between 224 (2008) and 243 Gg CO2e (2018), which can have some impact on the total GHGs. Nitrogenous emissions, as compared with enteric CH4, are considered low and are usually neglected. If we bear in mind that the GWP of this compound is more than ten times greater than that of CH4, then even a small amount should not be disregarded.
Moreover, our results indicated that cattle contributed almost 60% of the total N2O emissions, followed by sheep (<30%), poultry (<8%), goats (<8%), and the other species (<4%). In South, Southeast, and East Asia, the inventories for N2O and CH4 emissions from animal farming revealed that cattle, compared with other animal species, were the highest producers of CH4 (56%) and N2O (30%). Chhabra et al. [16] estimated that poultry was the first contributor (86.1%) to the total N2O emissions, followed by pigs (7.3%), indigenous cattle (5.7%), and exotic cattle (1.0%). Similarly, Truong et al. [18] reported that poultry accounted for the largest share of N2O emissions (60%), followed by pigs (26%).
Differences among countries can be attributed to the different environmental conditions, herd size of each animal species, type and duration of waste management, and husbandry systems in each country [15,18]. In this context, Rotz [36], Dourmad et al. [37], and Dijkstra et al. [42] suggested that the amount of N2O emissions might be related to the nitrogen concentration in the diet and the dry matter ingested by the animal. The efficiency of feed conversion into animal products depends on the relative contributions of maintenance and production to the total requirement [37]. When animal production level is low, maintenance contributes more, resulting in more feed required per kg product and, consequently, in higher relative emissions. In meat-producing animals, the efficiency is also affected by the composition of the meat, as fat deposition requires more energy than protein retention in lean tissues [37].

4.4. Mitigation and Adaptation Plan Undertaken by the Government

Tunisia is aware of the impact of GHG emissions on the climate crisis and has adopted a proactive policy in terms of both mitigation and adaptation. One of the objectives of this policy is to implement nationally appropriate mitigation actions (NAMAs) in the livestock sector. With the support of several international organizations (United Nations Development Programme (UNDP), Global Environment Facility (GEF), German cooperation), a number of NAMA initiatives have been launched in Tunisia and are at various stages of development. As part of the baseline and mitigation scenarios determination, 2010 was defined as the reference year, and 2030 as the horizon year. The mitigation objective requires a total investment of up to 17.5 billion U.S. dollars over the period 2015–2030, with 85% of this amount allocated for the energy sector and 5% for the livestock sector. In the agricultural sector, preliminary actions aiming at GHG mitigation include promotion of biological agriculture and reduction of pollution caused by the use of chemical fertilizers in excess in some intensive crops, stepping up the role of legumes in arable land, and the conservation and planting of biomass. GHG mitigation options related to animal management include the improvement of animal genetics, fertility, feeding, animal health, and longevity. Appropriate inventories of GHG emissions from each animal species farmed are required for all these measures to be effective. Given the new political environment of many countries and increased expectations of local communities, a general orientation to systematically focus on accessible or feasible adaptation options at low cost is necessary [6,35]. A series of adaptation measures have been undertaken, including adapting irrigated crops in the central regions, adapting mixed farming-livestock production to climate change in vulnerable regions, and updating the agricultural map to take into account the impacts of climate change. Other measures include the introduction of a climate monitoring and early warning system, an insurance mechanism against climatic hazards due to climate change, conserving and exploiting genetic heritage to adapt cereal crops to climate change, and developing innovative methods for arable crops.

5. Conclusions and Perspectives

This study revealed that, among the main livestock species farmed, cattle followed by small ruminants were responsible for the largest share of CH4 livestock emissions in Tunisia. Other species (equines and poultry) had a combined contribution of less than 2%. The critical influence of the values assumed for each emission factor reveals that there is a need for more accurate coefficients, specific for each geographic region or for identifiable farming systems. Hence, there are urgent needs to understand the various factors affecting the variability in enteric CH4 production, to reduce the uncertainty in GHG emission inventories, and to identify viable strategies for GHG reduction from livestock. A slight decline in GHG emissions from livestock has been observed in Tunisia from 2008 to 2018, concurrently with the decrease in the average population numbers of ruminants and equines, the main contributors to methane emissions. The estimation of GHG emissions is based exclusively on animal numbers, not taking into account that emissions per head can be increased as animal productivity is improved. In the future, worldwide emissions are expected to increase substantially as a response to an increasing demand for animal products. This can only be achieved by increasing animal productivity, even though the number of animals farmed is not increased or is even decreased slightly, as in Tunisia. These aspects need to be considered to refine the factors used for estimating GHG emissions more accurately, and priority should be given to creating an appropriate database for GHG inventory to facilitate the study of livestock contribution to GHG emissions. Once a more reliable inventory of GHG emissions from livestock is available, the formulation of appropriate adaptation and mitigation options with low costs for the agricultural sector is urgently required to be ready for adoption by farmers. In a broad sense, options for the mitigation of GHG emissions from the agricultural sector can be seen from the supply side as well as from the demand side. For supply-based measures, strategies lead to an increase in net GHG efficiency of agricultural production. These measures can be further defined as either technical or structural options. Whereas technical options reduce agricultural emissions using technologies such as anaerobic digesters, feed supplements, and soil nitrogen inhibitors, structural measures usually refer to more fundamental improvements such as a transition towards high-intensity management systems or relocation of production across regions. For demand-based measures, these options aim to reduce consumption of GHG-intensive products and at the reduction of waste. The improvement of animal productivity was also planned by the society as an efficient way to increase the production of animal products and meet the increasing local demand, without increasing the use of land or the emission of GHGs. Some other mitigation options, such as the use of feed additives in animal nutrition or of additives to enhance composting or for manure treatment, can be explored as an efficient strategy that may significantly reduce the GHG emissions per-unit-of-product footprint.

Author Contributions

Conceptualization, H.A., S.L. and H.H.; Data curation, H.A. and S.L.; Formal analysis, H.A., S.L. and H.H.; Investigation, H.A., S.A., M.A., N.M. and R.B.; Methodology, H.H.; Resources, H.H.; Supervision, H.A.; Validation, H.A., M.H.A., N.M., M.E.d.M., M.C., R.B. and S.L.; Visualization, H.A. and H.H.; Writing—original draft, H.A.; Writing—review & editing, H.A., N.M., M.E.d.H.M., M.C., S.L. and H.C.M. All authors have read and agreed to the published version of the manuscript.

Funding

This research was partly supported by the CLCA project, Phase II (Use of conservation agriculture in crop-livestock systems in the drylands for enhanced water use efficiency, soil fertility and productivity in NENA and LAC countries), which is funded by the International Fund for Agricultural Development (IFAD) (ICARDA’s agreement N°200116).

Acknowledgments

In this section you can acknowledge any support given which is not covered by the author contribution or funding sections. This may include administrative and technical support, or donations in kind (e.g., materials used for experiments).

Conflicts of Interest

The authors declare no conflict of interest.

References

  1. Diao, X.; Hazell, P.; Thurlow, J. The role of agriculture in African development. World Dev. 2010, 38, 1375–1383. [Google Scholar] [CrossRef]
  2. African Union Development Agency-NEPAD (AUDA-NEPAD). African Agriculture, Transformation and Outlook (2013). Available online: https://web.archive.org/web/20201016205723/; https://www.nepad.org/caadp/publication/agriculture-africa-transformation-and-outlook (accessed on 16 October 2020).
  3. Santos, N.; Ceccacci, I. Egypt, Jordan, Morocco and Tunisia: Key Trends in The Agrifood Sector; Food and Agriculture Organization of the United Nations (FAO): Rome, Italy, 2015. [Google Scholar]
  4. Observatoire National de l’Agriculture (ONAGRI). Annuaire Statistique 2017; ONAGRI, Ministère de l’Agriculture, des Ressources Hydrauliques et de la Pêche: Tunis, Tunisia, 2017. [Google Scholar]
  5. Tubiello, F.N.; Salvatore, M.; Ferrara, A.F.; House, J.; Federici, S.; Rossi, S.; Biancalani, R.; Condor Golec, R.D.; Jacobs, H.; Flammini, A.; et al. The contribution of agriculture, forestry and other land use activities to global warming, 1990–2012. Glob. Chang. Biol. 2015, 21, 2655–2660. [Google Scholar] [CrossRef] [PubMed] [Green Version]
  6. Wilkes, A.; Reisinger, A.; Wollenberg, E.; Van Dijk, S. Measurement, Reporting and Verification of Livestock GHG Emissions by Developing Countries in the UNFCCC: Current Practices and Opportunities for Improvement; CCAFS Report No. 17; CGIAR Research Program on Climate Change, Agriculture and Food Security (CCAFS) and Global Research Alliance for Agricultural Greenhouse Gases (GRA): Wageningen, The Netherlands, 2017. [Google Scholar]
  7. Ministère des Affaires Locales et L’Environnement de la Tunisie. Conference of the Parties to the United Nations Framework Convention on Climate Change (UNFCCC)-Intended Nationally Determined Contribution: Tunisia (2015). Available online: https://web.archive.org/web/20181217172822/; https:/www4.unfccc.int/sites/ndcstaging/PublishedDocuments/Tunisia First/INDC-Tunisia-English Version.pdf (accessed on 17 December 2018).
  8. Ministère des Affaires Locales et L’Environnement de la Tunisie. Deuxième Rapport Biennal de la Tunisie (2016) à la Convention Cadre des Nations Unies sur les Changements Climatiques (CCNUCC). Available online: https://web.archive.org/web/20191114003609/; https://unfccc.int/sites/default/files/resource/BUR2_Tunesia_2016.pdf (accessed on 14 November 2019).
  9. Ministère des Affaires Locales et L’Environnement de la Tunisie/United. United Nations Develpment Programme-Global Evironmental Finance. Tunisia’s Third National Communication (2019) as part of the United Nations Framework Convention on Climate Change (UNFCCC). Available online: https://web.archive.org/web/20201017061222/; https:/unfccc.int/sites/default/files/resource/Synthese Ang Finalise Tunisia.pdf (accessed on 17 October 2020).
  10. Smith, P.; Bustamante, M.; Ahammad, H.; Clark, H.; Dong, H.; Elsiddig, E.A.; Haberl, H.; Harper, R.; House, J.; Jafari, M.; et al. Agriculture, Forestry and Other Land Use (AFOLU). In Climate Change 2014: Mitigation of Climate Change. Contribution of Working Group III to the Fifth Assessment Report of the Intergovernmental Panel on Climate Change; Edenhofer, O., Pichs-Madruga, R., Sokona, Y., Farahani, E., Kadner, S., Seyboth, K., Adler, A., Baum, I., Brunner, S., Eickemeier, P., et al., Eds.; Cambridge University Press: Cambridge, UK; New York, NY, USA, 2015; pp. 811–922. [Google Scholar]
  11. Intergovernmental Panel on Climate Change (IPCC). 2006 IPCC Guidelines for National Greenhouse Gas Inventories. In IPCC National Greenhouse Gas Inventories Programme; Eggleston, H.S., Buendia, L., Miwa, K., Ngara, T., Tanabe, K., Eds.; Institute for Global Environmental Strategies (IGES): Hayama, Japan, 2006; ISBN 4-88788-032-4. [Google Scholar]
  12. Verner, D.; Treguer, D.; Redwood, J.; Christensen, J.; McDonnell, R.; Elbert, C.; Konishi, Y. Climate Variability, Drought, and Drought Management in Tunisia’s Agricultural Sector; World Bank Group: Washington, DC, USA, 2018. [Google Scholar]
  13. United Nations Climate Change. Global Warming Potentials (IPCC Fourth Assessment Report, 2007). Available online: https://unfccc.int/process-and-meetings/transparency-and-reporting/greenhouse-gas-data/frequently-asked-questions/global-warming-potentials-ipcc-fourth-assessment-report (accessed on 2 May 2020).
  14. Gerber, P.J.; Steinfeld, H.; Henderson, B.; Mottet, A.; Opio, C.; Dijkman, J.; Falcucci, A.; Tempio, G. Tackling Climate Change Through Livestock—A Global Assessment of Emissions and Mitigation Opportunities; Food and Agriculture Organization of the United Nations (FAO): Rome, Italy, 2013; ISBN 978-92-5-107920-1. [Google Scholar]
  15. Hristov, A.N.; Oh, J.; Firkins, J.L.; Dijkstra, J.; Kebreab, E.; Waghorn, G.; Makkar, H.P.S.; Adesogan, A.T.; Yang, W.; Lee, C.; et al. Mitigation of methane and nitrous oxide emissions from animal operations: I. A review of enteric methane mitigation options. J. Anim. Sci. 2013, 91, 5045–5069. [Google Scholar] [CrossRef] [PubMed] [Green Version]
  16. Chhabra, A.; Manjunath, K.R.; Panigrahy, S.; Parihar, J.S. Greenhouse gas emissions from Indian livestock. Clim. Chang. 2013, 117, 329–344. [Google Scholar] [CrossRef]
  17. Sallaye, M. Etablissement D’un Rapport sur L’inventaire des Sources D’émission et des Puits D’absorption de GES (2018). Available online: https://web.archive.org/web/20201018063956/; https://www.researchgate.net/profile/Miloud_Sallaye/publication/327872220_Etablissement_d%27un_rapport_sur_l%27inventaire_des_sources_d%27emission_et_des_puits_d%27absorption_de_GES_en_Algerie/links/5baaaf9b45851574f7e63b5c/Etablissement-dun-rapport-sur-linventaire-des-sources-demission-et-des-puits-dabsorption-de-GES-en-Algerie.pdf (accessed on 18 October 2020).
  18. Truong, A.H.; Kim, M.T.; Nguyen, T.T.; Nguyen, N.T.; Nguyen, Q.T. Methane, nitrous oxide and ammonia emissions from livestock farming in the Red River Delta, Vietnam: An inventory and projection for 2000–2030. Sustainability 2018, 10, 3826. [Google Scholar] [CrossRef] [Green Version]
  19. Intergovernmental Panel on Climate Change (IPCC). Revised 1996 IPCC Guidelines for National Greenhouse Inventories; Houghton, J.T., Meira Filho, L.G., Lim, B., Tréanton, K., Mamaty, I., Bonduki, Y., Griggs, D.J., Callander, B.A., Eds.; IPCC/OECD/IEA: Paris, France, 1997. [Google Scholar]
  20. Intergovernmental Panel on Climate Change (IPCC). Climate Change 2013: The Physical Science Basis. Contribution of Working Group I to the Fifth Assessment Report of the Intergovernmental Panel on Climate Change; Stocker, T.F., Qin, D., Plattner, G.-K., Tignor, M., Allen, S.K., Boschung, J., Nauels, A., Xia, Y., Bex, V., Midgley, P.M., Eds.; Cambridge University Press: Cambridge, UK; New York, NY, USA, 2013; ISBN 978-1-107-05799-1. [Google Scholar]
  21. Nugrahaeningtyas, E.; Baek, C.Y.; Jeon, J.H.; Jo, H.J.; Park, K.H. Greenhouse gas emission intensities for the livestock sector in Indonesia, based on the national specific data. Sustainability 2018, 10, 1912. [Google Scholar] [CrossRef] [Green Version]
  22. Moss, A.R.; Jouany, J.P.; Newbold, J. Methane production by ruminants: Its contribution to global warming. Anim. Res. 2000, 49, 231–253. [Google Scholar] [CrossRef] [Green Version]
  23. International Energy Agency (IEA) Part III: Greenhouse-gas emissions. CO2 Emissions from Fuel Combustion 2012; OECD Publishing: Paris, France, 2012; pp. III.1–III.51. [Google Scholar]
  24. Thorpe, A. Enteric fermentation and ruminant eructation: The role (and control?) of methane in the climate change debate. Clim. Chang. 2009, 93, 407–431. [Google Scholar] [CrossRef]
  25. Chang, J.; Peng, S.; Ciais, P.; Saunois, M.; Dangal, S.R.S.; Herrero, M.; Havlík, P.; Tian, H.; Bousquet, P. Revisiting enteric methane emissions from domestic ruminants and their δ13CCH4 source signature. Nat. Commun. 2019, 10, 1–14. [Google Scholar] [CrossRef] [PubMed]
  26. Moeletsi, M.E.; Tongwane, M.I.; Tsubo, M. Enteric methane emissions estimate for Livestock in South Africa for 1990–2014. Atmos. Basel 2017, 8, 69. [Google Scholar] [CrossRef] [Green Version]
  27. Knapp, J.R.; Laur, G.L.; Vadas, P.A.; Weiss, W.P.; Tricarico, J.M. Enteric methane in dairy cattle production: Quantifying the opportunities and impact of reducing emissions. J. Dairy Sci. 2014, 97, 3231–3261. [Google Scholar] [CrossRef] [PubMed] [Green Version]
  28. Food and Agriculture Organization of the United Nations. Livestock’s Long Shadow: Environmental Issues and Options; FAO: Rome, Italy, 2006; ISBN 978-92-5-105571-7. [Google Scholar]
  29. Sejian, V.; Lal, R.; Lakritz, J.; Ezeji, T. Measurement and prediction of enteric methane emission. Int. J. Biometeorol. 2011, 55, 1–16. [Google Scholar] [CrossRef] [PubMed]
  30. Bruinsma, J. World Agriculture: Towards 2015/2030. An FAO Perspective; Earthscan Publications Ltd.: London, UK, 2003; ISBN 92-5-104835-5. [Google Scholar]
  31. Food and Agriculture Organization of the United Nations (FAO). Livestock Sector Development for Poverty Reduction: An Economic and Policy Perspective—Livestock’s Many Virtues; Otte, J., Costales, A., Dijkman, J., Pica-Ciamarra, U., Robinson, T., Ahuja, V., Ly, C., Roland-Holst, D., Eds.; FAO: Rome, Italy, 2012; ISBN 9789251072424. [Google Scholar]
  32. Thornton, P.K.; Herrero, M. The Inter-Linkages Between Rapid Growth in Livestock Production, Climate Change, and The Impacts on Water Resources, Land Use, and Deforestation; International Livestock Research Institute (ILRI): Nairobi, Kenya, 2009. [Google Scholar]
  33. Thornton, P.K.; Herrero, M. Potential for reduced methane and carbon dioxide emissions from livestock and pasture management in the tropics. Proc. Natl. Acad. Sci. USA 2010, 107, 19667–19672. [Google Scholar] [CrossRef] [PubMed] [Green Version]
  34. Beauchemin, K.A.; McAllister, T.A.; McGinn, S.M. Dietary mitigation of enteric methane from cattle. CAB Rev. Perspect. Agric. Vet. Sci. Nutr. Nat. Resour. 2009, 4, 35.1–35.17. [Google Scholar] [CrossRef]
  35. Hristov, A.N.; Oh, J.; Lee, C.; Meinen, R.; Montes, F.; Ott, T.; Firkins, J.; Rotz, A.; Dell, C.; Adesogan, A.; et al. Mitigation of greenhouse gas emissions in livestock production—A review of technical options for non-CO2 emissions. In FAO Animal Production and Health Paper No. 177; Gerber, P.J., Benjamin, H., Makkar, H.P.S., Eds.; FAO: Rome, Italy, 2013; ISBN 978-92-5-107659-0. [Google Scholar]
  36. Rotz, C.A. Modeling greenhouse gas emissions from dairy farms. J. Dairy Sci. 2018, 101, 6675–6690. [Google Scholar] [CrossRef] [PubMed]
  37. Dourmad, J.-Y.; Rigolot, C.; van de Werf, H. Emission of green house gas, developing management and animal farming systems to assist mitigation. In Livestock and Global Climate Change; Rowlinson, P., Steele, M., Nefzaoui, A., Eds.; British Society of Animal Science, Cambridge University Press: Hammamet, Tunisia, 2008; pp. 36–39. [Google Scholar]
  38. Yan, T.; Agnew, R.; Gordon, F.; Porter, M. Prediction of methane energy output in dairy and beef cattle offered grass silage-based diets. Livest. Prod. Sci. 2000, 64, 253–263. [Google Scholar] [CrossRef]
  39. Patra, A.K. A meta-analysis of the effect of dietary fat on enteric methane production, digestibility and rumen fermentation in sheep, and a comparison of these responses between cattle and sheep. Livest. Sci. 2014, 162, 97–103. [Google Scholar] [CrossRef]
  40. Hristov, A.N.; Kebreab, E.; Niu, M.; Oh, J.; Bannink, A.; Bayat, A.R.; Boland, T.M.; Brito, A.F.; Casper, D.P.; Crompton, L.A.; et al. Uncertainties in enteric methane inventories, measurement techniques, and prediction models. J. Dairy Sci. 2018, 101, 6655–6674. [Google Scholar] [CrossRef] [PubMed]
  41. Ministry for the Environment. New Zealand’s Greenhouse Gas Inventory 1990–2013; New Zealand Governent: Wellington, New Zealand, 2015; ISBN 1179-223X.
  42. Dijkstra, J.; Oenema, O.; van Groenigen, J.W.; Spek, J.W.; van Vuuren, A.M.; Bannink, A. Diet effects on urine composition of cattle and N2O emissions. Animal 2013, 7, 292–302. [Google Scholar] [CrossRef] [PubMed] [Green Version]
Figure 1. Evolution of total greenhouse gas emissions (CH4 and N2O) from the total Tunisian livestock (Gg CO2e) throughout the studied period (2008–2018).
Agriculture 10 00562 g001
Figure 2. Evolution of the total gas emissions (Gg CO2e) by the different animal species/category from Tunisian livestock during the studied period (2008–2018).
Agriculture 10 00562 g002
Figure 3. Evolution of the total CH4 emissions (Gg CO2e) from total Tunisian livestock derived from either enteric fermentation or manure management during the studied period (2008–2018).
Agriculture 10 00562 g003
Figure 4. Evolution of total CH4 production (Gg CO2e) by the different animal species/category from Tunisian livestock during the studied period (2008–2018).
Agriculture 10 00562 g004
Figure 5. Evolution of CH4 emissions (Gg CO2e) issued from the enteric fermentation by the different animal species/category from Tunisian livestock during the studied period (2008–2018).
Agriculture 10 00562 g005
Figure 6. Evolution of direct and indirect N2O emissions (Gg CO2e) from Tunisian livestock during the studied period (2008–2018).
Agriculture 10 00562 g006
Figure 7. Evolution of N2O emissions (Gg CO2e) by the different animal species/category from Tunisian livestock during the studied period (2008–2018).
Agriculture 10 00562 g007
Table 1. Emission factors corresponding to methane (kg CH4.head−1.year−1) issued from enteric fermentation (EFenteric) and manure management (EFmanure), volatile solids excreted daily (VS, kg dry matter.animal−1. day−1), the maximal capacity of methane production from manure produced (BO, m3 CH4.kg−1 VS excreted), and manure fraction (MS(T,S,k)) values for different animal species/categories. [11].
AnimalCattleSheepGoatsEquinesCamelidsPoultry
SpeciesDairyOthersHorsesDonkeys/MulesLayingBroilerTurkey
EFenteric895855181046000
EFmanure940.220.240.972.14.10.010.020.09
VS4.52.70320.351.720.942.490.010.020.07
BO0.240.170.130.130.260.260.210.360.390.36
MS(T,S,k) (%)757525259055100100100
VS and BO values correspond to those of the following: East Europe for dairy cows; Latin America for other cattle; to developing countries for sheep, goat, horses, donkeys and mules, and camelids; to developed countries for poultry; MS(T,S,k) = fraction of manure from livestock category T treated using the manure management system S in climatic region k.
Table 2. Nitrogen (N) emissions per animal type (kg N.head−1.year−1) [11].
AnimalCattleSheepGoatsEquinesCamelidsPoultry
SpeciesDairyOthersHorsesDonkeys/MulesLayingBroilerTurkey
Nrate(T)0.350.351.171.370.460.460.461.10.820.74
TAM55039128302381302170.91.86.8
Nex(T)70.2649.9511.9615.0039.9621.8336.430.360.541.84
N2OD(mm)0.410.290.020.030.280.010.010.0010.0010.003
Nvolatilization-MMS15.8116.560.360.454.320.130.220.140.300.73
FracGasMS (%)30451212121212405540
Nrate(T): default N excretion rate per day (kg N.1000 kg−1 animal mass.day−1); TAM: typical animal mass for an animal of type T (kg.animal−1); Nex(T): annual average N excretion per head of animal category T per year (kg N.head−1.yr−1); N2OD(mm): direct N2O emissions from manure management; Nvolatilisation-MMS: losses due to volatilization during manure management in the system S; FracGasMS (%): percentage of nitrogen manure managed for animal species/category T, which is volatilized as NH3 and NOx in manure management S.
Table 3. Average annual animal population (thousands) in Tunisia during the studied period (2008–2018). Based on data provided by the Tunisian Ministry of Agriculture [4] and applying Equation (1).
Animal SpeciesCattleSheepGoatsEquinesCamelidsPoultry
DairyOthersHorsesDonkey/MulesBroilerLayingTurkey
2008449246730114962517284753663871654
2009443239736214552416882779663581934
2010440231723412962316480866262142278
2011430226699912822316480826962001993
2012427228680212722316480976663322888
201342422268561274221567810,64967252851
201443823468061248221487611,30774183059
201545023164901162211397811,80797972917
201645822864861199211308010,89974312811
201743720964061185201208110,83673502892
201840119464701197201118310,99368663033
Publisher’s Note: MDPI stays neutral with regard to jurisdictional claims in published maps and institutional affiliations.

