
An Acoustic Reconstruction of the House of Commons, c. 1820–1834

1
School of Physics, Engineering and Technology: Audio Lab, University of York, York YO10 5DD, UK
2
Department of History, University of York, York YO10 5DD, UK
*
Author to whom correspondence should be addressed.
Acoustics 2023, 5(1), 193-215; https://doi.org/10.3390/acoustics5010012
Submission received: 23 January 2023
/
Revised: 17 February 2023
/
Accepted: 21 February 2023
/
Published: 24 February 2023
(This article belongs to the Special Issue Acoustics, Soundscapes and Sounds as Intangible Heritage)
Abstract
:This paper presents an acoustic reconstruction of the UK House of Commons between c. 1820 and 1834. Focusing on a historically important site where political decisions were debated over the centuries, we aim to simulate and present the intangible principles of the acoustic properties and sounds heard within the space. The acoustic model was created based on available historical evidence with the aid of commercial acoustic simulation software. We discuss the decisions made for this reconstruction based on further experimentation with the acoustic characteristics of the constituent materials and settings of the available software. An additional comparison of the achieved acoustic results with spaces of similar historical importance and layout is presented, as a calibration of the model with in situ measurements was not possible in this case study. The values of T30, EDT, C50 and Ts are presented, while auralization examples are also available for a subjective evaluation of the results.
1. Introduction
In an effort to investigate some of the intangible aspects of history, including the acoustics of heritage spaces and the audio experiences perceived within them, new technologies and tools have been used in recent studies. For a more complete study of heritage sites, historians, archaeologists, musicologists and acousticians are just some of the specialists that should collaborate and exchange knowledge, methods and experience. The current paper focuses on the virtual acoustic reconstruction of the UK House of Commons as it appeared between c. 1820 and 1834. The interior of the Commons chamber had undergone multiple changes since its conversion from St Stephen’s Chapel in the mid-sixteenth century; we focus on the last stage before it was severely damaged by a fire in Westminster Palace in 1834 and demolished in 1837. Considering the importance of this building in shaping the history of the UK, and the political speeches and decisions that took place within it, we aim to study the acoustic characteristics of the space and understand more about its impact on history. An acoustic model has been created based on the historical evidence that is available to us. In this paper, we discuss the process of creating this model and the decisions we have made to arrive at a plausible acoustic result for the simulated virtual space. We also compare the acoustic results with spaces that appear to have some similarities with the history, layout, and fabric of the lost Commons chamber. Despite the uncertainties and limitations of not having in situ measurements of the space for further calibration of our model, we believe that our estimations contribute to a more holistic history of this historic site.
2. History of the House of Commons Chamber in the Palace of Westminster
The modern debating chamber of the UK House of Commons is not the same space that elected Members of Parliament historically occupied, nor is it in precisely the same location. The original Commons chamber was located in the former medieval chapel of St Stephen within the Palace of Westminster until 1834, when a major fire destroyed the space, and a replacement chamber was built nearby in the Gothic style. This House of Commons, in turn, was destroyed during the Second World War, following which the chamber was rebuilt on the same footprint in a similar but modernised style.
The first dedicated House of Commons chamber was located in the former royal chapel of St Stephen in the Palace of Westminster. The chapel itself was built during the reigns of Edward I, Edward II and Edward III, and was completed in the 1360s. The building was then refurbished and restructured in 1548–1550 during the Reformation of Edward VI, when the former college of St Stephen was dissolved and the upper chapel became the Commons chamber: the first time that the House of Commons had a permanent home of its own. The choir stalls were replaced with tiered benches arranged in parallel rows across the length of the room facing each other, with further seating wrapped around the east end of the space. As the purpose and the needs of Parliament were different from those for which the space had originally been designed, several alterations had to be made over the years. In 1692, the architect Sir Christopher Wren was called in to stabilise the building and modernise the interior. Wren lowered the ceiling of the medieval chapel, according to some in an effort to improve the acoustics of the space or to make the chamber warmer [1]. The galleries were extended to the north and south sides, and more benches were added to the existing west gallery. The medieval decorated stone walls were also covered with wainscot panelling, leaving a gap between the original walls and the panels and reducing the dimensions by 3 feet (0.91 m) at both the north and south sides. After the Acts of Union (1706–1707), additional seats were needed to accommodate the new Scottish Members of Parliament. The solution offered by Wren was to widen the galleries by one more row on each side.
In 1801, with the entry of Ireland into the United Kingdom, the architect James Wyatt was given the task of creating more space for the one hundred new members [2]. While his initial intention was to extend the west side of the chamber by merging it with the lobby located in the former antechapel, his work was limited to removing parts of the wainscot introduced by Wren and (more controversially) any remaining stonework and wall-paintings that had survived from the medieval St Stephen’s chapel. Wyatt replaced the wainscot but without leaving any gap between the original stone walls and the panels. This created extra space for additional rows on the main floor of the chamber and space underneath all the windows and between the piers for additional benches. Additional columns were added underneath the galleries for extra support. After Wyatt’s alterations, the final dimensions of the space were 18.6 m in length, 11.4 m in width and 8.6 m in height, based on the detailed architectural plans (as in Figure 1) that are available for all three levels (main floor, galleries, and ventilation space) [3] with a volume approximately 1823.5 m without furnishing and about 1402 m with furniture.
The capacity of the House of Commons, however, was always problematic, leading to overcrowding and uncomfortable sessions for the Members. The conditions in the chamber were poor; there was a constant issue with ventilation and room capacity while hosting the debates [2]. The heat, the smoke from candles and fires, and the background noise were reported on numerous occasions. Manuscript evidence implies that the architects involved in the reconstruction and renovation of the House of Commons between the 17th and 19th centuries included acoustical considerations in their planning and design [1].
The period of our investigation is focused between c. 1820 and 1834. During that time, the Commons chamber was in its very last stage of development before the fire. Additionally, we aim to include another historical element, which will be an interesting subject of future work. The ventilation space above the Commons ceiling, represented mainly as an octagon funnel in the middle of the House of Commons chamber, opened out into the original upper section of the medieval St Stephen’s chapel (as appears in Figure 2). Evidence from the 1820s and early 1830s reveals that this space was used by women, formally excluded from the chamber itself, to gather and listen to the parliamentary debates going on below. An initial and partial study of this space was conducted previously [4], and we aim to follow this up with the current acoustic model as a basis for future work.
3. Establishing the Geometry for the Acoustic Model
While focusing on the period from c. 1820 until the Palace fire of 1834, it was necessary also to retrace architectural changes over the centuries since a lot of surfaces and materials had remained the same or had been reused during the renovations of the space. Visual sources such as engravings, paintings [5,6,7,8,9], editorial cartoons [10,11,12,13], and architectural plans (such as Figure 1 and Figure 2 shown above) have been studied for different periods of the House of Commons. Relevant literature, including modern publications and reports of committee meetings in the chamber before or after the fire, have helped to create a better understanding of the space over these years.
The House of Commons and St Stephen’s Chapel have been the focus of two previous projects, which have proven very useful sources for this current work. Figure 3 is a virtual reconstruction of the House of Commons in 1692–1707 from [14], giving information on the seating layout and its materials, wall materials and decorations, as well as floor and ceiling as they appeared after Wren’s alteration.
An acoustic reconstruction of the House of Commons in c. 1789 was created in [4] using CATT-Acoustic [15], as presented in Figure 4a,b. This model was used as a starting point for this current study. Several changes had to be applied to this original model to reflect the state of the chamber after the significant alterations by Wyatt in 1801.
For the new version of the model, the wall surfaces on the north and south side of the room were set back between the piers, with additional seating areas underneath the windows. Additional ventilators have been added to the ceiling, working from new evidence on the ventilation systems of the period [2], and information about the use of the space above the ceiling by those well-connected women who were able to access it. The positioning of several doors and windows has been reconsidered for this model, following architectural plans (Figure 1 and Figure 2) and discussions with historians [16,17,18,19].
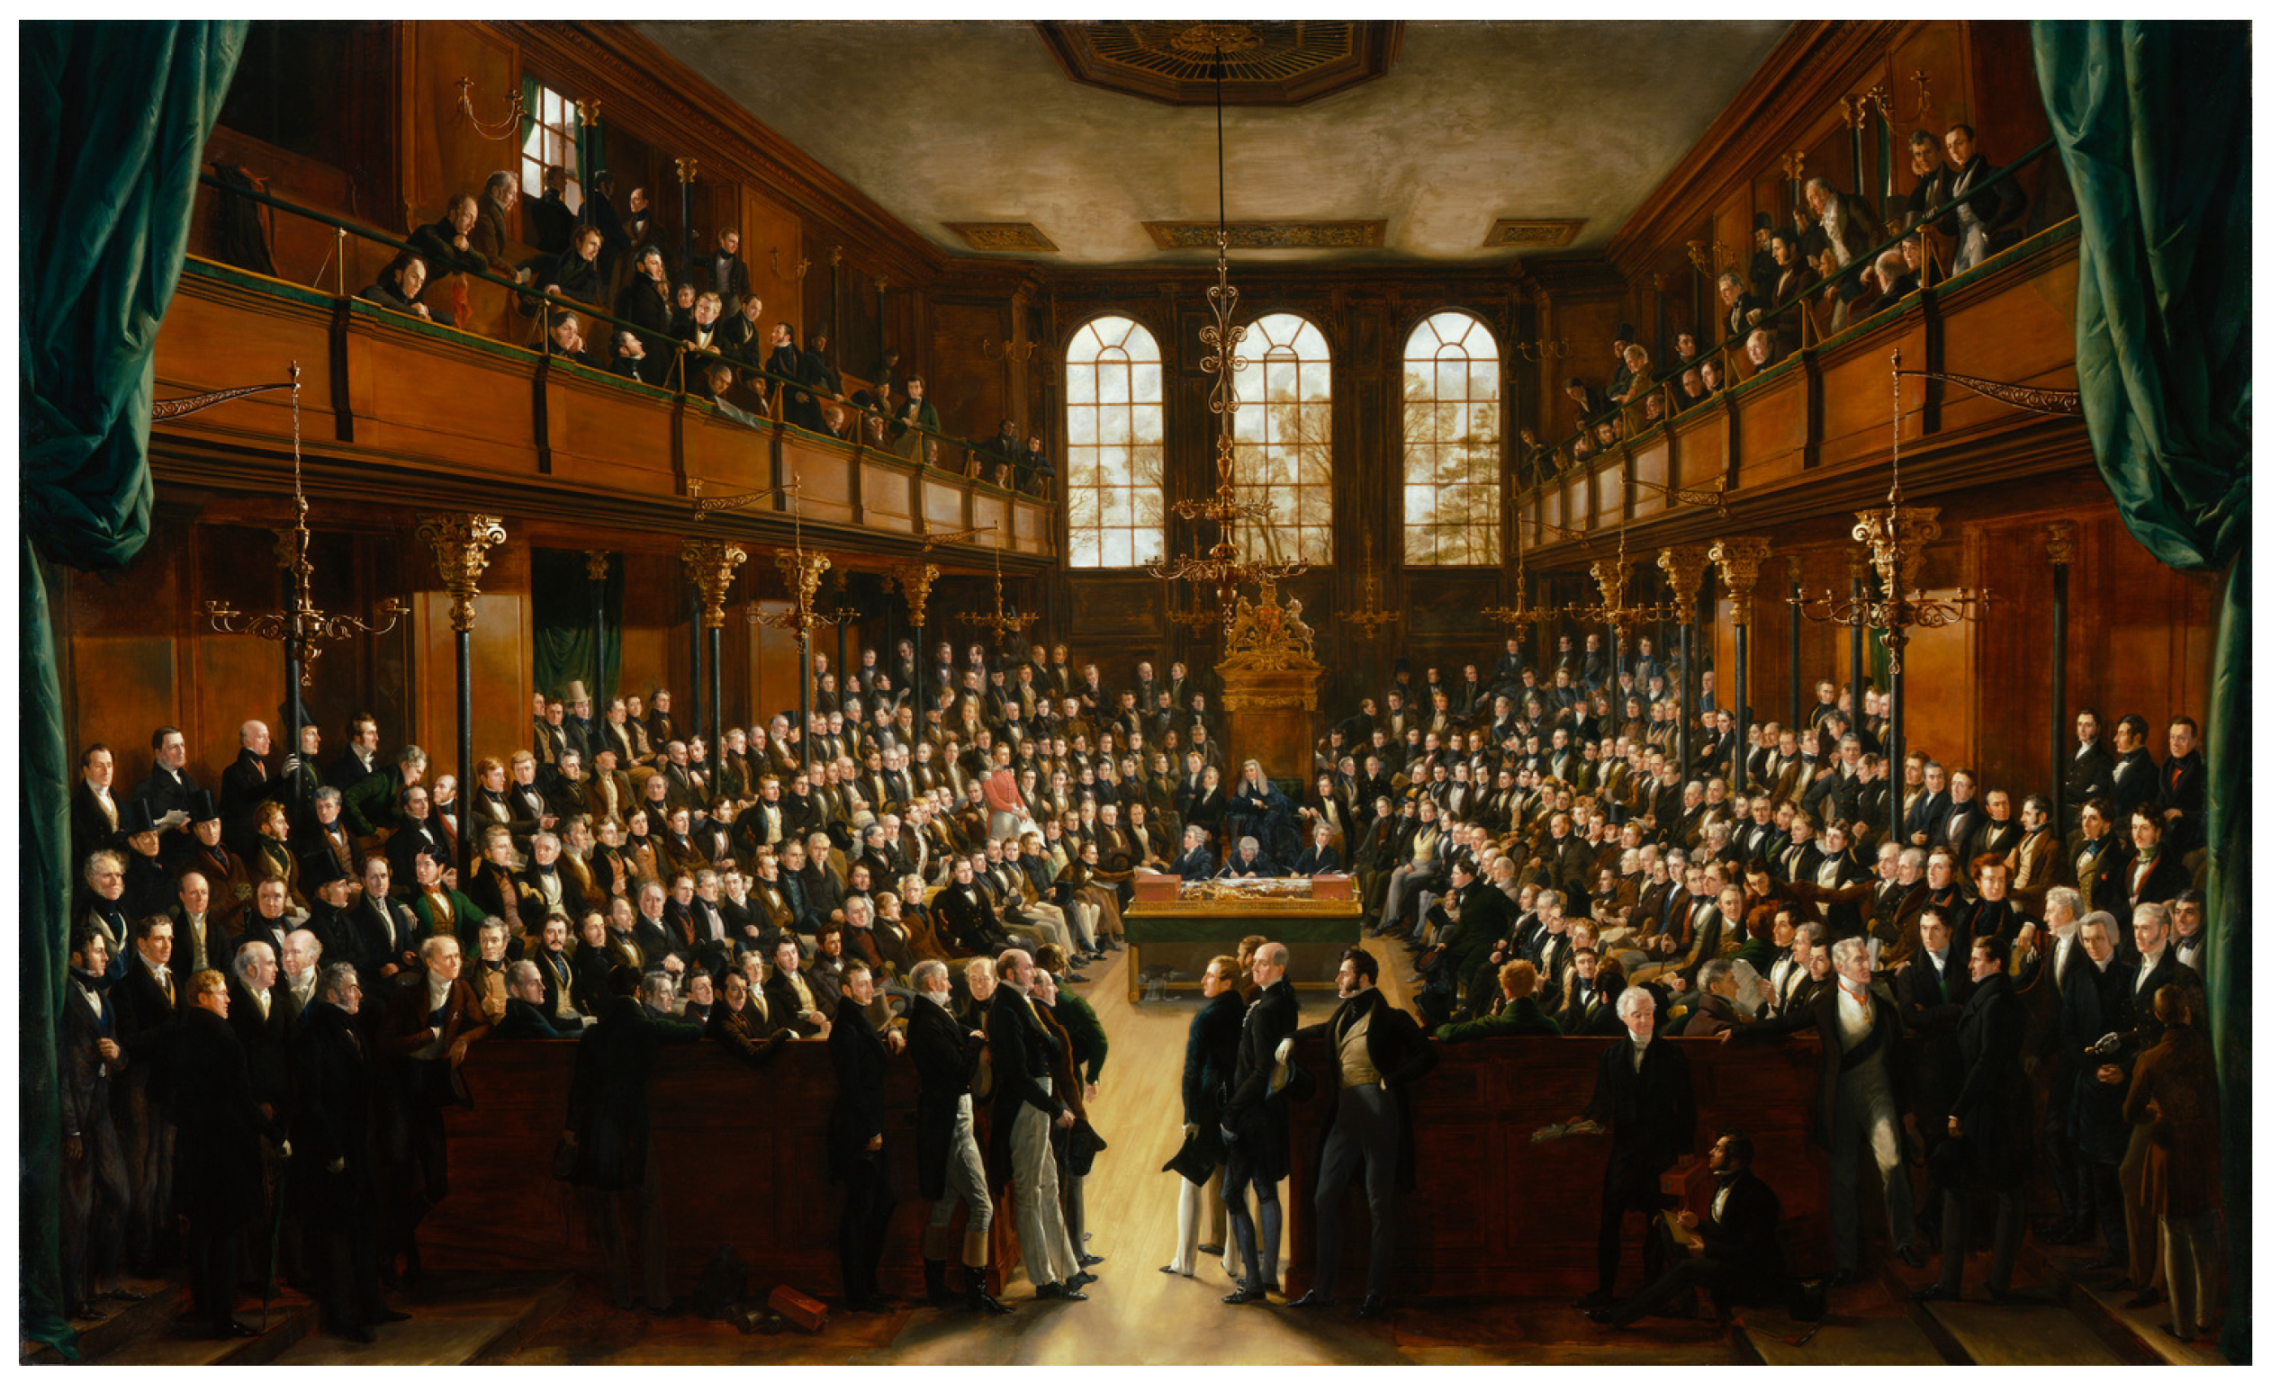
It appears that the construction of adjacent buildings (as can be seen in Figure 1) had led to the blocking of some windows and others being covered with wooden panels, leaving the space with two windows on each side of the galleries, one window per side on the north and south walls of the ground floor and the three principal windows to the east. Evidence from engravings suggests that some windows at the ground floor level were covered with heavy green curtains, as were external passageways on the other sides of those windows, as also shown in Figure 5. All of these details have been simulated in the latest version of the space.
Figure 5 was also a great source of evidence for the additional seating areas between the columns at the north and south walls, and the additional fifth row of benches om the east side of the chamber and behind the Speaker’s chair. Discussions with historians and researchers [16,17,18,19] specialising in the history of House of Commons and House of Lords gave assurance of the final decisions made in the creation of the geometric model and the materials used for the latest design.
In this updated geometric model, the new seats have been added following the design of the previous version; however, it was considered to be an unnecessarily detailed design of the benches, as there were many surfaces smaller than 0.5 m (as shown in Figure 4a,b). Literature on acoustic simulations and the comparison of detailed and simple versions of the geometric models on which they are based have indicated that by applying different scattering coefficients and overall settings in the acoustic modelling software, the results of the two versions could be sufficiently close [21,22]. ODEON [23,24] and CATT-Acoustic [15] guidance, however, suggest that this detailed approach can significantly increase the calculation time, while for the authors of this study, it was considered as an additional challenge to adjust the significant number of surfaces with different materials during the calibration process of this model.
It was also considered necessary to merge geometric planes (such as several planes forming part of the same wall or sides of the floor) and hence define them with the same materials. The updated and simplified version has 361 surfaces in total, which is reduced by half from the original detailed model, and a total surface area of 1175.68 m with adjusted absorption and scattering coefficient for the seating area, as will be discussed in Section 4.1 and Section 4.2. The model was also imported into the ODEON 14.00 Auditorium with some small changes to the subdivided surfaces as recommended for the use of this software. Figure 6 in CATT-Acoustic and Figure 7 in ODEON show the versions of the model based on the different detailed levels of the seating areas.
4. Materials and Methods
Examples in previous studies [22,25,26] where the acoustics of heritage sites have been reconstructed and studied using the two commercial acoustic software applications also used here, CATT-Acoustic and ODEON, have been considered, and useful information was taken regarding the estimation of the materials used, their absorption and scattering coefficients, and the calculation settings specific to each software.
For both ODEON and CATT-Acoustic models, the conditions in the acoustic environment were set to 20 °C for air temperature and 50% for the relative humidity. The results were obtained from an omnidirectional source at position P2, on the right side of the Speaker’s chair (presented in red in Figure 8) and from eleven additional receiver positions (presented in blue), excluding receiver 2, which represents the seated speaker for future scenarios. The Speaker’s position was not used as a candidate source position, as the speaker chair with the high marble back would have had a strong impact on the distribution of the early sound.
4.1. Absorption Coefficients
The materials below (Table 1) have been identified and defined by following information from historical references and images of the chamber and in combination with the available materials’ library properties from CATT-Acoustic and ODEON software.
The next step was to experiment with different possible materials and replace those surfaces of a considerable size, that is, the wooden panels on the walls and the seating area, and the wooden floor. Information on the absorption coefficient values for the materials used in the simulated model is limited in the literature, and even less for the scattering coefficient values. However, absorption and scattering coefficient values from church, cathedral and ancient theatre simulations have been taken into consideration, and the model was tested under a variety of different settings [22,25,26,27,28,29,30,31]. It was observed that different definitions for wooden panels (e.g. 16 mm wood on 40 mm studs or wooden floor on joists or wood, 25 mm with air space) will only just slightly change the obtained results as the absorption coefficient of the possible options documented does not differ significantly (as also discussed in [24]). Thus, the challenge for this project was mainly in the estimation of an appropriate absorption coefficient for the seating area.
For the purpose of this study, it was considered best to redefine the space as unoccupied in order to help the calibration process and comparison with similar physical spaces, which have been measured unoccupied (see Section 5). Our evidence for the benches in the House of Commons c. 1820–1834 is limited to the images of the period where some indication of upholstering can be observed when they are occupied. References from an earlier period suggest that the green fabrics that covered the seating area during meetings of Parliament were then restored at the end of each session. The seating area can play a significant role in the overall absorption and reverberation of a space, especially in large rooms that further lack additional absorbing surfaces. The prediction of absorption coefficients for chairs and pews varies significantly with the type and design of the seats and any upholstered material that might partly cover these seats. Table 2 shows some of the different materials with their absorption coefficient across the frequency bands, as found in previous studies [32,33,34,35,36], which have been tested in the calibration of this model, with some being more plausible than others. Scattering coefficients are also provided for some of these materials (as the second values across the frequency bands) and were also used for the acoustic experimentation.
Figure 9 presents the T30 results of the model from the different variations of the materials used on the seats as listed above. For this analysis, and what follows, the Aurora tools v.12.2.23-alpha [39] in Audacity 20.0 were used to obtain the relevant ISO3382 acoustic parameters from impulse responses generated as an output from the acoustic model. The observations from the previous studies highlighting the importance of the unoccupied seats in a space with the dimensions, furnishing, and materials as the current model have also been confirmed here. Significant changes in the average T30 values are obtained with the different materials on the seating area.
4.2. Scattering Coefficients
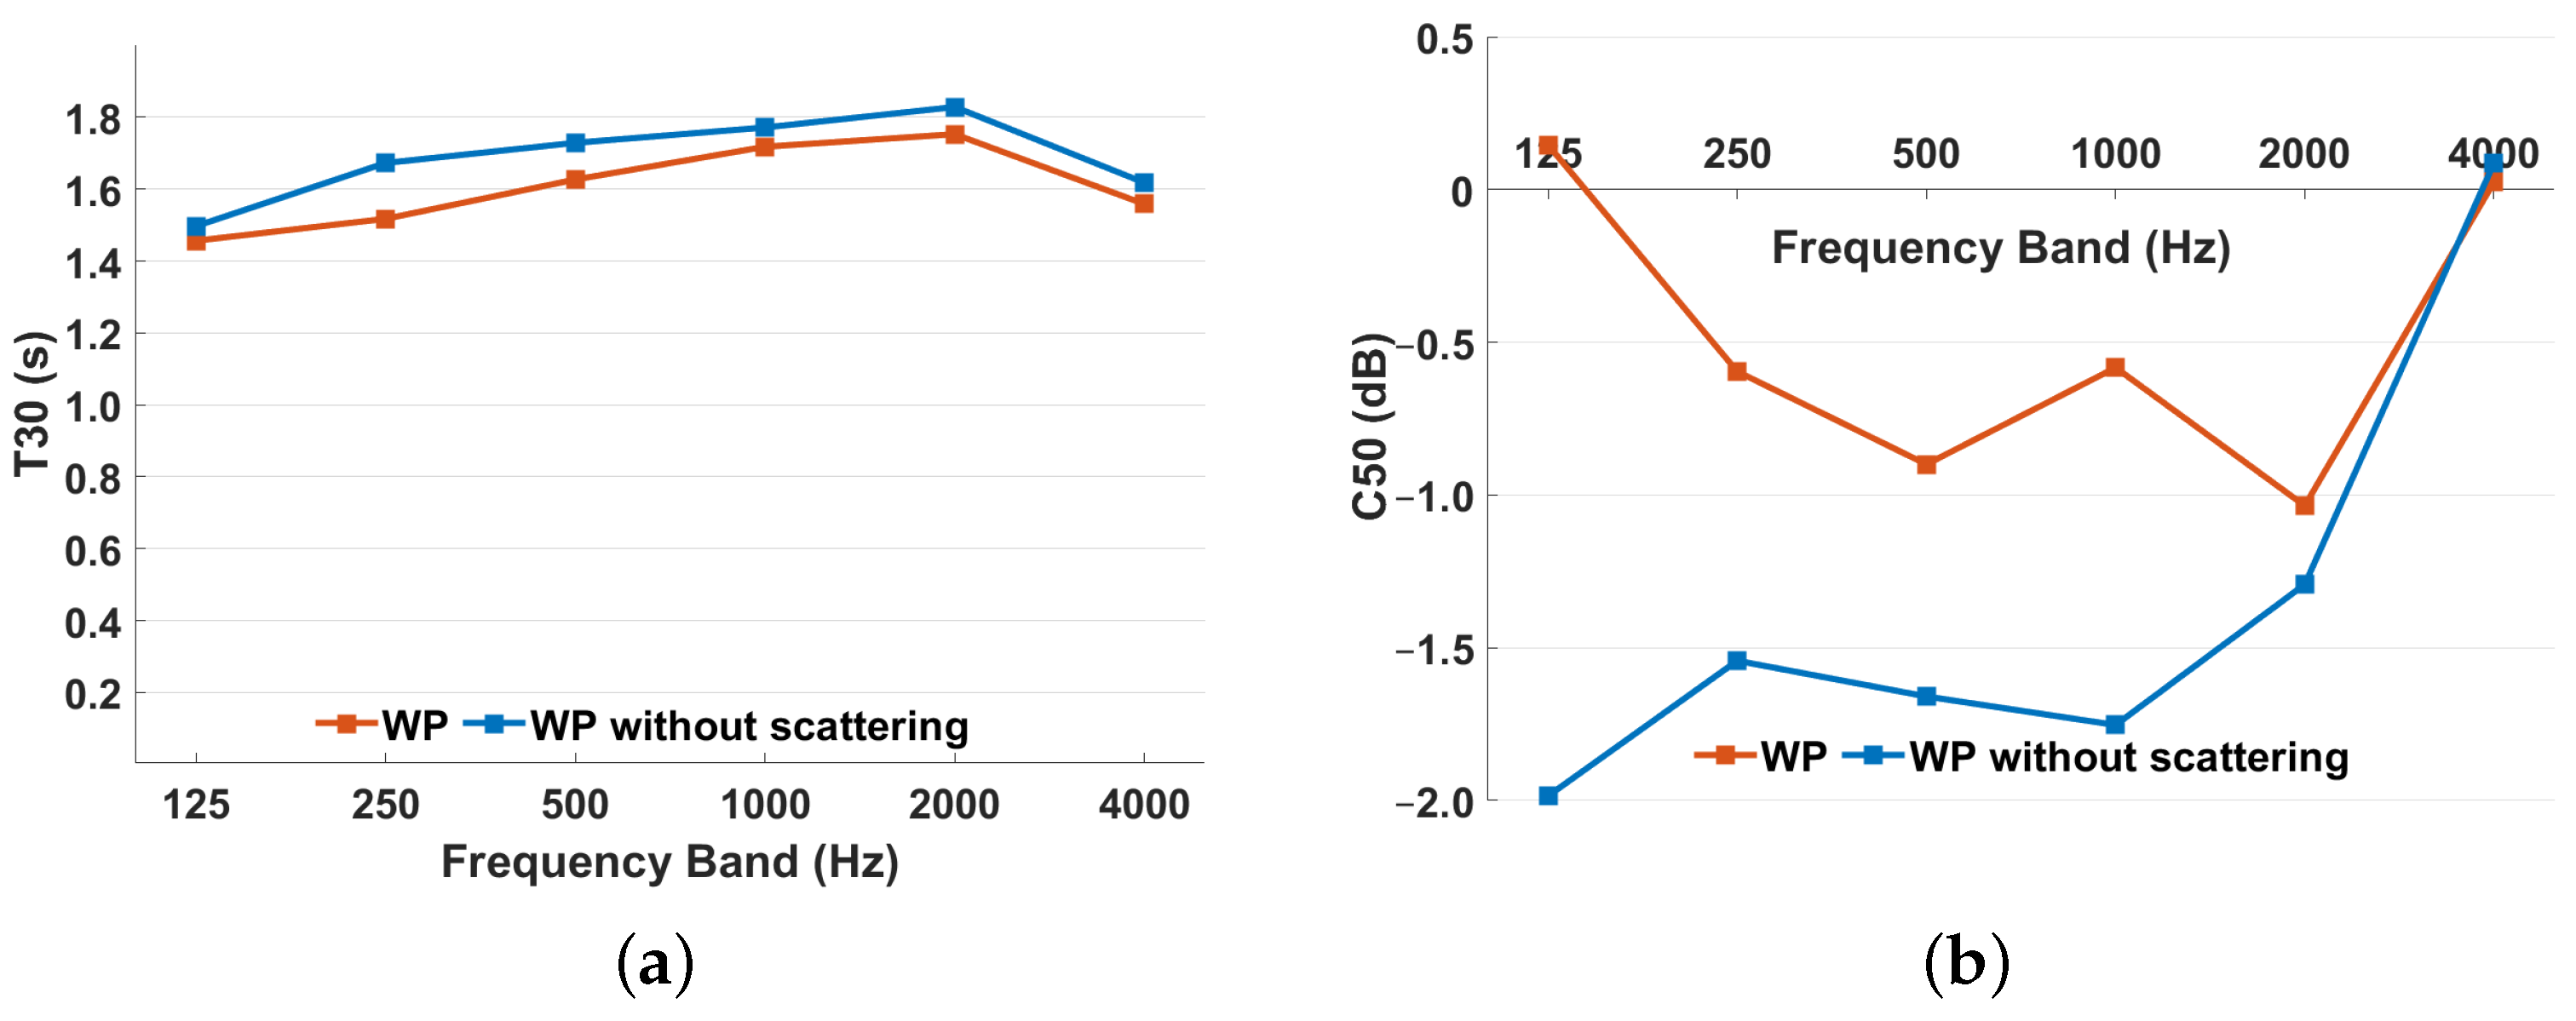
Scattering coefficients were also assigned to the experimental versions listed above. Initially, scattering coefficients were defined as 0.05 (as the default values in ODEON). By assigning detailed scattering coefficients, for the wooden pews (WP), as shown in Table 2, and for the rest of the surfaces, as shown in Table 3, the results of global parameter T30 were slightly changed. The results of C50, however, evidenced a significant increase, as shown in Figure 10.
The actual surface scattering has been used on the settings in ODEON in order to assign scattering coefficients to each surface, and the screen diffraction option was selected due to the non-visible source from various locations/receivers in the space as recommended by the ODEON manual [23]. These are the receivers R8, R10 and R11, as shown in Figure 8, which do not have visibility of the source S2. Using this software, scattering coefficients are defined for the middle frequency of 707 Hz, while for the rest of the frequencies, the software takes into consideration the Sets of Scattering Coefficient curves as suggested in the manual.
For further confirmation of the results by the use of geometric acoustic models, the final model from ODEON was imported and adjusted in CATT-Acoustic v9.1b. The same absorption coefficients were used for each individual surface (as shown in Table 1 and Table 2); however, scattering coefficients are not applied to individual surfaces as in ODEON but to each group of surfaces with the same material. Materials with the same name are defined with the same absorption and scattering coefficient. This can result in differences in the estimated parameters between the two pieces of software. The setting of the 2D Lambert scattering function was chosen for the materials in CATT-Acoustic, and the values of the scattering coefficients across the six different frequency bands were estimated by the same scattering coefficient curves provided by ODEON, all listed in Table 3.
4.3. Software Settings
For the final settings in ODEON, 30,000 rays were used, a Transition Order of 2, an impulse response resolution of 3 ms and an impulse response length of 3000 ms. These settings were the result of experimentation with a variety of recommendations from relevant literature [24,41], providing no unusual issues with the estimation of the acoustic parameters, or suspicious reflections/spikes in the obtained impulse responses, as explained in [36], while the auralisation results also sounded reasonable at the informal subjective evaluation.
For the calculation in CATT-Acoustics, Algorithm 2 was used in TUCT (see e.g. [15]), and similarly, several recommendations from the literature [22,25,26,37] were taken into consideration. For the number of rays/cones and impulse response length, the suggested values from the software were used, which were 470,688 rays/cones and 731.4 ms, correspondingly.
5. Model Validation Based on a Survey of Comparable Spaces
When developing an acoustic model, whether for an existing space or one that does not yet exist, it is important to build in calibration processes to justify the decisions made at key stages in the model definition and execution and to verify that the results obtained are plausible within a range of possible outcomes. This is particularly important in cases where it is not possible to obtain in situ measurements from the acoustic space being studied. In such circumstances, it is common to calibrate the model based on a comparison between predicted results obtained from the model and acoustic measurements from sites with similar characteristics or purposes. There are a significant number of studies that consider the acoustic properties of concert halls, ancient theatres, classrooms, and performance spaces in general [25,26,42]. The data from these studies, either based on acoustic measurements or acoustic reconstructions using computer modelling software, is of great value in informing the development and improvement of the acoustic experience in future similar designs [27]. In the acoustics of heritage sites, however, there is minimal supporting information available to better understand and compare the acoustic characteristics of spaces that no longer exist, and this information is usually limited to the study of other spaces with a comparable construction, design, or purpose. Thus, the design and the prediction of any acoustic result using computer modelling is based on a researcher’s best experience and knowledge of acoustics, materials used in the construction of a place, and its characterisation.
In terms of this study, the architectural style and acoustic characteristics of the c. 1820–1834 House of Commons have not been discussed much in the literature on the acoustics of heritage buildings or performance spaces. As a result, we embarked upon a study of historical sites around the UK that demonstrate some comparison with the House of Commons. The five chosen spaces have been surveyed and acoustically measured by various research teams from the AudioLab, University of York from 2017–2018, as independent studies, and some of their results are presented in [43]. In this section, we summarise these results and present additional acoustic information for the comparison and verification of the acoustic results of the final House of Commons model.
Two of the spaces, the Convocation House and the Divinity School in Oxford, were used as meeting places for the House of Commons away from the Palace of Westminster in the 17th century. A third space, the modern House of Commons, has largely retained the layout and architectural style of previous chambers; however, the current space is significantly larger and with contemporary materials and fabric. The last two spaces, the Holywell Music Room in Oxford and the York Guildhall Council Chamber, were not used for Parliamentary meetings; however, their layout and volume are similar to the c. 1820–1834 House of Commons chamber. The Holywell Music Room has been mainly used for music concerts, while the York Guildhall Council Chamber is the one space that is perhaps closest to the purpose and period of the model in this study. It was built in the 1880s and is still used as a place of political debate and discussion for current local government.
For the acoustic measurements of the Convocation House, Divinity School, House of Commons, and Holywell Music Room, a Genelec 8030 (Genelec Oy, Iisalmi, Finland) was used as the sound source and a SoundField ST450 microphone (SoundField, Silverwater, Australia) as the receiver, using a 20 Hz–20 kHz exponential sine sweep of length 15 s. In the Guildhall Council Chamber, in York, the research team used a Genelec 8130A for the sound source, a SoundField ST450 MkII microphone for the receiver and a 30s 20 Hz–22 kHz sine sweep for the excitation signal. For the analysis, MATLAB R2021a was used to post-process the recorded files, while the Aurora tools [39] in Audacity were used to obtain the ISO3382 acoustic parameters T30, C50, EDT and Ts from the resulting impulse responses. Overall, the methodology established by Farina [44] has been followed in all cases, such that the data obtained can later be used in a variety of auralization applications.
5.1. Convocation House, Oxford
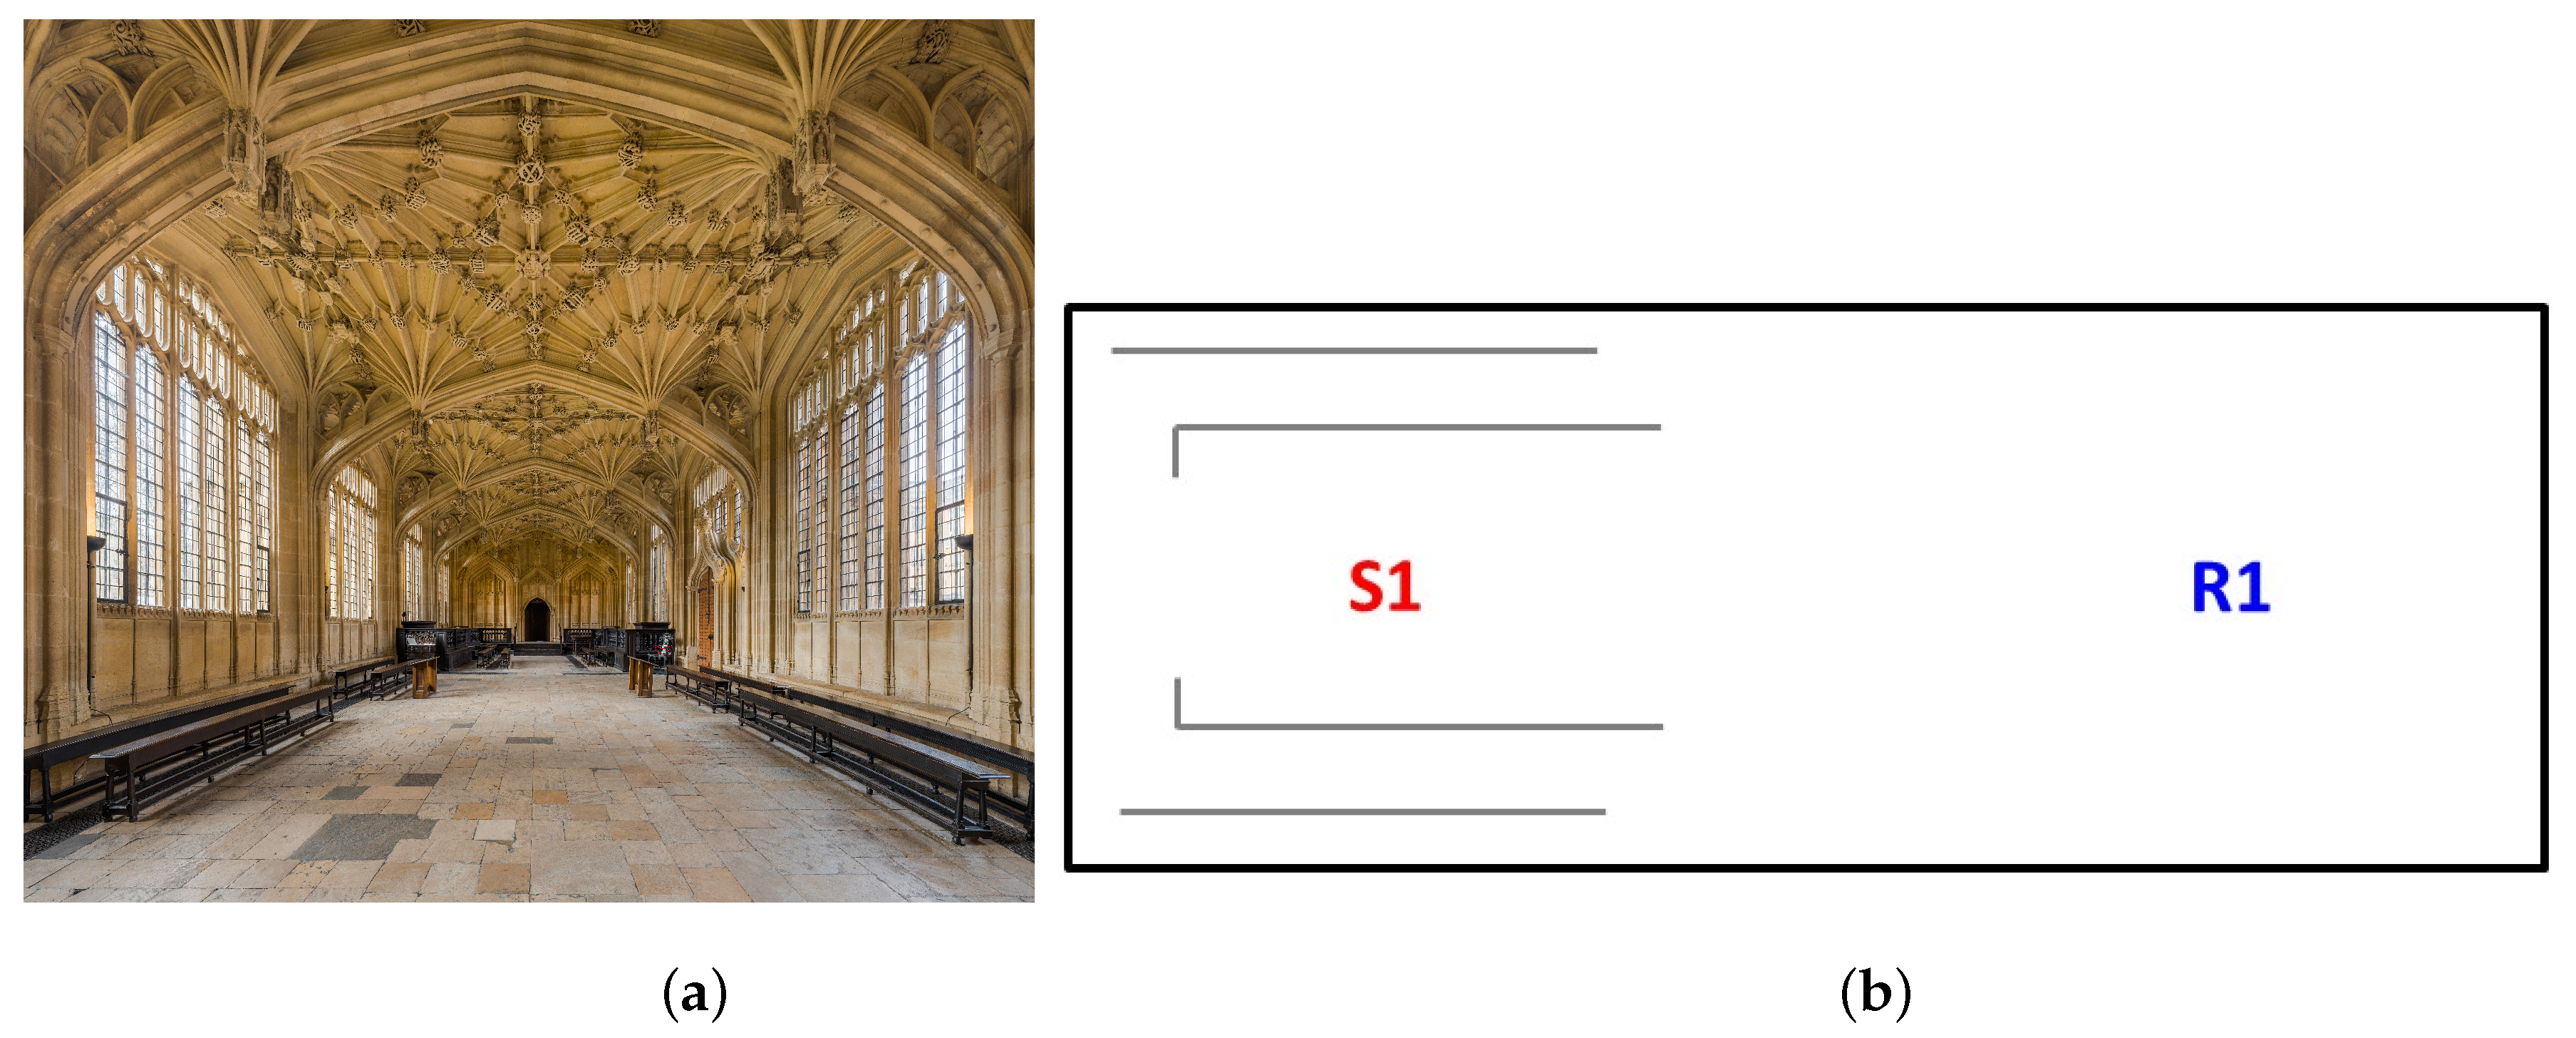
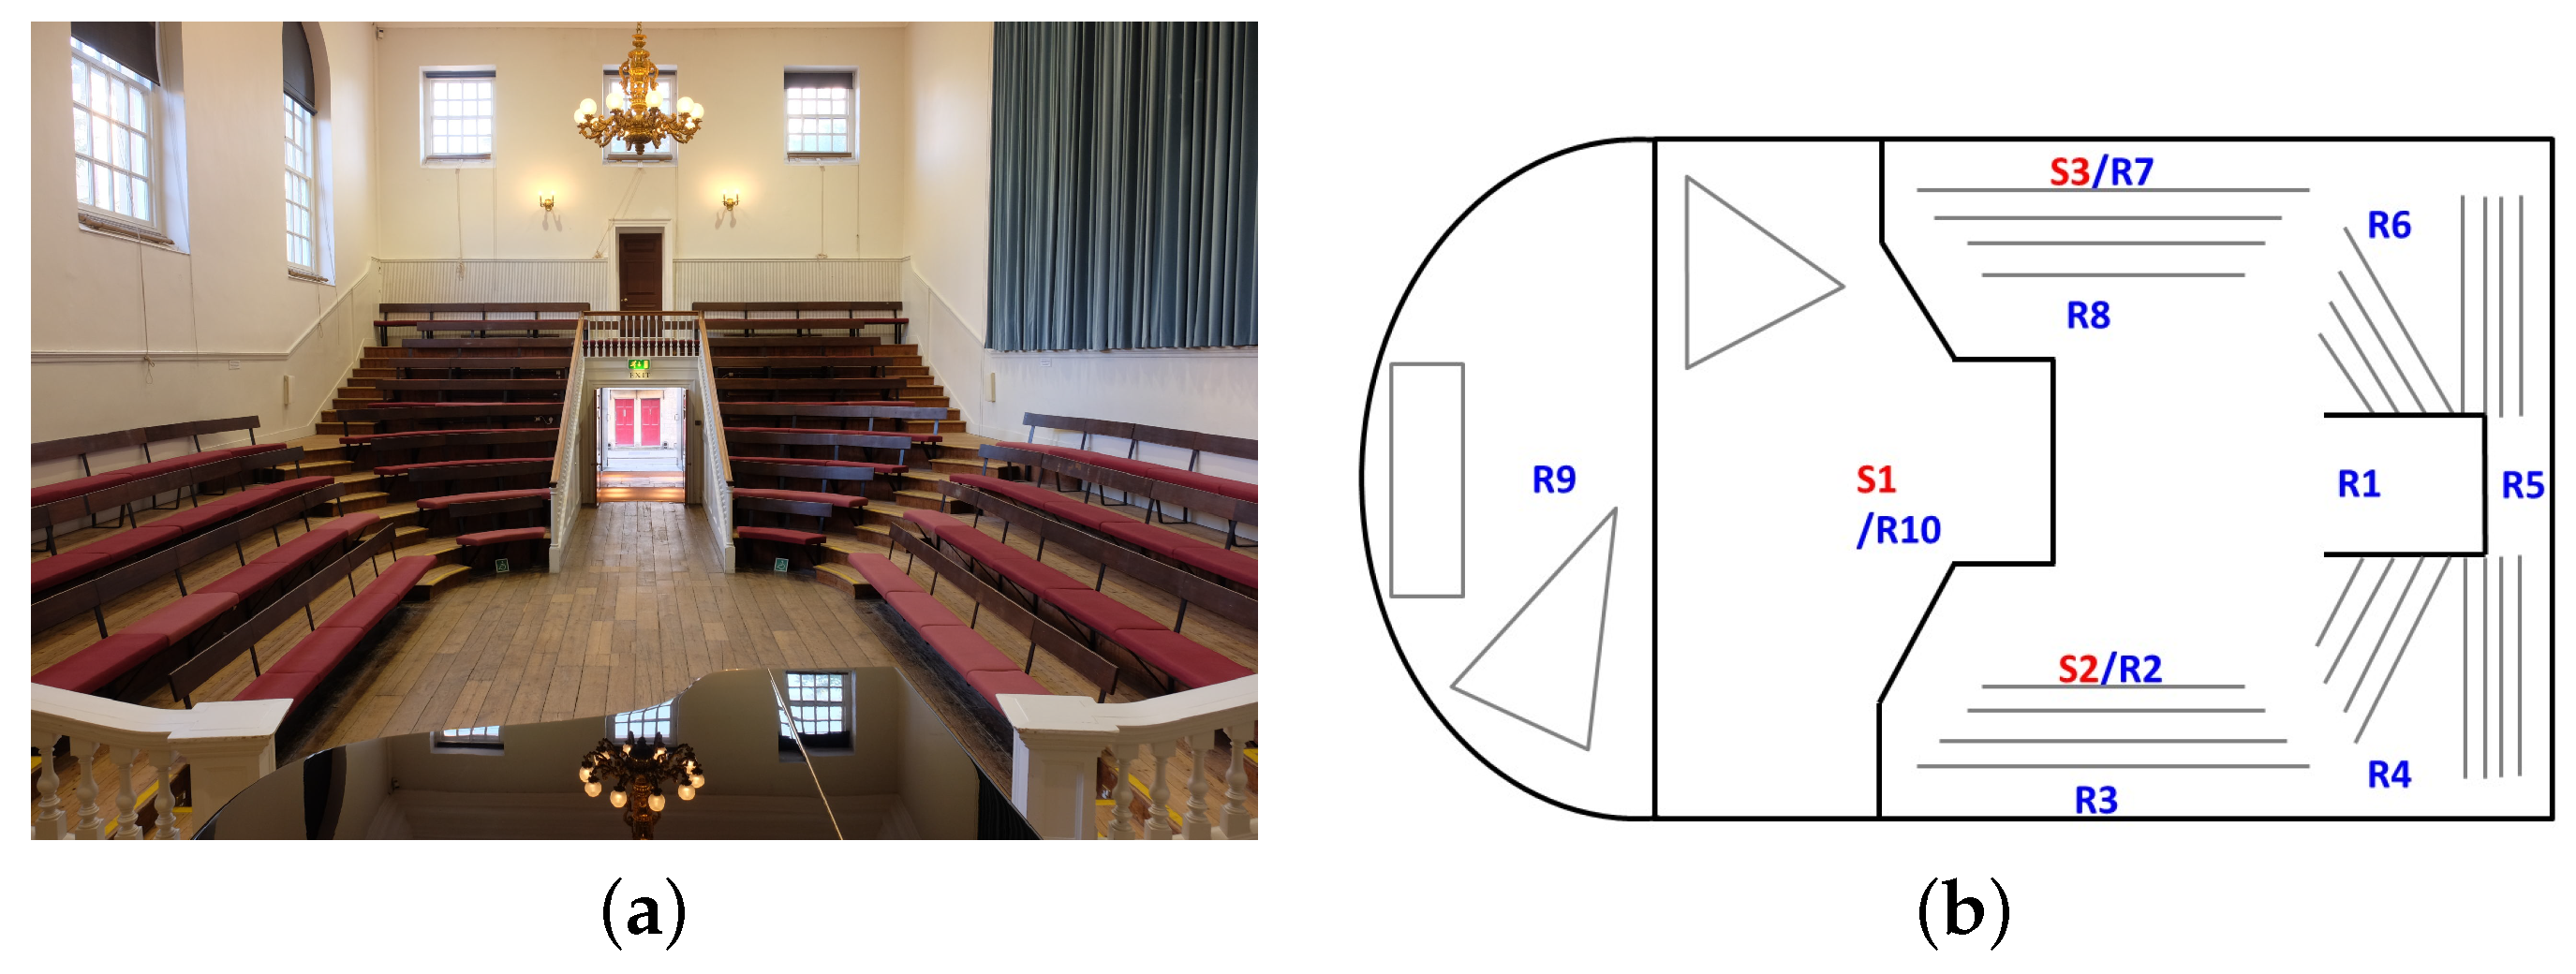
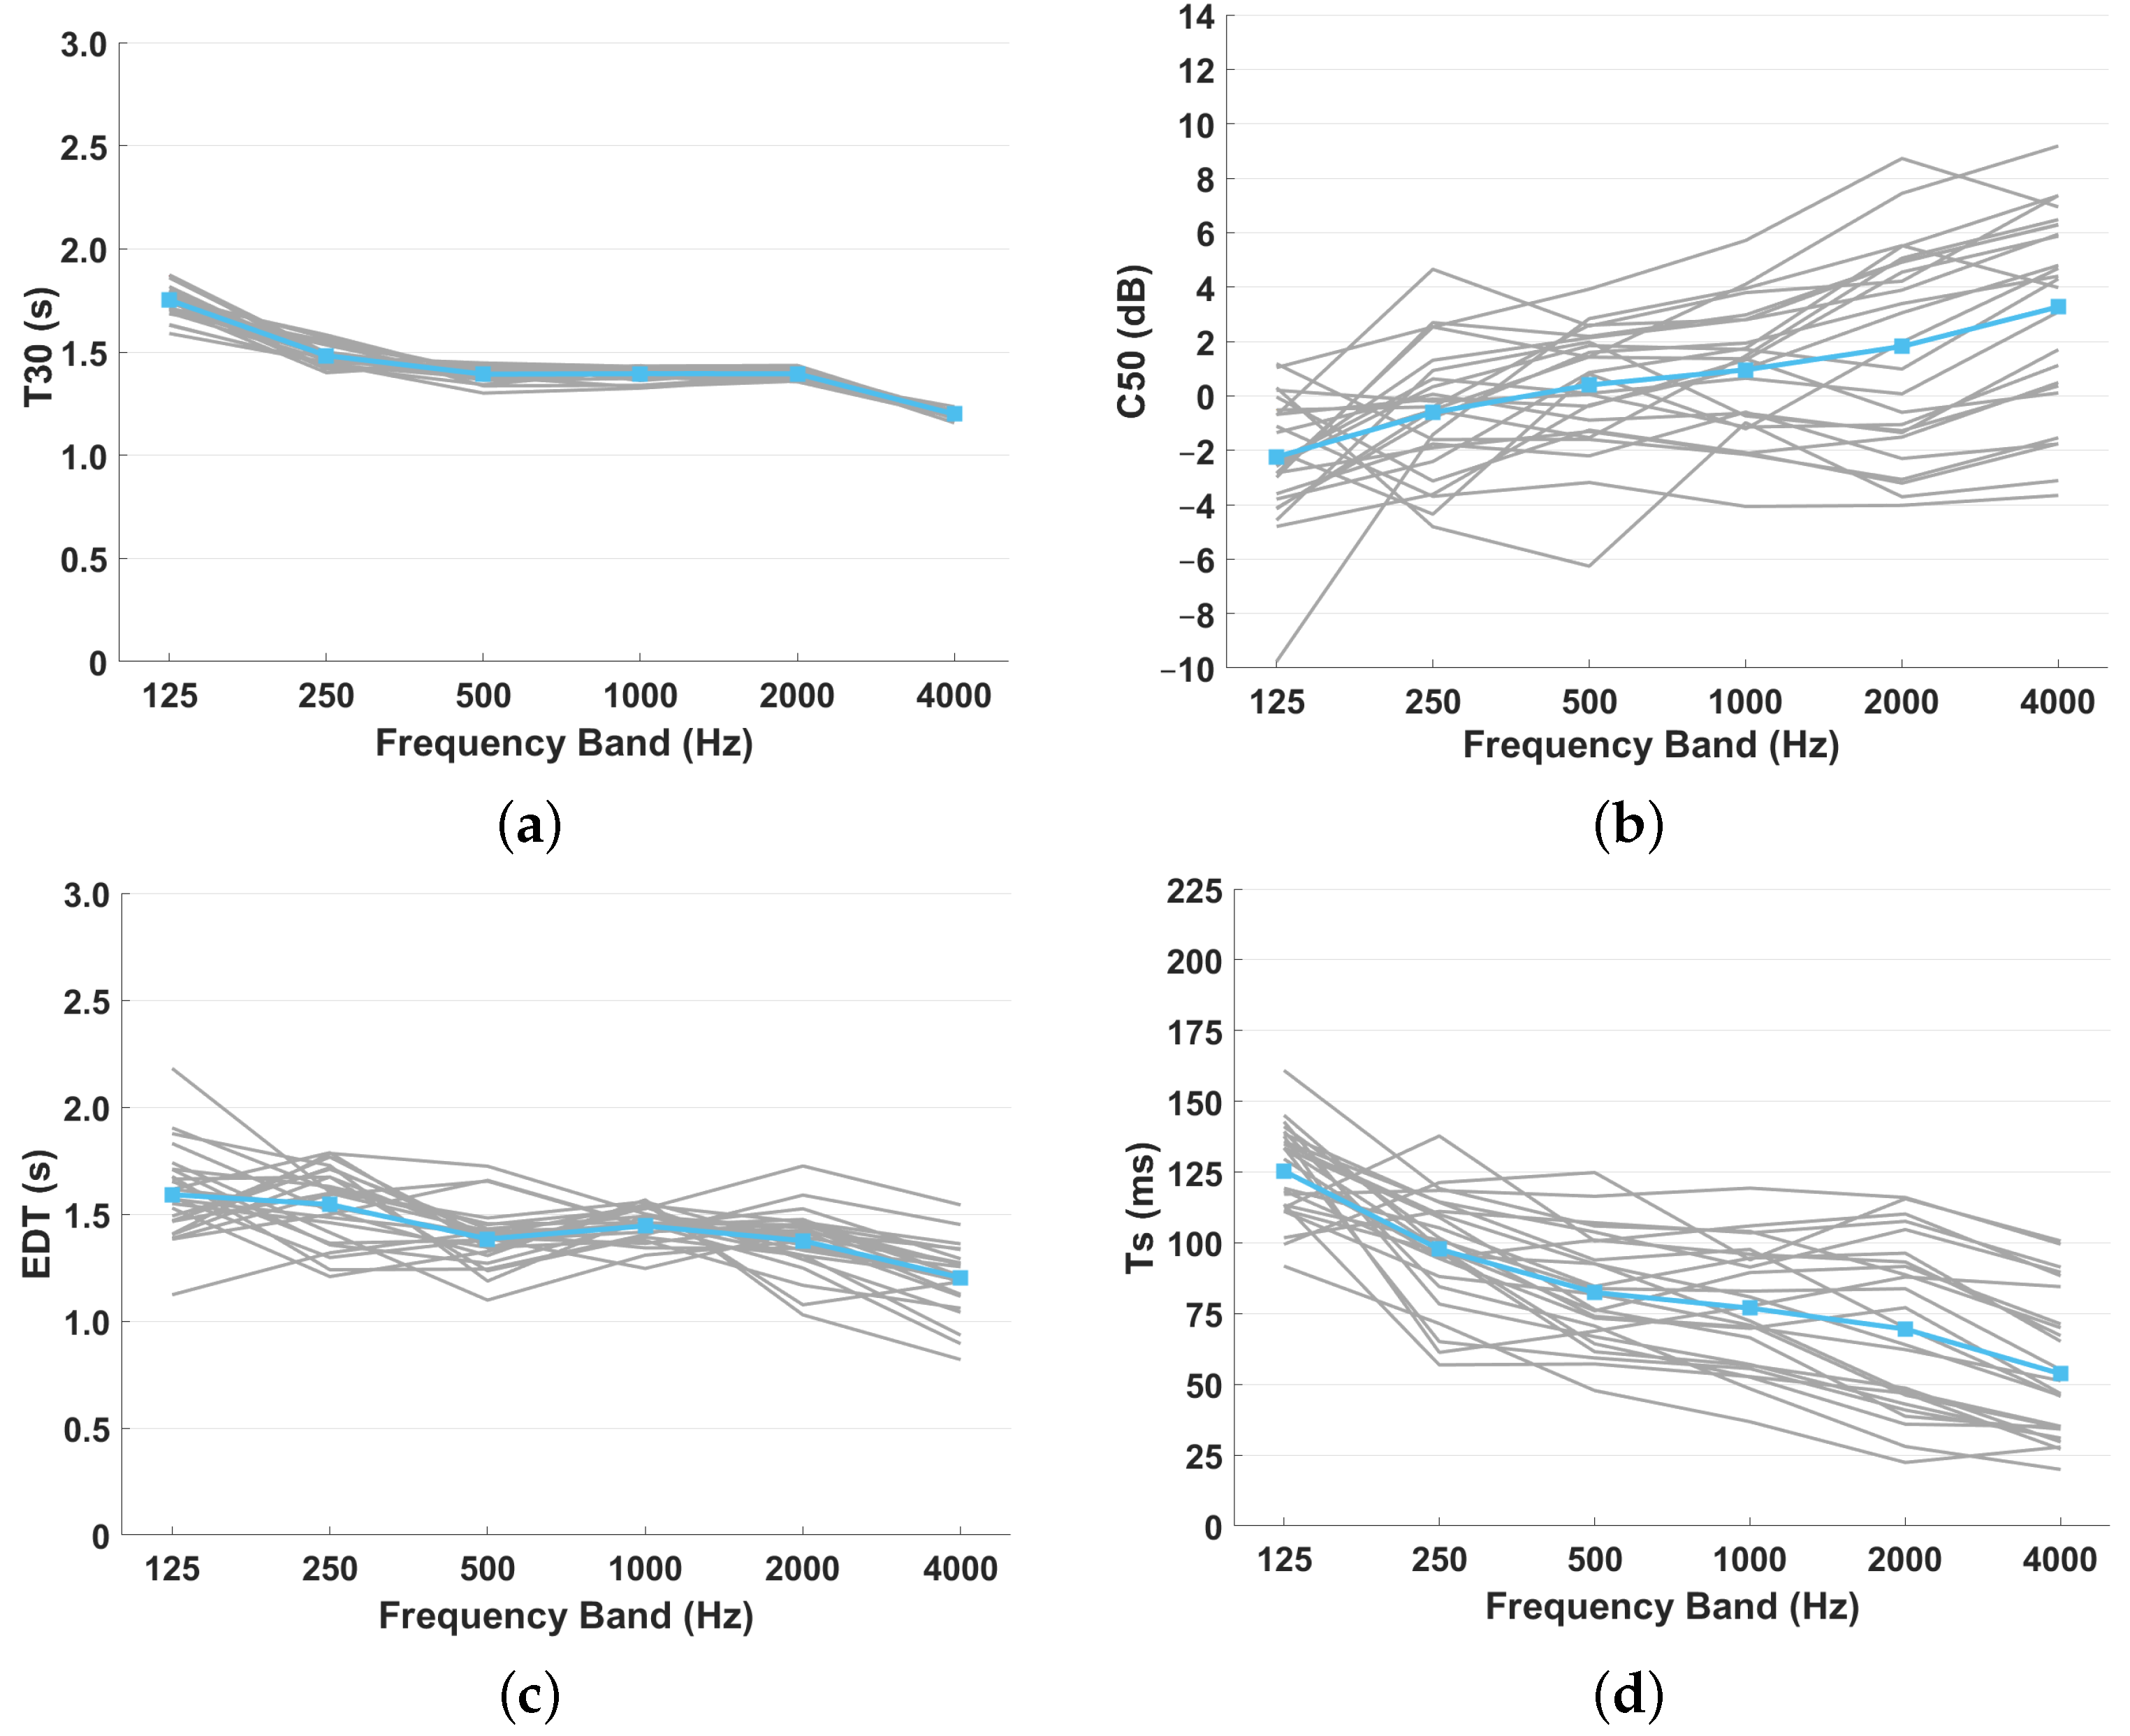
The Convocation House (CH) at the University of Oxford is part of the Bodleian Library and was formerly used for meetings of University committees. During the English Civil War and again in 1665 and 1681, it was also used for meetings of the House of Commons when Parliament was summoned to Oxford, which makes it an especially interesting space to compare with the designed model of the House of Commons at Westminster. It is a rectangular shape with dimensions of 18.55 m in length, 8.4 m wide and 7.63 m in height, with wooden stalls and wainscot decorating half of the height of the walls. During the measurements, three source locations were chosen and six receiver positions, resulting in fifteen source/receiver combinations, as shown in Figure 11. For the obtained average acoustic results in this paper, the measured position S2-R4 was excluded. The results of energy-based acoustic parameters (such as C50, C80 and D50) obtained from this position were quite different from the rest of the measurements in the space, as presented in [43]. Our explanation is that at location R4, the microphone was placed close to a wooden stand, which will have unduly influenced the acoustic behaviour at this location that was unrepresentative of the space more generally.
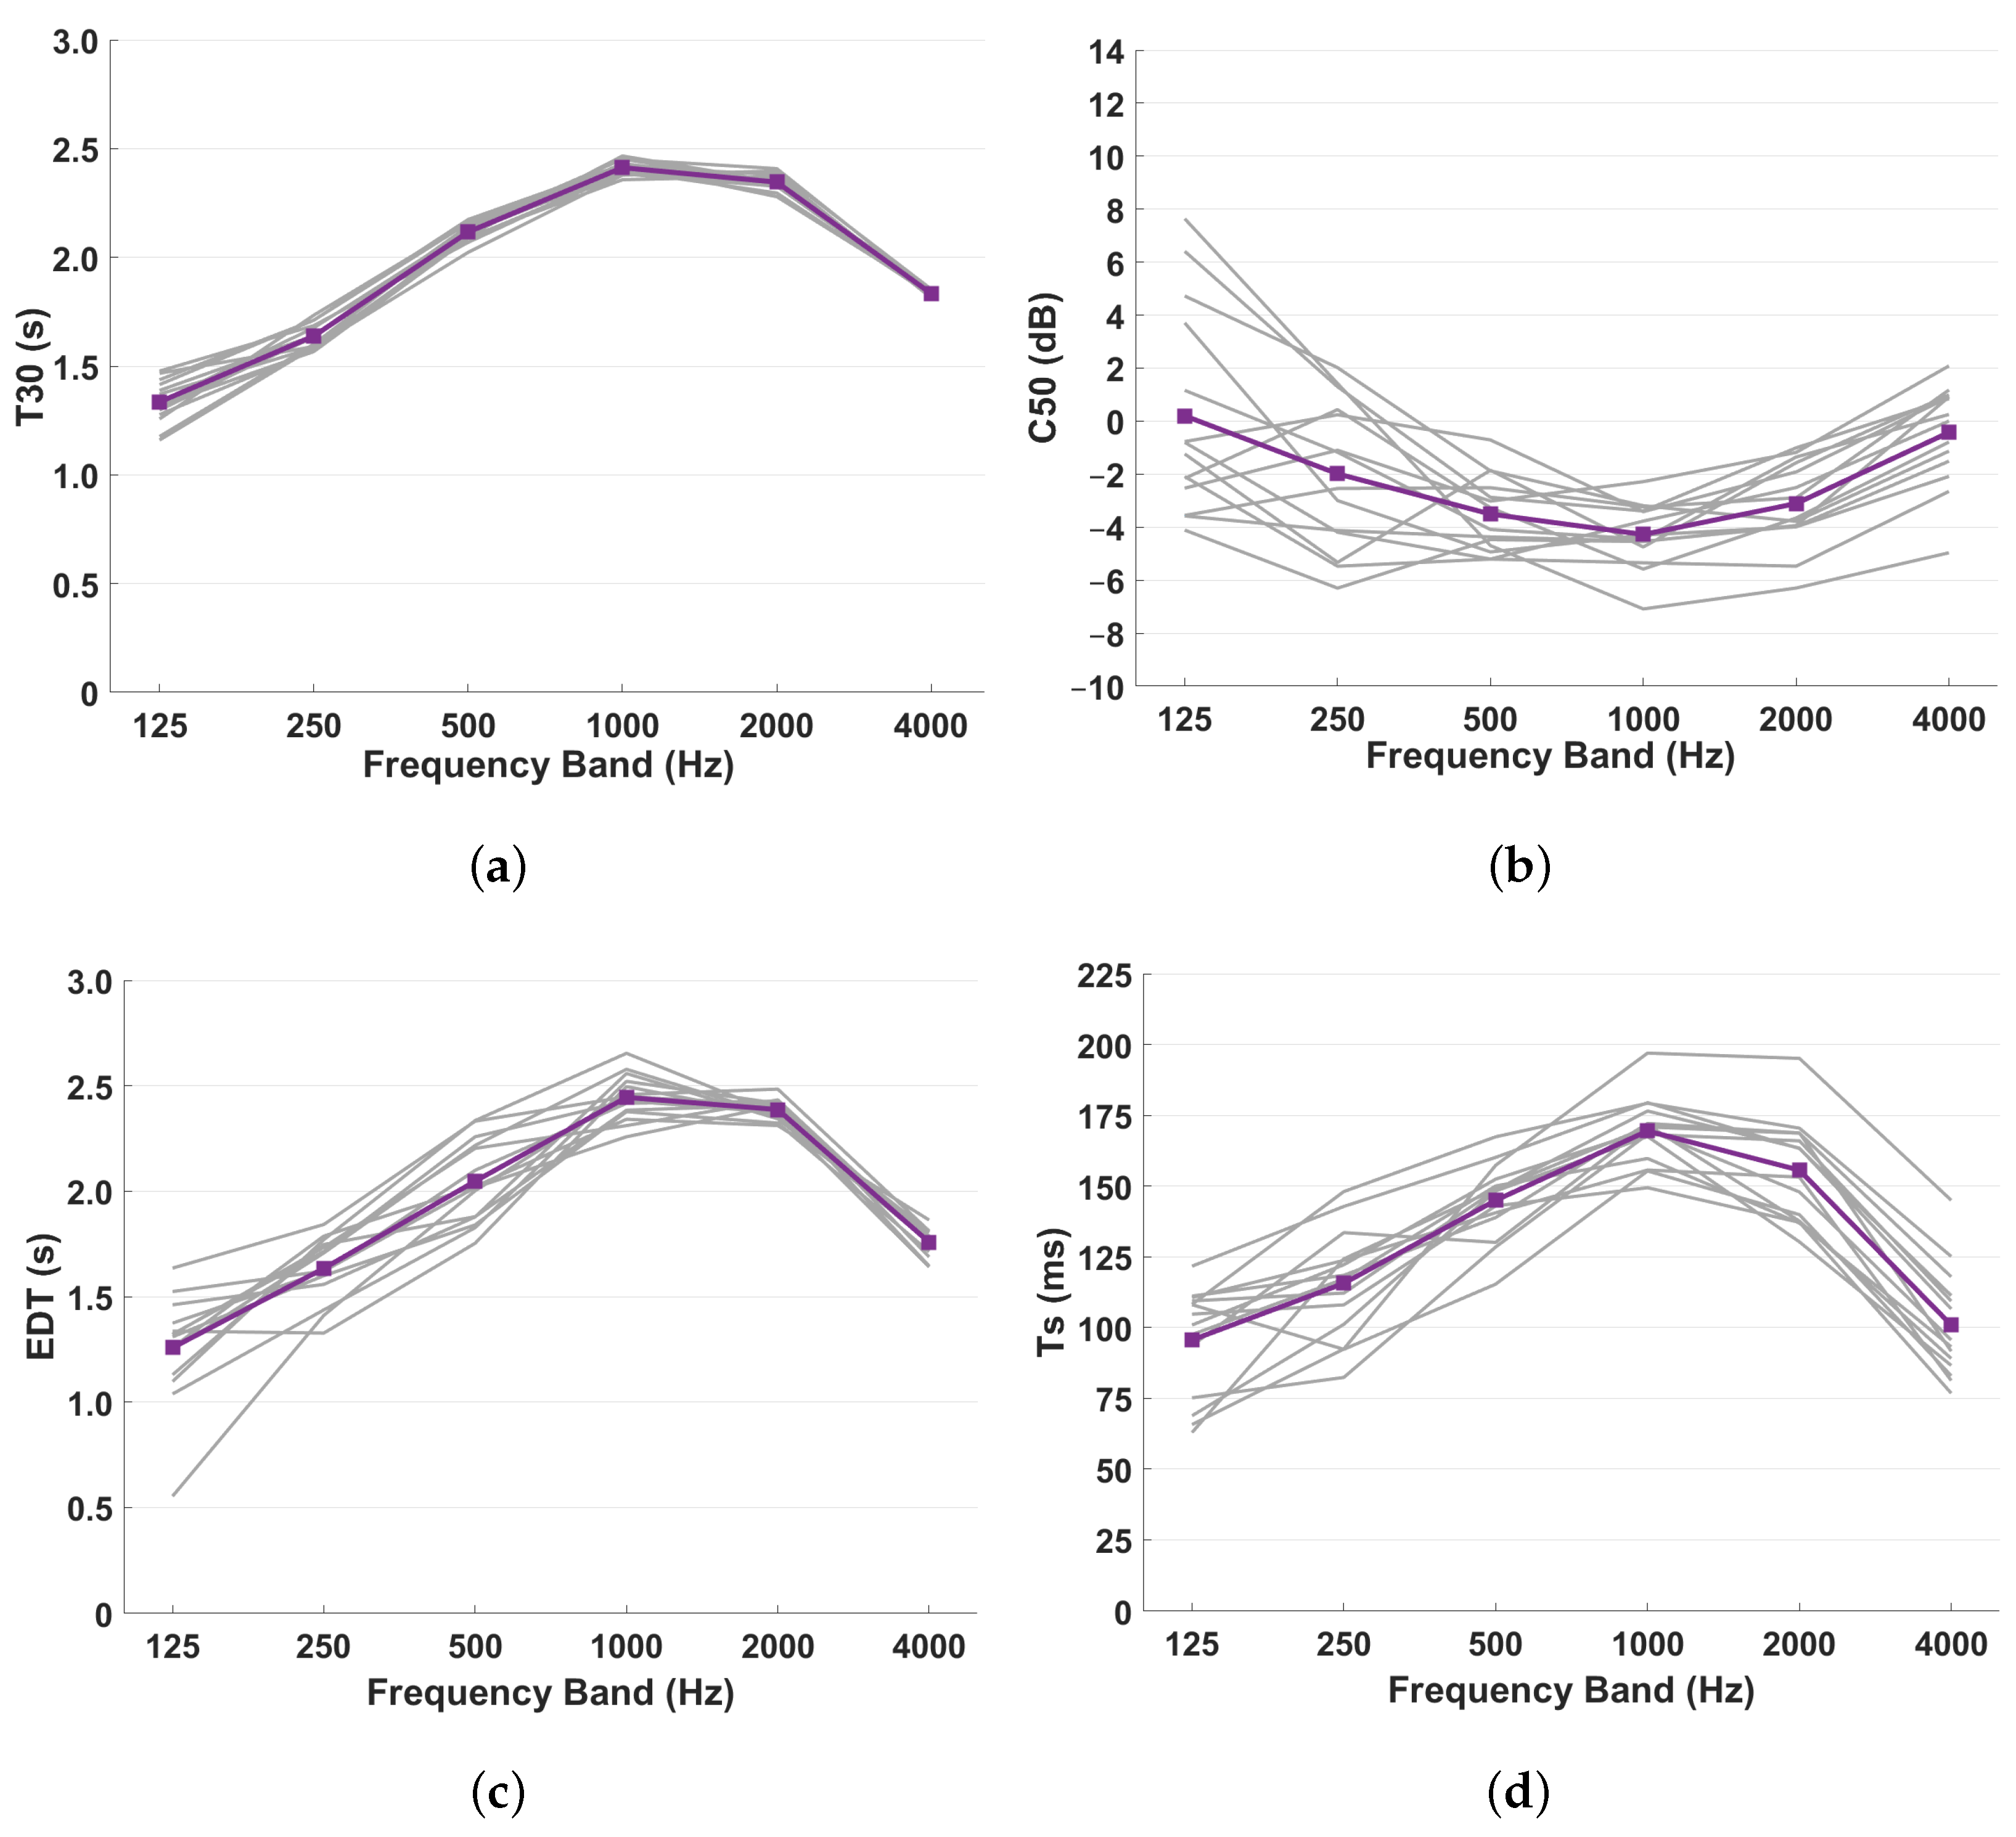
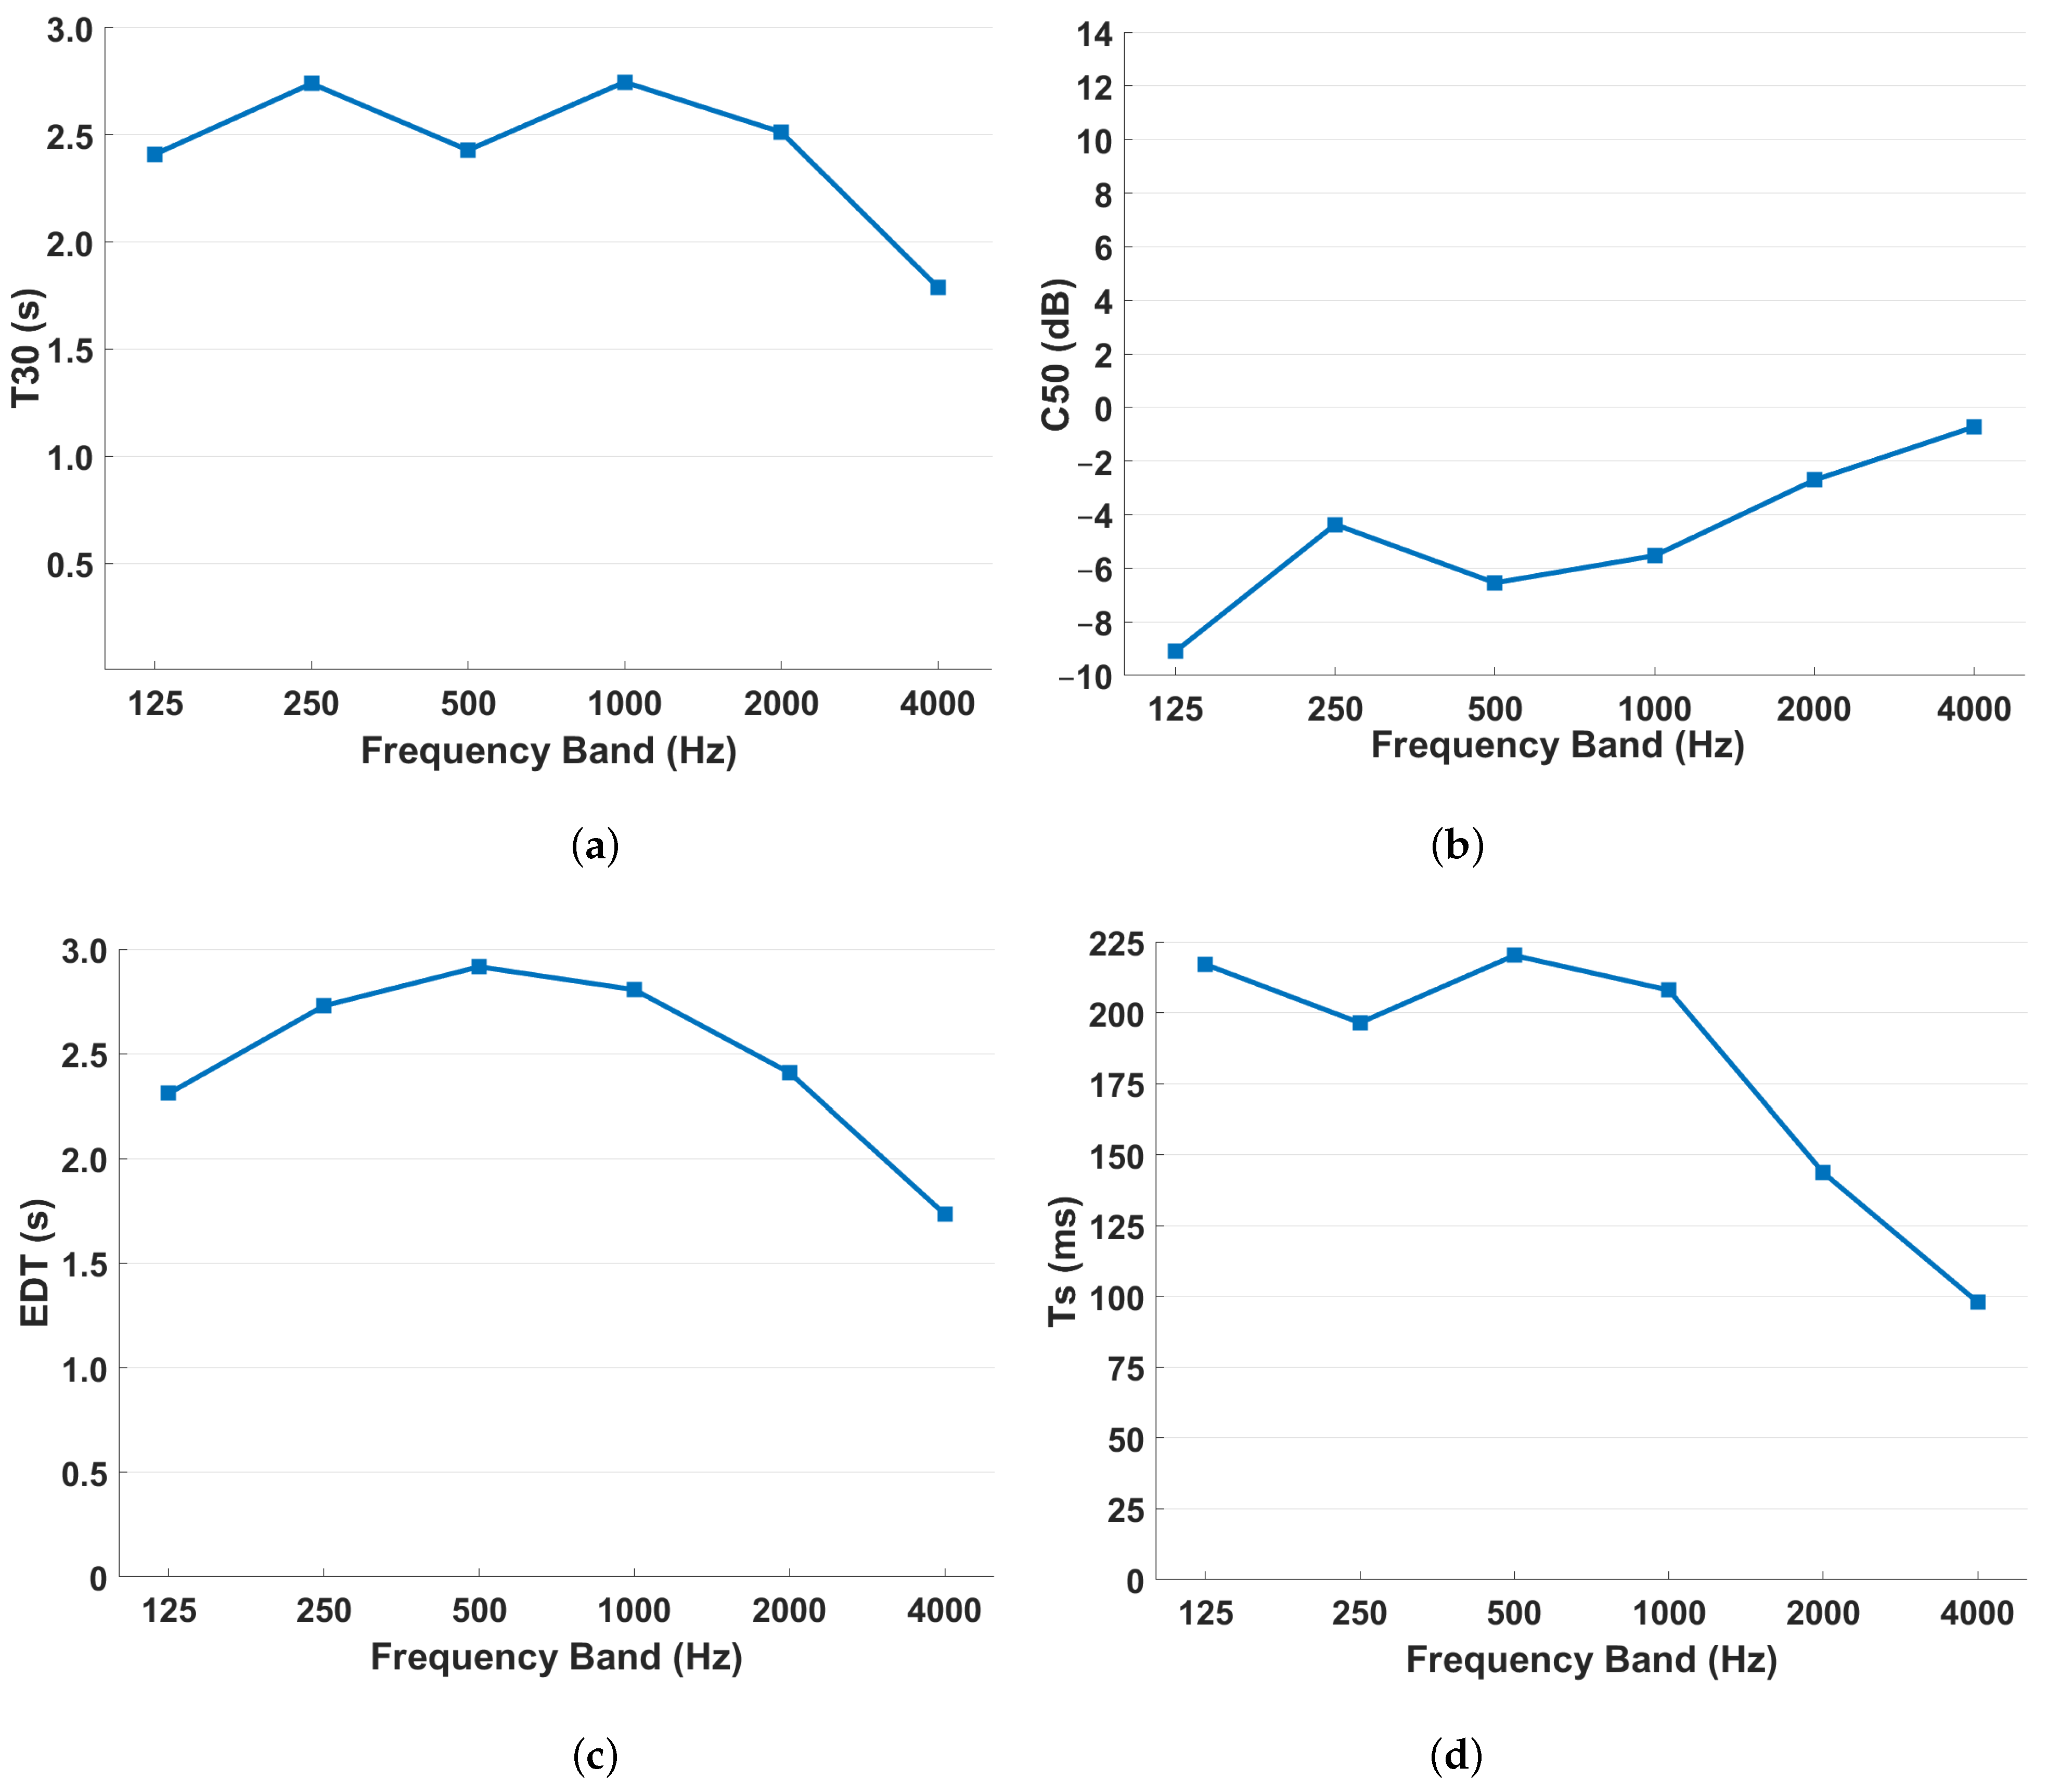
While the size and the architectural layout of the seating area are comparable with the House of Commons in the 1820s, the tiled floor and the vaulted ceiling make the space more reverberant, as is also found with examples of different ceiling designs in mosques [45], and as presented in T30 and EDT values shown in Figure 12. C50 and Ts values show high energy in the late reflections, which also indicate the perception of a reverberant space.
Figure 11.
(a) Convocation House, University of Oxford, photo by DAVID ILIFF. Licence: CC BY-SA 3.0 via Wikimedia Commons [46] and (b) floor plan of the measured positions.
Figure 11.
(a) Convocation House, University of Oxford, photo by DAVID ILIFF. Licence: CC BY-SA 3.0 via Wikimedia Commons [46] and (b) floor plan of the measured positions.

5.2. Divinity School, Oxford
The Divinity School (DS) is adjacent to the Convocation House at the University of Oxford. During the English Civil War and in 1625, it too was used for meetings of the House of Commons. It has dimensions of 27.6 m in length, 10.3 m in width and 7 m in height and is constructed from stone, marble, and large panelled windows. A single source/receiver position measurement was obtained for this space, as shown in Figure 13.
Its architectural characteristics and materials, as well as the lack of additional furnishing, indicate a much longer reverberation time compared to the c. 1820–1834 House of Commons chamber. Similar to the Convocation House, T30, EDT and Ts values (as shown in Figure 14) are quite high, with very poor clarity for speech (C50) as well. The highly reflective materials on the walls, as well as the long rectangular shape of the space, also cause high reverberation of low frequencies in comparison with the wooden furnishing in the Convocation House.
5.3. Modern House of Commons Chamber, Palace of Westminster
The modern House of Commons chamber (HoC), being built in a somewhat different style, is not directly comparable with the House of Commons as it was in the period 1820–1834. The use and purpose of the space for speech and debate were taken into consideration when the space was designed. This represents a significant difference between the modern House of Commons and the model under study, as St Stephen’s Chapel had originally been intended for the sung liturgy. The study of the acoustics of the modern House of Commons, however, offers useful information on the possible acoustic behaviour of the 1820–1834 model.
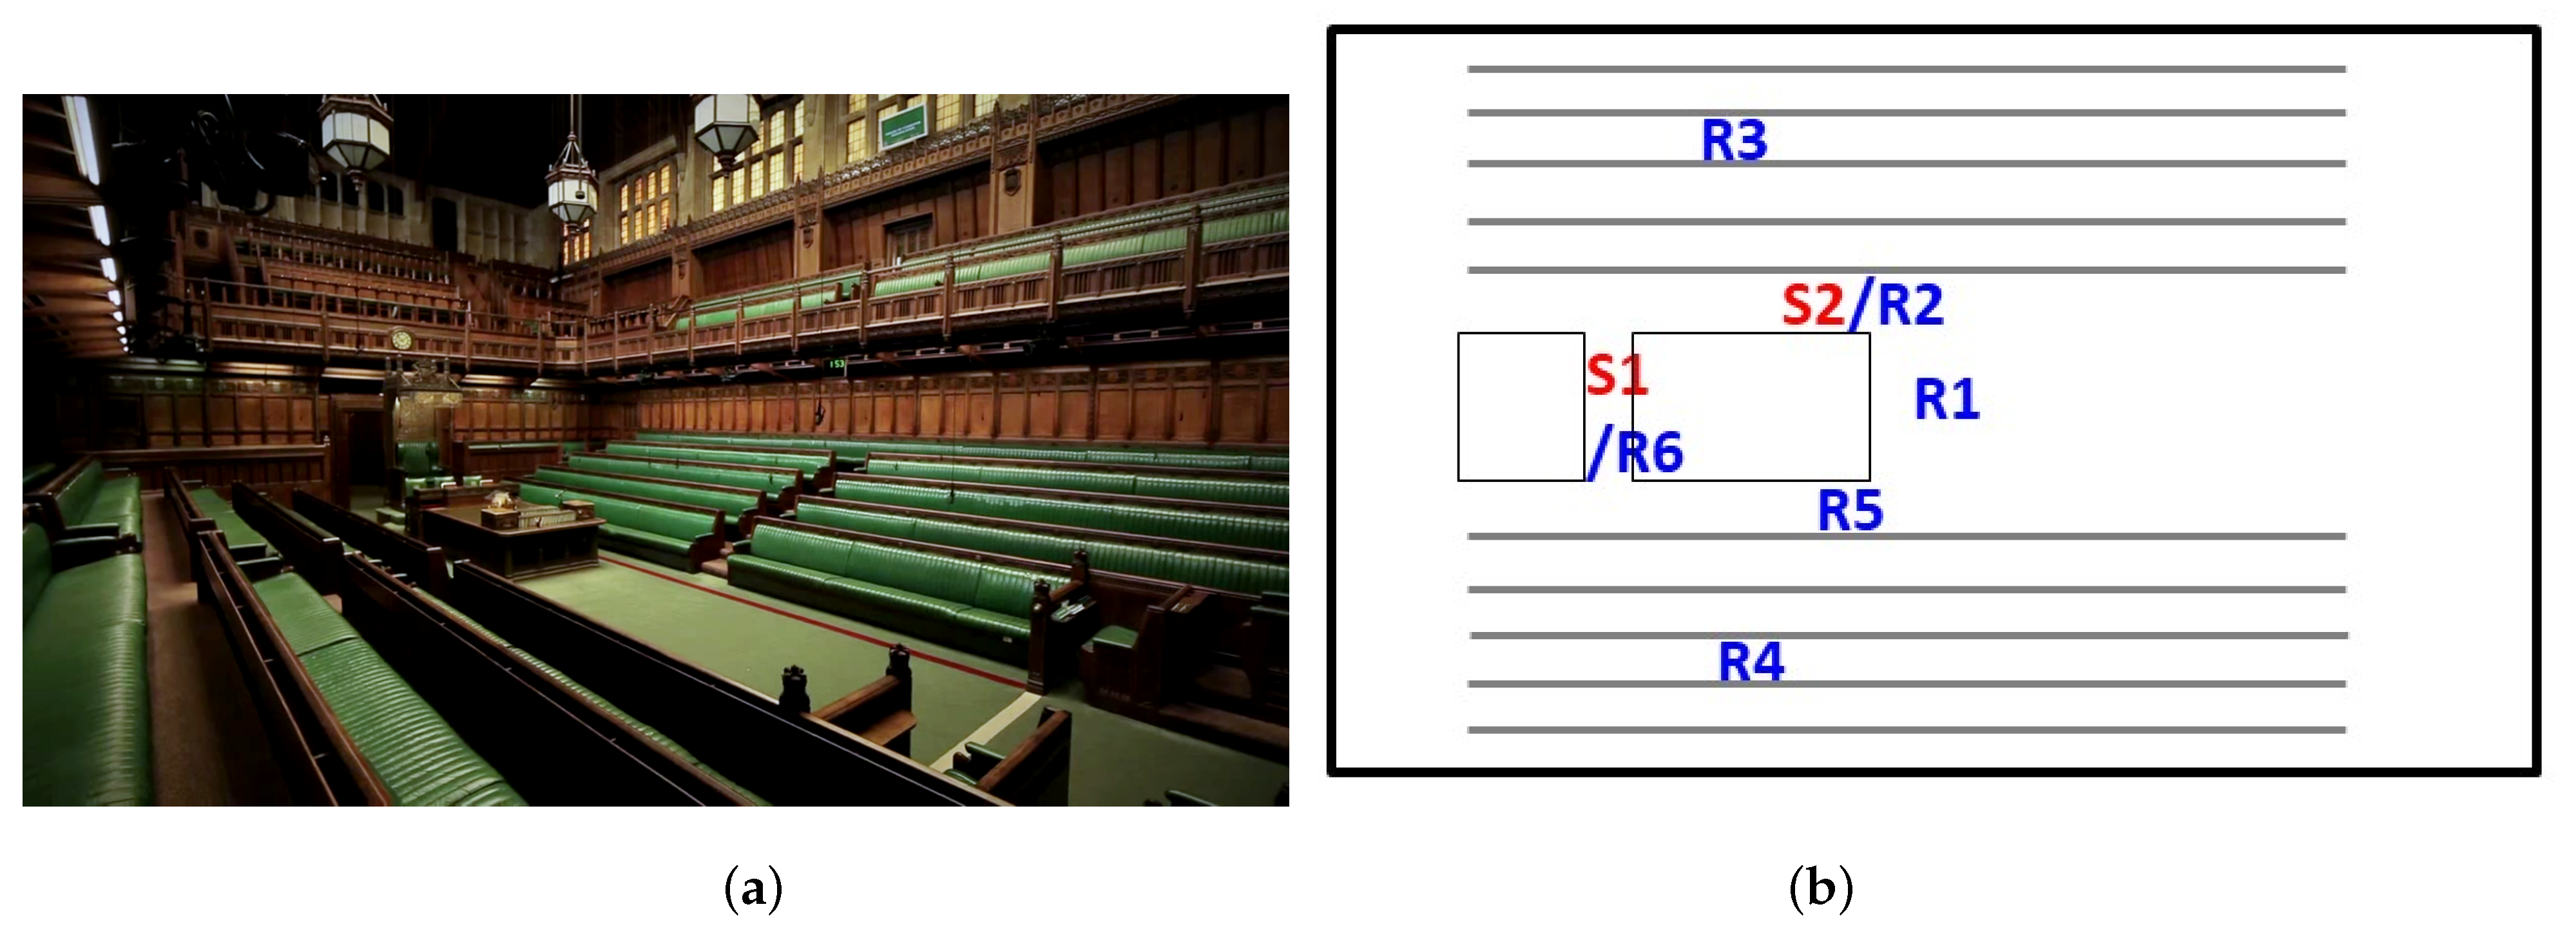
Designed by Sir Giles Gilbert Scott in 1950, the current House of commons deliberately echoes the same architectural style as the previous chambers, with the benches laid out in parallel rows across the length of the room. Its dimensions are 21 m in length, 16 m in width and 14.7 m in height, with a volume of approximately 4839 m without furnishings. Two-thirds of the walls are covered with wooden coffered benches and galleries, which work as acoustic diffusers, while the tops of the walls are covered with stone columns and large windows. The roof beam ends on a long roof window, the floor is covered with carpet, while the wooden benches are upholstered with green leather at the back and on the seats. Two source locations and six receiver positions were used during the measurement process, resulting in eight source/receiver combinations, as shown in Figure 15. The measured position S2-R5 was excluded from the averaged results obtained here. It was noted that the receiver position was in the near field of the sound source, and this unduly influenced the acoustic results (e.g., T30) obtained at this location that, upon inspection, could be seen to be unrepresentative of the space more generally [43].
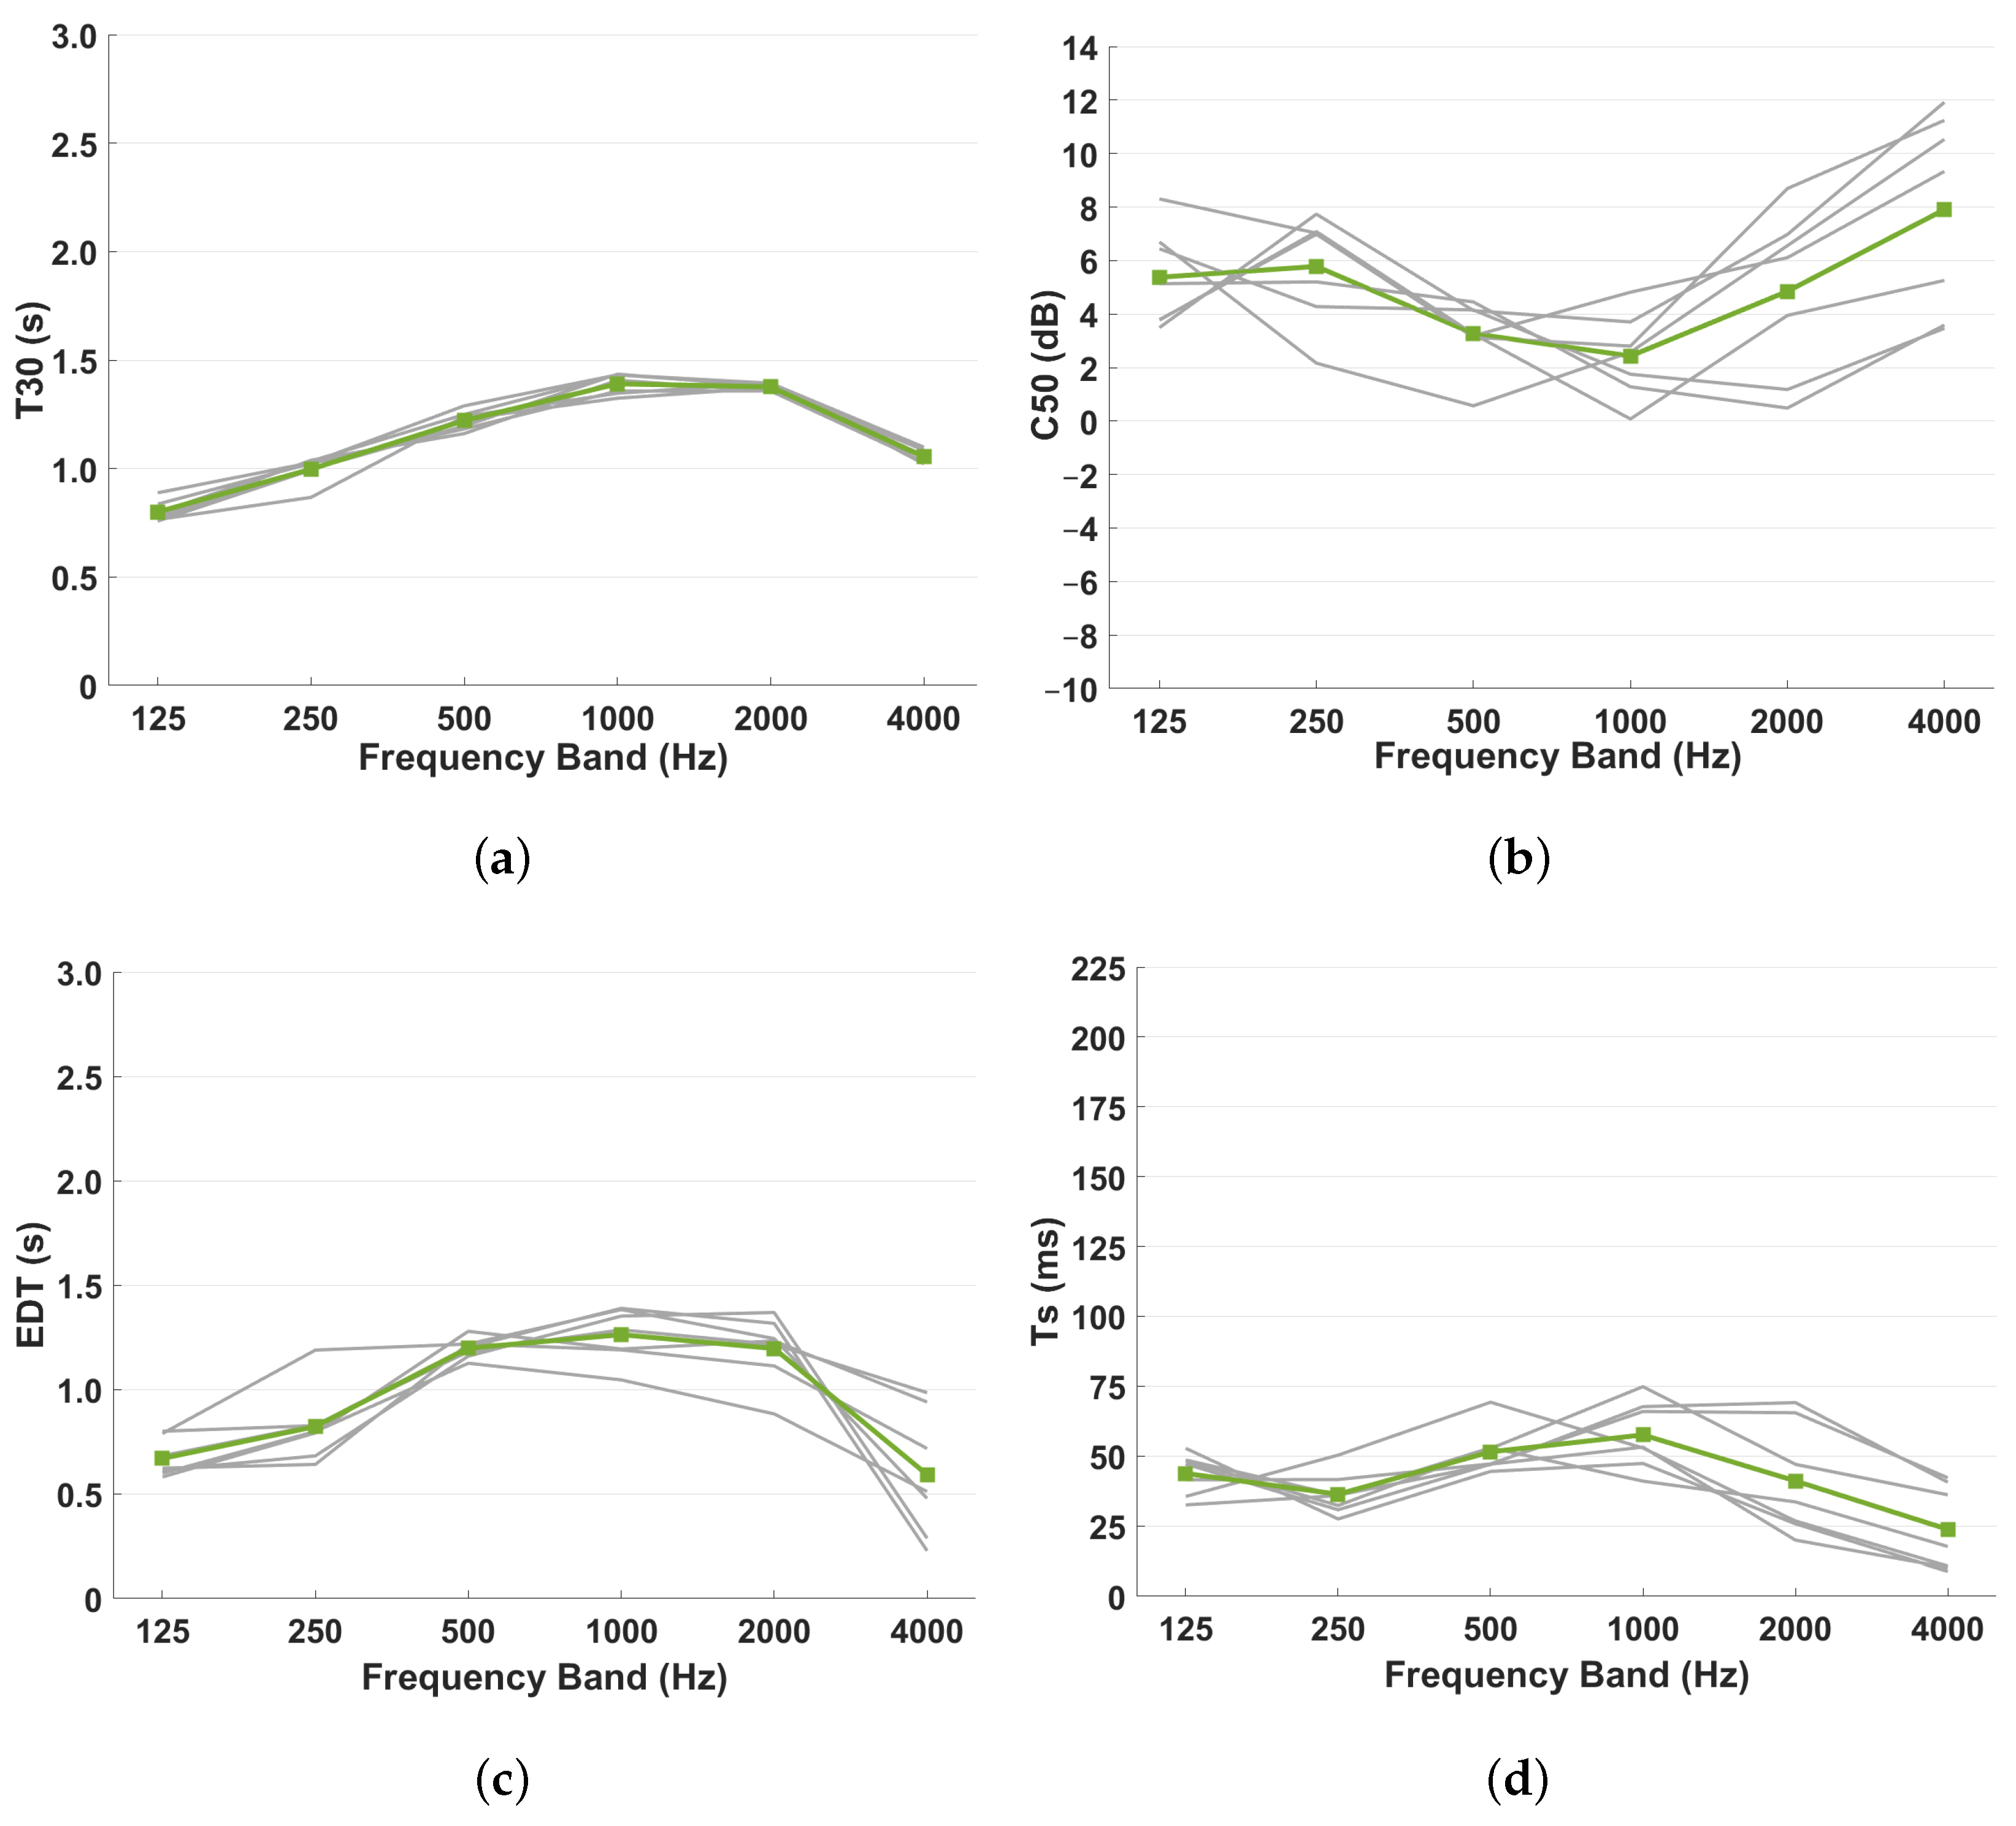
Despite the large volume, the materials in the space absorb a significant amount of sound energy, which impacts the values of the acoustic parameters obtained from the measurements, as shown in Figure 16.
5.4. Holywell Music Room, Oxford
The Holywell Music Room (HMR) was built in 1748 and is considered to be the first custom-built concert hall in Europe [49] (Figure 17), with dimensions of 19.7 m in length, 9.77 m in width and height of 9 m, and a volume of approximately 1732.22 m. While its acoustics are suited for chamber music, and it is particularly well-known for performances of Haydn, there are no direct links with parliamentary history or meetings of the House of Commons within this space. However, its layout with the parallel benches across the room and a gallery at the back, together with the wooden floor and benches covered with cushions, makes the space comparable with the previous spaces and the model under study. It is worth noting, however, that the ceiling and walls are covered with plastered brick, making the space more reverberant than the c. 1820–1834 House of Commons model with its wooden coffered walls, and this was noted after a comparison of absorption coefficients for these materials in [15,23,38]. There is also a curtain installed across the west wall of the space, which should reduce the reverberation time further, as well as help prevent flutter echoes between the two parallel walls. Twenty-seven impulse responses were obtained during the in situ measurements from a combination of three sound source locations and nine receiver points. The measured position S1-R9 was also excluded from the averaged results presented in Figure 18. Upon inspection, the results of energy-based parameters (C50, C80, D50) were quite different from the rest of the measurements. A closer look at the time domain impulse response revealed that strong early reflections could be evidenced, potentially due to the concave nature of the stage and its focal point coinciding with position R9. This measurement was, therefore, considered to be unrepresentative of the space more generally and so unsuitable for this acoustic analysis.
5.5. The Guildhall Council Chamber, York
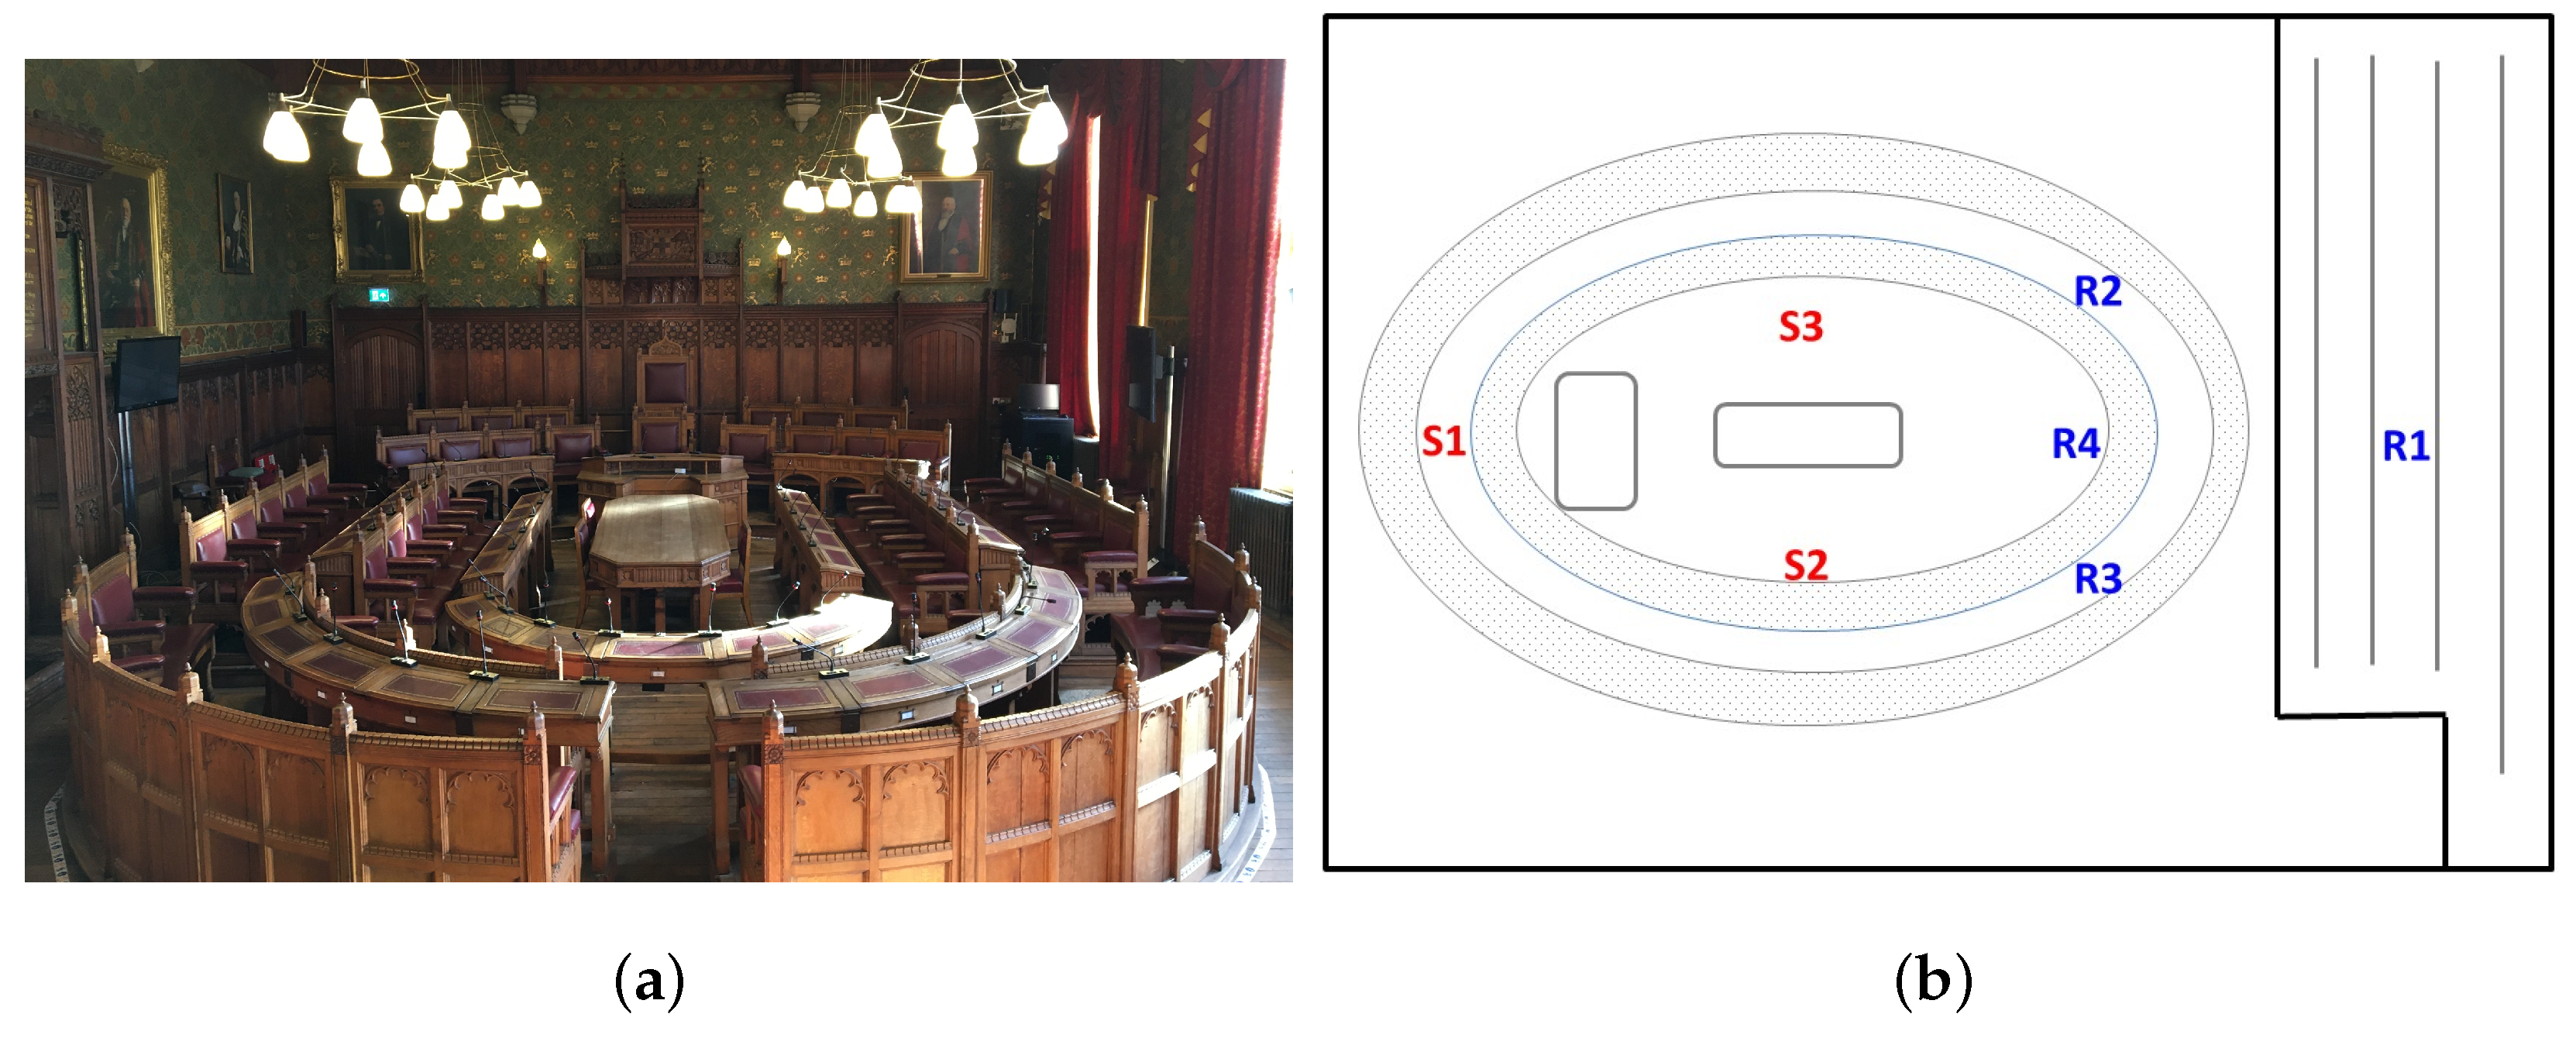
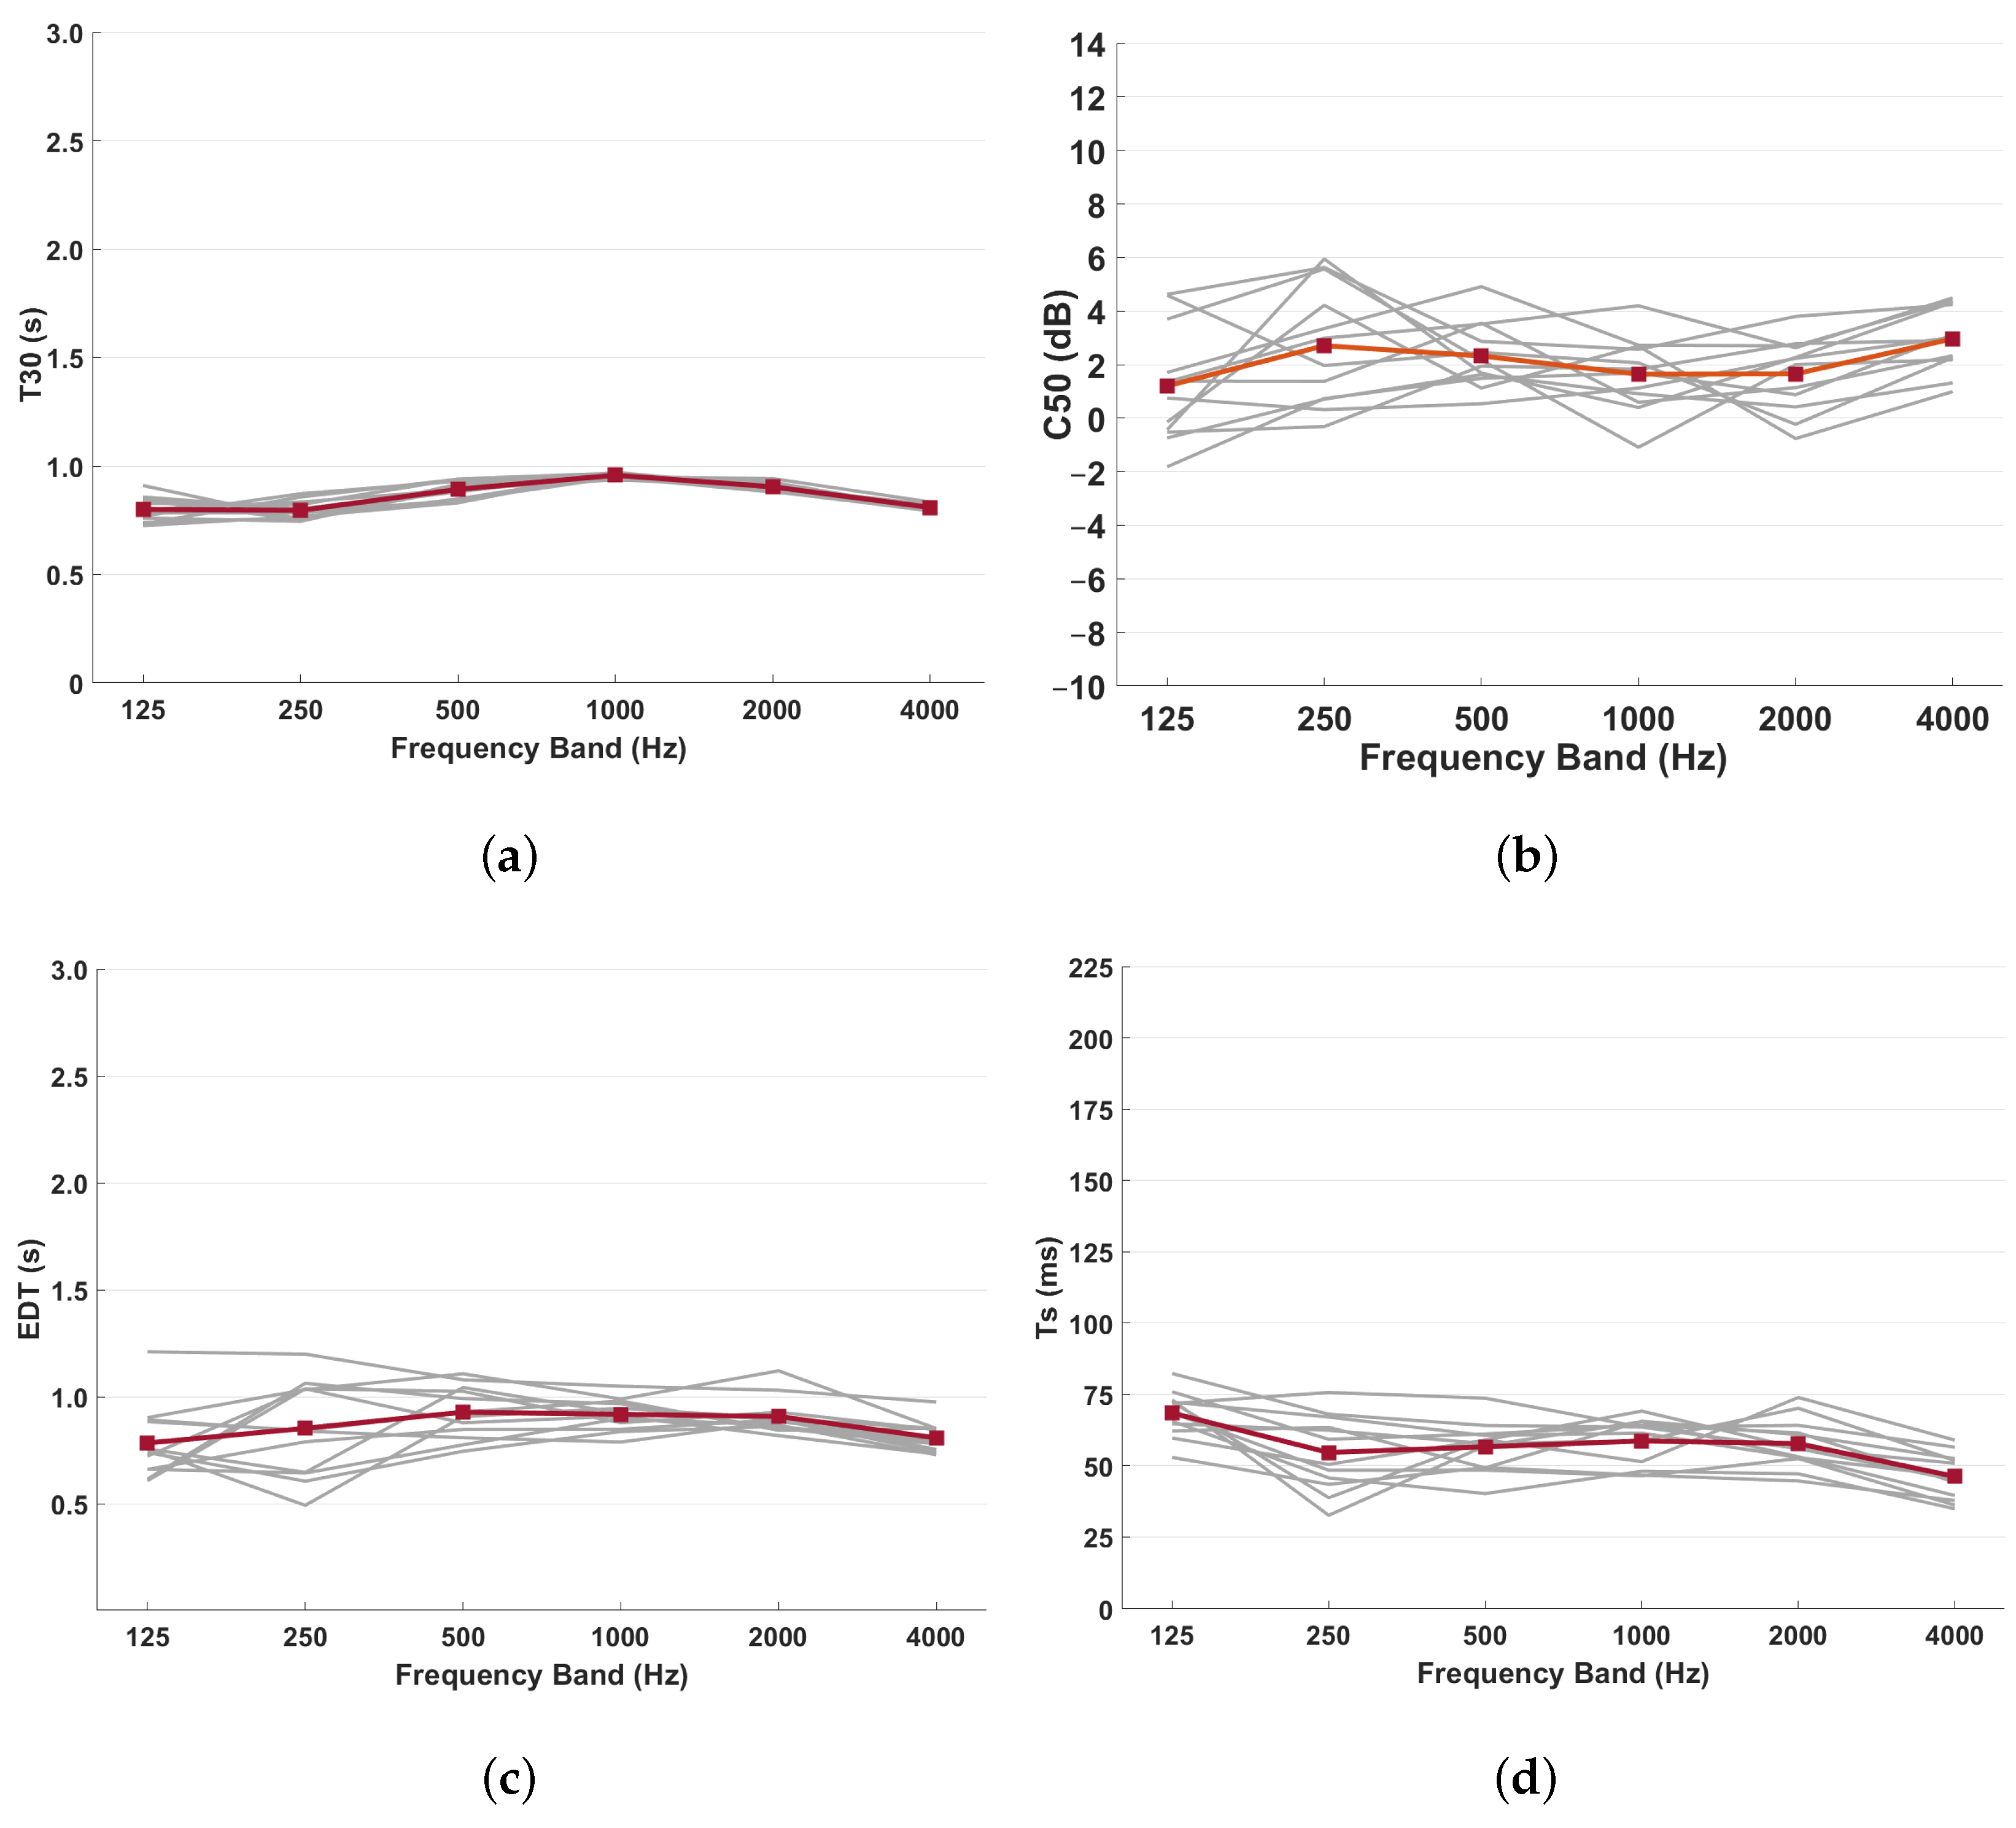
The Council Chamber of York Guildhall (YGCC), built in 1888–1891, has significant architectural similarities with the historic House of Commons chamber. As Figure 19 shows, the members of the council are seated in an oval layout of wooden benches, surrounded by wooden panels on the walls from the floor to approximately 2.5 m in height. The rest of the height of the walls is wallpapered plaster up to the ceiling, which is arched and timbered. In addition to the comparable layout of the seated area, where members face each other during debates, it is worth noting that this particular space shares very similar dimensions and construction materials to the House of Commons chamber of c. 1820–1834. The York Council Chamber measures 15.23 m in length, 10.04 m in width, and 8.68 m in height and is approximately 1327.24 m without furnishings. Twelve combinations of source/receiver had been obtained from three source and four receiver positions. The acoustic results of all these source/receiver combinations for T30, C50, EDT and Ts, were averaged and presented in Figure 20. It is noticeable that all the studied parameters have a flat curve across all the frequency bands, overall presenting very good acoustic characteristics for speech.
6. Results and Discussion
For the evaluation of the designed model, we have followed two approaches, and the results are analysed and discussed in this section. First, the results of the two models (the latest version in CATT-Acoustic and the one in ODEON) are presented, and their comparison provides us with confidence in the decisions made for this simulation. Secondly, the results of the acoustic parameters of the five existing spaces, as discussed above, are compared with the final version of the ODEON model, and conclusions are drawn in relation to the validity of the final model.
All the presented results have been analysed using the Aurora tools; both those from the in situ measurements and also those from the impulse responses generated by the two software applications. By using a common calculation tool for all, we aimed to avoid any further uncertainties regarding the calculation methods that the different software may use for the acoustic parameters.
It is also worth explaining that for this study, we used the average results of all the measured positions for all spaces. While the recent practice in the literature discourages this approach, as important information on local reflections and material characteristics can be overlooked when aiming to calibrate acoustic models, in this current study, any comparison of individual locations would have been meaningless, as the compared spaces and in situ positions differ.
6.1. Acoustics of the Simulated Models
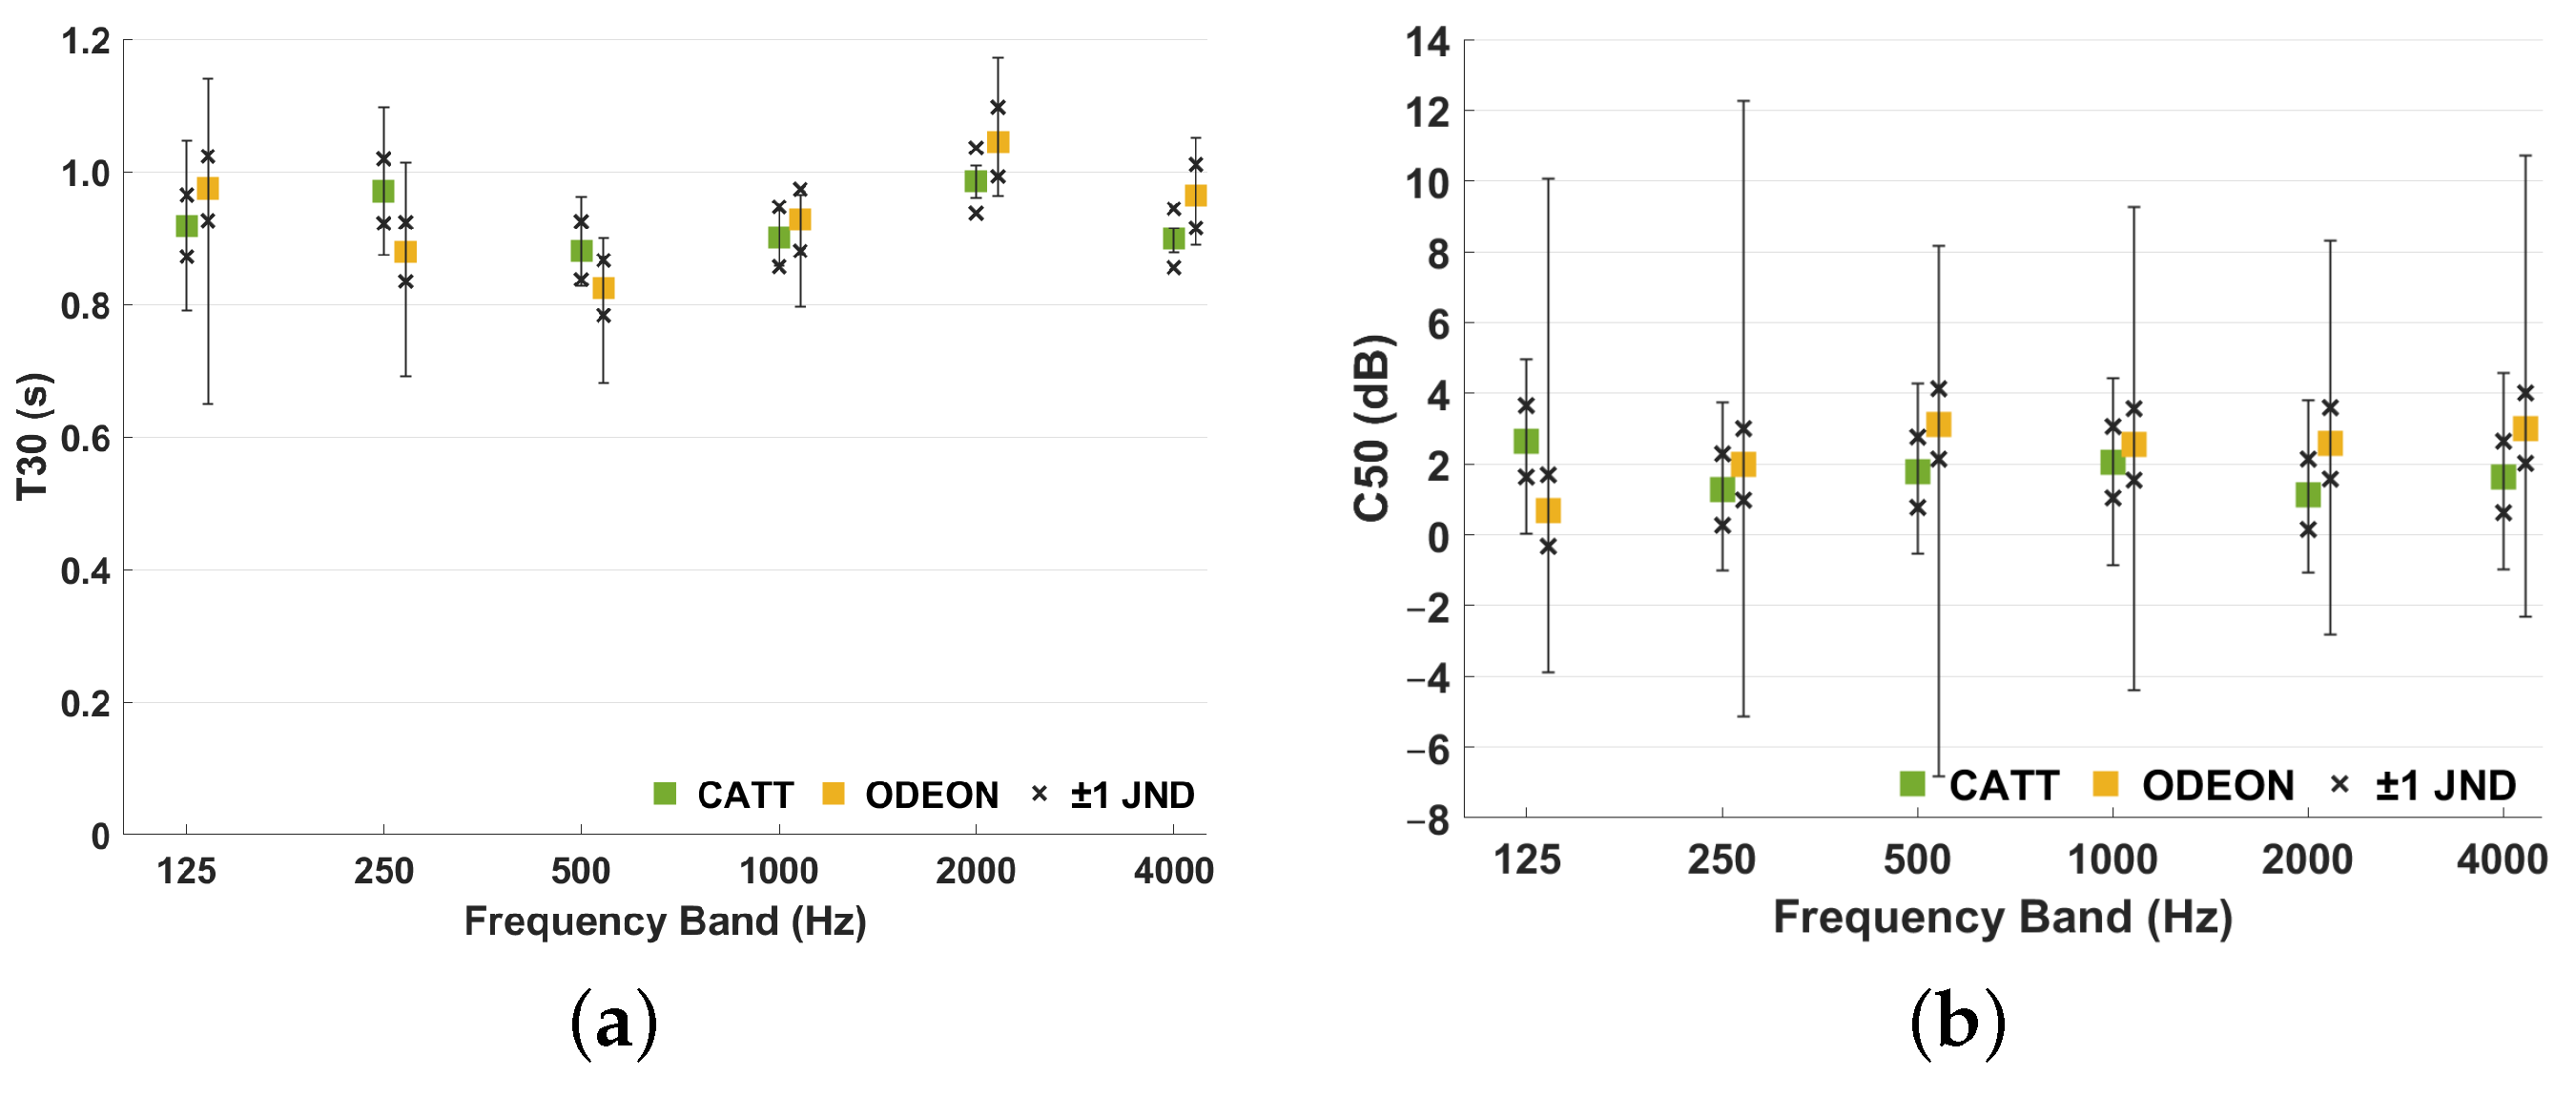
The two commercial software applications, CATT-Acoustic and ODEON, have been used for several studies and a significant amount of literature is available discussing their effectiveness in simulating enclosed spaces. While they are both based on geometrical acoustic methods, they have some important differences in their algorithms, which especially affects the scattering and diffusion prediction of the models. Thus, a comparison of the model from the two types of software can help to confirm the validity of the decisions taken for this studied space. For this final version of the model, the material wooden pews (A/S) with seat cushions (without persons) (WPC) from [36] was used for the seating areas. Figure 21 presents the results of both models for T30 and C50. The values are very close to each other, and for some frequency bands, the results are within 1 JND value for each of the parameters (these limits are indicated with X marks for each point). This gives us significant confidence in the decisions taken for each of the two software applications and their individual settings. The error bars present the standard deviation of the results across the eleven measured positions. It is noticeable that the standard deviation is wider for the ODEON model and especially for the results observed for C50 (which is a position-dependent parameter) [50]. The difference in the standard deviation could be caused by the different methods used to simulate scattering in these two applications, as well as the definition of the scattering coefficients for the individual materials (as discussed in Section 4.2).
6.2. Acoustics of the Measured Spaces
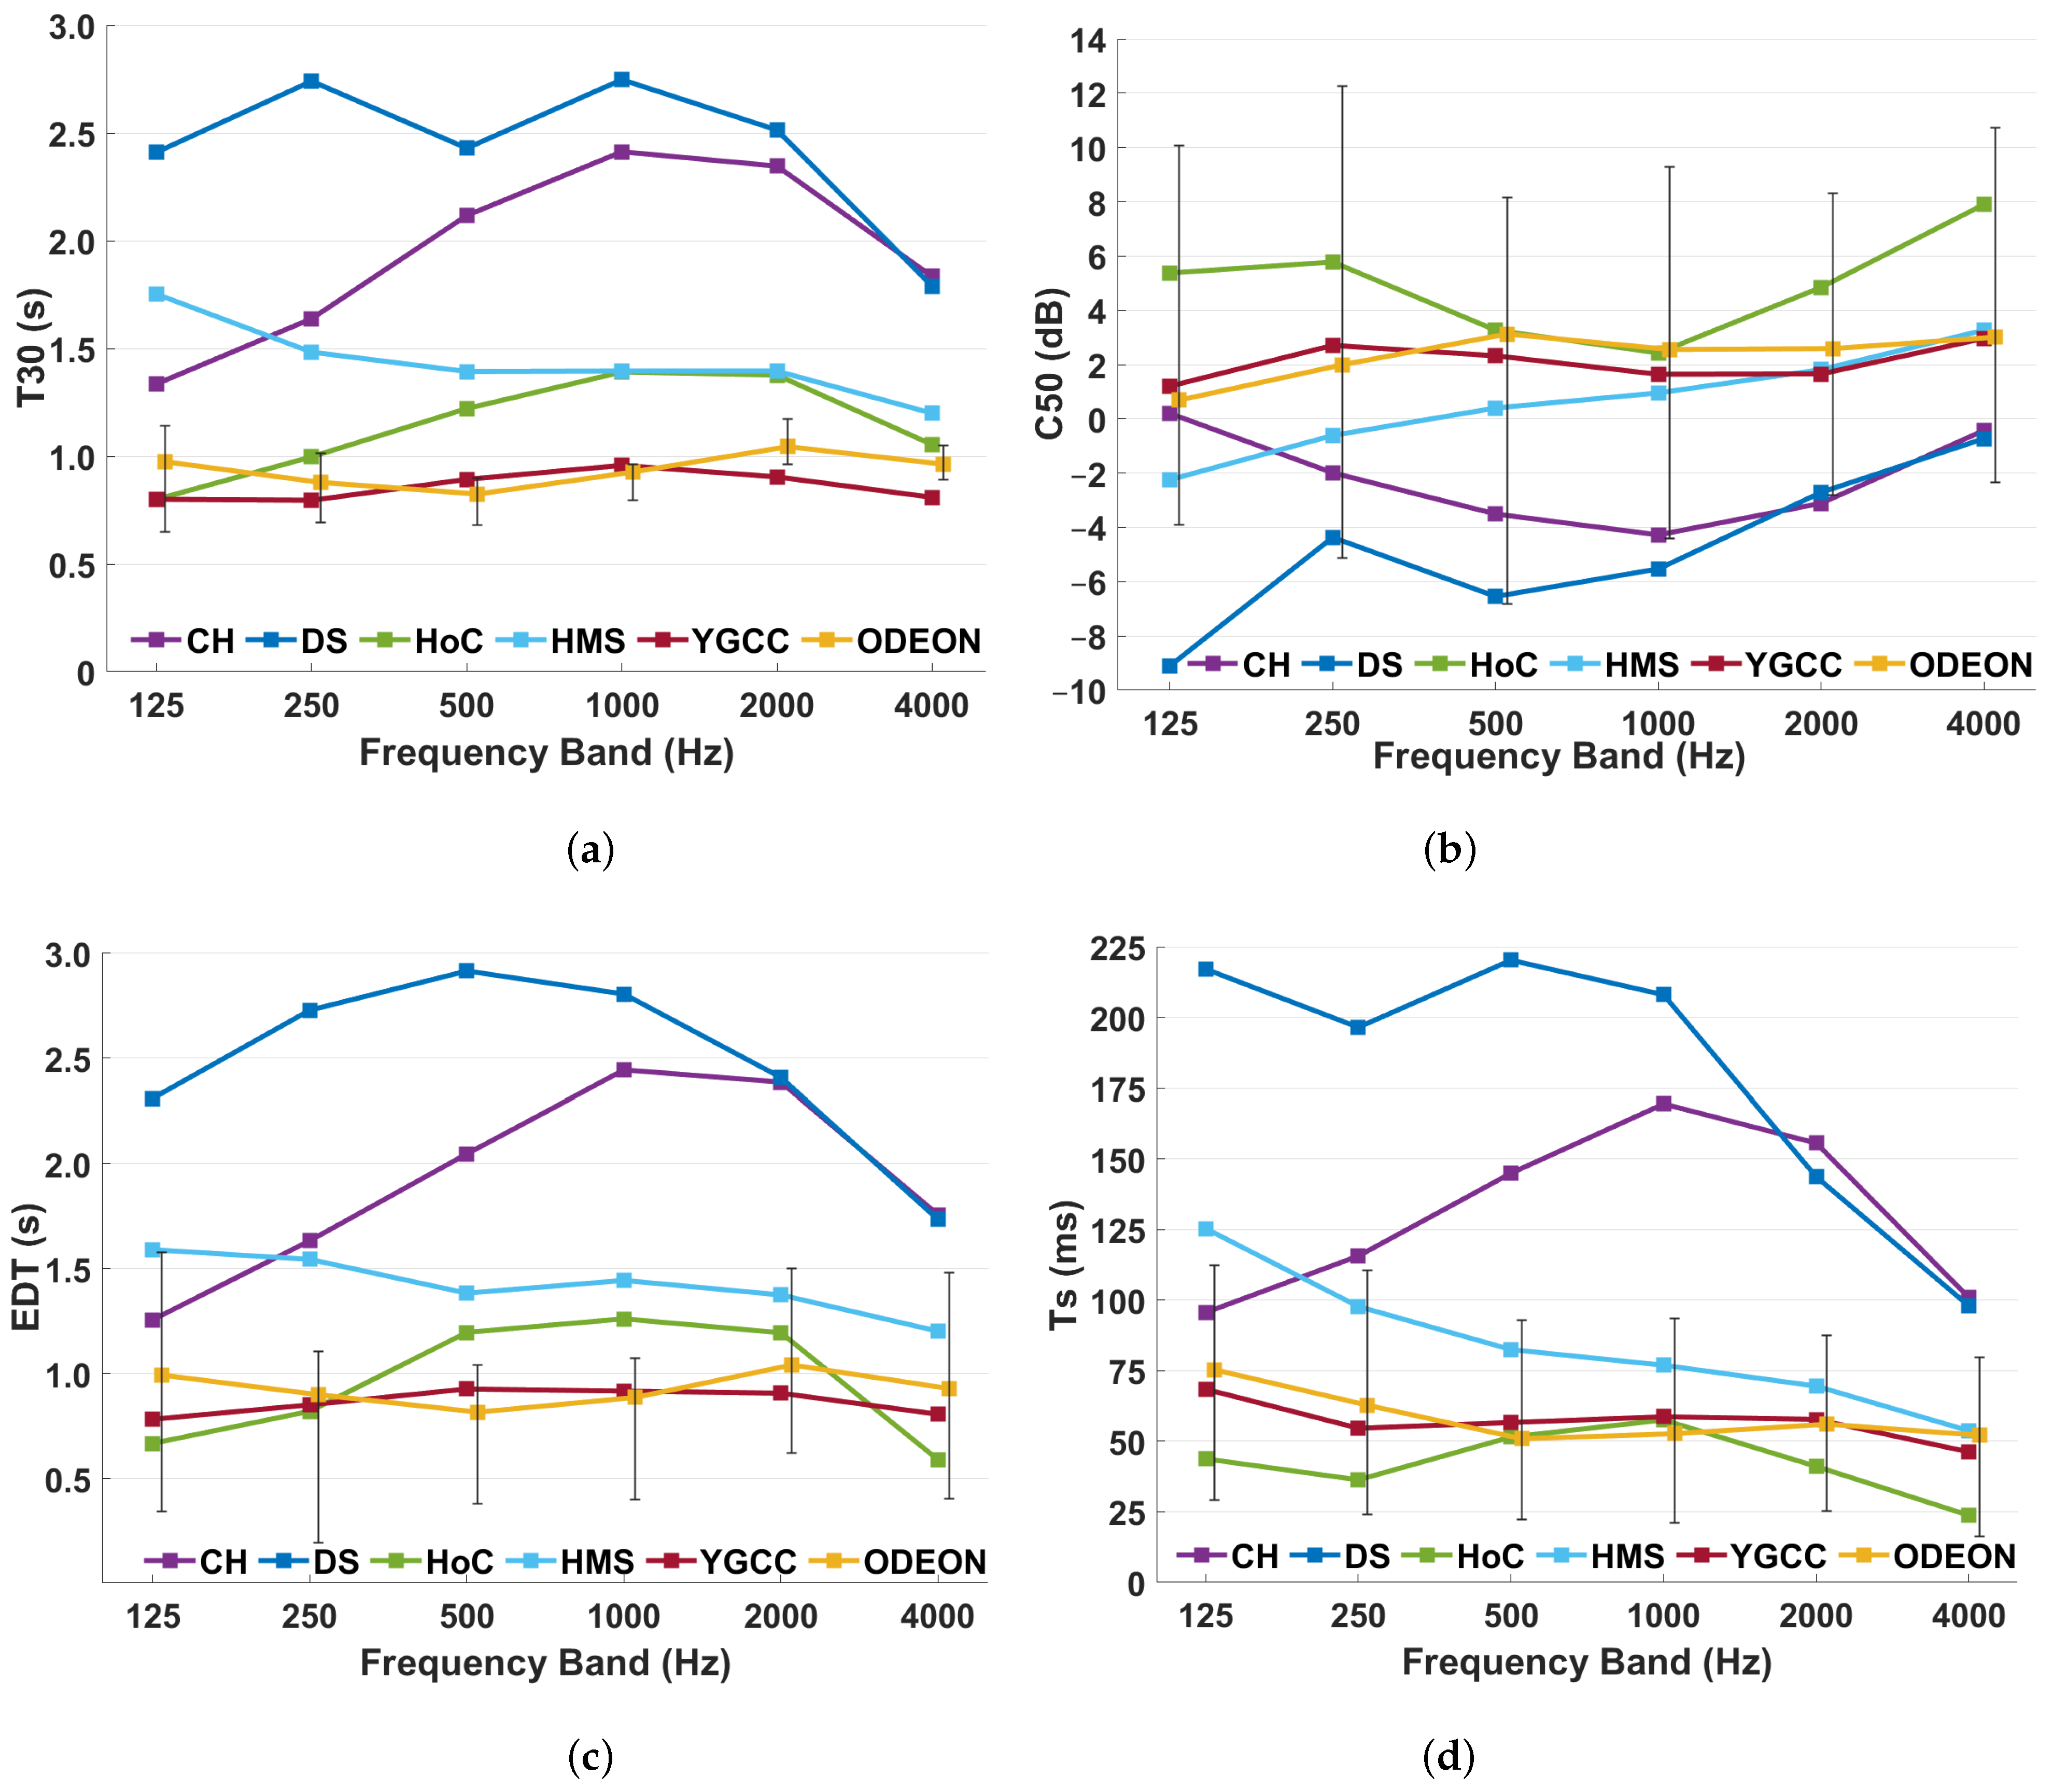
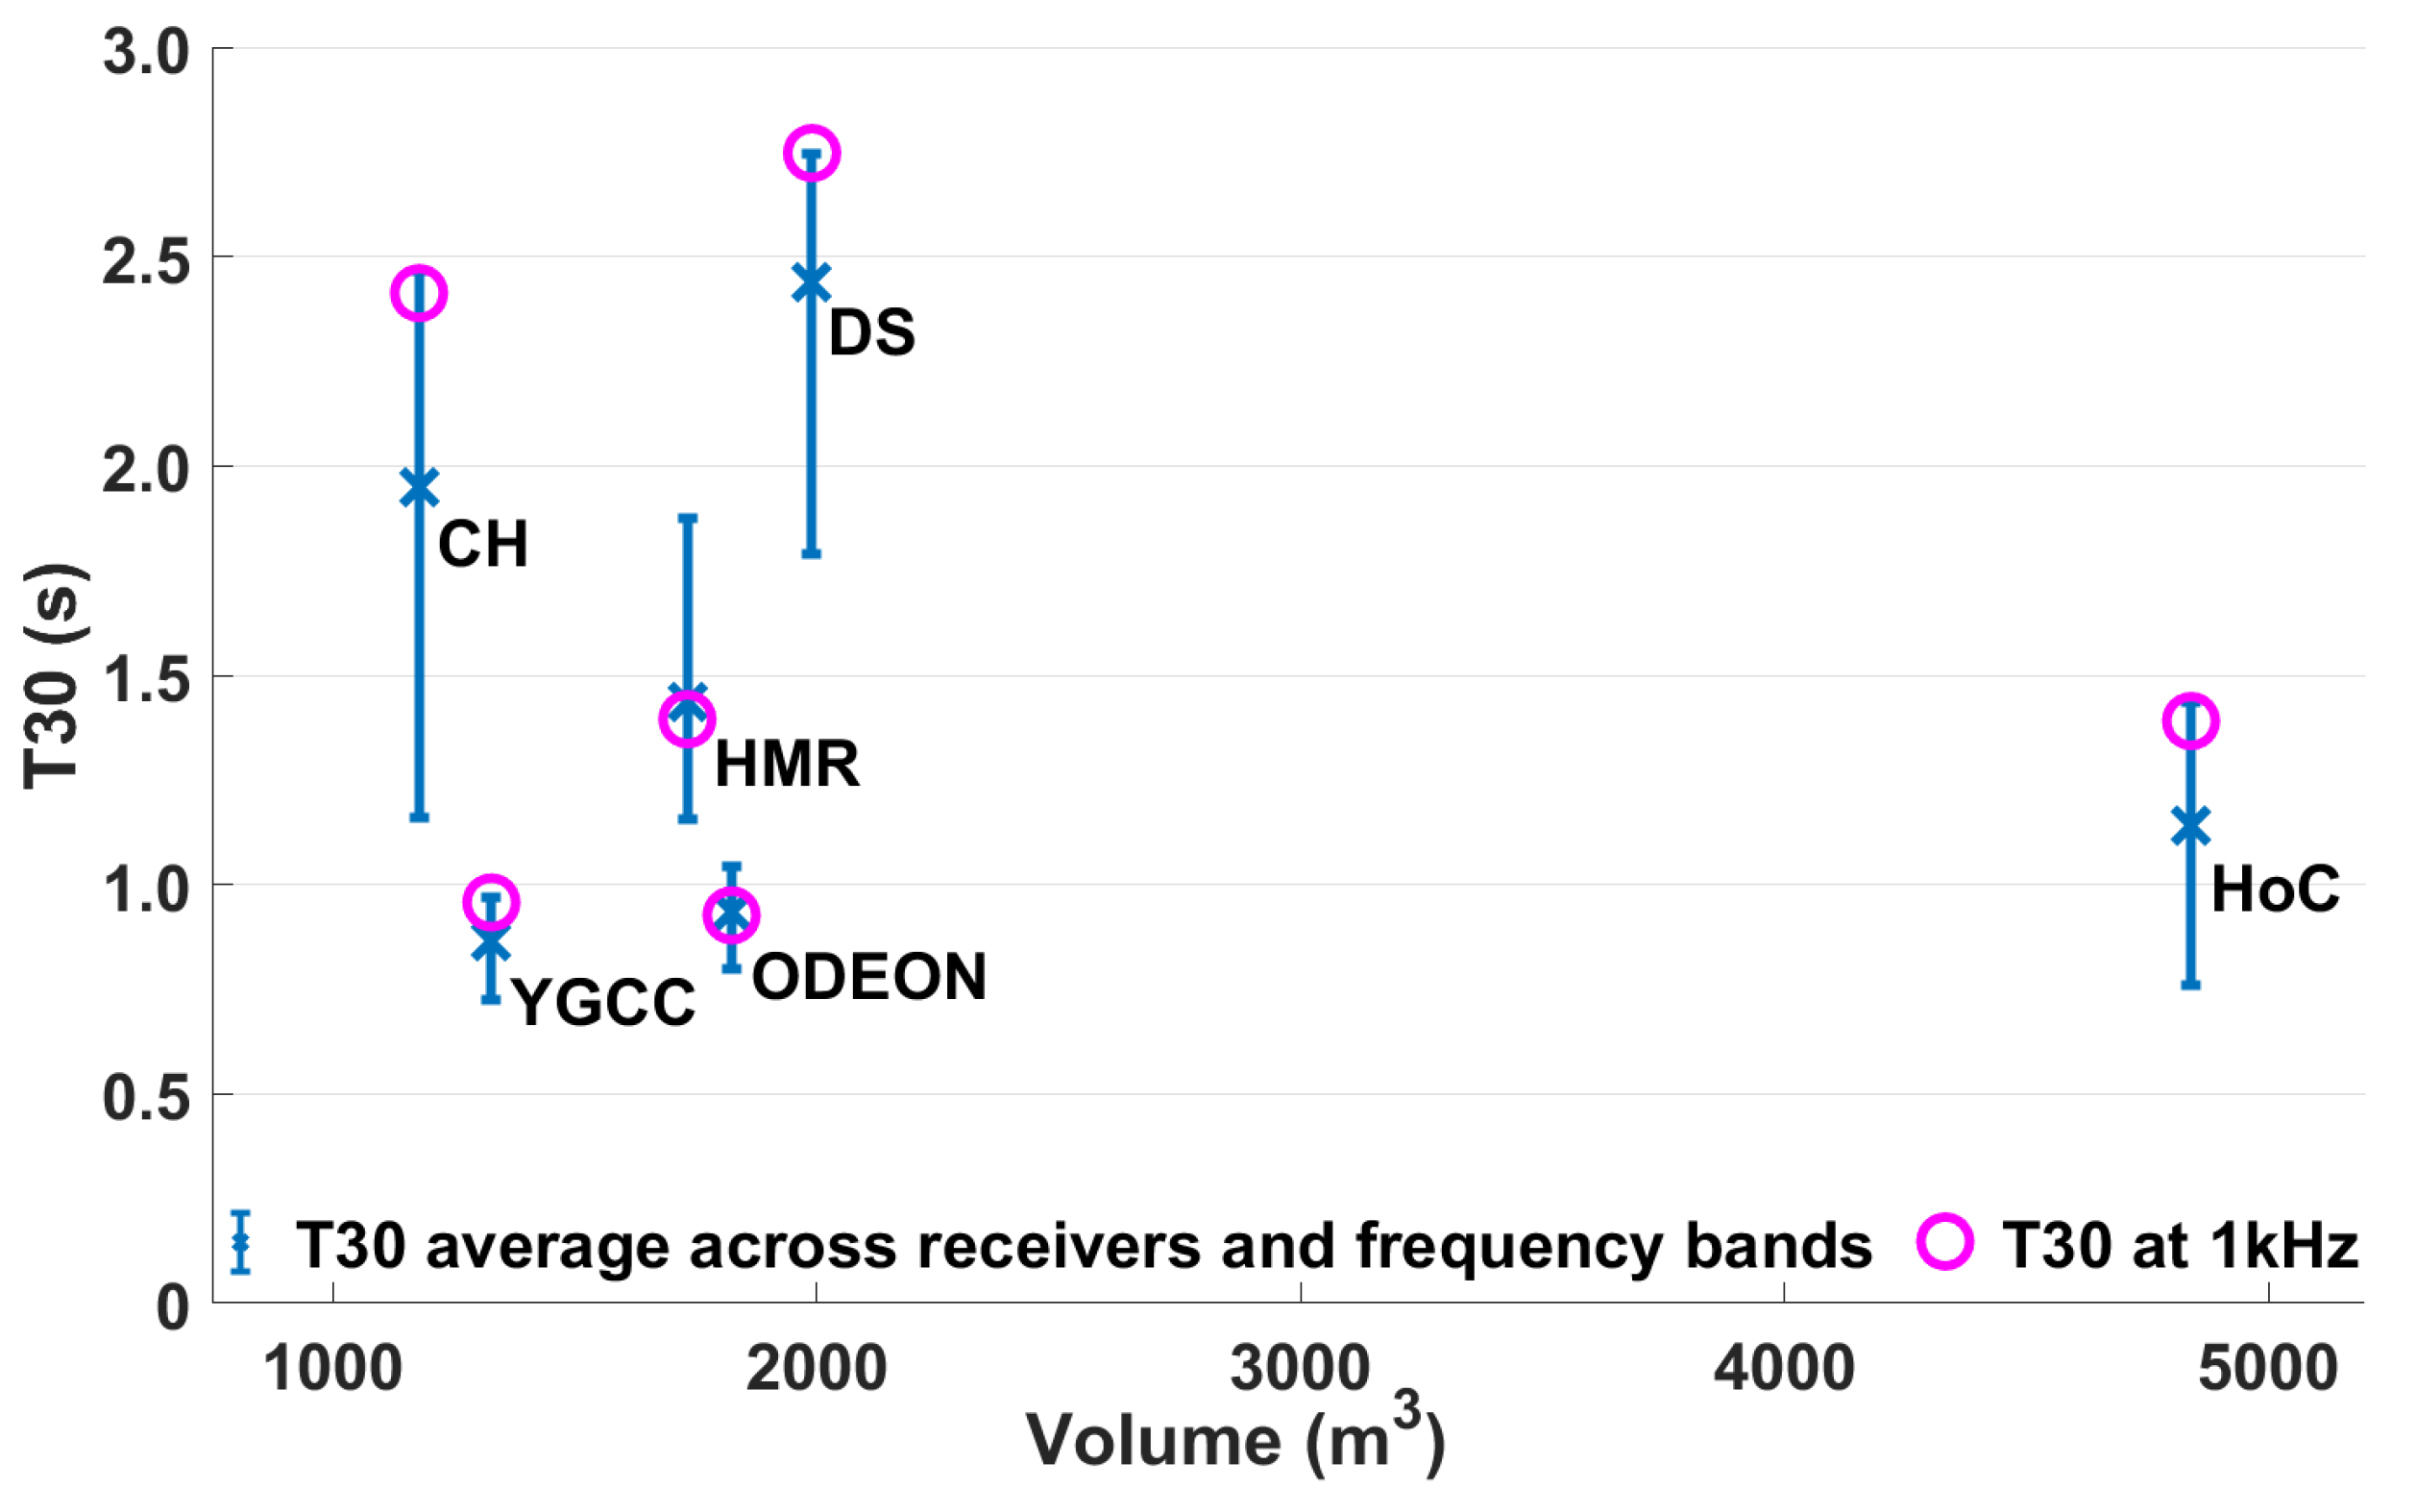
The average results of the five chosen spaces (as discussed in Section 5) are compared with the final version of the c. 1820–1834 House of Commons acoustic model as simulated in ODEON. Results of T30, EDT, C50 and Ts for all the spaces are presented in Figure 22, with error bars indicating the standard deviation of the values across source/receiver locations for the ODEON results. Figure 23 also provides very interesting information by comparing the spaces based on the T30 average values and their volume.
It is observed that the Convocation House (CH) and Divinity School (DS) have the highest values of T30. Considering their materials and shape, this was not a surprise; however, they should not be used as a direct comparison or for a calibration of the House of Commons model c. 1820–1834.
The modern House of Commons chamber (HoC), while significantly larger in volume than the other spaces (as shown in Figure 23), has a T30 value of 1.14 s (an average across measured positions and across frequency bands). Together with the results obtained from the rest of the acoustic parameters considered here, this indicated that it is a suitable space for the clear perception of speech. This is comparable with the much smaller spaces of the York Guildhall Council Chamber (YGCC) with T30 = 0.86 s, and Holywell Music Room (HMR) with T30 = 1.44 s, as well as the final ODEON c. 1820–1834 House of Commons model with T30 = 0.94 s. This low T30 value for the modern House of Commons was expected, considering the leather materials covering the seating area and the additional use of carpet on the floor. It is also noticeable that the T30 values at 1 kHz for the Convocation House, Divinity School, the modern House of Commons and York Guildhall Council Chamber are at the peak values of the error bars of the average T30 values, indicating the concave curve of the results across frequency bands with maximum values obtained at 1 kHz.
The results of the Holywell Music Room are also as might be expected, considering that the space was designed and used for musical performances. All acoustic parameter values are reasonably higher than the model of the historic House of Commons, and this is useful information and helps to provide verification for the design of the model.
As we had hypothesised from the description of the measured spaces (Section 5), the York Guildhall Council Chamber is the space that not only looks similar to the shape and materials of the designed model of the c. 1820–1834 House of Commons chamber but also has very similar acoustic characteristics to the results achieved for the simulated model. The values of C50 and Ts are also very similar for the two spaces. Ts has a fairly linear shape across all frequency bands, and this is also reflected in the behaviour of the C50 curve. This is something that is observed in both spaces: York Guildhall Council Chamber and the c. 1820–1834 House of Commons model.
The shoe box shape of the modern House of Commons, York Guildhall Council Chamber and the model of the c. 1820–1834 House of Commons, while common, could prove problematic in terms of the distribution and magnitude of early reflections. In all these cases, however, the use of various architectural and design features, such as ornaments, galleries, and coffered wooden panels, help the scattering of the sound across the room.
7. Auralizations
For the evaluation of the simulated model, auralizations are provided as Supplementary Materials as detailed in the section ’Data Availability Statement’, enabling the results of the acoustic model for both software (CATT-Acoustics and ODEON), and for all the chosen source-receiver positions to be auditioned. The auralization results of the other presented spaces are also available for comparison, and they are made available via the OpenAir website [51] for posterity. The W channel of the Ambisonic impulse responses (generated from either the commercial software or measured in situ) have been convolved with an anechoic stimulus. The anechoic sample is an excerpt of Henry Beaufoy’s speech to the House of Commons in 1792 on the subject of the slave trade, performed by John Cooper (co-author) in the anechoic chamber at the Audiolab, University of York. The perceived differences and similarities of the recorded/simulated spaces as heard in these audio files help to further verify the results of the acoustic parameters presented in this paper.
8. Conclusions
This study has allowed us to present an acoustic reconstruction of the historic House of Commons chamber in the period c. 1820–1834, shortly before its destruction by fire. The acoustic properties have been studied using two commercial software applications based on a 3D model of the reconstructed space. Several implemented versions of the model have allowed us to investigate in depth the most plausible scenarios for the design and choice of construction materials. As in situ measurements of the actual space (either from the past or in a more modern condition) were unavailable, evidence has been gathered from various categories of literature, manuscripts and artistic sources. Information from relevant studies has also been taken into account for the software settings, the chosen materials and the various design decisions.
In situ measurements of spaces with similar architectural characteristics or that have been used similarly, e.g., for parliamentary debates in the 17th century, have offered very helpful data for the comparison and verification of the design of this model.
Considering the above comparisons, we have reassurance that the version of the model presented in this paper provides a plausible representation of the acoustics of the simulated space. It was considered appropriate in this case study to calibrate this model by experimenting mainly on the materials used for the seating area, as confirmed from the results obtained from the in situ measurements of the five spaces. While the assumptions used in defining the absorption and scattering coefficients for the chosen materials can be considered as the main sources of uncertainty for this project, the comparison of the final results with these five spaces has offered confidence towards the final validity of the model.
Future work will take this validated model and use it as a means to investigate the impact of the acoustics of this space on the spatial variation of speech intelligibility. This is with a view of determining the extent by which Members of the UK Parliament, more than two centuries ago, would have been able to hear and contribute effectively to debates based on the location of their seat/position within the Historic House of Commons chamber at this time.
Author Contributions
Conceptualisation, A.F., D.M. and J.P.D.C.; methodology, A.F. and D.M.; software, A.F.; validation, A.F. and D.M.; formal analysis, A.F.; investigation, A.F., D.M. and J.P.D.C.; resources, A.F.; data curation, A.F.; writing—original draft preparation, A.F.; writing—review and editing, A.F., D.M. and J.P.D.C.; visualisation, A.F. and D.M.; supervision, D.M. and J.P.D.C.; project administration, A.F. and D.M.; funding acquisition, D.M. and J.P.D.C. All authors have read and agreed to the published version of the manuscript.
Funding
This project is part of the EU JPI-CH PHE (20-JPIC-0002-FS) (the Past Has Ears) project supported by the UK Arts and Humanities Research Council grant number AH/V001094/1.
Data Availability Statement
Auralization results from all measured positions and spaces are included here https://doi.org/10.5281/zenodo.7560885 (accessed on 23 February 2023).
Acknowledgments
The authors would like to thank Catriona Cooper for the original acoustic model of the House of Commons in 1789 in CATT-Acoustic and relevant literature she had found by the time. Thanks to Frank Stevens, Joe Rees-Jones, Catriona Cooper and OpenAir researchers, who carried out the measurements in situ and provided us with the impulse responses for the purpose of this study. The authors are very grateful to Paul Seaward, Mark Collins, Elizabeth Hallam Smith and Murray Tremellen for their informative discussions while also sharing precious evidence and knowledge with the authors.
Conflicts of Interest
The authors declare no conflict of interest.
References
- Wyatt, B. Esq. 17 August 1831. In Report from the Select Committee on House of Commons Buildings Together with the Minutes of Evidence Taken before Them; House of Commons: London, UK, 1831; p. 6. [Google Scholar]
- Smith, E.H. Ventilating the Commons, Heating the Lords, 1701–1834. Parliam. Hist. 2019, 38, 74–102. Available online: https://onlinelibrary.wiley.com/doi/abs/10.1111/1750-0206.12414 (accessed on 23 February 2023).
- TNA WORK. 29/23, 29/24, 29/25; The National Archives. Available online: https://images.nationalarchives.gov.uk/assetbank-nationalarchives/action/viewAsset?id=35582 (accessed on 23 October 2022).
- Cooper, C. The Sound of Debate in Georgian England: Auralising the House of Commons. Parliam. Hist. 2019, 38, 60–73. Available online: https://onlinelibrary.wiley.com/doi/abs/10.1111/1750-0206.12413 (accessed on 23 February 2023). [CrossRef] [Green Version]
- Hawksmoor, N. Longitudinal Section of Proposed Alterations to the Chamber of the House of Commons; Collection of All Souls College, University of Oxford: Oxford, UK, 1692; AS IV 91. [Google Scholar]
- Tillemans, P. The House of Commons in Session, Oil on Canvas, 137.2 × 123.2 cm; Parliamentary Art Collection; Palace of Westminster: London, UK, 1709–1714; WOA 2737. [Google Scholar]
- Hickel, K.A. Pitt Addressing the House of Commons, 1793; National Portrait Gallery: London, UK, 1793–1795; NPG 745. [Google Scholar]
- Wallis, W. Interior of the House of Commons (from ‘The Beauties of England and Wales’); Engraving, 142 × 203 mm; Department of Prints & Drawings, BH/FF/10/London Topography, British Museum: London, UK, 1815; No. 1880, 0911.1241. [Google Scholar]
- Scott, J. View of the Interior of the House of Commons during the Sessions of 1821–1823; Parliamentary Art Collection: London, UK, 1836; WOA 357. [Google Scholar]
- Gillray, J. Anticipation, or the Approaching Fate of the French Commercial Treaty; National Portrait Gallery: London, UK, 1787; NPG D12356. [Google Scholar]
- Gillray, J. Parliamentary-Reform,-or-Opposition-Rats, Leaving the House They Had Undermined; British Museum: London, UK, 1797; No. 1868, 0808.6634. [Google Scholar]
- Gillray, J. The Giant-Factotum Amusing Himself; British Museum: London, UK, 1797; No. 1868, 0808.6587. [Google Scholar]
- Gillray, J. Stealing Off;-or-Prudent Secession; British Museum: London, UK, 1798; No. 1851, 0901.944. [Google Scholar]
- Virtual St Stephen’s Project. Available online: https://www.virtualststephens.org.uk/ (accessed on 14 November 2022).
- CATT-Acoustic. User’s Manual v9.1; CATT: Gothenburg, Sweden, 2016. [Google Scholar]
- Hallam Smith, E.; English Historian and Librarian of the House of Lords Library from 2006–2016, UK. Personal communication, 2022.
- Collins, M.; Estates Historian & Archivist of the Estates Historic Archive at the Houses of Parliament, UK. Personal communication, 2022.
- Seaward, P.; British Historian and Director of the History of Parliament Trust, UK. Personal communication, 2022.
- Tremellen, M.; Architectural Historian and Ph.D. Candidate, University of York, UK. Personal communication, 2022.
- Hayter, G. 1833, The House of Commons; Oil on Canvas, 3460 mm × 5420 mm. Overall; © National Portrait Gallery: London, UK, 1858; Primary Collection NPG 54. [Google Scholar]
- Bradley, D.T.; Wang, L.M. Effect of model detail level on room acoustic computer simulations. J. Acoust. Soc. Am. 2002, 111, 2389. [Google Scholar] [CrossRef]
- Duran, S.; Chambers, M.; Kanellopoulos, I. An Archaeoacoustics Analysis of Cistercian Architecture: The Case of the Beaulieu Abbey. Acoustics 2021, 3, 252–269. Available online: https://www.mdpi.com/2624-599X/3/2/18 (accessed on 23 February 2023). [CrossRef]
- ODEON. User Manual, Version 13.0; ODEON A/S: Lyngby, Denmark, 2016. [Google Scholar]
- Naylor, G.M.; Rindel, J.H. Predicting Room Acoustical Behaviour with the ODEON Computer Model. In Proceedings of the 124th ASA Meeting, New Orleans, LA, USA, 31 October–4 November 1992. [Google Scholar]
- Alvarez-Morales, L.; Zamarreño, T.; Girón, S.; Galindo, M. A methodology for the study of the acoustic environment of Catholic cathedrals: Application to the Cathedral of Malaga. Build. Environ. 2014, 72, 102–115. [Google Scholar] [CrossRef]
- Alayón, J.; Girón, S.; Romero-Odero, J.A.; Nieves, F.J. Virtual Sound Field of the Roman Theatre of Malaca. Acoustics 2021, 3, 632–641. Available online: https://www.mdpi.com/2624-599X/3/1/8 (accessed on 23 February 2023). [CrossRef]
- Weinzierl, S.; Sanvito, P.; Schultz, F.; Büttner, C. The Acoustics of Renaissance Theatres in Italy. Acta. Acust. 2015, 101, 78–96. [Google Scholar] [CrossRef]
- Tronchin, L.; Merli, F.; Dolci, M. Virtual acoustic reconstruction of the Miners’ Theatre in Idrija (Slovenia). App. Acoust. 2021, 172, 107595. Available online: https://www.sciencedirect.com/science/article/pii/S0003682X2030699X (accessed on 23 February 2023). [CrossRef]
- Iannace, G.; Maffei, L.; Aletta, F. Computer Simulation of the Effect of the Audience on the Acoustics of the Roman Theatre of Beneventum (Italy). In Proceedings of the Acoustics of Ancient Theatres, Patras, Greece, 18–21 September 2011. [Google Scholar]
- Iannace, G.; Maffei, L.; Trematerra, P. The Acoustic Evolution of the Large Theatre of Pompeii. In Proceedings of the Acoustics of Ancient Theatres, Patras, Greece, 18–21 September 2011. [Google Scholar]
- Gade, A.; Lynge, C.; Lisa, M.; Rindel, J.H. Matching simulations with measured acoustic data from Roman Theatres using the ODEON programme. In Proceedings of the Forum Acusticum 2005, Budapest, Hungary, 29 August–2 September 2005. [Google Scholar]
- Beranek, L.L. Analysis of Sabine and Eyring equations and their application to concert hall audience and chair absorption. J. Acoust. Soc. Am. 2006, 120, 1399–1410. [Google Scholar] [CrossRef] [PubMed] [Green Version]
- Martellotta, F.; D’Alba, M.; Crociata, S.D. Laboratory measurement of sound absorption of occupied pews and standing audiences. App. Acoust. 2011, 72, 341–349. Available online: https://www.sciencedirect.com/science/article/abs/pii/S0003682X10002902 (accessed on 23 February 2023). [CrossRef]
- Martellotta, F.; Crociata, S.D.; D’Alba, M. On site validation of sound absorption measurements of occupied pews. App. Acoust. 2011, 72, 923–933. Available online: https://www.sciencedirect.com/science/article/pii/S0003682X11001642 (accessed on 23 February 2023). [CrossRef]
- Martellotta, F.; Cirillo, E. Experimental studies of sound absorption by church pews. App. Acoust. 2009, 70, 441–449. Available online: https://www.sciencedirect.com/science/article/abs/pii/S0003682X08001345 (accessed on 23 February 2023). [CrossRef]
- Carvalho, A.P.O.; Pino, J.S.O. Sound absorption of church pews. In Proceedings of the Inter. Noise 2012, New York, NY, USA, 19–22 August 2012. [Google Scholar]
- Galindo, M.; Zamarreño, T.; Girón, S. Acoustic simulations of Mudejar-Gothic churches. J. Acoust. Soc. Am. 2009, 126, 1207–1218. [Google Scholar] [CrossRef] [PubMed]
- Vorländer, M. Auralization; Springer: Berlin/Heidelberg, Germany, 2008. [Google Scholar]
- AURORA Plug-ins. Available online: http://www.aurora-plugins.com/ (accessed on 24 March 2022).
- Christensen, C.L.; Rindel, J.H. A new scattering method that combines roughness and diffraction effects. In Proceedings of the Forum Acusticum 2005, Budapest, Hungary, 29 August–2 September 2005. [Google Scholar]
- Adeeb, A.H.; Sü Gül, Z. Investigation of a Tuff Stone Church in Cappadocia via Acoustical Reconstruction. Acoustics 2022, 4, 419–440. Available online: https://www.mdpi.com/2624-599X/4/2/26 (accessed on 23 February 2023). [CrossRef]
- Facondini, M.; Ponteggia, D. Acoustics of the Restored Petruzzelli Theater. In Proceedings of the 128th AES Convention, London, UK, 22–25 May 2010. [Google Scholar]
- Foteinou, A.; Murphy, D.; Cooper, J. Architectural acoustics and parliamentary debate: Exploring the acoustics of the UK House of Commons Chamber. In Proceedings of the Acoustics of Ancient Theatres (2nd Symposium), Verona, Italy, 6–8 July 2022. [Google Scholar]
- Farina, A.; Ayalon, R. Recording Concert Hall Acoustics for Posterity. In Proceedings of the 24th AES International Conference, Banff, AB, Canada, 26–28 June 2003. [Google Scholar]
- Sert, F.Y.; Karaman, Ö.Y. An Investigation on the Effects of Architectural Features on Acoustical Environment of Historical Mosques. Acoustics 2021, 3, 559–580. Available online: https://www.mdpi.com/2624-599X/3/3/36 (accessed on 23 February 2023). [CrossRef]
- Wikimedia Commons Contributors. “File: Convocation House 2, Bodleian Library, Oxford, UK-Diliff.jpg.”. Wikipedia Commons, the Free Media Repository. 2021. Available online: https://commons.wikimedia.org/wiki/File:Convocation_House_2,_Bodleian_Library,_Oxford,_UK_-_Diliff.jpg (accessed on 30 April 2022).
- Wikimedia Commons Contributors. “File: Divinity School Interior 1, Bodleian Library, Oxford, UK-Diliff.jpg.”. Wikipedia Commons, the Free Media Repository. 2021. Available online: https://commons.wikimedia.org/w/index.php?title=File:Divinity_School_Interior_1,_Bodleian_Library,_Oxford,_UK_-_Diliff.jpg&oldid=529292672 (accessed on 30 April 2022).
- Wikimedia Commons Contributors. “File: House of Commons Chamber 1.png”. Wikipedia Commons, the Free Media Repository. 2012. Available online: https://commons.wikimedia.org/wiki/File:House_of_Commons_Chamber_1.png (accessed on 30 April 2022).
- Music At Oxford. Available online: https://www.musicatoxford.com/venues/holywell-music-room/ (accessed on 26 October 2022).
- Foteinou, A. Perception of Objective Parameter Variations in Virtual Acoustic Spaces. Ph.D. Thesis, University of York, York, UK, 2013. [Google Scholar]
- Open AIR. Available online: https://www.openair.hosted.york.ac.uk/?page_id=1167 (accessed on 30 April 2022).
Figure 1.
Detail from the architectural plans of the pre-fire House of Commons, as seen at [3]. The blue frame highlights the original boundaries of the medieval chapel of St Stephen, which was then separated into the House of Commons (east) and the Lobby (west).
Figure 1.
Detail from the architectural plans of the pre-fire House of Commons, as seen at [3]. The blue frame highlights the original boundaries of the medieval chapel of St Stephen, which was then separated into the House of Commons (east) and the Lobby (west).

Figure 2.
Section from west to east, showing the storeys of the House of Commons spaces, August 1834 [3].
Figure 2.
Section from west to east, showing the storeys of the House of Commons spaces, August 1834 [3].

Figure 3.
The House of Commons Remodelled, 1692–1707, St Stephen’s Chapel Westminster Project 2017, image from [14].
Figure 3.
The House of Commons Remodelled, 1692–1707, St Stephen’s Chapel Westminster Project 2017, image from [14].

Figure 4.
The original version of the model in CATT-Acoustic by [4], representing the House of Commons in c. 1789: (a) Section from north to south where the main entrance of the House of Commons was. (b) An elevation view of the model.
Figure 4.
The original version of the model in CATT-Acoustic by [4], representing the House of Commons in c. 1789: (a) Section from north to south where the main entrance of the House of Commons was. (b) An elevation view of the model.

Figure 5.
The House of Commons, 1833 by Sir George Hayter, oil on canvas, 1833–1843, 136 1/4 in. × 213 3/8 in. (3460 mm × 5420 mm) overall, © National Portrait Gallery, London [20].
Figure 5.
The House of Commons, 1833 by Sir George Hayter, oil on canvas, 1833–1843, 136 1/4 in. × 213 3/8 in. (3460 mm × 5420 mm) overall, © National Portrait Gallery, London [20].

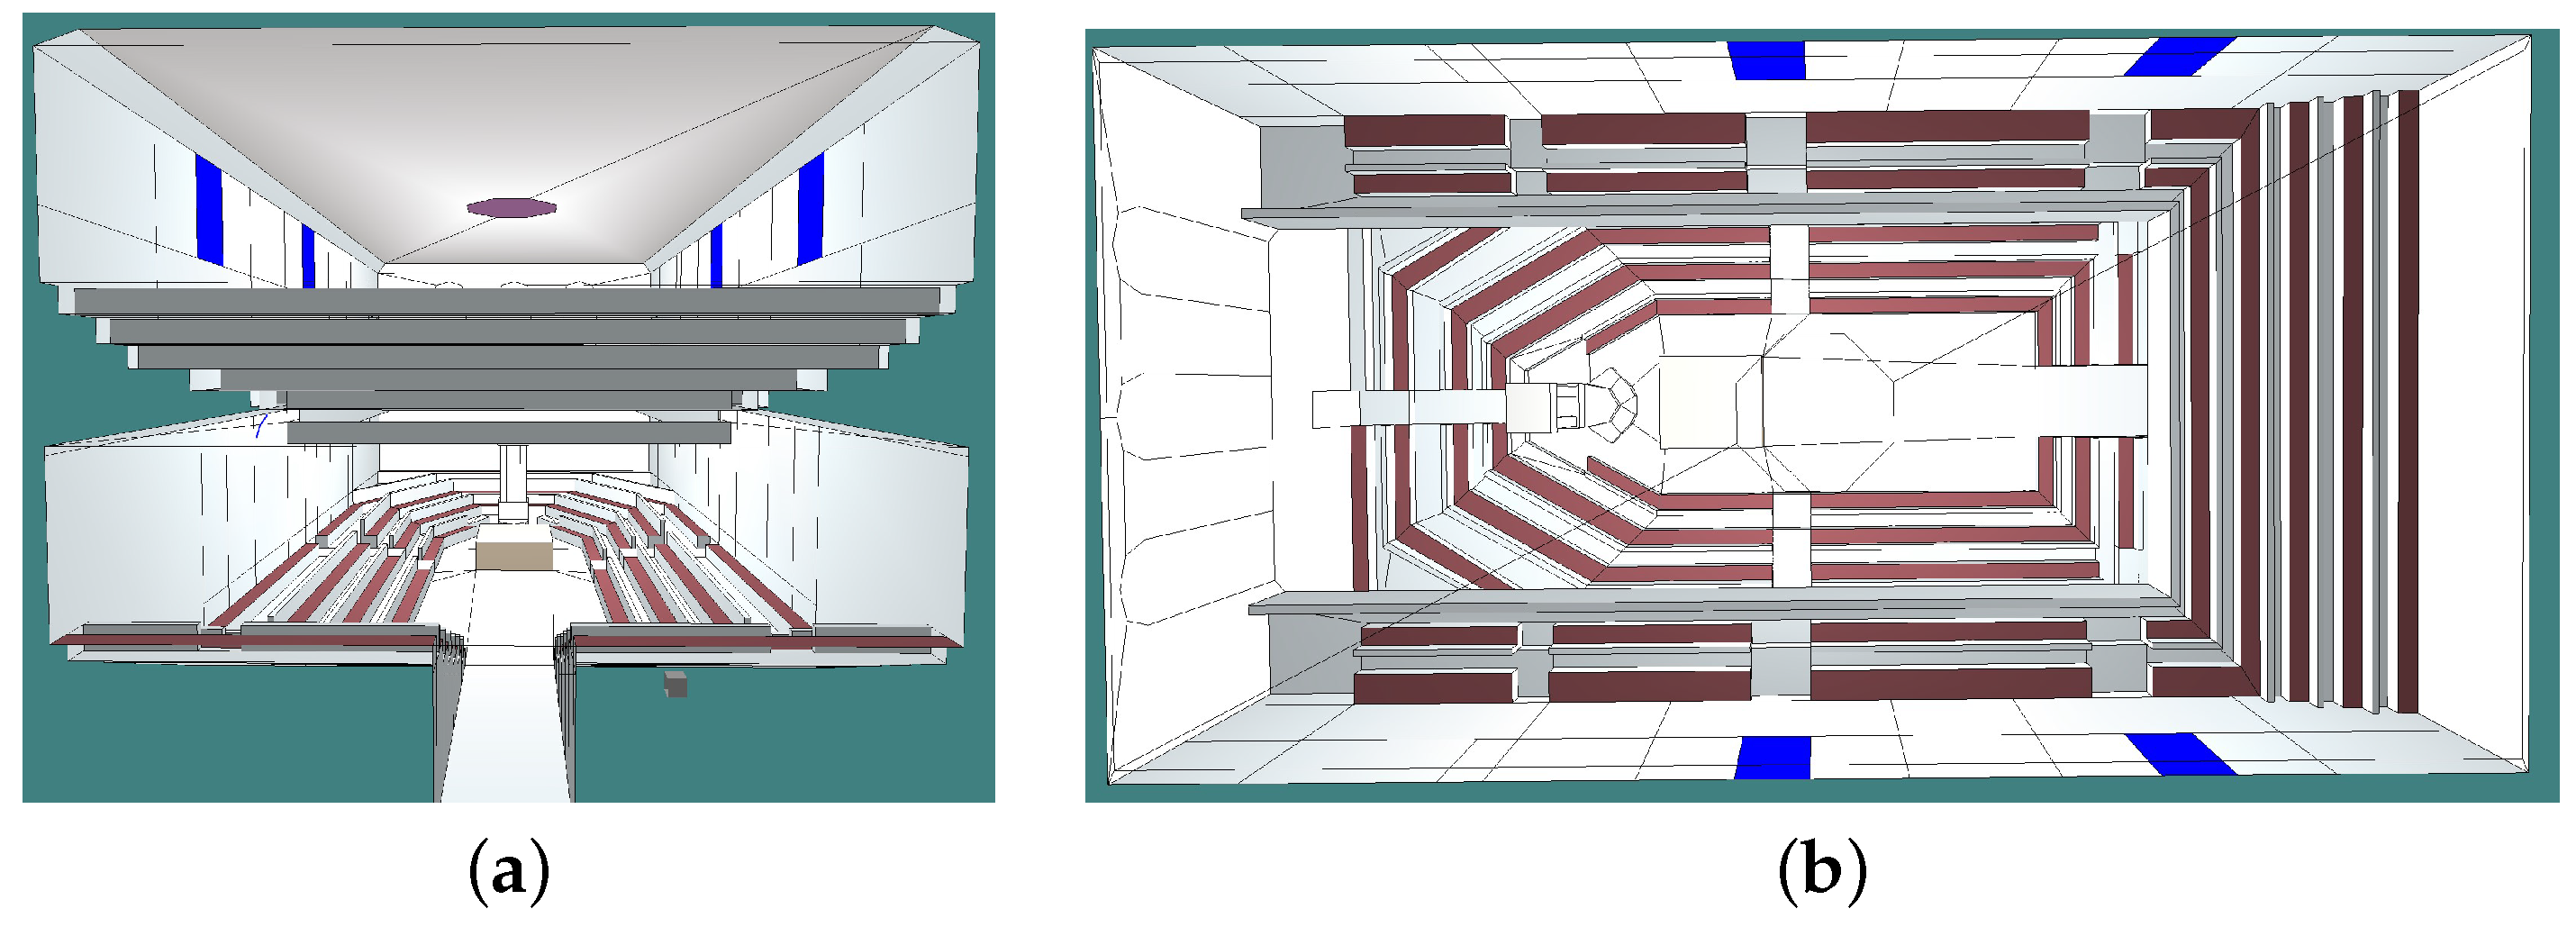
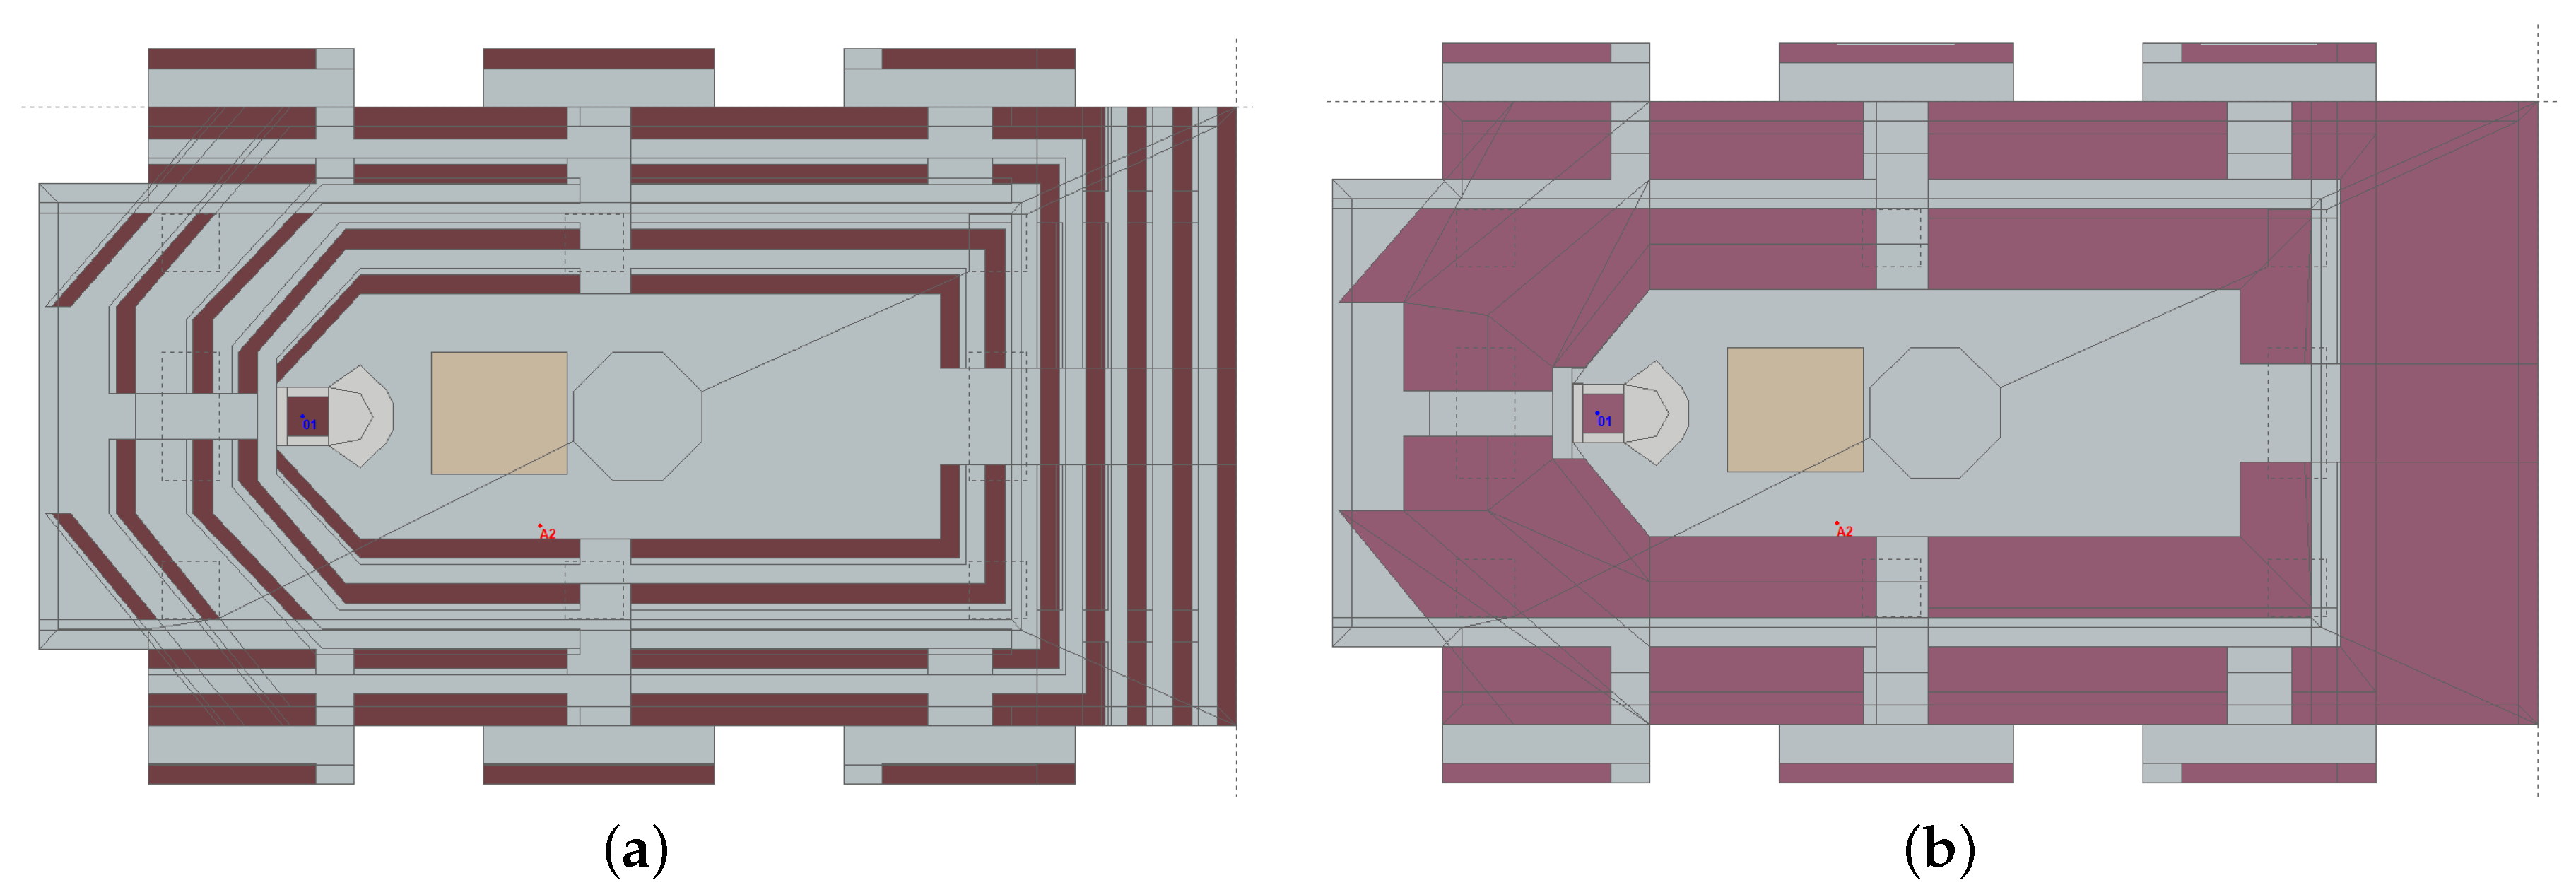
Figure 6.
The updated version of the model extended on the north and south walls by the window areas in CATT-Acoustic. (a) A detailed simulation of the benches is represented. (b) The benches’ surfaces have been simplified.
Figure 6.
The updated version of the model extended on the north and south walls by the window areas in CATT-Acoustic. (a) A detailed simulation of the benches is represented. (b) The benches’ surfaces have been simplified.

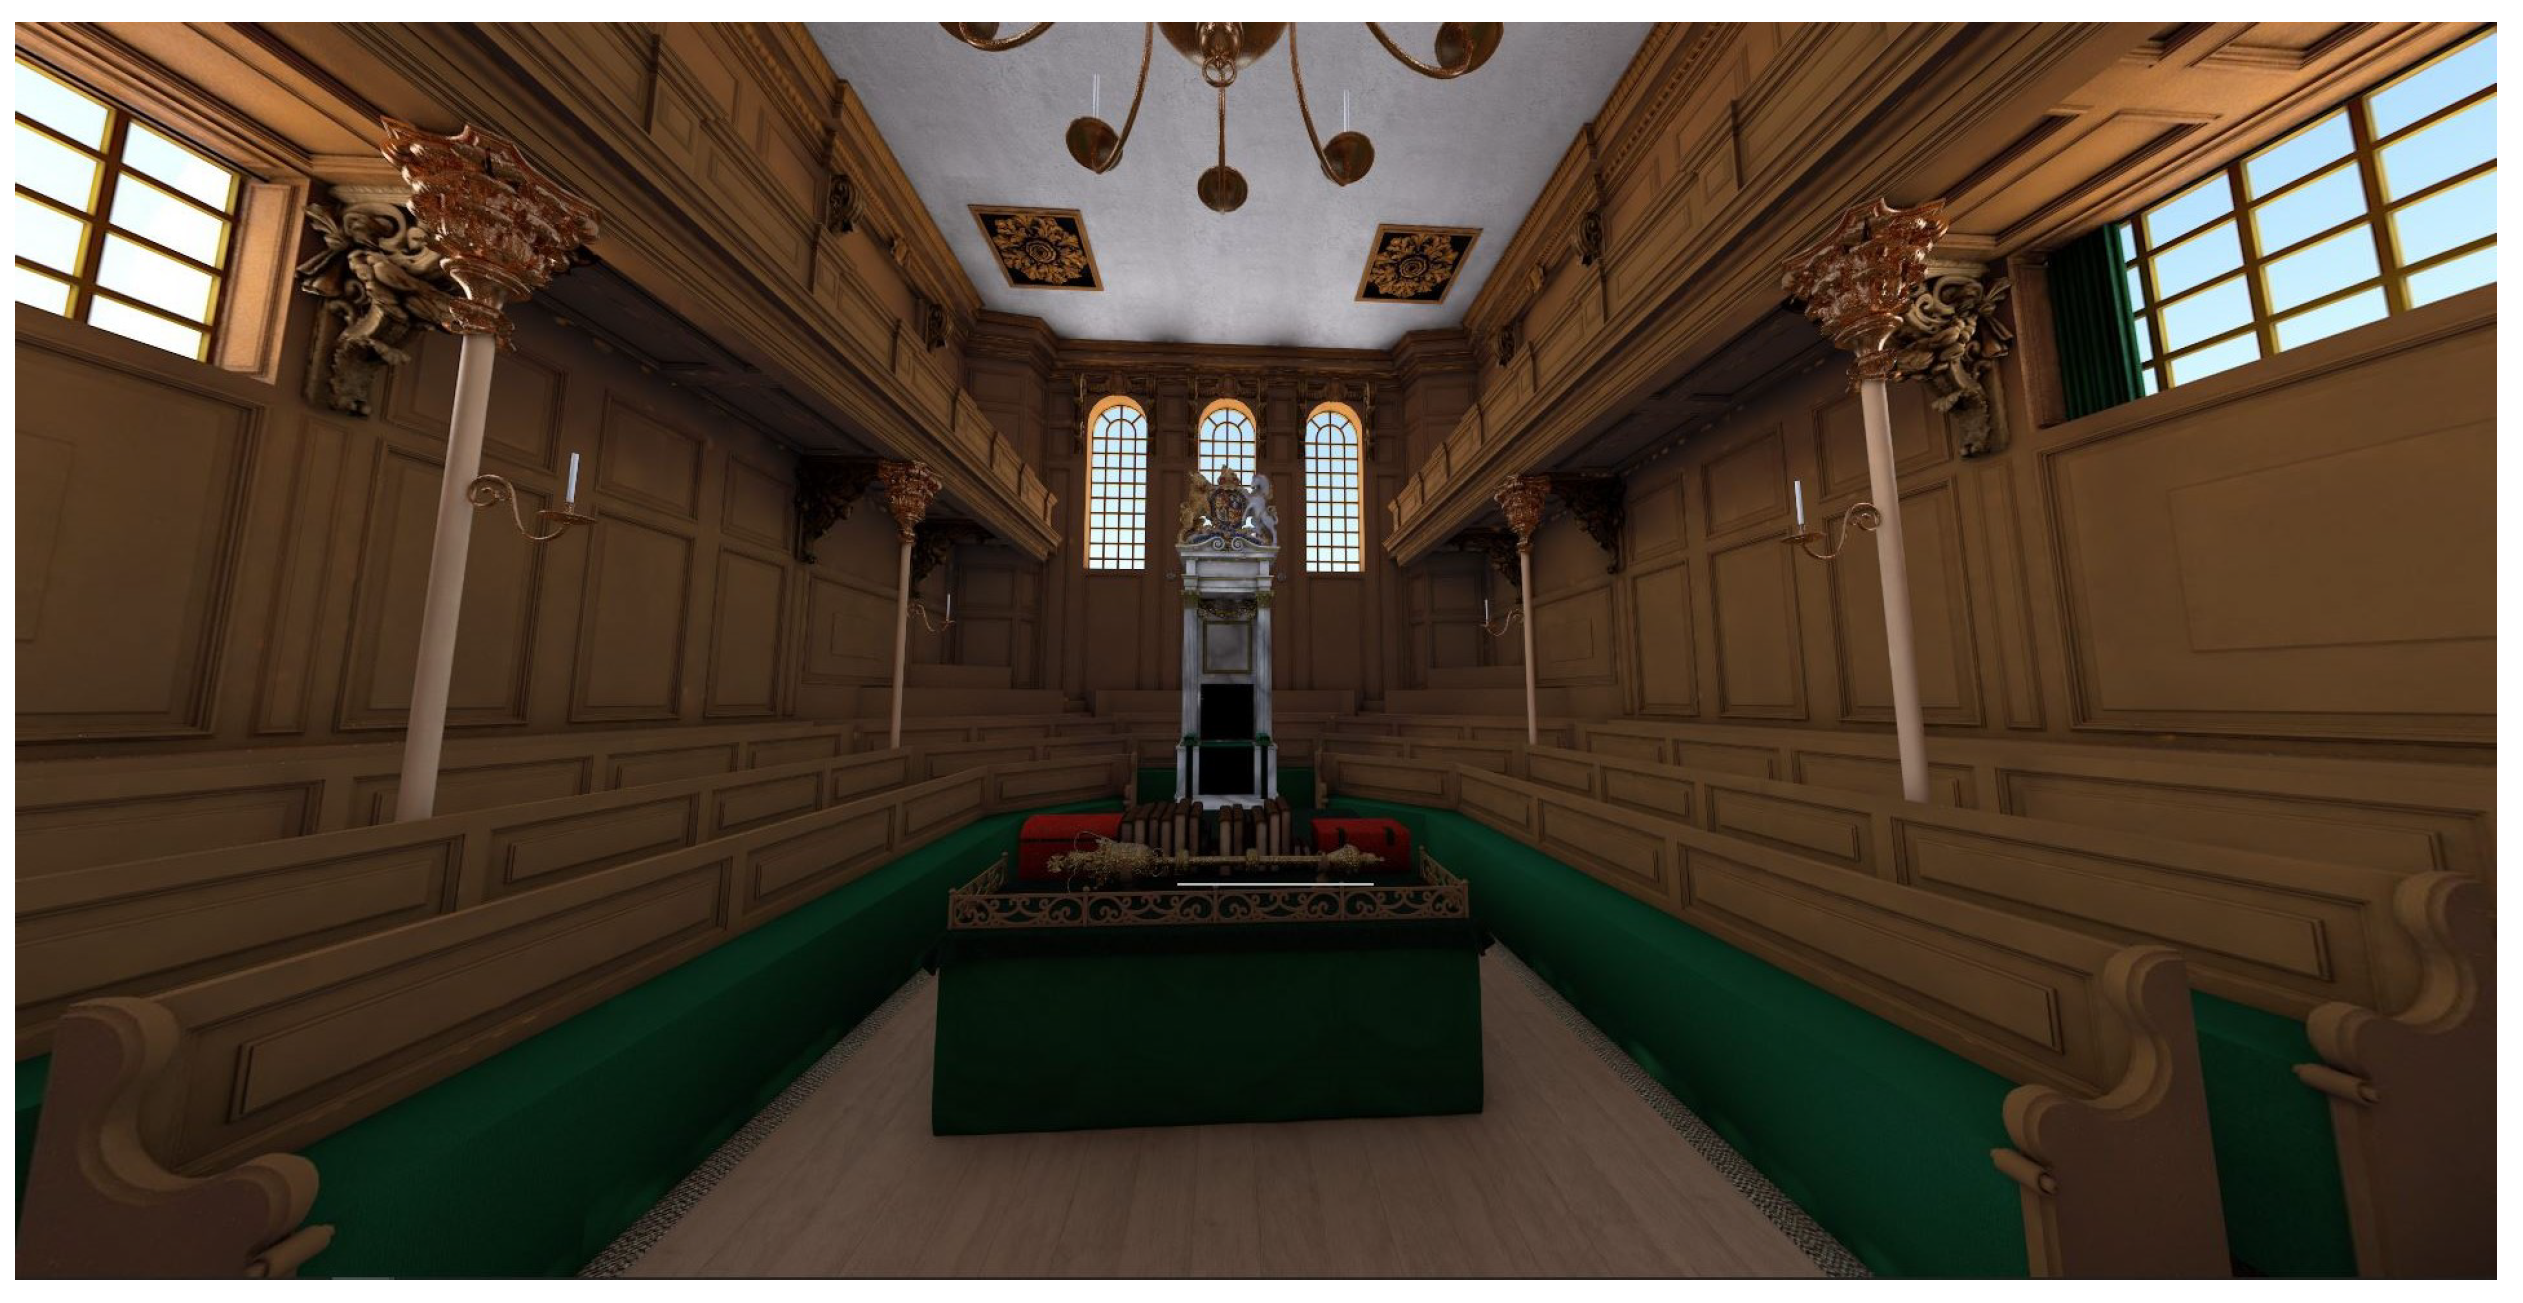
Figure 7.
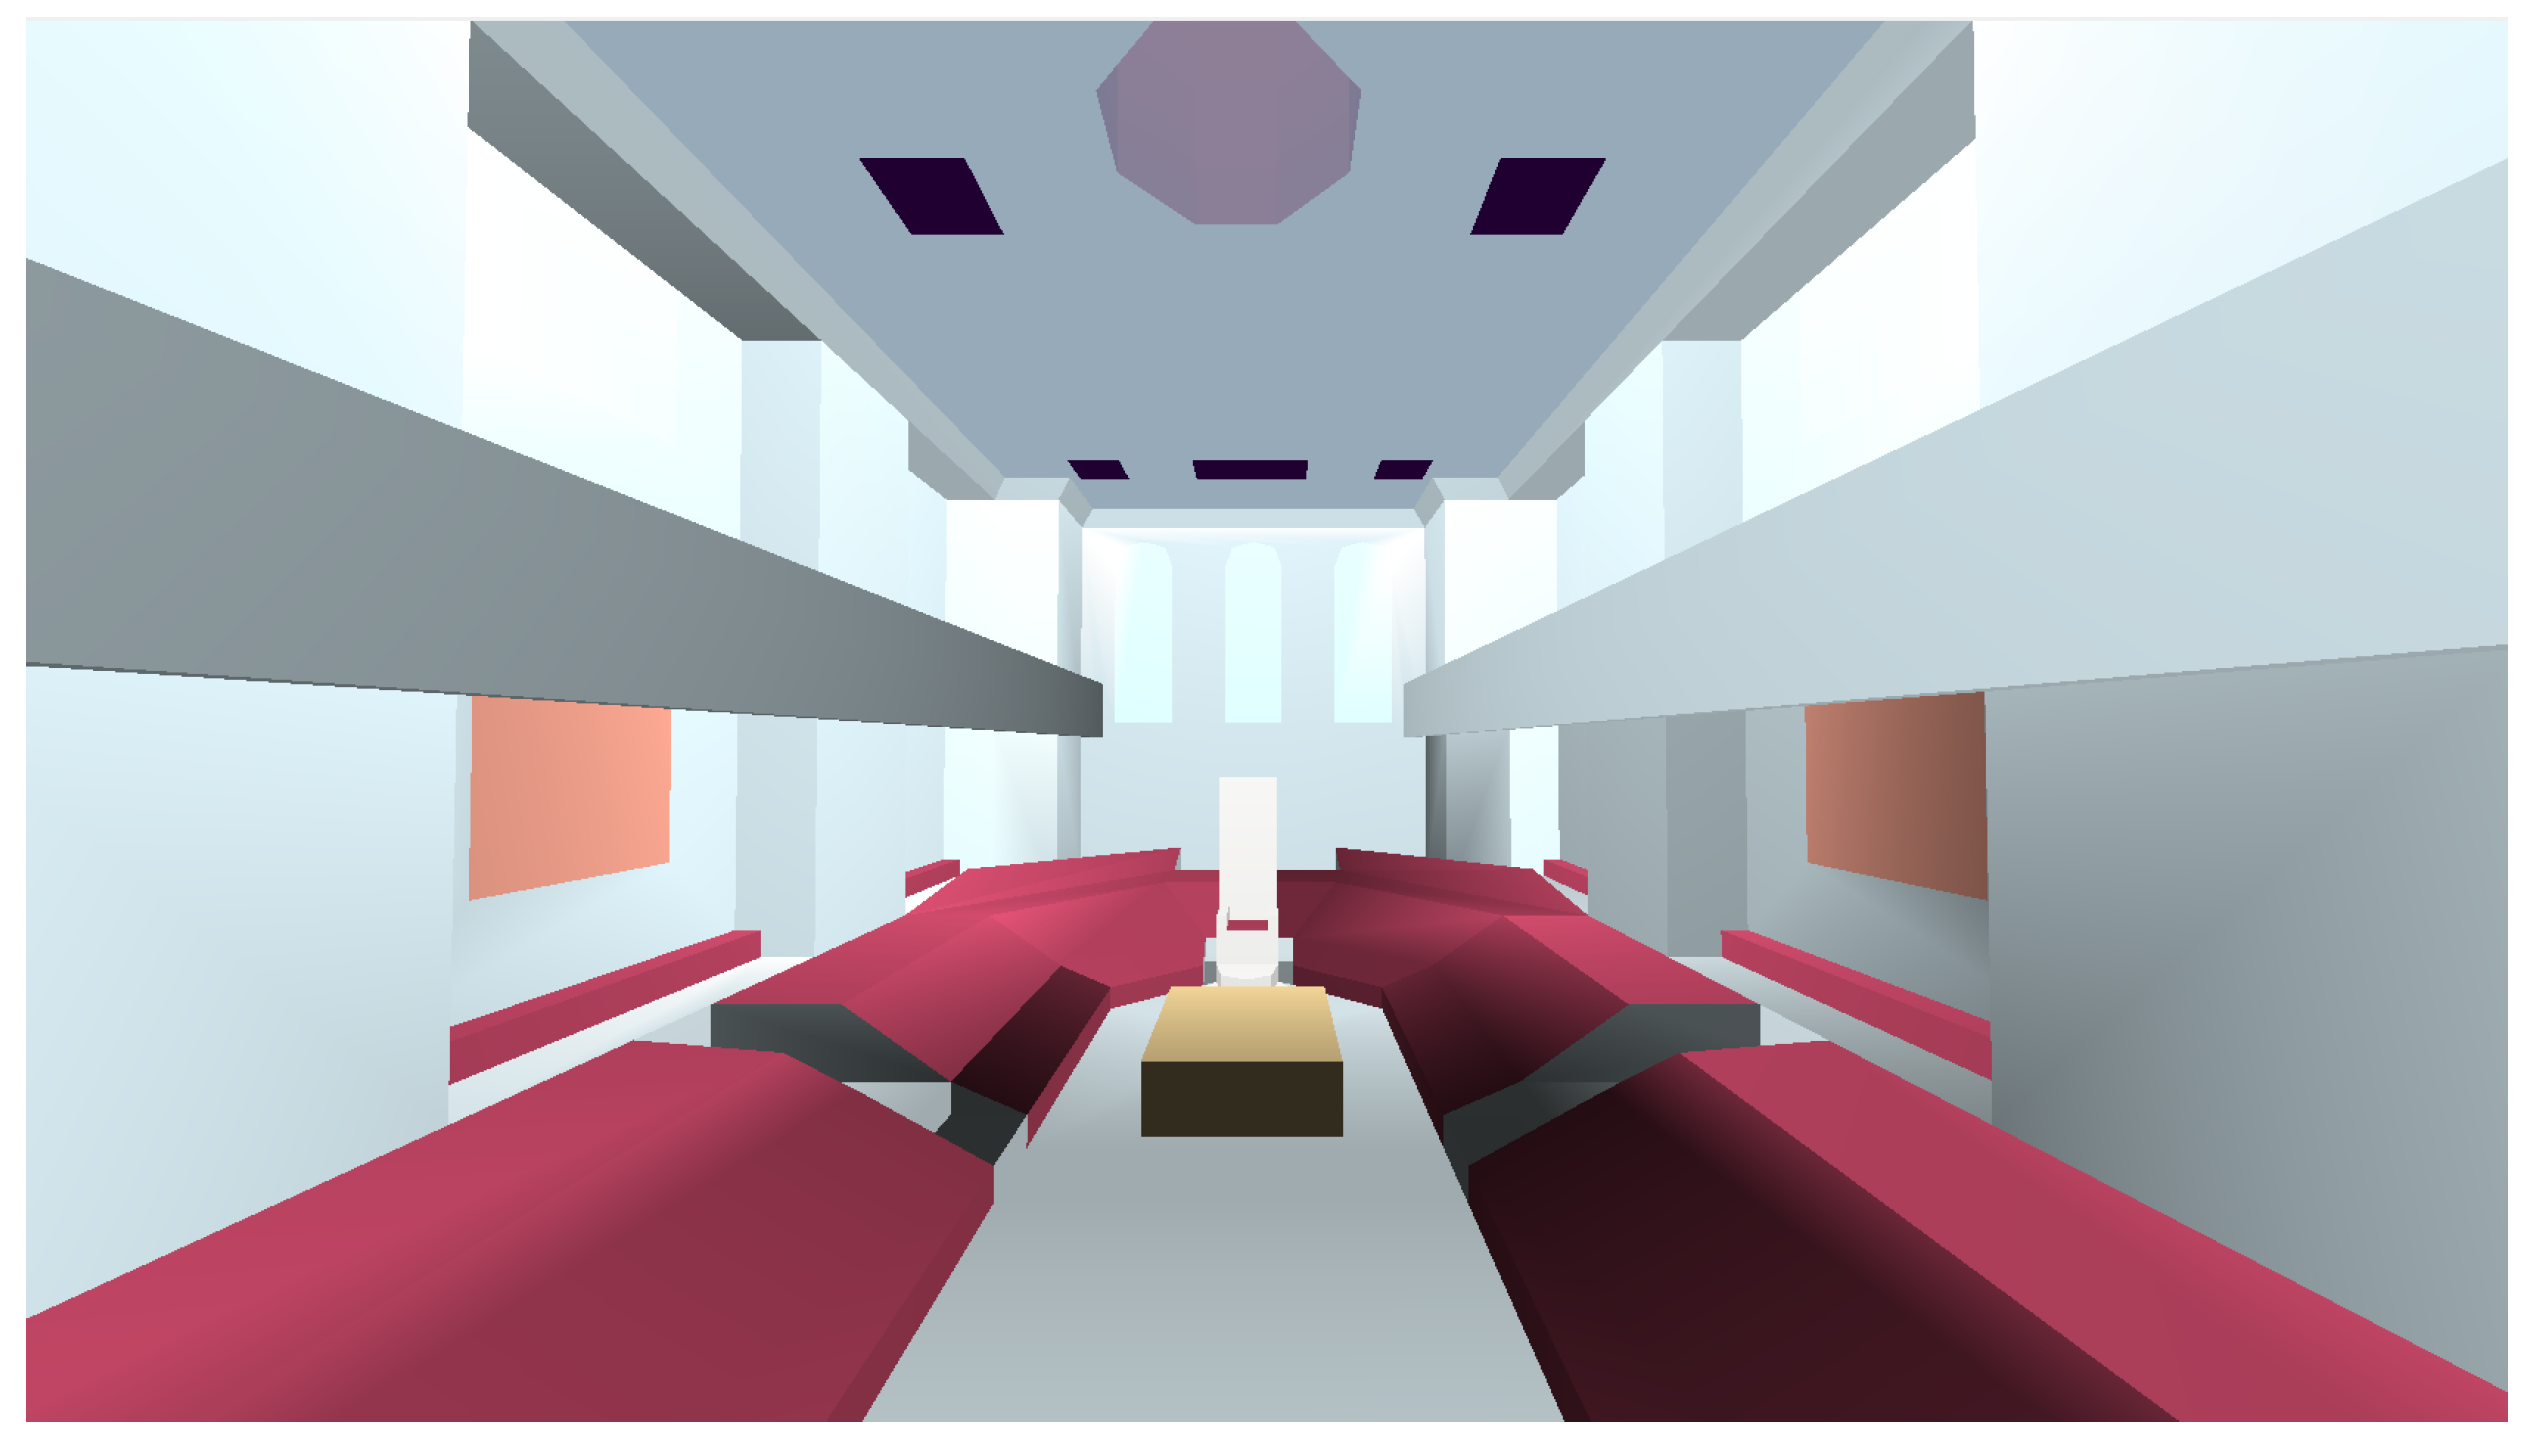
A virtualisation of the final model in ODEON with the simplified representation of the seating areas.
Figure 7.
A virtualisation of the final model in ODEON with the simplified representation of the seating areas.

Figure 8.
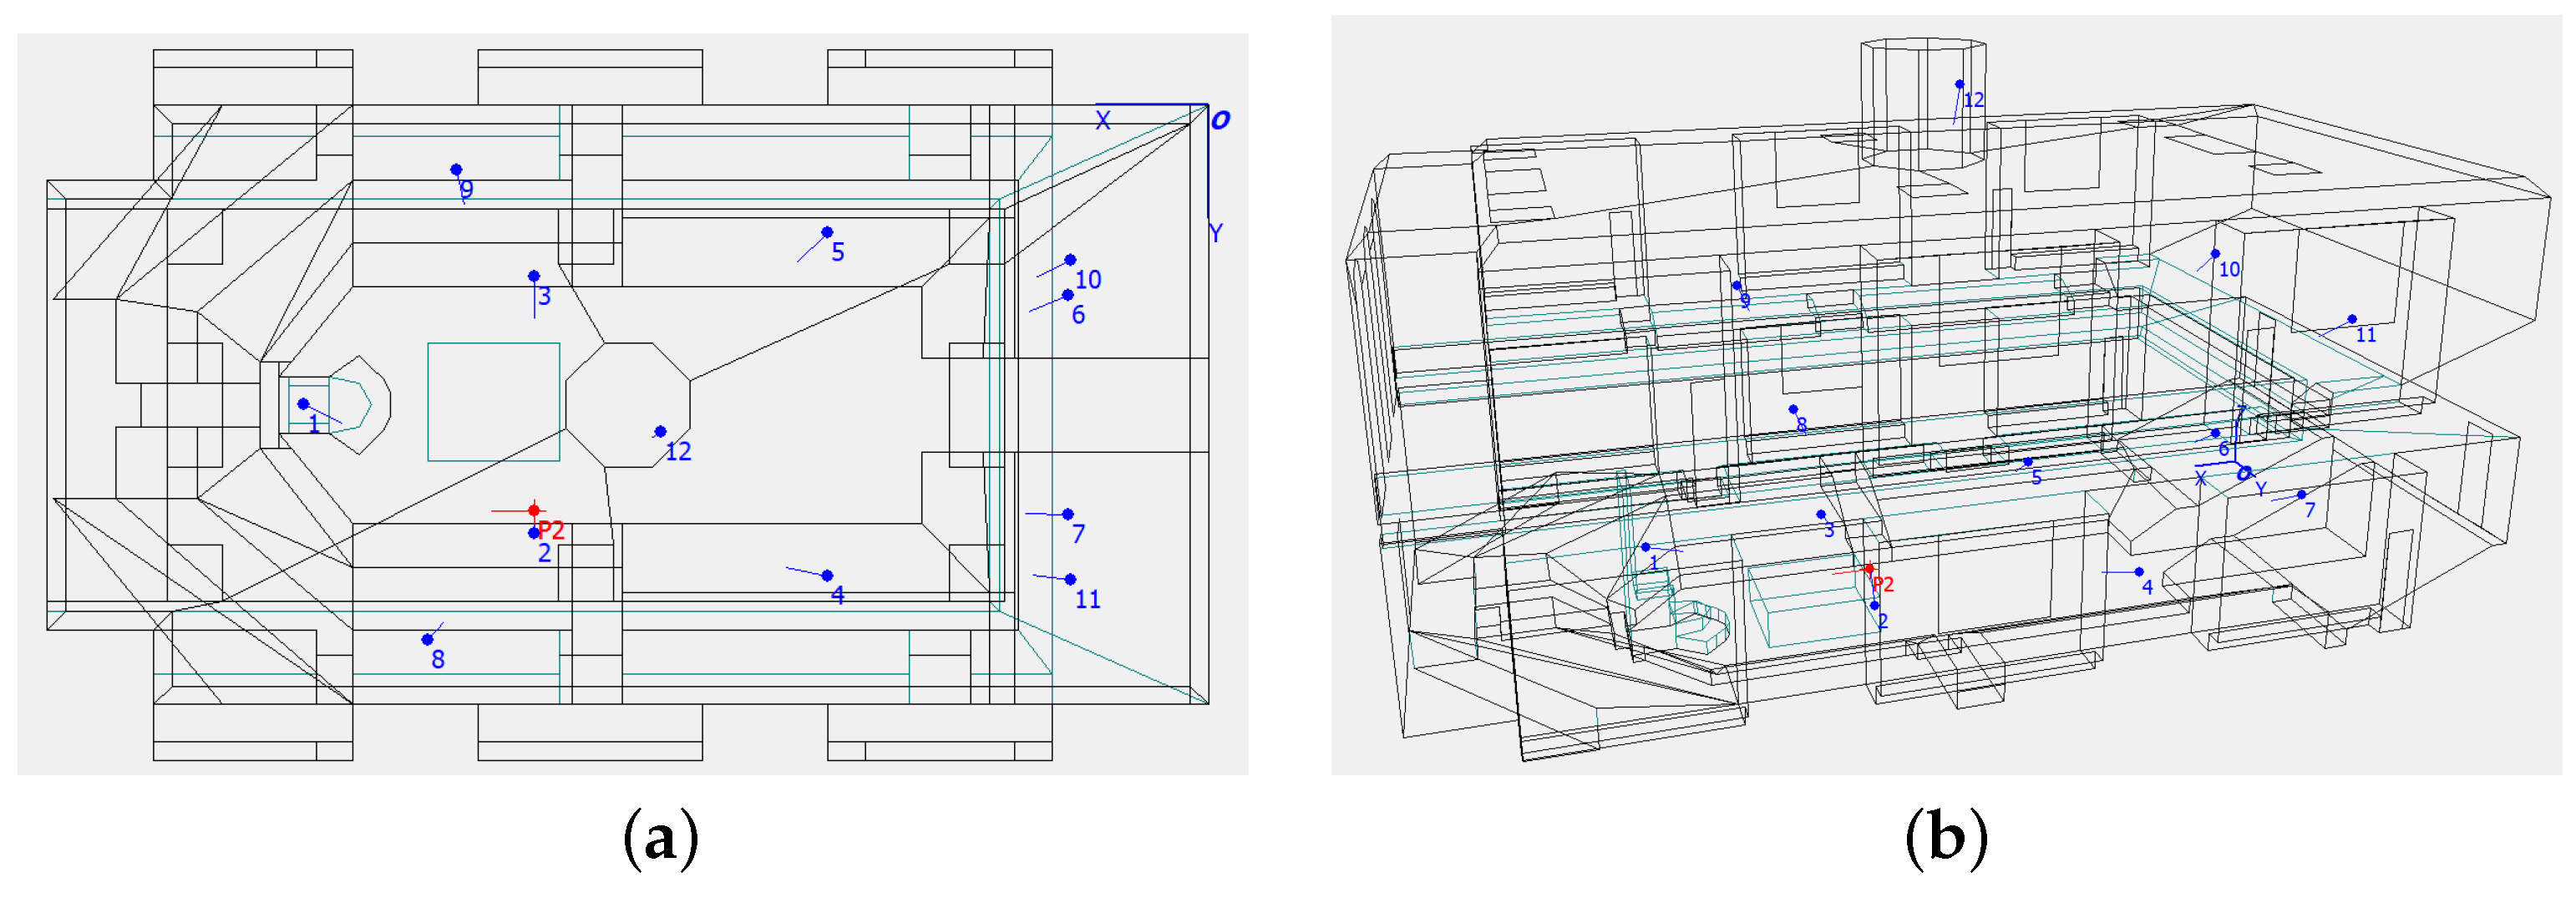
(a) An elevation view of the final ODEON model and (b) an east-to-west view of the space demonstrating the chosen source as a Member of the Parliament (MP) speaker on the right side of the Speaker’s chair (presented in red), and twelve receiver positions (presented in blue) in several positions on the main floor, galleries and ventilation space, all facing the source.
Figure 8.
(a) An elevation view of the final ODEON model and (b) an east-to-west view of the space demonstrating the chosen source as a Member of the Parliament (MP) speaker on the right side of the Speaker’s chair (presented in red), and twelve receiver positions (presented in blue) in several positions on the main floor, galleries and ventilation space, all facing the source.

Figure 9.
Average values of T30 obtained from experimental versions in ODEON by using different materials to define the surfaces of the seating area.
Figure 9.
Average values of T30 obtained from experimental versions in ODEON by using different materials to define the surfaces of the seating area.

Figure 10.
(a) Average T30 values and (b) C50 values with and without scattering coefficient information applied to all surfaces.
Figure 10.
(a) Average T30 values and (b) C50 values with and without scattering coefficient information applied to all surfaces.

Figure 12.
Results of the fourteen individual measured positions in the Convocation House, and the average values across frequency bands for (a) T30, (b) C50, (c) EDT and (d) Ts.
Figure 12.
Results of the fourteen individual measured positions in the Convocation House, and the average values across frequency bands for (a) T30, (b) C50, (c) EDT and (d) Ts.

Figure 13.
(a) Divinity School, University of Oxford, photo by DAVID ILIFF. Licence: CC BY-SA 3.0 via Wikimedia Commons [47] and (b) floor plan of the measured position.
Figure 13.
(a) Divinity School, University of Oxford, photo by DAVID ILIFF. Licence: CC BY-SA 3.0 via Wikimedia Commons [47] and (b) floor plan of the measured position.

Figure 14.
Results of the measured positions in Divinity School across frequency bands for (a) T30, (b) C50, (c) EDT and (d) Ts.
Figure 14.
Results of the measured positions in Divinity School across frequency bands for (a) T30, (b) C50, (c) EDT and (d) Ts.

Figure 15.
(a) Chamber of House of Commons, Palace of Westminster, in its current condition. Licence: CC BY-SA 3.0 via Wikimedia Commons [48] and (b) floor plan of the measured positions.
Figure 15.
(a) Chamber of House of Commons, Palace of Westminster, in its current condition. Licence: CC BY-SA 3.0 via Wikimedia Commons [48] and (b) floor plan of the measured positions.

Figure 16.
Results of the seven individual measured positions in the modern House of Commons and the average values across frequency bands for (a) T30, (b) C50, (c) EDT and (d) Ts.
Figure 16.
Results of the seven individual measured positions in the modern House of Commons and the average values across frequency bands for (a) T30, (b) C50, (c) EDT and (d) Ts.

Figure 17.
(a) Holywell Music Room, in Oxford in its current condition [49] and (b) floor plan of the measured positions.
Figure 17.
(a) Holywell Music Room, in Oxford in its current condition [49] and (b) floor plan of the measured positions.

Figure 18.
Results of the twenty-six individual measured positions in Holywell Music Room and the average values across frequency bands for (a) T30, (b) C50, (c) EDT and (d) Ts.
Figure 18.
Results of the twenty-six individual measured positions in Holywell Music Room and the average values across frequency bands for (a) T30, (b) C50, (c) EDT and (d) Ts.

Figure 19.
(a) Photograph of the York Guildhall Council Chamber (2023) and (b) floor plan of the measured positions.
Figure 19.
(a) Photograph of the York Guildhall Council Chamber (2023) and (b) floor plan of the measured positions.

Figure 20.
Results of the twelve individual measured positions in York Guildhall Council Chamber and the average values across frequency bands for (a) T30, (b) C50, (c) EDT and (d) Ts.
Figure 20.
Results of the twelve individual measured positions in York Guildhall Council Chamber and the average values across frequency bands for (a) T30, (b) C50, (c) EDT and (d) Ts.

Figure 21.
Comparison of the average values across eleven simulated positions in both CATT-Acoustic and ODEON for (a) T30, (b) C50. The X marks indicate the ±1 JND values for each parameter. Error bars at each point indicate the deviation of the results obtained from all eleven simulated positions.
Figure 21.
Comparison of the average values across eleven simulated positions in both CATT-Acoustic and ODEON for (a) T30, (b) C50. The X marks indicate the ±1 JND values for each parameter. Error bars at each point indicate the deviation of the results obtained from all eleven simulated positions.

Figure 22.
Average values of the five in situ measurements compared with the final model in ODEON: (a) T30, (b) C50, (c) EDT and (d) Ts. Error bars indicate the deviation of the values across the different measured positions of the ODEON model.
Figure 22.
Average values of the five in situ measurements compared with the final model in ODEON: (a) T30, (b) C50, (c) EDT and (d) Ts. Error bars indicate the deviation of the values across the different measured positions of the ODEON model.

Figure 23.
Average T30 results across all frequency bands of the five measured spaces and the ODEON model versus their volume. Error bars represent the deviation of the individual positions for each site, while the pink circle represents the averaged T30 values at 1 kHz.
Figure 23.
Average T30 results across all frequency bands of the five measured spaces and the ODEON model versus their volume. Error bars represent the deviation of the individual positions for each site, while the pink circle represents the averaged T30 values at 1 kHz.


Table 1.
The chosen materials with their absorption coefficient across the frequency bands, and the overall surface area of each of them, as used in the early versions of the model.
Table 1.
The chosen materials with their absorption coefficient across the frequency bands, and the overall surface area of each of them, as used in the early versions of the model.
| Materials | 125 Hz | 250 Hz | 500 Hz | 1 kHz | 2 kHz | 4 kHz | Surface Area |
|---|---|---|---|---|---|---|---|
| Woodenpanel | 0.20 | 0.15 | 0.10 | 0.08 | 0.04 | 0.02 | 630.4 m |
| Audience | 0.52 | 0.68 | 0.85 | 0.97 | 0.93 | 0.85 | 222.9 m |
| Plaster | 0.20 | 0.15 | 0.10 | 0.08 | 0.04 | 0.02 | 148.0 m |
| Wooden floor | 0.15 | 0.11 | 0.10 | 0.07 | 0.06 | 0.07 | 112.0 m |
| Glass | 0.18 | 0.06 | 0.04 | 0.03 | 0.02 | 0.02 | 24.7 m |
| Light velour | 0.03 | 0.04 | 0.11 | 0.17 | 0.24 | 0.35 | 9.6 m |
| Marble | 0.01 | 0.01 | 0.01 | 0.01 | 0.02 | 0.02 | 10.8 m |
| Metal perf | 0.76 | 0.76 | 0.90 | 0.99 | 0.85 | 0.70 | 11.5 m |
| Curtains | 0.04 | 0.23 | 0.14 | 0.57 | 0.53 | 0.40 | 5.8 m |
Table 2.
Frequency-dependent absorption coefficient of the materials found in previous studies and tested for the seating surfaces in the model. The material wooden pews (WP) is taken from [37], and its scattering coefficient values are listed as well (figures on the right in the corresponding row). The material unoccupied moderately upholstered chairs (UC) is from [38]. The material empty chairs, upholstered with leather (LC) is taken from [23]. The material empty chairs upholstered with cloth cover (CC) is from [23]. The material wooden pews (A/S) with seat cushions (without persons) (WPC) is from [36].
| Materials | 125 Hz | 250 Hz | 500 Hz | 1 kHz | 2 kHz | 4 kHz |
|---|---|---|---|---|---|---|
| WP | 0.10/0.30 | 0.15/0.40 | 0.18/0.50 | 0.20/0.60 | 0.20/0.70 | 0.20/0.80 |
| UC | 0.44 | 0.56 | 0.67 | 0.74 | 0.83 | 0.87 |
| LC | 0.40 | 0.50 | 0.58 | 0.61 | 0.58 | 0.50 |
| CC | 0.44 | 0.60 | 0.77 | 0.89 | 0.82 | 0.70 |
| WPC | 0.21 | 0.53 | 0.77 | 0.69 | 0.58 | 0.59 |
Table 3.
Scattering coefficients applied to the used materials in ODEON and CATT-Acoustic.
| Materials | Scattering Coefficient in ODEON | Scattering Coefficient in CATT-Acoustic (in %) | |||||
|---|---|---|---|---|---|---|---|
| 125 Hz | 250 Hz | 500 Hz | 1 kHz | 2 kHz | 4 kHz | ||
| Wooden panel | 0.2–0.5 for coffered panels and ceilings [40] | 2 | 5 | 25 | 45 | 70 | 90 |
| Wooden pews | 0.7 [40] | 9 | 35 | 60 | 80 | 90 | 90 |
| Plaster | 0.1 for large smooth surfaces [40] | 1 | 2 | 5 | 30 | 60 | 85 |
| Wooden floor | 0.1 | 1 | 2 | 5 | 30 | 60 | 85 |
| Glass | 0.15 | 1 | 3 | 5 | 16 | 54 | 85 |
Disclaimer/Publisher’s Note: The statements, opinions and data contained in all publications are solely those of the individual author(s) and contributor(s) and not of MDPI and/or the editor(s). MDPI and/or the editor(s) disclaim responsibility for any injury to people or property resulting from any ideas, methods, instructions or products referred to in the content. |
© 2023 by the authors. Licensee MDPI, Basel, Switzerland. This article is an open access article distributed under the terms and conditions of the Creative Commons Attribution (CC BY) license (https://creativecommons.org/licenses/by/4.0/).
Share and Cite
MDPI and ACS Style
Foteinou, A.; Murphy, D.; Cooper, J.P.D. An Acoustic Reconstruction of the House of Commons, c. 1820–1834. Acoustics 2023, 5, 193-215. https://doi.org/10.3390/acoustics5010012
AMA Style
Foteinou A, Murphy D, Cooper JPD. An Acoustic Reconstruction of the House of Commons, c. 1820–1834. Acoustics. 2023; 5(1):193-215. https://doi.org/10.3390/acoustics5010012
Chicago/Turabian StyleFoteinou, Aglaia, Damian Murphy, and J. P. D. Cooper. 2023. "An Acoustic Reconstruction of the House of Commons, c. 1820–1834" Acoustics 5, no. 1: 193-215. https://doi.org/10.3390/acoustics5010012