An Efficient Network Resource Management in SDN for Cloud Services


School of Computer Science and Engineering, Kyonggi University, Gyeonggi-do 16227, Korea
*
Authors to whom correspondence should be addressed.
Symmetry 2020, 12(9), 1556; https://doi.org/10.3390/sym12091556
Submission received: 7 August 2020
/
Revised: 4 September 2020
/
Accepted: 17 September 2020
/
Published: 21 September 2020
(This article belongs to the Section Computer)
Abstract
:With the recent advancements in cloud computing technology, the number of cloud-based services has been gradually increasing. Symmetrically, users are asking for quality of experience (QoE) to be maintained or improved. To do this, it has become necessary to manage network resources more efficiently inside the cloud. Many theoretical studies for improving the users’ QoE have been proposed. However, there are few practical solutions due to the lack of symmetry between implementation and theoretical researches. Hence, in this study, we propose a ranking table-based network resource allocation method that dynamically allocates network resources per service flow based on flow information periodically collected from a software defined network (SDN). It dynamically identifies the size of the data transmission for each service flow on the SDN and differentially allocates network resources to each service flow based on this size. As a result, it maintains the maximum QoE for the user by increasing the network utilization. The experimental results show that the proposed method achieves 29.4% higher network efficiency than the general Open Shortest Path First (OSPF) method on average.
1. Introduction
Various services have been provided, based on recent advancements in cloud computing technologies [1], and their types and targets have been continuously expanding. Early cloud-based services mainly focused on storage services, whereas various current services include big data analysis, games, and multimedia processing. Cloud-based services are expected to achieve the fastest rate of growth over the next few years. However, owing to advancements in these technologies and their market growth, processing procedures have become more complex and the amount of data required in the service provisioning procedures has drastically increased in symmetry. Therefore, an efficient management method for the internal resources of the cloud has symmetrically become essential for providing services more smoothly while maintaining the quality of experience (QoE).
The traditional network structure currently used on the Internet cannot flexibly deal with dynamically requested services. Software defined networking (SDN) [2] technology has emerged to address this issue. SDN symmetrically separates the network structure into a control plane and a data plane and manages network switches through the Openflow [3] protocol. At the control plane, the controller conducts network control functions such as routing, flow table management, and topology management. At the data plane, the switches forward packets using the flow rules received from the controller in symmetry. The overhead of the control plane in SDN may increase a little. However, SDN can efficiently manage network resources because it enables a logical access to the network and dynamically adds user-desired functions to the controller.
Therefore, in this study, we propose a method for efficiently managing resources when providing cloud services in SDN. The proposed method collects and analyzes the traffic pattern of the services currently being transmitted to the network using SDN. Based on the analyzed information, the priority of services is symmetrically determined by predicting the usage of services requested from the user. The proposed method dynamically allocates the network resources for each service based on the priority of services in symmetry.
2. Related Works
With the recent advancements and increasing demand for cloud computing technology, a delay problem in content delivery has seriously emerged at the cloud. Various studies have been actively conducted to address this problem. Studies on the management aspect of network resources have mainly focused on processing, such as traffic control, bandwidth load balancing, and path allocation, during the data transmission required to provide services to the relevant processing servers. Many previous studies have mainly focused on server computing resource management. However, recently, resource management methods considering both network resources and computational resources have been symmetrically gaining attention because of the need to consider delays actually occurring in the network.
In [4,5], an orchestrator system for managing network resources inside the cloud was proposed. The proposed system manages network resources using a python based open source Openflow/SDN (POX) controller in a Xen-based cloud environment. This system determines whether each virtual machine (VM) is executed using the virtual machine monitor (VMM) handler, and forwards the information to the engine. Next, the system allocates the network path to the determined VM. Here, it identifies the status of the network using the SDN controller. The core of these studies is to predict the load information of the network. To this end, the authors proposed a formula that predicts the network load information based on previous log information and the current state of the network traffic.
In [6], an integrated management framework based on SDN was proposed to reduce the resource usage during the network communication procedure. The proposed framework applies a real-time VM migration method to reduce the inefficiencies in dynamic network traffic and internal cloud links. The proposed migration method calculates the network load of the VMs from where the service is requested based on the S-CORE [7] algorithm, and then determines whether to apply migration based on this information.
In [8], the network is automated using Intent-Based Networking (IBM), which is similar to SDN, and improves the quality of service (QoS) of the network using cloud technology. It distributes the additionally required resources to the cloud by using cloud technology instead of physical backup resources when the network approaches the maximum overhead.
In [9], the QoS for various services is satisfied using network monitoring and flow level scheduling by employing SDN for a cloud data center network (CDCN). The proposed system suggests a resource allocation mechanism that maintains the maximum link utilization for all services, focusing on traffic management problems. In [10], a multi-service differentiated (MSD) traffic management strategy for SDN-based cloud data centers is proposed to process various types of increasing traffic. A Fibonacci tree optimization algorithm is applied to optimize the MSD traffic management.
In [11], the authors comprehensively surveyed and evaluated the performance of existing delay-constrained least-cost (DCLC) routing algorithms in the SDN environment. They adapted 26 DCLC routing algorithms to the SDN controller and compared their performances within the 4D evaluation framework. According to their results, the Lagrange relaxation-based aggregated cost algorithm and the search space reduction delay-cost-constrained routing algorithm performed well in most of the evaluation space. In [12], the authors studied the convergence performance of the Open Shortest Path First (OSPF) routing protocol in both the legacy network and the SDN architectures. They measured the packet forwarding delay and convergence time after a network failure. According to their results, the routing convergence time in SDN architecture is less than that in the distributed legacy network architecture. In [13], the authors similarly analyzed the performance of the network convergence in the legacy network and the SDN architectures.
In [14], the authors modified the OSPF routing protocol to dynamically change the metric calculation based on the network requirements. They give the privilege to multimedia traffic flows based on network requirements to improve the quality of multimedia services. Their protocol increases the network bandwidth utilization and reduces the loss rate and the delay of multimedia traffic flows. However, the goal of their protocol differs from that of our mechanism. Their protocol focuses on the service differentiation and provides more resources to multimedia traffic flows. Meanwhile, our mechanism focuses on the overall network resource utilization and provides more efficient network resources to the flows that can use them more. In addition, their protocol requires the flows to be explicitly classified into multimedia and non-multimedia types when the traffic enters the network. In [14], the authors used an artificial intelligence module, proposed in [15], for flow classification. However, that module is just optimized for separating small sensor data from multimedia data and does not consider diverse traffic data. In addition, their protocol requires the installation of a new message exchanging protocol on both the controller and the switches.
In [16], the authors proposed a way to reduce the delay for the significant traffic in SDN due to the separation of the control and data planes. In [17], the authors proposed a hierarchical resource allocation scheme to decrease the interference between the macro and the micro cells in SDN-based cellular networks.
Our study does not focus on the situation where there are so many network nodes that the distributed protocols cannot operate on them. We also do not focus on the performance comparison of routing protocols with the legacy network and the SDN either in symmetry. The performance of routing protocols in the legacy network and the SDN was symmetrically compared and analyzed well in [12,13]. In this study, we focus on efficient network resource management with SDN and propose a new network resource allocation mechanism that can be used in SDN. As mentioned above, many studies have been conducted on the load balancing and routing in SDN. However, there has been no approach to increase the overall network resource utilization by giving more efficient network resources to the flows that can use them more like ours.
3. Need for Network Resource Management in SDN
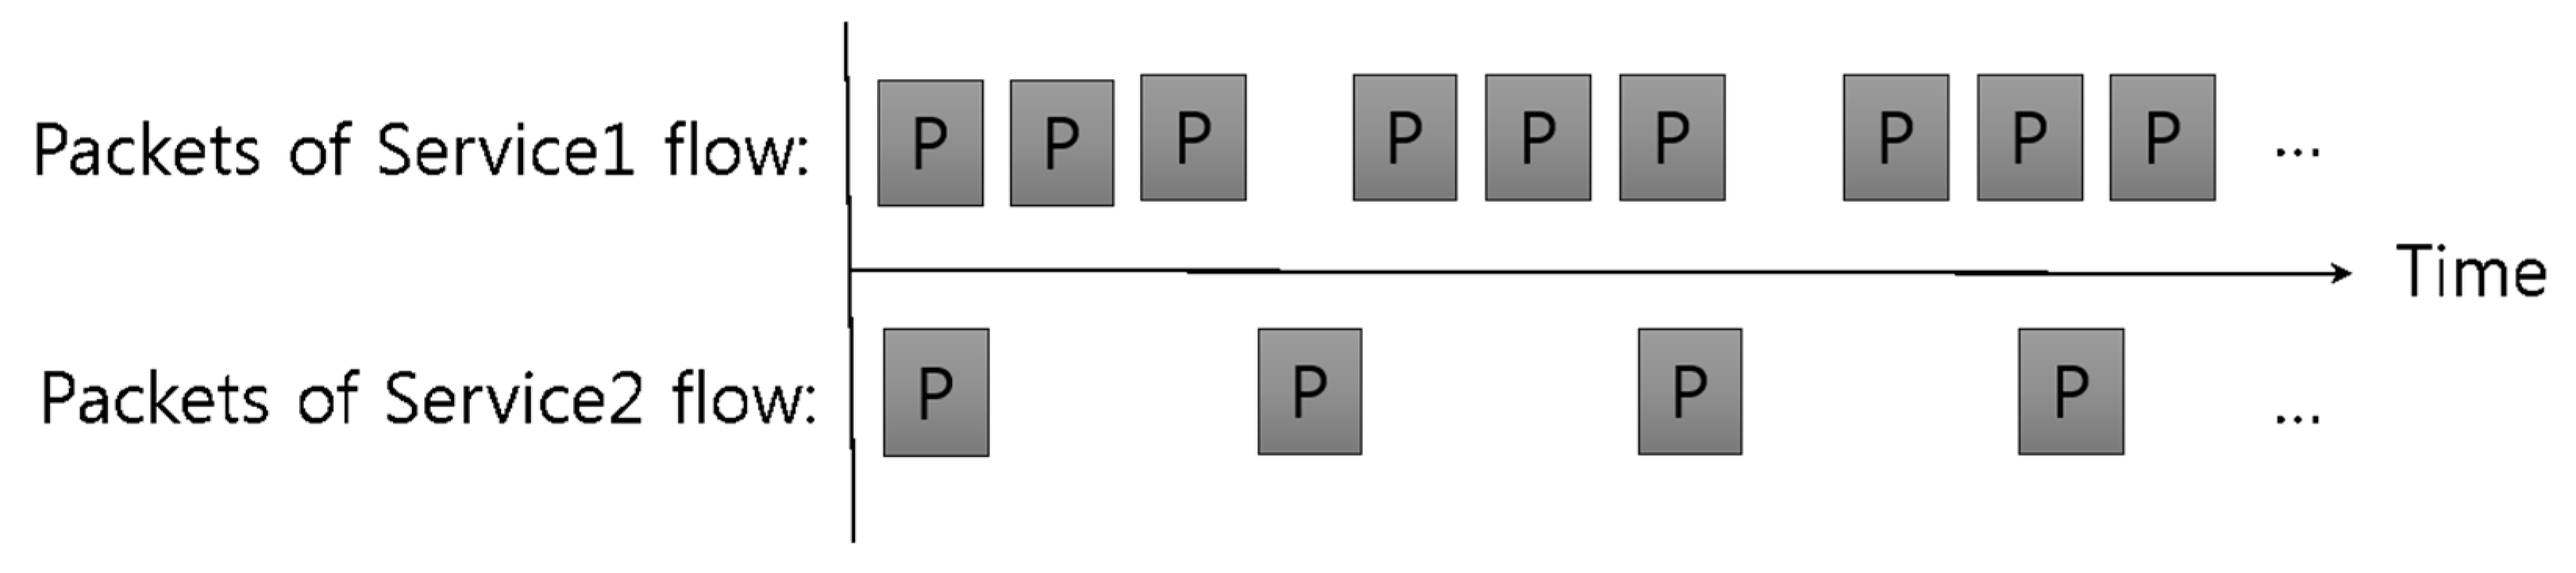
In a cloud-based service, a flow can be created and removed when a service begins and ends, respectively. Each flow takes a different form depending on the transmission pattern of the packets, and this pattern can vary depending on the type of service requested and the state of the service. Figure 1 shows an example of the internal packet sequence of the flow developed when two services are created. As indicated in the figure, the number of packets entering the flow varies dynamically depending on the state of each service. For example, regarding the flow for processing a real-time streaming service, the packets consistently come in at regular time intervals. In the flow for processing a web service, the packets explosively come in only when the web moves or starts, after which the packets occasionally enter to maintain the session. Therefore, the packet pattern of each flow differs owing to various factors when multiple users request multiple services. This difference dynamically changes the amount of network resources used by the flow.
A cloud system can use the network resources of various paths to deliver the desired content to the user. If highly effective network resources with low cost are first allocated to a flow that consumes a large amount of network resources, the user QoE can be significantly improved. Figure 2 shows an example of a cloud network topology with two different network cost paths and three service flows with a dynamically changing the amount of data transmitted. The cloud system shown in Figure 2a has two different paths between the user and server. It is assumed that the s1-s3-s5 path is less costly than the s1-s2-s4-s5 path and can support only a single service flow. Figure 2b shows the size of the data transmission required when processing the three services. In this scenario, if the cloud network is configured using a traditional network structure, the network resources cannot be dynamically allocated according to the amount of data. Therefore, in the traditional network structure, when Service1 is first requested, it is transmitted through the s1-s3-s5 path and the remaining services are transmitted through the s1-s2-s4-s5 path. At this time, when the network utilization is analyzed over time, Service1 is considered to effectively transmit most of the data in the t0-t1 section, thus using the path efficiently. However, in the t1-t2 section, Service2 is transmitting most of the data but cannot use the low cost path. In the t2-t3 section, Service1 transmits hardly any data, whereas Service3 steadily transmits data, leading to a sharp decrease in network utilization. Consequently, in a traditional network structure, network resources cannot be efficiently used because they cannot be dynamically allocated according to the amount of data transmitted.
If the traffic pattern changes are detected in real time and paths are dynamically allocated using the SDN structure, network resources can be more efficiently managed. The SDN structure enables the changes in the amount of data transmitted by each service flow to be identified in real time. Thus, it can dynamically allocate the most efficient network resources to the service flow that transmits the most data per unit time according to the amount of data transmission identified. If the SDN structure is adopted in the above example, the s1-s3-s5 network path can be switched and allocated to Service1, Service2, Service3, Service1, and Service3 per unit time. In this manner, the network efficiency continues to increase, thereby increasing the user’s QoE. However, we should accurately predict the changes in flow arising from various factors to obtain such results. Therefore, in this study, we propose a method for more precisely detecting and processing the flow changes in an SDN structure.
4. Proposed Network Resource Management Method in SDN
The proposed method manages resources efficiently at the network level when providing services in a cloud environment. Figure 3 shows the proposed system structure for efficient network resource management. As the figure indicates, the SDN controller is periodically notified regarding the amount of data and the number of packets transmitted. The information collected by the SDN controller is sent to the priority calculator, which uses it to calculate the weight of the flows. The ranking table manager sorts and stores the flows by priority based on the calculated weight. It then determines the network path of the flow using the set threshold. The ranking table manager continues to update and store the priority of the services. The flow rule generator creates a flow rule by setting the differential network paths for the services after checking the ranking table. The generated flow rule is sent back to the controller, which sends it to the switch through the Openflow protocol. Finally, each switch forwards packets based on the updated flow rule.
It is difficult to predict exactly how much data a specific service will send at a specific point in the future. Therefore, in this study, we propose a scheduling method that predicts the amount of future traffic required by the service by analyzing the amount of traffic that has been generated by the service flow. The proposed method includes a procedure for calculating the priority and a procedure for allocating the network path based on the priority. The priority is contingent on how much data have been sent at a certain time in the past. The priority increases for flows that have recently sent large amounts of data, whereas the priority decreases for flows that have not. If the priority of flows does not change over time, current high demanding flows may not use more efficient network paths because past high demanding flows are occupying it. For solving this, we use the exponential weighted moving average for the amount of data transmitted in the past for each flow k at time t, as expressed in Equation (1).
where, refers to the amount of data transmitted for flow k between time t-1 and t, and α refers to the weight.
Figure 4 shows the procedure for allocating the network path based on the priority through the ranking table in the application. The controller periodically calculates and forwards it to the ranking table. The ranking table then manages the collected flows by sorting them based on . It then applies a threshold for differential network path allocation. This threshold can be set differently depending on the characteristics of the service and is used as the criterion for allocating efficient network paths in the SDN.
5. Performance Evaluation
In this section, we evaluate the performance of the network management method based on the ranking table that is applied to a cloud system in an SDN environment. As a result that it is difficult to collect the input data for the experiment from actual cloud-based services, we obtained them through the Ostinato [18] packet generator by analyzing the user request patterns. Table 1 and Table 2 show the settings used for the system and the experimental data applied during the experiments, respectively.
The data used for the experiment are largely divided into multimedia and web service data. All the data have 180 flows. The packet size for the web service is generated randomly. It is assumed that the service request pattern of the web data is a random request made again within 10 min of an incoming request.
Figure 5 shows the network topology used for the experiments. The topology consists of eight switches and sends data traffic through four network paths. The cost of each link is 1. Hence, the total cost of each network path is the number of hops composing the path. Hence, the network paths s1-s2-s8 and s1-s3-s8 are better than network paths s1-s4-s6-s8 and s1-s5-s7-s8. It is assumed that the paths s1-s2-s8 and s1-s3-s8 do not include more than 60 flows each. Therefore, not all flows can use the optimal paths. Some of them have to use the non-optimal paths s1-s4-s6-s8 and s1-s5-s7-s8.
Figure 6 shows the data workloads used for the experiment, which have six workload types. Each workload represents the number of multimedia and web services requested over time. In the figure, the amount of data for multimedia and web services is the same for both Workload-E and the Workload-F. In this study, we evaluated the performance of the six workload types in the experiments. These experiments aim to verify how much data traffic is transmitted through optimal paths by efficiently allocating the network resources to the service flow. For performance comparison, we also implemented the OSPF, which is the most commonly used in the conventional path selection algorithms. Many researchers have investigated its performance in the SDN environment [12,13] and compared their proposals with the OSPF [14]. In our study, we also evaluate the OSPF and compare it with our proposed algorithm.
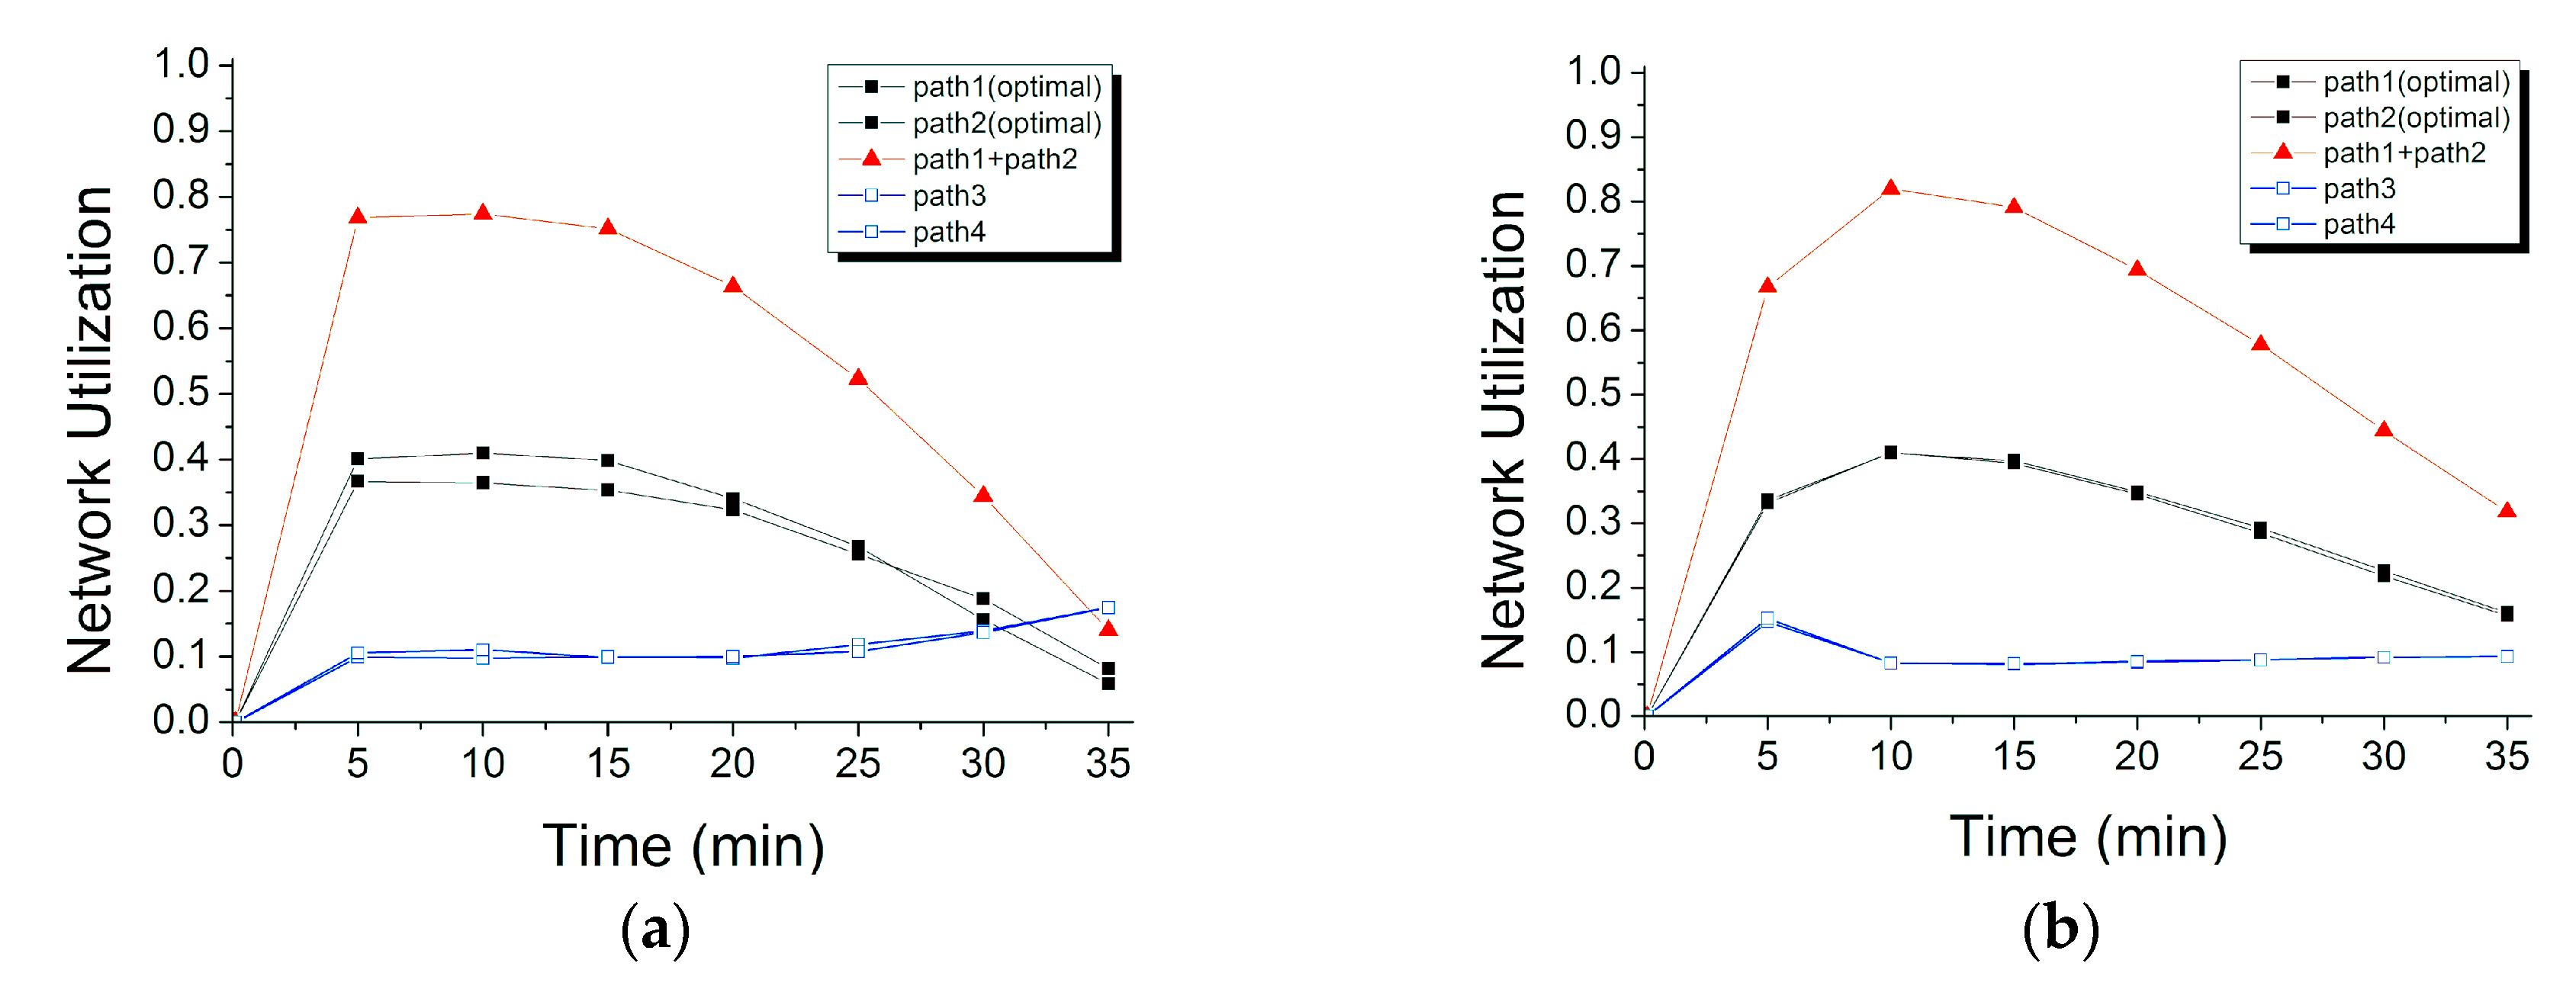
In the experiments, we set the weighting factor α of our proposed method as 0.5. We also update the ranking table every 5 min and distribute the flow rules to the switches at the same frequency. Figure 7 shows the performance evaluation results for Workload-A in which the multimedia services increase and the web services decrease. The vertical axis indicates the network utilization, and the horizontal axis indicates the flow of time in minutes. The network utilization is the amount of data sent divided by the maximum amount of data that can be sent through the optimal paths. This shows how many data are sent through the network paths. In the experiments, up to 120 flows can be sent through the optimal paths and the measurement interval is 5 min. Therefore, the maximum amount of data that can be sent through the optimal paths over the past 5 min is the sum of the amount of data in the top 120 flows based on the amount of data that enters during the corresponding amount of time. If the sum of the network utilizations of the optimal paths is 1, it indicates that all of the top 120 flows are assigned to the optimal paths. In the graph, the empty-blue-square line represents the results of paths 3 and 4 with long hop counts. The solid-black-square line represents the network utilization of the data transmitted through paths 1 and 2, which are optimal paths owing to the small number of hops. The solid-red-triangle line represents the sum of the amount of data transmitted through paths 1 and 2, and shows how much data flows through the optimal paths. If this value is 1, it indicates that the maximum amount of data that could be sent through the optimal paths was actually sent through those paths. The results confirm that the network utilization of paths 1 and 2 gradually decreases over time for the OSPF algorithm. Meanwhile, the utilization of paths 1 and 2 increases over time for the proposed algorithm. In the experiments, a total of 200 services were requested. At the first 0–5 min, the numbers of flows for multimedia services and web services were 20 and 180, respectively. Thus, many flows for the web services were allocated to optimal paths (paths 1 and 2) in the beginning. In this situation, the OSPF does not change the flows allocated to the optimal paths even though the number of flows for the multimedia services, which have a large amount of data transmitted, increases over time. In contrast, the proposed algorithm dynamically reallocates the paths based on the continuously checked priority of the flows. It lowers the priority of the web flows when new multimedia flows enters. Therefore, it changes the flows allocated to the optimal paths from the web services to the multimedia services when new multimedia services come in, thus leading to an increase in the efficiency in terms of network usage as shown in Figure 7b.
The same results are observed in the other workloads as shown in Figure 8, Figure 9, Figure 10, Figure 11 and Figure 12. However, the performance evaluation results of Workload-C in Figure 9 show an insignificant difference between the two algorithms. This is because the OSPF also uses the network efficiently as more multimedia services are initially requested than the number of web services and the number of multimedia services remains the same, thus resulting in the transmission of multimedia services through paths 1 and 2 from beginning to end.
Figure 13 shows a graph of the total network utilization during the entire experiment time. The total network utilization refers to the amount of data transmitted through paths 1 and 2 divided by the maximum amount of data that can be transmitted for each workload. The results show that the total network utilization of the proposed algorithm is 29.4% higher than that of OSPF on average. The proposed algorithm shows 69.2% higher utilization than OSPF on Workload-A and 1% higher on Workload-C. Workload-A starts with 180 web services sending a relatively small amount of data and 20 multimedia services sending a relatively large amount of data. The number of flows of web services decreases and the number of flows of multimedia services increases gradually over time. In this situation, OSPF mostly assigns the web flows to the optimal paths in the beginning and does not replace them with the incoming multimedia flows. In contrast, the proposed algorithm reallocates the optimal paths assigned to the earlier web flows to the new multimedia flows. As a result, the proposed algorithm provides much better performance than the OSPF. The situation is slightly different on Workload-C. On that workload, the number of multimedia flows is initially 100 and does not change over time. Whereas, the number of web flows starts at 20 and grows to 180 over time. In this situation, both the OSPF and the proposed algorithm assign the optimal paths to the multimedia flows and do not replace them even though the number of web flows increases. Therefore, there is little difference in network utilization on Workload-C. In summary, the proposed algorithm shows higher performance than the OSPF on all workloads. As a result, the network resource management method proposed in this paper is clearly more effective than the OSPF.
6. Conclusions
In this paper, we presented an efficient network resource allocation method in SDN to efficiently support cloud services. We dynamically calculated the priority of services over time using a ranking algorithm, based upon which we differentially allocated the network paths. Such a differential path allocation improves the bandwidth utilization of the network paths. To prove its efficiency, we simulated the proposed network resource management system on an SDN and evaluated its performance. The performance evaluation results showed that the proposed method improved the network utilization in comparison with the OSPF method.
The network model and workloads used in this study may not accurately represent actual service models and workloads. Therefore, in future research, we will consider the configurations of actual network models under various situations. We will also study the effect of the dynamic link cost change, and additionally evaluate the performance on network workloads gathered from the Internet. Finally, we have not yet found a similar mechanism where the goal is the same as ours. We will evaluate its performance and compare it with our mechanism if we find it in the future.
Author Contributions
Conceptualization, M.J. and B.-D.L.; methodology, N.K.; software, Y.J.; validation, Y.J.; writing—original draft preparation, M.J. and N.K.; writing—review and editing, N.K.; supervision, B.-D.L.; project administration, B.-D.L.; funding acquisition, N.K. All authors have read and agreed to the published version of the manuscript.
Funding
This work was supported by the Basic Science Research Program through the National Research Foundation of Korea (NRF) funded by the Ministry of Education (NRF-2020R1A6A1A03040583 and NRF-2017R1D1A1B04027874).
Acknowledgments
M.J. and N.K. equally contributed to this work.
Conflicts of Interest
The authors declare no conflict of interest. The funders had no role in the design of the study; in the collection, analyses, or interpretation of data; in the writing of the manuscript, or in the decision to publish the results.
References
- Mell, P.; Grance, T. The NIST Definition of Cloud Computing; National Institute of Standards and Technology: Gaithersburg, MD, USA, 2011. [Google Scholar]
- McKeown, N. Software-defined networking. IEEE Infocom Keynote Talk 2009, 17, 30–32. [Google Scholar]
- Openflow. Available online: https://www.opennetworking.org/ (accessed on 20 April 2020).
- Gharbaoui, M.; Martini, B.; Adami, D.; Giordano, S.; Castoldi, P. Cloud and network orchestration in SDN data centers: Design principles and performance evaluation. Comput. Netw. 2016, 108, 279–295. [Google Scholar] [CrossRef]
- Adami, D.; Martini, B.; Sgambelluri, A.; Donatini, L.; Gharbaoui, M.; Castoldi, P.; Giordano, S. An SDN orchestrator for cloud data center: System design and experimental evaluation. Trans. Emerg. Telecommun. Technol. 2017, 28, e3172. [Google Scholar] [CrossRef]
- Cziva, R.; Jouet, S.; Stapleton, D.; Tso, F.P.; Pezaros, D.P. SDN-based virtual machine management for cloud data centers. IEEE Trans. Netw. Serv. Manag. 2016, 13, 212–225. [Google Scholar] [CrossRef] [Green Version]
- Tso, F.P.; Hamilton, G.; Oikonomou, K.; Pezaros, D.P. Implementing scalable, network-aware virtual machine migration for cloud data centers. IEEE Sixth Int. Conf. Cloud Comput. 2013, 557–564. [Google Scholar] [CrossRef]
- Beshley, M.; Pryslupskyi, A.; Panchenko, O.; Beshley, H. SDN/cloud solutions for intent-based networking. In Proceedings of the 2019 3rd International Conference on Advanced Information and Communications Technologies (AICT), Lviv, Ukraine, 2–6 July 2019; pp. 22–25. [Google Scholar] [CrossRef]
- Thazin, N.; Khine, M.N.; Yutaka, I. Resource allocation scheme for SDN-based cloud data center network. In Proceedings of the Seventeenth International Conference on Computer Applications (ICCA 2019), Yangon, Myanmar, 27 February–1 March 2019. [Google Scholar]
- Wang, X.; Li, H.; Dong, Y.; Liu, Q.; Shi, X. A multi-service differentiation traffic management strategy in SDN cloud data center. Comput. Netw. 2020, 171, 107–143. [Google Scholar] [CrossRef]
- Guck, J.W.; Bemten, A.V.; Reisslein, M.; Kellerer, W. Unicast QoS routing algorithms for SDN: A comprehensive survey and performance evaluation. IEEE Commun. Surv. Tutor. 2017, 20, 388–415. [Google Scholar] [CrossRef]
- Zhang, H.; Yan, J. Performance of SDN routing in comparison with legacy routing protocols. In Proceedings of the 2015 International Conference on Cyber-Enabled Distributed Computing and Knowledge Discovery, Xi’an, China, 17–19 September 2015; pp. 491–494. [Google Scholar] [CrossRef]
- Abdallah, S.; Kayssi, A.; Elhajj, I.H. Performance analysis of SDN vs OSPF in diverse network environments. Concurr. Comput. Pract. Exp. 2019, e5410. [Google Scholar] [CrossRef]
- Rego, A.; Sendra, S.; Jimenez, J.M.; Lloret, J. Dynamic metric OSPF-based routing protocol for Software Defined Networks. Clust. Comput. 2019, 22, 705–720. [Google Scholar] [CrossRef]
- Egea, S.; Rego, A.; Carro, B.; Sanchez-Esguevillas, A.; Lloret, J. Intelligent IoT traffic classification using novel search strategy for fast based-correlation feature selection in industrial environments. IEEE Internet Things 2018, 5, 1616–1624. [Google Scholar] [CrossRef]
- Kasabai, P.; Djemame, K.; Puangpronpitag, S. Priority-based scheduling policy for OpenFlow control plane. KSII Trans. Internet Inf. Syst. 2019, 13, 733–750. [Google Scholar]
- Gong, W.; Pang, L.; Wang, J.; Xia, M. PSO-based resource allocation in software-defined heterogeneous cellular networks. KSII Trans. Internet Inf. Syst. 2019, 13, 2243–2257. [Google Scholar]
- OSTINATO. Available online: https://ostinato.org/ (accessed on 20 April 2020).
Figure 1.
Example of difference in traffic pattern of flow based on service.

Figure 2.
An example of cloud network topology and the amount of data transferred by the service flow: (a) Cloud network topology with two paths; (b) the amount of data transmitted by each service per unit time.
Figure 2.
An example of cloud network topology and the amount of data transferred by the service flow: (a) Cloud network topology with two paths; (b) the amount of data transmitted by each service per unit time.

Figure 3.
Proposed system architecture for network resource management.

Figure 4.
Network path allocation procedure using the ranking table in the application.

Figure 5.
Network topology for the experiments.

Figure 6.
Workloads for the experiments: (a) Workload-A; (b) Workload-B; (c) Workload-C; (d) Workload-D; (e) Workload-E; (f) Workload-F.
Figure 6.
Workloads for the experiments: (a) Workload-A; (b) Workload-B; (c) Workload-C; (d) Workload-D; (e) Workload-E; (f) Workload-F.

Figure 7.
Experimental results for Workload-A: (a) Open Shortest Path First (OSPF) algorithm; (b) proposed algorithm.
Figure 7.
Experimental results for Workload-A: (a) Open Shortest Path First (OSPF) algorithm; (b) proposed algorithm.

Figure 8.
Experimental results for Workload-B: (a) OSPF algorithm; (b) proposed algorithm.

Figure 9.
Experimental results for Workload-C: (a) OSPF algorithm; (b) proposed algorithm.

Figure 10.
Experimental results for Workload-D: (a) OSPF algorithm; (b) proposed algorithm.

Figure 11.
Experimental results for Workload-E: (a) OSPF algorithm; (b) proposed algorithm.

Figure 12.
Experimental results for Workload-F: (a) OSPF algorithm; (b) proposed algorithm.

Figure 13.
Total network utilization results.


Table 1.
The system configuration for the experiments.
| Parameters | Values |
|---|---|
| SDN controller | ONOS 1.3 |
| Simulator | Mininet 2.2 |
| OS | Linux Ubuntu 14.0 |
| Language | JAVA |
| Packet generator | Ostinato 0.5.1 |
Table 2.
The data configuration for the experiments.
| Service Type | Content Type | Traffic Pattern |
|---|---|---|
| Multimedia service | Video downloading | 300 MB–1 GB |
| Video streaming | 240 KB, 360 KB, 720 KB, 1 MB, 2 MB | |
| Video encoding | 5 GB–15 GB | |
| Web service | Web page loading | 1 MB–15 MB |
| Image loading | 1 MB–10 MB | |
| Metadata loading | 0.1 MB–1 MB |
© 2020 by the authors. Licensee MDPI, Basel, Switzerland. This article is an open access article distributed under the terms and conditions of the Creative Commons Attribution (CC BY) license (http://creativecommons.org/licenses/by/4.0/).
Share and Cite
MDPI and ACS Style
Jeon, M.; Kim, N.; Jang, Y.; Lee, B.-D. An Efficient Network Resource Management in SDN for Cloud Services. Symmetry 2020, 12, 1556. https://doi.org/10.3390/sym12091556
AMA Style
Jeon M, Kim N, Jang Y, Lee B-D. An Efficient Network Resource Management in SDN for Cloud Services. Symmetry. 2020; 12(9):1556. https://doi.org/10.3390/sym12091556
Chicago/Turabian StyleJeon, Myunghoon, Namgi Kim, Yehoon Jang, and Byoung-Dai Lee. 2020. "An Efficient Network Resource Management in SDN for Cloud Services" Symmetry 12, no. 9: 1556. https://doi.org/10.3390/sym12091556
Note that from the first issue of 2016, this journal uses article numbers instead of page numbers. See further details here.