Review

Research on the Microclimate of Protected Agriculture Structures Using Numerical Simulation Tools: A Technical and Bibliometric Analysis as a Contribution to the Sustainability of Under-Cover Cropping in Tropical and Subtropical Countries

by
Gloria Alexandra Ortiz Rocha
1,
Maria Angelica Pichimata
2 and
Edwin Villagran
1,*
1
Corporación Colombiana de Investigación Agropecuaria—Agrosavia, Centro de Investigación Tibaitata, Km 14, vía Mosquera-Bogotá, Mosquera 250040, Colombia
2
Corporación Colombiana de Investigación Agropecuaria—Agrosavia, Sede Central, Km 14, vía Mosquera-Bogotá, Mosquera 250040, Colombia
*
Author to whom correspondence should be addressed.
Sustainability 2021, 13(18), 10433; https://doi.org/10.3390/su131810433
Submission received: 7 August 2021 / Revised: 5 September 2021 / Accepted: 14 September 2021 / Published: 18 September 2021
(This article belongs to the Special Issue Urban Greenhouse and Sustainable Design)

Abstract

:
The use of protected agriculture structures in tropical and subtropical countries is the main alternative for intensification of agricultural production selected by producers. In general, in these regions, passive and plastic-covered structures predominate, with natural ventilation as the only method of climate control. This phenomenon has been widely studied in different types of structures using computational fluid dynamics (CFD) simulation. Therefore, this review aimed to collect and analyze the publications generated in this field of knowledge between 2010 and 2020. The search for information included the main academic databases available on the web and the analysis was carried out using bibliometric techniques, from which it was possible to identify details inherent to the scientific production, such as countries of origin, main authors, journals, and citations. Likewise, a detailed breakdown of the relevant technical information of the three phases of numerical simulation, such as preprocessing, processing, and postprocessing, was carried out. A compilation of 118 papers published in 65 journals, written by 256 authors, originating from 24 countries was achieved, where it was evident that Mexico and Colombia were the countries with the highest scientific production in the last decade. These papers analyzed, together, a total of 17 different types of structures where polyethylene-covered greenhouses predominated, with steady state simulations, for daytime climate conditions and without the presence of crops. Within the current and future research trends, the predominance of studies analyzing passive climate control methods, new models of insect-proof mesh-house structures, and, finally, studies focused on the structural analysis of greenhouses was found.

1. Introduction

Population growth projections show that by the year 2050, there could be approximately 9.1 billion people on planet Earth [1,2]. This, together with the high vulnerability of agriculture due to accelerated climate change, has become a serious threat to the food security of nations, generating new challenges to agricultural productivity [3]. Therefore, there is an explicit need to increase food production by approximately 70% in the coming years, and it is also necessary to develop production intensification strategies to provide technical solutions [4]. The increase in food production must also be carried out with less natural resources, such as water and soil, which is why agriculture under cover or in greenhouses has been proposed as one of the main production alternatives [5].
Worldwide, this production alternative in the agricultural industry has been the strategy used in recent years to improve yields in food production [6]. This has been achieved through the intensification and industrialization of processes and crop management techniques, as a continuous response to the reduced availability of resources necessary for food production [7]. The above has allowed a constant evolution of this production technique, making agriculture under cover a key tool for the achievement of sustainable development objectives [8].
Agricultural production under covered structures is considered a form of agricultural production where the microclimate factors affecting plant growth and development are totally or partially controlled [9]. Therefore, with respect to open field agricultural production, some benefits can be obtained, such as: (i) allowing agricultural production in regions where climatic conditions are adverse for the crops of interest, (ii) increasing production per unit area, (iii) optimizing water resource management and crop fertilization, and (iv) improving the commercial quality of the final product [10,11]. However, it should be noted that in order to achieve these benefits, it is necessary to have adequate microclimate management inside the different types of protected agriculture structures used in the countries where this type of technology has been implemented [12].
As for the typology of protected agriculture structures, they can be classified into active structures, where high-tech greenhouses predominate, which are equipped with the necessary mechanisms and controllers to manage the behavior of temperature, humidity, radiation, and CO2 levels inside the greenhouse [7]. On the contrary, passive structures are those that are very characteristic in regions with mild climates and where microclimate management is limited to natural ventilation and shading techniques or roof whitening. [11].
Microclimate refers to the interaction of climatic parameters generated around plants, including heat transfer by radiation, conduction, and convection, as well as the mass balance of water vapor and CO2 [13]. One of the alternatives for microclimate management in passive greenhouses is natural ventilation, a passive method that is considered low cost with low environmental impact [14]. Natural ventilation is the most important phenomenon to be controlled inside a protected agricultural structure, since it facilitates the exchange of mass and energy between the crop plants, the surrounding air inside the structure, and the external environment [15]. Therefore, in a structure that relies on natural ventilation as a method of climate control, it is necessary to ensure an adequate and uniform movement of air flow, which will guarantee that the microclimatic variables will remain within optimal levels for plant growth and development [16].
Natural ventilation depends on two driving forces: forced convection or dynamic ventilation and free convection or thermal ventilation. The forced convection component is dependent on the outside wind speed and the ventilation configuration of the greenhouse. The free convection component is generated from the buoyancy effect; this occurs due to the thermal gradient that is presented in the air inside and outside the greenhouse or protected agriculture structure. This, in turn, generates density and pressure differentials, which produce a vertical movement or chimney effect of the air inside the structure [17,18].
This air movement allows regulating temperature and humidity conditions, avoiding phenomena such as condensation inside the greenhouse or protected agricultural structure. Likewise, the flow of air from the outside environment is the only source of carbon enrichment in passive structures, therefore, this is a factor that positively or negatively affects the photosynthetic processes of plants [19,20]. Additionally, it has been reported that natural ventilation can improve pollination and, therefore, fruiting of some horticultural products such as tomatoes [21].
The efficiency of natural ventilation will depend on the specific and external factors of each type of protected agricultural structure. These include the size and height of the greenhouse, the shape and size of the ventilation areas of the structure, the direction and speed of the outside wind, the presence of neighboring structures or greenhouses, the use of anti-insect screens in the ventilation areas, and the type of crop and its phenological stage [22,23]. Considering these different factors that influence natural ventilation, it has been concluded that it is a physical phenomenon that is not easily understood. For this reason, understanding it through the use of different mathematical models and measurement techniques offers a starting point for decision making in the design and management of protected agricultural structures [20,24].
According to the literature, it has been reported that in the middle of the 20th century, on the eve of the Green Revolution, the first studies on air circulation in greenhouse structures were developed [25]. Four decades later, some researchers have proposed the use of Bernoulli’s equation as a calculation method to estimate the amount of air that can circulate through a ventilation area, thus generating the basic theory of natural ventilation in greenhouses [26,27,28]. Similar methodologies were also proposed for other types of structures such, as screenhouses [16]. Currently, there are already calculation techniques that help to understand the behavior of natural ventilation, among these are: (i) mass balance with a tracer gas, (ii) indirect energy and mass balance methods, (iii) direct measurements of velocities and pressures at windows, (iv) visual methods on scale models, and (v) wind tunnel studies [17,29].
However, it should be mentioned that some of these quantification methods require the development of experimental tests, in some cases complicated and expensive to carry out. Additionally, they only allow users to obtain a numerical value of the ventilation rate, but do not allow visualization and understanding of the movements of the air flows [20,30]. For some of these reasons, and taking into account the progress of engineering tools, in recent years, the use of computational fluid dynamics (CFD) has been proposed as an agile and accurate alternative for the study of natural ventilation in protected agricultural structures [31,32].
CFD simulation is a robust and mature methodology based on the nonlinear equations of conservation of mass, quantity of motion, and energy in the flow of a fluid; the calculation and solution of these equations is performed by numerical discretization and computational simulation [33]. This simulation methodology is composed of three phases: preprocessing, processing, and postprocessing. In the preprocessing phase, the geometry of the structure to be evaluated is constructed and the computational domain external to the structure is defined. The boundary conditions of the computational domain are also defined and finally the volume of the computational domain and the structure is spatially discretized in a numerical grid [17].
In the processing phase, the criteria and initial conditions of the simulation are selected, as well as the models that allow representing the microclimatic behavior inside the structure, such as the solar radiation model, turbulence model, buoyancy model, and porous media models. Finally, there is the postprocessing phase, where qualitative and quantitative analyses of the results obtained in the numerical simulations can be performed [23]. However, these simulations must be validated before implementation with experimental methodologies or with theoretical comparisons based on the execution of the numerical models or with comparisons of previously performed work [4,12,34].
Once the CFD model has been validated in this postprocessing phase, it is possible to describe the movement of the air flow inside any type of protected agricultural structure, it is also possible to optimize the size and position of the ventilation areas [35,36]. It is also possible to develop specific analyses or studies of any type of ventilation configuration of a structure and its effect on the spatial distribution of microclimate variables and even detect deficiencies in the design of ventilation systems used in tropical and subtropical regions [30,35,37,38,39]. Finally, it is also important to mention that once a structured and a validated CFD model is available for a given protected agricultural structure type, it is possible to make decisions on its management through numerical simulations, without the need to resort to experimental tests, thus reducing costs and optimizing processes [40].
The CFD methodology, implemented as a design tool with the objective to improve the efficiency of natural ventilation in greenhouses or protected agricultural structures, has achieved a great recognition worldwide. This is reflected in the number of studies that have been developed related to this topic [17,41,42,43]. Within these studies, we have also found research where the objective was the study of anti-insect screen establishment in the ventilation areas of passive greenhouses and their effect on natural ventilation [44,45,46,47]. There have also been more recent studies evaluating the microclimate and its variation due to the presence of different types of crops and at different phenological stages or the effect on the microclimate due to the implementation of active climate control equipment, such as heating, cooling, and CO2 injection systems [48,49,50,51,52].
Another research approach aimed to take advantage of the high capacity of CFD to analyze unconstructed scenarios, thus offering advantages in analyzing the spatial variability of the microclimate and energy efficiency in all types of protected agriculture structures, allowing users to obtain realistic and accurate results that facilitate the optimization of the technological systems involved in agricultural production under cover [53,54,55,56]. Finally, the results obtained through CFD are being used for farmers’ education, through the combination of numerical results and technological developments that allow virtual reality representations. It has been possible to establish technological showcases where farmers can observe the relationship between air flows in a greenhouse and the generation of the microclimate [57,58].
The economic and social context of many countries located in the tropical and subtropical regions does not allow the implementation of high-tech greenhouses. Therefore, in these regions, there is still an opportunity to increase the level of technological optimization of the roof structures used and, currently, the use of CFD in these countries is a valuable tool in the search for these technological solutions [59]. In recent years, in these countries located in the tropical and subtropical region, a significant number of studies on the greenhouse microclimate have been developed, but to date there has been no analysis of the impact and relationship between these investigations. One way to know these factors is through bibliometric studies, which have become research tools recently used in many areas of science and technology [60]. Bibliometrics allow us to quantitatively relate the research works developed in a specific area, to learn some of the particularities and impact of each work, to identify research networks, and even to conclude on the research trends in the analyzed area of knowledge [61].
For the above reasons, the main objective of this work was to develop a bibliometric and technical analysis through the compilation of scientific information reported in the main databases of studies related to the use of CFD applied to the analysis of natural ventilation in passive protected agricultural structures in tropical and subtropical geographic regions.

2. Materials and Methods

Literature review is a relevant tool when talking about knowledge management and mainly in evaluating the scientific production of a specific area [62]. Therefore, to achieve the objective of this work, a methodology for the analysis of the information collected in the different databases explored was proposed, comprising two stages: (I) bibliometric analysis and (II) technical analysis. The two stages complement each other, resulting in a structured, systematic, and detailed analysis of the current information related to the topic of study.

2.1. Bibliometric Analysis

As a result of the computer revolution since 1950, information and communication technologies (ICTs) have developed considerably. Therefore, there are now computer techniques that allow the analysis of the scientific production generated in an area of knowledge [63,64]. They facilitate the analysis of information through mathematical tools that allow researchers to establish the existing relationships between the stakeholders of the knowledge networks [65,66]. One of these analysis techniques is part of scientometrics and is known as bibliometrics, which is a technique that provides, through a systematic analysis, understanding of the current state of the art of a field of knowledge in which a researcher or a research network is interested [67,68,69].
Bibliometrics has been implemented in recent years in many countries, which has made it possible to analyze the scientific production of authors, countries, journals, research centers, universities, and other divulgation agencies, using different qualitative and quantitative graphical tools that allow the visualization of data [61]. Through the use of bibliometrics, the search for scientific information of a particular topic is now more efficient and accurate, facilitating the distribution of knowledge and its exponential growth [63,68].
Considering all the above, an organized and structured search was proposed, to identify and analyze the relevant scientific literature, with the goal of identifying the advances and relevant findings developed from numerical simulation with CFD methodology in naturally ventilated greenhouses. This search for information was defined through the stages represented by the workflow in Figure 1.

2.1.1. Approach to the Objective of the Search

The objective of the search was to identify the existing scientific literature of the last decade (2010–2020), in different academic databases, establishing structured search patterns that allowed us to find various research on the topic covered in this document and subsequently make use of bibliometric indicators to understand the trends of this topic. In this way, we proceeded to the next stage where the search keywords were defined.

2.1.2. Keyword Definition

The keywords used in the search equation and subsequently inserted in scientific databases to search for related documents were defined considering three classifications: firstly the type of protected agricultural structure analyzed, within which there are two large groups—greenhouses and screenhouses; secondly, the type of climate control used, in this case studies focused on natural ventilation; and, finally, the method of analysis of natural ventilation with emphasis on the CFD numerical simulation methodology (Table 1).
To establish Equation (1) used for the search and collection of scientific documents of interest, we used various search operators combining the three categories mentioned in Table 1. The search was limited in time to papers published between 2010 and 2020 and, in spatial scale, to papers generated in studies conducted in countries located in the tropical and subtropical regions. Finally, special care was taken to exclude documents in which the subject of study was not related to the topic and objective of this research, which, due to their similarity in syntax, fall into the search field, for example, documents related to greenhouse gases.
((greenhouse OR nethouse OR mesh-house OR screenhouse) AND (cfd OR numerical OR simulation) AND (“natural ventilation”))

2.1.3. Identification of Pertinent Databases

Among the scientific databases, the following were used: Science Direct, Scielo, Mendeley, Taylor and Francis, Springer, Wiley Online Library, Web of Science, Google Scholar, and documents obtained from the social network, Researchgate. These were selected for their international recognition in the academic, professional, and scientific fields [70].

2.1.4. Understanding and Analysis of Results

For data analysis, we used the methodology described by Aria and Cuccurullo [71], who recommend the implementation of the open source software Biblioshiny, which is structured for its operation in the R-studio software. In addition, the bibliometric software VOSviewer was used. This software allows the exploration and visualization of bibliometric networks through the construction of two-dimensional graphs that are easy to interpret, where, among others, the co-authorship and co-citation networks, the related links between papers and authors, and, finally, the strength of the relationship between the links of these two bibliometric networks are determined [72].
However, considering the different sources of information originating from the identified literature, it was also necessary to use other software, such as Excel and Mendeley. This made it possible to generate a personalized analysis in which the following variables were considered: the main authors of the subject, the main countries of scientific production in the subject, and the annual production, among others. This generated database allowed the identification and categorization of the collected information and its visualization through conventional bibliometric graphs.

2.2. Technical Analysis

The purpose of the technical analysis was to analyze the particularities of each study with respect to each of the parameters listed in Table 2.
Additionally, to evaluate the impact of the journals in which the selected studies were published, information was identified through the SCImago Journal and Country Rank (SJR), reviewing the H-index value, which relates the number of citations based on the number of articles published, and the quartile position in Scimago Journal Rank (SJR) was also reviewed. These quartiles order the journals of each subject category from highest (Q1) to lowest (Q4) in terms of index or impact factor [65,73].

3. Results and Discussion

3.1. Bibliometric Component

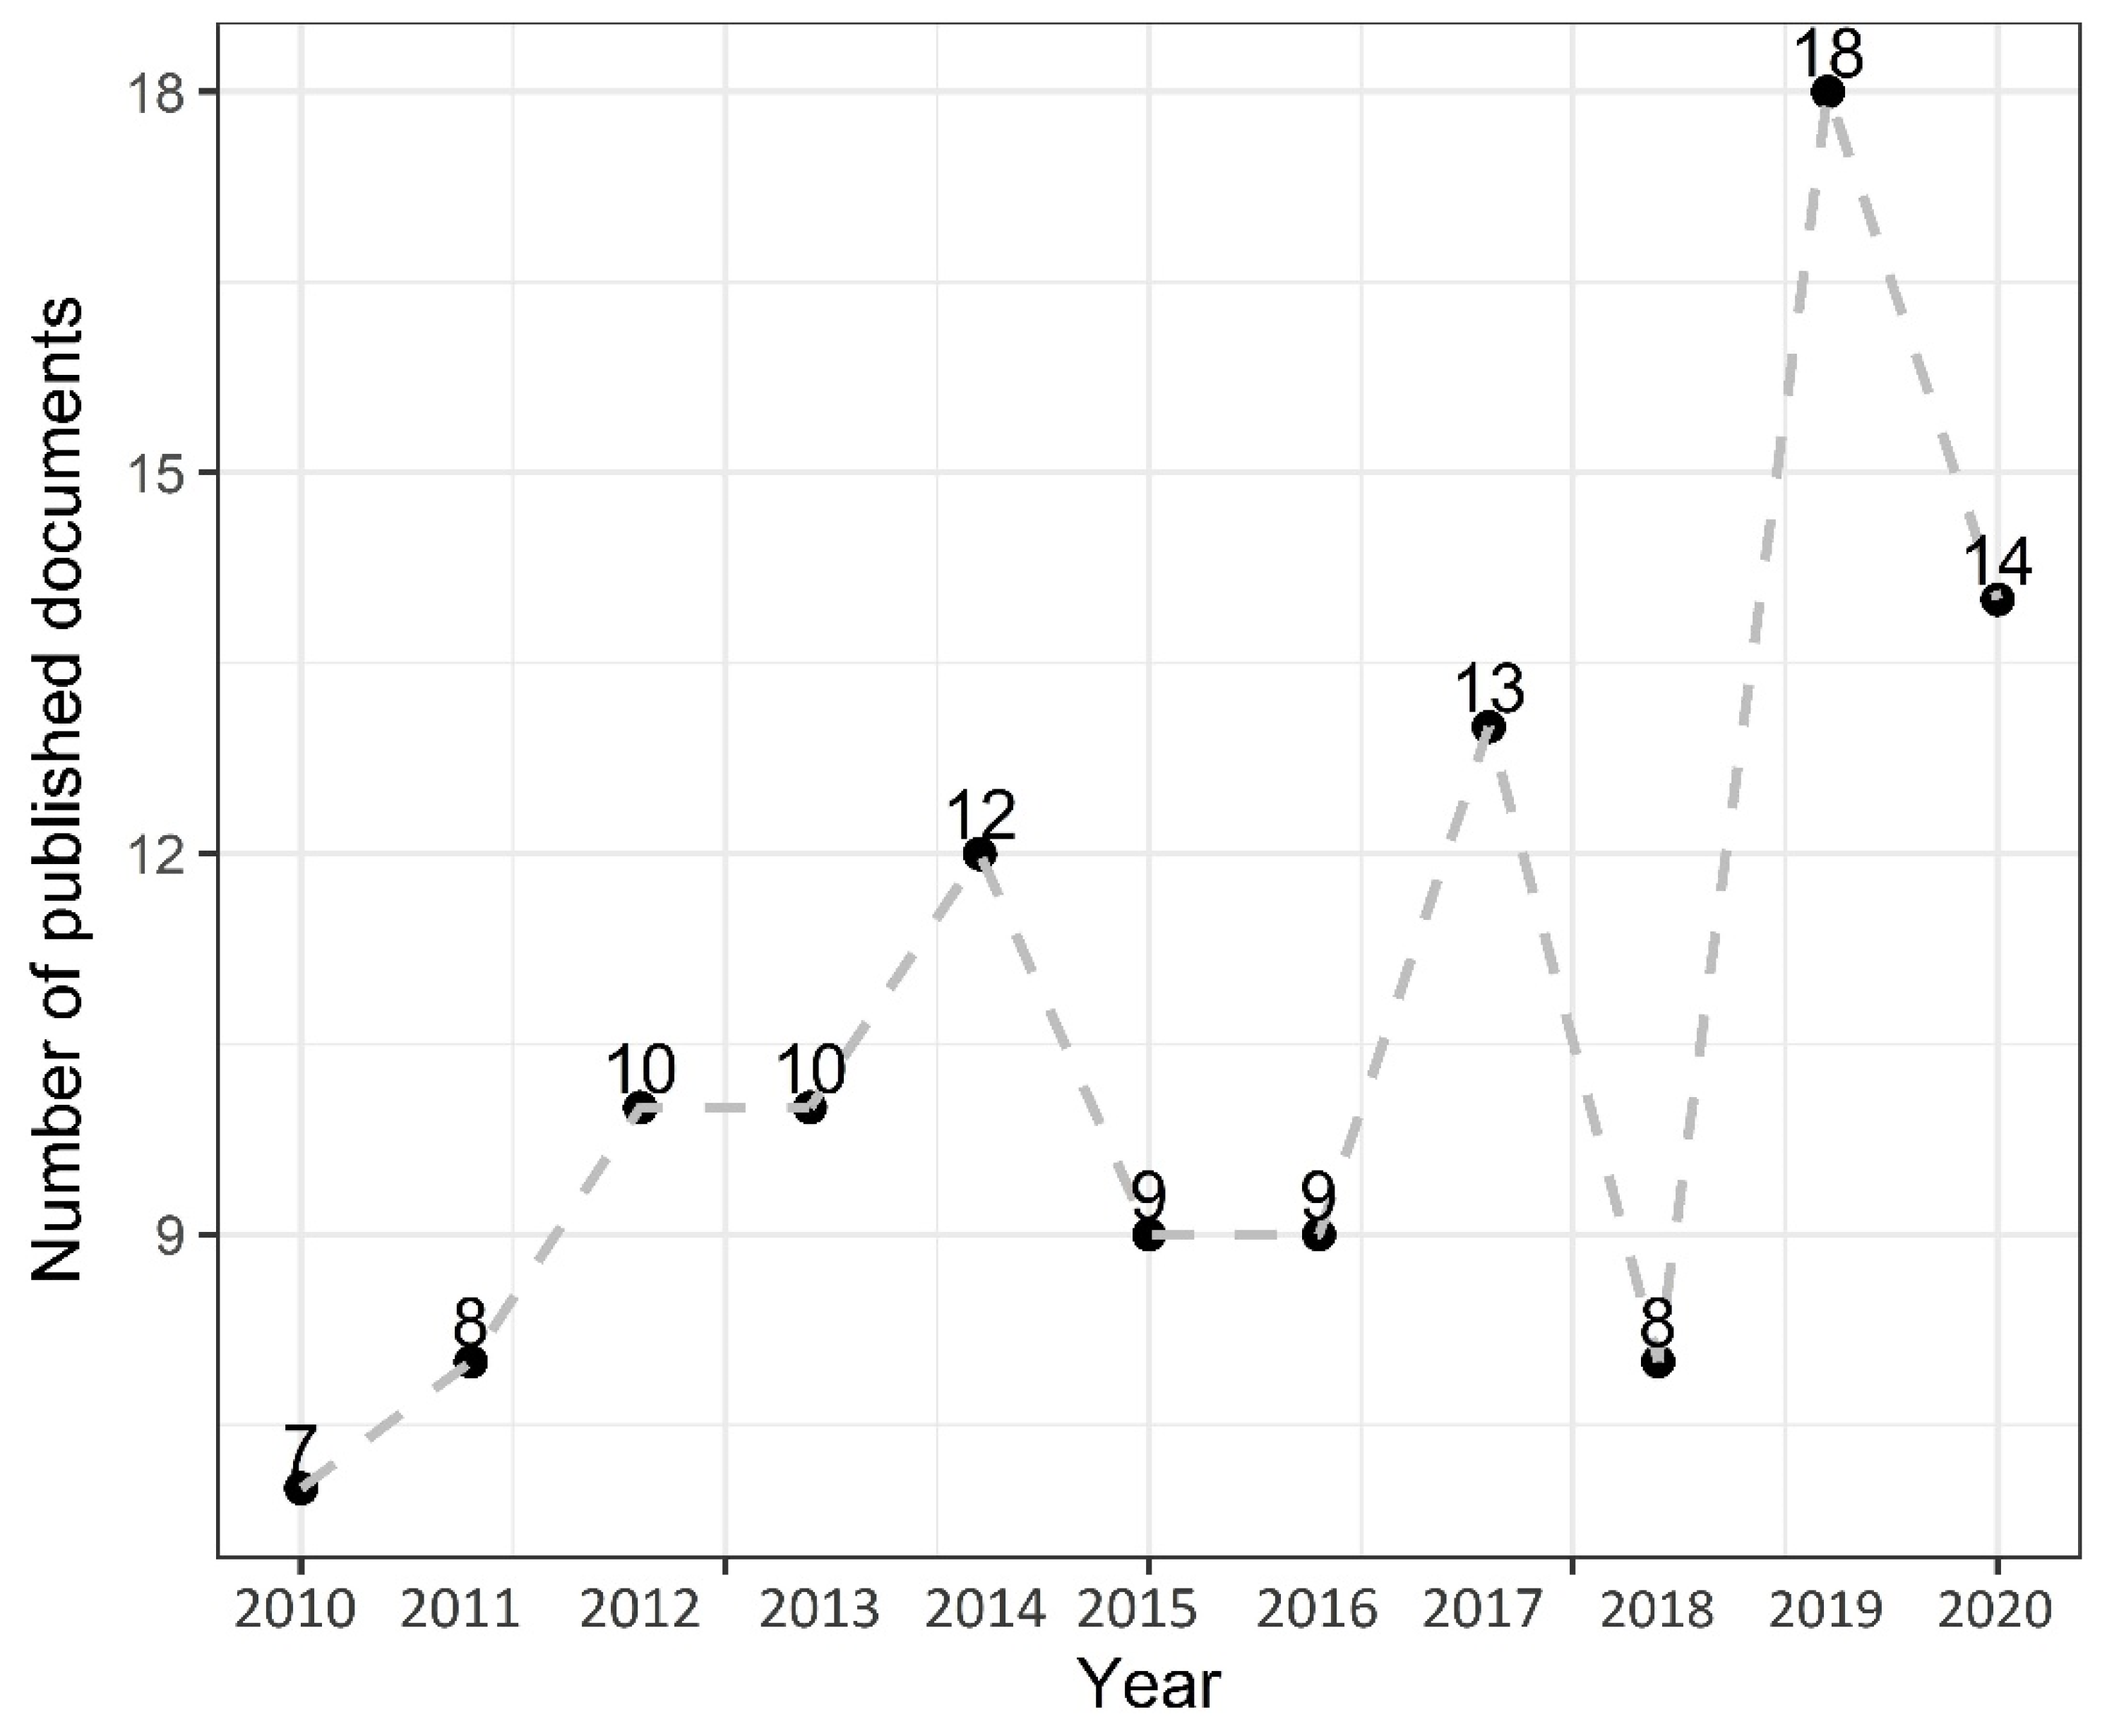
3.1.1. Analysis of Related Scientific Production

Figure 2 shows the behavior of articles published annually, between 2010 and 2020. The total number of articles for the period analyzed was 118 articles, which translated into an average value of 10.72 published articles per year. The years of least and most publications were 2010 and 2019 with 7 and 18 papers, respectively.
Figure 2 shows that, during the last decade, there has been a fluctuating behavior in the number of documents published each year, although for the years 2019 and 2020 the scientific productivity for the subject showed an increase with respect to the average value of the period of eight and four articles, respectively. This shows that in tropical and subtropical countries, there is still a continuous interest in applying the CFD methodology to the study of natural ventilation of protected agricultural structures.

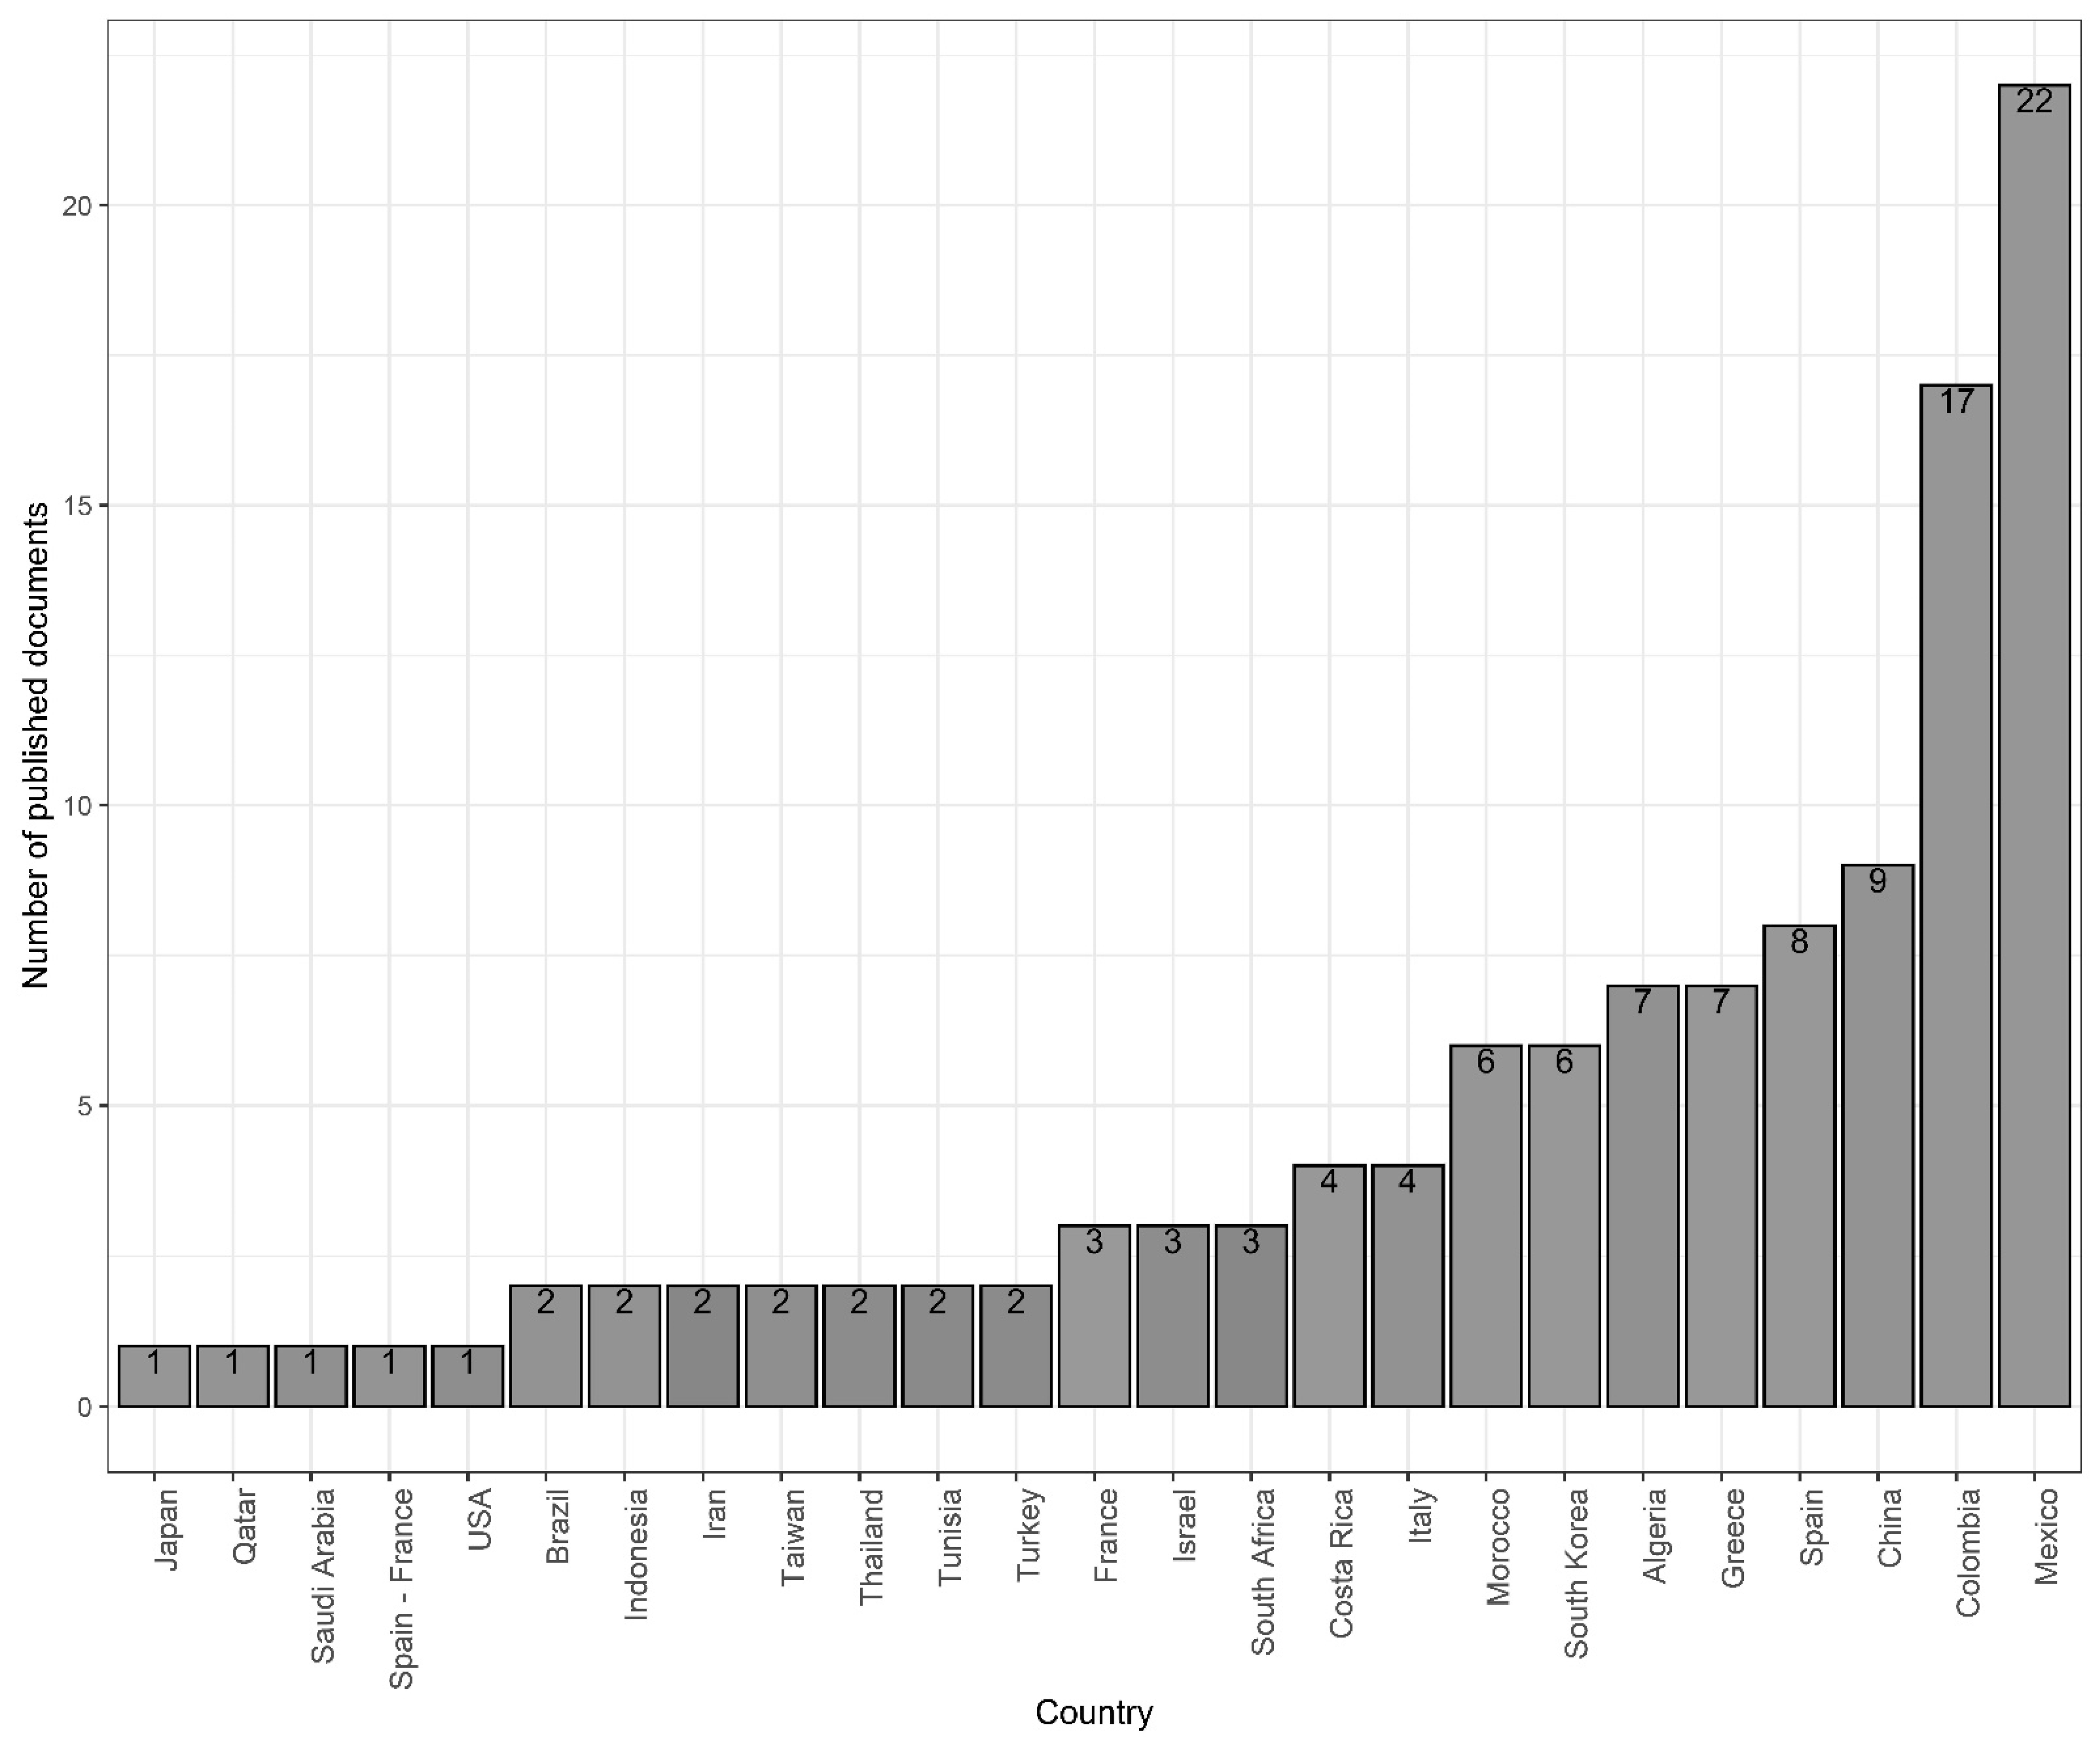
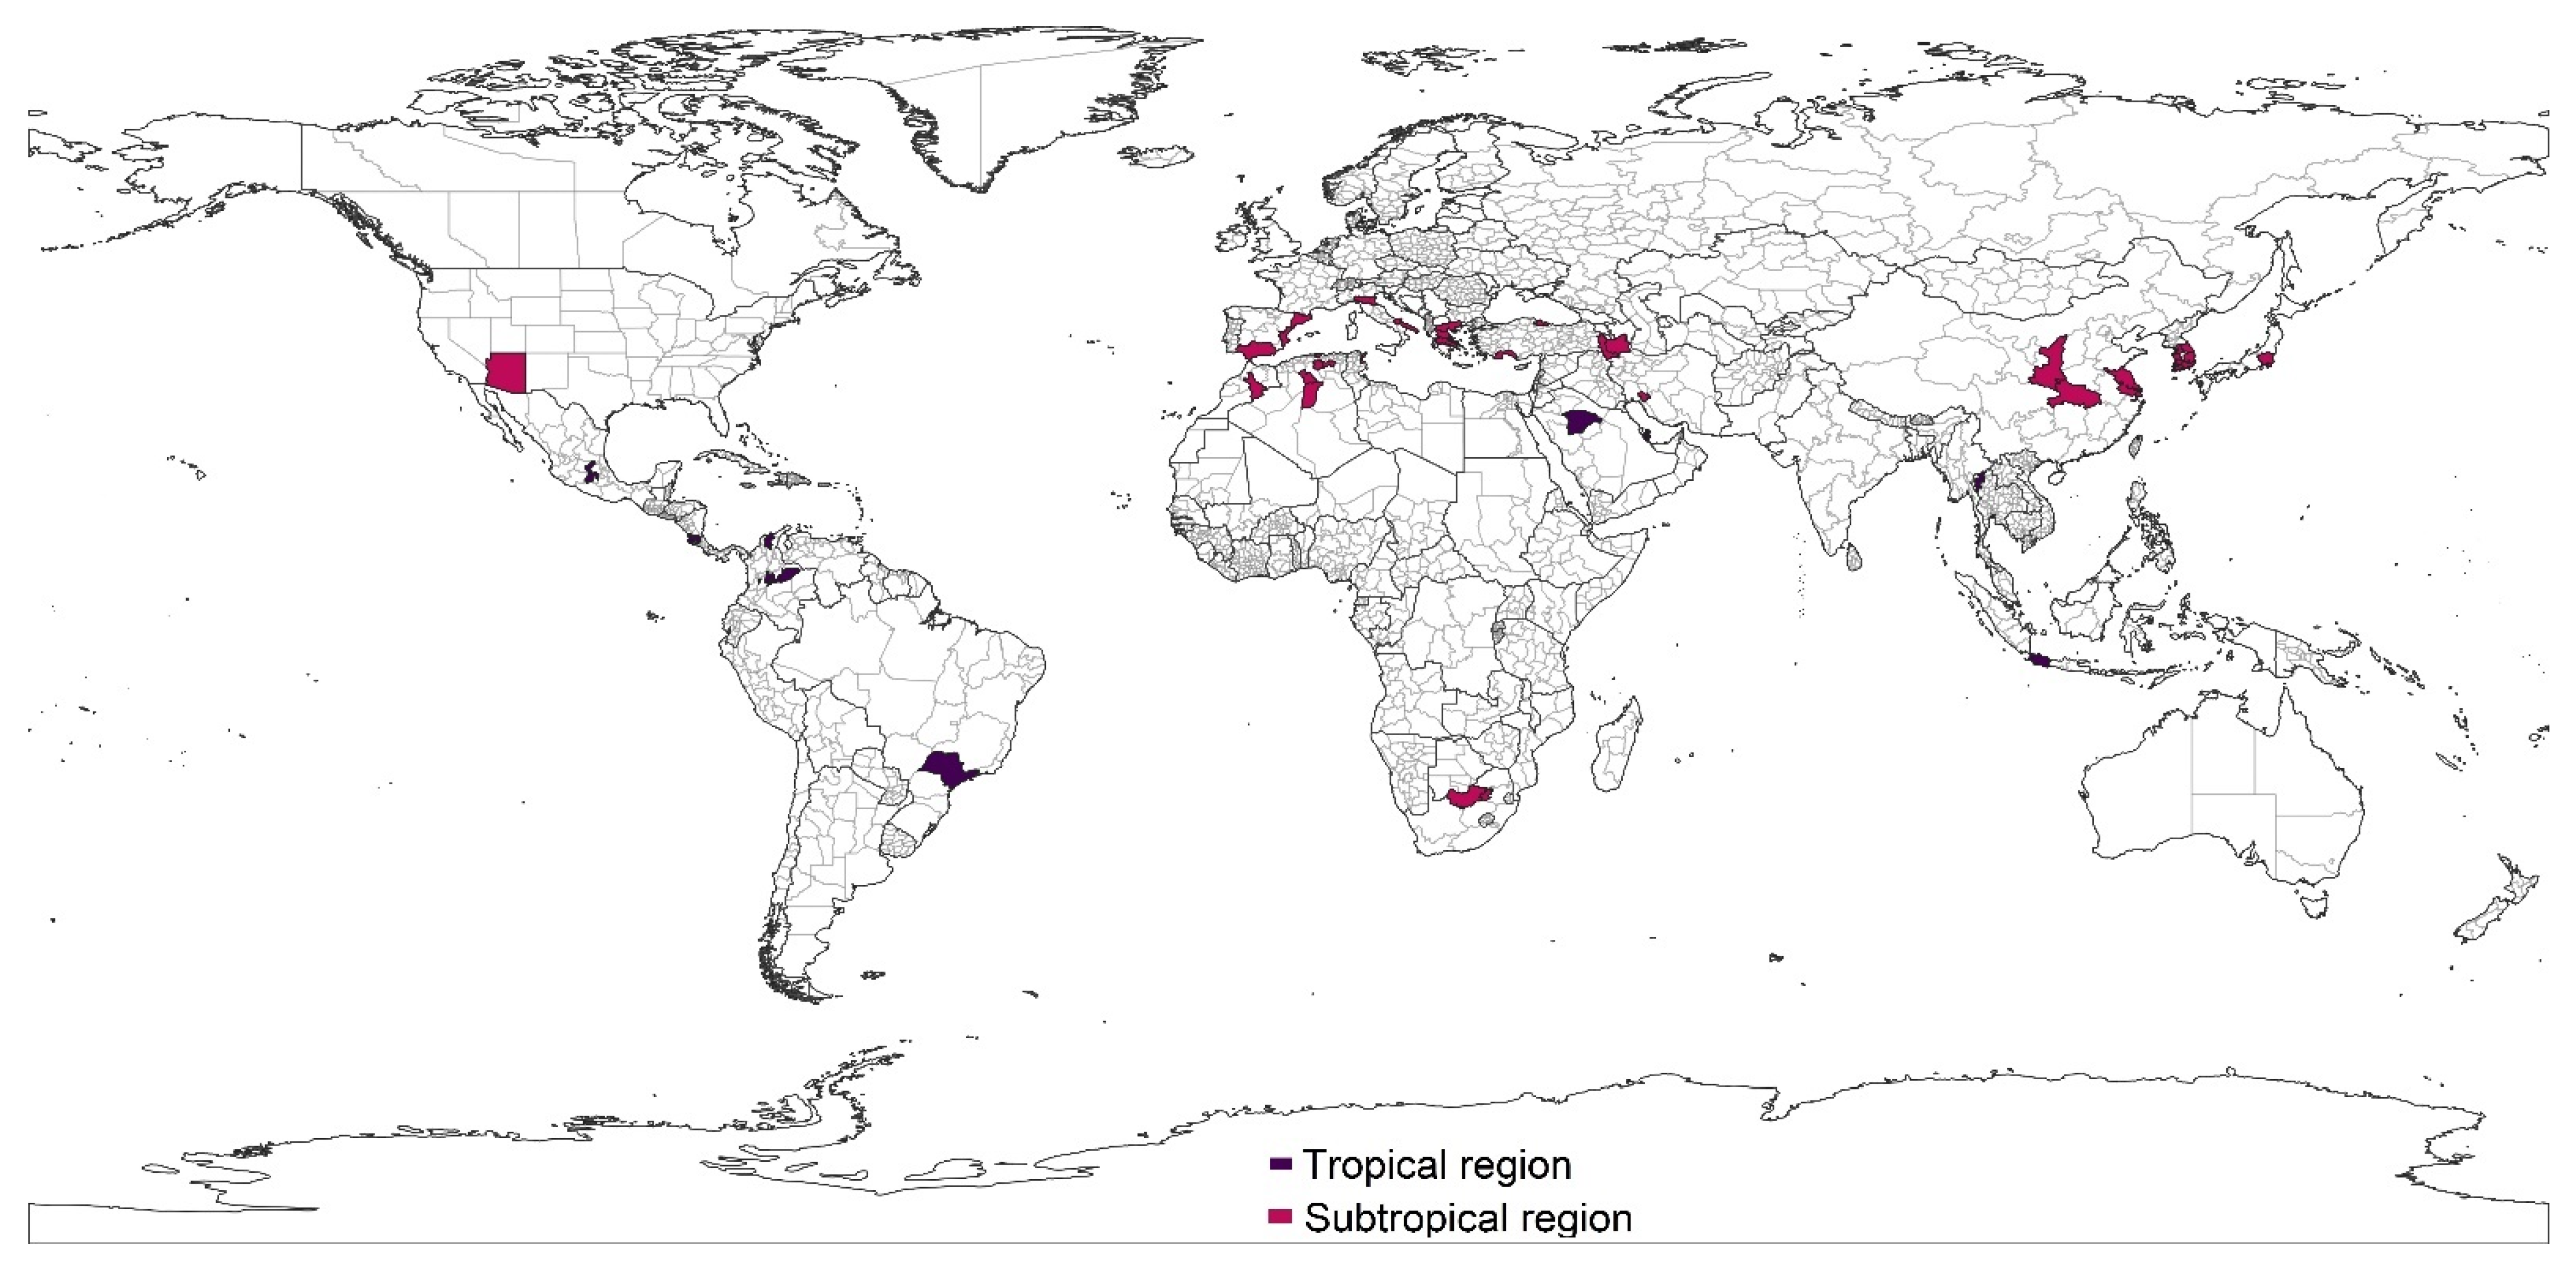
3.1.2. Scientific Production by Country

As for the scientific production by country, of the total of 118 articles collected, these were generated in a total of 24 countries, among which Mexico stands out with 19% of the publications, followed by Colombia with 14%, China with 8%, Spain with 7%, and Greece and Algeria with 6%, respectively. Therefore, the scientific production generated in these six countries is equivalent to 60% of the publications of the total number of countries in the regions analyzed (Figure 3).
In terms of spatial distribution, 65 of the publications collected in this research work came from countries in the subtropical region and 53 from countries in the tropical region. Figure 4 shows the countries of origin of the research works, highlighting the Mediterranean region, where passive greenhouses and screenhouse structures used for intensive horticulture predominate. Also, in some regions of China, where the Chinese solar greenhouse is predominant, in recent years the phenomenon of natural ventilation and microclimatic optimization by passive methods has been investigated [74].
In the Latin American and Caribbean region, the studies developed in the Colombian Andean region should be highlighted, where CFD has been widely used for the thermal and aerodynamic characterization of the main greenhouses used for the production of cut flowers and ornamental species [75]. It should be noted that in this region, there are approximately 8700 hectares dedicated mainly to crops such as roses, carnations, chrysanthemums, among others, all products that are marketed in countries such as Canada, Japan, and the United States [37].
A main characteristic of the greenhouse structures used in Colombia is that they are low cost with a low technological level, where microclimate conditions are usually not optimal for the growth and development of plants in some specific hours, both during the day and at night [76,77]. Therefore, in the last decade, research has been developed implementing the use of CFD, with the objective to design structures where natural ventilation is optimized and a better microclimate behavior is obtained [17,78,79]. The above has made it possible to obtain a couple of passive greenhouse structure designs adapted to the climatic conditions of the high Andean tropics, a region where 90% of the country’s production under cover is concentrated [29].
Although, it should be mentioned that in the future, it will be necessary to implement CFD to obtain designs of protected agriculture structures adapted to other agro-climatic conditions of the country. This is because the production sector of cannabis for medicinal use to be commercialized in international markets is currently emerging strongly in Colombia and other countries in the region. However, due to various economic, legal, and political factors, much research is still needed to define the most appropriate production infrastructure and other production factors to optimize processes and increase crop yields [80,81].
On the other hand, the varied climatic conditions according to the temperature ranges that generate changes in average ambient temperature and humidity present in Colombia and the diversity of established horticultural crops offers possibilities for research and development of low-cost and efficient technologies to promote agricultural production in passive greenhouses. Research should be oriented to the characterization of the microclimate behavior of different greenhouse designs, which will allow the generation of useful information to understand the development of crops under these types of structures. This information can be generated from the implementation of CFD simulations [82].
Another country in the American continent where a significant number of CFD studies applied to the greenhouse area have been carried out is Mexico, mainly in the center and north of the country. In these regions, there are usually low temperatures at night during certain times of the year, which affects crop growth due to the unheated greenhouses [83]. Therefore, some of these studies sought to determine the behavior of temperatures and airflows in the nighttime climate from different ventilation configurations [46,84]. Another recent interest has been to determine the climatic behavior of structures known as insect-proof mesh-houses, which are structures that have been used in recent years mainly because they are cheaper to build than the greenhouses used in the region [82].

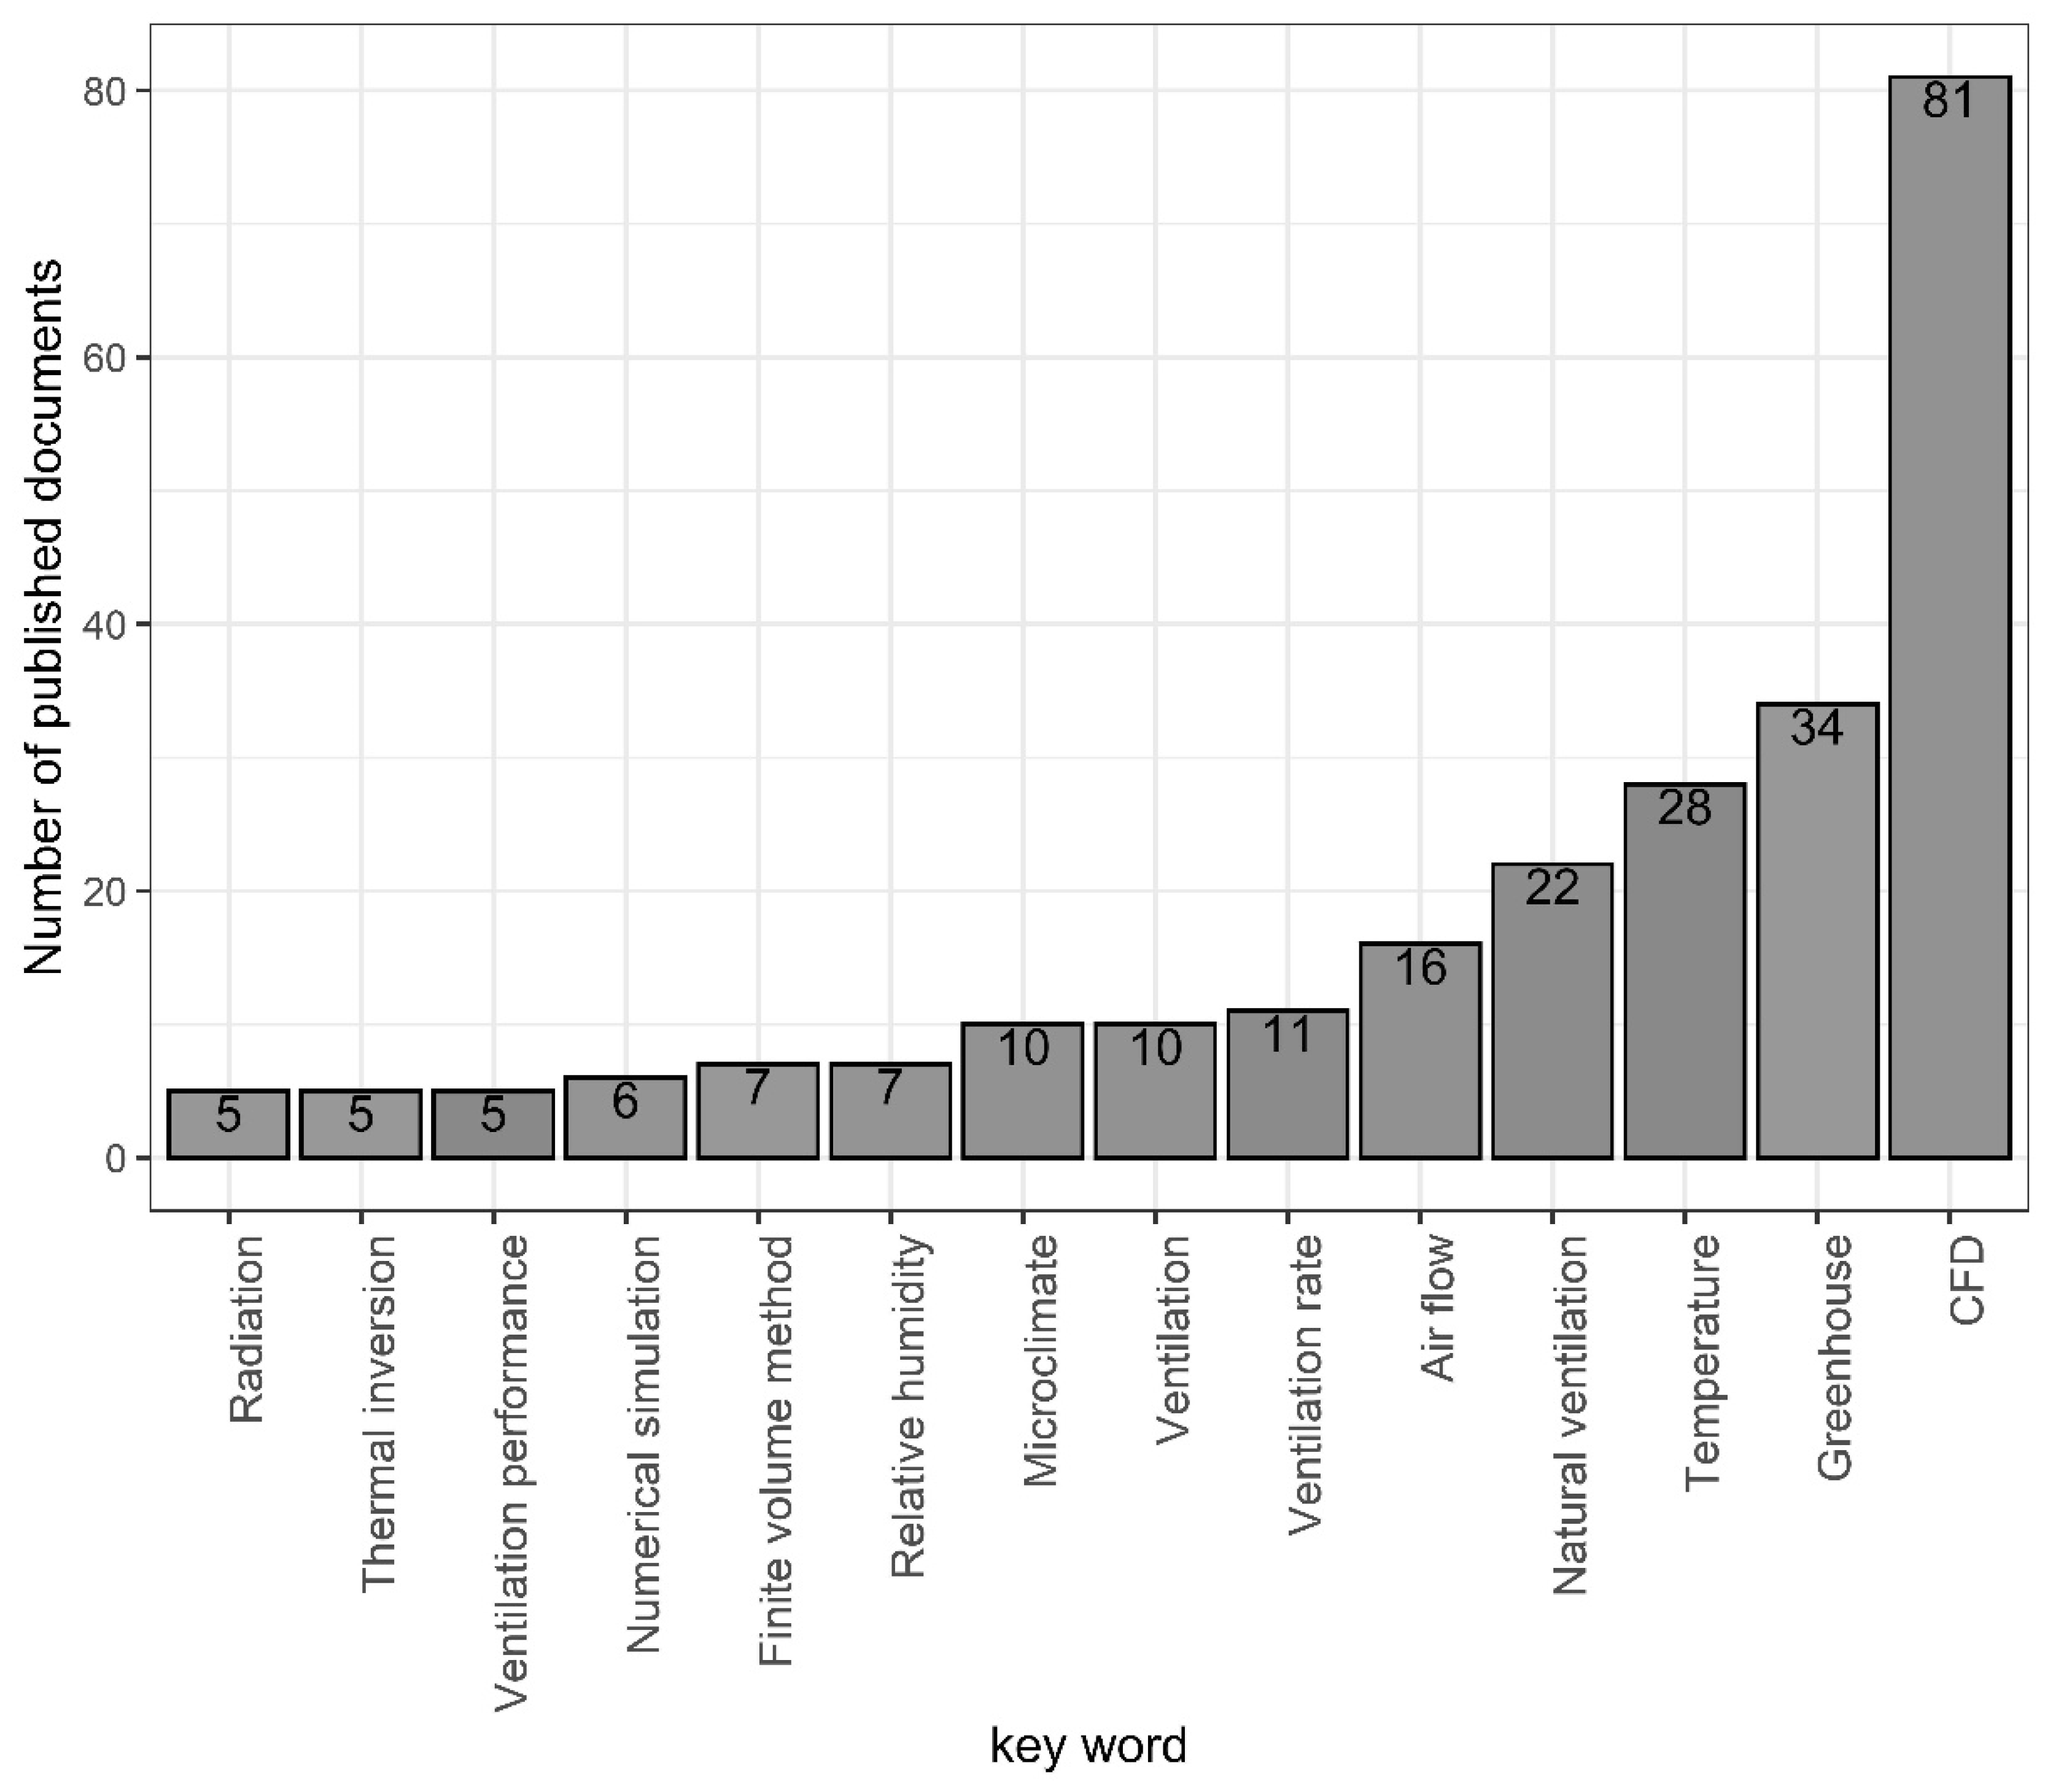
3.1.3. Keywords Used

A total of 223 keywords were identified in the 118 documents collected, 156 keywords were used only once, 37 keywords were used twice, and 8 keywords were used three and four times, respectively. Figure 5 shows the 14 most frequently used keywords. It was identified that the word CFD was used in a total of 81 documents. The next most used words were temperature and greenhouse, which were used in 34 and 28 of the documents, respectively.
The next keywords ranked in importance of use were those related to the phenomenon of natural ventilation, air flow pattern, and microclimate. These were aspects commonly studied in the papers collected due to their high influence on the growth and development of crops and the fact that they are factors that can positively or negatively affect some physiological processes of plants, such as transpiration and photosynthesis [75,85]. Moreover, it is important to mention that we have been able to identify keywords that describe some phenomena such as thermal inversion. This phenomenon is very characteristic of passive greenhouses that do not have heating systems and negatively affect crop yields. Given that the temperature inside the structure at night is lower than that of the outside environment, this promotes condensation or free water on the plants foliage [79].

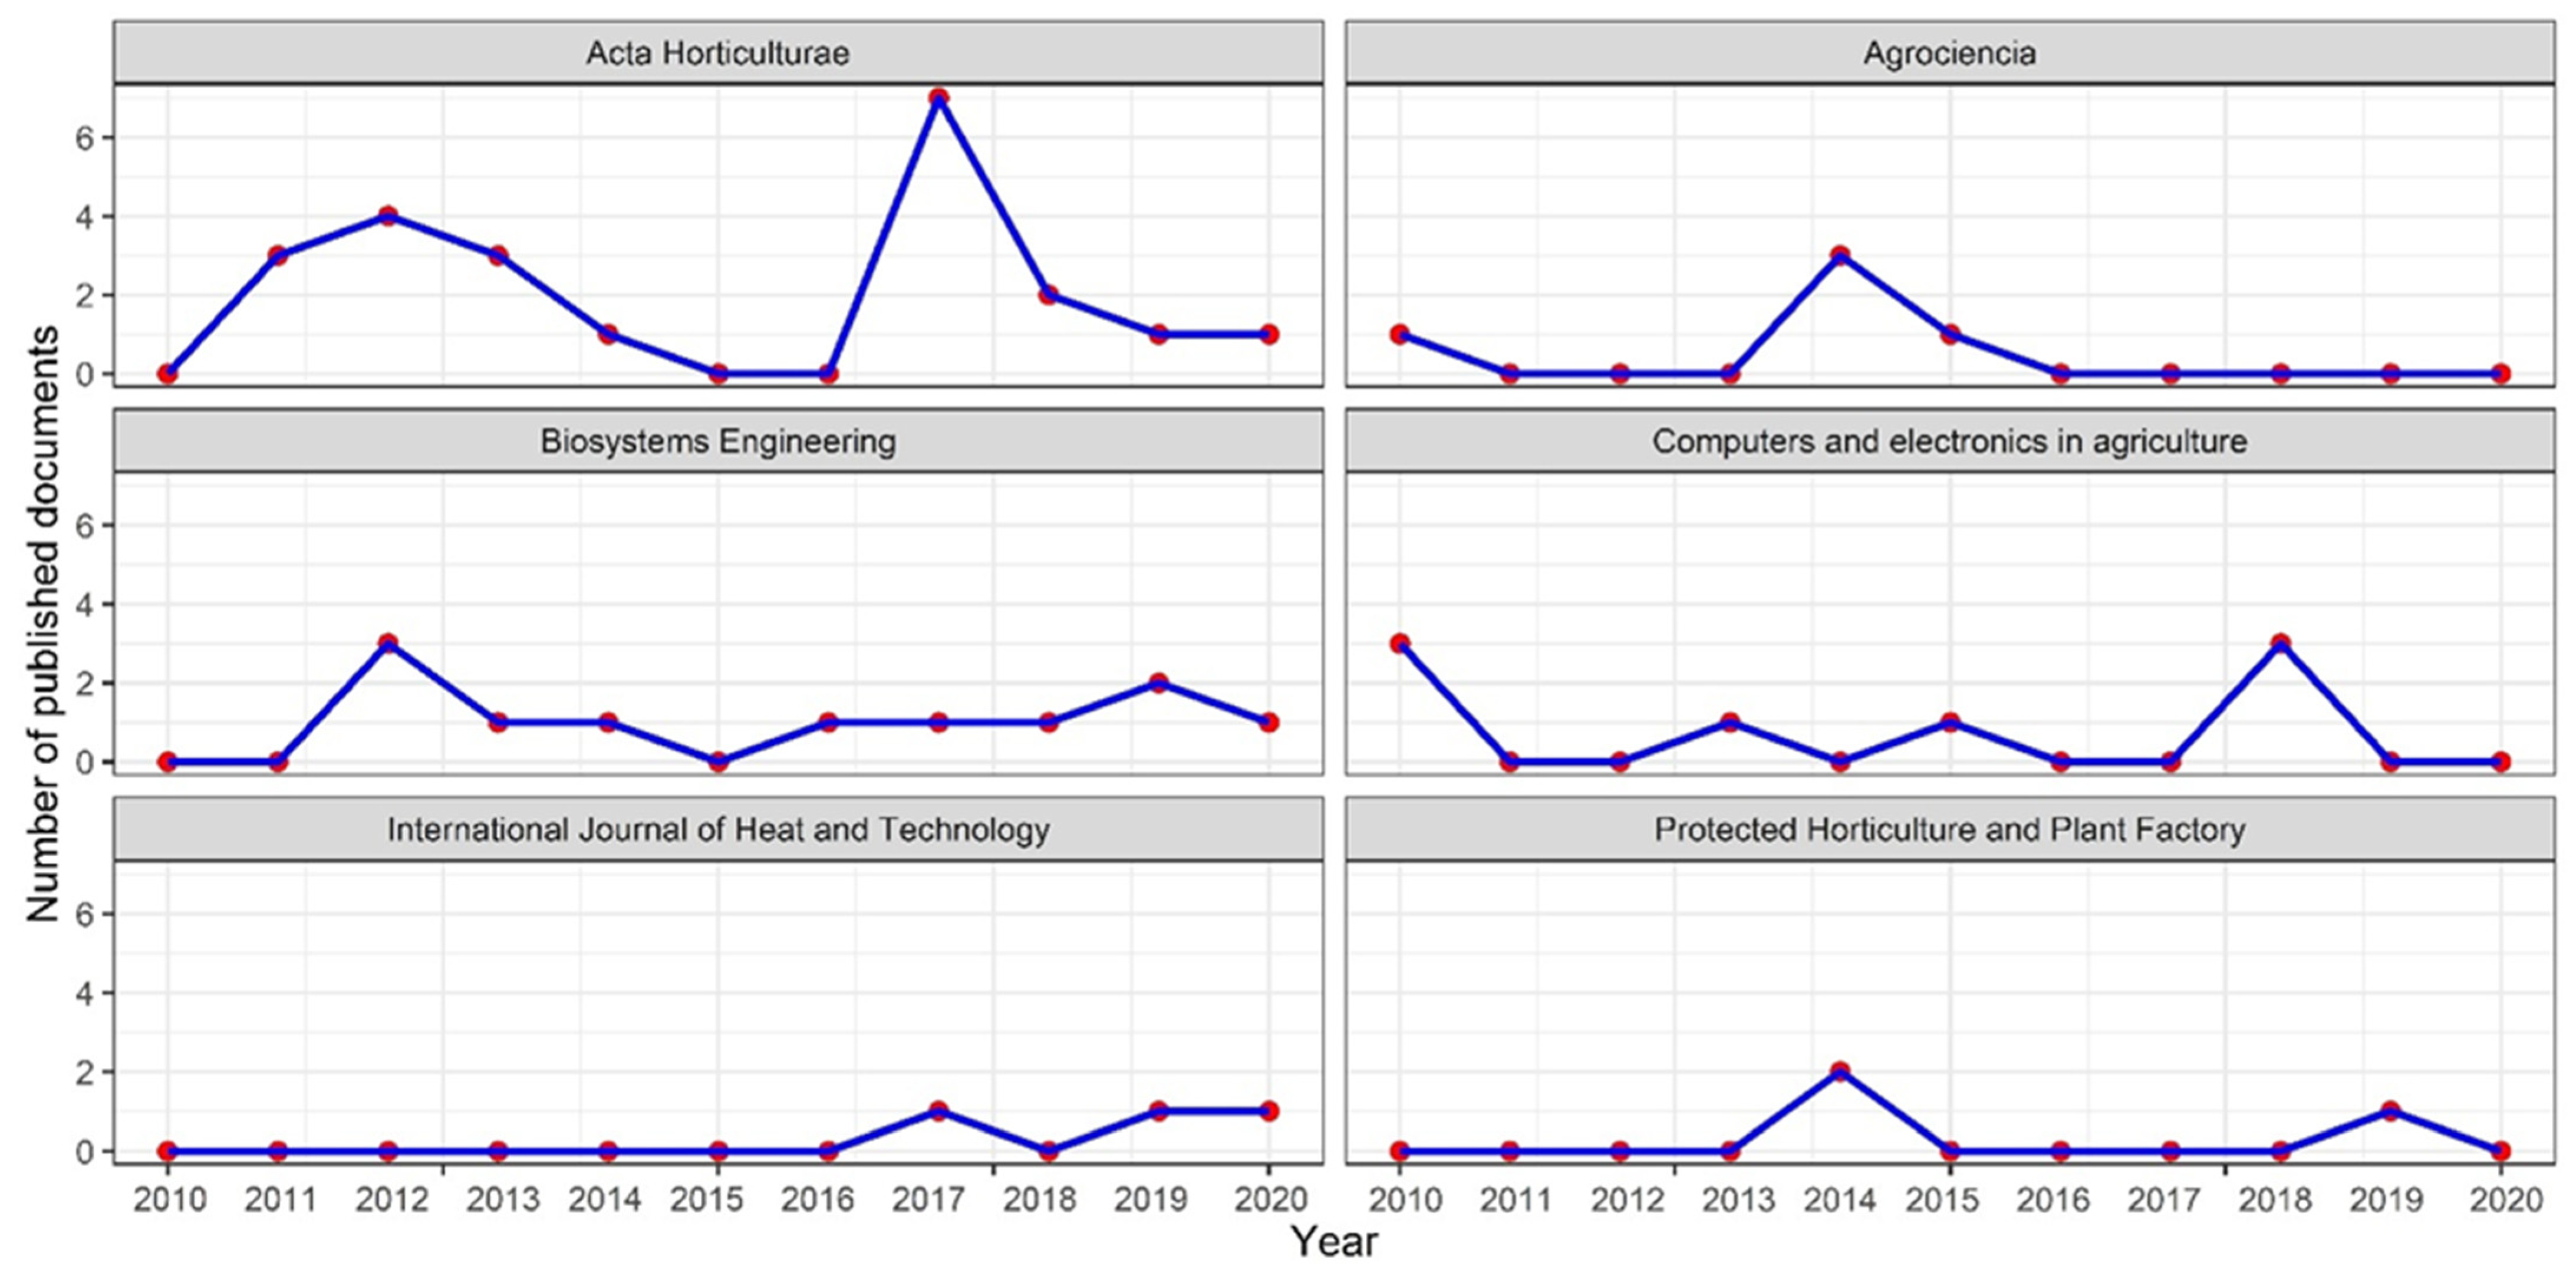
3.1.4. Academic Journals Selected for Publication

For the subject of the study, 65 academic journals were found that have published related studies during the last decade; these journals were indexed in approximately 30 databases. Table 3 shows 15 of the main journals that have published at least one document. It can also be seen that 13 of these 15 journals were reported in the SCImago Journal and Country Rank platform, which allows characterizing these groups of journals through the quartile in which they are classified, the H-index, and the SCImago Journal Rank (SJR).
Table 3 shows that the journals that have made the greatest contribution to the total number of documents collected are: Acta Horticulturae with 18.64%, Biosystems Engineering with 9.32%, Computers and Electronics in Agriculture with 5.93%, and Agrociencia with 4.24%, for a total of 38.13%, equivalent to 45 published scientific articles. The journal Acta Horticulturae is located in quartile 4 and presents an H-index of 58 and an SRJ index of 0.18, this journal publishes on general topics of horticulture. On the other hand, the journal Biosystems Engineering is in quartile 1 with an H-index and SRJ of 110 and 0.89, respectively; its publications represent advances in the understanding of the performance of biological systems and it is considered an interdisciplinary journal.
Computers and Electronics in Agriculture is a quartile 1 journal with an H-index of 115 and an SRJ of 1.21 and its publications are related to agronomy, horticulture, forestry, aquaculture, and livestock in research lines related to electronics, the internet of things, and sensing in agriculture. The journal Agrociencia is a quartile 2 journal with an H-index of 22 and an SRJ of 0.19; it is a journal that publishes articles related to agricultural sciences in the context of Latin America and the Caribbean.
Finally, the production per year for the six journals with the highest number of articles shows very different trends (Figure 6). It was observed that the journals Acta Horticulturae, Biosystems Engineering, and Computers and Electronics in Agriculture are journals that have published continuously from 2010 to the current time. The journal Agrociencia, on the other hand, published on the subject between 2010 and 2015, but in the last five years did not publish articles related to the subject. This behavior may be associated to the fact that Latin American researchers have looked to submit their work in journals from other latitudes, perhaps seeking greater visibility. This may be linked to the fact that the International Journal of Heat and Technology seems to be a new alternative academic journal where researchers seek to publish the work developed in this field of knowledge.

3.1.5. Authors with the Highest Scientific Productivity in the Decade

For the 118 documents collected, a total of 256 authors were identified. Table 4 shows the 15 main authors who have published research papers about CFD simulation applied to passive greenhouses or other types of protected agriculture structures. These 15 authors belong to 7 countries and most of them belong to research positions in universities or agricultural research centers.

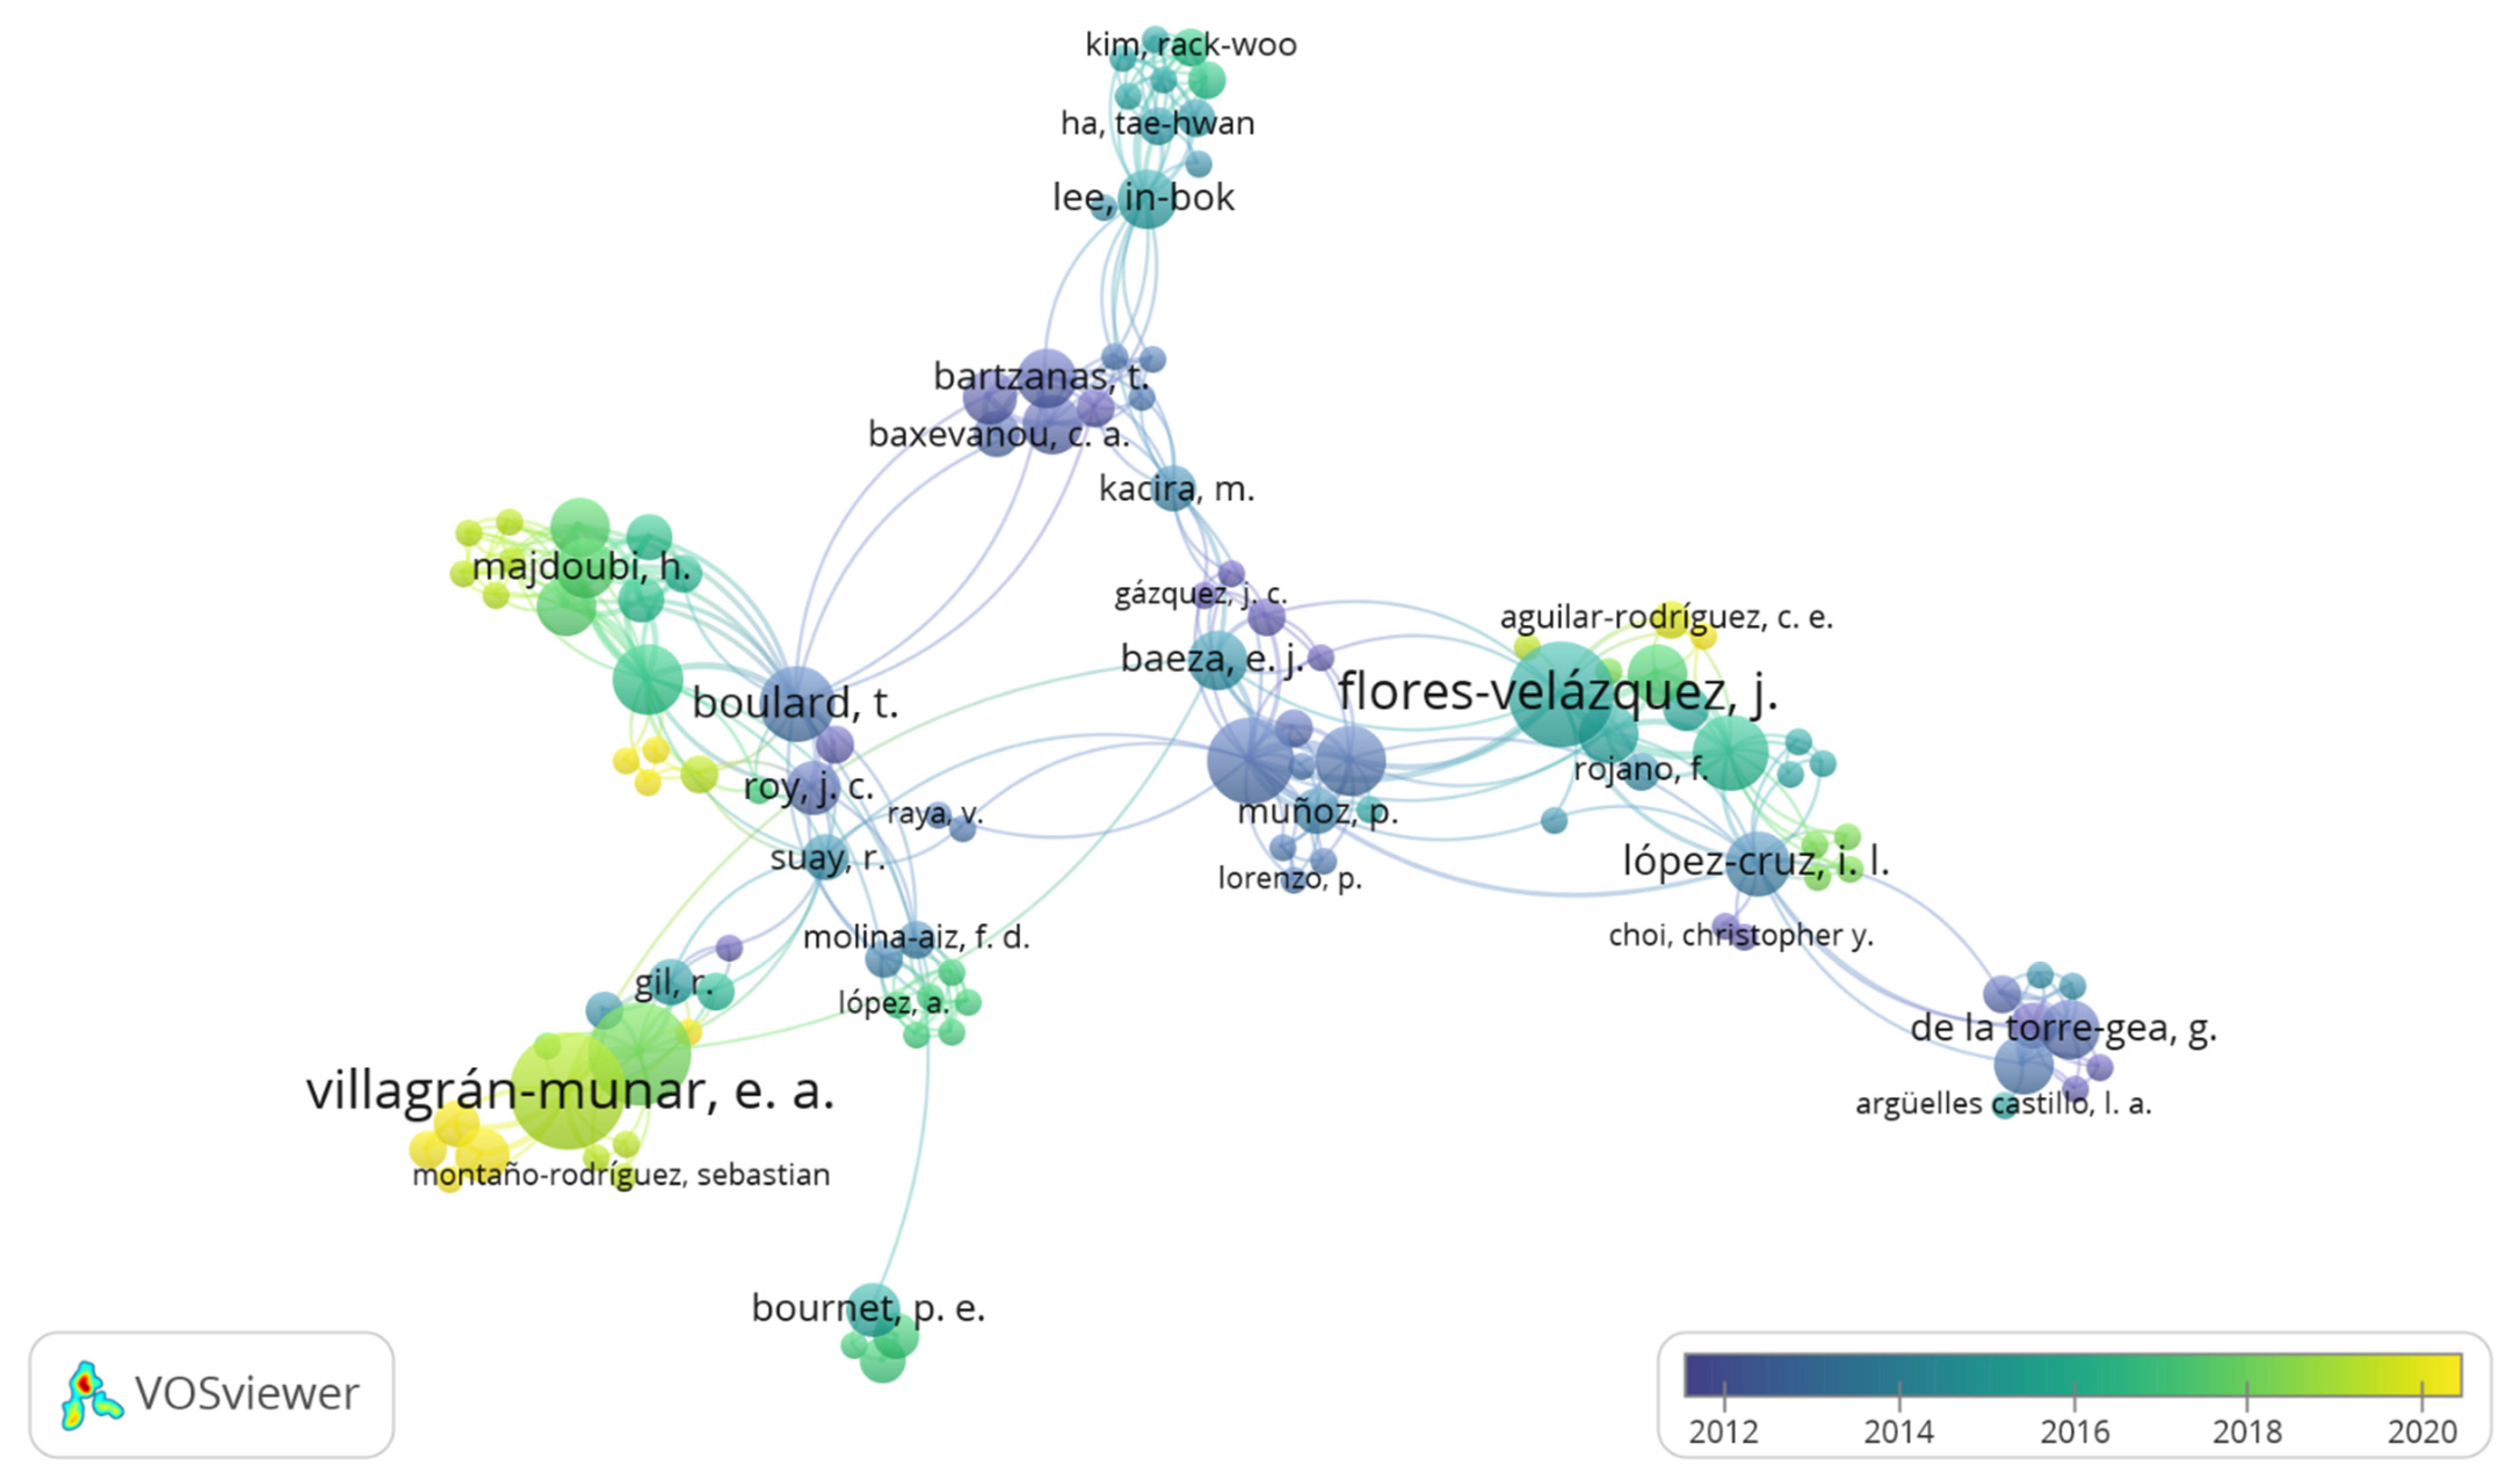
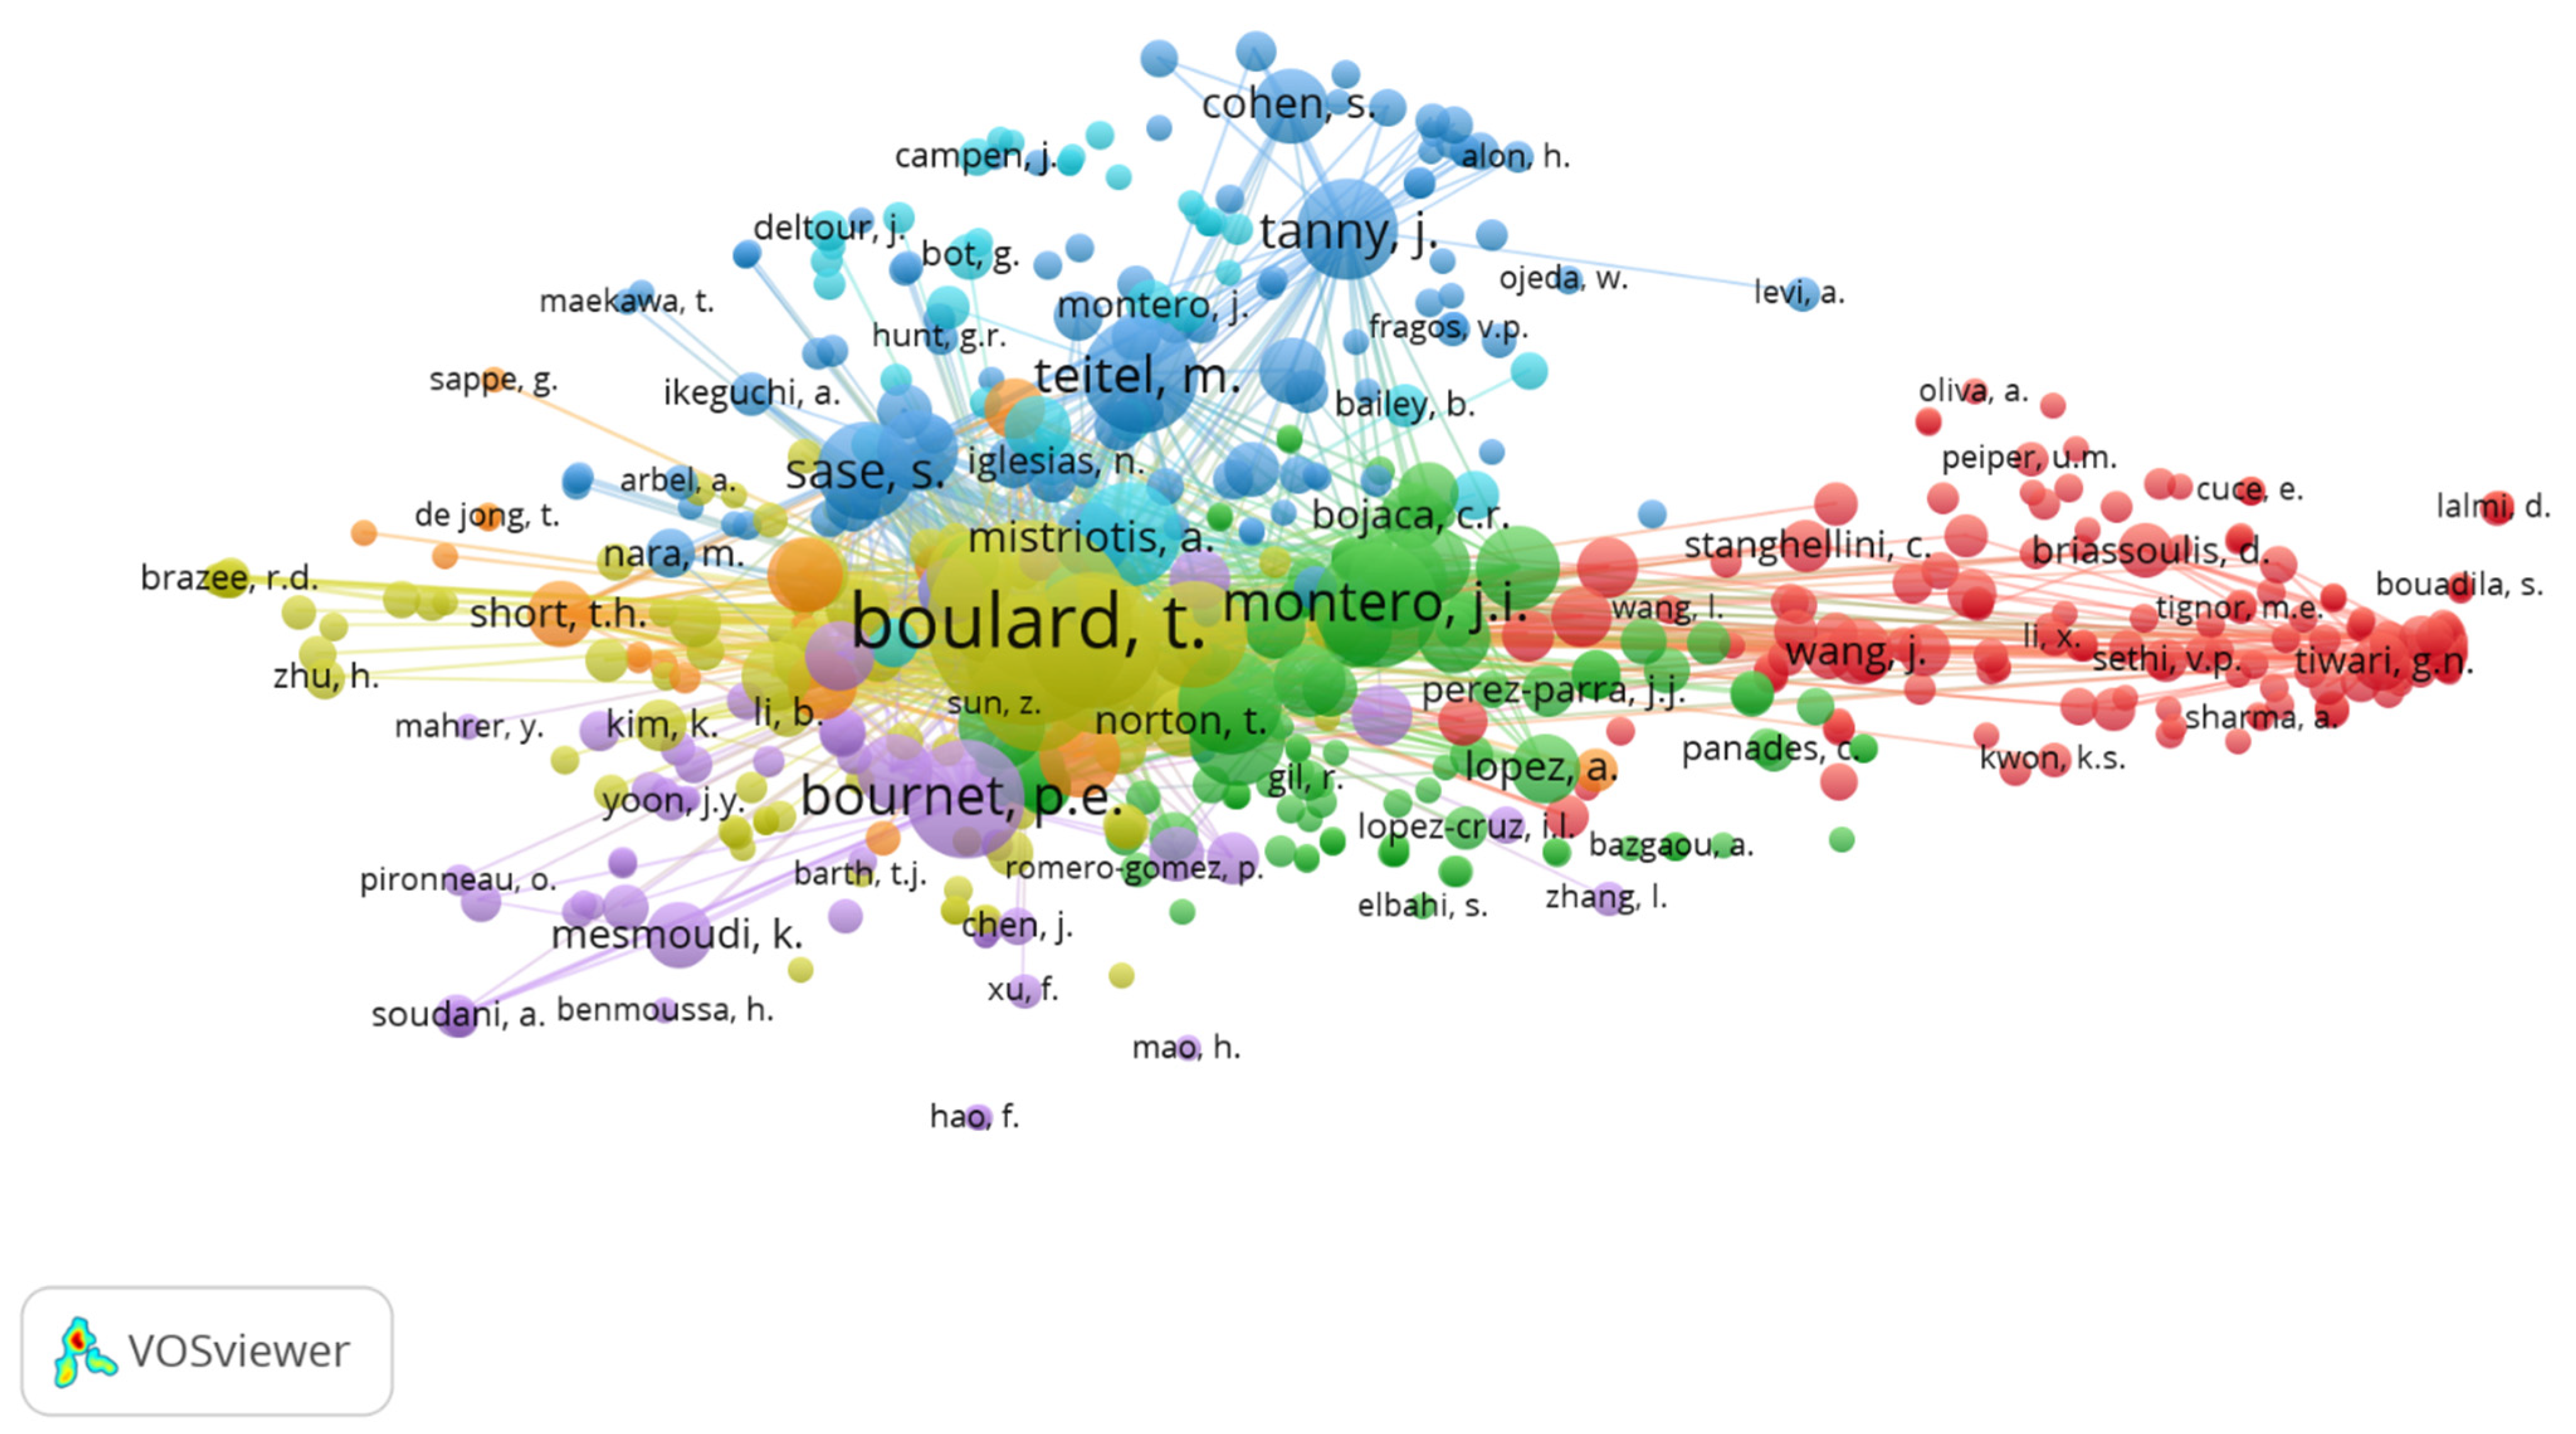
3.1.6. Co-Authorship and Co-Citation Network

Co-authorship networks make it possible to analyze and recognize structures that make up a scientific community [86]. Likewise, these networks allow the association of groups of authors and their contribution to the continuous scientific production in a specific area of knowledge [87]. Figure 7 shows the co-authorship network built with the use of the VOSviewer software—256 authors were identified, each author is represented by a node, these authors make up 42 working groups, and the network is related to a total of 690 links with a total link strength of 911.
Figure 7 shows that the database obtained generated a considerably disconnected and dense network, with a significant number of authors in the periphery and not connected to each other. At the center of the network are authors who worked on this topic in the previous decade, mainly in countries of the Mediterranean region, and who have joint works, such as Montero JI and Boulard T, and that in the middle of this decade has been taken up again with the work developed by Lopez A, Senhaji A, and Bournet P.
Moreover, it is also possible to identify the network of Mexican authors who developed works between 2010 and 2015, where the principal authors were identified as Lopez-Cruz I and de la Torre-Gea G. In addition, Figure 7 identifies the authors who are active in the subject, contributing research in the most recent years. Villagrán Munar E has contributed a considerable number of articles and their publications have been made between 2018 and 2020. It should also be noted that several authors are currently researching this topic, however, the relationship between them is limited to their close working group.
Only authors participating in the larger co-authorship network are presented in Figure 8, excluding the small networks seen in the periphery of Figure 7. There, it shows that the production network of 114 authors is made up of 12 different groups related with 389 links and with a total link strength of 571. It also shows important authors who published a good number of papers between 2012 and 2016, such as Bartzanas T, Molina- Aiz F, Baeza EJ, Flores Velasquez J, and Suay R.
A co-citation analysis allowed us to identify the patterns of behavior of the community interested in the research topic under study. That is, in the simplest case, two or more documents share a co-citation relationship when cited by a third document, directly reflecting the relationship in the topics among these document [88]. This relationship gains strength as the frequency with which the group of two or more documents are again co-cited increases [89]. In this case, a graph was found to be formed by a network of 563 nodes related to 65,660 links, with a total link strength of 395,576. It also identified points of convergence between the networks of the authors Boulard T and Montero JI, accompanied in their vicinity by authors such as Bournet P, Sase S, Teitel M, and Mistriotis A (Figure 9).

3.1.7. Frequently Cited Documents

Of the 118 documents, 94 have been cited at least once. Table 5 shows the 15 most cited documents in the area of knowledge and region of study. Within these, the top article is the one published by Bournet and Boulard [41], who carried out a review article on the studies developed in natural ventilation of greenhouses from 1984 to 2009. In this document can also be found all the advances obtained at that time in the implementation of CFD simulation for this subject. Following this, with 86 citations, is the work developed by Piscia et al. [90], which was the first CFD simulation work on nighttime weather that incorporated the user-defined functions needed to predict condensation phenomena.

3.2. Technical Component of the Studies

3.2.1. Protected Agriculture Structure Types

A total of 17 different types of protected agriculture structures were identified (Table 6). Five of the main greenhouse structures stood out, such as the chapel, tunnel, arch, Gothic, and the Venlo types; among these five typologies, a total of 81 publications were made. Also, there were existing studies on passive structures, such as screenhouses, which had a total of nine publications and which are structures that have been very popular among farmers in the last decade, mainly in warm weather conditions in low-altitude regions. There were two studies developed in the Americas regarding greenhouses built in hillside areas, which is also a cultivation practice that has been increasing in recent years as a technological alternative to open field agriculture.
The size of the structures is also relevant, since one of the factors to be considered in CFD simulation studies is the size of the structure. This factor will determine the computational cost required and the simulation time to obtain an accurate solution. In this regard, Table 7 presents the studies classified according to the size of the structures evaluated, showing that 45 studies were conducted in small, protected agriculture structures, followed by 35 and 16 studies in medium and large structures, respectively. The remaining studies did not report the size of the greenhouse evaluated.
This diversification of evaluated sizes depends very much on the final objective of the research work or the place where it was carried out, for example, the studies carried out in research centers or universities were generally done on small-size structures, such as that from De la Torre-Gea et al. [150], who developed a study using CFD and Bayesian networks to determine the distribution of temperature, humidity, and CO2 as a function of crop height in a Gothic-type greenhouse.
The studies in medium or large passive greenhouses have usually been conducted in commercial production structures, for example Villagrán y Bojacá [77] used a CFD model to determine the performance of a commercial greenhouse used in the Colombian ornamental sector. Similarly, Flores-Velasquez et al. [122] determined the climatic performance of four protected agriculture structures used for agricultural production in Mexico.
In the last decade, several authors have analyzed different types of existing greenhouses for agricultural production, reaching the almost generalized conclusion regarding the geometry of the structure and its strong influence on the behavior of the microclimate [17,76,78,110]. In general terms, it has been observed that the air flow movement will present different velocities depending on the shape of the roof [110]. This same roof geometry will affect the heat transfer values and, therefore, the temperature distribution in that region of the greenhouse [136]. On the other hand, recent studies have recommended the octagonal-type greenhouse because they have better ventilation rates and better temperature distribution compared to greenhouses equipped with side and roof ventilation [137]. Likewise, with respect to geometry, it is increasingly common to find studies that recommend increasing the height of structures in order to improve the efficiency of the natural ventilation phenomenon [148].
It is important to mention that these works have allowed the identification of the optimal size and location of the ventilation areas, which has improved the microclimatic behavior of the structures [29,110]. Moreover, it has been possible to determine the surface area of ventilation required to generate optimal microclimates in different types of greenhouses [29,125,137]. Another generalized conclusion is that passive greenhouses should not be larger than 50 m in width [122]. Regarding the behavior of climatic variables of physiological interest, such as photosynthetically active radiation (PAR), Mesmoudi et al. [105] found that for the climatic conditions of Algeria, the Venlo-type greenhouse is the one that allows the best PAR utilization.
For the case of Indonesia, Romdhonah et al. [170,171] defined that the suitable greenhouse structure is the peak type, while for Korea, Rasheed et al. [116], recommended the use of the Gothic greenhouse with conical roof, since these are the types of greenhouses that generate the best natural ventilation performance under the climatic conditions of each country. In China [15] and Thailand [151], the ventilation areas for a Chinese solar greenhouse and an arc-type greenhouse were redesigned to reduce the thermal gradients inside the structures. In Colombia, based on the limitations of the traditional greenhouse, two greenhouse models have been proposed: the DMG (curved multi-span design) and the GMG (Gothic multi-span design), greenhouses that have 19% more ventilation area, which allows higher ventilation rates and lower thermal gradients [29]. Likewise, for a chapel-type greenhouse, the implementation of ventilation towers was recently recommended as a passive ventilation alternative to obtain a homogeneous microclimate [177].

3.2.2. Type of Covering Material

Regarding the covering material, the main aspects to be considered for its selection are the cost and physical, thermal, and optical properties (Table 8). The main materials reported in the documents collected showed that the most used material is polyethylene, which was reported in 67 studies and in 16 of the 24 countries. This result coincides with previous studies, such as the one of Choab et al. [178], who concluded that low-density polyethylene is the most used material for greenhouse covers due to its low cost.
Another material commonly used for greenhouse covering is glass, which has greater durability over time and more stable optical properties during its useful life. For this study, 11 documents reported the use of this glazing material. Glass is a rigid material that requires the greenhouse to have a more robust structure and to allow for the installation panels, which is one of the reasons why it is less used [102]. Another advantage of glass is its high thermal radiation retention capacity, which allows for better nighttime climate conditions, since it can limit the thermal inversion process that is characteristic of plastic-covered greenhouses. Thermal inversion is the main reason why the indoor microclimate presents lower temperature conditions and higher humidity values compared to the outdoor environment [152].
In other studies, different covering materials have been analyzed; in this work, nine investigations were found that had this approach. To highlight the work of Lee et al. [126], where two types of greenhouse with plastic cover and two types of greenhouse with glass cover were analyzed. The conclusion was that both the shape of the structure and the roof material affect the thermal behavior of the greenhouses and, therefore, different air renewal flow rates are needed to maintain the same temperature conditions in each of the structures.
On the other hand, Baxevanou et al. [135] developed a study evaluating four types of covering materials: ethylene vinyl acetate (EVA), thermal polyethylene (TPE), polyvinyl chloride (VPVC), and a three-layer coextruded film (3L) in a tunnel-type greenhouse with tomato plants built in Central Greece. The conclusion was that for the climatic conditions that occurred throughout the year, the most suitable covering material was ethylene vinyl (EVA), since, for the tomato crop, it was the one that generated the best thermal conditions and air flow pattern and, at the same time, the one that allowed the best use of PAR radiation.
Another covering material primarily used in screenhouses is the porous insect-proof screen, which is a material widely used in hot climate regions where rainfall is scarce or occurs during very specific times of the year. In warm weather conditions, the spatial behavior of the temperature under this material is homogeneous and does not differ greatly from the outside temperature, with a thermal differential of only 1.7 °C [164]. However, it should be mentioned that the selection of the porous mesh at commercial level should be made taking into account the degree of control efficiency with respect to the main insect pests to be controlled and the level of restriction of the natural ventilation of the structure [122].
Finally, there are shadehouses, where the main objective is to limit the level of radiation that enters the structure. Depending on the crop, this can be used for agronomic and physiological purposes or to improve the microclimate conditions inside the structure. In a study carried out in Mexico, a shade net structure was evaluated, which presented favorable conditions for agricultural production with an average thermal gradient of −4.65 °C, with respect to the ambient temperature [130].

3.2.3. Analyzed Ventilation Configuration

Natural ventilation is the main method of climate control for passive structures, although it should be noted that each structure differs in terms of the surface area of the vents, their location in the structures, and the ventilation configuration used in each country [29]. The dominant ventilation configuration is ventilation through the lateral and roof areas, which was analyzed in 67 studies (Table 9).
One of the main conclusions is that this configuration allows an adequate homogenization of the microclimate and high air renewal rates in different types of greenhouses [37,183,184]. This type of configuration generally allows cool and fresh air to enter through the side vents and evacuates hot and humid air through the roof vents [170]. It is also the most widely used ventilation configuration in countries such as Colombia and Mexico, as it was reported in 17 and 13 investigations, respectively.
As for side ventilation, 21 studies were reported with this type of ventilation configuration—studies that were mainly developed in Greece, with four publications, followed by Algeria, China, and Spain, each with three publications. In general, this type of report has been made for tunnel greenhouses or greenhouse typologies that do not have ventilation systems in the roof. The general recommendation is that this ventilation configuration can be used in narrow or mono-span greenhouses, since the cooling of the greenhouse will be restricted to the areas near the side window where the air flow from the outside environment enters [36].
The rooftop ventilation configuration was reported in 16 studies, and it has been used in Venlo greenhouses or in multi-tunnel greenhouses that do not have ventilation areas on their side walls [137,146,185]. Its efficiency and effect on the microclimate will depend on several factors, among which, it is worth mentioning: the type of opening generated and whether it is roll-up or hinged. For roll-up ventilation, the wind direction is not a determining factor in the microclimate conditions generated inside the greenhouse [185]. In the case of the hinged opening, the best arrangement is on the windward side, since they allow generating a higher air renewal rate, but their cooling efficiency is also discussed, since it is a configuration that generates greater climatic heterogeneity [111]. However, it is also important to note that each greenhouse structure must be evaluated in order to determine the best configuration and arrangement of the rooftop ventilation areas since its efficiency will depend on multiple factors specific to the structure, the local climatic conditions, and the obstacles that may exist around the greenhouse [56,111,169].
On the other hand, a few studies have focused on analyzing the movement of air flow in closed greenhouses, either under night or winter weather conditions, where the aim was to increase the temperature to optimal levels for agricultural production either via the greenhouse effect or from passive heating systems [131]. Under these conditions, Ghernaout et al. [100] reported that the free convection airflow will depend on the heat transfer coefficient between the soil and the greenhouse interior environment and through the heat transfer coefficient between the roof and the inside and outside environment of the greenhouse.
Finally, what is also clear is that several studies, regardless of the ventilation configuration used, have continually suggested increasing the ventilation areas of greenhouses in order to obtain the ventilation rates required for a naturally ventilated structure [37,155]. Therefore, it is important to note that greenhouses with ventilation surfaces equivalent to 30% or less of the covered floor area of the greenhouse present heterogeneous microclimatic conditions due to poor ventilation rates [75,76,77]. On the contrary, greenhouses with ventilation surfaces higher than 35% show adequate ventilation rates and thermal behavior of lesser magnitude and greater homogeneity [169]. Another trend identified in regions where prevailing wind speed conditions are less than 1 m s−1, is the increase of ventilation in the roof region, which helps to generate higher rates of renewal via free convection [110,142].

3.2.4. Type of Software Used for Numerical Solution of the Simulations

Nowadays, due to the boom and success that CFD studies have had in this area of knowledge, there are a good number of commercial or open-source options available. For instance, in the preprocessing phase, it is possible to use AUTODESK to generate the geometry, ANSYS Fluent to solve the numerical models, and TECPLOT 360 to develop the postprocessing phase [17].
Table 10 shows the main solution software identified in the collected research. It was observed that the most widely used software has been ANSYS Fluent, with a total of 70 studies carried out in 15 of the countries from which the scientific publications’ inaugural research studies originated, highlighting its use in Colombia, Mexico, Algeria, Spain, and Japan. The second most used has been the ANSYS CFX software, with a total of five studies, some of them developed in Tunisia and Korea. Also, with less frequency of use were some software, used by a single country, such as Airpak 3.0, implemented in China, Autodesk CFD 2015, used for a publication that originated in Italy, Autodesk CFD 2017 in Brazil, COMSOL and MATLAB in Iran and Star CCM+ in South Africa. It should be noted that the choice of software will depend on the user, their programming capacity and, in many cases, the access to paid licensing software.
It should also be noted that some of the software programs used have a different solution methodology for the equations that describe the motion of a fluid flow, better known as Navier–Stokes equations. The finite volume methodology (FVM) stands out, which was used in 95 of the analyzed publications. This is related to the type of solution software implemented, such as ANSYS FLUENT, which, by default, performs the solution by FVM, because this is the fastest solution methodology with the lowest computational cost, also offering very accurate solutions [91].
The other methodology is the finite element method (FEM), which can be run in the commercial package ANSYS FLOTRAN. This methodology can offer a little more accurate solutions than those obtained with FVM. Although, the accuracy achieved in the solution versus the computational cost and the memory available to store the data of the generated solution are quite debatable [91]. For more technical details, such as types of suitable numerical mesh, stability, and convergence time, the reader is referred to review the work of Molina-Aiz et al. [91] and Benni et al. [32]. Finally, another possibility is to use a combined method with FEM and FVM, such as the one running with the ANSYS CFX solver, which can often provide more accurate, stable, and faster solutions.

3.2.5. Type of Numerical Simulation Performed

In general, CFD simulations for the study of natural ventilation in greenhouses can be approached through two solution approaches. The first one is in steady state, in which specific starting conditions are established until the convergence of this simulation is found, and this method has mainly been used for quick evaluations or in works that aimed to design some kind of greenhouse structure [17]. The other solution approach is in transient time state, this type of simulation is effective to evaluate the behavior of the microclimate in a greenhouse and its effect on the dynamics of heat and mass transfer of plants of any crop species. This type of simulation can also establish the changing conditions that are a reality in the climate variables in the external environment to the structure [53,186].
In the documents collected, 84 of these studies developed the simulations in steady state (Table 11). As for the countries where these 84 studies were carried out, 17 came from Mexico, 14 from Colombia, and 8 from China, and most of them aimed at analyzing and quantifying the natural ventilation of some type of greenhouse structure and its effect on the microclimate generated. In some specific studies, it was deduced that due to the size of the greenhouse evaluated, the most appropriate option in terms of computational cost was the stationary simulation, e.g., Villagran et al. [112] and Flores-Velasquez [122].
Also to be highlighted is the work carried out by Lalmi et al. [118], who used steady-state simulations to evaluate the efficiency of a thermal storage system inside a tunnel greenhouse and found that the use of this accumulator improved the thermal conditions of the greenhouse in a range of 3 to 5 °C. These authors also concluded that a successfully validated CFD model should allow the design and location of future heating systems in the Ghardaïa region of Algeria.
In the case of transient state simulations, a total of 15 research papers with this methodological approach were identified. In this case, the largest number of papers were generated in China, with six publications, followed by Spain and Korea, each with three published articles, while in countries such as Colombia, only one publication has been generated with this type of simulation. In general, these types of simulation are the most suitable approach to simulate the real experimental conditions collected in the outdoor and indoor environments of any protected agricultural structure.
Hong and Lee [106] reported that it can take from 3 to 20 min after opening a ventilation area for the effect of natural ventilation to be observed on the thermal pattern in a single-bay chapel greenhouse. Likewise, Erráis et al. [139], in a study where the temporal evolution of transpiration and photosynthetic rate of a tomato crop established in a Venlo-type greenhouse was evaluated, reported a detailed description of the thermal radiation and transpiration fields inside the crop, concluding that these present a high heterogeneity due to the differentiated radiation levels that are intercepted at the different levels of the crop canopy.
On the other hand, there are studies that have reported on the technical issues visualized through steady state and transient state simulation studies. Piscia et al. [90] implemented transient simulations to validate a CFD model under nighttime weather conditions and then, with the validated model, stationary simulations were used to study condensation phenomena under different initial conditions. The authors reported that the condensation phenomena behaved with the same characteristic pattern. Therefore, they could be modeled under the same logistic function that can represent the simulated starting conditions. Finally, the increasingly explicit interest of researchers in simulating the interactions of some type of crop with microclimate conditions is undoubtedly the main reason why transient state simulations are currently being promoted.

3.2.6. Type of Numerical Grid Implemented

Another relevant phase in CFD simulation studies has focused on the definition of the type of numerical meshing to be established to discretize the computational domain, which will undoubtedly allow us to obtain accurate solutions in accordance with reality [124]. In general, we found simulation works developed with structured grids; this type of numerical grid presents a regular connectivity between the nodes of the grid and, at the same time, allows researchers to obtain a good convergence and resolution of the analyzed problem [187].
On the other hand, there are the unstructured grids, which present irregular connectivity between grid nodes and, in terms of computational calculation, require more time for the solution of the analyzed problem and, in turn, require more memory for data storage and processing. Although, this type of meshing is better suited to complex geometries and requires less experience by the user in numerical meshing processes [11].
It was observed that 51 publications did not report what type of numerical grids they implemented in their simulation process, while 45 research papers reported that they implemented unstructured numerical grids. Finally, eight publications used the structured type of grid and three investigations used a hybrid-type grid, which is a combination of structured and unstructured cells (Table 12). Therefore, it can be mentioned that perhaps because of the versatility that unstructured grids allow, these are the most implemented in the research works carried out.
Regarding the origin of the publications, Greece and Italy were the countries that topped the list of publications where the structured grids were implemented, with three and two documents, respectively. For the unstructured grids, the country with the most publications was Colombia with a total of 16 documents, followed by Algeria with 4 and finally Costa Rica, Spain, and Mexico with 3 each.
It is also important to mention that regardless of the type of numerical grid implemented, it will always be necessary to determine the quality of the numerical grid, its size, and the independence of the solution to the size of the numerical grid [79,187]. In general, preprocessing software has within its interface the option to quantify the quality of the numerical grid under some indexes created for this purpose, such as asymmetry, aspect ratio, and cell skewness [78]. For the definition of the solution independence to the size of the numerical grid, it is advisable to perform sensitivity analyses to find the appropriate size that guarantees a high accuracy of the solution at the lowest possible computational cost [95,99,187].

3.2.7. Turbulence Model Implemented

The simulation of air flow over a protected agricultural structure will require the selection of a closure model to simulate the fluctuating component of the flow, better known as turbulence [41]. Table 13 presents the turbulence models used in the compiled papers; it was found that during this last decade, the use of the standard k-ε model was predominant, being implemented in 72 research papers. This model is quite popular to study greenhouse climate since it offers accurate solutions at a low computational cost [79]. The countries that contributed the most were Colombia with 17, Mexico with 13, China and Spain with 7 and Morocco with 5 studies.
The k-ε RNG model was found to be the second most commonly used, with a total of seven publications, coming from countries such as Korea, China, Greece, Italy, Mexico, and Turkey. This renormalized turbulence model has proven to be more accurate for predicting the airflow pattern inside greenhouses built in regions with low wind speeds [188]. Thirdly, was the use of the large eddy simulation (LES) model, with a total of four studies; in general, it has been reported that the accuracy of the LES model is better than that of the standard k-ε models, although it should also be mentioned that the use of the LES model will require a higher computational cost [187].
Three research papers have also been developed comparing the results obtained using different turbulence models. For instance, Lee et al. [126] performed the calculation of ventilation rates by CFD simulation in four greenhouse types, using in the simulations the standard k-ε, RNG k-ε, realizable k-ε, standard k-ω, and SST k-ω turbulence models. The results showed that for single-span greenhouses, the most appropriate turbulence model is the RNG k-ε model, since it offers satisfactory simulation results with respect to the experimental results and is a turbulence model that allows obtaining solutions at an acceptable computational speed.
Finally, we found works where modified turbulence models were used. Teitel and Wenger [163] implemented the turbulence model described in the work of Yang et al. [189] in order to study the air flow behavior in two frame house structures with different roofs. They reported that the structure cover influenced the speed and intensity of the air movement pattern in the region where crops were grown. On the other hand, Benni et al. [95] reported the implementation of a turbulence model specially designed to simulate the natural convection process in naturally ventilated greenhouses. Likewise, 16 documents did not report which turbulence model was implemented in the CFD simulation. This is not adequate since it does not provide the reader with the necessary information to understand the implemented CFD model and, in turn, restricts the applicability or replication of the model for studies in other structures or climatic regions.

3.2.8. Implemented Radiation Model

The behavior of the microclimate in a protected agriculture structure is also highly dependent on the energy transfers via solar radiation [190]. Likewise, the level of radiation intercepted by the roof and transferred to the interior of the structure directly influences plant physiological processes, such as transpiration and photosynthesis [191,192]. Therefore the coupling of a solar radiation model able to efficiently and realistically simulate radiative transfers has been increasingly an area of interest and continuous development in this area of knowledge [41].
In the same way, solar radiation affects the thermal component of natural ventilation, with solar radiation being the cause via the greenhouse effect and by free convection of the buoyancy phenomenon. This phenomenon promotes the recirculation of air in the region close to the greenhouse roof [33,193]. Therefore, in regions where low wind speeds are predominant, it is important that the CFD simulation considers solar radiation since the air flow behavior is affected by the chimney phenomenon due to thermal phenomena occurring from the ground to the ventilation areas located in the roof zone [121].
Regarding the type of radiation model implemented in the reviewed studies (Table 14), it was observed that there were 62 investigations where the use of a solar radiation model was not reported or a simplified method was used where boundary conditions were established, either temperature or heat flux on the roof, floor, or walls of the roof structure analyzed [29,41]. Romero-Gómez et al. [46], in a study developed in a tunnel-type greenhouse in Mexico, calculated ventilation rates by applying a heat flow condition on the floor inside the greenhouse. The main conclusion of this study was that the type of CFD model can contribute to identify relevant design factors affecting greenhouse cooling under local climatic conditions. This same conclusion has been reported in other studies with the same methodological approach [76,105,169].
Regarding the research papers that implemented a radiation model to solve the radiative transfer equation (RTE), 44 studies that used the discrete order (DO) radiation model stood out (Table 14). This model allows considering the different wavelengths of solar radiation and allows modeling radiation on semi-transparent walls and is suitable for media with a variable spectral absorption coefficient over the entire wavelength spectrum [194]. For its implementation, the optical characteristics of the covering material, such as absorptivity, transmissivity, and reflectivity for each wavelength considered, must be provided [195]. It is also possible to include a user-defined function written in C++ code to couple the irradiance boundary conditions to the CFD model [33].
The DO radiation model implemented in CFD studies developed in France and Morocco showed that the level of solar radiation has a strong influence on the stomatal resistance of crops and, therefore, on plant transpiration. Additionally, they confirmed the ability of the numerical model to predict the microclimate for different times of the day and times of the year, since the position of the sun can be set within the boundary and initial conditions of the CFD model, which increases the realism of the generated simulations [139]. On the other hand, Da silva et al. [132] demonstrated that indirect ventilation through ground heat exchangers can reduce the temperature inside a tunnel-type greenhouse by up to 4 °C.
A study was also identified in Mexico, where the Rosseland model was used in conjunction with the solar calculator included in the software by default [130]. This work identified that a greenhouse–shade-screen hybrid structure in semi-arid climatic conditions showed a lower thermal gradient compared to a greenhouse with a plastic cover, enabling vegetable production. It should also be mentioned that when solar radiation data for the study region are not available, these values can be obtained from the solar calculator of the Ansys Fluent software, and these values from the solar calculator can be coupled to any of the radiation models available in the software [4]. Finally, these coupled simulations in recent years have allowed the evaluation of different covering materials, which helps producers or decision makers to select the covering material with the best microclimate conditions, better PAR radiation utilization, and higher thermal efficiency in protected agriculture structures [135].

3.2.9. Implemented Crop Model

The realism increasingly demanded by CFD modeling and simulation studies together with computational development has allowed the implemented models to include some type of crop inside the evaluated structures. The general methodological approach has been to consider the crop as a porous medium where the Darcy–Forchheimer equation is solved [53]. Also, from user-defined functions, mathematical models can be programmed to simulate the blocks of crop plants as sources of sensible and latent heat, depending on local climatic conditions and radiation levels [41]. The aerodynamic coefficients established experimentally in wind tunnels for different types of crops can also be included in the CFD model, which allows for simulation of the physical restriction to the air flow generated by the crop rows [7].
However, 55.1% of the collected works did not consider the crop within the simulations developed (Table 15). Many studies justified the non-presence of the crop in their research, mainly because they sought to characterize ventilation rates and temperature and relative humidity distribution patterns under the worst-case scenario of a greenhouse in an empty condition [15,32,76]. Under this condition, much of the energy captured by the structure is converted into heat since there are no crop plants to serve as sinks or provide water vapor to help regulate the temperature through water evaporation [2]. It can also be mentioned that in the works originated in countries such as Colombia, Saudi Arabia, United States, Indonesia, Iran, Italy, Japan, Thailand, Taiwan, and Turkey, most of them did not include any type of crop.
Regarding the studies that included the crop, 42 works were identified (Table 15). These studies came from Israel, Morocco, France, and Qatar, countries that included the crop in all publications generated in the last decade. Nebbali et al. [92] detailed a mathematical model useful for predicting heat and mass exchanges in tomato plants. The authors concluded that this crop model programmed in a CFD model had a high predictive capacity to determine the behavior of transpiration in the crop rows and its spatiotemporal evolution throughout the day. Likewise, Piscia et al. [134] concluded that the transpiration rate of the crop will depend on the leaf area index of the plants and on the level of radiation that falls on the plant canopy.
Regarding the contribution in number of works developed with the presence of crops, it is worth mentioning Mexico, where 10 publications with this approach originated. These works allowed researchers to determine that when the location of the crop is parallel to the air flow, the conditions of humidity and CO2 concentration improve and not the thermal gradient, although the authors emphasized that the conditions generated are optimal for the growth and development of the tomato crop [153]. These studies also identified that the effect on the air flow velocity generated by the different types of crops depends on the morphology and porosity degree of the plant [109]. In a study where different crops were evaluated, it was reported that the average velocity in a screen house with pepper plants was 0.18 ms−1, while in the same structure with green bean plants, the average air flow velocity was 0.3 ms−1 [159].
One of the last studies developed in Mexico focused on calculating, through CFD simulation, the accumulation of degree days in a tomato crop established in two regions of the country. This information allowed predicting the crop cycle, planning planting and harvesting tasks, as well as water resource management. The authors reported that for the Navolato region, up to four harvests can be achieved during a year, while in Texcoco only one crop cycle can be achieved, which must be transplanted in May and harvested before November [156].
These simulations with crop presence have also led to the conclusion that the ventilation rate is not always the most appropriate indicator to evaluate a type of structure. As observed in the research results, it is more important to determine the conditions at the plant level for variables such as air flow velocity, temperature, absolute humidity, and, in general terms, the homogeneity of the microclimate [157,173]. For example, one of the South African studies concluded that greenhouses located to leeward show lower air velocity distribution at plant height, while those located to windward show higher velocities and generate greater heterogeneity, which influences the quality and production of the crop [143].

3.2.10. Type of Meteorological Condition Simulated

Until 2003, greenhouse microclimate studies developed with CFD simulation focused on analyzing the conditions generated during the daytime period [17]. However, it has been increasingly frequent to carry out studies in greenhouses under night weather conditions due to phenomena that occur during the night period, mainly in plastic-covered greenhouses, such as condensation or thermal inversion [162]. The frequent interest in improving the thermal efficiency of greenhouses and of some heating systems implemented in some regions has also contributed to this increase in studies on nighttime climate conditions [196].
In this case, 75 of the documents collected were studies developed for the daytime period (Table 16). Of this total, the three countries that made the greatest contribution were Mexico, Colombia, and China with 19%, 15%, and 11%, respectively. There are also other countries that have publications only for the daytime period, such as Saudi Arabia, Brazil, Iran, Qatar, Thailand, and Taiwan. As for studies on night climate, 12 papers were identified, with a high percentage coming from countries such as Spain, Morocco, and Colombia. Finally, 16 studies developed in Colombia, Algeria, and Indonesia analyzed the two conditions.
The main objective of daytime climate analysis is to characterize the movement of flow patterns, quantify ventilation rates, as well as to evaluate some alternatives for the microclimatic optimization of various protected agriculture structures [76,175]. On the other hand, for nighttime conditions, research has attempted to establish climate management strategies to mitigate thermal inversion [75]. For example, it has been proposed to use double roofs, mulches, or thermal screens in addition to the covering material in order to limit energy loss [152,174,197]. It has also been proposed to use a tunnel-type greenhouse, since it presents a suitable thermal behavior for the night period [140], or for other types of greenhouses use closing systems in the fixed ventilation areas in the roof region [79].

3.2.11. Type of Validation Used

Another relevant step in the CFD modeling and simulation process is the validation phase of the numerical results. This should generally be done by means of a procedure that allows obtaining experimental data under the configuration of one of the simulated scenarios. This validation process allows researchers to define if the numerical results present a good fit with the real observed behavior [91,125,187]. For the documents collected, it was identified that the most used experimental methodology is the measurement of microclimatic variables inside the evaluated structures, a methodology that was used in 69 of the published documents (Table 17).
Microclimatic evaluation is the type of validation that allows recording the behavior of the microclimate inside the structure and its interaction with the plants and the climatic conditions outside. The climatic variables inside protected agricultural structures with which CFD models are validated have usually been temperature and relative humidity in most studies [5,47,79,104]. As a second line of use for validation, variables such as air flow velocity and direction have been quantified [15,29]; other studies have investigated the measurement of the CO2 concentration [19,150], heat flow from the ground [152], and the radiation level [181].
These microclimatic measurements have made it possible to experimentally verify some quite general problems of passive greenhouses, such as the high spatial heterogeneity in the behavior of temperature, relative humidity, and CO2 concentration [111,150,175]. In addition, poor air renewal rates, thermal inversion, and problems generated by condensation in this type of structure have been observed, factors that limit yields and the quality of harvested products [79,102,139]. Under this same methodological approach, but with a considerable number of 33 measuring and recording sensors, it was also possible to perform a qualitative and quantitative validation of the spatial distribution of temperature in a 2000 m2 greenhouse using prediction techniques with geostatistics [17].
The next validation methodology identified was through wind tunnel measurements; under this methodological approach, the CFD models of nine of the published studies were validated. This validation methodology allows observing the qualitative and quantitative characteristics of the airflow pattern. Pakari and Ghani [49] reported that the maximum air flow velocity magnitude predicted by the CFD simulations presented an error of 3% with respect to those obtained experimentally in the wind tunnel. The authors also mentioned that the CFD model had a high capacity to predict the air recirculation zones generated in the air entry region of a tunnel-type greenhouse equipped with wind ventilation towers. Similar prediction error results were reported for three types of single-span greenhouses in Korea by Ha et al. [108].
It is also worth noting that in the study conducted by Baeza et al. [149], a regular approximation of the results obtained in the wind tunnel compared to those obtained by CFD simulation has been reported. The authors recommended maintaining the development of experimental tests on the real greenhouse prototype to improve validation methods, since wind tunnel results cannot always determine the real behavior of greenhouse structures under different ventilation configurations. These combined wind tunnel and field experimentation validations were successfully carried out by Kwon et al. [198], Fouad et al. [199], and, more recently, by Vieira Neto and Soriano [129].
Another alternative that has been used by researchers is the comparison of their results with the results obtained in previously published research papers. Under this validation approach, eight studies developed in the last decade were identified (Table 17). Within this classification, it was observed that the studies came from countries such as Algeria, Arabia, Indonesia, Mexico, and Morocco. For example, Majdoubi et al. [172] used a CFD model from a previous study already validated and published.
The objective of this new work was to analyze the effect of ventilating under three different ventilation configurations in a Canarian greenhouse under day and night climate conditions. The authors reported that for daytime conditions the greenhouse should be ventilated only through the ventilation areas arranged on the east and west sides of the structure, since this configuration helps to reduce the heterogeneity and the thermal gradient at the crop level. Likewise, this ventilation configuration used in nocturnal climate conditions allows reducing the humidity level in the volume occupied by the crop canopy.
Another form of validation is through experimentation on scale greenhouse models inserted in water tunnels. This type of validation allows researchers to see the behavior of water flow through the greenhouse structure and to record it qualitatively with the use of visualization techniques. Under this validation methodology, two research works developed in typical Mexican structures were identified.
It is important to highlight that a total of 19 research studies did not validate the CFD models or did not report the validation results obtained. Some studies mentioned that the validation of the simulations is complex due to the difficulty in accurately quantifying the ventilation rates in greenhouse structures. Finally, a study was identified where the authors mentioned that they based their study on the law of fluid physics related to continuity, reporting that the difference between the air inlet and outlet flow rates to the computational domain only presented a standard error of 3.24%, concluding that the CFD model implemented was reliable for the development of the simulations [110].
Experimentally collected data are generally compared with those obtained by CFD simulation. These comparisons of the datasets allow researchers to establish the degree of fit of the CFD model to predict the real conditions occurring inside the protected agriculture structures [125]. These comparisons are mainly performed by calculating some goodness-of-fit measures, such as the root mean square error (RMSE), the absolute error (MAE), or the mean percentage error (MAPE). In this review, 34 studies calculated these goodness-of-fit measures as an evaluation method to define the prediction quality of the implemented CFD model and, therefore, to determine if its use is appropriate for the purposes of the proposed research or if, on the contrary, modifications should be made to the CFD model to improve its prediction capacity.
The error ranges considered adequate to accept the model are diverse; in general, it has been mentioned that for the MAPE the errors should be below 10% for the variables predicted by the CFD model [4,200]. This is in line with the recommendation given by Baptista et al. [201], who recommended that models used to predict the microclimate in greenhouses should not have errors greater than 10% for variables such as temperature and relative humidity. It should also be mentioned that the more these goodness-of-fit measures tend to 0, the better the predictive quality of the implemented CFD model [29]. Within this group of studies, it is worth highlighting those that achieved RMSE values below 0.7 °C for temperature [83,102,143] and below 4% for relative humidity [47,166].
Other studies have calculated some less commonly used indices, such as the ratio of percentage deviation index (RPD), which is a value that relates the standard deviation values of the measured data and the RMSE of the simulated values. RPD values higher than 2 indicate a good prediction quality [95,202]. Alternatively, some publications have validated CFD models by means of graphical comparisons between the data obtained experimentally in the protected agricultural structure and those obtained by numerical simulation. A total of 19 publications included this methodology in the validation analysis (Table 18). Da silva et al. [132] obtained values above 0.94 in the correlation coefficient between measured and simulated data for temperature, humidity, and solar radiation inside an arc-type greenhouse.
Another form of quantitative analysis identified in 15 studies was the construction of trend graphs between measured and simulated data and the application of statistical tests to analyze these datasets. In general terms, these statistical tests with 95% confidence intervals sought to determine whether there were significant differences between the variances or between each of the measured and simulated datasets and, based on these results, to accept or reject the validity of the CFD model [11,175]. Finally, 11 studies validated the CFD models using some of the techniques mentioned above or some combination of them (Table 18).

3.3. Current Research Trends

Current and future research trends include a growing interest on the part of growers to establish their crops in insect-proof screenhouses [204,205]. Therefore, this is a topic of interest that may have further developments in the coming years, focusing on the search for structural mesh lattices that allow the greatest control of pest insects with the least possible impact on air flow patterns and the homogeneity of the microclimate [164]. In addition, this type of screenhouse structure should have some type of simple structure inside to limit the water fall on the leaves of the plants and, thus, allow horticultural production during the rainy seasons of the year [125].
On the other hand, the use of renewable energies as a technological alternative to optimize the microclimatic conditions of passive protected agricultural structures has also been acquiring research interest in recent years [11]. In this regard, it should be mentioned that for daytime climate conditions in low latitude and warm climate regions, it is necessary to limit the incident radiation on the interior of the structures to reduce the generated thermal gradient. This can be achieved through the use of shading screens [134] or from the use of photovoltaic panels that also allow the generation of energy that can be used for other air conditioning tasks [5,206,207].
Likewise, for nighttime climate conditions, it is necessary to continue research on passive heating systems that allow users to increase the energy level inside the structures in order to improve plant growth and development and to limit phenomena such as condensation and thermal inversion [79]. These scenarios, together with those of daytime climate, should certainly start with the inclusion of crops in CFD models, which will allow simulating the interactions between the physical processes of plants and their contribution to the generation of the microclimate, thus making the simulations more realistic.
In terms of the greenhouse structural design, a line of research is also being generated where the objective is the structural optimization of some greenhouse typologies. These studies use numerical simulation to determine the air pressure coefficients that generate stresses and point to structural loads that can affect the structural stability of greenhouses or the physical durability of covering materials [208]. Therefore, information on validated models for single-span greenhouses [115,209] and for multi-span greenhouses [210,211] is already available in the scientific literature. The authors’ conclusions highlight the need for further studies to relate wind direction and speed to the internal and external pressure coefficients of the greenhouse structure.

4. Conclusions

A compilation of 118 papers on the use of computational fluid dynamics (CFD) applied to the study of natural ventilation in passive protected structures used for agricultural production in tropical and subtropical climatic regions, in the last decade, was achieved. These papers were written by 256 authors associated with research centers and universities and the reviewed studies were carried out in 24 countries with Mexico and Colombia predominating. The papers were published in 65 indexed academic journals where Acta Horticulturae, Biosystems Engineering, and Computers and Electronics in Agriculture stood out. The year with the highest production of published papers was 2019 with 18 papers.
In general, interactions between research groups and authors from countries of the Mediterranean region, Mexico, and Colombia were observed. The most studied structures were polyethylene-covered greenhouses, where a total of 16 typologies implemented in these geographical regions were identified. Greenhouses with areas less than 500 m2 and ventilated through side and roof ventilation were predominant.
In terms of computational simulation, the most widely implemented software has been Ansys Fluent, which discretizes and solves the equations that describe the behavior of air flow using the finite volume methodology. The most developed type of simulation is under steady state time, applying the k- ε turbulence model, without the presence of crop and without coupling any solar radiation model. Analyses of structures under diurnal climate conditions were also predominant, where research studies mainly sought to determine the ventilation rates of each greenhouse type and their effects on the spatial distribution of temperature.

Author Contributions

Conceptualization, E.V. and M.A.P.; methodology, E.V. and G.A.O.R.; software, G.A.O.R.; validation, E.V., M.A.P., and G.A.O.R.; formal analysis, E.V. and G.A.O.R.; investigation, E.V., M.A.P., and G.A.O.R.; resources, E.V., M.A.P., and G.A.O.R.; data curation, G.A.O.R.; writing—original draft preparation, E.V., M.A.P., and G.A.O.R.; writing—review and editing, E.V., M.A.P., and G.A.O.R.; supervision, E.V.; project administration, M.A.P.; funding acquisition, E.V. and M.A.P. All authors have read and agreed to the published version of the manuscript.

Funding

This research was funded by Ministerio de Ciencia Tecnología e Innovación de Colombia—MINCIENCIAS and The APC was funded by Corporación Colombiana de Investigación Agropecuaria—AGROSAVIA.

Institutional Review Board Statement

Not applicable.

Informed Consent Statement

Not applicable.

Data Availability Statement

Data available from authors upon request.

Acknowledgments

The authors would like to thank the Corporación Colombiana de Investigación Agropecuaria—AGROSAVIA for the technical support in the execution of this research. This study was funded by the Ministerio de Ciencia Tecnología e Innovación de Colombia—MINCIENCIAS through the project named “Fortalecimiento de las capacidades de I + D + i del centro de investigación Tibaitatá para la generación, apropiación y divulgación de nuevo conocimiento como estrategia de adaptación al cambio climático en sistemas de producción agrícola ubicados en las zonas agroclimáticas del trópico alto colombiano”.

Conflicts of Interest

The authors declare no conflict of interest.

References

  1. Rabbi, B.; Chen, Z.H.; Sethuvenkatraman, S. Protected cropping in warm climates: A review of humidity control and cooling methods. Energies 2019, 12, 2737. [Google Scholar] [CrossRef] [Green Version]
  2. Villagran, E.; Leon, R.; Rodriguez, A.; Jaramillo, J. 3D numerical analysis of the natural ventilation behavior in a Colombian greenhouse established in warm climate conditions. Sustainability 2020, 12, 8101. [Google Scholar] [CrossRef]
  3. Revathi, S.; Sivakumaran, N.; Radhakrishnan, T.K. Design of solar-powered forced ventilation system and energy-efficient thermal comfort operation of greenhouse. Mater. Today Proc. 2021, in press. [Google Scholar] [CrossRef]
  4. Villagrán, E.; Rodriguez, A. Analysis of the Thermal Behavior of a New Structure of Protected Agriculture Established in a Region of Tropical Climate Conditions. Fluids 2021, 6, 223. [Google Scholar] [CrossRef]
  5. Ben Amara, H.; Bouadila, S.; Fatnassi, H.; Arici, M.; Allah Guizani, A. Climate assessment of greenhouse equipped with south-oriented PV roofs: An experimental and computational fluid dynamics study. Sustain. Energy Technol. Assess. 2021, 45, 101100. [Google Scholar] [CrossRef]
  6. Rojas-Rishor, A. Análisis del Comportamiento Térmico de un Invernadero Construido en Ladera, Aplicando Dinámica de Fluidos Computacional. Bachelor’s Thesis, Facultad de Ingeniería, Departamento de Ingeniería Agrícola, Universidad de Costa Rica, San Pedro, Costa Rica, 2015. Available online: https://www.ingbiosistemas.ucr.ac.cr/wp-content/uploads/2016/02/tesis-adriana-rojas.pdf (accessed on 10 May 2021).
  7. Villagran, E.; Henao-Rojas, J.C.; Franco, G. Thermo-Environmental Performance of Four Different Shapes of Solar Greenhouse Dryer with Free Convection Operating Principle and No Load on Product. Fluids 2021, 6, 183. [Google Scholar] [CrossRef]
  8. Zhou, D.; Meinke, H.; Wilson, M.; Marcelis, L.F.M.; Heuvelink, E. Towards delivering on the sustainable development goals in greenhouse production systems. Resour. Conserv. Recycl. 2021, 169, 105379. [Google Scholar] [CrossRef]
  9. Graamans, L.; Baeza, E.; van den Dobbelsteen, A.; Tsafaras, I.; Stanghellini, C. Plant factories versus greenhouses: Comparison of resource use efficiency. Agric. Syst. 2018, 160, 31–43. [Google Scholar] [CrossRef]
  10. Ramírez Vargas, C.; Nienhuis, J. Evaluación del crecimiento y productividad del tomate (Lycopersicon esculentum Mill) bajo cultivo protegido en tres localidades de Costa Rica. Rev. Tecnol. Marcha 2012, 25, 3. [Google Scholar] [CrossRef] [Green Version]
  11. Villagran, E.; Bojacá, C.; Akrami, M. Contribution to the sustainability of agricultural production in greenhouses built on slope soils: A numerical study of the microclimatic behavior of a typical Colombian structure. Sustainability 2021, 13, 4748. [Google Scholar] [CrossRef]
  12. Akrami, M.; Javadi, A.A.; Hassanein, M.J.; Farmani, R.; Dibaj, M.; Tabor, G.R.; Negm, A. Study of the effects of vent configuration on mono-span greenhouse ventilation using computational fluid dynamics. Sustainability 2020, 12, 986. [Google Scholar] [CrossRef] [Green Version]
  13. Villagran Munar, E.A.; Bojacá Aldana, C.R.; Rojas Bahamon, N.A. Determination of the thermal behavior of a Colombian spatial greenhouse through computational fluid dynamics. Rev. UDCA Actual. Divulg. Cient. 2018, 21, 415–426. [Google Scholar]
  14. McCartney, L.; Lefsrud, M.G. Field trials of the natural ventilation augmented cooling (NVAC) greenhouse. Biosyst. Eng. 2018, 174, 159–172. [Google Scholar] [CrossRef]
  15. He, X.; Wang, J.; Guo, S.; Zhang, J.; Wei, B.; Sun, J.; Shu, S. Ventilation optimization of solar greenhouse with removable back walls based on CFD. Comput. Electron. Agric. 2018, 149, 16–25. [Google Scholar] [CrossRef]
  16. Espejel Trujano, D.; López Cruz, I.L. Determinación de las tasas de ventilación natural en un invernadero mediante modelos teóricos y gases trazadores. Rev. Mex. Cienc. Agríc. 2013, 4, 185–198. [Google Scholar]
  17. Villagrán-Munar, E.A.; Bojacá-Aldana, C.R.; Acuña-Caita, J.F. Diseño Y Evaluación Climatica de un Invernadero Para Condiciones de Clima Intertropical de Montaña. Master’s Thesis, Facultad de Ingeniería, Departamento de Ingeniería Agrícola, Universidad Nacional de Colombia, Bogotá, Colombia, 2016. Available online: https://repositorio.unal.edu.co/bitstream/handle/unal/56572/1072644298.2016.pdf?sequence=1&isAllowed=y (accessed on 1 May 2021).
  18. López, A.; Valera, D.L.; Molina-Aiz, F. Sonic anemometry to measure natural ventilation in greenhouses. Sensors 2011, 11, 9820–9838. [Google Scholar] [CrossRef] [PubMed]
  19. Molina-Aiz, F.D.; Norton, T.; López, A.; Reyes-Rosas, A.; Moreno, M.A.; Marín, P.; Espinoza, K.; Valera, D.L. Using computational fluid dynamics to analyse the CO2 transfer in naturally ventilated greenhouses. Acta Hortic. 2017, 1182, 283–292. [Google Scholar] [CrossRef]
  20. De Pedro, L.F. Invernaderos en Regiones Tropicales Y Sub-Tropicales Balance de Energía, Diseño Y Manejo del Ambiente Físico. Master’s Thesis, Universidad Nacional de Formosa en convenio con el Gobierno de la Provincia—Instituto Universitario de Formosa, Laguna Blanca, Argentina, 2015. Available online: https://bibliotecavirtual.unl.edu.ar:8443/ (accessed on 23 March 2021).
  21. Arellano-García, M.; Marco, A.; Valera-Martínez, D.L.; Urrestarazu-Gavilán, A.; Murguía-López, M.R.; Zermeño-González, J. Ventilación natural Y forzada de invernaderos tipo Almería Y su relación con el rendimiento de tomate. Terra Latinoam. 2011, 29, 379–386. [Google Scholar]
  22. Espinoza, K.; López, A.; Valera, D.L.; Molina-Aiz, F.D.; Torres, J.A.; Peña, A. Effects of ventilator configuration on the flow pattern of a naturally-ventilated three-span Mediterranean greenhouse. Biosyst. Eng. 2017, 164, 13–30. [Google Scholar] [CrossRef]
  23. Bojacá, C.R.; Villagrán, E.A. Diseño, construcción y evaluación de un invernadero para el cultivo de flores de corte en las condiciones del occidente de la Sabana de Bogotá. In Productos Relevantes del Proyecto Fortalecimiento de la Competitividad del Sector Floricultor Colombiano Mediante el uso de Ciencia, Tecnología e Innovación Aplicadas en Cundinamarca; Ediciones Unisalle: Bogota, Colombia, 2021; Volume 1, pp. 12–45. [Google Scholar] [CrossRef]
  24. Ruiz-García, A.; López-Cruz, I.L.; Arteaga-Ramírez, R.; Ramírez-Arias, J.A. Tasas de ventilación natural de un invernadero del centro de México estimadas mediante balance de energía. Agrociencia 2015, 49, 87–100. [Google Scholar]
  25. Morris, L.G.; Neale, F.E. Engineering, Infrared Carbon Dioxide Gas Analyser and Its Use in Glasshouse Research; National Institute of Agricultural Engineering: City of York, UK, 1954. [Google Scholar]
  26. Boulard, T.; Kittas, C.; Roy, J.C.; Wang, S. Convective and ventilation transfers in greenhouses, part 2: Determination of the distributed greenhouse climate. Biosyst. Eng. 2002, 83, 129–147. [Google Scholar] [CrossRef] [Green Version]
  27. Boulard, T.; Meneses, J.F.; Mermier, M.; Papadakis, G. The mechanisms involved in the natural ventilation of greenhouses. Agric. For. Meteorol. 1996, 79, 31–77. [Google Scholar] [CrossRef]
  28. Baptista, F.J.; Bailey, B.J.; Randall, J.M.; Meneses, J.F. Greenhouse ventilation rate: Theory and measurement with tracer gas techniques. J. Agric. Eng. Res. 1999, 72, 363–374. [Google Scholar] [CrossRef] [Green Version]
  29. Villagrán, E.A.; Baeza Romero, E.J.; Bojacá, C.R. Transient CFD analysis of the natural ventilation of three types of greenhouses used for agricultural production in a tropical mountain climate. Biosyst. Eng. 2019, 188, 288–304. [Google Scholar] [CrossRef]
  30. Flores-Velázquez, J.; Mejía-Saenz, E.; Montero-Camacho, J.I.; Rojano, A. Analísis nuḿrico del clima interior en un invernadero de tres naves con ventilacín mećnica. Agrociencia 2011, 45, 545–560. [Google Scholar]
  31. Akrami, M.; Mutlum, C.D.; Javadi, A.A.; Salah, A.H.; Fath, H.E.S.; Dibaj, M.; Farmani, R.; Mohammed, R.H.; Negm, A. Analysis of inlet configurations on the microclimate conditions of a novel standalone agricultural greenhouse for egypt using computational fluid dynamics. Sustainability 2021, 13, 1446. [Google Scholar] [CrossRef]
  32. Benni, S.; Santolini, E.; Barbaresi, A.; Torreggiani, D.; Tassinari, P. Calibration and comparison of different CFD approaches for airflow analysis in a glass greenhouse. J. Agric. Eng. 2017, 48, 49–52. [Google Scholar] [CrossRef] [Green Version]
  33. Fidaros, D.K.; Baxevanou, C.A.; Bartzanas, T.; Kittas, C. Numerical simulation of thermal behavior of a ventilated arc greenhouse during a solar day. Renew. Energy 2010, 35, 1380–1386. [Google Scholar] [CrossRef]
  34. Perén, J.I.; van Hooff, T.; Leite, B.C.C.; Blocken, B. CFD analysis of cross-ventilation of a generic isolated building with asymmetric opening positions: Impact of roof angle and opening location. Build. Environ. 2015, 85, 263–276. [Google Scholar] [CrossRef] [Green Version]
  35. Villagrán, E.A.; Gil, R.; Acuña, J.F.; Bojacá, C.R. Optimization of ventilation and its effect on the microclimate of a colombian multispan greenhouse. Agron. Colomb. 2012, 30, 282–288. [Google Scholar]
  36. Baeza, E.J.; Pérez-Parra, J.J.; Montero, J.I.; Bailey, B.J.; López, J.C.; Gázquez, J.C. Analysis of the role of sidewall vents on buoyancy-driven natural ventilation in parral-type greenhouses with and without insect screens using computational fluid dynamics. Biosyst. Eng. 2009, 104, 86–96. [Google Scholar] [CrossRef]
  37. Villagran Munar, E.A.; Bojaca Aldana, C.R. Study of natural ventilation in a Gothic multi-tunnel greenhouse designed to produce rose (Rosa spp.) in the high-Andean tropic. Ornam. Hortic. 2019, 25, 133–143. [Google Scholar] [CrossRef] [Green Version]
  38. Flores-Velázquez, J.; López-Cruz, I.L.; Mejía-Sáenz, E.; Montero-Camacho, J.I. Evaluación del desempeño climático de un invernadero baticenital del centro de México mediante dinámica de fluidos computacional (CFD). Agrociencia 2014, 48, 131–146. [Google Scholar]
  39. Fragos, V.P.; Kateris, D.; Ntinas, G.K.; Firfiris, V.; Kotsopoulos, T.A. Investigation of ventilation opening positions effect on the airflow inside and outside of a greenhouse. Acta Hortic. 2017, 1170, 151–157. [Google Scholar] [CrossRef]
  40. Briceño-Medina, L.Y.; Ávila-Marroquín, M.V.; Jaimez-Arellano, R.E. Simicroc: Modelo de simulación del microclima de un invernadero. Agrociencia 2011, 45, 801–813. [Google Scholar]
  41. Bournet, P.E.; Boulard, T. Effect of ventilator configuration on the distributed climate of greenhouses: A review of experimental and CFD studies. Comput. Electron. Agric. 2010, 74, 195–217. [Google Scholar] [CrossRef]
  42. Bournet, P.E.; Chassériaux, G.; Winiarek, V. Simulation of energy transfers in a partitioned glasshouse during daytime using a Bi-band radiation model. Acta Hortic. 2006, 719, 357–364. [Google Scholar] [CrossRef]
  43. Li, H.; Li, Y.; Yue, X.; Liu, X.; Tian, S.; Li, T. Evaluation of airflow pattern and thermal behavior of the arched greenhouses with designed roof ventilation scenarios using CFD simulation. PLoS ONE 2020, 15, e0239851. [Google Scholar] [CrossRef]
  44. Molina-Aiz, F.D.; Valera, D.L.; Peña, A.A.; Álvarez, A.J.; Gil, J.A. Analysis of the effect of rollup vent arrangement and wind speed on Almería-type greenhouse ventilation performance using computational fluid dynamics. Acta Hortic. 2006, 719, 173–180. [Google Scholar] [CrossRef]
  45. Teitel, M.; Garcia-Teruel, M.; Ibanez, P.F.; Tanny, J.; Laufer, S.; Levi, A.; Antler, A. Airflow characteristics and patterns in screenhouses covered with fine-mesh screens with either roof or roof and side ventilation. Biosyst. Eng. 2015, 131, 1–14. [Google Scholar] [CrossRef]
  46. Romero-Gómez, P.; Choi, C.Y.; López-Cruz, I.L. Mejora de las tasas de ventilación de invernaderos bajo condiciones climáticas del centro de México. Agrociencia 2010, 44, 1–15. [Google Scholar]
  47. Villagrán, E.A.; Jaramillo, J.E.; León-Pacheco, R.I. Natural ventilation in greenhouse with anti-insect screens evaluated with a computational fluid model. Agron. Mesoamerican 2020, 31, 689–717. [Google Scholar] [CrossRef]
  48. Zhang, Y.; Yasutake, D.; Hidaka, K.; Kitano, M.; Okayasu, T. CFD analysis for evaluating and optimizing spatial distribution of CO2 concentration in a strawberry greenhouse under different CO2 enrichment methods. Comput. Electron. Agric. 2020, 179, 105811. [Google Scholar] [CrossRef]
  49. Pakari, A.; Ghani, S. Airflow assessment in a naturally ventilated greenhouse equipped with wind towers: Numerical simulation and wind tunnel experiments. Energy Build. 2019, 199, 1–11. [Google Scholar] [CrossRef]
  50. Saberian, A.; Sajadiye, S.M. The effect of dynamic solar heat load on the greenhouse microclimate using CFD simulation. Renew. Energy 2019, 138, 722–737. [Google Scholar] [CrossRef]
  51. Aguilar-Rodriguez, C.E.; Flores-Velazquez, J.; Ojeda-Bustamante, W.; Rojano, F.; Iñiguez-Covarrubias, M. Valuation of the energy performance of a greenhouse with an electric heater using numerical simulations. Processes 2020, 8, 600. [Google Scholar] [CrossRef]
  52. Guo, J.; Liu, Y.; Lü, E. Numerical simulation of temperature decrease in greenhouses with summer water-sprinkling roof. Energies 2019, 12, 2435. [Google Scholar] [CrossRef] [Green Version]
  53. Bouhoun Ali, H.; Bournet, P.E.; Cannavo, P.; Chantoiseau, E. Development of a CFD crop submodel for simulating microclimate and transpiration of ornamental plants grown in a greenhouse under water restriction. Comput. Electron. Agric. 2018, 149, 26–40. [Google Scholar] [CrossRef]
  54. Li, K.; Xue, W.; Mao, H.; Chen, X.; Jiang, H.; Tan, G. Optimizing the 3D Distributed Climate inside Greenhouses Using Multi-Objective Optimization Algorithms and Computer Fluid Dynamics. Energies 2019, 12, 2873. [Google Scholar] [CrossRef] [Green Version]
  55. Chen, J.; Xu, F.; Tan, D.; Shen, Z.; Zhang, L.; Ai, Q. A control method for agricultural greenhouses heating based on computational fluid dynamics and energy prediction model. Appl. Energy 2015, 141, 106–118. [Google Scholar] [CrossRef]
  56. Fatnassi, H.; Boulard, T.; Ben Amara, H.; Roy, J.C.; Suay, R.; Poncet, C. Increasing the height and multiplying the number of spans of greenhouse: How far can we go? Acta Hortic. 2017, 1170, 137–143. [Google Scholar] [CrossRef]
  57. Kim, R.; Kim, J.; Lee, I.; Yeo, U.; Lee, S.; Decano-Valentin, C. Development of three-dimensional visualisation technology of the aerodynamic environment in a greenhouse using CFD and VR technology, part 1: Development of VR a database using CFD. Biosyst. Eng. 2021, 207, 33–58. [Google Scholar] [CrossRef]
  58. Kim, R.; Kim, J.; Lee, I.; Yeo, U.; Lee, S.; Decano-Valentin, C. Development of three-dimensional visualisation technology of the aerodynamic environment in a greenhouse using CFD and VR technology, part 2: Development of an educational VR simulator. Biosyst. Eng. 2021, 207, 12–32. [Google Scholar] [CrossRef]
  59. Villagrán, E.; Flores-Velazquez, J.; Bojacá, C.; Akrami, M. Evaluation of the microclimate in a traditional Colombian greenhouse used for cut flower production. Agronomy 2021, 11, 1330. [Google Scholar] [CrossRef]
  60. van Eck, N.J.; Waltman, L. Citation-based clustering of publications using CitNetExplorer and VOSviewer. Scientometrics 2017, 111, 1053–1070. [Google Scholar] [CrossRef] [PubMed] [Green Version]
  61. Pico-Saltos, R.; Carrión-Mero, P.; Montalván-Burbano, N.; Garzás, J.; Redchuk, A. Research trends in career success: A bibliometric review. Sustainability 2021, 19, 4625. [Google Scholar] [CrossRef]
  62. Montalván-Burbano, N.; Pérez-Valls, M.; Plaza-Úbeda, J. Analysis of scientific production on organizational innovation. Cogent Bus. Manag. 2020, 7, 1745043. [Google Scholar] [CrossRef]
  63. Michán Aguirre, L. Cienciometría, información e informática en ciencias biológicas: Enfoque interdisciplinario para estudiar interdisciplinas. J. Philos. Life Sci. 2011, 19, 239–243. [Google Scholar]
  64. Tarrío-Saavedra, J.; Orois, E.; Naya, S. Estudio métrico sobre la actividad investigadora usando el software libre R: El caso del sistema universitario gallego. Investig. Bibl. 2017, 2017, 221–247. [Google Scholar] [CrossRef] [Green Version]
  65. Cervantes Rendón, E.; Garza Almanza, V. La cienciometría como herramienta para analizar el impacto de la investigación científica en una región. Cult. Cient. Y Tecnol. 2012, 9, 41–49. [Google Scholar]
  66. Aznar-Sánchez, J.A.; Velasco-Muñoz, J.F.; López-Felices, B.; Román-Sánchez, I.M. An analysis of global research trends on greenhouse technology: Towards a sustainable agriculture. Int. J. Environ. Res. Public Health 2020, 17, 664. [Google Scholar] [CrossRef] [Green Version]
  67. dos Santo, R.C.; Sell, D.; Steil, A.V.; Ceci, F.; Fernandes, V.; Andreoli, C.V. A revista engenharia sanitária e ambiental no sistema Brasileiro de ciência, Tecnologia e inovação. Eng. Sanit. Ambient. 2015, 20, 1–16. [Google Scholar] [CrossRef] [Green Version]
  68. Paz-Enrique, L.E.; Hernandez-Alfonso, E.A. Estudio de productividad científica internacional de la temática Caña de Azúcar relacionada con Química Aplicada. Tecnol. Química 2015, 35, 295–307. [Google Scholar]
  69. Speroni, R.D.M.; Dandolini, G.A.; Souza, J.A.; Gauthier, F.A.O. Estado da arte da produção científica sobre indicadores e índices de inovação. Rev. Adm. Innov. 2015, 12, 49. [Google Scholar] [CrossRef] [Green Version]
  70. López-Illescas, C.; de Moya-Anegón, F.; Moed, H.F. Coverage and citation impact of oncological journals in the Web of Science and Scopus. J. Informetr. 2008, 2, 304–316. [Google Scholar] [CrossRef]
  71. Aria, M.; Cuccurullo, C. bibliometrix: An R-tool for comprehensive science mapping analysis. J. Informetr. 2017, 11, 959–975. [Google Scholar] [CrossRef]
  72. Payán-Sánchez, B.; Belmonte-Ureña, L.J.; Plaza-úbeda, J.A.; Vazquez-Brust, D.; Yakovleva, N.; Pérez-Valls, M. Open innovation for sustainability or not: Literature reviews of global research trends. Sustainability 2021, 13, 1136. [Google Scholar] [CrossRef]
  73. Roldan-Valadez, E.; Salazar-Ruiz, S.Y.; Ibarra-Contreras, R.; Rios, C. Current concepts on bibliometrics: A brief review about impact factor, Eigenfactor score, cite score, SCI mago journal rank, source-Normalised impact per paper, H-index, and alternative metrics. Ir. J. Med. Sci. 2019, 188, 939–951. [Google Scholar] [CrossRef] [PubMed]
  74. Hou, Y.; Li, A.; Li, Y.; Jin, D.; Tian, Y.; Zhang, D.; Wu, D.; Zhang, L.; Lei, W. Analysis of microclimate characteristics in solar greenhouses under natural ventilation. Build. Simul. 2021, 14, 1811–1821. [Google Scholar] [CrossRef]
  75. Villagran Munar, E.A.; Bojacá Aldana, C.R.; Rojas Bahamon, N.A. Determinación del comportamiento térmico de un invernadero espacial colombiano mediante dinámica de fluidos computacional. Rev. UDCA Actual. Divulg. Cient. 2018, 21, 415–426. [Google Scholar] [CrossRef]
  76. Villagrán-Munar, E.A.; Gil, R.; Acuña-Caita, J.F.; Bojacá-Aldana, C.R. Optimización de la ventilación y su efecto en el microclima de un invernadero multitúnel colombiano. Agron. Colomb. 2012, 30, 282–288. [Google Scholar]
  77. Villagrán-Munar, E.A.; Bojacá-Aldana, C.R. Determinación del comportamiento térmico de un invernadero colgante colombiano aplicando simulación CFD. Rev. Ciencias Técnicas Agropecu. 2019, 28. [Google Scholar]
  78. Gil, R.; Bojacá-Aldana, C.R.; Casilimas, H.; Schrevens, E.; Suay, R. Assessment of sidewall and roof vents opening configurations to improve airflow inside greenhouses. Acta Hortic. 2012, 952, 141–146. [Google Scholar] [CrossRef]
  79. Villagrán-Munar, E.A.; Bojacá-Aldana, C.R. Study using a CFD approach of the efficiency of a roof ventilation closure system in a multi-tunnel greenhouse for nighttime microclimate optimization. Rev. Ceres 2020, 67, 345–356. [Google Scholar] [CrossRef]
  80. Klancoowat, W.; Chaiyat, N.; Nathewet, P. Wastewater recovery of air conditioning for indoor cannabis production. In Proceedings of the 15th National and International Sripatum University Conference 2020, Bangkok, Thailand, 18 December 2020. [Google Scholar]
  81. Saavedra, M.; Ricardo, K. Requerimientos Agronómicos Para Un Modelo Productivo De Cannabis En La Provincia Del Sumapaz. Bachelor’s Thesis, Facultad de Ciencias Agropecuarias Ingeniería Agronómica University of Cundinamarca, Fusagasugá, Colombia, 2021. [Google Scholar]
  82. Villagran, E. Two-dimensional numerical study of the microclimate generated in three screenhouses for the climatic conditions of the colombian caribbean. Int. J. Heat Technol. 2021, 39, 460–468. [Google Scholar] [CrossRef]
  83. Espinal-Montes, V.; López-Cruz, I.; Rojano-Aguilar, A.; Romantchik-Kriuchova, E.; Ramírez-Arias, A. Determinación de los gradientes térmicos nocturnos en un invernadero usando dinámica de fluidos computacional. Agrociencia 2015, 49, 233–247. [Google Scholar]
  84. Flores-Velázquez, J. Dinamica de fluidos computacional (CFD) para modelar Y optimizar el ambiente de un invernadero. Comeii 2017, 485, 1–11. [Google Scholar]
  85. Valdez-Torres, J.B.; Soto-Landeros, F.; Osuna-Enciso, T.; Báez-Sañudo, M.A. Modelos de predicción fenológica para maíz blanco (Zea mays L.) y gusano cogollero (Spodoptera frugiperda J. E. Smith). Agrociencia 2012, 46, 399–410. [Google Scholar]
  86. Gutiérrez, J.K.R.; Velasco, N.Y.G. Redes de coautoría como herramienta de evaluación de la producción científica de los grupos de investigación. Rev. Gen. Inf. Y Doc. 2017, 27, 279. [Google Scholar]
  87. Velden, T.; Haque, A.; Lagoze, C. A new approach to analyzing patterns of collaboration in co-authorship networks: Mesoscopic analysis and interpretation. Scientometrics 2010, 85, 219–242. [Google Scholar] [CrossRef] [Green Version]
  88. Herrera-Franco, G.; Montalván-Burbano, N.; Carrión-Mero, P.; Apolo-Masache, B.; Jaya-Montalvo, M. Research trends in geotourism: A bibliometric analysis using the scopus database. Geosciences 2020, 10, 379. [Google Scholar] [CrossRef]
  89. Carrión-Mero, P.; Montalván-Burbano, N.; Herrera-Narváez, G.; Morante-Carballo, F. Geodiversity and mining towards the development of geotourism: A global perspective. Int. J. Des. Nat. Ecodynamics 2021, 16, 191–201. [Google Scholar] [CrossRef]
  90. Piscia, D.; Montero, J.I.; Baeza, E.; Bailey, B.J. A CFD greenhouse night-time condensation model. Biosyst. Eng. 2012, 111, 141–154. [Google Scholar] [CrossRef]
  91. Molina-Aiz, F.D.; Fatnassi, H.; Boulard, T.; Roy, J.C.; Valera, D.L. Comparison of finite element and finite volume methods for simulation of natural ventilation in greenhouses. Comput. Electron. Agric. 2010, 72, 69–86. [Google Scholar] [CrossRef]
  92. Nebbali, R.; Roy, J.C.; Boulard, T. Dynamic simulation of the distributed radiative and convective climate within a cropped greenhouse. Renew. Energy 2012, 43, 111–129. [Google Scholar] [CrossRef]
  93. Tanny, J. Microclimate and evapotranspiration of crops covered by agricultural screens: A review. Biosyst. Eng. 2013, 114, 26–43. [Google Scholar] [CrossRef]
  94. Bartzanas, T.; Kacira, M.; Zhu, H.; Karmakar, S.; Tamimi, E.; Katsoulas, N.; Lee, I. Computational fluid dynamics applications to improve crop production systems. Comput. Electron. Agric. 2013, 93, 151–167. [Google Scholar] [CrossRef]
  95. Benni, S.; Tassinari, P.; Bonora, F.; Barbaresi, A.; Torreggiani, D. Efficacy of greenhouse natural ventilation: Environmental monitoring and CFD simulations of a study case. Energy Build. 2016, 125, 276–286. [Google Scholar] [CrossRef]
  96. Piscia, D.; Muñoz, P.; Panadès, C.; Montero, J.I. A method of coupling CFD and energy balance simulations to study humidity control in unheated greenhouses. Comput. Electron. Agric. 2015, 115, 129–141. [Google Scholar] [CrossRef]
  97. Aguilar-Rodríguez, C.E.; Flores-Velázquez, J. CFD simulation of heat and mass transfer for climate control in greenhouses. Heat Mass Transf.—Adv. Sci. Technol. Appl. 2019, 32, 1–11. [Google Scholar] [CrossRef] [Green Version]
  98. Baxevanou, C.A.; Fidaros, D.K.; Bartzanas, T.; Kittas, C. Numerical simulation of solar radiation, air flow and temperature distribution in a naturally ventilated tunnel greenhouse. Agric. Eng. Int. CIGR J. 2010, 12, 48–67. [Google Scholar]
  99. Villagrán-Munar, E.A.; Bojacá-Aldana, C.R. CFD simulation of the increase of the roof ventilation area in a traditional Colombian greenhouse: Effect on air flow patterns and thermal behavior. Int. J. Heat Technol. 2019, 37, 881–892. [Google Scholar] [CrossRef]
  100. Ghernaout, B.; Attia, M.E.; Bouabdallah, S.; Driss, Z.; Benali, M.L. Heat and fluid flow in an agricultural greenhouse. Int. J. Heat Technol. 2020, 38, 92–98. [Google Scholar] [CrossRef]
  101. Pontikakos, C.; Ferentinos, K.P.; Tsiligiridis, T.A.; Sideridis, A.B. Natural ventilation efficiency in a twin-span greenhouse using 3D computational fluid dynamics. In Proceedings of the Third International Conference on Information and Communication Technologies in Agriculture, Volos, Greece, 20–23 September 2006. [Google Scholar]
  102. Piscia, D.; Montero, J.I.; Bailey, B.; Muñoz, P.; Oliva, A. A new optimisation methodology used to study the effect of cover properties on night-time greenhouse climate. Biosyst. Eng. 2013, 116, 130–143. [Google Scholar] [CrossRef]
  103. Piscia, D.; Montero, J.I.; Flores-Velázquez, J. Predicting night-time condensation in a multi-span greenhouse using computational fluid dynamic simulations. Acta Hortic. 2012, 927, 627–634. [Google Scholar] [CrossRef]
  104. Mesmoudi, K.; Meguallati, K.H.; Bournet, P.E. Effect of the greenhouse design on the thermal behavior and microclimate distribution in greenhouses installed under semi-arid climate. Heat Transf. Asian Res. 2017, 46, 1294–1311. [Google Scholar] [CrossRef]
  105. Mesmoudi, K.; Meguellati, K.H.; Bournet, P.E. Thermal analysis of greenhouses installed under semi arid climate. Int. J. Heat Technol. 2017, 35, 474–486. [Google Scholar] [CrossRef] [Green Version]
  106. Hong, S.W.; Lee, I. Predictive model of micro-environment in a naturally ventilated greenhouse for a model-based control approach. Prot. Hortic. Plant Fact. 2014, 23, 181–191. [Google Scholar] [CrossRef]
  107. Montero, J.I.; Muñoz, P.; Sánchez-Guerrero, M.C.; Medrano, E.; Piscia, D.; Lorenzo, P. Shading screens for the improvement of the night-time climate of unheated greenhouses. Span. J. Agric. Res. 2013, 11, 32–46. [Google Scholar] [CrossRef] [Green Version]
  108. Ha, J.S.; Lee, I.; Kwon, K.; Ha, T. Analysis on internal airflow of a naturally ventilated greenhouse using wind tunnel and PIV for CFD validation. Prot. Hortic. Plant Fact. 2014, 23, 391–400. [Google Scholar] [CrossRef]
  109. Chu, C.R.; Lan, T.; Tasi, R.K.; Wu, T.R.; Yang, C.K. Wind-driven natural ventilation of greenhouses with vegetation. Biosyst. Eng. 2017, 164, 221–234. [Google Scholar] [CrossRef]
  110. Rico-García, R.; Soto-Zarazúa, G.M.; Alatorre-Jácome, O.; De la Torre-Gea, G.; Gomez-Melendez, D.J. Aerodynamic study of greenhouses using computational fluid dynamics. Int. J. Phys. Sci. 2011, 6, 6541–6547. [Google Scholar] [CrossRef]
  111. Bojacá, C.R.; Gil, R.; Villagrán, E. Ecofisiologia y manejo del cultivo. In Manual de Producción de Pepino Bajo Invernadero; Editorial Universidad Jorge Tadeo Lozano: Bogota, Colombia, 2012; Volume 1, pp. 1–210. [Google Scholar]
  112. Villagrán, E.A.; Bojacá, C.R. Determination of the thermal behavior of a Colombian hanging greenhouse applying CFD simulation. Rev. Ciencias Técnicas Agropecu. 2019, 28. [Google Scholar]
  113. Reynafarje, X.; Villagrán, E.A.; Bojacá, C.R.; Gil, R.; Schrevens, E. Simulation and validation of the airflow inside a naturally ventilated greenhouse designed for tropical conditions. Acta Hortic. 2020, 1271, 55–62. [Google Scholar] [CrossRef]
  114. Aich, W.; Kolsi, L.; Borjini, M.N.; Al-Rashed, A.; Ben Aissia, H.; Oztop, H.F.; Abu-Hamdeh, N. Three-dimensional computational fluid dynamics analysis of buoyancy-driven natural ventilation and entropy generation in a prismatic greenhouse. Therm. Sci. 2018, 22, 73–85. [Google Scholar] [CrossRef]
  115. López-Bautista, V.; Villaseñor-Perea, C.A.; López-Canteñs, G.D.J.; Carrillo-García, M.; Cervantes-Osornio, R. Análisis de coeficientes de la fuerza del viento y comportamiento del flujo sobre un modelo de invernadero. Rev. Mex. Cienc. Agríc. 2016, 7, 821–832. [Google Scholar] [CrossRef] [Green Version]
  116. Maher, D.; Sami, A.; Hana, A. CFD modelling of air temperature distribution inside tunnel greenhouse in semi-arid region. Int. J. Eng. Syst. Model. Simul. 2018, 10, 112–124. [Google Scholar] [CrossRef]
  117. Rasheed, A.; Lee, J.W.; Kim, H.T.; Lee, H.W. Efficiency of different roof vent designs on natural ventilation of single-span plastic greenhouse. Prot. Hortic. Plant Fact. 2019, 28, 225–233. [Google Scholar] [CrossRef]
  118. Lalmi, D.; Benseddik, A.; Bensaha, H.; Bouzaher, M.T.; Arrif, T.; Guermoui, M.; Rabehi, A. Evaluation and estimation of the inside greenhouse temperature, numerical study with thermal and optical aspect. Int. J. Ambient Energy 2019, 42, 1269–1280. [Google Scholar] [CrossRef]
  119. Nebbali, R.; Roy, J.C.; Boulard, T. Climate dynamic simulations of a cropped greenhouse tunnel. Acta Hortic. 2011, 893, 581–588. [Google Scholar] [CrossRef]
  120. Bartzanas, T.; Fidaros, D.K.; Boulard, T.; Katsoulas, N.; Kittas, C. Experimental results and spatial simulation of climate in a greenhouse with insect screens. Acta Hortic. 2011, 893, 597–604. [Google Scholar] [CrossRef]
  121. Montaño-Rodríguez, S.; Villagrán-Munar, E.A.; Osorio-Fiaga3, D.F.; Bojacá-Aldana, C.R.; Velásquez-Vargas, W.L. Simulación numérica del comportamiento térmico de un macro túnel utilizado para la producción de hongos comestibles bajo condiciones de clima tropical. Rev. Tecnol. Marcha 2019, 32, 78–85. [Google Scholar] [CrossRef]
  122. Flores-Velázquez, J. Análisis del Clima en Los Principales Modelos de Invernaderos en México (Malla Sombra, Multitúnel Y Baticenital) Mediante la Técnica del CFD (Computational Fluid Dynamics). Ph.D. Thesis, Universidad de Almeria, Almeria, Spain, 2010. [Google Scholar]
  123. Chu, C.R.; Lan, T.W. Effectiveness of ridge vent to wind-driven natural ventilation in monoslope multi-span greenhouses. Biosyst. Eng. 2019, 186, 279–292. [Google Scholar] [CrossRef]
  124. Villagrán-Munar, E.A.; Bojacá-Aldana, C.R. Microclimate I simulation in a greenhouse used for roses production under conditions of intertropical climate. Chil. J. Agric. Anim. Sci. 2019, 35, 137–150. [Google Scholar] [CrossRef]
  125. Villagran, E.A.; Matarrita, R.R.; Noreña, J.E.J. Comportamiento microclimático diurno, en temporada seca, de tres estructuras para agricultura protegida en el trópico seco. UNED Res. J. 2020, 12, e2854. [Google Scholar] [CrossRef]
  126. Lee, S.; Lee, I.; Kim, R. Evaluation of wind-driven natural ventilation of single-span greenhouses built on reclaimed coastal land. Biosyst. Eng. 2018, 171, 120–142. [Google Scholar] [CrossRef]
  127. He, K.; Chen, D.; Sun, L.; Huang, Z.; Liu, Z. Analysis of the climate inside multi-span plastic greenhouses under different shade strategies and wind regimes. Korean J. Hortic. Sci. Technol. 2014, 32, 473–483. [Google Scholar] [CrossRef] [Green Version]
  128. He, K.; Chen, D.; Sun, L.; Liu, Z.; Huang, Z. The effect of vent openings on the microclimate inside multi-span greenhouses during summer and winter seasons. Eng. Appl. Comput. Fluid Mech. 2015, 9, 399–410. [Google Scholar] [CrossRef]
  129. Vieira-Neto, J.G.; Soriano, J. Computational modelling applied to predict the pressure coefficients in deformed single arch-shape greenhouses. Biosyst. Eng. 2020, 200, 231–245. [Google Scholar] [CrossRef]
  130. Argüelles Castillo, L.A.; Rico-García, E. Invernadero Hibrido Malla-Sombra Para el Control de Temperatura con Ventilación Natural. Master’s Thesis, Universidad Autónoma de Querétaro, Querétaro, Mexico, 2015. [Google Scholar]
  131. Fitz-Rodrıguez, E.; López-Cruz, I.L.; Salazar-Moreno, R.; Rojano-Aguilar, A.; Rosales-Vicelis, J.E.; López-Dıáz, J.H. Analysis of air-temperature profile in a solar-heated greenhouse with computational fluid dynamics. Acta Hortic. 2018, 1227, 93–98. [Google Scholar] [CrossRef]
  132. Da Silva, R.C.; Cordeiro Júnior, J.J.F.; Pandorfi, H.; Vigoderis, R.B.; Guiselini, C. Simulation of ventilation systems in a protected environment using computational fluid dynamics. Eng. Agric. 2017, 37, 414–425. [Google Scholar] [CrossRef]
  133. Taloub, D.; Bouras, A.; Driss, Z. Effect of the soil inclination on natural convection in half-elliptical greenhouses. Int. J. Eng. Res. Africa 2020, 50, 70–78. [Google Scholar] [CrossRef]
  134. Piscia, D.; Montero, J.I.; Melé, M.; Flores-Velázquez, J.; Pérez-Parra, J.; Baeza, E.J. A CFD model to study above roof shade and on roof shade of greenhouses. Acta Hortic. 2012, 952, 133–140. [Google Scholar] [CrossRef]
  135. Baxevanou, C.; Fidaros, D.; Bartzanas, T.; Kittas, C. Yearly numerical evaluation of greenhouse cover materials. Comput. Electron. Agric. 2017, 149, 54–70. [Google Scholar] [CrossRef]
  136. Ziapour, B.M.; Dehnavi, R. A numerical study of the arc-roof and the one-sided roof enclosures based on the entropy generation minimization. Comput. Math. Appl. 2012, 64, 1636–1648. [Google Scholar] [CrossRef] [Green Version]
  137. Moghaddam, J.J. The effect of turbulence on natural ventilation of a proposed octagonal greenhouse in a transient flow. Int. J. Environ. Sci. Technol. 2020, 18, 2181–2196. [Google Scholar] [CrossRef]
  138. Gomez-Mataix, G.; Montero, J.I.; Raya, V.; Suay, R. Benchmark study of the distance between greenhouses and its effect on wind driven ventilation. Acta Hortic. 2013, 1008, 207–212. [Google Scholar] [CrossRef]
  139. Cemek, B.; Atiş, A.; Küçüktopçu, E. Evaluation of temperature distribution in different greenhouse models using computational fluid dynamics (CFD). Anadolu J. Agric. Sci. 2017, 32, 54–63. [Google Scholar] [CrossRef] [Green Version]
  140. Baeza, E.J.; Pérez-Parra, J.; Lopez, J.C.; Kacira, M.; Gázquez, J.C.; Montero, J.I. Validation of CFD simulations for three dimensional temperature distributions of a naturally ventilated multispan greenhouse obtained by wind tunnel measurements. Acta Hortic. 2011, 893, 571–580. [Google Scholar] [CrossRef]
  141. De La Torre-Gea, G.; Delfín-Santisteban, O.; Torres-Pacheco, I.; Soto-Zarazúa, G.; Guevara-González, R.; Rico-García, E. Bayesian networks applied in a CFD model of the crop in greenhouse. Agrociencia 2014, 48, 307–319. [Google Scholar]
  142. Limtrakarn, W.; Boonmongkol, P.; Chompupoung, A.; Rungprateepthaworn, K.; Kruenate, J.; Dechaumphai, P. Computational fluid dynamics modeling to improve natural flow rate and sweet pepper productivity in greenhouse. Adv. Mech. Eng. 2012, 4, 1–7. [Google Scholar] [CrossRef] [Green Version]
  143. Villagrán-Munar, E.A.; Bojacá-Aldana, C.R. Numerical evaluation of passive strategies for nocturnal climate optimization in a greenhouse designed for rose production (Rosa spp.). Ornam. Hortic. 2019, 25, 351–364. [Google Scholar] [CrossRef] [Green Version]
  144. De la Torre-Gea, G. Modelación del Flujo de Aire Mediante Dinámica de Fluidos Computacionales en Invernaderos con Ventilación Natural. Ph.D. Thesis, Universidad Autonoma de Queretano, Queretano, Mexico, 2013. [Google Scholar]
  145. Kwon, J.K.; Lee, S.H.; Seong, J.H.; Moon, J.P.; Lee, S.J.; Choi, B.M.; Kim, K.J. Analysis of natural ventilation characteristics of venlo-type greenhouse with continuous roof vents. J. Biosyst. Eng. 2011, 36, 444–452. [Google Scholar] [CrossRef] [Green Version]
  146. Errais, R.; Senhaji, A.; Mouqallid, M.; Bekkaoui, A.; ElFellah, Y.; Majdoubi, H.; Fatnassi, H.; Guissi, K.; Maliani, D.O. Computational fluid dynamic time evolution of crop transpiration and heat transfer inside a Venlo greenhouse. Acta Hortic. 2020, 1296, 167–176. [Google Scholar] [CrossRef]
  147. Mesmoudi, K.; Meguellati, K.H.; Bournet, P.E.; Serir, L. Numerical prediction of thermal environment and energy consumption of three different greenhouses under hot and semi-arid climate. Acta Hortic. 2017, 1170, 79–86. [Google Scholar] [CrossRef]
  148. Lee, S.Y.; Lee, I.B.; Kwon, K.S.; Ha, T.H.; Yeo, U.H.; Park, S.J.; Kim, R.W.; Jo, Y.S.; Lee, S.N. Analysis of natural ventilation rates of venlo-type greenhouse built on reclaimed lands using CFD. J. Korean Soc. Agric. Eng. 2015, 57, 21–33. [Google Scholar] [CrossRef]
  149. Santolini, E.; Pulvirenti, B.; Benni, S.; Barbaresi, L.; Torreggiani, D.; Tassinari, P. Numerical study of wind-driven natural ventilation in a greenhouse with screens. Comput. Electron. Agric. 2018, 149, 41–53. [Google Scholar] [CrossRef]
  150. Kruger, S.; Pretorius, L. The Effect of bench arrangements on the natural ventilation of a multispan greenhouse. In Proceedings of the ASME 2013 International Mechanical Engineering Congress and Exposition, San Diego, CA, USA, 15–21 November 2013; pp. 1–10. [Google Scholar]
  151. Kruger, S.; Pretorius, L. An assessment of different boundary conditions in a naturally ventilated venlo-type greenhouse. In Proceedings of the 14th International Heat Transfer Conference, Washington, DC, USA, 8–13 August 2010; Volume 8, pp. 1–9. [Google Scholar] [CrossRef]
  152. Tezcan, A.; Buyuktas, K. Determining of climatic parameters using CFD in different window span in naturally ventilated greenhouses. J. Basic Appl. Sci. 2013, 9, 178–186. [Google Scholar] [CrossRef]
  153. Li, Y.; Sun, G.; Wang, X. Temperature field-wind velocity field optimum control of greenhouse environment based on CFD model. Math. Probl. Eng. 2014, 2014, 949128. [Google Scholar] [CrossRef] [Green Version]
  154. Flores-Velázquez, J.; Vega-García, M. Regional management of the environment in a zenith greenhouse with computational fluid dynamics (CFD). Ing. Agríc. Y Biosist. 2019, 11, 3–20. [Google Scholar] [CrossRef]
  155. Flores-Velázquez, J.; Villarreal-Guerrero, F.; Rojano-Aguilar, A.; Rojano, F. Greenhouse air dynamics in foliage. Acta Hortic. 2014, 1037, 1035–1042. [Google Scholar] [CrossRef]
  156. Aguilar-Rodríguez, C.E.; Flores-Velázquez, J.; Rojano-Aguilar, A.; Ojeda-Bustamante, W.; Iñiguez-Covarrubias, M. Tomato (Solanum lycopersicum L.) crop cycle estimation in greenhouse, based on degree day heat (GDC) simulated in CFD. Tecnol. Y Cienc. Agua 2020, 11, 27–57. [Google Scholar] [CrossRef]
  157. Senhaji, A.; Mouqallid, M.; Majdoubi, H. CFD assisted study of multi-chapels greenhouse vents openings effect on inside airflow circulation and microclimate patterns. Open J. Fluid Dyn. 2019, 9, 119–139. [Google Scholar] [CrossRef] [Green Version]
  158. Rojano, F.; Flores-Velázquez, J.; Villarreal-Guerrero, F.; Rojano, A. Dynamics of climatic conditions in a greenhouse: Two locations in Mexico. Acta Hortic. 2014, 1037, 955–962. [Google Scholar] [CrossRef]
  159. Flores-Velázquez, J.; Ojeda-Bustamante, W.; Villarreal-Guerrero, F.; Rojano-Aguilar, A. Effect of crops on natural ventilation in a screenhouse evaluated by CFD simulations. Acta Hortic. 2017, 1170, 95–101. [Google Scholar] [CrossRef]
  160. Flores-Velazquez, J.; Arzeta, A.; Ojeda, W.; Villarreal-Guerrero, F. Computational fluid dynamics analysis of the wind drag force in a typical Mexican screenhouse. Acta Hortic. 2018, 1227, 99–106. [Google Scholar] [CrossRef]
  161. Flores-Velázquez, J.; Villarreal-Guerrero, F.; López-Cruz, I.L.; Montero-Camacho, J.I.; Piscia, D. 3-Dimensional thermal analysis of a screenhouse with plane and multispan roof by using computational fluid dynamics (CFD). Acta Hortic. 2013, 1008, 151–158. [Google Scholar] [CrossRef]
  162. Villagran, E.; Ramirez, R.; Rodriguez, A.; Pacheco, R.L.; Jaramillo, J. Simulation of the thermal and aerodynamic behavior of an established screenhouse under warm tropical climate conditions: A numerical approach. Int. J. Sustain. Dev. Plan. 2020, 15, 487–499. [Google Scholar] [CrossRef]
  163. Teitel, M.; Wenger, E. The effect of screenhouse roof shape on the flow patterns—CFD simulations. Acta Hortic. 2012, 927, 603–610. [Google Scholar] [CrossRef]
  164. Villagrán-Munar, E.A.; Jaramillo, J.E. Microclimatic behavior of a screen house proposed for horticultural production in low-altitude tropical climate conditions. Comun. Sci. 2020, 11, 1–10. [Google Scholar] [CrossRef]
  165. Zhang, X.; Wang, H.; Zou, Z.; Wang, S. CFD and weighted entropy based simulation and optimisation of Chinese solar greenhouse temperature distribution. Biosyst. Eng. 2016, 142, 12–26. [Google Scholar] [CrossRef]
  166. Sun, Y.C.; Bao, E.C.; Zhu, C.M.; Yan, L.L.; Cao, Y.F.; Zhang, X.H.; Li, J.M.; Jing, H.W.; Zou, Z. Effects of window opening style on inside environment of solar greenhouse based on CFD simulation. Int. J. Agric. Biol. Eng. 2020, 13, 53–59. [Google Scholar] [CrossRef]
  167. Teitel, M.; Wenger, E. Air exchange and ventilation efficiencies of a monospan greenhouse with one inflow and one outflow through longitudinal side openings. Biosyst. Eng. 2014, 119, 98–107. [Google Scholar] [CrossRef]
  168. Wang, X.W.; Luo, J.Y.; Li, X.P. CFD based study of heterogeneous microclimate in a typical chinese greenhouse in central China. J. Integr. Agric. 2013, 12, 914–923. [Google Scholar] [CrossRef]
  169. Villagrán, E.A.; Bojacá, C.R. Effects of surrounding objects on the thermal performance of passively ventilated greenhouses. J. Agric. Eng. 2019, 50, 20–27. [Google Scholar] [CrossRef]
  170. Romdhonah, Y.; Suhardiyanto, H.; Erizal, E.; Saptomo, S. Analisis ventilasi alamiah pada greenhouse tipe standard peak menggunakan computational fluid dynamics. J. Ilm. Rekayasa Pertan. Biosist. 2015, 3, 170–178. [Google Scholar]
  171. Romdhonah, Y.; Suhardiyanto, H.; Saptomo, S.K. Computational fluid dynamics (air temperature dan RH distribution inside a standard peak greenhouse using computational fluid dynamics). J. Ilm. Rekayasa Pertan. Biosist. 2014, 3, 125–133. [Google Scholar]
  172. Majdoubi, H.; Fatnassi, H.; Boulard, T.; Senhaji, A.; Demrati, H.; Mouqallid, M.; Bouirden, L. Computational study of thermal performance of an unheated canarian-Type greenhouse: Influence of the opening configurations on airflow and climate patterns at the crop level. Acta Hortic. 2017, 1182, 87–94. [Google Scholar] [CrossRef]
  173. Majdoubi, H.; Boulard, T.; Fatnassi, H.; Senhaji, A.; Elbahi, S.; Demrati, H.; Mouqallid, M.; Bouirden, L. Canary greenhouse CFD nocturnal climate simulation. Open J. Fluid Dyn. 2016, 06, 88–100. [Google Scholar] [CrossRef] [Green Version]
  174. Majdoubi, H.; Fatnassi, H.; Senhaji, A.; Elbahi, S.; Demrati, H.; Mouqallid, M.; Bouirden, L. Computational study of canary greenhouse side wall and roof vents opening effect on nocturnal airflow and climate patterns. Am. J. Agric. Sci. Eng. Technol. 2016, 3, 1–17. [Google Scholar]
  175. Flores-Velazquez, J.; Rishor, A.R.; Aguilar, A.R.; Bustamante, W.O.; Flores-Velázquez, J.; Rojas-Rishor, A.; Rojano-Aguilar, A.; Ojeda-Bustamante, W. CFD modeling to assessing environment of a greenhouse typical in Costa Rica. In Proceedings of the 2016 ASABE Annual International Meeting, Orlando, FL, USA, 17–20 July 2016; pp. 2–11. [Google Scholar]
  176. Tashoo, K.; Thepa, S.; Pairintra, R.; Namprakai, P. Reducing the air temperature inside the simple structure greenhouse using roof angle variation. Tarim Bilim. Derg. 2014, 20, 136–151. [Google Scholar] [CrossRef]
  177. Villagrán-Munar, E.A. Implementation of ventilation towers in a greenhouse established in low altitude tropical climate conditions: Numerical approach to the behavior of the natural ventilation. Rev. Ceres 2021, 68, 10–22. [Google Scholar] [CrossRef]
  178. Choab, N.; Allouhi, A.; El Maakoul, A.; Kousksou, T.; Saadeddine, S.; Jamil, A. Review on greenhouse microclimate and application: Design parameters, thermal modeling and simulation, climate controlling technologies. Sol. Energy 2019, 191, 109–137. [Google Scholar] [CrossRef]
  179. De la Torre-Gea, G.; Rico-García, E. Redes bayesianas aplicadas a un modelo CFD del entorno de un cultivo en invernadero. Agrociencia 2014, 48, 307–319. [Google Scholar]
  180. Villagran, E.A.; Bojaca, C.R. Simulación con base en la técnica dinámica de fluidos computacional (CFD), para el diseño y optimización de la ventilación natural de los invernaderos de flores de corte en la sabana de Bogotá. Produmedios 2017, 8, 1–104. [Google Scholar]
  181. He, K.; Chen, D.; Sun, L.; Huang, Z.; Liu, Z. Effects of vent configuration and span number on greenhouse microclimate under summer conditions in eastern China. Int. J. Vent. 2015, 13, 381–396. [Google Scholar] [CrossRef]
  182. Mistriotis, A.; Castellano, S. Airflow through net covered tunnel structures at high wind speeds. Biosyst. Eng. 2012, 113, 308–317. [Google Scholar] [CrossRef]
  183. Molina-Aiz, F.D.; Valera, D.L.; Peña, A.A.; Gil, J.A. Optimisation of Almería-type greenhouse ventilation performance with computational fluid dynamics. Acta Hortic. 2005, 691, 433–440. [Google Scholar] [CrossRef]
  184. Katsoulas, N.; Bartzanas, T.; Boulard, T.; Mermier, M.; Kittas, C. Effect of vent openings and insect screens on greenhouse ventilation. Biosyst. Eng. 2006, 93, 427–436. [Google Scholar] [CrossRef]
  185. Baeza, E.; Pérez-Parra, J.; López, J.C.; Gázquez, J.C. La dinámica de fluidos computacional como herramienta para mejorar el diseño de los sistemas de ventilación natural en invernadero. Estac. Exp. Fund. Cajamar 2007, 15, 1079–1086. [Google Scholar]
  186. Bouhoun Ali, H.; Bournet, P.E.; Cannavo, P.; Chantoiseau, E. Using CFD to improve the irrigation strategy for growing ornamental plants inside a greenhouse. Biosyst. Eng. 2019, 186, 130–145. [Google Scholar] [CrossRef]
  187. Tominaga, Y.; Mochida, A.; Yoshie, R.; Kataoka, H.; Nozu, T.; Yoshikawa, M.; Shirasawa, T. AIJ guidelines for practical applications of CFD to pedestrian wind environment around buildings. J. Wind Eng. Ind. Aerodyn. 2008, 96, 1749–1761. [Google Scholar] [CrossRef]
  188. Coussirat, M.; Guardo, A.; Jou, E.; Egusquiza, E.; Cuerva, E.; Alavedra, P. Performance and influence of numerical sub-models on the CFD simulation of free and forced convection in double-glazed ventilated façades. Energy Build. 2008, 40, 1781–1789. [Google Scholar] [CrossRef]
  189. Yang, Y.; Gu, M.; Chen, S.; Jin, X. New inflow boundary conditions for modelling the neutral equilibrium atmospheric boundary layer in computational wind engineering. J. Wind Eng. Ind. Aerodyn. 2009, 97, 88–95. [Google Scholar] [CrossRef]
  190. Bartzanas, T.; Boulard, T.; Kittas, C. Effect of vent arrangement on windward ventilation of a tunnel greenhouse. Biosyst. Eng. 2004, 88, 479–490. [Google Scholar] [CrossRef]
  191. Villagran, E.; Bojacá, C. Analysis of the microclimatic behavior of a greenhouse used to produce carnation (Dianthus caryophyllus L.). Ornam. Hortic. 2020, 26, 109–204. [Google Scholar] [CrossRef]
  192. Villagran, E.; Bojacá, C. Experimental evaluation of the thermal and hygrometric behavior of a Colombian greenhouse used for the production of roses (Rosa spp.). Ornam. Hortic. 2020, 26, 205–219. [Google Scholar] [CrossRef]
  193. Pérez-Vega, C.; Ramírez-Arias, J.A.; López-Cruz, I.L.; Arteaga-Ramírez, R.; Cervantes-Osornio, R. 3D computational fluid dynamics modeling of temperature and humidity in a humidified greenhouse. InAgBi 2020, 13, 17–31. [Google Scholar] [CrossRef]
  194. Montero, J.I.; Muñoz, P.; Antón, A.; Iglesias, N. Computational fluid dynamic modelling of night-time energy fluxes in unheated greenhouses. Acta Hortic. 2005, 691, 403–410. [Google Scholar] [CrossRef]
  195. Kim, K.; Yoon, J.Y.; Kwon, H.J.; Han, J.H.; Eek Son, J.; Nam, S.W.; Giacomelli, G.A.; Lee, I.B. 3-D CFD analysis of relative humidity distribution in greenhouse with a fog cooling system and refrigerative dehumidifiers. Biosyst. Eng. 2008, 100, 245–255. [Google Scholar] [CrossRef]
  196. Dhiman, M.; Sethi, V.P.; Singh, B.; Sharma, A. CFD analysis of greenhouse heating using flue gas and hot water heat sink pipe networks. Comput. Electron. Agric. 2019, 163, 104853. [Google Scholar] [CrossRef]
  197. Morille, B.; Genez, R.; Migeon, C.; Bournet, P.E.; Bouhoun Ali, H. CFD Simulations of the distributed climate time-evolution inside a glasshouse at night. Acta. Hortic. 2013, 1008, 201–206. [Google Scholar] [CrossRef]
  198. Kwon, K.; Kim, D.; Kim, R.; Ha, T.; Lee, I. Evaluation of wind pressure coefficients of single-span greenhouses built on reclaimed coastal land using a large-sized wind tunnel. Biosyst. Eng. 2016, 14, 58–81. [Google Scholar] [CrossRef]
  199. Fouad, N.S.; Mahmoud, G.H.; Nasr, N.E. Comparative study of international codes wind loads and CFD results for low rise buildings. Alex. Eng. J. 2018, 57, 3623–3639. [Google Scholar] [CrossRef]
  200. Montaño Moreno, J.J.; Palmer Pol, A.; Sesé Abad, A.; Cajal Blasco, B. Using the R-MAPE index as a resistant measure of forecast accuracy. Psicothema 2013, 25, 500–506. [Google Scholar] [CrossRef]
  201. Baptista, F.J.; Bailey, B.J.; Meneses, J.F. Comparison of humidity conditions in unheated tomato greenhouses with different natural ventilation management and implications for climate and Botrytis cinerea control. Acta Hortic. 2008, 801, 1013–1019. [Google Scholar] [CrossRef]
  202. Rossel, R.A.V.; Taylor, H.J.; McBratney, A.B. Multivariate calibration of hyperspectral γ-ray energy spectra for proximal soil sensing. Eur. J. Soil Sci. 2007, 58, 343–353. [Google Scholar] [CrossRef]
  203. Janni, K.A.; Jacobson, L.D. Modeling Natural Ventilation Induced by Combined Thermal Buoyancy and Wind. Trans. Am. Soc. Agric. Eng. 1989, 32, 2165–2174. Available online: https://experts.umn.edu/en/publications/modeling-natural-ventilation-induced-by-combined-thermal-buoyancy (accessed on 11 February 2019).
  204. Teitel, M.; Rguez, M.G.T.; Liang, H.; Tanny, J.; Ozer, S.; Alon, H. Vertical profiles of temperature, humidity ratio and air velocity in different types of insect-proof screenhouse. Acta Hortic. 2018, 1227, 205–212. [Google Scholar] [CrossRef]
  205. Teitel, M.; Liang, H.; Vitoshkin, H.; Tanny, J.; Ozer, S. Airflow patterns and turbulence characteristics above the canopy of a tomato crop in a roof-ventilated insect-proof screenhouse. Biosyst. Eng. 2020, 190, 184–200. [Google Scholar] [CrossRef]
  206. Baxevanou, C.; Fidaros, D.; Katsoulas, N.; Mekeridis, E.; Varlamis, C.; Zachariadis, A.; Logothetidis, S. Simulation of radiation and crop activity in a greenhouse covered with semitransparent organic photovoltaics. Appl. Sci. 2020, 10, 2550. [Google Scholar] [CrossRef] [Green Version]
  207. Hassanien, R.H.; Li, M.; Yin, F. The integration of semi-transparent photovoltaics on greenhouse roof for energy and plant production. Renew. Energy 2018, 121, 377–388. [Google Scholar] [CrossRef]
  208. Maraveas, C. Wind pressure coefficients on greenhouse structures. Agriculture 2020, 10, 149. [Google Scholar] [CrossRef]
  209. Kuroyanagi, T. Investigating air leakage and wind pressure coefficients of single-span plastic greenhouses using computational fluid dynamics. Biosyst. Eng. 2017, 163, 15–27. [Google Scholar] [CrossRef]
  210. Kim, R.-W.; Hong, S.-W.; Lee, I.-B.; Kwon, K.-S. Evaluation of wind pressure acting on multi-span greenhouses using CFD technique, Part 2: Application of the CFD model. Biosyst. Eng. 2017, 164, 257–280. [Google Scholar] [CrossRef]
  211. Kim, R.W.; Lee, I.B.; Kwon, K. Evaluation of wind pressure acting on multi-span greenhouses using CFD technique, Part 1: Development of the CFD model. Biosyst. Eng. 2017, 164, 235–256. [Google Scholar] [CrossRef]
Figure 1. Workflow for the search of scientific information.
Sustainability 13 10433 g001
Figure 2. Number of articles published per year and their trend in the last decade.
Sustainability 13 10433 g002
Figure 3. Number of documents published by country.
Sustainability 13 10433 g003
Figure 4. Geographical distribution of the research papers collected.
Sustainability 13 10433 g004
Figure 5. Key words most frequently used in the documents collected.
Sustainability 13 10433 g005
Figure 6. Number of articles published per year for the journals with the highest number of publications.
Sustainability 13 10433 g006
Figure 7. Co-authorship map considering the 256 authors.
Sustainability 13 10433 g007
Figure 8. Co-authorship map, considering 114 authors.
Sustainability 13 10433 g008
Figure 9. Map of the authors’ co-citation network.
Sustainability 13 10433 g009
Table 1. Keywords used in the search equation.
Type of StructureClimate ControlMethodology of Analysis
GreenhouseNatural ventilationCFD
Nethouse Numerical
Mesh-house Simulation
Screenhouse
Table 2. Characteristic parameters for the technical classification of documents.
About the StructureAbout the Simulation
Structure type (greenhouse or screenhouse)Type of software used for numerical solution of the simulations
Greenhouse typeType of numerical simulation performed
Structure sizeType of numerical grid implemented
Turbulence model implemented
Structure type (greenhouse or screenhouse)Implemented radiation model
Greenhouse typeImplemented crop model
Structure sizeType of meteorological condition simulated
Table 3. Main academic journals that publish on the research topic.
RankJournalNumber of Documents%SRJH-IndexQuartile
1Acta Horticulturae2218.640.18584
2Biosystems Engineering119.320.891101
3Computers and Electronics in Agriculture75.931.211151
4Agrociencia54.240.19223
5International Journal of Heat and Technology32.540.28293
6Protected Horticulture and Plant Factory32.54N.aN.aN.a
7Open Journal of Fluid Dynamics21.69N.aN.aN.a
8Ornamental Horticulture21.690.2763
9Renewable Energy21.691.831911
10Journal of Agricultural Engineering21.690.3182
11Energy and Buildings21.691.741841
12Revista Ceres21.690.3162
13African Journal of Biotechnology10.850.3843
14Agronomy Mesoamerican10.850.1224
15Comunicata Scientiae10.850.24123
Table 4. Leading authors in the field of knowledge in the last decade.
AuthorPublished DocumentsNumber of
Citations
Current
Position
Current
Institution
Country of
Nationality
Edwin Villagrán18276Associate researcherCorporación Colombiana de Investigación Agropecuaria (AGROSAVIA)Colombia
Jorge Flores Velázquez15311ResearcherColegio de PosgraduadosMéxico
Carlos Bojacá14913Full profesorJorge Tadeo Lozano UniversityColombia
Juan Ignacio Montero Camacho102531Senior researcherInstitute of Agrifood Research and Technology (IRTA)Spain
Thierry Boulard88032Senior researcherFrench National Research Institute for Agriculture (INRA).French
Abraham Rojano-Aguilar8324ProfessorChapingo Autonomous UniversityMéxico
Hicham Fatnassi71570Senior horticulture scientistInternational Center for Biosaline Agriculture (ICBA)French
Davide Piscia7144Researchernational center for genomic analysis (cnag)Italy
Irineo L. López-Cruz61790ResearcherChapingo Autonomous UniversityMexico
‪Thomas Bartzanas53345Associate ProfessorAgricultural University of AthensGreece
Esteban Baeza51293ResearcherWageningen UR Greenhouse HorticultureSpain
Constantinos Kittas53074ProfessorUniversity of ThessalyGreece
Guillermo De la Torre-Gea5121Researcher mangerGarman Technology Research and Development InstituteMexico
Hassan Majdoubi5258ResearcherRegional Center of Education and Training Jobs-Fes-MeknesMorocco
Mhamed Mouqallid5124ResearcherEcole Nationale d’Agriculture de MeknèsMorocco
Table 5. The 15 most cited published papers between 2010 and 2020.
TitleCitationsReference
Effect of ventilator configuration on the distributed climate of greenhouses: A review of experimental and CFD studies178[41]
A CFD greenhouse nighttime condensation model86[90]
Comparison of finite element and finite volume methods for simulation of natural ventilation in greenhouses82[91]
Numerical simulation of thermal behavior of a ventilated arc greenhouse during a solar day78[33]
Dynamic simulation of the distributed radiative and convective climate within a cropped greenhouse68[92]
Microclimate and evapotranspiration of crops covered by agricultural screens: A review63[93]
Computational fluid dynamics applications to improve crop production systems60[94]
Efficacy of greenhouse natural ventilation: Environmental monitoring and CFD simulations of a study case58[95]
Ventilation optimization of solar greenhouse with removable back walls based on CFD52[15]
CFD and weighted entropy-based simulation and optimization of Chinese Solar Greenhouse temperature distribution37[96]
A method of coupling CFD and energy balance simulations to study humidity control in unheated greenhouses35[96]
CFD Simulation of Heat and Mass Transfer for Climate Control in Greenhouses35[97]
Numerical simulation of solar radiation, air flow and temperature distribution in a naturally ventilated tunnel greenhouse31[98]
Mejora de las tasas de ventilación de invernaderos bajo condiciones climáticas del centro de México31[46]
Transient CFD analysis of the natural ventilation of three types of greenhouses used for agricultural production in a tropical mountain climate31[29]
Table 6. Types of protected agriculture structures analyzed in the documents collected.
Protected Agriculture Structure TypeNumber of PublicationsReferences
Chapel21[39,47,75,90,96,99,100,101,102,103,104,105,106,107,108,109,110,111,112,113,114]
Tunnel19[17,49,76,79,92,104,105,110,115,116,117,118,119,120,121,122,123,124,125]
Arc14[33,98,126,127,128,129,130,131,132,133,134,135,136,137]
Venlo14[32,54,95,104,105,138,139,140,141,142,143,144,145,146]
Gothic13[29,37,46,56,78,126,147,148,149,150,151,152,153]
Zenital10[5,38,122,126,149,154,155,156,157,158]
Screenhouse9[122,125,130,159,160,161,162,163,164]
Chinese Solar5[15,165,166,167,168]
Traditional Colombian3[29,111,169]
Standard peak2[170,171]
Almeria2[19,91]
Canary2[172,173,174]
Slope2[6,175]
Simple1[176]
Sierrra1[83]
Octagonal1[137]
One-water sloping roof1[136]
Table 7. Number of protected agriculture structures grouped according to surface area covered (m2).
SmallMediumLarge
(≤500 m2)(Between 500 m2 and 5000 m2)(>5000 m2)
453515
Table 8. Number of publications grouped by type of covering material used in the analyzed structure.
Type of Covering MaterialNumber of PublicationsReferences
Polyethylene (plastic-covered)67[5,6,17,29,33,38,46,47,49,56,75,76,77,79,83,90,91,92,96,99,101,102,103,106,107,108,109,110,111,113,116,117,118,119,120,121,124,127,128,129,132,134,140,147,148,149,150,151,152,153,154,155,156,157,158,162,167,168,169,172,173,174,175,179,180,181]
Glass11[32,95,100,105,138,141,142,143,144,145,146]
Various roofi materials9[19,98,104,122,125,126,130,131,135]
Anti-insect screen7[159,160,161,162,163,164,182]
Polycarbonate5[54,137,139,170,171]
Polyvinyl film (PVC)1[15,176]
Shade screen1[182]
Polypropylene1[166]
Expanded polystyrene1[165]
Table 9. Number of publications grouped by type of ventilation configuration used in the analyzed structure.
Ventilation ConfigurationNumber of PublicationsReferences
Side and rooftop67[6,17,19,29,32,37,38,39,46,47,75,76,77,78,79,83,91,95,99,101,104,105,108,111,113,114,117,122,123,124,125,126,127,128,130,132,141,142,143,144,145,147,148,149,152,153,154,155,156,157,158,159,160,161,162,163,164,166,168,169,170,171,172,173,174,176,181]
Side21[15,33,54,90,92,98,102,103,109,116,118,119,120,121,135,140,150,165,167,179,182]
Rooftop16[5,49,56,96,106,110,115,129,134,136,137,138,139,146,151,175]
Closed4[100,107,131,133]
Table 10. Number of publications grouped by type of software used for CFD simulations.
Software TypeNumber of PublicationsReferences
ANSYS FLUENT79[5,6,15,17,19,29,32,33,37,38,46,47,75,76,78,79,83,90,91,92,96,98,99,100,101,102,103,104,105,106,107,111,113,115,117,118,119,120,121,124,125,127,128,130,131,132,133,134,135,138,139,140,141,142,146,147,148,149,150,152,153,154,155,156,157,158,159,160,161,162,164,165,166,168,169,175,179,181]
ANSYS CFX5[116,151,163,167,176]
CFD20004[56,172,173,174]
FORTRAN3[39,114,136]
SOLIDWORKS3[145,170,171]
ANSYS FLOTRAN2[110,182]
StarCCM+2[143,144]
Software Truchas2[109,123]
Airpak 3.01[54]
COMSOLMultiphysics1[49]
COMSOL Y MATLAB1[137]
Autodesk CFD 20151[95]
Autodesk CFD 20171[129]
Table 11. Number of publications grouped by type of simulation implemented in the numerical analysis.
Type of SimulationNumber of PublicationsReferences
Steady state84[6,17,19,37,38,39,46,47,49,54,56,75,76,77,78,79,83,91,96,98,99,100,101,104,105,107,108,109,111,113,114,115,116,117,118,120,121,122,123,124,125,128,129,130,131,132,133,134,136,140,141,142,143,144,145,146,147,148,149,150,152,153,154,155,156,157,158,159,160,161,162,163,164,166,169,170,171,172,173,174,175,176,179,182]
Transient state15[15,29,32,33,92,102,103,106,110,119,135,137,139,151,167]
Both8[90,95,126,127,138,165,168,181]
Table 12. Number of publications grouped by type of numerical meshing used in the discretization of the computational domain.
Type of GridNumber of PublicationsReferences
No Reported51[5,38,46,56,83,90,102,103,107,108,114,117,118,119,120,122,126,127,130,131,134,135,136,137,138,145,146,148,149,150,151,153,154,155,158,159,161,165,166,168,170,171,172,173,174,175,179,181,182]
Unstructured45[6,15,17,19,29,37,47,49,54,75,76,77,79,91,95,96,99,100,101,104,105,109,110,111,113,115,116,121,123,124,125,129,132,140,143,144,147,152,156,157,162,163,164,169,176]
Structured8[32,33,39,78,92,98,133,142]
Hybrids3[106,128,139]
Table 13. Number of publications grouped by type of turbulence model implemented in the CFD simulations.
Turbulence ModelNumber of DocumentsReferences
k-ε estándar72[5,6,15,17,19,29,33,37,38,46,47,49,75,76,77,78,79,83,90,91,92,96,98,99,102,103,104,105,108,111,113,116,119,120,121,123,124,125,127,128,130,131,134,135,137,138,139,142,147,150,151,152,154,155,156,157,158,159,160,161,162,164,165,166,167,168,169,172,173,174,176,181]
No. reported16[32,39,56,100,107,114,115,132,133,136,140,145,146,150,171,175]
k-ε RNG7[54,101,117,141,148,153,182]
LES4[110,118,122,123]
Use of various models3[126,129,149]
k-ε Realizable3[106,143,144]
k-ε Modified1[163]
Mixing length turbulence model1[95]
Table 14. Number of publications grouped by type of radiation model implemented in CFD simulations.
Radiation ModelNumber of DocumentsReference
Simplified method62[19,32,37,38,39,46,49,76,78,83,91,95,99,100,106,108,109,110,111,113,114,115,116,120,121,122,123,126,129,131,133,136,141,142,143,144,145,146,147,148,149,151,153,154,155,156,159,160,161,163,164,165,167,169,170,171,172,173,174,175,176,179,182]
Discrete Ordinate Model (DOM)44[5,6,15,17,29,33,47,54,56,75,77,79,90,92,96,98,101,102,103,104,105,107,117,118,119,124,125,127,128,132,134,135,137,138,139,140,150,152,157,158,162,166,168,181]
Rosseland—solar calculator1[130]
Table 15. Number of publications that considered or omitted the presence of crop plants in the CFD simulations.
Presence of CropNumber of PublicationsReferences
No65[15,29,32,37,39,46,47,49,54,75,76,77,78,79,83,90,91,95,99,100,101,106,107,108,110,111,113,114,115,116,117,118,121,123,124,125,126,129,130,131,133,136,137,140,142,144,145,146,147,148,149,150,151,152,160,162,164,165,166,169,170,171,175,176,182]
Yes42[5,6,17,19,33,38,56,92,96,98,102,103,104,105,119,120,122,127,128,132,134,135,138,139,141,143,150,153,154,155,156,157,158,159,161,163,167,168,172,173,174,181]
Empty and crop1[109]
Table 16. Number of publications grouped by type of meteorological condition analyzed in the CFD simulations.
Type of ClimateNumber of PublicationsReferences
Daytime75[5,6,15,19,29,32,33,37,38,39,46,47,49,54,56,76,78,91,98,99,101,104,105,106,109,110,111,113,114,117,120,121,122,123,125,126,127,128,129,130,132,133,134,135,136,137,138,140,141,142,143,144,145,146,147,150,151,153,154,155,156,157,158,159,161,164,166,167,168,169,175,176,179,181,182]
Daytime and Nighttime16[17,75,77,92,95,100,116,118,119,124,139,148,162,165,170,171]
Nighttime12[79,83,90,96,102,103,107,131,152,172,173,174]
Table 17. Number of publications grouped by type of validation developed in the research work.
Type of ValidationNumber of PublicationsReferences
Microclimatic measurement69[5,6,15,17,19,29,32,33,37,47,54,75,77,79,83,90,91,95,99,100,102,104,105,106,107,111,113,116,117,120,121,125,127,128,129,132,135,137,138,139,140,141,142,144,145,146,148,150,151,152,153,154,155,156,162,164,165,166,167,168,169,171,173,175,176,179,181,182]
Not reported10[39,46,78,92,96,98,119,131,143,174]
Not validated9[56,76,101,103,133,134,147,161,163]
Wind tunnel9[49,108,109,115,123,126,129,136,149]
Based on previous research results8[114,118,136,157,159,160,170,172]
Water tunnel2[38,122]
Auto calibration1[110]
Table 18. Number of publications grouped by type of comparison between simulated and experimental data sets.
Method of ComparisonNumber of PublicationsReferences
Goodness-of-fit34[5,15,17,19,32,37,47,54,75,77,79,83,99,102,105,110,111,121,124,125,126,129,130,132,142,145,152,162,164,166,170,171,203]
Trend graphs19[90,106,107,113,114,122,127,128,136,139,144,149,153,160,165,167,169,173,181]
Statistical analysis and trend graph15[91,104,105,108,110,116,120,135,138,141,143,146,148,150,182]
Statistical analysis4[6,100,101,175]
Goodness-of-fit and trend graph4[29,95,137,176]
Statistical analysis and goodness-of-fit3[6,154,156]
Publisher’s Note: MDPI stays neutral with regard to jurisdictional claims in published maps and institutional affiliations.

