
How to Measure Environmental Performance in Ports
by
 , , and
Alejandro Vega-Muñoz
1 ,
,
Guido Salazar-Sepulveda
2,* ,
,
Juan Felipe Espinosa-Cristia
3 and
and
Jonathan Sanhueza-Vergara
4,5 
1
Public Policy Observatory, Universidad Autónoma de Chile, 7500912 Santiago, Chile
2
Departamento de Ingeniería Industrial—Facultad de Ingeniería, Universidad Católica de la Santísima Concepción, 4090541 Concepción, Chile
3
Facultad de Economía y Negocios, Universidad Andres Bello, 2531015 Viña del Mar, Chile
4
Logistics and Quality Management, Fuels Division—SBU Andes, AES Gener, 7500024 Santiago, Chile
5
Asociación Internacional de Profesionales en Puertos y Costas, 7850286 Santiago, Chile
*
Author to whom correspondence should be addressed.
Sustainability 2021, 13(7), 4035; https://doi.org/10.3390/su13074035
Submission received: 10 March 2021
/
Revised: 27 March 2021
/
Accepted: 29 March 2021
/
Published: 5 April 2021
(This article belongs to the Special Issue Reducing the Environmental Impact of Maritime Transport)
Abstract
:Featured Application
This article provides adequate instruments and indicators for measuring the environmental performance of ports within the framework of the Sustainable Development Goals (SDGs).
Abstract
Oceans, seas, and marine resources are highly relevant for achieving the Sustainable Development Goals. Such relevance has given rise to the blue economy approach, where scholars and policymakers see activities carried out in cargo ports from a different perspective. The blue economy approach stresses the emergence of multiple transnational networks in relation to these topics and the development of green ports plus environmental measurements at seaports in general. In this context, our study aimed to review the various scientifically documented methods for measuring environmental performance in ports, ports companies, or port authorities in the maritime transport and inland waterways framework. The study followed a scientometric meta-analytic methodology to accomplish its goals. The study strictly referred to the Environmental Performance in Ports (EPP) and extracted the corpus to analyze data held in five databases embedded in the Web of Science Core Collection. Then, the selection was processed and refined with the PRISMA guidelines to establish the eligibility criteria for articles with the PICOS (Population, Interventions, Comparators, Outcomes, and Study) tool. A limited study set was identified. This included port environmental performance indicators and studies that were strongly influenced by the European Sea Ports Organization and Green Marine networks. These were compared based on the ecological Sustainable Development Goals (SDGs), scale structure, and diversity in application. Finally, we assessed two measurement forms documented in the scientific research on the subject at a global level and discussed their pros and cons.
1. Introduction
The ocean regulates the global climate; provides humans with natural resources, such as food, materials, important substances, and energy; and is essential for international trade and recreational and cultural activities. Along with human development and economic growth, free access, and the use of the ocean for resources and services have put strong pressure on marine systems due to practices such as overfishing and increased resource extraction and disruption of coastal areas by various types of pollution [1,2]. Moreover, unsustainable practices and practices that are harmful for the marine environment, such as overfishing and illegal fishing, whether undeclared or within the rules, threaten the capacity of developing countries [3].
In this context, a specific Sustainable Development Goal (SDG) was developed for oceans, seas, and marine resources to provide guidance in the conservation and use of this environmental resource. Additionally, an initial framework of agreement was constructed, which contains policies, strategies, and models for sustainable development, installing the challenge of advancing from implementation towards sustainability strategy execution [4] (see Appendix A).
In this regard, the topics addressed by the 14th SDG are diverse. For example, Gifford et al. [5] developed a conceptual model of innovative governance practices by integrating sustainability objectives, implemented through two case studies of the Swedish maritime group. For their part, Hermann et al. [6] conducted a phosphorus processing study in which they studied the conflicting potentials of targets in the trade-off between low energy consumption and effects at sea. Finally, Arana-Landin [7], using a transdisciplinary approach, examined how to enhance sustainable artisanal fisheries through social economy policies to ensure the implementation of the so-called triple bottom line.
Within the fisheries field, it is also important to align SDGs with the Voluntary Guidelines for Securing Sustainable Small-Scale Fisheries (SSF Guidelines, see Appendix B). This alignment is required because the reciprocity between the scope and nature of the two instruments can help to guide the formulation of appropriate governance tools [8]. In addition, the fishing industry can implement practices that, for example, can help to reduce marine contamination or bycatching. However, this requires further work to identify the specific information mechanisms that research companies should use to assess their progress against the set of SDGs [9].
Regional fisheries management organizations (RFMOs) are key institutions in international fisheries management with the potential to play important roles in achieving the 14th SDG. The results of the network evaluation show that RFMOs cooperate primarily with other RFMOs or fisheries-related organizations, while there is a lack of cooperation with other maritime organizations. Therefore, there is great potential to increase the contributions of RFMOs to SDG 14, aligning a greater part of their work with this objective [10].
In addition, strategic environmental assessment (SEA) has the potential to assist in the implementation of SDG support actions. This is because SEA provides a systematic framework for incorporating SDGs into policies, plans, and programs. It is also clear that the SDGs, in turn, could support SEA’s contribution to the implementation of the sustainable development strategy. Therefore, the association of both policy instruments could foster a mutually benefitting relationship [11].
Finally, each of the findings identified emphasize the importance of using integrated models to support the planning of SDG strategies and complement the information provided by stakeholder participation in coastal countries [12]. According to Mohammed et al. [13], although policymakers can use several legal, regulatory, and economic tools to implement SDGs, they should focus more on implementing tax instruments, such as taxes, subsidies, and conditional transfers, to provide the necessary incentives to stakeholders in coastal countries.
1.1. The Oceans and the Blue Economy
Although variety reigns over unity, and the term “blue economy” has been present in the common language over the past decade, there is currently no commonly accepted definition for the blue economy [14,15]. To bring us closer to a common definition, we use the definition from [16], which identifies the blue economy as a “platform for strategic, integrated, and participatory coastal and ocean development and protection that incorporates a low carbon economy, the ecosystem approach, and human wellbeing through advancing regional industries, services, and activities”. In studying the concepts of blue economy and blue growth and including them in a coherent environmental accounting framework, Mulazzani et al. [17] used the United Nations Environmental–Economic Accounting System to propose a set of assumptions for linking the blue economy/growth and ecosystem services, including the creation of an adjusted value-added measure that considers the depletion and degradation of the environment and the value of noncommercial benefits provided by the ecosystem. More specific topics, such as the “blue economy management” concept and several blue economy cases, are detailed below.
1.1.1. Blue Economy Management
Through studies conducted in Bangladesh by Sarker et al. [18], it was concluded that the achievement of sustainable “blue” growth requires strategic planning focused on sectors with potential within the activities of the blue economy. These sectors are related to ocean research and governance. In addition, the study argues that the improvement of blue growth and the achievement of the SDGs must go hand-in-hand; in this way, there is a balance that does not promote blue growth at the expense of environmental sustainability. In this sense, Voyer et al. [19] and Voyer et al. [20] indicate that strengthening connections between sectoral management agreements, through the use of border organizations and by sending a message to existing instruments, could be an efficient and pragmatic approach to the implementation of the blue economy.
Improving the management and governance of marine resources requires science and socioeconomics to be united. For sustainable growth of the blue economy, strong scientific information on the marine environment, detailed knowledge of activities occurring in the ocean space, and an integral understanding of environmental impacts are needed (Mallin et al. [21]). However, there is now a gap in human understanding dimensions regarding the seas and populated coasts of the world. Knowledge of human dimensions for the seas and coasts is critical for evidence-based decision-making in marine policy areas, including marine conservation, marine spatial planning, fisheries management, climate adaptation, and the blue economy [22].
1.1.2. Blue Economy Cases
In the absence of a settled definition of the blue economy, some recent research exemplified its areas. Research carried out by Katila et al. [23] aimed to evaluate blue growth at practical and local levels considering an existing active maritime sector and a relatively pristine environment (Gulf of Bothnia, Finland). To assess this environment, the importance of local economic data was examined, and in this way, the potential of blue economies could be understood. Similar, studies carried out by Akpomera et al. [24] analyzed the positioning of sub-Saharan Africa in the new framework of the blue economy and showed that it accounts for bottlenecks representing maritime insecurity and fragile governance in the coastal states of Africa. The authors considered one of the central factors in the occurrence of bottlenecks and their effects on manage maritime insecurity and weak governance as the lack of financial and technological capacity to collect ocean assets.
Along with the areas already identified, various visions of the blue economy for sustainable development were illustrated by Hassanali [25] through case studies conducted in three Caribbean Community countries (CARICOM; Trinidad and Tobago, Belize, and Granada). Hassanali [25] stated that discussion, understanding, and engagement among its members is needed to reach an agreed policy and strategy that effectively coordinates and operates the development of the blue economy in the region. Such understanding would enable CARICOM to optimize the collective economic, social, and environmental benefits of the blue economy and allow regional grouping to be an influential player in all aspects of the blue economy discourse on the global stage.
Regarding regional development, Pinto et al. [26] provided a timely contribution to fill the knowledge gap on the blue economy. The authors presented the findings and analysis of a survey applied to blue economy organizations in Portugal, Spain, Ireland, and Scotland. This study specified that innovation, human capital, and social capital provide the basis for the creation and consolidation of maritime clusters. In addition, Hoerterer et al. [27] added, from the viewpoints of various stakeholders participating in the blue economy of the German coast, an explanation of how synergies and conflicts between stakeholders and political decision-making can influence blue growth in highly disputed regions. Particularly, these authors explained the case of the North Sea basin, which is even more relevant given the effects of climate change. The authors concluded by demanding that public policies be formulated with a more flexible and adaptive approach that considers changes to environmental, social, and economic realities.
1.2. Green Ports and Environmental Performance in Ports (EPP)
In recent years, people’s awareness of the protection of the environment has increased. While ports promote economic development and the employment level in port cities, they also have a negative impact on the port city environment; therefore, the sustainability of port activities is becoming increasingly valued [28,29,30].
Factors in the specific context of a port have strong influences on the selection and adoption of sustainable practices by the port authority, conditioning its environmental priorities, specific regulations, financial resources, and immediate competition areas, with wide variations occurring between regions and specific ports [31]. Variation in the above aspects is important, as corporate sustainability practices have the potential to generate value for port users and, as such, give competitive advantages to port operators and port servicers [32,33,34].
This aim of this approach to port sustainability is to conserve natural resources and biodiversity, as the amount of waste generated is becoming a growing problem, both in terms of the inefficient use of resources and the harmful effects produced. Even though large quantities of waste originate on land, a certain amount of waste is also generated at sea as a product of maritime transport [35]. Therefore, there have been efforts to promote the improvement of sustainability through ecoports or green ports [36].
So-called green ports arose from the political discourse of international maritime organizations, which have focused mainly on explaining the economic aspects and benefits associated with the implementation of environmental policies and the development of green guides and codes of conduct for port authorities [37,38]. As a result, all stakeholder seaports, including port authorships, policy makers, port users, and local communities, must invest substantial resources to achieve a high level of environmental competitiveness [39].
1.2.1. Clean Energies in Port Environments
Faced with the challenges due to the increasing daily rate of environmental pollution and the generation of electricity from fossil fuel sources in different countries, the international technoscientific community has demanded the study of alternative solutions for the generation and distribution of energy [40,41,42]. Such is the case with the electrical inter-connections among some of the Egyptian seaports which, for optimal operation, are maintaining a clean and sustainable environment with the use renewable energy generation units composed of photovoltaic power generation resources [43]. In the same sense, research by Contestabile et al. [44] studied a hybrid wave energy collector, fully integrated into Madagascar’s traditional breakwaters based on a previous development in Italy. In addition, Contestabile et al. [45] conducted a study along the south coast of Western Australia involving comparative assessments with different turbine strategy designs compared with the costs of traditional breakwaters. Finally, studies conducted by Esteban et al. [46] in the offshore wind industry can also be cited as the foundation for considering the use of these designs for construction in ports.
Li et al. [47] analyzed the decisions of ports and power plants on investment in single-engine energy converters, considering the uncertain supply. Studies by Yu et al. [48] in this area are also of interest. The authors, through a multi-object model that integrates spatial and temporal dimensions for strategic planning, studied whether and when ships should modernize to use electricity from the coast. They aimed to study energy use, where cruise ships seem to be a relevant case in the blue economy. In fact, cruise ships are one of the fastest growing and most energy-consuming tourism segments, generating significant greenhouse gas (GHG) emissions as well as atmospheric pollutants such as nitrous oxide (NOx) and particulate matter (PM2.5) [49,50,51,52]. Therefore, there is significant concern about exposure to atmospheric emissions [53,54] that affect human health and climate change. For this reason, port authorities have developed plans and programs to reduce atmospheric emissions. Programs have been created to monitor and form inventories of atmospheric emissions from the perspective of information systems (e.g., the clean trucks program, emission control systems technology demonstrations, the vessel speed reduction program, the idling reduction program, expansion of shore side electricity, and the air emissions inventor in several ports: Antwerp, Belgium; Bremerhaven, Germany; Dalian, China; Livorno, Italy; Long Beach, USA; Stockholm, Sweden; Vancouver, Canada) [55]. Along this line of research are the works developed by Lee et al. [56], Zhu et al. [57], and Wang et al. [58]. The latter tried to study the problem of integrated allocation of berths and quay cranes considering the payment of taxes on carbon emissions. This problem was formulated as a bi-objective integer programming model, intended to minimize the total delay in the completion of all tasks and the total operating costs.
For their part, Mjelde et al. [59] investigated differences in port tariffs depending on the environmental performance of ships, as this represents an additional factor in the consideration of cruise owners to invest in green technologies. The authors studied the use of liquefied natural gas (LNG) as fuel for a cruise ship, requiring positive incentives for ports to help to establish research, reduce emissions into the atmosphere, and drive the adoption of ecological technologies.
Finally, Simonsen et al. [49] developed and used a model of the amounts of carbon dioxide (CO2), NOx, and PM2.5 emitted at sea and in ports in Norwegian waters, finding that approximately 14.6% of these pollutants are deposited in ports, especially in Bergen, Oslo, and Stavanger. These findings confirm the considerable differences in the environmental performance of cruise ships. These findings could be used to design maritime policies that force cruise operators to introduce cleaner technologies and rethink operative practices.
1.2.2. Environmental Performance Indicators in the World’s Ports
The economic importance of maritime transport has significant implications for the social and environmental performance of port regions [60,61]. Through Stankovic’s studies [62], composite indices were created as relevant scientifically based tools that were used to compare and monitor various aspects of sustainability in 37 port regions in seven countries on the European side of the Mediterranean across a five-year period from 2014 to 2018. The results highlight the GDP per capita and population density as indicators of greater relative importance in terms of port region sustainability. Liao et al. [63] and Wan et al. [64] evaluated the current state of green port development around the world by establishing an evaluation model for quantitative measurement of the development of green ports based on a framework of drivers, pressures, states, impacts, and responses.
Puig et al. [65] and Puig et al. [66] investigated a list of ports associated with the European Maritime Ports Organization (ESPO) through the self-diagnostic method (SDM; see Appendix C), through which ports can self-assess their environmental management. The results yielded data on a set of management indicators for environmental matters, with an inventory of environmental legislation being the highest implementation indicator (96.7%), followed by the existence of an environmental policy (95.7%). Moreover, Walker [67] and Hossain et al. [68] assessed sustainability and environmental performance in ports within the framework of Canada’s Green Marine Environmental Program (GMEP; see Appendix D) using predefined indicators to identify operational trends and links to port sustainability.
Through an inductive research approach, Hall et al. [69] identified and evaluated the initiation and implementation process behind exemplary innovations in the Vancouver, Columbia, Los Angeles, and Long Beach, California ports. The study included innovation in new technologies and processes for cargo management and movement, mechanisms for policy planning and formulation, as well as the financing, implementation, updating, administration, and operation of infrastructure systems. This relatively new area of competition based on innovation was also studied by Polanco-Pérez et al. [70], Valenzuela et al. [71], and Seisdedos et al. [72] in terms of environmental performance in new engineering works, installation, and coastal interventions.
Finally, studies carried out by Khaslavskaya et al. [73] and Kotowska et al. [74] emphasized the promotion of modes of transport and transport chains that are more environmentally responsive to the hinterland as alternatives to highway transport. Inland shipping and waterways are environmentally friendly and cheap modes of transport. Therefore, a modal change from highways to inland waterways is one of the elements of the European Union’s sustainable transport policy, and this is gaining importance in the development policies of port authorities as a strategic element in developing green ports.
While there appear to be multiple environmental initiatives in the port area, many of these are contextualized in a context that escapes the boundaries of a seaport or port company and depend on the country and location, including the port authority. Regarding the measurement of port environmental performance, there are similarities in this regard, because measuring the environmental performance of a port region or port city differs from measuring it within the jurisdiction of a port authority, and even within those territorial limits, it can differ between seaports or port companies In this way, the possibility of developing integral and tested measuring instruments is reduced to a more restricted set of possibilities that we analyze, in detail, in this article.
2. Methods
The review presented used the Preferred Reporting Items for Systematic Reviews and Meta-Analyses (PRISMA) guidelines [75], and the PICOS (Population, Interventions, Comparators, Outcomes, and Study) tool was used to establish the eligibility criteria for articles [76], for which we used Solé et al.’s [77] publication about ecosystem service assessment in coastal areas as a methodological reference for thematic proximity. The initial search for articles was strengthened with the use of scientometrics [78] that were used recently in topics related to articles by Sun et al. [79], Stojanovic et al. [80], Wang et al. [81], and Vega-Muñoz et al. [82]. The use of scientometrics in a meta-analysis [83] focuses on knowledge production, the spatiality of knowledge production, and knowledge relationships within the network of global actors [84,85], allowing the initial selection of articles to be refined based on a search vector using field labels, wildcards, and operators (Boolean, proximity, and priority) [86]. Its incorporation of sequential mixed use with the PRISMA guidelines has also been addressed previously [87,88,89].
Articles with the search vector TS = ((environmental NEAR/0 performance) AND (port?) AND (sea OR maritime OR harbor OR harbour OR coast)) were identified using 5 databases from the Web of Science Core Collection (WoS): Science Citation Index Expanded (SCIE), Social Sciences Citation Index (SSCI), Emerging Sources Citation Index (ESCI), Conference Proceedings Citation Index—Science (CPCI-S), and Conference Proceedings Citation Index- Social Science and Humanities (CPCI-SSH). SCIE and SSCI both contain journals indexed to the WoS Journal Citation Report (JCR). They consider high-quality journals for which the impact is calculated annually based on the average number of citations received. The ESCI contributes articles published in journals without impact calculations but adds other publications originating in regions where knowledge production develops with less intensity and is recognized within the periphery and semi-periphery of knowledge production [90]. Finally, the Conference Proceedings databases (CPCI-S and CPCI-SSH) present recent knowledge that has not yet been published in journals but which is already part of the discussion in prestigious international conferences. Regarding Scopus, the journals indexed to SSCI-WoS have a high indexation duplicity. However, the Scopus journals, which do not present double indexing with the SSCI base, were not considered because “Scopus covers a superior number of journals but with lower impact and limited to recent articles” [91] (p. 24).
Using PRISMA, the selection of articles was specified based on eligibility criteria: the population under study, interventions in this population, comparator elements of these studies, results to which these studies are oriented, and study designs (a set of criteria called the PICOS tool, as shown in Table 1).
3. Results
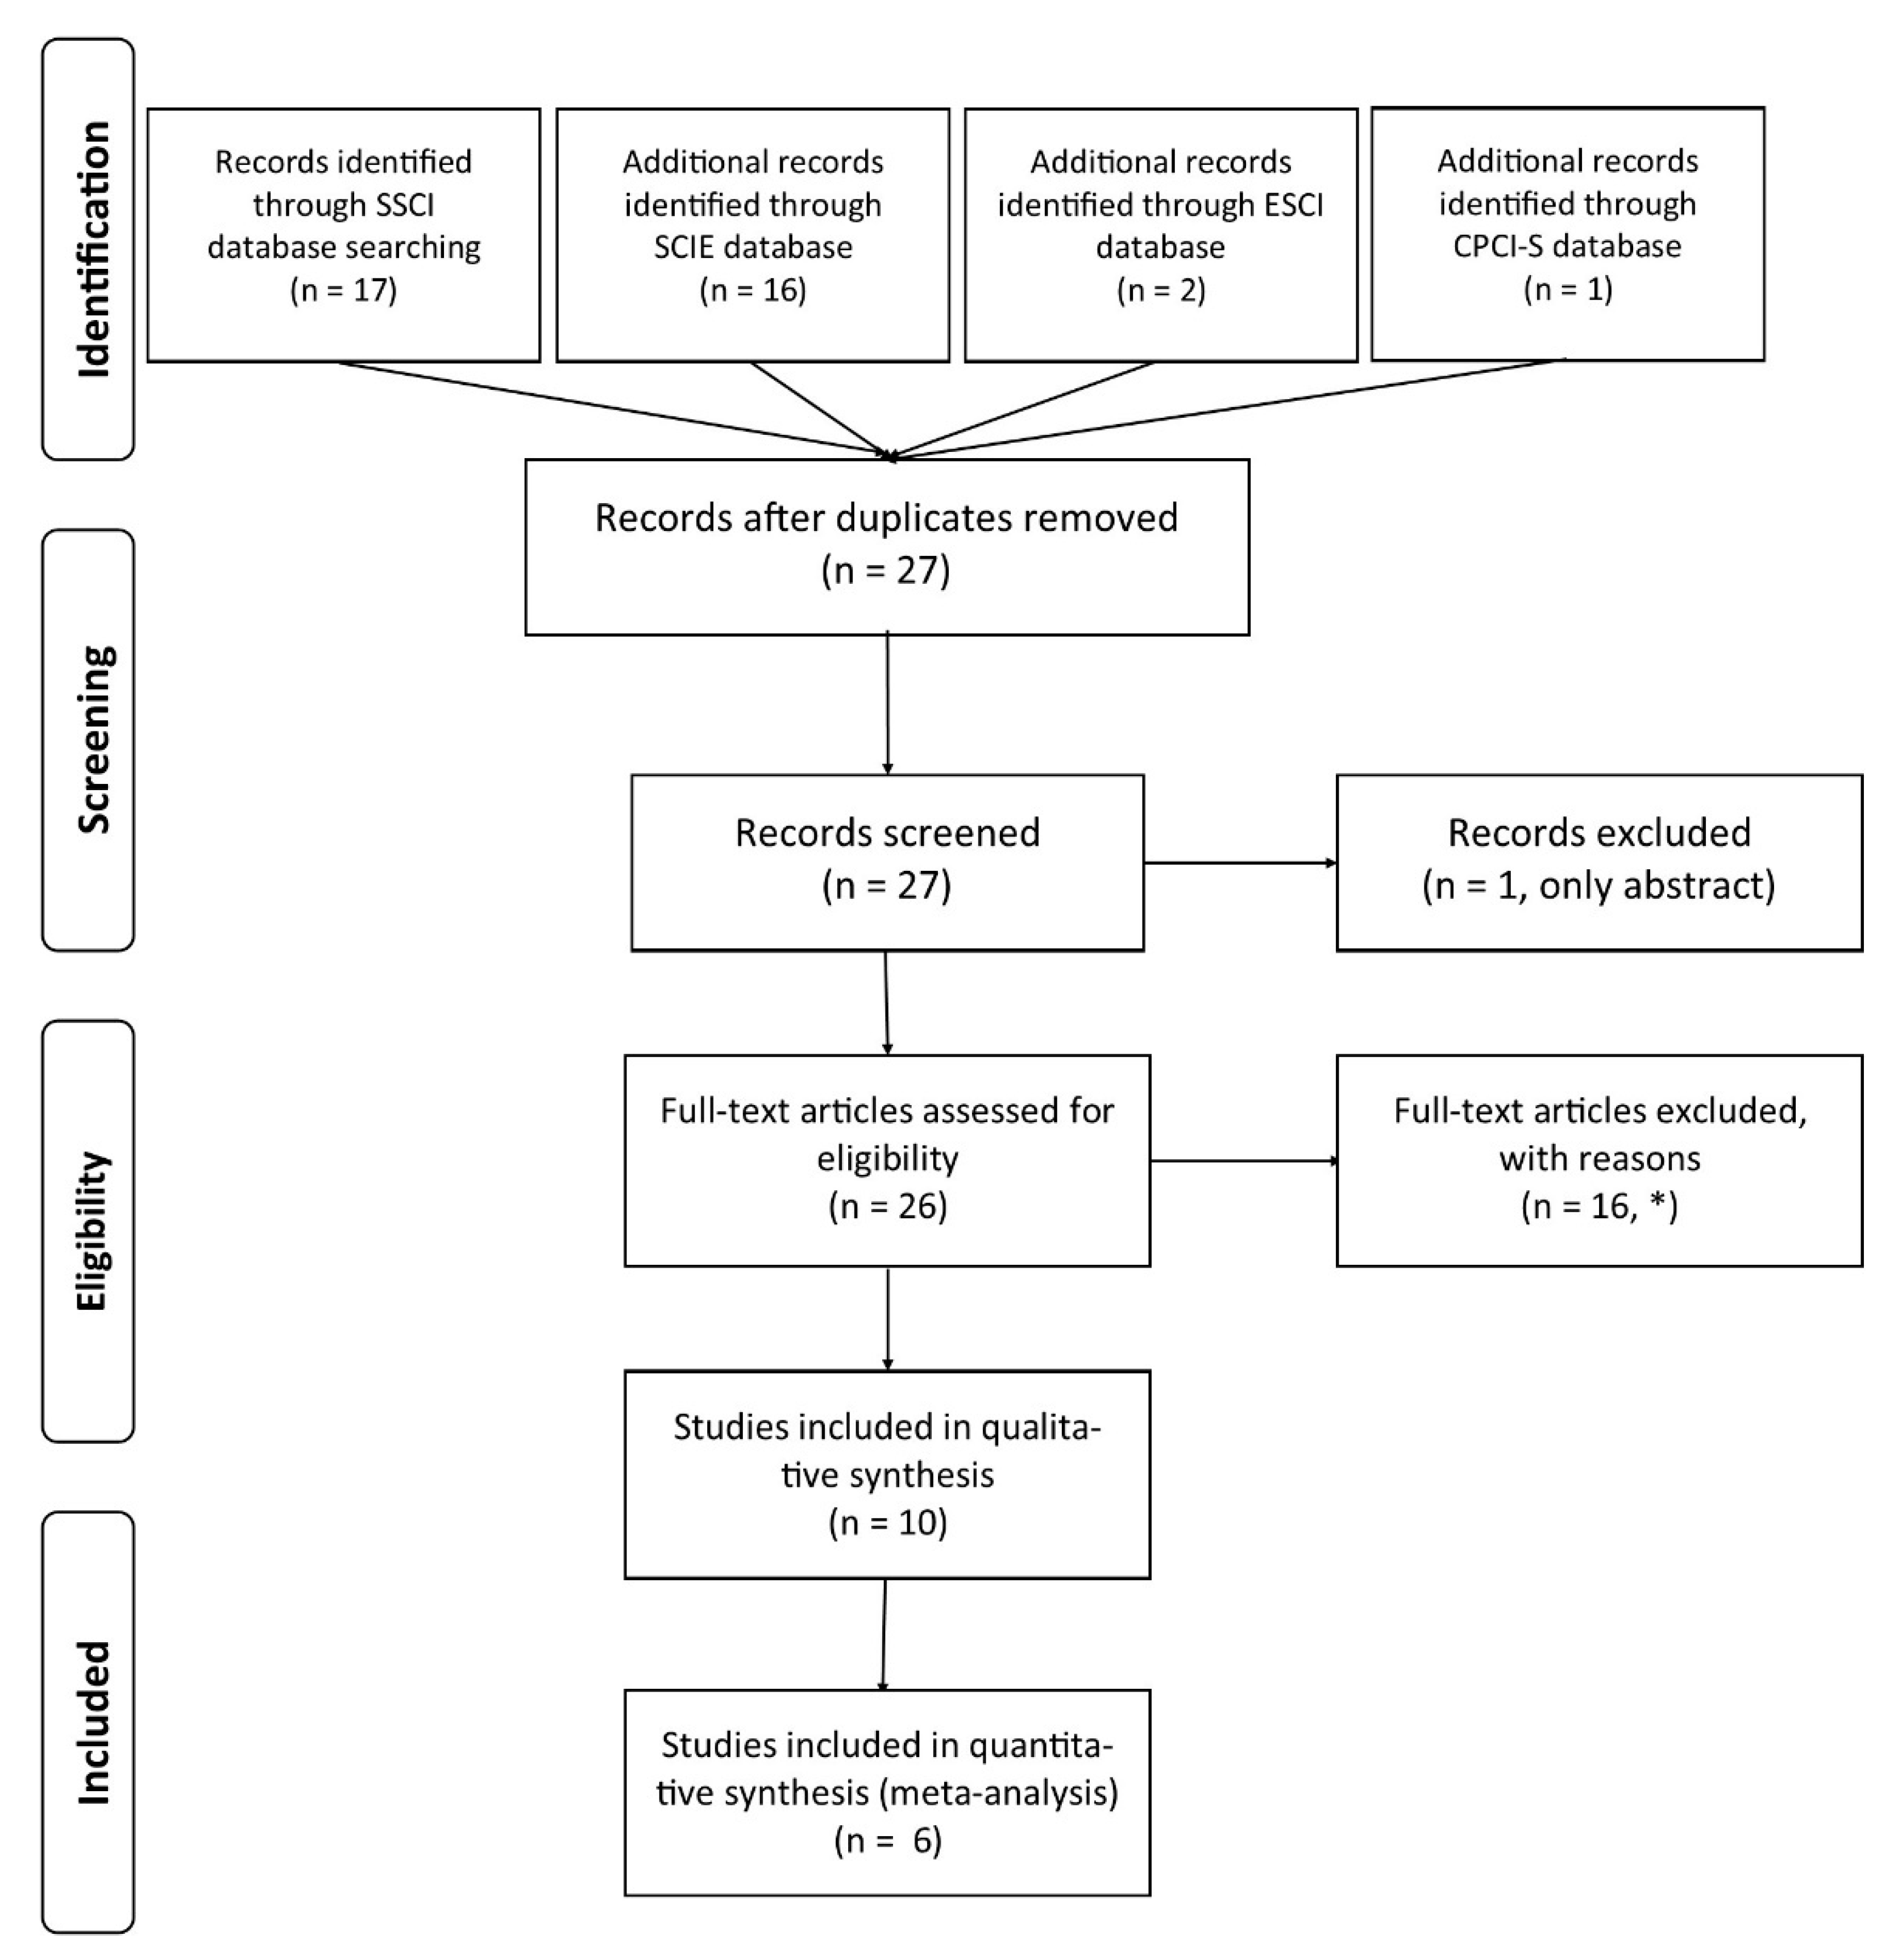
The scientometric search of articles identified a total of 36 documents from different databases in the Web of Science Core Collection (SSCI, SCIE, ESCI, and CPCI-S). There were 27 unique titles and abstracts (without repetitions; see Appendix E) and 26 full-text articles recovered and screened with the selection criteria defined with the PICOS tool.
The exclusions considered articles that referred to coastal port landscapes, dry ports, environmental innovation cases, green port fees, the hydraulic model test, port cities, port regions, and shipping. Additionally, there were articles involving theoretical discussions, literature reviews, qualitative methods (interviews), and mixed methods.
Thus, the screening identified 10 articles that fulfilled our inclusion criteria, as shown in Figure 1.
3.1. Qualitative Review Analysis
The 10 articles that met the eligibility criteria were reviewed at full-text level to accurately define whether their characteristics provided homogeneous criteria to make them comparable. Table 2 presents the main identification and recovery information obtained from WoS databases.
Table 2 shows a high presence of institutions mainly from Spain in four articles and three articles from Belgium, Canada, and the United Kingdom. A greater presence of the following organizations in the selected articles stands out: Cardiff University (UK), Dalhousie University (CA), Polytechnic University of Catalonia, and Polytechnic University of Valencia (SP). However, above all, we highlight the centrality of the Spanish Higher Education Institutions, which connects with organizations from Belgium, Canada, Croatia, and the United Kingdom.
In terms of thematic coverage, the 10 articles are mainly associated with the Environmental Sciences—WoS category. However, some of these articles address only one specific topic and not the set of topics that environmental sustainability (resources and environments) encompasses. Thus, carrying out qualitative review analyses on the full text of articles of research that focus exclusively on a single indicator or indicator on a specific topic was excluded, as was the case with the study of the carbon footprint (CO2) by Cloquell-Ballester et al. [53] in Valencia Port, and the use of data envelopment analysis (DEA) by Dong et al. [30] to rank 10 container ports that are part of the Maritime Silk Road (MSR), including the ports of Antwerp, Barcelona, Colombo, Dubai, Hamburg, Hong Kong, Kelang, Laem Chabang, Shanghai, and Singapore. In the case of Wooldridge [38], the focus was on biological indicators of ecology populations in the context of UK ports.
In the case of Siroka et al.’s [51] study, although it was mentioned that a collection of environmental indicators are applied to port authorities, the objective of the article differs from measurement or empirical evaluation, as its interest is in the interaction of the Internet of Things (IoT) for the calculation of a Port Environmental Index.
3.2. Quantitative Review Analysis
The set of selected articles was valued according to the breadth of topics on environmental sustainability that it addressed in its design and the diversity of port contexts that were applied (countries and ports). In this way, as seen in Table 3, the instruments of the 6 articles were compared with the environmental SDGs, and information on ports and port systems where these articles were applied since Lloyd’s List’s One Hundred Ports [92] and the UNCTAD Stat Maritime Profile was given [93].
The first thing to highlight is the time sequence that occurs between both articles by Puig et al. [65,66], which mainly focused on the ports of Central Europe, West Europe, and Southern Europe, with a great diversity of ports and national port systems. Klopott’s article [61] adopted the ESPO/EcoPorts survey as the basis for the dichotomous indicators exposed in his work applied to three Polish ports. The evolution stated in the article by Puig et al. [66] refers to an increase of 23 to 26 questions in the section “Environmental issues and monitoring”. This is therefore the most complete and current of the three, although the questions and indicators are only partially available in the main text of the publication and its references, limiting its replicability in other studies. It is also necessary to indicate that this set of articles takes the Self Diagnosis Method published in the article by Darbra et al. [94] as the basis reference for the research work developed. This author is also a co-author in Puig et al. [65,66], whose completeness of variables on the measurement scale is dichotomous, which delimits the possibility for the statistical analysis of data.
- Does the port have an environmental monitoring program?
- Does the program address air quality?
- Does the program address the carbon footprint?
- Does the program address energy consumption?
- Does the program address marine ecosystems?
- Does the program address noise?
- Does the program address sediment quality?
- Does the program address soil quality?
- Does the program address terrestrial habitats?
- Does the program address waste?
- Does the program address water consumption?
- Does the program address water quality?
- Has the port identified environmental performance indicators (EPIs) to monitor trends in environmental performance?
Secondly, for the articles by Walker [67] and Hossain et al. [68], there is also a direct connection, given the co-authoring of T.R. Walker in the second of these articles. Both mainly focused on Canadian ports with the following port-limited indicators: (1) greenhouse gases, (2) spill prevention, (3) dry bulk handling and storage, (4) community impacts, and (5) environmental leadership. Of those we considered, the first four as indicators of port environmental performance, it is also interesting to consider the indicators intended for shipowners, since they also occur when ships are in port: Aquatic invasive species (for ballast water), air emissions (SOx, PM, and NOx), cargo residues (loading and unloading solid bulk), oily water (by water, fuel, or oil mix during maintenance operations), and waste management. Another relevant aspect is the use of the ordinal scale (indicator criterion) adopted from the GM/GMEP [67,68]:
- Level 1—Monitoring of regulations.
- Level 2—Systematic use of a defined number of best practices.
- Level 3—Integration of best practices into an adopted management plan and quantifiable understanding of environmental impacts.
- Level 4—Introduction of new technologies.
- Level 5—Excellence and leadership.
As a third alternative that emphasizes more technical indicators and measurement parameters but was also developed using the ESPO/EcoPorts Framework, the study of Le et al. [42] in two Bulgarian ports is presented. The performance of some of these measurements involves higher technical requirements for data collection but allows access to more accurate information (mainly ratio scale) for decision-making by port authorities regarding environmental performance in ports (See Table 4).
As a result, we can highlight the existence of only two frameworks for environmental performance in ports, namely the American contribution created by Green Marine, and the European development EcoPorts.
4. Discussion
Once the researchers were systematized, we were faced with three sets of alternatives, but we avoided the depth of parameters reached by Le et al. [42] and their emphasis on measuring aquatic indicators. The support and inspiration of the research was reduced to the GMEP of Green Marine and the advances of the EcoPorts—ESPO project.
As for the environmental factors, the Sustainable Development Goals were emphasized, although these are the product of the indicators included on Life Below Water (SDG 14) as a context of interaction and Responsible Consumption and Production (SDG 12), mainly given the waste of port activity and transfer of waste from docked vessels as well as the acoustic contamination that particularly impacts ports located within port cities. In the resources field, compared to many previous studies, the absence of an emphasis on Affordable and Clean Energy (SDG 7) is notorious. Apparently undimotor, photovoltaic, coastal, and offshore generation aero generators (blue energetic economy), to name a few, are understood as alternatives and are even considered experimental methods that fall within the boundaries of the port authority or territorial jurisdiction but not as integral parts of the seaport. Specific situations are given by the possibility of operating with clean energy in some port activities or providing them to ships in port, as well as the possibility of providing LNG as fuel, which will undoubtedly occur more and more every day based on other developments in the energy industry.
Referring port contributions and performance to the SDG—Environments, the 13th SDG on Climate Action is generally remarkable and has great emphasis within the frameworks of GMEP and EcoPorts. This is consistent with the global establishment of the Conference Overall of Parts (COP) from the United Nations Framework Convention on Climate Change (UNFCCC) and the objectives of the Paris Agreement, but these initiatives are established even above the presence of indicators related to the 14th SDG concerning “the oceans, seas and marine resources”.
The application range achieved with ESPO/EcoPorts supported by Puig et al. [65,66] and researchers in 2017 and 2020 is certainly much higher than that achieved with the other four research areas. This does not imply scientific validation but gives an account of the possibility of effective implementation in various national realities, scales, and port contexts. Without a doubt, the use of dichotomous scales is a weakness for the purpose of trying to deepen statistical analyses. In this respect, Walker [67] and Hossain’s work [68] gained ground by using ordinal scales (although both studies do not present statistical tests), although it is necessary to expand them beyond the Canadian context and some US ports. This is not only because it is a matter of national scope, but because of the possibility of having a port range that could cover other scale size realities in addition to providing accurate indicators for Clean Water and Sanitation (SDG 6) and Affordable and Clean Energy (SDG 7). While both approaches achieve greater relevance to the set of analyzed research, achieving an instrument that allows good thematic coverage and the possibility for further statistical analysis requires the integration of both scales, generating synergies based on the advantages detailed above.
5. Conclusions
This research identifies consolidated forms of EPP measurement under GMEP [67,68] and EcoPorts [42,61,65,66], which, in terms of measurement complexity and analysis possibilities, highlights the aspect of GMEP in the instruments applied by Walker [67] and Hossain et al. [68]. Additionally, it provides adequate instruments and indicators for measuring environmental performance in ports within the framework of the SDGs.
A strong limitation to the widespread study of indicators in the port field is distinguishing the measurements of SDG 6 (Clean Water and Sanitation) from those strictly associated with SDG 14 (Life Below Water): the same water cycle, coastal geomorphology, the large number of effluents present in coastal areas and inland waterways, the recirculation of this resource for human or industrial consumption, and the hydro social cycle. The difficulty is that it can only be seen in the environmental measurement context of a specific port.
Regarding future research lines, it is relevant to conduct further EPP studies on less studied geographical areas to determine the effects of this phenomenon on the sustainability of those countries and territories in addition to advancing the development of specific measuring instruments for certain types of port terminals (e.g., fishing terminals, bulk terminals, oil terminals, ore terminals). Finally, it is important to increase our understanding of the effects of environmental public policies on EPP in search of greater contributions from the 2030 SDG Agenda.
Author Contributions
Conceptualization, A.V.-M.; methodology, A.V.-M.; software, A.V.-M.; validation, J.S.-V. and J.F.E.-C.; formal analysis, J.F.E.-C.; writing—original draft preparation, G.S.-S. and J.S.-V.; writing—review and editing, A.V.-M. and J.F.E.-C.; supervision, J.F.E.-C.; project administration, A.V.-M.; funding acquisition, G.S.-S. All authors have read and agreed to the published version of the manuscript.
Funding
The APC was partially funded by Universidad Católica de la Santísima Concepción.
Institutional Review Board Statement
Not applicable.
Informed Consent Statement
Not applicable.
Data Availability Statement
Not applicable.
Acknowledgments
The authors appreciate the comments received by the Technical Commissions of the Asociación Internacional de Profesionales en Puertos y Costas (AIPPYC) during the development of this review.
Conflicts of Interest
The authors declare no conflict of interest.
Appendix A. Goal 14 Targets (Extracted from the United Nations SDGs)
14.1. By 2025, the aim of the SDGs [95] is to prevent and significantly reduce marine pollution of all kinds, in particular, from land-based activities, including marine debris and nutrient pollution.
14.2. By 2020, the aim is to sustainably manage and protect marine and coastal ecosystems to avoid significant adverse impacts, including strengthening their resilience and taking restorative action in order to achieve healthy and productive oceans.
14.3. Minimize and address the impacts of ocean acidification, including through enhanced scientific cooperation at all levels.
14.4. By 2020, the aim is to effectively regulate harvesting and end overfishing, illegal, unreported and unregulated fishing, and destructive fishing practices and to implement science-based management plans in order to restore fish stocks in the shortest time feasible, at least to levels that can produce the maximum sustainable yield, as determined by their biological characteristics.
14.5. By 2020, the aim is to conserve at least 10 per cent of coastal and marine areas, consistent with national and international laws and based on the best available scientific information.
14.6. By 2020, the aim is to prohibit certain forms of fishery subsidies that contribute to overcapacity and overfishing; eliminate subsidies that contribute to illegal, unreported, and unregulated fishing; and refrain from introducing new subsidies, recognizing that appropriate and effective special and differential treatment for developing and the least developed countries should be an integral part of World Trade Organization fishery subsidies negotiation.
14.7. By 2030, the aim is to increase the economic benefits to small island developing states and the least developed countries from the sustainable use of marine resources, including the sustainable management of fisheries, aquaculture, and tourism.
14.A. Increase scientific knowledge, develop research capacity, and transfer marine technology, taking into account the Intergovernmental Oceanographic Commission Criteria and Guidelines on the Transfer of Marine Technology in order to improve ocean health and to enhance the contribution of marine biodiversity to the development of developing countries, in particular small island developing states and the least developed countries.
14.B. Provide access for small-scale artisanal fishers to marine resources and markets.
14.C. Enhance the conservation and sustainable use of oceans and their resources by implementing international laws, as reflected in UNCLOS, which provides the legal framework for the conservation and sustainable use of oceans and their resources, as recalled in paragraph 158 of The Future We Want.
Appendix B. Get to Know the Sustainable Small-Scale Fisheries (SSF) Guidelines
The SSF Guidelines [96] mention that “The principles in the Voluntary Guidelines for Securing Sustainable Small-Scale Fisheries in the Context of Food Security and Poverty Eradication (SSF Guidelines) address policies, strategies and legal frameworks concerning small-scale fisheries, but also other matters affecting lives and livelihood in fishing communities. They have a clear human rights-based approach, and they put people, rather than fish, in focus. The SSF Guidelines are global in scope, and they guide dialogue, policy processes and actions at national, regional and international level. Key issues in the SSF Guidelines include managing resources and allocating tenure rights responsibly; supporting social development and decent work; looking at fish workers along the entire value chain from catching through processing to trading fish; promoting gender equality; and taking into account climate change and disaster risk.”
Appendix C. EcoPorts Self Diagnosis Method (SDM) Tools
“The Self Diagnosis Method consists of three parts:
- -
- The SDM checklist: Filling in the SDM checklist is your ‘passport’ to the EcoPorts network.
- -
- SDM Comparison: Compare your SDM score with the European average
- -
- SDM Review: Review your SDM score and receive expert’s advice and customized recommendations.” [97]
Appendix D. Green Marine Environmental Program
“Green Marine environmental certification program offers a detailed framework for maritime companies to first establish and then reduce their environmental footprint. It is aimed at ship owners, port authorities, Seaway corporations, terminal operators, and shipyard managers who have to demonstrate year-over-year improvements in measurable ways to maintain their Green Marine certification. Using 14 performance indicators, our comprehensive program addresses key environmental issues in regard to air, land and water pollution: Aquatic invasive species, Cargo residues, Community impacts, Community relations, Dry bulk handling and storage, Environmental leadership, Greenhouse gas emissions, Oily discharge, Pollutant air emissions NOx, Pollutant air emissions SOx & PM, Prevention of spills and leakages, Ship recycling, Underwater noise, and Waste management”. [98]
Appendix E
The appendix shows the WoS identifiers (UT) for the 27 articles identified with the studied search vector: UT = (WOS:000610325000001 OR WOS:000599420700002 OR WOS:000591903100003 OR WOS:000589167700001 OR WOS:000587626600014 OR WOS:000555929300001 OR WOS:000501387300060 OR WOS:000492012000002 OR WOS:000489104700305 OR WOS:000474313500005 OR WOS:000473750500160 OR WOS:000483416200008 OR WOS:000462661000276 OR WOS:000443791700034 OR WOS:000427211900009 OR WOS:000443699800004 OR WOS:000407529200024 OR WOS:000382229500025 OR WOS:000375816000037 OR WOS:000375604500007 OR WOS:000336709500011 OR WOS:000328602300003 OR WOS:000322696900004 OR WOS:000209271500009 OR WOS:000288689700004 OR WOS:000081998200010 OR WOS:A1993LU58500002).
References
- Visbeck, M.; Kronfeld-Goharani, U.; Neumann, B.; Rickels, W.; Schmidt, J.; van Doorn, E.; Matz-Lück, N.; Ott, K.; Quaas, M.F. Securing blue wealth: The need for a special sustainable development goal for the ocean and coasts. Mar. Policy 2014, 48, 184–191. [Google Scholar] [CrossRef] [Green Version]
- García-Llave, R.; Piniella, F.; Acosta-Sánchez, M. Maritime Interdiction on The High Seas: A Case Study of Spain and The Concept of ‘Universal Jurisdiction. J. Marit. Res. 2015, 12, 77–88. [Google Scholar]
- Okafor-Yarwood, I. Illegal, unreported and unregulated fishing, and the complexities of the sustainable development goals (SDGs) for countries in the Gulf of Guinea. Mar. Policy 2019, 99, 414–422. [Google Scholar] [CrossRef] [Green Version]
- Visbeck, M.; Kronfeld-Goharani, U.; Neumann, B.; Rickels, W.; Schmidt, J.; Van Doorn, E.; Matz-Lück, N.; Proelss, A. A Sustainable Development Goal for the Ocean and Coasts: Global ocean challenges benefit from regional initiatives supporting globally coordinated solutions. Mar. Policy 2014, 49, 87–89. [Google Scholar] [CrossRef]
- Gifford, E.; McKelvey, M. Knowledge-Intensive Entrepreneurship and S3: Conceptualizing Strategies for Sustainability. Sustainability 2019, 11, 4824. [Google Scholar] [CrossRef] [Green Version]
- Hermann, L.; Kraus, F.; Hermann, R. Phosphorus Processing—Potentials for Higher Efficiency. Sustainability 2018, 10, 1482. [Google Scholar] [CrossRef] [Green Version]
- Arana-Landin, S. Social Economy as the Means to Help Achieve the Targets of Sustainable Development Goal 14. Sustainability 2020, 12, 4529. [Google Scholar] [CrossRef]
- Said, A.; Chuenpagdee, R. Aligning the sustainable development goals to the small-scale fisheries guidelines: A case for EU fisheries governance. Mar. Policy 2019, 107. [Google Scholar] [CrossRef]
- Haas, B.; Fleming, A.; Haward, M.; McGee, J. Big fishing: The role of the large-scale commercial fishing industry in achieving Sustainable Development Goal 14. Rev. Fish Biol. Fish. 2019, 29, 161–175. [Google Scholar] [CrossRef]
- Haas, B.; Haward, M.; McGee, J.; Fleming, A. Explicit targets and cooperation: Regional fisheries management organizations and the sustainable development goals. Int. Environ. Agreem. PoliticsLaw Econ. 2014, 1–13. [Google Scholar] [CrossRef]
- González-Del-Campo, A.; Gazzola, P.; Onyango, V. The mutualism of strategic environmental assessment and sustainable development goals. Environ. Impact Assess. Rev. 2020, 82. [Google Scholar] [CrossRef]
- Pedercini, M.; Zuellich, G.; Dianati, K.; Arquitt, S. Toward achieving Sustainable Development Goals in Ivory Coast: Simulating pathways to sustainable development. Sustain. Dev. 2018, 26, 588–595. [Google Scholar] [CrossRef]
- Mohammed, E.Y.; Steinbach, D.; Steele, P. Fiscal reforms for sustainable marine fisheries governance: Delivering the SDGs and ensuring no one is left behind. Mar. Policy 2018, 93, 262–270. [Google Scholar] [CrossRef]
- Garland, M.; Axon, S.; Graziano, M.; Morrissey, J.; Heidkamp, C.P. The blue economy: Identifying geographic concepts and sensitivities. Geogr. Compass. 2019, 13, e12445. [Google Scholar] [CrossRef] [Green Version]
- Winder, G.M.; Le Heron, R. Assembling a Blue Economy moment? Geographic engagement with globalizing biological-economic relations in multi-use marine environments. Dialogues Hum. Geogr. 2017, 7, 3–26. [Google Scholar] [CrossRef] [Green Version]
- McKinley, E.; Aller-Rojas, O.; Hattam, C.; Germond-Duret, C.; San Martín, I.; Hopkins, C.; Aponte, H.; Potts, T. Charting the course for a blue economy in Peru: A research agenda. Environ. Dev. Sustain. 2019, 21, 2253–2275. [Google Scholar] [CrossRef] [Green Version]
- Mulazzani, L.; Malorgio, G. Blue growth and ecosystem services. Mar. Policy 2017, 85, 17–24. [Google Scholar] [CrossRef]
- Sarker, S.; Bhuyan, A.; Rahman, M.M.; Islam, M.A.; Hossain, M.S.; Basak, S.C.; Islam, M.M. From science to action: Exploring the potentials of Blue Economy for enhancing economic sustainability in Bangladesh. Ocean Coast. Manag. 2018, 157, 180–192. [Google Scholar] [CrossRef]
- Voyer, M.; van Leeuwen, J. Social license to operate’ in the Blue Economy. Resour. Policy 2019, 62, 102–113. [Google Scholar] [CrossRef]
- Voyer, M.; Farmery, A.K.; Kajlich, L.; Vachette, A.; Quirk, G. Assessing policy coherence and coordination in the sustainable development of a Blue Economy. A case study from Timor Leste. Ocean Coast. Manag. 2020, 192, 105187. [Google Scholar] [CrossRef]
- Mallin, F.; Barbesgaard, M. Awash with contradiction: Capital, ocean space and the logics of the Blue Economy Paradigm. Geoforum 2020, 113, 121–132. [Google Scholar] [CrossRef]
- Bennett, N.J. Marine Social Science for the Peopled Seas. Coast. Manag. 2019, 47, 244–252. [Google Scholar] [CrossRef] [Green Version]
- Katila, J.; Ala-Rami, K.; Repka, S.; Rendon, E.; Torronen, J. Defining and quantifying the sea-based economy to support regional blue growth strategies—Case Gulf of Bothnia. Mar. Policy 2019, 100, 215–225. [Google Scholar] [CrossRef]
- Akpomera, E. Africa’s Blue Economy: Potentials and challenges for more locally beneficial development. Rev. Afr. Political Econ. 2020, 47, 651–661. [Google Scholar] [CrossRef]
- Hassanali, K. CARICOM and the blue economy—Multiple understandings and their implications for global engagement. Mar. Policy 2020, 120. [Google Scholar] [CrossRef]
- Pinto, H.; Cruz, A.R.; Combe, C. Cooperation and the emergence of maritime clusters in the Atlantic: Analysis and implications of innovation and human capital for blue growth. Mar. Policy 2015, 57, 167–177. [Google Scholar] [CrossRef] [Green Version]
- Hoerterer, C.; Schupp, M.F.; Benkens, A.; Nickiewicz, D.; Krause, G.; Buck, B.H. Stakeholder Perspectives on Opportunities and Challenges in Achieving Sustainable Growth of the Blue Economy in a Changing Climate. Front. Mar. Sci. 2020, 6, 795. [Google Scholar] [CrossRef]
- Zheng, Y.; Zhao, J.; Shao, G. Port City Sustainability: A Review of Its Research Trends. Sustainability 2020, 12, 8355. [Google Scholar] [CrossRef]
- Norshafinas, B.A.; Mohamad, R.O.; Mohd, S.I.; Saadon, D.A.; Mohamed, N. Sustainable development goal of the recreation port: The case study of the Duyong marina & resort, Terengganu, Malaysia. J. Crit. Rev. 2020, 7, 1449–1454. [Google Scholar] [CrossRef]
- Dong, G.; Zhu, J.; Li, J.; Wang, H.; Gajpal, Y. Evaluating the Environmental Performance and Operational Efficiency of Container Ports: An Application to the Maritime Silk Road. Int. J. Environ. Res. Public Health 2019, 16, 2226. [Google Scholar] [CrossRef] [Green Version]
- Lawer, E.T. Transnational networks for the ‘greening’ of ports: Learning from best practice? GeoJournal 2019. [Google Scholar] [CrossRef]
- Stein, M.; Acciaro, M. Value Creation through Corporate Sustainability in the Port Sector: A Structured Literature Analysis. Sustainability 2020, 12, 5504. [Google Scholar] [CrossRef]
- Karani, P.; Failler, P. Comparative coastal and marine tourism, climate change, and blue economy in African Large Marine Ecosystems. Environ. Dev. 2020, 100572. [Google Scholar] [CrossRef]
- Novaglio, C.; Bax, N.; Boschetti, F.; Emad, G.R.; Frusher, S.; Fullbrook, L.; Hemer, M.; Jennings, S.; Van Putten, I.; Robinson, L.M.; et al. Deep aspirations: Towards a sustainable offshore Blue Economy. Rev. Fish Biol. Fish. 2021, 21, 1–22. [Google Scholar] [CrossRef]
- Slišković, M.; Ukić Boljat, H.; Jelaska, I.; Jelić Mrčelić, G. Review of Generated Waste from Cruisers: Dubrovnik, Split, and Zadar Port Case Studies. Resources 2018, 7, 72. [Google Scholar] [CrossRef] [Green Version]
- Wu, X.; Zhang, L.; Yang, H.-C. Integration of Eco-centric Views of Sustainability in Port Planning. Sustainability 2020, 12, 2971. [Google Scholar] [CrossRef] [Green Version]
- Lawer, E.T.; Herbeck, J.; Flitner, M. Selective Adoption: How Port Authorities in Europe and West Africa Engage with the Globalizing ‘Green Port’ Idea. Sustainability 2019, 11, 5119. [Google Scholar] [CrossRef] [Green Version]
- Wooldridge, C.F.; McMullen, C.; Howe, V. Environmental management of ports and harbours—Implementation of policy through scientific monitoring. Mar. Policy 1999, 23, 413–425. [Google Scholar] [CrossRef]
- Di Vaio, A.; Varriale, L. Management Innovation for Environmental Sustainability in Seaports: Managerial Accounting Instruments and Training for Competitive Green Ports beyond the Regulations. Sustainability 2018, 10, 783. [Google Scholar] [CrossRef] [Green Version]
- Cavagnaro, R.J.; Copping, A.E.; Green, R.; Greene, D.; Jenne, S.; Rose, D.; Overhus, D. Powering the Blue Economy: Progress Exploring Marine Renewable Energy Integration With Ocean Observations. Mar. Technol. Soc. J. 2020, 54, 114–125. [Google Scholar] [CrossRef]
- Yigit, K.; Kokkulunk, G.; Parlak, A.; Karakas, A. Energy cost assessment of shoreside power supply considering the smart grid concept: A case study for a bulk carrier ship. Marit. Policy Manag. 2016, 43, 469–482. [Google Scholar] [CrossRef]
- Le, X.Q.; Hens, L.; Stoyanov, S. Water management in the framework of environmental management systems in Bulgarian seaports. Phys. Chem. EarthParts A/B/C 2011, 36, 141–149. [Google Scholar] [CrossRef]
- Balbaa, A.; Swief, R.A.; El-Amary, N.H. Smart Integration Based on Hybrid Particle Swarm Optimization Technique for Carbon Dioxide Emission Reduction in Eco-Ports. Sustainability 2019, 11, 2218. [Google Scholar] [CrossRef] [Green Version]
- Contestabile, P.; Vicinanza, D. Coastal Defence Integrating Wave-Energy-Based Desalination: A Case Study in Madagascar. J. Mar. Sci. Eng. 2018, 6, 64. [Google Scholar] [CrossRef] [Green Version]
- Contestabile, P.; Di Lauro, E.; Buccino, M.; Vicinanza, D. Economic Assessment of Overtopping BReakwater for Energy Conversion (OBREC): A Case Study in Western Australia. Sustainability 2017, 9, 51. [Google Scholar] [CrossRef]
- Esteban, M.D.; López-Gutiérrez, J.-S.; Negro, V. Gravity-Based Foundations in the Offshore Wind Sector. J. Mar. Sci. Eng. 2019, 7, 64. [Google Scholar] [CrossRef] [Green Version]
- Li, L.; Zhu, J.; Ye, G.; Feng, X. Development of Green Ports with the Consideration of Coastal Wave Energy. Sustainability 2018, 10, 4270. [Google Scholar] [CrossRef] [Green Version]
- Yu, J.; Voß, S.; Tang, G. Strategy development for retrofitting ships for implementing shore side electricity. Transp. Res. Part D Transp. Environ. 2019, 74, 201–213. [Google Scholar] [CrossRef]
- Simonsen, M.; Gossling, S.; Walnum, H.J. Cruise ship emissions in Norwegian waters: A geographical analysis. J. Transp. Geogr. 2019, 78, 87–97. [Google Scholar] [CrossRef]
- Sanabra, M.C.; Santamaria, J.J.U.; De Oses, F.X.M. Manoeuvring and hotelling external costs: Enough for alternative energy sources? Marit. Policy Manag. 2014, 41, 42–60. [Google Scholar] [CrossRef] [Green Version]
- Široka, M.; Pilicic, S.; Milosevic, T.; Lacalle, I.; Traven, L. A novel approach for assessing the ports’ environmental impacts in real time—The IoT based port environmental index. Ecol. Indic. 2021, 120, 106949. [Google Scholar] [CrossRef]
- Fazia, C.; Errigo, M.F. The coastal port landscape: New opportunities for tourism and challenges for clean energy. Int. J. Urban Plan. 2017, 10, 57–74. [Google Scholar]
- Cloquell-Ballester, V.; Lo-Iacono-Ferreira, V.G.; Artacho-Ramírez, M.Á.; Capuz-Rizo, S.F. The Carbon Footprint of Valencia Port: A Case Study of the Port Authority of Valencia (Spain). Int. J. Environ. Res. Public Health 2020, 17, 8157. [Google Scholar] [CrossRef] [PubMed]
- Poulsen, R.T.; Ponte, S.; Sornn-Friese, H. Environmental upgrading in global value chains: The potential and limitations of ports in the greening of maritime transport. Geoforum 2018, 89, 83–95. [Google Scholar] [CrossRef] [Green Version]
- Cammin, P.; Yu, J.; Heilig, L.; Voss, S. Monitoring of air emissions in maritime ports. Transp. Res. Part D Transp. Environ. 2020, 87. [Google Scholar] [CrossRef]
- Lee, T.; Yeo, G.T.; Thai, V. Environmental efficiency analysis of port cities: Slacks-based measure data envelopment analysis approach. Transp. Policy 2014, 33, 82–88. [Google Scholar] [CrossRef]
- Zhu, M.; Yuen, K.F.; Ge, J.; Li, K. Impact of maritime emissions trading system on fleet deployment and mitigation of CO2 emission. Transp. Res. Part D Transp. Environ. 2018, 62, 474–488. [Google Scholar] [CrossRef]
- Wang, T.; Du, Y.; Fang, D.; Li, Z.C. Berth Allocation and Quay Crane Assignment for the Trade-off Between Service Efficiency and Operating Cost Considering Carbon Emission Taxation. Transp. Sci. 2020, 54. [Google Scholar] [CrossRef]
- Mjelde, A.; Endresen, O.; Bjorshol, E.; Gierloff, C.W.; Husby, E.; Solheim, J.; Mjos, N.; Eide, M.S. Differentiating on port fees to accelerate the green maritime transition. Mar. Pollut. Bull. 2019, 149, 110561. [Google Scholar] [CrossRef] [PubMed]
- Taljaard, S.; Slinger, J.H.; Arabi, S.; Weerts, S. The natural environment in port development: A ‘green handbrake’ or an equal partner? Ocean Coast. Manag. 2021, 199. [Google Scholar] [CrossRef]
- Klopott, M. Restructuring of environmental management in Baltic ports: Case of Poland. Marit. Policy Manag. 2013, 40, 439–450. [Google Scholar] [CrossRef]
- Stanković, J.J.; Marjanović, I.; Papathanasiou, J.; Drezgić, S. Social, Economic and Environmental Sustainability of Port Regions: MCDM Approach in Composite Index Creation. J. Mar. Sci. Eng. 2021, 9, 74. [Google Scholar] [CrossRef]
- Liao, M.S.; Ding, J.F.; Liang, G.S.; Lee, K.L. Key Criteria for Evaluating the Green Performance of Ports. J. Test. Eval. 2016, 44, 20140354. [Google Scholar] [CrossRef]
- Wan, C.P.; Zhang, D.; Yan, X.P.; Yang, Z.L. A novel model for the quantitative evaluation of green port development—A case study of major ports in China. Transp. Res. Part D Transp. Environ. 2017, 61. [Google Scholar] [CrossRef]
- Puig, M.; Michail, A.; Wooldridge, C.; Darbra, R. Benchmark dynamics in the environmental performance of ports. Mar. Pollut. Bull. 2017, 121. [Google Scholar] [CrossRef]
- Puig, M.; Raptis, S.; Wooldridge, C.; Darbra, R.M. Performance trends of environmental management in European ports. Mar. Pollut. Bull. 2020, 111686. [Google Scholar] [CrossRef]
- Walker, T. Green Marine: An environmental program to establish sustainability in marine transportation. Mar. Pollut. Bull. 2016, 105, 199–207. [Google Scholar] [CrossRef] [PubMed]
- Hossain, T.; Adams, M.; Walker, T. Sustainability initiatives in Canadian ports. Mar. Policy 2019. [Google Scholar] [CrossRef]
- Hall, P.; O’Brien, T.; Woudsma, C. Environmental innovation and the role of stakeholder collaboration in West Coast port gateways. Res. Transp. Econ. 2013, 42, 87–96. [Google Scholar] [CrossRef]
- Polanco-Pérez, J.; Search, F.V.; Winckler, P.; Ochoa-Muñoz, M.J.; Landaeta, M. Unexpected effects of coastal storms on trophic ecology of two rocky reef fish species. Mar. Biol. 2021, 168, 20. [Google Scholar] [CrossRef]
- Valenzuela, V.P.B.; Samarasekara, R.S.M.; Kularathna, A.H.T.S.; Perez, G.C.C.; Norikazu, F.; Crichton, R.N.; Quiroz, M.; Yavar, R.; Izumi, I.; Aranguiz, R.; et al. Comparative Analysis of Tsunami Recovery Strategies in Small Communities in Japan and Chile. Geosciences 2019, 9, 26. [Google Scholar] [CrossRef] [Green Version]
- Seisdedos, M.; Carrasco, P. Port Projects in Blue Economy: Port of Motril-Granada. J. Coast. Res. 2020, 95, 940. [Google Scholar] [CrossRef]
- Khaslavskaya, A.; Roso, V. Outcome-Driven Supply Chain Perspective on Dry Ports. Sustainability 2019, 11, 1492. [Google Scholar] [CrossRef] [Green Version]
- Kotowska, I.; Mańkowska, M.; Pluciński, M. Inland Shipping to Serve the Hinterland: The Challenge for Seaport Authorities. Sustainability 2018, 10, 3468. [Google Scholar] [CrossRef] [Green Version]
- Moher, D.; Liberati, A.; Tetzlaff, J.; Altman, D.G.; The PRISMA Group. Preferred Reporting Items for Systematic Reviews and Meta-Analyses: The PRISMA Statement. PLoS Med. 2009, 6, e1000097. [Google Scholar] [CrossRef] [PubMed] [Green Version]
- Methley, A.M.; Campbell, S.; Chew-Graham, C.; McNally, R.; Cheraghi-Sohi, S. PICO, PICOS and SPIDER: A comparison study of specificity and sensitivity in three search tools for qualitative systematic reviews. BMC Health Serv. Res. 2014, 14, 579. [Google Scholar] [CrossRef] [Green Version]
- Solé, L.; Ariza, E. A wider view of assessments of ecosystem services in coastal areas: The perspective of social-ecological complexity. Ecol. Soc. 2019, 24. [Google Scholar] [CrossRef]
- Porter, A.L.; Kongthon, A.; Lu, J.C. Research profiling: Improving the literature review. Scientometrics 2002, 53, 351–370. [Google Scholar] [CrossRef]
- Sun, J.; Wang, M.-H.; Ho, Y.-S. A historical review and bibliometric analysis of research on estuary pollution. Mar. Pollut. Bull. 2012, 64, 13–21. [Google Scholar] [CrossRef] [PubMed]
- Stojanovic, T.; McNae, H.; Tett, P.; Potts, T.W.; Reis, J.; Smith, H.D.; Dillingham, I. The “social” aspect of social-ecological systems: A critique of analytical frameworks and findings from a multisite study of coastal sustainability. Ecol. Soc. 2016, 21. [Google Scholar] [CrossRef] [Green Version]
- Wang, L.; Xue, X.; Zhao, Z.; Wang, Z. The Impacts of Transportation Infrastructure on Sustainable Development: Emerging Trends and Challenges. Int. J. Environ. Res. Public Health 2018, 15, 1172. [Google Scholar] [CrossRef] [PubMed] [Green Version]
- Vega-Muñoz, A.; Arjona-Fuentes, J.M.; Ariza-Montes, A.; Han, H.; Law, R. In search of ‘a research front’ in cruise tourism studies. Int. J. Hosp. Manag. 2020, 85, 102353. [Google Scholar] [CrossRef]
- Kullenberg, C.; Kasperowski, D. What Is Citizen Science? A Scientometric Meta-Analysis. PLoS ONE 2016, 11, e0147152. [Google Scholar] [CrossRef] [Green Version]
- Mikhaylov, A.; Mikhaylova, A.; Hvaley, D. Knowledge Hubs of Russia: Bibliometric Mapping of Research Activity. J. Scientometr. Res. 2020, 9, 1–10. [Google Scholar] [CrossRef]
- Albort-Morant, G.; Henseler, J.; Leal-Millán, A.; Cepeda-Carrión, G. Mapping the Field: A Bibliometric Analysis of Green Innovation. Sustainability 2017, 9, 1011. [Google Scholar] [CrossRef] [Green Version]
- Vega-Muñoz, A.; Arjona-Fuentes, J.M. Social Networks and Graph Theory in the Search for Distant Knowledge in the Field of Industrial Engineering. In Advanced Applications of Graph Theory in Modern Society; Pal, M., Samanta, S., Pal, A., Eds.; IGI-Global: Hershey, PA, USA, 2020; pp. 397–418. [Google Scholar] [CrossRef]
- Kazerani, M.; Davoudian, A.; Zayeri, F.; Soori, H. Assessing abstracts of Iranian systematic reviews and meta-analysis indexed in WOS and Scopus using PRISMA. Med. J. Islam Repub. Iran 2017, 31, 104–109. [Google Scholar] [CrossRef] [PubMed]
- Sott, M.K.; Furstenau, L.B.; Kipper, L.M.; Giraldo, F.D.; Lopez-Robles, J.R.; Cobo, M.J.; Zahid, A.; Abbasi, Q.H.; Imran, M.A. Precision Techniques and Agriculture 4.0 Technologies to Promote Sustainability in the Coffee Sector: State of the Art, Challenges and Future Trends. IEEE Access 2020, 8, 149854–149867. [Google Scholar] [CrossRef]
- Carlucci, S.; De-Simone, M.; Firth, S.K.; Kjærgaard, M.B.; Markovic, R.; Rahaman, M.S.; Annaqeeb, M.K.; Biandrate, S.; Das, A.; Dziedzic, J.W.; et al. Modeling occupant behavior in buildings. Build. Environ. 2020, 174, 106768. [Google Scholar] [CrossRef]
- Oliveira, T. Scientific policies in the knowledge age: A conjuncture analysis of the global scientific ecosystem. Perspectivas em Ciência da Informação 2019, 24, 191–215. [Google Scholar] [CrossRef]
- Chadegani, A.A.; Salehi, H.; Yunus, M.M.; Farhadi, H.; Fooladi, M.; Maryam Farhadi, M.; Nader Ale Ebrahim, N.A. A Comparison between Two Main Academic Literature Collections: Web of Science and Scopus Databases. Asian Soc. Sci. 2013, 9, 18–26. [Google Scholar] [CrossRef] [Green Version]
- Lloyd’s List’s One Hundred Ports. Available online: https://lloydslist.maritimeintelligence.informa.com/one-hundred-container-ports-2020 (accessed on 27 February 2021).
- UNCTAD Stat Maritime Profile. Available online: https://unctadstat.unctad.org/CountryProfile/MaritimeProfile/en-GB/004/index.html (accessed on 27 February 2021).
- Darbra, R.M.; Ronza, A.; Casal, J.; Stojanovic, T.A.; Wooldridge, C. The Self Diagnosis Method. A new methodology to assess environmental management in sea ports. Mar. Pollut. Bull. 2004, 48, 420–428. [Google Scholar] [CrossRef] [PubMed]
- United Nations. Goal 14: Conserve and Sustainably Use the Oceans, Seas and Marine Resources. Available online: https://www.un.org/sustainabledevelopment/oceans/ (accessed on 26 March 2021).
- Food and Agriculture Organization. Get to Know the SSF Guidelines. Available online: http://www.fao.org/voluntary-guidelines-small-scale-fisheries/guidelines/en/ (accessed on 26 March 2021).
- EcoPorts Tools. Self Diagnosis Method (SDM): The User-Friendly Environmental Checklist. Available online: https://www.ecoports.com/sdm (accessed on 26 March 2021).
- Green Marine Environmental Certification Program. Available online: https://green-marine.org/certification/scope-and-criteria/ (accessed on 26 March 2021).
Figure 1.
Preferred Reporting Items for Systematic Reviews and Meta-Analyses (PRISMA) analysis flow. * The exclusions correspond to articles with emphases on shipping, port regions, port cities, port environmental networks, dry ports, environmental innovation cases, coastal port landscapes, green port fees, and the hydraulic model test, as well as articles involving a theoretical discussion/literature review or developed methodologically in narrative form with interviews or mixed methods.


Table 1.
Eligibility criteria (PICOS (Population, Interventions, Comparators, Outcomes, and Study).
| PICOS | Description |
|---|---|
| Population | Port companies or port authorities (only seaports and maritime ports, considered ports in inland waterways). |
| Interventions | Measurement of port environmental performance. |
| Comparator | Presence of port environmental performance indicators (definition, validation, or application) |
| Outcomes | An environmental performance evaluation of one or a group of ports at the company or port authority level in terms of ownership. Their current performance is identified or performance is compared over time or between ports. |
| Study designs | Only quantitative study types are included (survey datasets, cohort studies, cross-sectional studies). |
Table 2.
Articles included in the qualitative review analysis.
| First Author | Journal | Publ. Year | Affiliation Author | WoS: Category and Accession Number |
|---|---|---|---|---|
| Wooldridge et al. | Mar. Pol. | 1999 | Cardiff Univ. (UK) | Environ. Stu.; Int. Relat./000081998200010 |
| Le et al. | Phys. Chem. Earth | 2011 | Vrije Univ. Brussel (BE), Univ. Chem. Technol. & Metall. (BG) | Geosci., Multidiscip.; Meteorol. & Atmos. Sci.; Water Resour./000288689700004 |
| Klopott | Marit. Policy Manag. | 2013 | Gdynia Marit. Univ. (PL) | Transp./000322696900004 |
| Walker et al. | Mar. Pollut. Bull. | 2016 | Dalhousie Univ. (CA) | Environ. Sci.; Mar. & Freshw. Biol./000375816000037 |
| Puig et al. | Mar. Pollut. Bull. | 2017 | Polytech. Univ. Catalonia (SP), ESPO 1 (BE), Cardiff Univ. (UK) | Environ. Sci.; Mar. & Freshw. Biol./000407529200024 |
| Dong et al. | Int. J. Environ. Res. Public Health | 2019 | Shanghai Marit. Univ. (CN), Southwestern Univ. Financ. & Econ. (CN), Zhejiang Gongshang Univ. (CN), Univ. Manitoba (CA) | Environ. Sci.; Public, Environ. & Occup. Health/000473750500160 |
| Hossain et al. | Mar. Pol. | 2019 | Gov. of Nfld. and Labrador (CA), Dalhousie Univ. (CA) | Environ. Stud.; Int. Relat./000474313500005 |
| Cloquell-Ballester et al. | Int. J. Environ. Res. Public Health | 2020 | Polytech. Univ. Valencia (SP) | Environ. Sci.; Public, Environ. & Occup. Health/000589167700001 |
| Puig et al. | Mar. Pollut. Bull. | 2020 | Polytech. Univ. Catalonia (SP), ESPO (BE), Cardiff Univ. (UK) | Environ. Sci.; Mar. & Freshw. Biol./000587626600014 |
| Široka et al. | Ecol. Indic. | 2021 | Univ. Rijeka (HR), Polytech. Univ. Valencia (SP) | Biodivers. Conserv.; Environ. Sci./000591903100003 |
1 European Sea Ports Organisation.
Table 3.
Included articles for the quantitative review analysis.
| Thematic and Geographic Coverage | Le, Hens, and Stoyanov (2011) | Klopott (2013) | Walker (2016) | Puig, Michail, Wooldridge, and Darbra (2017) | Hossain, Adams, and Walker (2019) | Puig, Raptis, Wooldridge, and Darbra (2020) | Mean |
|---|---|---|---|---|---|---|---|
| Phys. Chem. Earth | Marit. Policy Manag. | Mar. Pollut. Bull. | Mar. Pollut. Bull. | Mar. Pol. | Mar. Pollut. Bull. | ||
| SDG 6: Clean Water and Sanitation | 7 | 0 | 0 | 2 | 0 | 2 | 2 |
| SDG 7: Affordable and Clean Energy | 0 | 1 | 0 | 1 | 0 | 1 | 1 |
| SDG 12: Responsible Consumption and Production | 4 | 1 | 1 | 2 | 1 | 2 | 2 |
| SDG 14: Life Below Water | 2 | 1 | 1 | 2 | 1 | 2 | 2 |
| Total SDG Resources | 13 | 4 | 2 | 7 | 2 | 7 | 6 |
| SDG 13: Climate Action | 2 | 1 | 1 | 2 | 1 | 2 | 2 |
| SDG 15: Life and Land | 0 | 1 | 1 | 2 | 1 | 2 | 1 |
| Total SDG Environments | 2 | 2 | 2 | 4 | 2 | 4 | 3 |
| Total Environmental SDGs | 15 | 6 | 4 | 11 | 4 | 11 | 9 |
| GM/GMEP Framework | No | No | Yes | No | Yes | No | |
| ESPO/EcoPorts Framework | Yes | Yes | No | Yes | No | Yes | |
| Complexity of measurement scales | Ratio | Dichotomy/ Ordinal | Ordinal | Dichotomy | Ordinal | Dichotomy | |
| Statistical tests | n.a.3 | n.a. | n.a. | n.a. | n.a. | n.a. | |
| Number of ports studied | 2 | 4 | 26 | 91 | 18 | 90 | |
| Number of ports in Lloyd’s List’s One Hundred Ports 1 | 0 | 1 | 2 | 2 | n.a. | ||
| Port throughput 2019 1, coverage range (thousands of TEUs and low standard port coding) | --- | 2073 (DDN) | 1745 (YVR)—3399 (YUL) | n.a. | 1745 (YVR)—3399 (YUL) | n.a. | |
| Number of countries | 1 | 1 | 2 | 20 | 1 | 19 | |
| Country port throughput 2019 2, coverage range (thousands of TEUs and ISO 3166-1-alpha-2 code) | 263 | 3046 | 7004 (CA)—55,519 (US) | 223 (EE)—19,596 (DE) | 7004 | 223 (EE)—19,596 (DE) | |
| Area/Countries (ISO 3166-1-alpha-2 code) | BG | PL | CA, US | Europe | CA | Europe |
1 Lloyd’s List’s One Hundred Ports. 2 UNCTAD Stat Maritime Profile. 3 Not Available (in article). SDG: Sustainable Development Goals.
Table 4.
Aspects, indicators, and parameters present in Le et al. [42] (p. 142).
Table 4.
Aspects, indicators, and parameters present in Le et al. [42] (p. 142).
| Aspect | Indicators | Specific Parameters |
|---|---|---|
| Environmental conditions in and around the ports | ||
| Water quality | Physico-chemical parameters | Temperature (C), turbidity (NTU), total dissolved solids (TDS), and total suspended solids TSS (mg/L) |
| Organic and inorganic pollution | DO, BOD, COD, nitrite, nitrate, ammoniac, phosphate, and coliforms (MPN/100 mL) | |
| Metals in water (mg/L) | Chromium (Cr), cadmium (Cd), copper (Cu), lead (Pb), manganese (Mn), zinc (Zn), iron (Fe), arsenic (As), mercury (Hg), oil (mg/L) | |
| Persistent organic compounds (lg/L) | Lindane, aldrin, dieldrin, endrin, DDT and metabolites (DDD and DDE), organotins (TBT and derivatives) | |
| Soil and sediment quality | Metals in sediments (water bottom) (mg/kg dry) | Cadmium (Cd), copper (Cu), lead (Pb), zinc (Zn), arsenic (As), mercury (Hg) |
| Oil (mg/g dry) and cyanide (mg/kg dry) | ||
| Persistent organic compounds (lg/kg dry weight) | Lindane, aldrin, dieldrin, endrin, DDT and metabolites (DDD and DDE), organotins (TBT and derivatives) | |
| Air quality | Micro-climate conditions | Temperature (ºC), humidity (%), wind velocity (m/s), CO, NO2, SO2, Pb, VOC, dusts (mg/m3) |
| Noise (dBA) | ||
| Biological resources | Degradation of ecosystems | |
| Presence of pollutant in biological indicative species (clam, mussels, fish, and resident bird) (mg/kg dry tissue) | Metals, persistent organic compounds | |
| Emissions from the port: | ||
| Into the air | Emissions into the air (tonnes/year) | CO, CO2, NOx, SO2, VOC, dust, PM |
| Into the water | Amount of household wastewater (m3/year) | |
| Amount of oily waste from ship (m3/year) | Bilge, oil sludge | |
| Solid waste | From ships and port’s operations | Type; amount (tonnes/year) |
Publisher’s Note: MDPI stays neutral with regard to jurisdictional claims in published maps and institutional affiliations. |
© 2021 by the authors. Licensee MDPI, Basel, Switzerland. This article is an open access article distributed under the terms and conditions of the Creative Commons Attribution (CC BY) license (https://creativecommons.org/licenses/by/4.0/).
Share and Cite
MDPI and ACS Style
Vega-Muñoz, A.; Salazar-Sepulveda, G.; Espinosa-Cristia, J.F.; Sanhueza-Vergara, J. How to Measure Environmental Performance in Ports. Sustainability 2021, 13, 4035. https://doi.org/10.3390/su13074035
AMA Style
Vega-Muñoz A, Salazar-Sepulveda G, Espinosa-Cristia JF, Sanhueza-Vergara J. How to Measure Environmental Performance in Ports. Sustainability. 2021; 13(7):4035. https://doi.org/10.3390/su13074035
Chicago/Turabian StyleVega-Muñoz, Alejandro, Guido Salazar-Sepulveda, Juan Felipe Espinosa-Cristia, and Jonathan Sanhueza-Vergara. 2021. "How to Measure Environmental Performance in Ports" Sustainability 13, no. 7: 4035. https://doi.org/10.3390/su13074035
Note that from the first issue of 2016, this journal uses article numbers instead of page numbers. See further details here.