Characterization of SDGs towards Coastal Management: Sustainability Performance and Cross-Linking Consequences


Abstract
:1. Introduction
1.1. Coastal Sustainability
1.2. Literature Review
1.2.1. Coastal Flood Management
1.2.2. Assessment of Sustainability
1.3. Problem Statement and Aim
2. Methodology
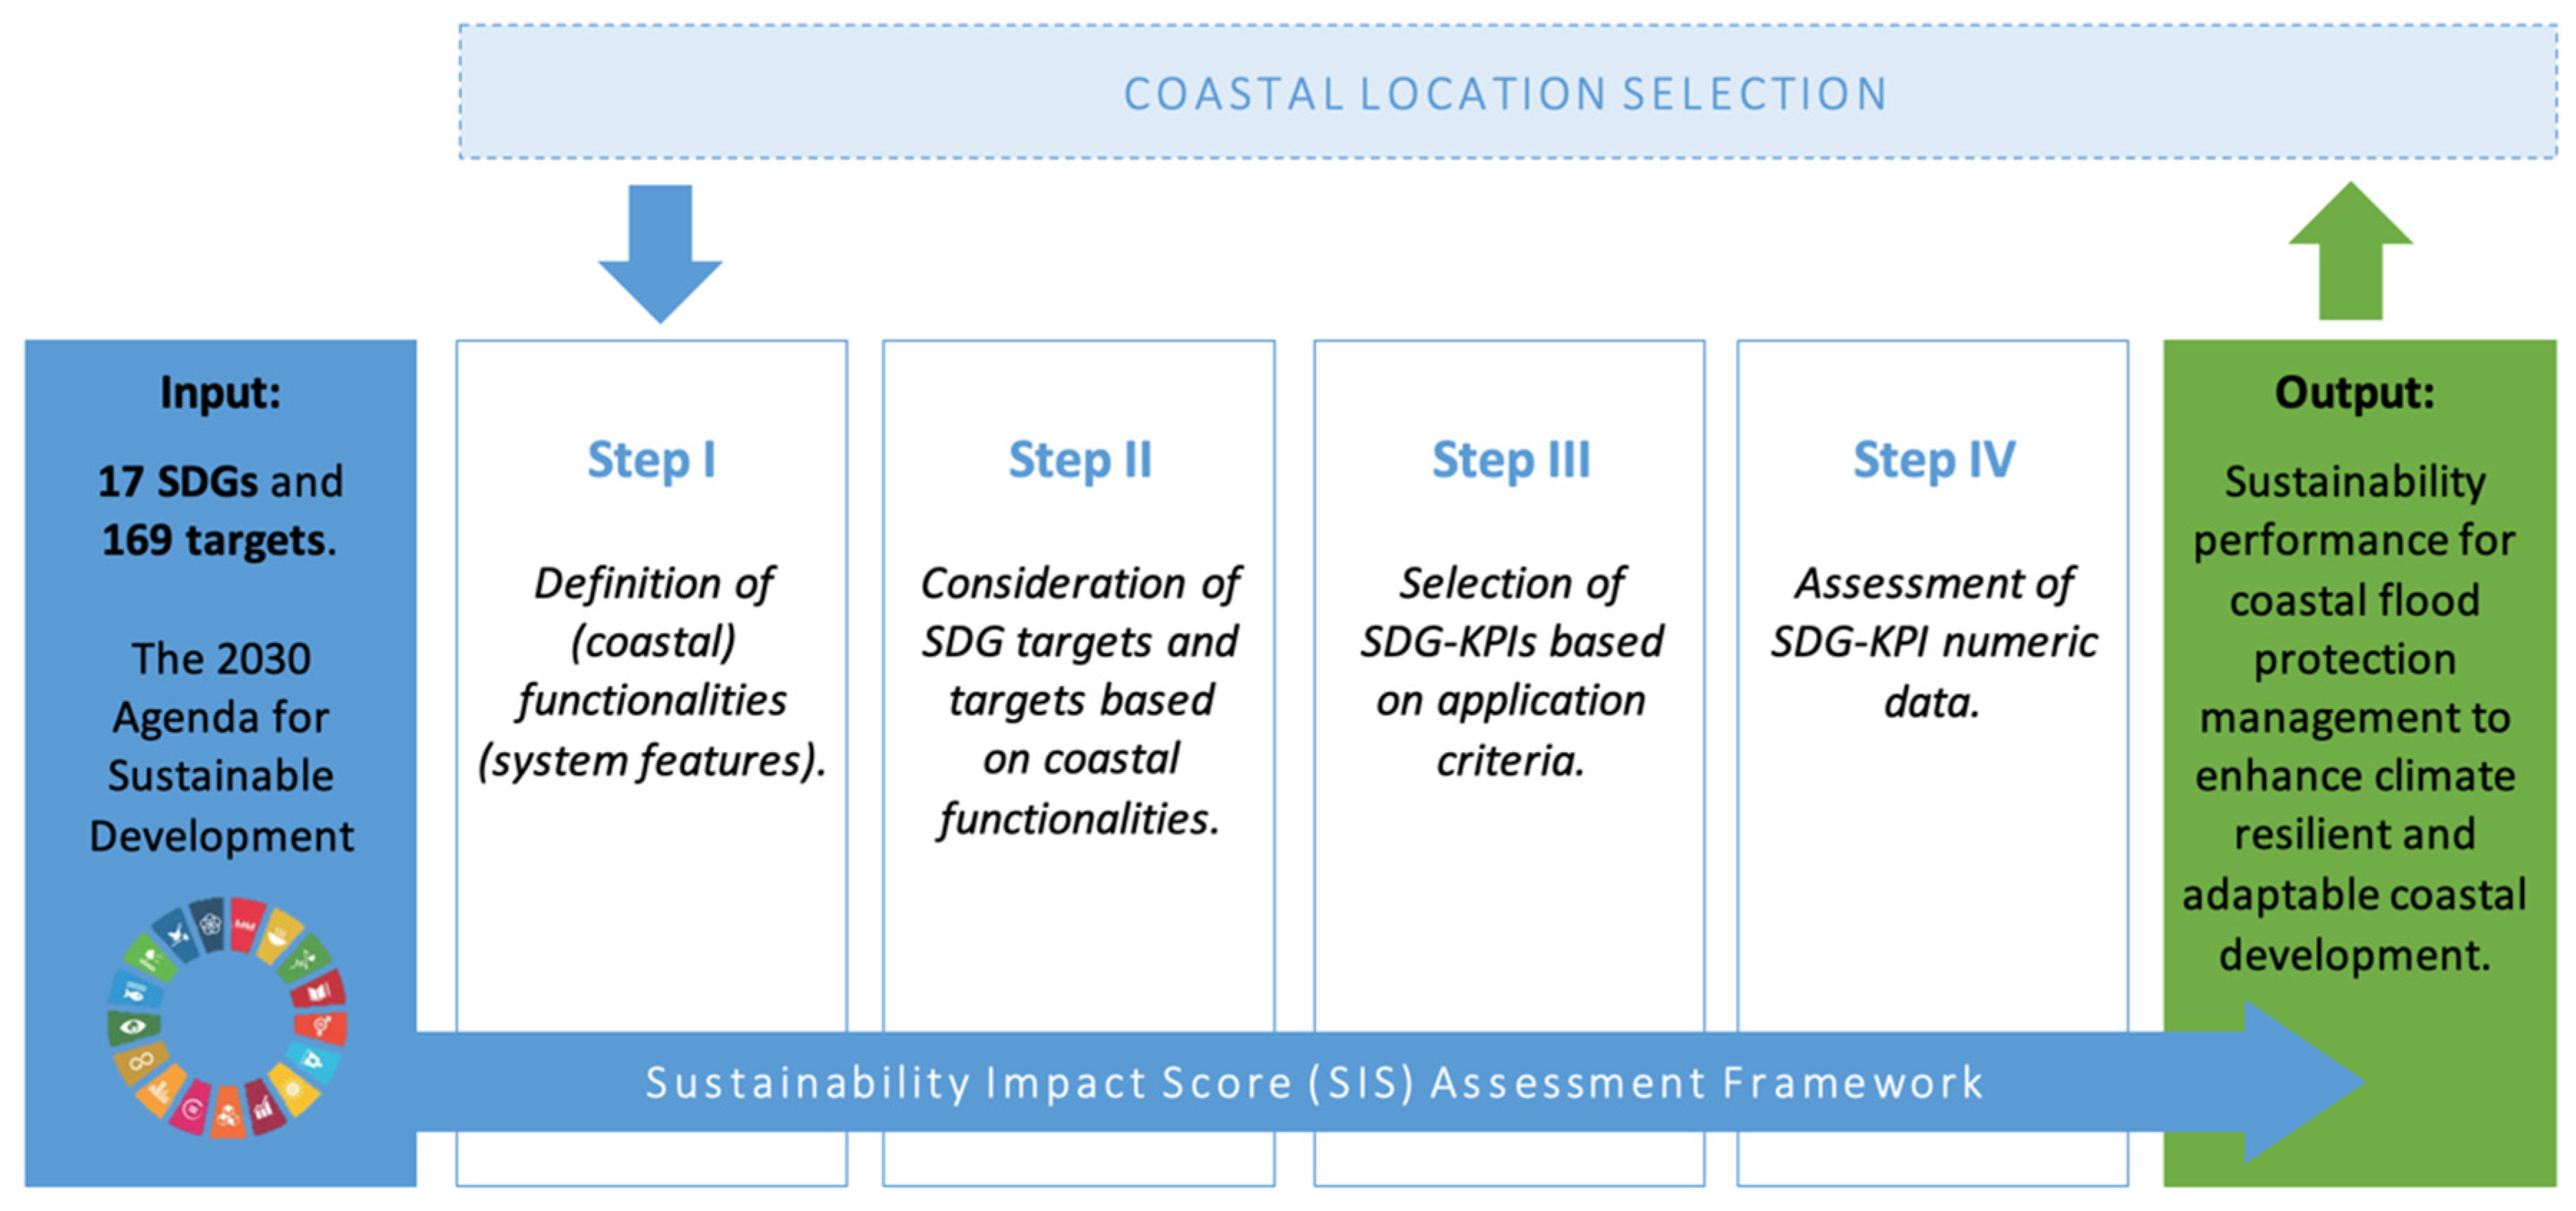
2.1. SDG-SIS Framework
2.2. Selection of Case Studies
2.3. Definition of the Functionalities (Step I)
- Serving coastal ecosystems to reduce flood frequency;
- Serving socioeconomic inclusive growth;
- Valuating biodiversity and ecosystem;
- Regulating emission reduction;
- Controlling coastal flooding and erosion reduction;
- Serving wellbeing of humans.
2.4. Consideration of SDG Targets (Step II)
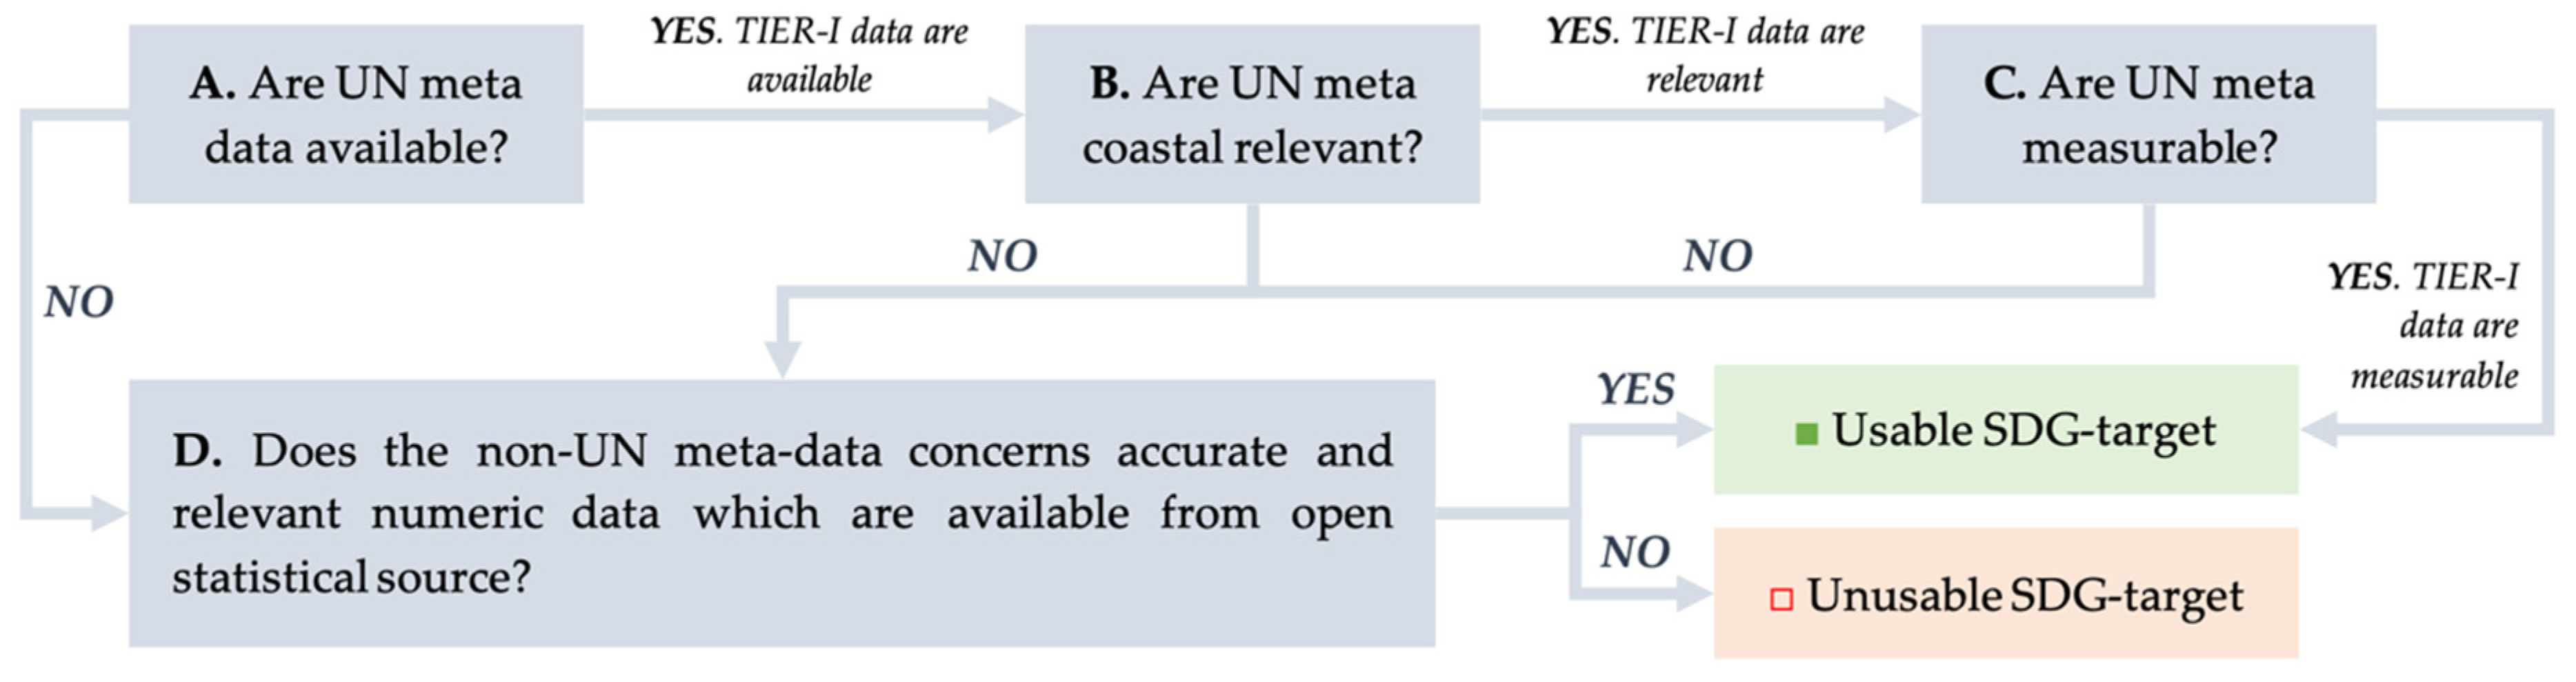
2.5. Selection Criteria of the SDG Coastal KPIs (Step III)
- UN metadata available [57]. The SDG targets are selected based on the criterion A: Are UN Tier 1 metadata available? If available, go to step B; if not available, go to step D.
- Are UN metadata relevant to coastal resilience solutions and effective adaptation strategies of the coastal infrastructure [71]? The SDG targets are selected based on the following criterion B: Is there a relationship with the coastal relevancy? If relevant, go to step C; if not relevant, go to step D.
- Are UN metadata measurable in terms of an easy-to-estimate parameter [67]? The SDG targets are selected based on the following criteria: C: What is the specificity of the indicator for coastal assessment; Does the “specificity of the indicator” relate to its measurability in terms of an easy-to-score parameter? If measurable, go for use as target; if not measurable, go to step D.
- Do the non-UN metadata concern accurate and relevant numeric data which are available from official statistical sources [11]? The SDG targets are selected based on the following criterion: D: Are accurate, relevant numeric data available from official statistical sources? If available, go for usable target; if not available, they are not usable for the target.
2.6. Assessment of SDG-KPI Numeric Data (Step IV)
- The total sum of the individual SDG-KPI outcomes represents the SIS. In this study, 12 SDG-KPIs are selected (Step III) for the assessment. This range of individual SDG-KPI (in formula: KPI) can be divided into two different sub-values, respectively, SISa and SISb.
- SISa entails the sum of SDG-KPI outcomes that represent a positive impact towards the SIS—for example, renewable energy (SDG 7.2) with KPI expressed in percentage renewable electricity share of total electricity output. Each of the individual outcomes are linearly standardized on a scale of 0–100 percent, which is generated using the individual KPI outcome divided by the best-scoring KPI. For the SISa values, the KPImax must be used.
- SISb entails the sum of SDG-KPI outcomes that represent a negative impact towards the SIS—for example, CO2 emission reduction (SDG 9.4) with KPI expressed in CO2 emissions per capita. For SISb, the lowest-scoring KPI (KPImin) is used to linearly standardize the individual KPI outcome. Moreover, the SISb values are converted with a reciprocal value of 1. The output correlation variables from the comprehensive results can be compared with the SDG-KPIs of the no-impact benchmark coast.
2.7. Statistical Analysis
3. Results
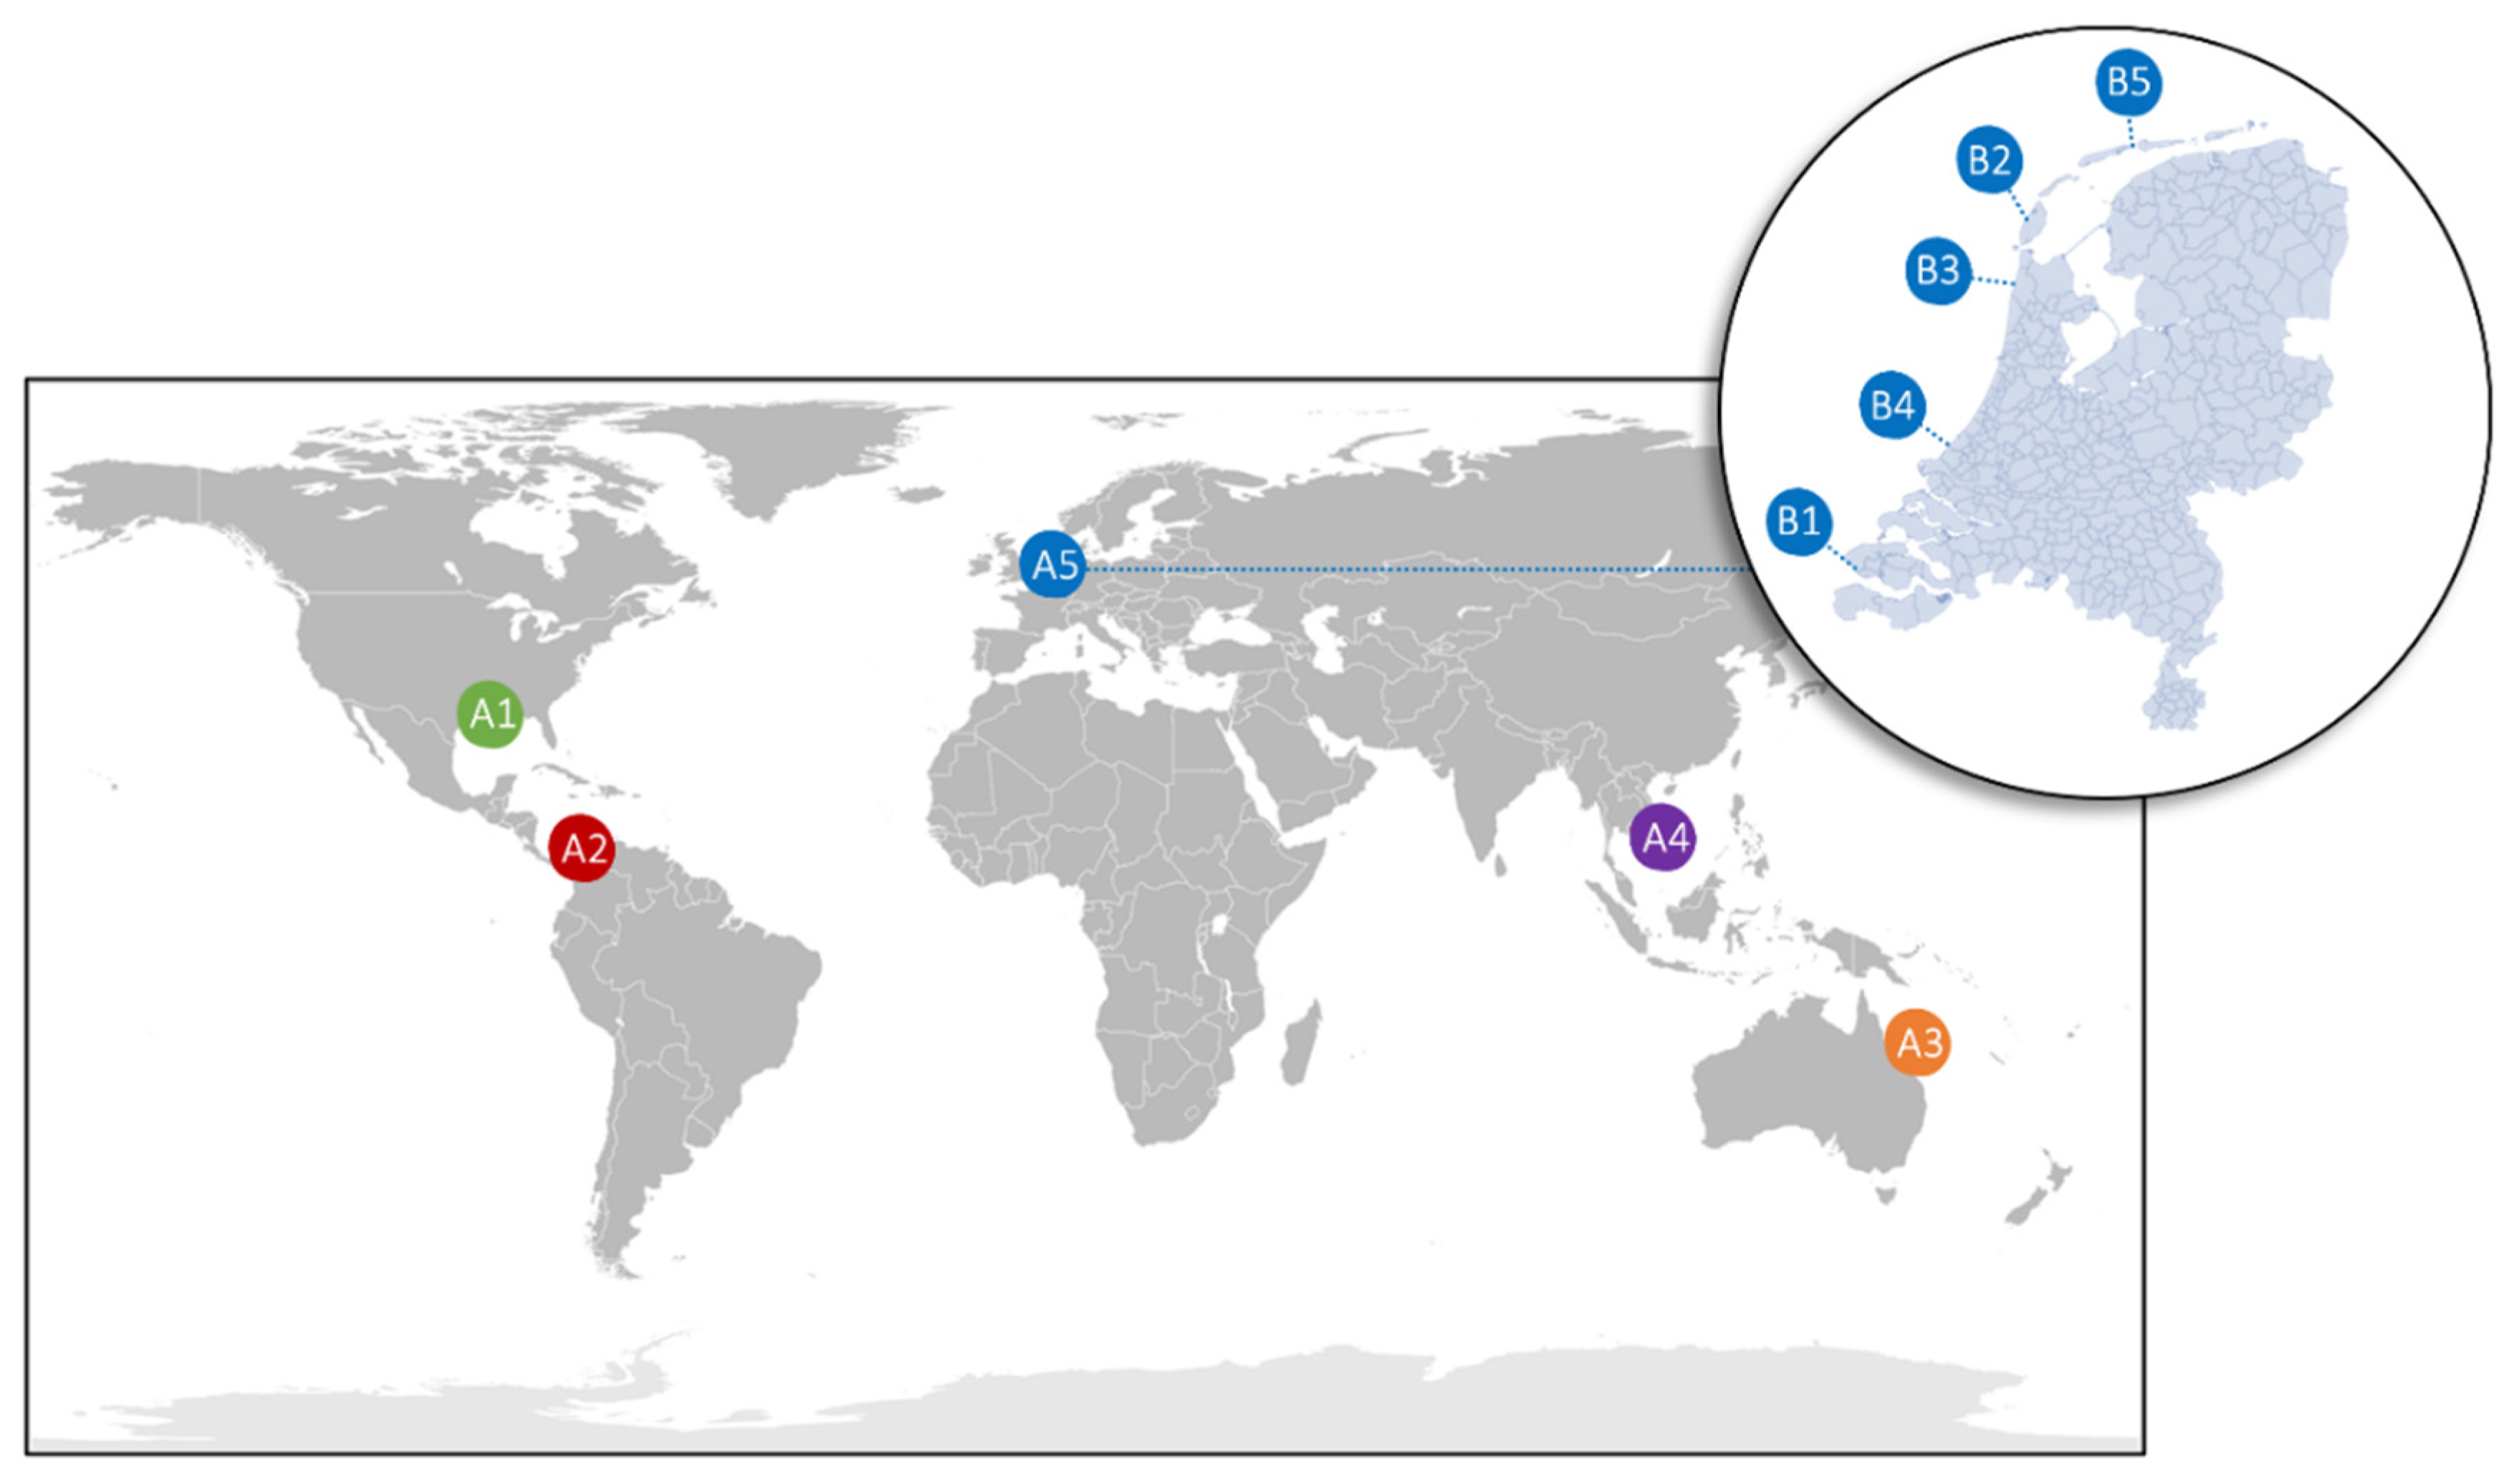
3.1. Selection of Coastal Locations
- Five cases, including coastlines with different geologies, were selected: (A1) Mississippi Delta of Louisiana, United States of America, (A2) Caribbean Delta of Colombia, (A3) South Pacific Ocean, Queensland, Australia, (A4) East Sea Mekong Delta, Vietnam, and (A5) North Sea Delta of The Netherlands.
- Five cases, including NBS sand nourishment projects within the North Sea region in Netherlands, were selected, representing the set with the same geology: (B1) beach nourishments Domburg and (B2) Texel, (B3) combination of shoreface-beach nourishment Callantsoog, (B4) sand motor nourishment Delfland, and (B5) system nourishment Ameland Inlet.
3.2. Definition of Functionalities (Step I)
3.3. Consideration of SDG Targets (Step II)
3.4. Selection of the SDG Coastal KPIs (Step III)
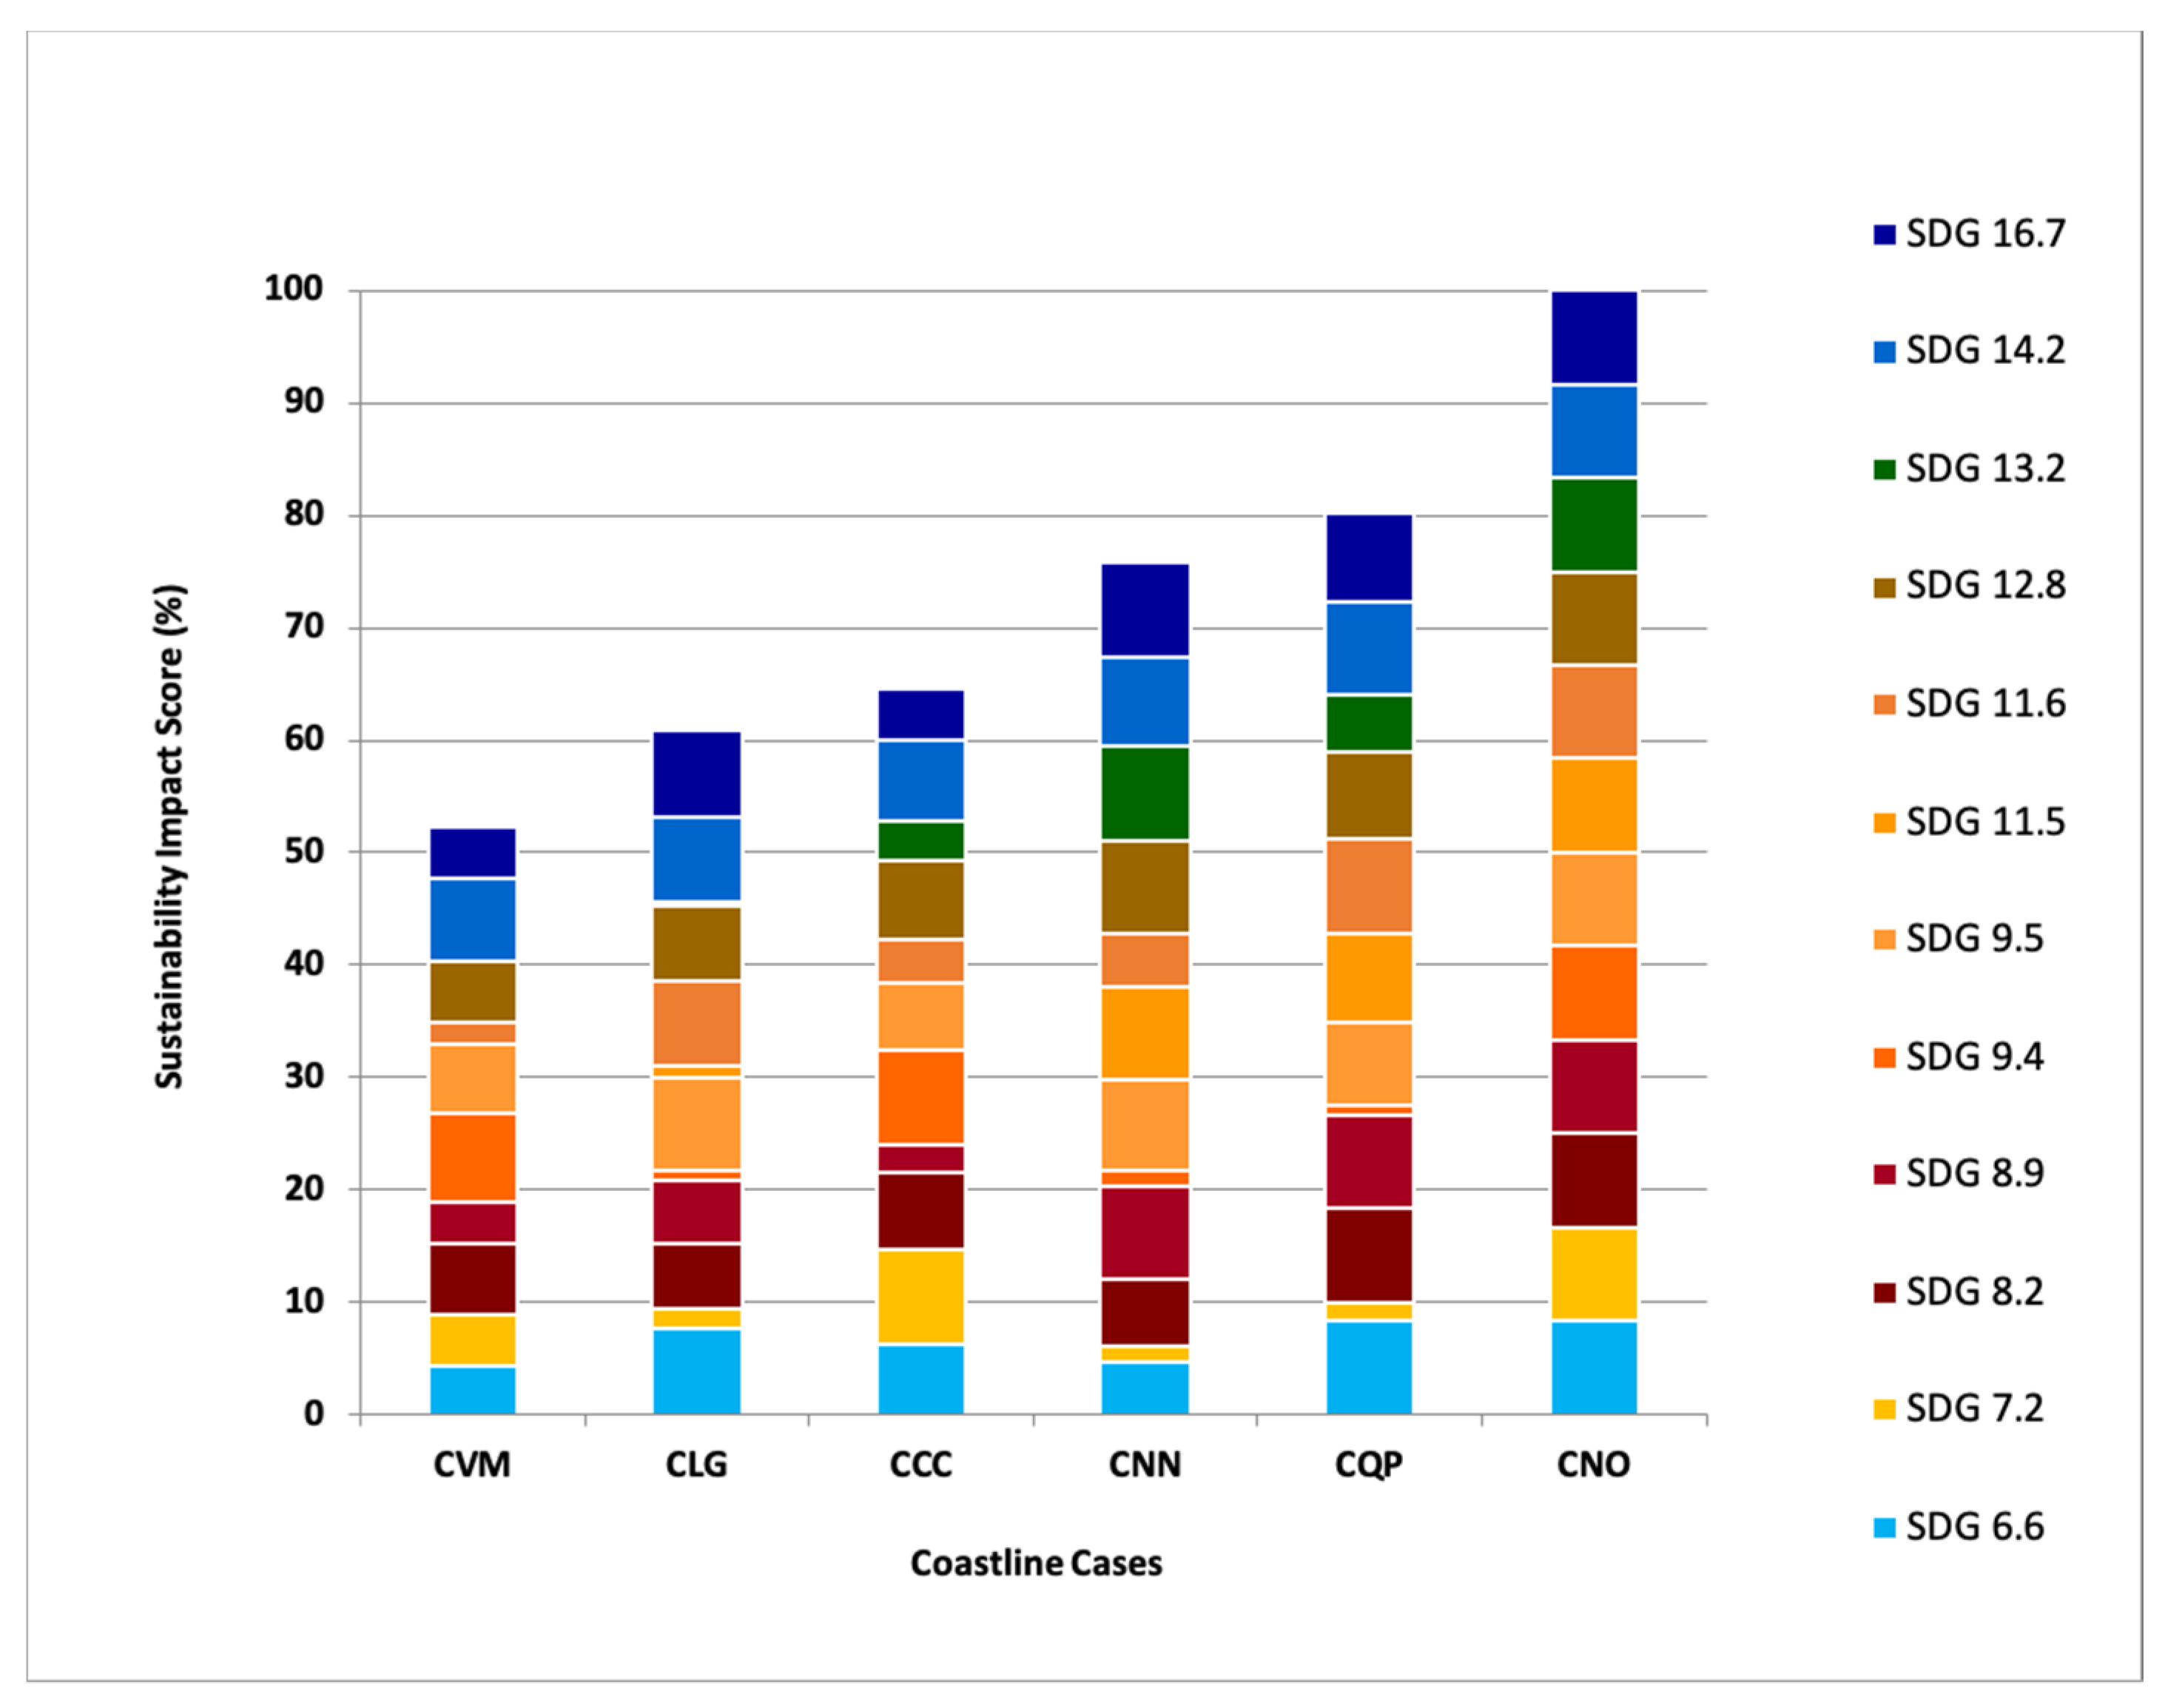
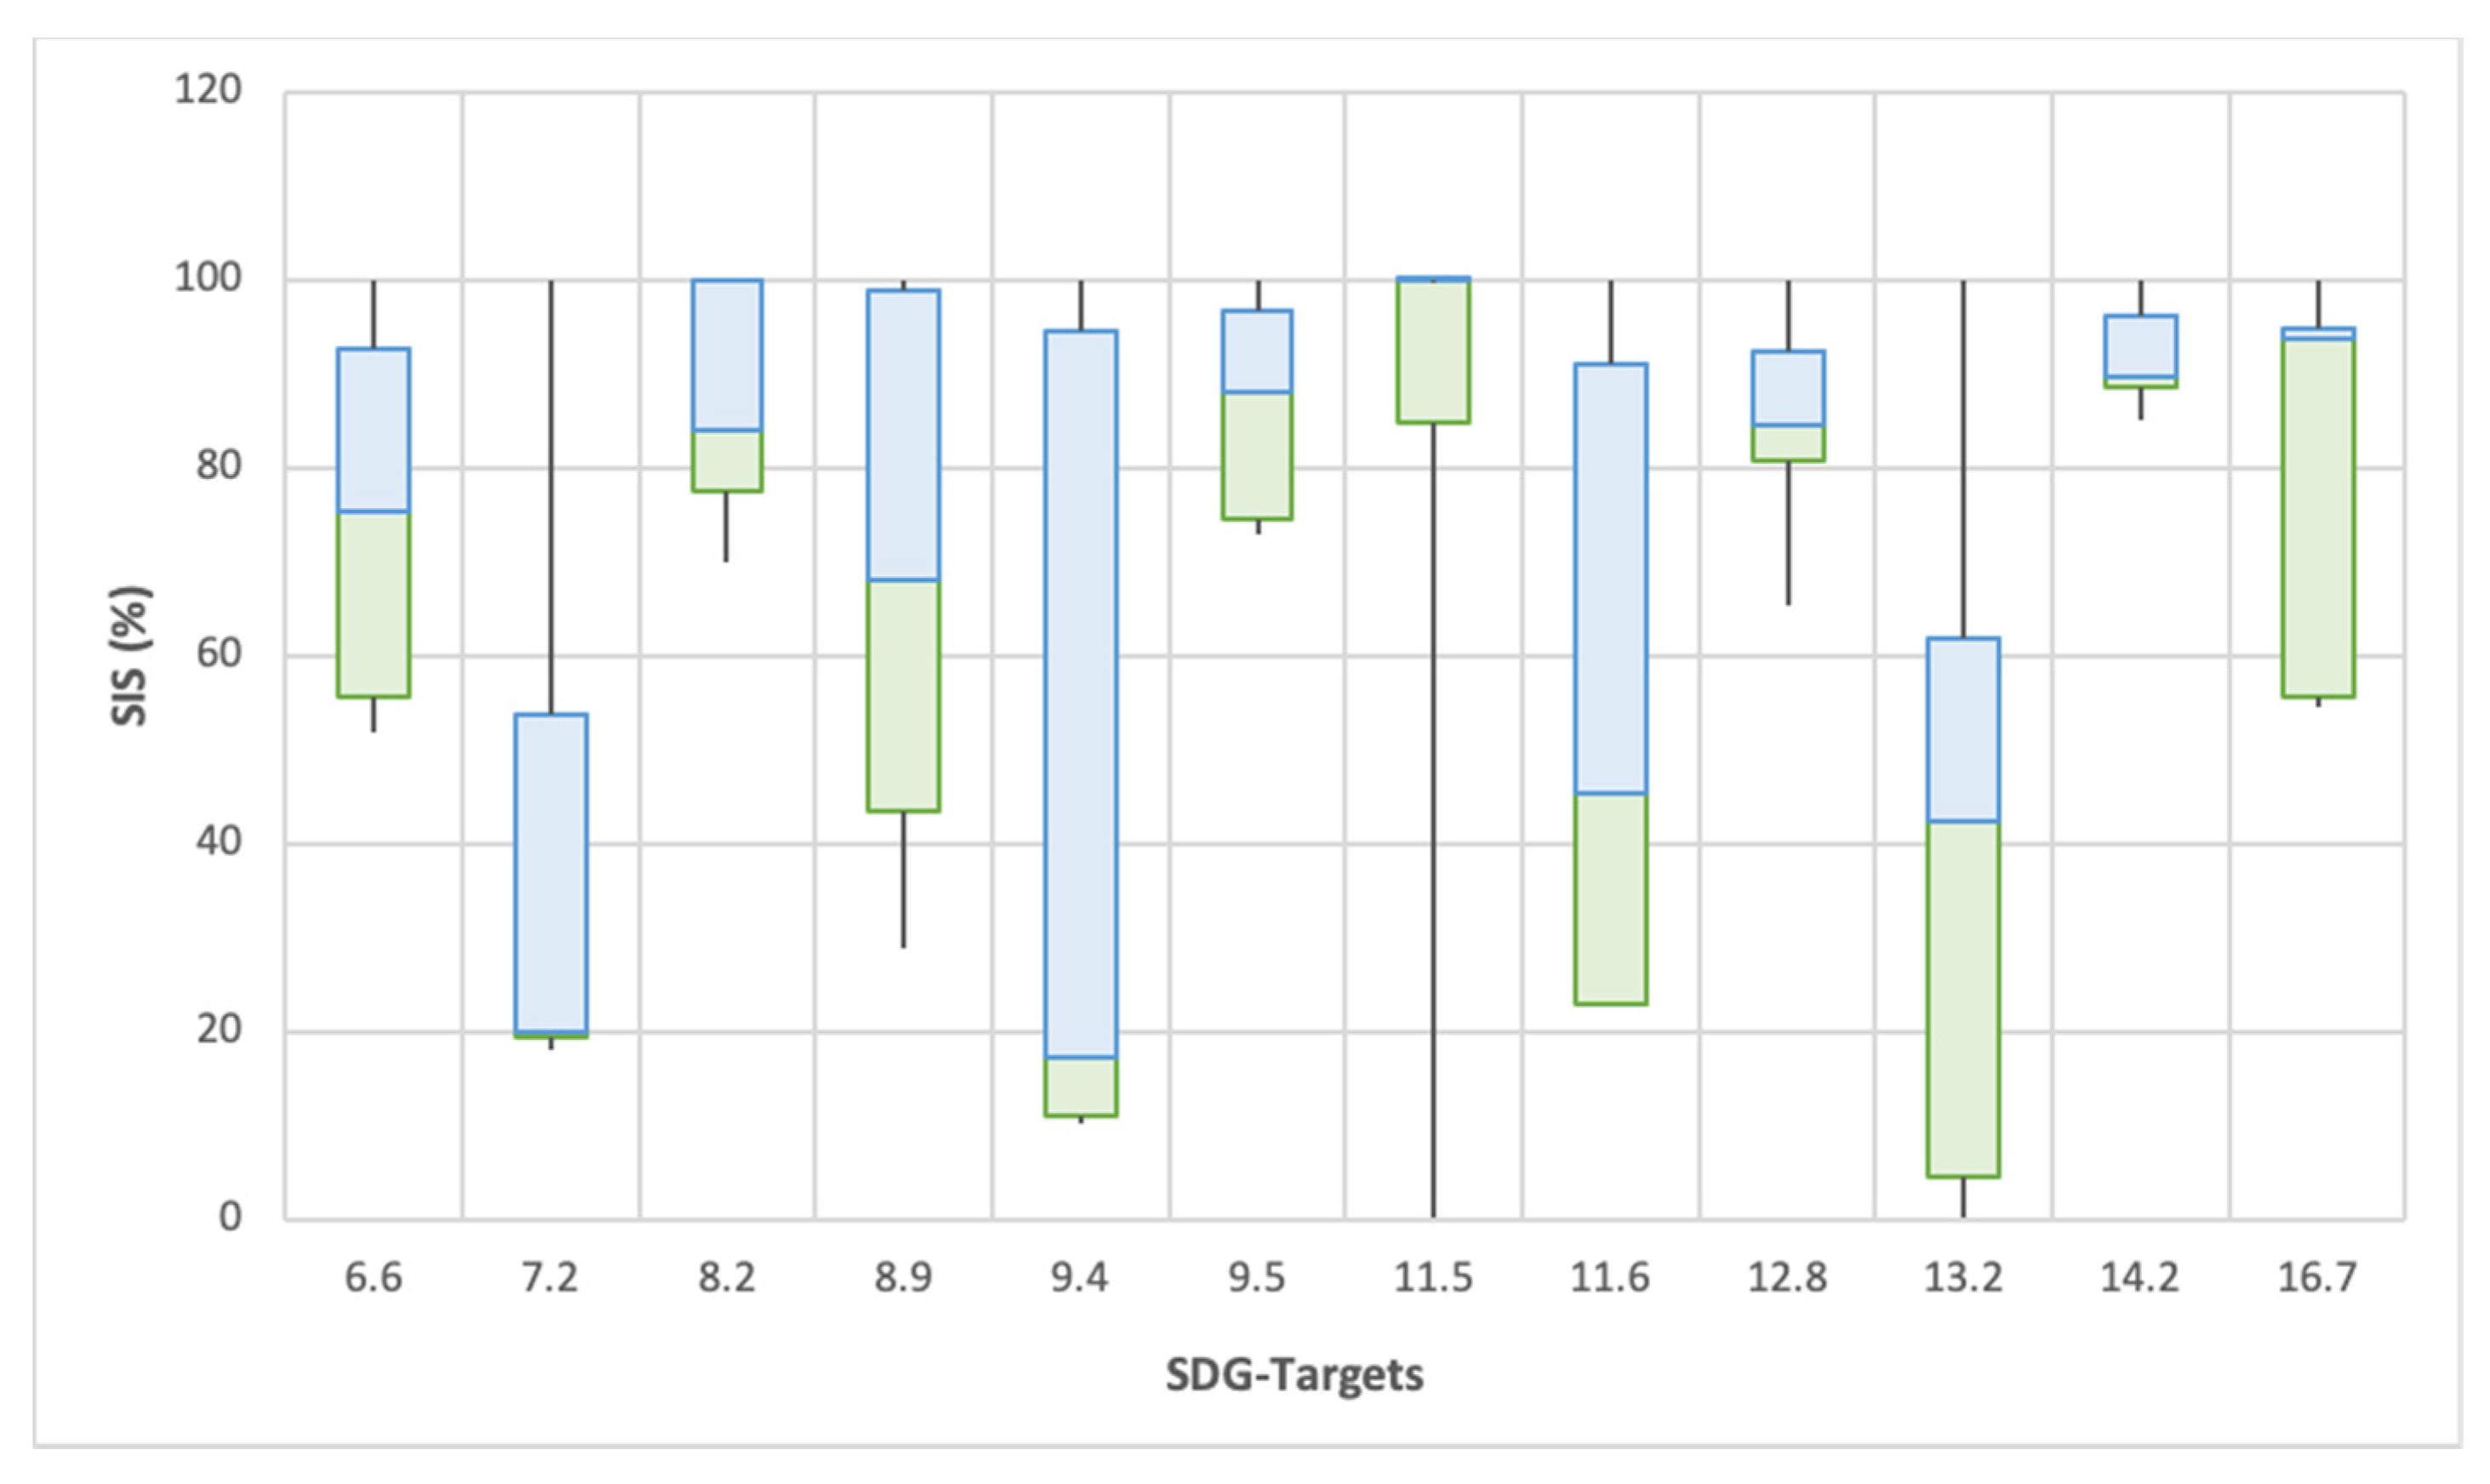
3.5. SDG Assessment of Coastline Sustainability (Step IV)
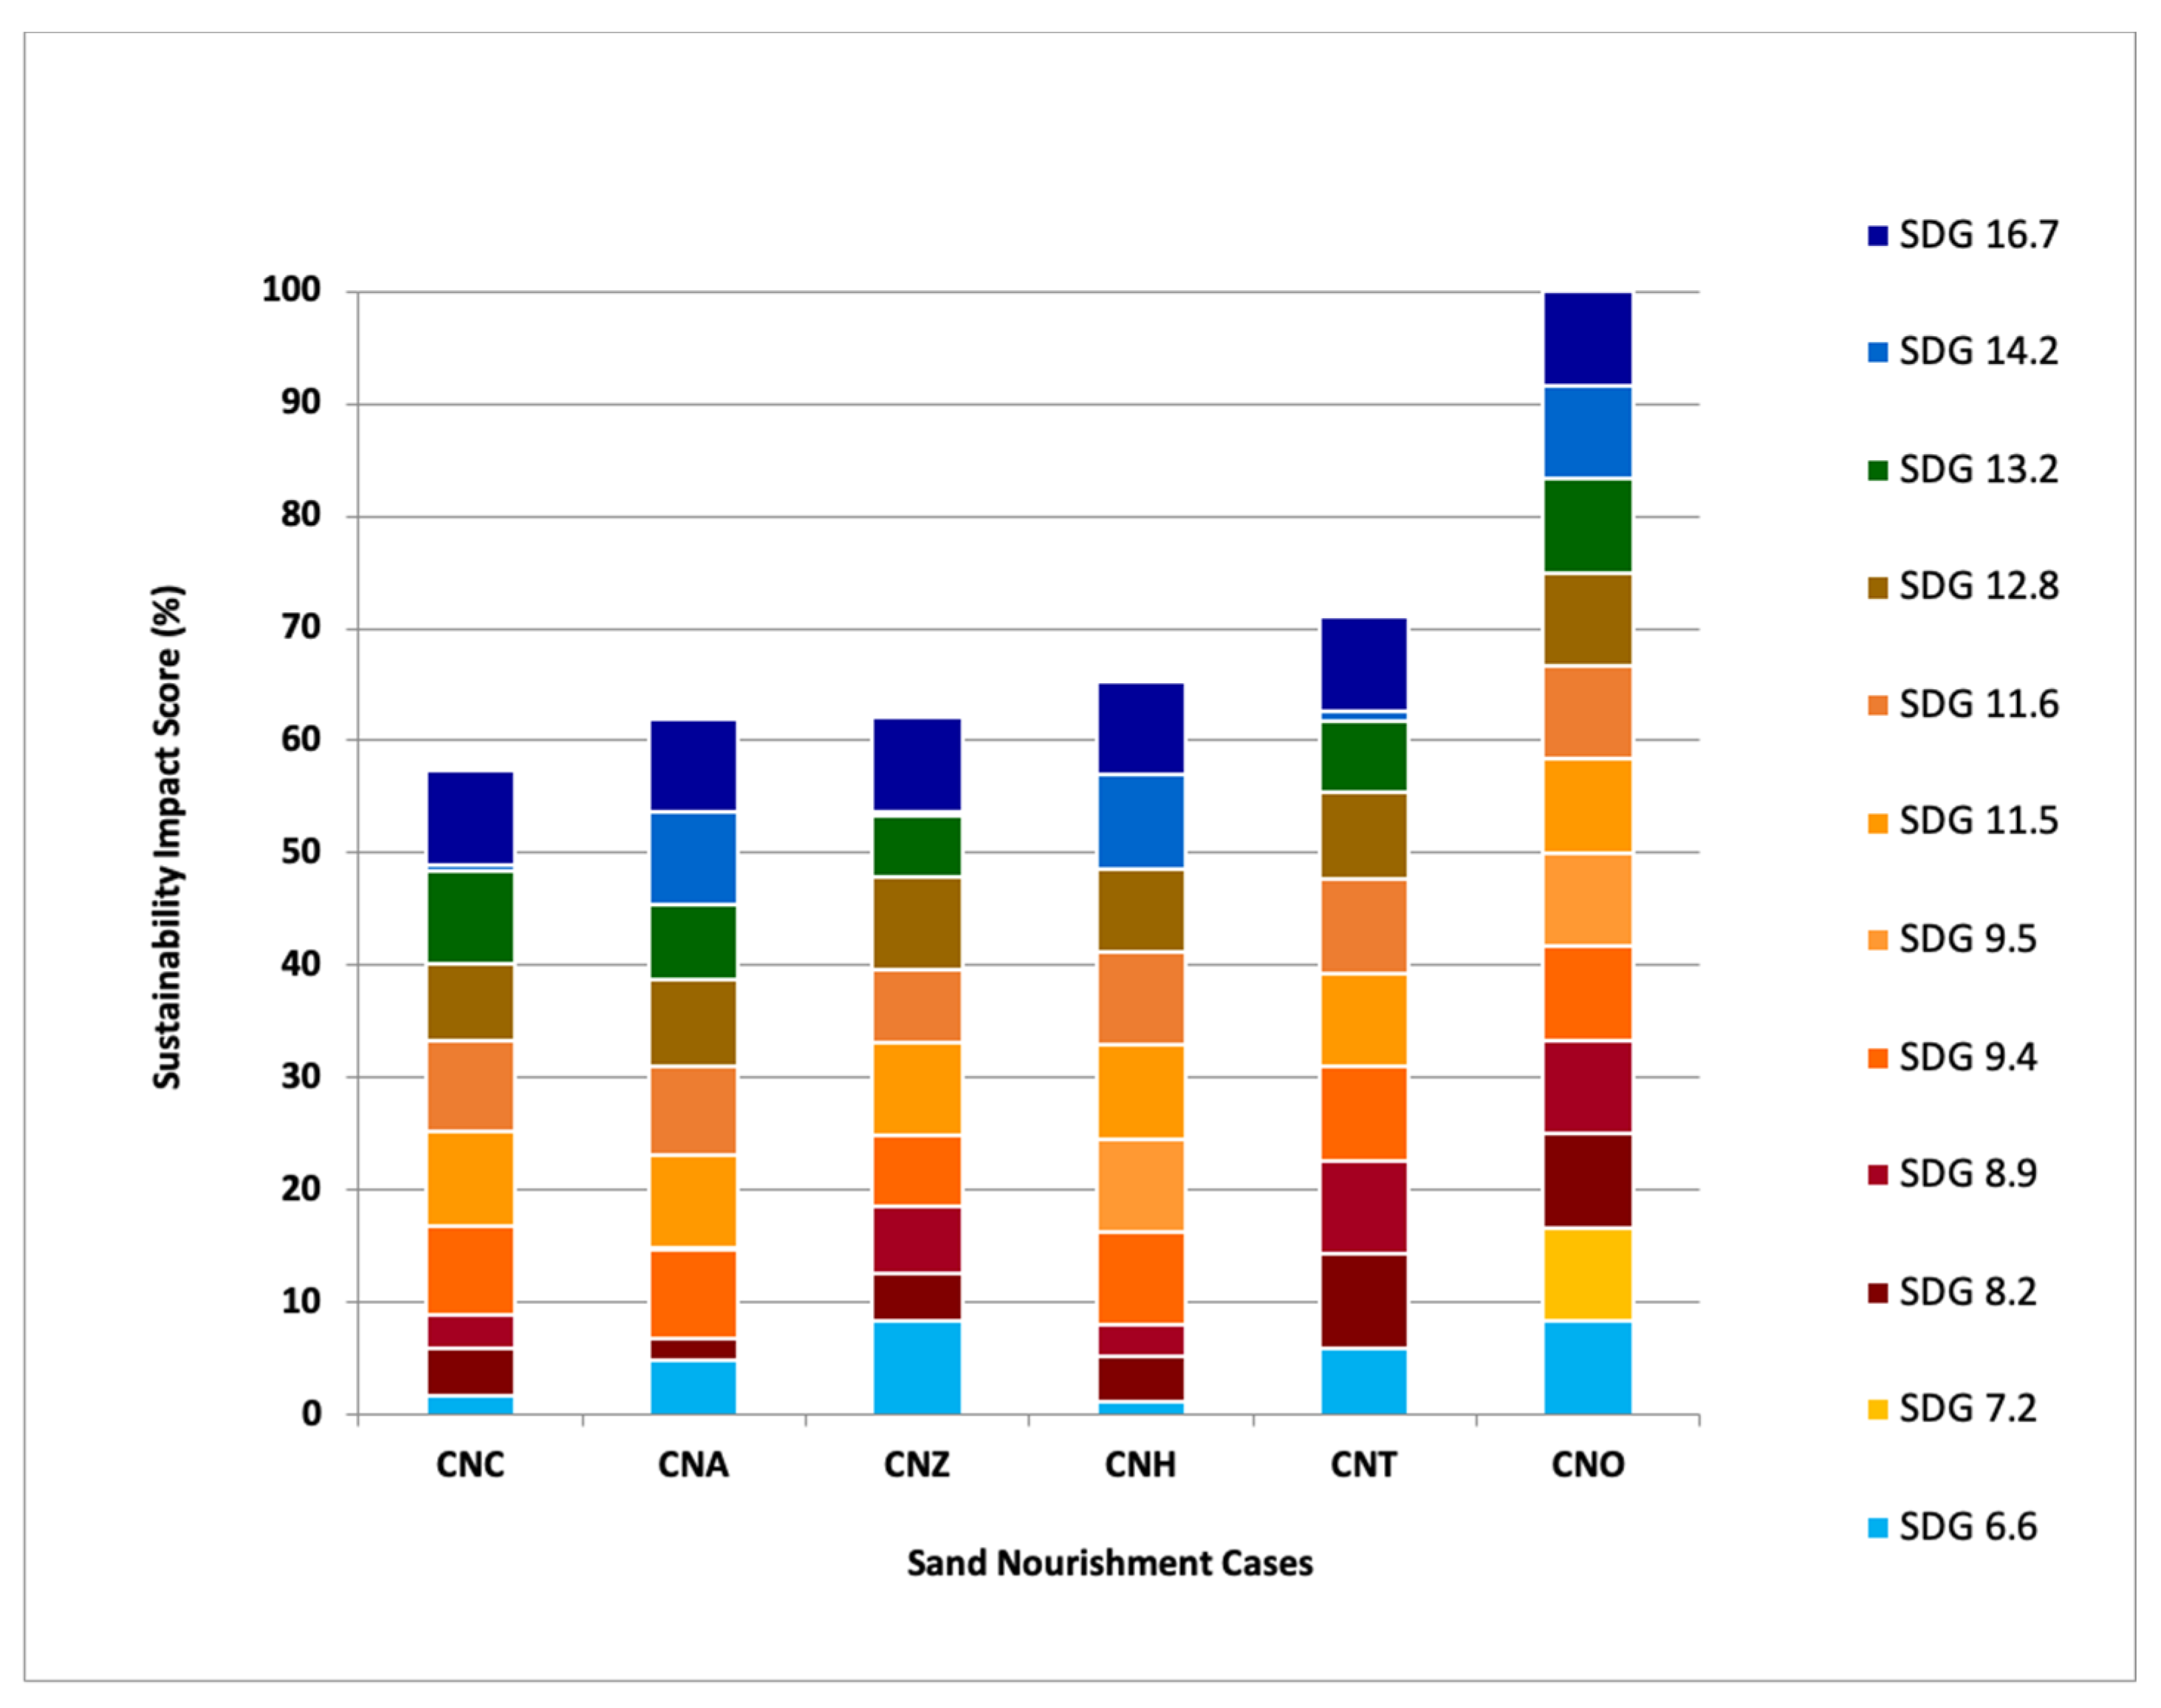
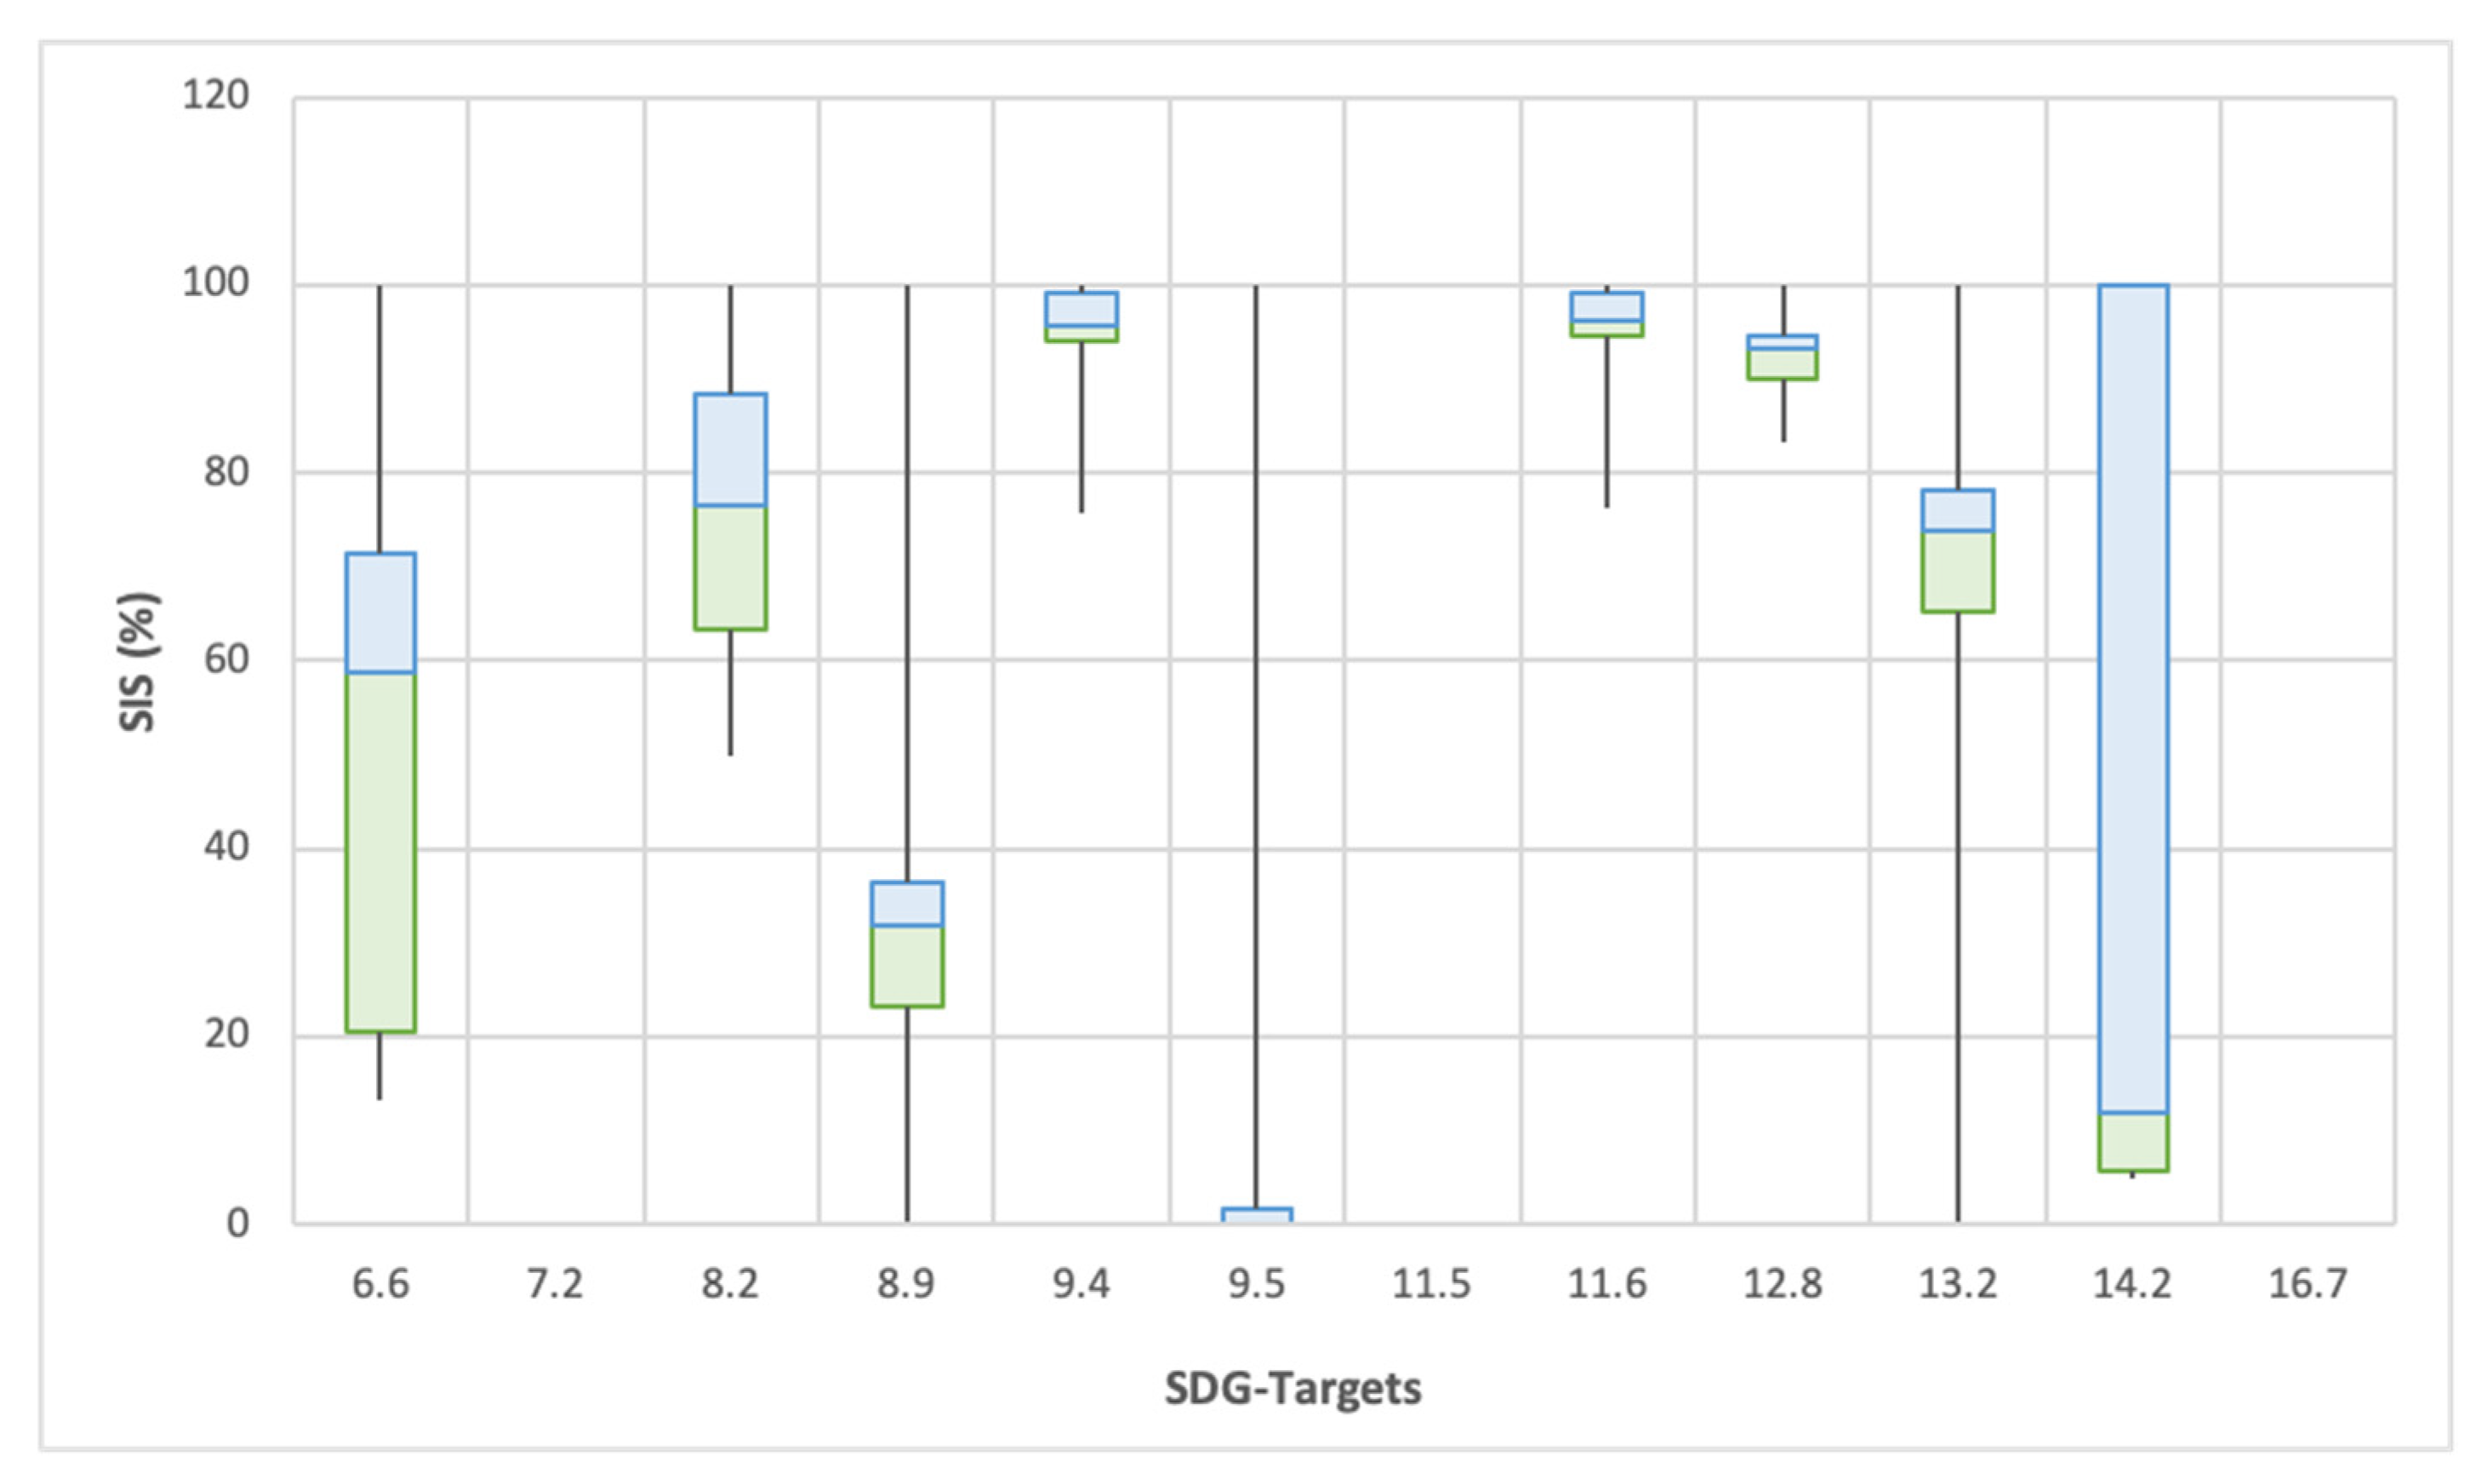
3.6. SDG Assessment of Sand Nourishment Cases (Step IV)
4. Discussion
4.1. SDG-SIS Framework
4.2. Consideration of SDGs
4.2.1. SIS for Coastline Cases
4.2.2. SIS for Sand Nourishment Cases
4.3. Data Availability for Interpretation and Decision-Making
4.4. Multiple Modes of Assessment Applicability
4.5. Coastal Flood Protection Management in an Adaptable Manner
5. Conclusions
- The SDG-SIS methodology relied on chosen functionalities; the selected SDG targets and corresponding KPIs facilitate measurement of the progress towards climate resilient coastal protection. Moreover, the SDG-SIS framework is able to systematically consider SDG targets to support an integrated assessment of coastal sustainability. Moreover, it is illustrated that the complexities in geographical and socioeconomic characteristics may influence the selection of SDG targets.
- The connection between SDG targets and KPIs makes it possible to quantitatively and specifically measure the SDGs, resulting in the SDG-SIS for coastal flood protection management to enhance climate-resilient and adaptable coastal development. Consideration of coastal system features including ecosystem functionalities resulted in the selection of 38 out of the 169 SDG targets. Taking into account the two sets of cases—respectively, a set global coastlines and sand nourishments in the Netherlands—not all 38 targets were able to be connected with KPIs. In this study, indicator selection is dependent on the availability of public numeric data, resulting in an assessment of the case studies with only 12 SDG targets out of selected 36 SDG targets, respectively: 6.6 (water quantity and quality), 7.2 (renewable energy), 8.2 (economic productivity), 8.9 (sustainable tourism), 9.4 (CO2 emission reduction), 9.5 (knowledge and innovation), 11.5 (disaster risk reduction), 11.6 (air quality), 12.8 (flood awareness), 13.2 (coastal erosion/accretion), 14.2 (biodiversity abundance), 16.7 (institutional capacity).
- The crucial role of adequate and specific data is demonstrated as a boundary condition for identifying priorities on early action in order to achieve the SDGs. In this study, open source metadata derived from international agencies prove to be suitable to serve as SDG-KPI. Missing SDG targets can enhance the efficacy of strategies for the improvement of SDG-related indicators and encompassing integrated strategies for sustainable flood protection management. As shown by the minor differences in the level of sustainability between the examined case studies, accurate and available data are essential to ensure a reliable level of distinctiveness of the SDG-KPIs to be able to make valuable interpretations.
- The five NBS sand nourishment cases show a relatively small number of SDG-KPIs which turn out to be valuable for application as SIS. However, individual SDG target scores may be useful as separate SDG criteria, although not in terms of SIS. The available SDG-KPI data of the five global cases perform for some coastlines a low SIS, which indicates a weak climate-resilient and adaptable coastline. However, the SIS can be rather unbalanced due to the high SIS and at the same time, e.g., high emission rates of CO2 for some coastline cases. This concludes that for an individual SDG target, outcomes are crucial to reveal the details of appropriate interpretation of climate-resilient and adaptable coastlines. Therefore, cross-linking cumulative consequences do not directly or definitively indicate the level of sustainability. This denotes the importance of prioritizing SDGs to serve as an instrument for policymakers to optimize the climate robustness of coasts.
- The SDG-SIS framework proves to be flexible in benchmarking progress against defined thresholds which denote the achievement of SDGs. The framework supports coastal policy by addressing long-term measures and providing a sustainable vision for future implementation. The SDG-SIS framework is a starting point for discussions on integrated policy since it shows that a set of indicators can be successfully applied to assess flood protection management, rendering it applicable on a global or regional scale for coherent integrated policymaking across sectors to enhance climate-resilient and adaptive management. Moreover, the SDG-SIS framework proves to be flexibly applicable, provided there are accurate data, for other policy domains such as asset management.
Author Contributions
Funding
Institutional Review Board Statement
Informed Consent Statement
Data Availability Statement
Acknowledgments
Conflicts of Interest
Appendix A

| Coastal Services | CLG | CCC | CVM | CQP | CNN | CNH | CNA | CNC | CNZ | CNT |
|---|---|---|---|---|---|---|---|---|---|---|
| Coastal area | Mississippi Delta in Louisiana Gulf of Mexico | Caribbean Delta of Colombia | Vietnam Mekong Delta | Queensland Pacific | North Sea coast in The Netherlands | Netherlands, Delfland nourishment | Netherlands, Ameland Inlet nourishment | Netherlands, Callantsoog nourishment | Netherlands, Domburg nourishment | Netherlands, Texel nourishment |
| Metropolis in coastal area | New Orleans | Cartagena, Barranquilla | Ho Chi Min City | Brisbane | Cadzand-Den Helder | The Hague | Small villages | Small villages | Small villages | Small villages |
| Coastal inhabitants * 1000 [118] | 4.684 | 9.746 | 17.510 | 4.165 | 8.219 | 515 | 3.7 | 2.4 | 106.5 | 13.6 |
| Amount of people per km2 | 35 | 73 | 318 | 12 | 504 | 6.344 | 58 | 96 | 147 | 86 |
| City population in coastal area (inhabitants * 1000) for years 2010 & 2025 [119] | (1.167) 1.224 | (950); Nd | (6.166); 9.662 | (2.044); 2.694 | (6.999); 7.285 | Nd | Nd | Nd | Nd | Nd |
| Environmental- & climate protection plan (Table 2) | + (2017) | + (2017) | + (2013) | + (2018) | + (2013) | + (2010) | + (2013) | + (2013) | + (2013) | + (2013) |
| Coastal defense aim | Natural defenses and habitat | Protecting coastlines | Natural defenses; Mekong Delta Plan (MDP) has no formal status | Protecting coastlines | Protecting coastlines | Delta program Coast Innovation pilot; | Delta program Coast innovation pilot | Part of Delta program Coast | Part of Delta program Coast | Part of Delta program Coast |
| Marine Protection Areas (% of terr. waters) or N2000 or marine/coastal wetlands (RAMSAR) | 41.1 | 2.1 | 0.6/ RAMSAR | 40.7/ RAMSAR | 21.5/ N2000 | N2000 | N2000 | N2000 | N2000 | N2000 |
| Goal of long-term or Master Plans | Resilience | Resilience | Safe prosperous and sustainable delta | Management of coastal areas, vulnerable to erosion | Viable coast | Experiment | Experiment | Viable coast | Viable coast | Viable coast |
| Policy model climate change | Protection and adapting | “Dutch delta approach” | Socioeconomic planning | Cost-effective strategy management | Strategy for the coast | Aims set for pilot | Aims set for pilot | Strategy for the coast | Strategy for the coast | Strategy for the coast |
| Maritime transport or port activities | Not mentioned | National dredging plan | Not mentioned | Not mentioned | Not mentioned | Not mentioned | Not mentioned | Not mentioned | Not mentioned | Not mentioned |
| Strategy on climate regulation, adaptation to storms and river discharges | Restoration, protection, oyster | Integrated Coastal Zone Management (ICZM) | MDP risk by upstream developments | Need for adaptation to Climate Change (CC) | Flood safety with spatial plan | ICZM | ICZM | ICZM | ICZM | ICZM |
| Flood and coastal protection | Storm surge-based flood risk reduction | Application early warning system | Mekong Delta (MD) in top 5 deltas most affected by CC | - | Shoreface and beach nourishments | Sand motor Innovative concepts | System nourishment Innovative concepts | Shoreface and beach nourishments | Shoreface and beach nourishments | Shoreface and beach nourishments |
| Goal of urgency for action | Flood risk and hurricane disaster control | Safety of water production | Sustainability and safety | Coastal hazards for beaches | ICZM and innovation nourishments | Innovative and integrated solutions | Innovative and integrated solutions | ICZM and innovation nourishments | ICZM and innovation nourishments | ICZM and innovation nourishments |
Appendix B
| SDG Target | Goals and Targets from the 2030 Agenda for Sustainable Development [14] |
|---|---|
| 1.5 | By 2030, build the resilience of the poor and those in vulnerable situations and reduce their exposure and vulnerability to climate-related extreme events and other economic, social and environmental shocks and disasters. |
| 3.9 | By 2030, substantially reduce the number of deaths and illnesses from hazardous chemicals and air, water and soil pollution and contamination. |
| 3.d | Strengthen the capacity of all countries, in particular developing countries, for early warning, risk reduction and management of national and global health risks. |
| 6.3 | By 2030, improve water quality by reducing pollution, eliminating dumping and minimizing release of hazardous chemicals and materials, halving the proportion of untreated wastewater and substantially increasing recycling and safe reuse globally. |
| 6.6 | By 2020, protect and restore water-related ecosystems, including mountains, forests, wetlands, rivers, aquifers and lakes. |
| 7.2 | By 2030, increase substantially the share of renewable energy in the global energy mix. |
| 7.3 | By 2030, double the global rate of improvement in energy efficiency. |
| 8.2 | Achieve higher levels of economic productivity through diversification, technological upgrading and innovation, including through a focus on high-value added and labour-intensive sectors |
| 8.4 | Improve progressively, through 2030, global resource efficiency in consumption and production and endeavour to decouple economic growth from environmental degradation, in accordance with the 10-Year Framework of Programmes on Sustainable Consumption and Production, with developed countries taking the lead. |
| 8.9 | By 2030, devise and implement policies to promote sustainable tourism that creates jobs and promotes local culture and products. |
| 9.1 | Develop quality, reliable, sustainable and resilient infrastructure, including regional and transborder infrastructure, to support economic development and human well-being, with a focus on affordable and equitable access for all. |
| 9.4 | By 2030, upgrade infrastructure and retrofit industries to make them sustainable, with increased resource-use efficiency and greater adoption of clean and environmentally sound technologies and industrial processes, with all countries taking action in accordance with their respective capabilities. |
| 9.5 | Enhance scientific research, upgrade the technological capabilities of industrial sectors in all countries, in particular developing countries, including, by 2030, encouraging innovation and substantially increasing the number of research and development workers per 1 million people and public and private research and development spending. |
| 11.3 | By 2030, enhance inclusive and sustainable urbanization and capacity for participatory, integrated and sustainable human settlement planning and management in all countries. |
| 11.5 | By 2030, significantly reduce the number of deaths and the number of people affected and substantially decrease the direct economic losses relative to global gross domestic product caused by disasters, including water-related disasters, with a focus on protecting the poor and people in vulnerable situations. |
| 11.6 | By 2030, reduce the adverse per capita environmental impact of cities, including by paying special attention to air quality and municipal and other waste management. |
| 11.a | Support positive economic, social and environmental links between urban, peri-urban and rural areas by strengthening national and regional development planning. |
| 11.b | By 2020, substantially increase the number of cities and human settlements adopting and implementing integrated policies and plans towards inclusion, resource efficiency, mitigation and adaptation to climate change, resilience to disasters, and develop and implement, in line with the Sendai Framework for Disaster Risk Reduction 2015–2030, holistic disaster risk management at all levels. |
| 12.2 | By 2030, achieve the sustainable management and efficient use of natural resources. |
| 12.7 | Promote public procurement practices that are sustainable, in accordance with national policies and priorities. |
| 12.8 | By 2030, ensure that people everywhere have the relevant information and awareness for sustainable development and lifestyles in harmony with nature. |
| 12.b | Develop and implement tools to monitor sustainable development impacts for sustainable tourism that creates jobs and promotes local culture and products. |
| 12.c | Rationalize inefficient fossil-fuel subsidies that encourage wasteful consumption by removing market distortions, in accordance with national circumstances, including by restructuring taxation and phasing out those harmful subsidies, where they exist, to reflect their environmental impacts, taking fully into account the specific needs and conditions of developing countries and minimizing the possible adverse impacts on their development in a manner that protects the poor and the affected communities. |
| 13.1 | Strengthen resilience and adaptive capacity to climate-related hazards and natural disasters in all countries. |
| 13.2 | Integrate climate change measures into national policies, strategies and planning. |
| 13.3 | Improve education, awareness-raising and human and institutional capacity on climate change mitigation, adaptation, impact reduction and early warning. |
| 13.b | Promote mechanisms for raising capacity for effective climate change-related planning and management in least developed countries and small island developing States, including focusing on women, youth and local and marginalized communities. |
| 14.1 | By 2025, prevent and significantly reduce marine pollution of all kinds, in particular from land-based activities, including marine debris and nutrient pollution. |
| 14.2 | By 2020, sustainably manage and protect marine and coastal ecosystems to avoid significant adverse impacts, including by strengthening their resilience, and take action for their restoration in order to achieve healthy and productive oceans. |
| 14.3 | Minimize and address the impacts of ocean acidification, including through enhanced scientific cooperation at all levels. |
| 14.4 | By 2020, effectively regulate harvesting and end overfishing, illegal, unreported and unregulated fishing and destructive fishing practices and implement science-based management plans, in order to restore fish stocks in the shortest time feasible, at least to levels that can produce maximum sustainable yield as determined by their biological characteristics. |
| 14.5 | By 2020, conserve at least 10 per cent of coastal and marine areas, consistent with national and international law and based on the best available scientific information. |
| 14.7 | By 2030, increase the economic benefits to small island developing States and least developed countries from the sustainable use of marine resources, including through sustainable management of fisheries, aquaculture and tourism. |
| 14.a | Increase scientific knowledge, develop research capacity and transfer marine technology, taking into account the Intergovernmental Oceanographic Commission Criteria and Guidelines on the Transfer of Marine Technology, in order to improve ocean health and to enhance the contribution of marine biodiversity to the development of developing countries, in particular small island developing States and least developed countries. |
| 14.c | Enhance the conservation and sustainable use of oceans and their resources by implementing international law as reflected in the United Nations Convention on the Law of the Sea, which provides the legal framework for the conservation and sustainable use of oceans and their resources, as recalled in paragraph 158 of “The future we want” |
| 15.8 | By 2020, introduce measures to prevent the introduction and significantly reduce the impact of invasive alien species on land and water ecosystems and control or eradicate the priority species. |
| 16.7 | Ensure responsive, inclusive, participatory and representative decision-making at all levels. |
| 17.17 | Encourage and promote effective public, public–private and civil society partnerships, building on the experience and resourcing strategies of partnerships. |
Appendix C
| Selection Criteria | |||||||||||
|---|---|---|---|---|---|---|---|---|---|---|---|
| Selected SDG Targets | Short Description | (A) Availability | (B) Relevancy | (C) Specificity | (D) Accuracy | Selected/ Not Selected | Motivation of Synergy | ||||
| YES | NO | YES | NO | YES | NO | YES | NO | ||||
| 1.5 | Disaster resilience | → B | → C | ■ | Not selected | Covered in 11.5 | |||||
| 3.9 | Pollutions and contamination | → B | → D | □ | Not selected | ||||||
| 3.d | Early warning & risk reduction | → B | → D | □ | Not selected | ||||||
| 6.3 | Water pollution | → B | → C | → D | ■ | Not selected | Covered in 6.6 | ||||
| 6.6 | Water quantity and quality | → B | → C | ■ | Selected | ||||||
| 7.2 | Renewable energy | → B | → C | ■ | Selected | ||||||
| 7.3 | Energy efficiency | → B | → D | → D | □ | Not selected | |||||
| 8.2 | Economic productivity | → B | → C | → D | ■ | Selected | double- SDG | ||||
| 8.4 | Resource efficiency | → D | □ | Not selected | |||||||
| 8.9 | Sustainable tourism | → D | ■ | Selected | double- SDG | ||||||
| 9.1 | Resilient infrastructure | → B | → D | □ | Not selected | ||||||
| 9.4 | CO2 emission reduction | → B | → C | → D | ■ | Selected | double- SDG | ||||
| 9.5 | Knowledge and innovation | → B | → D | ■ | Selected | double- SDG | |||||
| 11.3 | Inclusive urbanization | → D | □ | Not selected | |||||||
| 11.5 | Disaster risk reduction | → D | ■ | Selected | double- SDG | ||||||
| 11.6 | Air quality | → B | → C | ■ | Selected | double- SDG | |||||
| 11.a | Development planning | → D | □ | Not selected | |||||||
| 11.b | Holistic disaster risk management | → B | → C | → D | ■ | Not selected | covered in 11.5 | ||||
| 12.2 | Natural resources | → D | □ | Not selected | |||||||
| 12.7 | Sustainable procurement | → D | □ | Not selected | |||||||
| 12.8 | Flood awareness | → D | ■ | Selected | |||||||
| 12.b | Monitor sustainable development | → D | □ | Not selected | |||||||
| 12.c | Phasing out harmful subsidies | → D | □ | Not selected | |||||||
| 13.1 | Resilience and adaptive capacity | → B | → D | ■ | Not selected | covered in 11.5 | |||||
| 13.2 | Coastal erosion or accretion | → B | → D | ■ | Selected | ||||||
| 13.3 | Improve climate education | → B | → D | ■ | Not selected | covered in 12.8 | |||||
| 13.b | Effective planning | → D | ■ | Not selected | covered in 12.8 | ||||||
| 14.1 | Marine pollution | → D | ■ | Not selected | covered in 6.6 | ||||||
| 14.2 | Biodiversity abundance | → D | ■ | Selected | |||||||
| 14.3 | Ocean acidification | → D | □ | Not selected | |||||||
| 14.4 | Sustainable fishing | → B | → D | □ | Not selected | ||||||
| 14.5 | Coastal-marine conservation | → B | → D | ■ | Not selected | covered in 14.2 | |||||
| 14.7 | Small island developing | → D | □ | Not selected | |||||||
| 14.a | Marine technology | → D | □ | Not selected | |||||||
| 14.c | Ocean conservation | → D | □ | Not selected | |||||||
| 15.8 | Prevention of invasive alien species | → D | □ | Not selected | |||||||
| 16.7 | Institutional capacity | → D | ■ | Selected | |||||||
| 17.17 | Public–private partnerships | → D | □ | Not selected | |||||||
Appendix D
| Short Description | KPI | SDG Target | Unit | Reference | CLG | CCC | CVM | CQP | CNN |
|---|---|---|---|---|---|---|---|---|---|
| Social service | |||||||||
| Water quantity and quality | Actual renewable water resources per capita | 6.6 | % | [118] | 75 | 61 | 42 | 81 | 45 |
| Renewable energy | Renewable electricity share of total electricity output (%) | 7.2 | % | [87] | 13.2 | 68.2 | 36.7 | 13.6 | 12.4 |
| Disaster risk reduction | Sendai Index | 11.5 | Number of deaths/missing persons affected by hydrological disasters per 100,000 inhabitants of coastal area | [94] | 7.90 | 787.2 | 5151.5 | 6.7 (2016) | 0.0 |
| Air quality | PM2.5 | 11.6 | μg/m3 | [95] | 6.7 | 13.4 | 26.6 | 6.1 | 11.0 |
| Institutional capacity | Governance Effectiveness Index | 16.7 | % | [101] | 91 | 54 | 53 | 92 | 97 |
| Environmental service | |||||||||
| Coastal erosion or accretion | Average erosion or accretion rate | 13.2 | Average change rate in m/year | [98] | −1.58 | −0.52 | −1.71 | 0.04 | 1.12 |
| Biodiversity abundance | Ocean Health Index | 14.2 | % | [88] | 84.2 | 80.1 | 83.3 | 94.0 | 90.5 |
| Economic service | |||||||||
| Economic productivity | Annual growth rate of real GDP per employed person | 8.2 | % | [88] | 66.8 | 80.4 | 74.0 | 95.6 | 66.8 |
| Sustainable tourism | World Economic Forum | 8.9 | % | [90] | 41.4 | 17.50 | 26.5 | 60.1 | 60.8 |
| CO2 emission reduction | Carbon dioxide (CO2) emissions per capita; estimates | 9.4 | 1000 tons CO2/CAP km2 coast | [91] | 16.5 | 1.7 | 1.8 | 15.4 | 9.9 |
| Knowledge and innovation | Global Competitiveness Index | 9.5 | % | [92] | 5.9 | 4.3 | 4.4 | 5.2 | 5.7 |
| Flood awareness | Public awareness | 12.8 | % | [96] | 21 | 22 | 17 | 24 | 26 |
Appendix E
| Short Description | KPI | SDG Target | Unit | Reference | CNH | CNA | CNC | CNZ | CNT |
|---|---|---|---|---|---|---|---|---|---|
| Social service | |||||||||
| Water quantity and quality | Eutrophication | 6.6 | NO3 and NO2 (mg/l) | [122] | 0.75 (1981) | 0.17 (2018) | 0.49 (1978) | 0.10 (2018) | 0.14 (2018) |
| Renewable energy | Renewable electricity share of total electricity output (%) | 7.2 | % | [87] | ND | ND | ND | ND | ND |
| Disaster risk reduction | Sendai Index | 11.5 | Number of deaths/missing persons affected by hydrological disasters | [94] | 0 | 0 | 0 | 0 | 0 |
| Air quality | Air pollution/ MKI | 11.6 | kg DB eq./m3 | [86] | 4.01 | 4.21 | 4.14 | 5.22 | 3.98 |
| Institutional capacity | Participation ladder | 16.7 | Index | [102] | 3 | 3 | 3 | 3 | 3 |
| Environmental service | |||||||||
| Coastal erosion or accretion | Average erosion or accretion per nourishment | 13.2 | Average change rate in m/year | [99] | −36 | 0 | 10 | −6 | −2 |
| Biodiversity abundance | Impact of disrupted seabed m3 | 14.2 | m2/m3 | [100] | 0.7 | 0.7 | 12.2 | 14.5 | 5.9 |
| Economic service | |||||||||
| Economic productivity | Annual growth job market due project in Euro/m3 | 8.2 | Euro/m3 | [89] | ND | 0.28 | 0.60 | ND | 1.20 |
| Sustainable tourism | Amount of Extra dry beach surface per m3 | 8.9 | m2/m3 | [38] | 0.07 | 0.00 | 0.08 | 0.16 | 0.22 |
| CO2 emission reduction | Carbon dioxide (CO2) emissions per nourishment | 9.4 | kg CO2 eq/m3 nourishment | [86] | 11.0 | 11.6 | 11.4 | 14.4 | 10.9 |
| Knowledge and innovation | Citation of peer publications in SCOPUS | 9.5 | number of citations | [93] | 284 | 5 | 0 | 0 | 0 |
| Flood awareness | Flood and water awareness based | 12.8 | HF (%) | [97] | 2.15 | 2.23 | 1.99 | 2.39 | 2.26 |
References
- Hall, J.W.; Sayers, P.; Walkden, M.; Panzeri, M. Impacts of climate change on coastal flood risk in England and Wales: 2030–2100. Philos. Trans. R. Soc. A Math. Phys. Mot. Sci. 2006, 364, 1027–1049. [Google Scholar] [CrossRef] [Green Version]
- De Boer, J.; Van der Zande, T.E.; Pieters, H.; Ariese, F.; Schipper, C.A.; Van Brummelen, T.; Vethaak, A.D. Organic contaminants and trace metals in flounder liver and sediment from the Amsterdam and Rotterdam harbours and off the Dutch coast. J. Env. Monit. 2001, 3, 386–393. [Google Scholar] [CrossRef]
- Botwe, B.O.; de Schamphelaere, K.; Schipper, C.A.; Teuchies, J.; Blust, R.; Nyarko, E.; Lens, P.N.L. Integrated hazard, risk and impact assessment of tropical marine sediments from Tema Harbour (Ghana). Chemosphere 2017. [Google Scholar] [CrossRef] [PubMed]
- Muller, C.O.; Yu, H.; Zhu, B. Ambient air quality in China: The impact of particulate and gaseous pollutants on IAQ. Procedia Eng. 2015, 121, 582–589. [Google Scholar] [CrossRef] [Green Version]
- Schipper, C.A.; Vergouwen, S.; Bel de, B.; de Jong, M. Ports of the Future. Exploratory Study. Deltares Rep. 2015, 45, 1220137-000. Available online: https://www.researchgate.net/publication/282011883_Port_of_the_Future_Exploratory_study (accessed on 1 May 2015).
- Bishop, M.; Peterson, C. Assessing the environmental impacts of beach nourishment. J. Sci. Math. 2005, 55, 887–896. [Google Scholar]
- Kundzewicz, Z.W.; Kanae, S.; Seneviratne, S.I. Flood risk and climate change: Global and regional perspectives. Hydrol. Sci. J. 2013, 59, 1–28. [Google Scholar] [CrossRef] [Green Version]
- Miller, J.D.; Hutchins, M. The impacts of urbanisation and climate change on urban flooding and urban water quality: A review of the evidence concerning the United Kingdom. J. Hydrol. Reg. Stud. 2017, 12, 345–362. [Google Scholar] [CrossRef] [Green Version]
- IPCC. Summary for policymakers. In Climate Change 2014: Mitigation of Climate Change. Contribution of Working Group III to the Fifth Assessment Report of the Intergovernmental Panel on Climate Change; Edenhofer, O.R., Pichs-Madruga, Y., Sokona, E., Farahani, S., Kadner, K., Seyboth, A., Adler, I., Baum, S., Brunner, P., Eickemeier, B., et al., Eds.; Cambridge University Press: Cambridge, UK; New York, NY, USA, 2014. [Google Scholar]
- van Wesenbeeck, B.K.; de Boer, W.; Narayan, S.; van der Star, W.R.; de Vries, M.B. Coastal and riverine ecosystems as adaptive flood defences under a changing climate. Mitig. Adapt. Strateg. Glob. Change 2016, 22, 1087–1094. [Google Scholar] [CrossRef] [Green Version]
- Schipper, C.A.; Vreugdenhil, H.; de Jong, M.P.C. A sustainability assessment of ports and port-city plans: Comparing ambitions with achievements. Transp. Res. 2017, 57, 84–111. [Google Scholar] [CrossRef]
- Nicholls, R.J.; Hutton, C.W.; Lázár, A.N.; Allan, A.; Adger, W.N.; Adams, H.; Wolff, J.; Rahman, M.; Salehin, M. Integrated assessment of social and environmental sustainability dynamics in the Ganges-Brahmaputra-Meghna delta, Bangladesh. Estuar. Coast. Shelf Sci. 2016, 183, 1–12. [Google Scholar] [CrossRef] [Green Version]
- UN. Take Action for the Sustainable Development Goals–United Nations Sustainable Development. 2015. Available online: https://www.un.org/sustainabledevelopment/sustainable-development-goals/ (accessed on 1 December 2015).
- UN. Transforming Our World: The 2030 Agenda for Sustainable Development; Resolution Adopted by the General Assembly on 25 September 2014; (A/Res/70/1); UN: New York, NY, USA, 2015. [Google Scholar]
- Adoption of the Paris Agreement; Proposal by the President, COP21; UN: New York, NY, USA, 2015.
- UN. Report of the Inter-Agency and Expert Group on Sustainable Development Goal Indicators Statistical Commission. Items for Discussion and Decision: Data and Indicators for the 2030 Agenda for Sustainable Development; E/CN.3/2019/2; UN: New York, NY, USA, 2019. [Google Scholar]
- UN. 2019. Available online: https://undocs.org/pdf?symbol=en/A/RES/74/4 (accessed on 20 January 2021).
- UN. The Sustainable Development Goals Report 2017; United Nations: New York, NY, USA, 2017; Available online: https://unstats.un.org/sdgs/files/report/2017/TheSustainableDevelopmentGoalsReport2017.pdf (accessed on 20 January 2021).
- UN. Guidelines to Support Country Reporting on the Sustainable Development Goals; UN: New York, NY, USA, 2017. [Google Scholar]
- UNDP. What are the Sustainable Development Goals? 2018. Available online: www.undp.org/content/undp/en/home/sustainable-development-goals.html (accessed on 20 January 2021).
- UNDP. Investing in Innovative Nature-Based Solutions; UNDP: New York, NY, USA, 2017. [Google Scholar]
- Wendling, L.A.; Huovila, A.; Castell-Rüdenhausen, M.; Hukkalainen, M.; Airaksinen, M. Benchmarking nature-based solution and smart city assessment schemes against the sustainable development goal indicator framework. Front. Env. 2018. [Google Scholar] [CrossRef] [Green Version]
- Giardino, A.; Santinelli, G.; Vuik, V. Coastal state indicators to assess the morphological development of the Holland coast due to natural and anthropogenic pressure factors. Ocean Coast. Manag. 2014, 87, 93–101. [Google Scholar] [CrossRef]
- Stronkhorst, J.; Huisman, B.; Giardino, A.; Santinelli, G.; Santos, F.D. Sand nourishment strategies to mitigate coastal erosion and sea level rise at the coasts of Holland (The Netherlands) and Aveiro (Portugal) in the 21st century. Ocean Coast. Manag. 2018, 156, 266–276. [Google Scholar] [CrossRef]
- Sustain. Measuring Coastal Sustainability: The Sustain Policy Tool. 2012. Available online: https://www.msp-platform.eu/projects/measuring-coastal-sustainability-sustain-policy-tool (accessed on 20 January 2021).
- Dawson, R.J.; Dickson, M.E.; Nicholls, R.J. Integrated analysis of risks of coastal flooding and cliff erosion under scenarios of long-term change. Clim. Chang. 2009, 95, 249–288. [Google Scholar] [CrossRef] [Green Version]
- World Bank. Implementing Nature-Based Flood Protection: Principles and Implementation Guidance; World Bank: Washington, DC, USA, 2017. [Google Scholar]
- Green, D.R.; Payne, J.L. Marine and Coastal Resource Management: Principles and Practices (Earthscan Ocean); Routledge: New York, NY, USA, 2017; 336p, ISBN 1849712905. [Google Scholar]
- UN. Indicators of Sustainable Development: Guidelines and Methodologies; No. E.08. II. A.2; United Nations: New York, NY, USA, 2007; ISBN 978-92-1-104577-2. [Google Scholar]
- DEDUCE. Indicators Guidelines. To Adapt an Indicators-Based Approach to Evaluate Sustainable Coastal Development; DEDUCE Interreg III; 2007, 98 pg. Available online: http://www.im.gda.pl/images/ksiazki/2007_indicators_guidelines.pdf (accessed on 1 December 2007).
- Schanze, J.; Hutter, G.; Penning-Rowsell, E.; Nachtnebel, H.P.; Meyer, V.; Werritty, A.; Harries, T.; Holzmann, H.; Jessel, B.; Koeniger, P.; et al. Systematisation, Evaluation and Context Conditions of Structural and Non-Structural Measures for Flood Risk Re-Duction; ERA-NET CRUE: London, UK, 2008. [Google Scholar]
- Sayers, P.; Walsh, C.; Dawson, R. Climate impacts on flood and coastal erosion infrastructure. Infrastruct. Asset Manag. 2015, 1400040. [Google Scholar] [CrossRef] [Green Version]
- Stive, M.J.F.; de Schipper, M.A.; Luijendijk, A.P.; Aarninkhof, S.G.J.; van Gelder-Maas, C.; van Thiel de Vries, J.S.M.; de Vries, S.; Henriquez, M.; Marx, S.; Ranasinghe, R. A new alternative to saving our beaches from sea-level rise: The sand motor. J. Coast. Res. 2013, 29, 1001–1008. [Google Scholar] [CrossRef]
- Sutton-Grier, A.E.; Gittman, R.K.; Arkema, K.K.; Bennett, R.O.; Benoit, J.; Blitch, S.; Burks-Copes, K.A.; Colden, A.; Dausman, A.; DeAngelis, B.M.; et al. Investing in natural and nature-based infrastructure: Building better along our coasts. Sustainability 2018, 10, 523. [Google Scholar] [CrossRef] [Green Version]
- Dronkers, J.; Stojanovic, T. Coastal management and governance. In North Sea Climate Change Assessment; Colijn, F., Quante, M., Eds.; Springer: Berlin, Germany, 2016; pp. 475–488. [Google Scholar]
- Narayan, S.; Beck, M.W.; Wilson, P. The value of coastal wetlands for flood damage reduction in the northeastern USA. Sci. Rep. 2017, 7, 9463. [Google Scholar] [CrossRef]
- Giardino, A.; Mulder, J.; de Ronde, J.; Stronkhorst, J. Sustainable development of the Dutch coast: Present and future. J. Coast. Res. 2011, 61, 166–172. [Google Scholar] [CrossRef]
- Stronkhorst, J.; van Buren, R. Asset Management en Kustlijnzorg; Report 1220047-002; Deltares: Delft, The Netherland, 2015. (In Dutch) [Google Scholar]
- Rizzo, A.; Anfuso, G. Coastal dynamic and evolution: Case studies from different sites around the world. Water 2020, 12, 2829. [Google Scholar] [CrossRef]
- Disaster Risk Reduction and Resilience in the 2030 Agenda for Sustainable Development; UNDRR: Geneva, Switzerland, 2015.
- Suraj, M.; Singh, R.B.; Huggel, C. Climate Change, Extreme Events and Disaster Risk Reduction: Towards Sustainable Development Goals; Springer: Berlin, Germany, 2018. [Google Scholar] [CrossRef]
- Lorcan, C.; Blanchard, K.; Maini, R.; Radu, A.; Eltinay, N.; Zaidi, Z.; Murray, V. Knowing what we know—Reflections on the development of technical guidance for loss data for the Sendai framework for disaster risk reduction. PLoS Curr. 2018, 10, 1–12. [Google Scholar]
- Rickels, W.; Dovern, J.; Hoffmann, J.; Quaas, M.F.; Schmidt, J.O.; Visbeck, M. Indicators for monitoring sustainable development goals: An application to oceanic development in the European Union. Earth’s Future 2016, 4, 252–267. [Google Scholar] [CrossRef] [Green Version]
- Ishtiaque, A.; Masrur, A.; Rabby, Y.W.; Jerin, T.; Dewan, A. Remote sensing-based research for monitoring progress towards SDG 15 in Bangladesh: A review. Remote. Sens. 2020, 12, 691. [Google Scholar] [CrossRef] [Green Version]
- Kistenkas, F.H.; Bouwma, I.M. Barriers for the ecosystem services concept in European water and nature conservation law. Ecosyst. Serv. 2018, 29, 223–227. [Google Scholar] [CrossRef]
- Climate Change Adaptation, Marine and Coastal Issues; Commission Staff Working Document (SWD 2013); European Commision: Brussels, Belgium, 2013.
- Kudale, M.D. Impact of port development on the coastline and the need for protection. Indian J. Geo-Mar. Sci. 2010, 39, 597–604. [Google Scholar]
- Elkington, J. Cannibals with Forks: The Triple Bottom Line of 21st Century Business; Capstone Publishing Ltd.: Oxford, UK, 1998. [Google Scholar]
- Haarmann, W.; Hermans, F.; Overeem, I. Monitoring van Provinciale Duurzame Ontwikkeling. De Duurzaamheidbalans Getoetst in Vier Provincies. 2004. Available online: https://www.telos.nl/Publicaties/PublicatiesRapporten/HandlerDownloadFiles.ashx?idnv=699418 (accessed on 20 January 2021).
- Ahvenniemi, H.; Huovila, A.; Pinto-Seppä, I.; Airaksinen, M. What are the differences between sustainable and smart cities? Cities 2017, 60, 234–245. [Google Scholar] [CrossRef]
- Essex, B.; Koop, S.H.A.; van Leeuwen, C.J. Proposal for a national blueprint framework to monitor progress on water-related sustainable development goals in Europe. Environ. Manag. 2020, 65, 1–18. [Google Scholar] [CrossRef] [Green Version]
- Schipper, C.A. Understanding the sustainable development goal approach for ports of the future. In Proceedings of the 38th IAHR World Congress, Panama City, Panama, 1–6 September 2019. [Google Scholar]
- Zimon, D.; Srouf, J.T.R. Drivers of sustainable supply chain management: Practices to alignment with UN sustainable development goals. Int. J. Qual. Res. 2019, 14, 219–236. [Google Scholar] [CrossRef]
- Horan, D. National Baselines for Integrated Implementation of an Environmental Sustainable Development Goal Assessed in a New Integrated SDG Index. Sustainability 2020, 12, 6955. [Google Scholar] [CrossRef]
- Schroeder, P.; Anggraeni, K.; Weber, U. The relevance of circular economy practices to the sustainable development goals. J. Ind. Ecol. 2018, 2, 77–95. [Google Scholar] [CrossRef] [Green Version]
- Lawer, E.T.; Herbeck, J.; Flitner, M. Selective adoption: How port authorities in Europe and West Africa engage with the globalizing ‘Green Port’ idea. Sustainability 2019, 11, 5119. [Google Scholar] [CrossRef] [Green Version]
- UN. (2019) Tier Classification for Global SDG Indicators, 4 April 2019. Available online: https://unstats.un.org/sdgs/files/Tier%20Classification%20of%20SDG%20Indicators_4%20April%202019_web.pdf (accessed on 1 May 2019).
- Nabyonga-Orem, J. Monitoring sustainable development goal 3: How ready are the health information systems in low-income and middle-income countries? BMJ Glob. Health 2017, 2, e000433. [Google Scholar] [CrossRef] [PubMed]
- Le Blanc, D. Towards integration at last? The sustainable development goals as a network of targets. Sustain. Dev. 2015, 23, 176–187. [Google Scholar] [CrossRef]
- Nilsson, M.; Chisholm, E.; Griggs, D. Mapping interactions between the sustainable development goals: Lessons learned and ways forward. Sustain. Sci. 2018, 13, 1489–1503. [Google Scholar] [CrossRef] [Green Version]
- Pedercini, M.; Zuellich, G.; Dianati, K.; Arquitt, S. Toward achieving sustainable development goals in ivory coast: Simulating pathways to sustainable development. Sustain. Dev. 2018, 26, 588–595. [Google Scholar] [CrossRef]
- Hutton, C.W.; Nicholls, R.J.; Lázár, A.T.; Chapman, A.; Schaafsma, M.; Salehin, M. Potential trade-offs between the sustainable development goals in coastal Bangladesh. Sustainability 2018, 10, 1108. [Google Scholar] [CrossRef] [Green Version]
- Reguero, B.G.; Bresch, D.N.; Beck, M. Coastal risks, nature-based defenses and the economics of adaptation: An application in the Gulf of Mexico, USA. Coast. Eng. Proc. 2014, 1, 25. [Google Scholar] [CrossRef] [Green Version]
- Raymond, C.M.; Berry, P.; Breil, M.; Nita, M.R.; Kabisch, N.; de Bel, M.; Enzi, V.; Frantzeskaki, N.; Geneleti, D.; Cardinaletti, M.; et al. An Impact Evaluation Framework to Support Planning and Evaluation of Nature-Based Solutions Projects; Report Prepared by the EKLIPSE Expert Working Group on Nature-Based Solutions to Promote Climate Resilience in Urban Areas; Centre for Ecology and Hydrology: Wallingford, UK, 2017. [Google Scholar]
- Raymond, C.M.; Frantzeskaki, N.; Kabisch, N. A framework for assessing and implementing the co-benefits of nature-based solutions in urban areas. Environ. Sci. Pol. 2017, 77, 15–24. [Google Scholar] [CrossRef]
- Dushenko, M.; Bjorbæk, C.T.; Steger-Jensen, K. Application of a sustainability model for assessing the relocation of a container terminal: A case study of Kristiansand port. Sustainability 2019, 11, 87. [Google Scholar] [CrossRef] [Green Version]
- IPCC. Climate change 2001: Impacts, adaptation and vulnerability. In Contribution of Working Group II to the Third Assessment Report of the Intergovernmental Panel on Climate Change, World Meteorological Organisation and United Nations Environment Programme; McCarthy, J., Canziani, O.F., Leary, N.A., Dokken, D.J., White, K.S., Eds.; Cambridge University Press: Cambridge, UK, 2001; 1032p. [Google Scholar]
- Millennium Ecosystem Assessment. Ecosystems and Human Well-Being: Synthesis; Island Press: Washington, DC, USA, 2005. [Google Scholar]
- Torresan, S.; Critto, A.; Valle, M.D.; Harvey, N.; Marcomini, A. Assessing coastal vulnerability to climate change: Comparing segmentation at global and regional scales. Sustain. Sci. 2018, 3, 45–65. [Google Scholar] [CrossRef]
- UN. Compilation of Metadata for the Proposed Global Indicators for the Review of the 2030 Agenda for Sustainable Development, Metadata for Goals 1 till 17. 2016. Available online: https://unstats.un.org/sdgs/iaeg-sdgs/metadata-compilation (accessed on 20 January 2021).
- Gopalakrishnan, L.; Landry, C.E.; Smith, M.D. Climate change adaptation in coastal environments: Modeling challenges for resource and environmental economists. Rev. Environ. Econ. Policy 2018, 12, 48–68. [Google Scholar] [CrossRef] [Green Version]
- Climate Change Adaptation, Coastal and Marine Issues; SWD 133; UN: New York, NY, USA, 2013.
- Russel, P.R. Mississippi River Diversions Could Save Louisiana’s Drowning Coast. Eng. News Record. 2018. Available online: https://www.datacenterresearch.org/news/mississippi-river-diversions-could-save-louisianas-drowning-coast/ (accessed on 9 August 2018).
- State of Louisiana. Coast Masterplan. Louisiana Comprehensive Master Plan for a Sustainable Coast; OTS-State Printing: Baton Rouge, LA, USA, 2017.
- OECD Environmental Performance Reviews: Colombia; OECD Publishing: Paris, France, 2014. [CrossRef]
- Guannel, G.; Arkema, K.; Ruggiero, P.; Verutes, G. The power of three: Coral reefs, seagrasses and mangroves protect coastal regions and increase their resilience. PLoS ONE 2016, 11, e0158094. [Google Scholar] [CrossRef] [PubMed] [Green Version]
- Preparing a Shoreline Erosion Management Plan. Guideline for Coastal Development; Department of Environment and Science, Queensland Government: Brisbane, QLD, Australia, 2018.
- Gebhardt, S.; Nguyen, L.D.; Kuenzer, C. Mangrove Ecosystems in the Mekong Delta–Overcoming Uncertainties in Inventory Mapping Using Satellite Remote Sensing Data. Chapter 12. In The Mekong Delta System: Interdisciplinary 315 Analyses of a River Delta, Environmental Science and Engineering; Renaud, F.G., Kuenzer, C., Eds.; Springer: Dordrecht, The Netherlands, 2012. [Google Scholar]
- Ministry of Natural Resources and Environment. Mekong Delta Plan Long-Term Vision and Strategy for a Safe, Prosperous and Sustainable Delta; MinIeW, RHDHV, Deltares, Rebel, WUR. 2013. Available online: https://www.deltares.nl/app/uploads/2014/01/Mekong-delta-plan-Long-term-vision-and-strategy.pdf (accessed on 20 January 2021).
- Compass for the Coast. National Coastal Strategy; Ministry of Infrastructure and Environment, Delta Commission: The Hague, The Netherlands, 2013.
- Van Oers, M.; Ministerie van Verkeer en Waterstaat, Rijkswaterstaat, Waterdienst (RWS, WD). Objectbeheerregime Kustfundament. Beheer- en Onderhoudsstrategie Objectbeheerregime Kustfundament. 2017; 84p, (In Dutch). Available online: https://puc.overheid.nl/rijkswaterstaat/doc/PUC_143111_31/ (accessed on 20 January 2021).
- DHV Milieu en Infrastructuur; H+N+S landschapsarchitecten. Aanleg en Zandwinning Zandmotor Delflandse Kust: Projectnota/ MER; Provence Zuid-Holland: Den Haag, The Netherlands, 2010; 372p. (In Dutch) [Google Scholar]
- Van Prooijen, B.C.; Tissier, M.F.S.; de Wit, F.P.; Pearson, S.G.; Brakenhoff, L.B.; van Maarseveen, C.G.; van der Vegt, M.; Mol, J.W.; Kok, F.; Holzhauer, H.; et al. Measurements of hydrodynamics, sediment, morphology and benthos on Ameland ebb-tidal delta and lower shoreface. Earth Syst. Sci. Data 2020. [Google Scholar] [CrossRef]
- SDG-Tracker. 2018. Available online: https://ourworldindata.org/uploads/2018/06/SDG-Data-Matrix-01.png (accessed on 20 January 2021).
- UNEP. 2019. Available online: http://www.unep.org/explore-topics/water/what-we-do/monitoring-water-quality (accessed on 20 January 2021).
- Rijkswaterstaat. What is DuboCalc? 2018. Available online: https://www.dubocalc.nl/en/what-is-dubocalc/ (accessed on 20 January 2021).
- World Bank. 2019. Available online: https://data.worldbank.org/indicator/EG.GDP.PUSE.KO.PP.KD (accessed on 20 January 2021).
- Ocean Health Index. 2018. Available online: http://www.oceanhealthindex.org/ (accessed on 20 January 2021).
- Andringa, T. De Kust-Meer dan Hoogwaterbescherming. Een Verkenning van de Baten van Kustlijnzorg. Ph.D. Thesis, University of Twente, Enschede, The Netherlands, 2015. (In Dutch). [Google Scholar]
- World Economic Forum. The Travel & Tourism Competitiveness Report 2019; World Economic Forum: Geneva, Switzerland, 2019; ISBN 978-2-940631-01-8. [Google Scholar]
- Global Economy. 2019. Available online: https://www.theglobaleconomy.com/rankings/Carbon_dioxide_emissions_per_capita/ (accessed on 20 January 2021).
- World Economic Forum. 2019. Available online: http://reports.weforum.org/global-competitiveness-index-2017-2018/competitiveness-rankings/#series=GCI.B.09 (accessed on 20 January 2021).
- Elsevier. 2018. Available online: https://www.scopus.com/search/form.uri?display=basic (accessed on 20 January 2021).
- Sendai Framework. The International Disaster Database. Centre for Research on the Epidemiology of Disasters/CRED. 2019. Available online: https://www.emdat.be/classification (accessed on 20 January 2020).
- World Health Organization. 2019. Available online: http://www.who.int/phe/health_topics/outdoorair/databases/cities/en/ (accessed on 20 January 2021).
- Hyogo Framework. 2019. Available online: https://www.preventionweb.net/english/hyogo/progress/priority5/?pid:222 (accessed on 20 January 2021).
- SAMR Publieksmonitor Waterpeil; Ministry of Infrastructure and Water Management: The Hague, The Netherlands, 2016; (In Dutch). Available online: https://klimaatadaptatienederland.nl/@212601/waterpeil/ (accessed on 1 July 2016).
- Luijendijk, A.; Hagenaars, G.; Ranasinghe, R.; Baart, F.; Donchyts, G.; Aarninkhof, S. The state of the world’s beaches. Sci. Rep. 2018, 8, 6641. [Google Scholar] [CrossRef]
- Giardino, A.; den Heijer, C.; Santinelli, G.; van der Werf, J.J. Tools for Medium and Long-Term Prediction of Nourishment Effects; Report 1207724-003; Deltares: Delft, The Netherlands, 2013. [Google Scholar]
- Van Duin, C.F.; Vrij Peerdeman, M.; Jaspers, C.J.; Bucholc, A.M.; Wessels, S.C. MER Winning Suppletiezand Noordzee 2013–2017; Report; Grontmij: Stockholm, Sweden, 2012. (In Dutch) [Google Scholar]
- World Bank. Government Effectiveness Index. 2019. Available online: http://info.worldbank.org/governance/wgi/index.aspx#reports (accessed on 20 January 2021).
- Pröpper, I.M.A.M.; Steenbeek, D.A. De aanpak van Interactief Beleid: Elke Situatie is Anders; Coutinho: Bussum, The Netherlands, 1999. (In Dutch) [Google Scholar]
- Neumann, B.; Ott, K.; Kenchington, R. Strong sustainability in coastal areas: A conceptual interpretation of SDG 14. Sustain. Sci. 2017, 12, 1019–1035. [Google Scholar] [CrossRef] [Green Version]
- Allen, C.; Reid, M.; Thwaites, J.; Glover, R.; Kestin, T. Assessing national progress and priorities for the sustainable development goals (SDGs): Experience from Australia. Sustain. Sci. 2019, 15, 521–538. [Google Scholar] [CrossRef]
- Wood, S.L.R.; Jonson, S.K.; Justin, J.A.; Brauman, K.A.; Chaplin-Kramer, R.; Fremier, F.; Girvetz, E.; Line, J.; Gordon, J.L.; Kappel, C.V.; et al. Distilling the role of ecosystem services in the sustainable development goals. Ecosyst. Serv. 2018, 29, 70–82. [Google Scholar] [CrossRef] [Green Version]
- Velders, G.J.; Maas, R.J.; Geilenkirchen, G.P.; de Leeuw, F.A.; Ligterink, N.E.; Ruyssenaars, P.; de Vries, W.J.; Wesselin, J. Effects of European emission reductions on air quality in the Netherlands and the associated health effects. Atmos. Environ. 2020, 221, 117109. [Google Scholar] [CrossRef]
- Vousdoukas, M.I.; Ranasinghe, R.; Mentaschi, L.; Plomaritis, T.A.; Athanasiou, P.; Luijendijk, A.; Feyen, L. Sandy coastlines under threat of erosion. Nat. Clim. Chang. 2020, 10, 260–263. [Google Scholar] [CrossRef]
- Dang, H.A.H.; Serajuddin, U. Tracking the sustainable development goals: Emerging measurementchallenges and further reflections. World Dev. 2020, 127, 104570. [Google Scholar] [CrossRef] [Green Version]
- Butler, J.R.A.; Bohensky, E.L.; Suadnya, W.; Yanuartati, Y.; Handayani, T.; Habibi, P.; Puspadi, K.; Skewes, T.D.; Wise, R.M.; Suharto, I. Scenario planning to leap-frog the sustainable development goals: An adaptation pathways approach. Clim. Risk Manag. 2015. [Google Scholar] [CrossRef] [Green Version]
- GRI. 2019. Available online: https://database.globalreporting.org/ (accessed on 20 January 2021).
- Borsje, B.W.; de Vries, S.; Janssen, S.K.H.; Luijendijk, A.P.; Vuik, V. Chapter 8. Building with nature as coastal protection strategy in the Netherlands. In Living Shorelines; The Science and Management of Nature-Based Coastal Protection; Bilkovic, D.M., Mitchell, M.M., La Peyre, M.K., Toft, D., Eds.; CRC Press: Boca Raton, FL, USA, 2016. [Google Scholar]
- EU. An EU Strategy on Adaptation to Climate Change. COM 2013, 216. Available online: https://eur-lex.europa.eu/LexUriServ/LexUriServ.do?uri=COM:2013:0216:FIN:EN:PDF (accessed on 16 April 2013).
- Water Elements in the European Green Deal; Directorate-General for the Environment, European Commission: Brussels, Belgium, 2020.
- EC. Regulation of the European Parliament and of the Council Establishing the Framework for Achieving Climate Neutrality and Amending Regulation (EU) 2018/1999 (European Climate Law); 2020/0036 (COD); EC: Brussels, Belgium, 2020. [Google Scholar]
- Directive 2007/60/EC of the European Parliament and of the Council of 23 October 2007 on the Assessment and Management of Flood Risks; European Parliament: Brussels, Belgium, 2007.
- Schueler, K. Nature-Based Solutions to Enhance Coastal Resilience; Inter-American Development Bank: Washington, DC, USA, 2017. [Google Scholar]
- Schmidt, S.; Neumann, B.; Waweru, Y.; Durussel, C.; Unger, S.; Visbeck, M. SDG14 conserve and sustainably use the oceans, seas and marine resources for sustainable development. In A Guide to SDG Interactions: From Science to Implementation; Griggs, D.J., Nilsson, M., Stevance, A.-S., McCollum, D., Eds.; International Council for Science: Paris, France, 2017; pp. 174–218. [Google Scholar]
- UNEP. 2020. Available online: https://open.unep.org/ (accessed on 20 January 2021).
- McKinsey. Global Cities of the Future: An Interactive Map. 2012. Available online: https://www.mckinsey.com/featured-insights/urbanization/global-cities-of-the-future-an-interactive-map (accessed on 20 January 2021).
- Vinuesa, R.; Azizpour, H.; Leite, I.; Balaam, M.; Dignum, V.; Domisch, S.; Felländer, A.; Langhans, S.D.; Tegmark, M.; Nerini, F.F. The role of artificial intelligence in achieving the sustainable development goals. Nat. Commun. 2020, 11, 233. [Google Scholar] [CrossRef] [Green Version]
- Fonseca, L.M.; Domingues, J.P.; Dima, A.M. Mapping the sustainable development goals relationships. Sustainability 2020, 12, 3359. [Google Scholar] [CrossRef] [Green Version]
- Waterinfo Database. 2020. Available online: https://waterinfo.rws.nl/#!/nav/expert/ (accessed on 20 January 2021).


| Adaptation Measure | Description of (Eco)System Functionalities | Relevance to Climate Change | Reference |
|---|---|---|---|
| Nature Based Solution flood protection | Ecosystems such as salt marshes, mangroves, and vegetated fore shores may attenuate waves | As a result, it contributes to flood protection and reduces climate’s impact on coastal erosion | [10,27,32,34] |
| Beach-, foreshore nourishment | Morphology of a natural coastal ecosystem is in balance; interventions may interrupt this balance | Nourishment will have a positive shoreline contribution to climate regulation | [23,24,33] |
| Coastal wetland restoration | When the functioning of the ecosystem is under pressure, a potential added value could be obtained | Creating favorable habitat circumstances for fisheries or restoration of disturbed areas | [36] |
| Shoreline stabilization | Technical infrastructures to protect coastal zone from erosion (e.g., seawalls) | Traditional solution against flooding | [37,38,39] |
| Disaster risk reduction management | Assessing and reducing flood risk | Proactive planning and capacity building for extreme events | [9,27,40,41,42] |
| Integrated coastal management | Monitoring and evaluation of both the sustainability and performance of coastal management | Process defines goals and actions | [25,43,44] |
| Coastal, estuary, and riverine resource management | Assessing ecosystem changes that makes sustainability more feasible | Assessment of sea-level rise impacts | [28] |
| Marine protected area management and conservation agreement | Precautionary approach for area of critical concern | Series of measures improves the marine protected areas’ resilience to climate change | [45,46] |
| [12] | [42] | [43] | [44] | [54] | [59] | [60] | [61] | [62] | |
|---|---|---|---|---|---|---|---|---|---|
| Policy strategy | Coastal and delta strategy | Disaster risk reduction strategy | Coastal strategy | Coastal erosion and riverbank | Island states | Global national strategy | Coastal strategy | Integrated assessment of national strategy | Coastal and delta strategy |
| Geographical area | Bangladesh | - | EU coastal states | Bangladesh | Small Island Developing States | - | - | Ivory Coast | Bangladesh |
| Framework | (DDIEM) Delta Dynamic Integrated Emulator Model | Sendai framework | (IAEG-SDGs) Inter-Agency and Expert Group-Sustainable Development Goals | Remote sensing | (I-SDG) Integrated-Sustainable Development Goal | Assessment Overview | Assessment Overview | Treshold21-iSDG | (IAM) Integrated Assessment Model |
| Type of assessment | Qualitative | Quantitative | Qualitative | Semi-quantitative | Quantitative | Semi-quantitative | Qualitative | Qualitative | Quantitative |
| SDG 1 | 1 | 1.5.1; 1.5.2; 1.5.3 | - | - | - | 1 | - | 1 | 1 |
| SDG 2 | 2 | - | - | - | - | 2 | - | 2 | 2 |
| SDG 3 | 3 | - | - | - | - | 3 | - | 3 | - |
| SDG 4 | 4 | - | - | - | - | 4 | - | 4 | - |
| SDG 5 | - | - | - | - | - | 5 | - | 5 | - |
| SDG 6 | - | - | - | - | - | 6 | - | 6 | - |
| SDG 7 | - | - | - | - | - | 7 | - | 7 | - |
| SDG 8 | 8 | - | - | - | - | 8 | - | 8 | 8 |
| SDG 9 | - | - | - | - | - | 9 | - | 9 | - |
| SDG 10 | 10 | - | - | - | - | 10 | - | 10 | 10 |
| SDG 11 | - | 11.b.1; 11.b.2 | - | - | - | 11 | - | 11 | - |
| SDG 12 | - | - | - | - | - | 12 | - | 12 | - |
| SDG 13 | 13 | 13.1.1; 13.1.2; 13.1.3 | - | - | - | 13 | - | 13 | - |
| SDG 14 | 14 | - | 14.1; 14.2; 14.3; 14.4; 14.5; 14.6; 14.7; 14.a; 14.b; 14.c | - | 14.1; 14.4; 14.5; 14.7 | 14 | 14.2; 14.5 | 14 | 14 |
| SDG 15 | 15 | - | - | 15 | - | 15 | - | 15 | 15 |
| SDG 16 | - | - | - | - | - | 16 | - | 16 | - |
| SDG 17 | - | - | - | - | - | 17 | - | 17 | - |
| Geographical Location | Coastal Types | Flood Protection Type | Nourishment Type/Size (m3) | Reference |
|---|---|---|---|---|
| Coastline cases (set 1) | ||||
| Mississippi delta of Louisiana USA; Gulf of Mexico (CLG) | Wetlands, salt marches, mangroves | Nature-based flood protection; Sediment carried by the river floods | None | [73,74] |
| Caribbean delta of Colombia; Caribbean Sea & Pacific Ocean (CCC) | Hard structures; Rocks or cliffs fronted by sandy beaches and break walls | Shoreline stabilization; Rocks or cliffs fronted sediment supplied by erosion | None | [75] |
| Coast of Queensland, Australia; South Pacific Ocean (CQP) | Hard structures and coral and mangroves, and sandy beaches with dune landscapes | Nature-based flood protection; Barrier reef and mangrove forests | None | [76,77] |
| Mekong delta of Vietnam; East Sea (CVM) | Hard structures and nature- based mangrove wetland, salt marches structure; Tidal Delta | Nature-based flood protection; Sedimentation and mangroves | None | [78,79] |
| North Sea delta of The Netherlands; North Sea (CNN) | Sandy coastline with urban agglomeration | beach, foreshore nourishment | Yearly 12,000,000 | [80] |
| Sand nourishment cases (set 2) | ||||
| The Netherlands; North Sea; Domburg (CNZ) | Sandy coastline | Beach nourishment | 350,000 | [81] |
| The Netherlands; North Sea; Texel (CNT) | Sandy coastline | Beach nourishment | 1,150,000 | [81] |
| The Netherlands; North Sea; Callantsoog (CNC) | Sandy coastline | Shoreface nourishments and beach nourishment | 1,000,000 and 400,000 | [81] |
| The Netherlands; North Sea; Delfland Sand Motor Pilot (CNH) | Sandy coastline | Mega nourishment | 19,200,000 | [82] |
| The Netherlands; North Sea; Ameland Inlet Pilot (CNA) | Sandy coastline | Inlet system nourishment | 5,000,000 | [83] |
| Coastal Functionalities/System Features | CLG | CCC | CVM | CQP | CNN * |
|---|---|---|---|---|---|
| A. Serving coastal ecosystems to reduce flood frequency | ▲ | ▲ | ▲ | ▲ | ▲ |
| B. Serving socioeconomic inclusive growth | ▲ | ▲ | ▲ | ▲ | ▲ |
| C. Valuating biodiversity and ecosystem | ▲ | ▲ | ▲ | ▲ | ▲ |
| D. Regulating emission reduction | ▽ | ▽ | ▽ | ▽ | ▲ |
| E. Controlling coastal flooding and erosion reduction | ▲ | ▲ | ▲ | ▲ | ▲ |
| F. Serving wellbeing of humans | ▲ | ▲ | ▲ | ▽ | ▽ |
| SDG | SDG-Target | Short Description | A | B | C | D | E | F |
|---|---|---|---|---|---|---|---|---|
| 1 | 1.5 | Disaster resilience | 2 | 2 | 0 | 0 | 2 | 2 |
| 2 | - | 0 | 0 | 0 | 2 | 0 | 2 | |
| 3 | 3.9 | Pollutions and contamination | 0 | 0 | 0 | 2 | 0 | 2 |
| 3 | 3.d | Early warning & risk reduction | 0 | 0 | 1 | 2 | 0 | 2 |
| 4 | - | 2 | 0 | 2 | 0 | 0 | 0 | |
| 5 | - | 0 | 2 | 0 | 2 | 1 | 1 | |
| 6 | 6.3 | Water pollution | 0 | 2 | 0 | 2 | 0 | 0 |
| 6.6 * | Water quantity and quality | 0 | 2 | 0 | 2 | 1 | 2 | |
| 7 | 7.2* | Renewable energy | 2 | 2 | 1 | 1 | 0 | 1 |
| 7.3; | Energy efficiency | 1 | 2 | 2 | 0 | 0 | 2 | |
| 8 | 8.2 * | Economic productivity | 2 | 2 | 1 | 1 | 2 | 2 |
| 8.4 | Resource efficiency | 2 | 2 | 1 | 2 | 1 | 2 | |
| 8.9 * | Sustainable tourism | 2 | 2 | 1 | 1 | 1 | 2 | |
| 9 | 9.1 | Resilient infrastructure | 1 | 2 | 0 | 0 | 2 | 2 |
| 9.4 * | CO2 emission reduction | 2 | 2 | 0 | 0 | 2 | 2 | |
| 9.5 * | Knowledge and innovation | 0 | 0 | 1 | 2 | 0 | 2 | |
| 10 | - | 0 | 2 | 2 | 1 | 0 | 2 | |
| 11 | 11.3 | Inclusive urbanization | 2 | 2 | 2 | 2 | 2 | 2 |
| 11.5 * | Disaster risk reduction | 0 | 2 | 2 | 0 | 0 | 1 | |
| 11.6 * | Air quality | 1 | 2 | 1 | 1 | 1 | 2 | |
| 11.a | Development planning | 1 | 0 | 1 | 1 | 1 | 2 | |
| 11.b | Holistic disaster risk management | 0 | 2 | 2 | 1 | 0 | 2 | |
| 12 | 12.2 | Natural resources | 0 | 2 | 1 | 2 | 0 | 2 |
| 12.7 | Procurement practices | 2 | 1 | 1 | 0 | 2 | 2 | |
| 12.8 * | Flood awareness | 2 | 1 | 2 | 2 | 2 | 1 | |
| 12.b | Monitor sustainable development | 1 | 1 | 1 | 2 | 2 | 2 | |
| 12.c | Phasing out harmful subsidies | 2 | 2 | 2 | 2 | 2 | 2 | |
| 13 | 13.1 | Resilience and adaptive capacity | 0 | 1 | 2 | 2 | 0 | 2 |
| 13.2 * | Coastal erosion/accretion | 2 | 2 | 2 | 1 | 2 | 2 | |
| 13.3 | Improve climate education | 0 | 1 | 2 | 2 | 0 | 1 | |
| 13.b | Effective planning | 0 | 2 | 2 | 0 | 0 | 1 | |
| 14 | 14.1 | Reduce marine pollution | 1 | 0 | 2 | 0 | 0 | 1 |
| 14.2 * | Biodiversity abundance | 0 | 2 | 2 | 0 | 0 | 1 | |
| 14.3 | Ocean acidification | 0 | 2 | 2 | 0 | 0 | 1 | |
| 14.4 | Sustainable fishing | 0 | 1 | 2 | 2 | 0 | 1 | |
| 14.5 | Coastal marine conservation | 0 | 0 | 2 | 0 | 0 | 2 | |
| 14.7 | Small island developing | 0 | 2 | 0 | 0 | 1 | 2 | |
| 14.a | Marine technology | 1 | 2 | 0 | 0 | 1 | 1 | |
| 14.c | Ocean conservation | 2 | 2 | 0 | 0 | 2 | 2 | |
| 15 | 15.8 | Prevention of invasive alien species | 0 | 0 | 0 | 2 | 0 | 2 |
| 16 | 16.7 * | Institutional capacity | 0 | 0 | 0 | 2 | 0 | 2 |
| 17 | 17.17 | Public–private partnerships | 0 | 0 | 1 | 2 | 0 | 2 |
| SDG Target | Short Description | Coastline SDG-KPI Data Availability | Sand Nourishment SDG-KPI Data Availability |
|---|---|---|---|
| 6.6 | Water quantity and quality | Protect and restore water-related ecosystems, including coast, wetlands, rivers, aquifers, and lakes; it brings risks related to water quality based on nutrient pollution by eutrophication [85] | Contribute to concentration NO3 pollution with impact on eutrophication (Conc. NO3 and NO2 in mg/L) [86] |
| 7.2 | Renewable energy | Contribute by the energy transition to a less carbon-intensive system, accompanied by cost reductions [87] | No accurate and relevant open source data available from official international associations. |
| 8.2 | Economic productivity | Shows jobs in the higher economic level of productivity by incline of growth rate of real GDP per employed person [88] | The budget per nourishment is standardized on the total amount spent on personnel divided by the total volume of the nourishment [89] |
| 8.9 | Sustainable tourism | Contributes to coastal tourism and has no negative impact on the degree of tourism and recreation [90] | Confirms the relation between beach size and number of visitors. To parameterize the index for the nourishment, the average extra beach width is multiplied by the length of the nourishment and then standardized over the different cases, divided by the total nourishment volume, and the extra (dry) beach surface area is the result [38] |
| 9.4 | CO2 emission reduction | Considers coastal intervention when CO2 emission is limited by increased resource-use efficiency and adoption of clean, environmentally friendly technologies [91] | With the NBS analysis, CO2 is expressed as kg CO2 equivalent per cubic meter of sand nourishment, calculated through DuboCalc [86] |
| 9.5 | Knowledge and innovation | Contribute by SDG indicator Global Competitiveness Index World Economic Forum [92] | With NBS analysis, it relates the number of scientific articles published on the different nourishments as the total number of times that these peer-reviewed publications in turn are cited in SCOPUS [93] |
| 11.5 | Disaster risk reduction | Contributes to the vulnerability to climate-related extreme events which have effect on the directly affected persons attributed to disasters [94] | Contributes to the vulnerability to climate-related extreme events which have effect on the directly affected persons attributed to disasters [94] |
| 11.6 | Air quality | Link to resilience and sustainably reduces the environmental impacts in consideration of the population exposure to air pollution of PM2, PM10, or 1.4-DB-eq./m3 [95] | The toxic emission profile (kg 1,4-DB equivalent) is calculated with DuboCalc based on fuel consumption), during the whole lifecycle [86] |
| 12.8 | Flood awareness | Hyogo Framework implement the global disaster risk reduction framework [96] | Water awareness expressed as public monitoring program [97] |
| 13.2 | Coastal erosion or accretion | Relate to coastal erosion, indicated as distribution as of sandy shorelines change rate as m/yr average based on Google Earth Engine (GEE) analyses [98] | Sand nourishment erosion change rate is based on MorphAn modeling to calculate the reduced meters of land loss or average erosion rate on location of the nourishment [99] |
| 14.2 | Biodiversity abundance | Considers biodiversity both in short and long term for Marine Protected Areas (MPAs) when does not harm habitats and species based on Ocean Health Index [88] | Effect of the nourishments on the sand source locations have been analyzed based on disrupted sea floor habitat. The designated source locations for sand nourishments are past the depth of −20 m NAP, the value of a m2 seabed on the source locations is set equal for the sand nourishments. As a result, the surface area of the source location is chosen and divided by the total volume of the nourishment as a standardization [100] |
| 16.7 | Institutional capacity | Focus on sustainability when it is implemented, managed, and maintained in a society with a positive and high human and institutional capacity, based on Government Effectiveness Index [101] | Public–private–citizen participation is used and expressed as a tool named the “participation ladder” [102] |
Publisher’s Note: MDPI stays neutral with regard to jurisdictional claims in published maps and institutional affiliations. |
© 2021 by the authors. Licensee MDPI, Basel, Switzerland. This article is an open access article distributed under the terms and conditions of the Creative Commons Attribution (CC BY) license (http://creativecommons.org/licenses/by/4.0/).
Share and Cite
Schipper, C.A.; Dekker, G.G.J.; de Visser, B.; Bolman, B.; Lodder, Q. Characterization of SDGs towards Coastal Management: Sustainability Performance and Cross-Linking Consequences. Sustainability 2021, 13, 1560. https://doi.org/10.3390/su13031560
Schipper CA, Dekker GGJ, de Visser B, Bolman B, Lodder Q. Characterization of SDGs towards Coastal Management: Sustainability Performance and Cross-Linking Consequences. Sustainability. 2021; 13(3):1560. https://doi.org/10.3390/su13031560
Chicago/Turabian StyleSchipper, Cor A., Gerben G.J. Dekker, Beer de Visser, Bas Bolman, and Quirijn Lodder. 2021. "Characterization of SDGs towards Coastal Management: Sustainability Performance and Cross-Linking Consequences" Sustainability 13, no. 3: 1560. https://doi.org/10.3390/su13031560