Innovative Tools for Tourism and Cultural Tourism Impact Assessment


1
Institute of Baltic Studies, Lai 30, 51005 Tartu, Estonia
2
Department of Business Administration, Tallinn University of Technology 5, 19086 Tallinn, Estonia
3
Department of Geography, Institute of Ecology and Earth Sciences, Faculty of Science and Technology, University of Tartu, 51005 Tartu, Estonia
*
Author to whom correspondence should be addressed.
Sustainability 2020, 12(18), 7470; https://doi.org/10.3390/su12187470
Submission received: 13 August 2020
/
Revised: 31 August 2020
/
Accepted: 8 September 2020
/
Published: 10 September 2020
(This article belongs to the Special Issue A European Perspective on Cultural Heritage as a Driver for Sustainable Development and Regional Resilience)
Abstract
:The importance of data and evidence has increased considerably in policy planning, implementation, and evaluation. There is unprecedented availability of open and big data, and there are rapid developments in intelligence gathering and the application of analytical tools. While cultural heritage holds many tangible and intangible values for local communities and society in general, there is a knowledge gap regarding suitable methods and data sources to measure the impacts and develop data-driven policies of cultural tourism. In the tourism sector, rapid developments are particularly taking place around novel uses of mobile positioning data, web scraping, and open application programming interface (API) data, data on sharing, and collaborative economy and passenger data. Based on feedback from 15 European cultural tourism regions, recommendations are developed regarding the use of innovative tools and data sources in tourism management. In terms of potential analytical depth, it is especially advisable to explore the use of mobile positioning data. Yet, there are considerable barriers, especially in terms of privacy protection and ethics, in using such data. User-generated big data from social media, web searches, and website visits constitute another promising data source as it is often publicly available in real time and has low usage barriers. Due to the emergence of new platform-based business models in the travel and tourism sector, special attention should be paid to improving access and usage of data on sharing and collaborative economy.
1. Introduction
Cultural tourism as a sub-sector of tourism has been defined as a “type of tourism activity in which the visitor’s essential motivation is to learn, discover, experience and consume the tangible and intangible cultural attractions/products in a tourism destination” [1]. The size of the cultural tourism market is estimated to account for some 40% of all international tourism arrivals [2], a trend which is expected to further grow in the following years.
Moving away from the original elite customers orientation, cultural tourism has developed towards the mass market, broadening its concept beyond sites and monuments, and towards creativity, lifestyles, traditions, and everyday culture. Several distinct themes have emerged, such as historic and cultural heritage, arts, gastronomy, film and music, as well as tourism based on creative industries [3]. Cultural tourism is also increasingly driven by language tourism and the search for cultural experiences based on the lifestyles and habits of the places visited [4]. This diversification of cultural tourism poses an interesting challenge in terms of defining a ‘cultural tourist’ and measuring the impacts of cultural tourism. Further challenges stem from changing mobility patterns. As people increasingly share their lives between several places and spend extended periods of time outside their country of origin, the roles of ‘locals’ and ‘tourists’ are becoming increasingly blurred [3]. In Barcelona, a concept of ‘temporary citizens’ has been introduced, changing the civic codes and regulation of tourist facilities and “the re-visioning of ‘tourists’ as ‘temporary citizens,’ thereby seeking to shift the tourist from a pure consumer into a prosumer of culture” [5].
As of today, the impact assessment frameworks and the data sources commonly used for measuring the impact of (cultural) tourism are mostly based on surveys [6]. The availability of survey data gathered in regular intervals over a longer period ensures more accurate assessments of the economic impact of tourism. However, consistent survey data is not universally available and conducting surveys can be time consuming and costly. At the same time, open and big data and novel data science approaches are currently transforming the landscape for socio-economic policy and research, considerably shortening the cycle of data collection and offering insights into mobility and tourism consumption patterns that are not easily captured in survey data. Three recent key trends can be highlighted when discussing policy monitoring and evaluation, and the use of data and tools.
First, the importance of evidence has increased considerably in policy planning, implementation, and evaluation. On the one hand, economic, social, and environmental challenges are becoming increasingly complex; on the other hand, governments are facing growing pressure to deliver more quality services for less. Therefore, to address these complexities, it is important that the implementation and delivery of public policies and services are informed by sound evidence and are effectively and efficiently designed. In particular, modern approaches applied include “leveraging new methods, tools and technologies to transform the invisible to visible, allowing governments to see and understand insights, perspectives, opinions and possibilities that have previously remained hidden, allowing them to become more effective and make better decisions” [7] (p. 123). The COVID-19 crisis has particularly highlighted the importance of rapid access to sound evidence in policy design and implementation.
However, some public administration researchers have started to warn that “evidence-based policy may result in a dramatic simplification of the available perceptions, in flawed policy prescriptions” [8] (p. 62). At the same time, responsible use of quantitative data is not generally questioned. Furthermore, no-one is neglecting that “Governments are translating the world into bits and bytes that can be read by machines and fed into algorithms that serve as the basis for a growing number of decisions and services. In so doing, they are re-imagining some of the most fundamental roles of government and building foundations for emerging technologies” [7].
This refers, in our understanding, to the second key trend—the unprecedented increase of the availability of open and big data. For example, Janssen and Kuk identify big and open linked data as a key driver of government innovation [9].
Open data refers to data that is created and provided by a stakeholder, offered with a reusable license, is machine processable, and released without discrimination or cost to the public (see [10] for details). An extensive number of datasets have become available and are accessible over application programming interfaces (APIs) for real-time data. Open data-based services have emerged rapidly both in the private domain (e.g., [11]) as well as in the public domain (e.g., [12]), on national and local levels (e.g., [13]). Characteristic to open data-based developments is the extensive number of stakeholders involved.
Big data refers to another key trend—the emergence of extremely large data sets that may be analyzed computationally to reveal patterns, trends, and associations [14,15,16]. However, processing big data faces considerable challenges regarding search, capture, storage, analysis, and information privacy; thus there is the need to find innovative ways to expose the hidden values from wide datasets that are complex, diverse, and massive in scale [17].
Extensive benefits have been related to big data analytics, including social and economic value [18,19]. Also, official statisticians work increasingly on big data—for an interesting case study on the opportunities and challenges presented by big data for compiling indicators to support Agenda 2030 and measure progress on sustainable development goal (SDG) indicators, see [20]. Researchers are also increasingly looking at the role of big data in policy cycles specifically, concluding in one study that big data “promises faster and better insights, given that correlations can be automatically deduced by the application of machine learning algorithms, data can be observed in its entirety, and analytical results theoretically become available instantaneously” [21] (p. 158). Still, the use of big data for public policy is at an early stage, with expectations far outstripping the current reality [22].
Also, big data is seen as of strategic importance for the European statistical system and concrete steps have been taken since 2013 [23,24,25]. The work of ESSnet Big Data II (2018–2020) is particularly important. It is a project within the European Statistical System (ESS), analyzing the integration of big data in the regular production of official statistics through pilots exploring the potential of selected big data sources, and through building and implementing concrete applications [26].
The third key trend refers to the rapid developments in intelligence and analytical tools, including geographic information system (GIS) tools that are particularly important for tourism assessment. Tourism is a socio-economic activity linked to the space where it takes place and there are many GIS tools used in the tourism sector, both for tourists and managers, for route planning, economic analysis, etc. However, stakeholders are not capable of benefiting from the latest advancements in data analysis that are presented in complex manner with poor visualizations, etc. Another key trend is the inclusion of data science tools, particularly predictive analytics. Artificial intelligence (AI) has been specifically identified as an area of research and technology that can have a significant impact on public policies and services in many ways: “In just a few years, it is expected that the potential will exist to free up nearly one-third of public servants’ time, allowing them to shift from mundane tasks to high-value work. Governments can also use AI to design better policies and make better decisions, improve communication and engagement with citizens and residents, and improve the speed and quality of public services”; at the same time there are extensive challenges to overcome [27] (p. 3).
These recent key trends also influence the governance of tourism. Policymakers and researchers agree that there is a knowledge gap regarding suitable methods and data sources to measure different types of impacts of cultural tourism [28]. Similarly, UNWTO (UN World Tourism Organization) reports that “It is clear that better and more comprehensive data are required to adequately chart tourism and culture synergies and to guide policy and operations. At present, there is little consistency in the measurement of cultural tourism and no agreed definition that can make measurement more consistent” [2]. Or, as stated by academic researchers “The challenge of continuing to develop and refine theories (and applications) of the cultural aspects of the economics of tourism looms large” [4] (p. 104).
This research aims to analyze and contribute to overcoming the aforementioned challenges by identifying the recent trends in policy monitoring and evaluation and discussing how novel data and tools could be used in the fields of cultural tourism impact assessment. The research is undertaken within the on-going research project “Improving Sustainable Development Policies and Practices to Assess, diversify, and foster Cultural Tourism in European regions and areas” (IMPACTOUR) (Figure 1). It is a project funded by the H2020 Framework Program of the European Commission and conducted from January 2020 until December 2022. It engages 12 partners from 10 European countries. The main ambition of the IMPACTOUR project is to create an innovative and easy-to-use methodology and tool to measure and assess the impact of cultural tourism on European economic and social development. The project thereby aims to improve Europe’s cultural tourism policies and practices and strengthen its role as a sustainable driving force in the growth and economic development of European regions. By identifying and comparing quantitative/qualitative information on cultural tourism forms and promotion, and by providing quantifiable evidence of cultural tourism strategies and their effect on European regions’ development and Europeanization, IMPACTOUR will deliver an innovative methodology and tool. The approach combines data analytics algorithms with AI and machine learning strategies and provides stakeholders with strategic guidance so that policies and practices on cultural tourism can be improved [29].
2. Research Methodology
The research started with a literature review. The objective was to identify relevant literature dealing with methods and data sources to measure different types of impacts of cultural tourism, both theoretically as well as empirically. Relevant academic literature was identified using commonly used databases, such as Google Scholar, Scopus, and Web of Science. Of the hundreds of potentially relevant sources identified, the most frequently cited and topical ones were explored further for the identification of key recurring themes.
For the identification of recent key trends regarding policy monitoring and evaluation, the use of data and tools generally and in the fields of tourism and cultural tourism, academic sources were mapped using key terms “+ tourism + “impact assessment” + evaluation + data, “cultural tourism.”” Furthermore, policy-relevant sources were identified using similar terms and websites of key international organizations (such as the European Commission, Eurostat, Organisation for Economic Co-operation and Development (OECD), UNWTO). In-depth content analysis was also carried out regarding the presentations at the OECD’s Global Forum on Tourism Statistics, a biennial forum organized by the OECD and Eurostat.
Empirical feedback was gathered from regional tourism development organizations participating in the IMPACTOUR project. The IMPACTOUR consortium includes, directly or indirectly (as external piloting partners), many regional tourism development organizations. They were approached about their current practices regarding methods and data sources used to measure impacts. Data gathering was carried out and written feedback was gathered on the overall approach, and more specifically, the awareness and (planned) use of mobile positioning data, World Wide Web data, data on sharing/collaborative economy, and passenger data. The use of other novel data and/or tools (e.g., data on credit card payments, ticketing platforms, participants’ registration systems) for assessing the impacts of cultural tourism was also explored.
As input to this article, 15 IMPACTOUR pilots described their data use practices, giving examples of how they use different data sources for assessing the impacts of tourism. They also highlighted the barriers and challenges of using innovative data sources in tourism management. The piloting cases cover ten European countries, including cross-border regions. They vary in size (from small villages to large cultural regions) and by type of cultural tourism (from religious pilgrimage routes and historical architecture to destinations famous for folk culture and modern gastronomy). Due to this variety of contexts, the cases constitute a suitable sample for the purposes of acquiring a first indication of the potential of using novel data tools in cultural tourism management in different contexts. They also provide useful empirical information on the similarities and/or differences of barriers to using these tools in destinations of different profiles and sizes.
3. Key Trends Regarding Data and Tools in Cultural Tourism
Tourism is an information-intensive industry [6], and is largely influenced by the trends discussed in the introductory section. Due to the massive amounts of data available, analytics has become a need to make sense of the information present in the data. The role of data science and big data analytics is becoming increasingly important as organizations are using their information assets to gain a competitive advantage. The flexibility offered through big data analytics empowers functional as well as firm-level performance [30]. Therefore, big data analytics is inherently connected with the growth of tourism design and smart destinations, which is a logical result of the advancements of IT solutions and its extensive adoption in both consumer market and the industry over the last 20 years [31]. Big data analytics has shown that it not only allows better understanding of the consumer market, but also empowers collaboration, open innovation, and value co-creation in the tourism industry. Analysis of big data has demonstrated that it can work as an enabler in the support of strategic decision-making [32].
The increasing reliance of tourism on ICTs (information and communication technologies) and data has been captured in the concept of ‘smart tourism,’ which could be defined as “tourism supported by integrated efforts at a destination to collect and aggregate/harness data derived from physical infrastructure, social connections, government/organizational sources, and human bodies/minds in combination with the use of advanced technologies to transform that data into on-site experiences and business value-propositions with a clear focus on efficiency, sustainability and experience enrichment“ [33] (p. 181). A central component of smart tourism is smart destinations, i.e., tourism destinations which integrate ICTs into the physical tourism infrastructure. Destinations have done this, for example, by using Internet of Things (IoT) sensors to measure and manage the movement of people, providing tourists with location-based information via smartphone apps, collecting real-time public transportation location information and sharing this live on information displays in bus stops, and so on [33]. Although the focus of the smart tourism concept is on enhancing travelers’ experiences, the data that is generated because of smart tourism applications can also support tourism planning and governance. An important part of the smart tourism concept is that it regards tourists as co-creators of valuable data, e.g., by uploading hash-tagged photos of tourism destinations on social media, crowd mapping points of interest, generating data through the sensors in their wearables, etc.
The current “International recommendations for tourism statistics” [34] and Eurostat’s “Methodological manual for tourism statistics” [35] focus mainly on surveys as a data source, but there is a shift ongoing in statistical offices “from being pure data collectors to becoming data connectors, assessing the relevance and methodological quality of a varied range of input sources and piecing together the puzzle to obtain a powerful information system” [24] (p. 17). ESSnet Big Data particularly focuses on innovative tourism statistics and aims to develop a conceptual framework and pilot with a tourism information system to support statistical production in the field of tourism by integrating various big data sources with administrative registers and statistical databases using innovative statistical methods [36].
Three stages are expected to emerge:
Short term: Next to traditional surveys (household surveys, business surveys for the accommodation sector) that will remain the main input for primary tourism statistics, big data sources will slowly become important sources of auxiliary information.
Medium term: The influence of surveys is likely to decrease in favor of big data.
Long term: The role of surveys will diminish even further, and the role of big data will keep increasing, bringing “a revolutionary temporal and geographical granularity” [24].
In analyzing the use of big data for tourism statistics—specifically, the tourism sustainability aspects—Guilarte and Quintáns [37] emphasize the benefits of the immense volume of information, the real-time synchronization of big data sources, and granularity. Other benefits include the introduction of new indicators (e.g., those related to informal accommodation systems such as Airbnb, Homestay, HomeExchange). “In addition, the combination of big data and computational knowledge allows the creation of intelligence tourism information systems to generate meaningful information and predictive insights” [37] (p. 14) and potentially support sustainable growth (e.g., the use of applications on climate change, to raise awareness). Xu and colleagues conclude similarly: “Big data approaches represent exciting opportunities for sustainable tourism studies, in which the sheer scale of data and analytic potential opens up new ways of understanding tourism-relevant behavior” [38] (p. 158).
Several key challenges are also identified (Table 1) relating to stakeholder collaboration, access/continuity/complexity of data, and to potential quality issues [37]. Demunter [24] emphasizes the ‘closed’ nature of some potential data sources due to being held by private companies, as well as potential problems with the alignment of concepts and definitions. Issues around the objectivity, independence, and trust by the users can arise towards such an innovative approach. Furthermore, big data presents major and heterogeneous ethical challenges, due to autonomous data collection, independent of human activity, potential abuses of informational reuse, unauthorized access, and overall lack of awareness and transparency among the population of how ethics of research is maintained [39,40,41,42,43].
The potential of open data is also becoming increasingly important in the context of tourism. So far, open data seems to be regarded mostly as a means of enhancing tourist experiences; for example, providing visitors with map applications that they can use in their smartphones, thereby sharing location-based information on nearest tourist attractions, accommodation facilities, etc., or displaying real-time public transportation information at bus stops. However, open data is also becoming a tool for tourism monitoring and planning, although the possibilities in this area have been under-studied so far [44]. Pesonen and Lampi [44] state that in several countries and regions, data on tourist expenditure, hotels, accommodation, restaurants, events, public transportation, heritage sites, beaches, travel camps, tourism service providers, etc., is already available as open data. However, they note that part of the relevant data is held by private tourism businesses, who tend to provide less open data than governments. They point out the role of destination management organizations in collecting and opening data from their regions for tourism innovation purposes.
The increasing use of APIs in recent years has been a major driver of the provision and use of open data. According to Longhi and colleagues, the launch of the Google Maps API in 2015 has “given rise to a lot of applications and mashups, that is, applications that use and combine data from different sources to create new services” and “a lot of applications have consisted in positioning public data on Google maps“ [45]. In a similar vein, OpenStreetMap is considered a powerful incentive for municipalities and companies to open their data [45].
Since a large part of tourism-relevant open data concerns geospatial information, studies have also discussed the possibilities for linking open data from different sources to assist tourism planning. For example, a study by Kršak and colleagues [46] explored the competitiveness of former mining sites as potential tourism points of interest (POIs) by linking mining heritage locations to location-based data on existing tourism services (e.g., distance from lodging, food services, public transportation, parking, and other tourism POIs). As an important data source, they relied on the EU-funded SDI4Apps portal, which involves a repository of linked open geospatial data on over 27,000,000 POIs along with an open API and applications for users. Among other sources, the portal relies on widely used data resources such as OpenStreetMap and GeoNames.org.
Bluetooth and WiFI data are also utilized in tourism research. Bluetooth data is mainly used to monitor visitor movement at events or festivals. It can be used for indoor settings, where Global Positioning System (GPS) or mobile phones might not work due to weakened signal strength. For example, Versichele and colleagues [47] used Bluetooth tracking data in Ghent, Belgium to explore tourist flow patterns. Compared with Bluetooth, WiFi data is more convenient and cost-effective [48]. To date, few tourism studies have used WiFi data. Bonne and colleagues [48] suggested a method of scanning at multiple locations for packets sent out by the WiFi interface on visitors’ smartphones, and correlating the data captured at these different locations in the context of a music festival. With increasing provision of WiFi services within destinations, in future WiFi data will become broader in coverage and more convenient to access.
Overall, emerging tools for cultural tourism impact assessment seem to be centered around four key domains: (1) Mobile positioning data, (2) World Wide Web data, (3) data on sharing and collaborative economy, and (4) passenger data. Developments around these fields are discussed most often at the OECD’s Global Forum on Tourism Statistics, a biennial forum organized by the OECD and Eurostat. Its latest forum in 2018 had dedicated sessions on mobile positioning data and on ‘measuring the activities and the impact of the collaborative economy’ [49]. In 2014 there was also focus on ‘mobile phone data for tourism statistics’ and on the use of traffic control cameras and web data [50].
The UN’s Big Data Project Inventory [51]—a catalogue of big data projects that are relevant for official statistics, SDG indicators, and other statistics needed for decision-making on public policies, as well as for management and monitoring of public sector programs/projects—highlights 10 projects in the fields of tourism statistics. Of those 10 projects, seven are related to mobile phone data, one is related to road sensor data, one to exploring the potential of flight reservation systems data for official statistics, and one to exploring Wikipedia page view counts as a source for official statistics. Thus, in the following section a closer look is taken at key emerging new tools for tourism statistics, especially for assessing the impacts of cultural tourism.
4. Emerging Tools for Cultural Tourism Impact Assessment
4.1. Mobile Positioning Data
4.1.1. Introduction to Mobile Big Data
Rapid advances in ICTs in recent decades have opened several new possibilities for collecting data about tourists and their behavior, movement, and preferences, thereby allowing the evaluation of the impact of tourism to specific destinations. One example of this is the widespread distribution of mobile phones. In 2019, 67% of the world’s population owned a mobile phone and 65% of all those connections were smartphones [52]. In Europe, North America, and China, which constitute the majority of the world’s tourism international arrivals and receipts, the subscriber penetration rates were 86%, 83%, and 82%, respectively [52]. In other words, a vast majority of people are regularly carrying the phones with them everywhere they go, thus giving an opportunity to collect detailed information about the movements and behavior of tourists and to use that information to assess the impact of tourism on destinations.
Mobile phones, and especially smartphones, include several sensors such as GPS, Bluetooth, Wi-Fi, camera, etc., that can be used to collect various information. However, studies using data gathered via the aforementioned sensors are usually limited in time and space (for example, covering few days or fixed geographical areas such as old town, or national park), or include only small samples (e.g., people who are willing to download specific applications to record their movement or ask about their preferences). The essence of mobile phones, however, lies in using the cellular network technology (e.g., 2G, 3G, 4G) that enable communication within the mobile network. Mobile network operators (MNO) automatically collect, for network management purposes, the data that is created when using mobile phones for calling, sending messages, or using Internet. Such data includes the time and location of all call events done on the network cell level. This kind of data is referred to as mobile positioning data (MPD), which means any type of mobile phone event data that includes a subscriber identifier, time attribute, and location [53].
MPD can be obtained via “active” or “passive” means. Active positioning implies the tracking of mobile phones using special queries with permission from the phone user; this is seldom used due to privacy concerns and typically involves relatively small samples [54]. To note, sometimes tracking via an installed application on smartphones (e.g., applications that use GPS data) can be referred to as active positioning. The majority of mobile phone tracking studies which have used cellular network data in tourism research have used the alternative, passive MPD [55]. Passive MPD consist of the location coordinates of mobile phones in a cellular network, which are collected and stored automatically by the mobile network operator for the purposes of customer billing, network maintenance, and performance monitoring [54,56].
Because passive MPD is collected automatically from everyone using a mobile phone, it is possible to detect various mobility types, from everyday commuters to people making a holiday trip once a year. Thus, MPD is a valuable source to analyze the entire extent of human mobility in three dimensions: Time, space, and frequency of trips. Thus, MPD can be used to describe different forms of temporary mobility, including tourism. Passive MPD can be used to measure the volume (arrivals and departures) of tourists and to analyze tourist- and trip-related characteristics (country of origin, time, length, and spatial extent of visits) in all three forms of tourism: Domestic, inbound, and outbound over longer periods covering vast geographical areas.
In the following sub-sections, the use cases of MPD in tourism studies, the evaluation of how MPD can be used in the assessment of cultural tourism impacts, and the advantages and disadvantages of MPD are described. Several parts of the overview originate from a PhD thesis ‘Mobile positioning data for tourism destination studies and statistics,’ defended at the University of Tartu, Estonia [57].
4.1.2. Using Passive Mobile Positioning Data in Tourism Studies
The first studies to use cellular network-based data from mobile phones in tourism studies can be dated back to the 2000s. They mostly show the potential of the data for use in studies on travel behavior [58], the planning and administration of public life [59], and urban analysis [60]. However, since 2007, location data from mobile phones have been actively used in tourism studies as well [54,56], but the majority of studies using mobile positioning data are still focused on the methodological questions and the use of data in human mobility, transportation, and urban analysis research. The main reasons behind it are difficulties in data access, the lack of analytical knowledge, and computation power among tourism researchers to cope with the vast amount of data that is produced in mobile networks.
After testing the feasibility of passive MPD and its analysis methods in tourism research in the early 2000s, several studies have been made. MPD has been used, for example, to analyze domestic tourists’ seasonal moves to second homes in Estonia [61] and to identify and construct spatial patterns for domestic tourist flows between 32 cities in France [62]. Inbound and outbound tourism trips can be identified thanks to roaming contracts between MNOs, which allow the use of mobile phones in countries other than those in which they are registered. In the case of inbound tourism, MPD have been used to analyze seasonality in foreign tourists’ space consumption [56], segment repeat visitors [63], measure destination loyalty [64], evaluate travel distances of events visitors and regular visitors [65], identify tourist destinations based on visitor flows [66], find generalized movement patterns of tourists [67], and identify destination functions [68]. There have been fewer studies of outbound tourism, given the fact that the spatial accuracy of MPD for outbound trips is often not disaggregated further than the country visited. However, outbound trips have been used to compare ethnic [69] and generational differences in those who travel abroad [70].
The uniqueness of mobile positioning lies in the fact that it is the only new digital data source used in tourism research that has vast potential of being used in official national tourism statistics and has been already used for that reason. So far, two countries in the world use MPD to produce national tourism statistics: Estonia [71] and Indonesia [72]. Regardless of the potential of using MPD in tourism statistics, only a few wide-ranging examples are available, although the number is growing. In Estonia, the database of call detail records covers the entire country and one full economic cycle (inbound data have been collected since 2004 and outbound data since 2008), and tourism statistics have been published since 2008 [54]. Regardless of the longitudinal coverage and success so far in Estonia, there have been some problems in the data access lately. That is mainly due to the vagueness in the legislation and the MNO’s fear of acting against the law, which may result in monetary penalties. In Indonesia, mobile signaling data combined with cross-border surveys have been used since 2016 [72]. In addition, there have been some small-scale pilot studies, for example, in France [73] and Finland [74] and other countries, the results of which have mainly been presented at international conferences.
The potential of using MPD in tourism statistics has also been noted at the European and international level. In 2012, Eurostat initiated a study on the use of MPD in tourism statistics, resulting in a comprehensive report ‘Feasibility Study on the Use of Mobile Positioning Data for Tourism Statistics’ [75]. Furthermore, the United Nations has a Global Working Group on Big Data for Official Statistics, which has been working on the creation of a ‘Handbook on the use of Mobile Phone data for Official Statistics’ [53]. Both documents describe the essence of data and outline the major advantages and disadvantages of MPD. However, those organizations can function only as moderators in the process of implementing the use of mobile positioning data in tourism statistics. For example, Eurostat is promoting the use of big data in statistics and could therefore lead the development of the methodology, concepts, and definitions on tourism statistical indicators compiled from mobile positioning data. This methodology can be applied in countries where mobile positioning data can be used for producing statistics, albeit the regulatory limitations vary across EU countries.
4.1.3. Using Mobile Positioning Data to Evaluate the Impact of Cultural Tourism
One of the most important indicators derived from MPD that can be used in the assessment of cultural tourism impact on destinations is the number of tourists that specific destinations are welcoming on a daily basis. MPD also enables one to capture same-day visitors who do not stay overnight at the destination. In addition, MPD includes information about tourists who are not staying at official accommodation establishments, such as people staying with their friends or family or people using Airbnb rentals that are quite often not included in the official accommodation statistics. Therefore, the real number of tourists that destinations are receiving every day may be much greater according to MPD than expected compared to traditional data sets such as surveys or accommodation data. Thus, MPD has the potential to capture the effects of tourism more accurately, including economic, social, and environmental impacts.
The use of MPD in tourism analysis also allows one to monitor these changes in tourism arrivals with good temporal and spatial detail. Thus, it is possible to analyze the daily, weekly, and seasonal rhythm of visitors. Monitoring the daily rhythm of visitors is important, for example, in cities welcoming big cruise ships or which have a large share of same-day visitors, such as Dubrovnik, Venice, Tallinn, and others, where the old towns might get crowded in some hours of the day. Thousands of visitors rushing through the tiny streets of medieval old towns can cause congestion and ruin the tourism experience for those visitors, who are hoping to perceive the uniqueness of the places that are now shadowed by the crowds. This over-crowding also has an impact on the everyday life of local people, who tend to avoid the touristic places and choose other trajectories for getting around and spend time in different places. However, detailed temporal data are a valuable source for better destination management, so that the pressure on certain places on certain times can be alleviated.
In addition to daily rhythms, detailed MPD is useful when planning future tourism activities (e.g., opening times of tourist attractions) on a weekly manner and possibly further times dealing with one of the most important problems many destinations worldwide are facing—the seasonality of tourism. As MPD can be collected longitudinally it is possible to follow the changes in tourism arrivals over longer periods, such as months and years. This allows for the identification of the high and low season, and the shoulder season in between. Even though in most cases the cultural tourism products can be consumed all year round, the visitor numbers still indicate uneven distribution of tourist arrivals throughout the year. For example, Rome or Paris, that have plenty of activities for cultural tourists all year round, still have high and low seasons. One of the most well-known solutions to shorten the low season is to organize big tourism events in the shoulder season. These may be concerts, exhibitions, fairs, and other similar large events that attract local people as well as foreign visitors, which can potentially have a wider impact on the regional economy. Here again MPD is valuable as it is possible to evaluate the hinterland of the events, by analyzing the origin of visitors, which places they are coming from, how long they are staying, and which other places they visit [65,76].
Furthermore, the duration of stay can be used as a proxy to assess the extent of tourism impacts. Short-term visitors usually focus on the famous landmarks, such as the Eiffel Tower and Louvre in Paris, whereas tourists staying for longer will have time to discover other hidden gems in and around Paris, thereby distributing the tourism revenues more evenly throughout the country. Tourists who make longer visits to destinations are more likely to be repeat visitors. This is again one aspect that can be analyzed using longitudinal MPD. As each phone in the data set has its own unique ID, it is possible to analyze the reoccurring IDs in the database throughout the years and identify all the visits a person has made during the data period.
Therefore, besides the temporal scale, the tourism statistics gained from MPD can be used to analyze the spatial extent of the visits. MPD enables one to identify the whole visitation pattern within a country based on the call activities done during the trip. It is possible to see which places are visited by tourists, which places are visited together on one trip, and which areas do not receive so many visitors. Thus, it is possible to analyze the carrying capacity of destination areas. In places where the number of tourists is already causing negative impacts, the focus should be on alleviating pressure on the core areas, and market instead those places that are already on the way of tourists but not visited as often. In addition, some areas might receive less attention just because of absent or inconvenient transportation connections.
The impact of tourism also varies among different visitor types. The use of MPD enables one to distinguish between tourists from different countries of origin. The country of origin is derived from the phone’s SIM card registration. Thus, the temporal and spatial indicators can be analyzed among different visitor segments, in the case of MPD, by countries of origin. Tourists from different countries have different spatial visitation patterns. Long-haul travelers tend to visit more tourism hot-spot areas, whereas visitors from neighboring countries tend to behave more like domestic tourists and visit smaller, and not so well-known attractions. Visitors from neighboring countries are also less influenced by season and visit destinations all year round, while visitors from more distant countries tend to be more high season oriented [66].
Hence, using MPD in tourism studies helps answer the questions: When, where, who, and how many tourists are visiting destinations. For impact assessment analysis, it would also be good to know what kinds of tourism activities the visitors are carrying out. Unfortunately, MPD cannot give direct answers here, because of the lack of qualitative information such as trip purpose or preferences. However, indirectly, it is possible to categorize the visitor types by their spatiotemporal behavior and assume some meaning from there. For example, same-day visitors from Finland to Estonia who spend time only in the city center of Tallinn, can be culture lovers or shopping tourists, whereas tourists from Germany staying for a week and having overnights in different rural areas in Estonia might be interested in nature, camping, or old manors. For analyzing the question of what the tourists are doing at destinations, other new digital data sets can be used, for example, analyzing the photos uploaded to photo sharing websites or social media.
Therefore, MPD can be used to quantitatively measure the number of tourists at destinations on different timeframes and spatial scales. This is essential for calculating the carrying capacity of a place. As the data has good consistency and detail, it is possible to differentiate the carrying capacity value for different times and rearrange the tourism flows to other less visited areas instead. Targeted marketing campaigns can be created for differentiating tourism markets by considering the existing knowledge based on the MPD analysis. For other tourism impacts, such as economic, social-cultural, and environmental, additional data sets are needed. However, new digital data sets can be of help here. For example, tourism expenditure information could be derived from transaction data, or the number of cars driving through or parking near tourism attractions can be counted from traffic control cameras.
4.1.4. Advantages and Disadvantages of Using Mobile Positioning Data in Tourism Studies
As described in the previous sub-section, MPD cannot answer all the questions tourism planners, managers, or researchers might have. The main limitations of MPD are the differences in phone use, lack of qualitative information and difficulties in access to data. The latter has so far been the biggest obstacle in the use of MPD when it comes to producing official statistics or carrying out scientific research. Problems in access arise from international or national regulatory limitations and legislation. MNOs are unwilling to provide data due to the necessity for maintaining business confidentiality, or due to privacy protection and ethical concerns, fear of being tracked, and a general disapproval by society of such methods. Despite this, there are two countries in the world where MPD is an official source for tourism statistics—Estonia [71] and Indonesia [72]. In both countries the spin-off company of University of Tartu, Estonia, Positium, has helped to build up the methodological workflow to use MPD for producing national tourism statistics. In addition, there are several countries in which pilot studies for producing statistics have been conducted [53], and even more scientific articles where MPD have been used for tourism studies [55]. However, as access is restricted there is no unified methodology available and no cross-domain analysis, and therefore, the reproducibility and overall transparency of the research is somewhat limited.
Problems arise also from the phone use patterns. Specifically, the more often a phone is used the more data is produced and the more accurate the results derived from MPD are. The use of mobile phones depends on various factors such as roaming prices, personality traits, and socio-demographic and -economic characteristics (e.g., gender, age, income) [75]. For example, the higher the roaming costs or the longer the stay, the more likely tourists are to switch to local SIM cards, which will lead to underrepresentation of foreign tourists in MPD. Differences in mobile phone use in turn may cause several under and over coverage issues in the overall number of nights spent and in the spatiotemporal coverage of the visits. For example, the share of same-day visits may be overestimated and the number of visited places may be underestimated. Another major shortcoming of MPD is the lack of qualitative information, such as trip purpose, type of accommodation, means of transport, expenditure, activities carried out, tourist preferences and satisfaction, etc. This kind of information is especially important for getting a complete picture about the possible effects of tourism on the destination. This information can be collected by conducting additional surveys among visitors and residents.
Despite the limitations described, MPD has many advantages over traditional data sets used in tourism research and statistics. One of the biggest is the ability to evaluate mobility indicators for a much larger sample, both automatically and cost-effectively. In the case of Estonia, the MNO market is quite evenly shared between three operators, so using data from one MNO represents roughly one third of people living in Estonia and this can be generalized across the entire population. Thus, compared to traditional surveys, the cost and burden of data collection does not depend on the number of observations or people in the sample. Surveys, on the other hand, entail high costs just because of that, thus, the samples are relatively small and that in turn may lead to possible bias in the results [75]. Another major advantage is that MPD has good consistency and resolution of data in time and space which helps distinguish between various mobility types based on people’s longitudinal spatiotemporal behavior [77]. Good consistency and resolution over time means that MPD can be collected almost in real-time and for longer periods. Thus, the timeliness of MPD helps to grasp increasing tourist numbers and provide quick indicators in near real-time; however, the faster the process the higher the costs for maintenance, software, and hardware. Good consistency and resolution over time enables one to follow tourists throughout their visits. This is not possible with accommodation or border statistics, where tourists are registered at discrete locations that may result in the double counting effect. Double counting in accommodation refers to a situation in which one tourist stays at different hotels during one trip and is therefore counted several times. Other traditional methods such as surveys or trip diaries are mostly retrospective, and the quality depends on the memory of the tourists.
However, MPD does not substitute traditional data sets, but rather complements them. For more widespread use of MPD in tourism statistics three key aspects need to be improved: Develop better regulation and legislation to access the data; find additional baseline data to compare the results derived from MPD; and create unified and transparent methodology for extracting indicators generated from MPD [77]. Currently, the General Data Protection Regulation (GDPR) [78] in the European Union does not regulate the use of MPD in scientific research, and the regulation follows every country’s national legislation, thus the rules for the use of MPD vary by country. As the conditions vary, it is also difficult to create a unified transparent system for the use of MPD in national statistical systems. Regardless, it is important to note that MPD is also useful for producing other kinds of statistics beside tourism, such as population, migration, commuting, traffic flow, and employment statistics. However, the quality of the statistics produced from MPD is dependent on the baseline data it is compared to, and here again challenges arise, as traditional sources also entail problems. In addition, several stakeholders are looking for even more detailed data in time and space on attraction level that would mean to take into use different MPD sets. These developments have to be in line with privacy conditions that are set out by the GDPR and national legislation. Compared to other digital big data sets, the advantages of MPD are, again, their large sample and good contingency over space and time, while difficulties in access consist of the only major disadvantage.
Despite the difficulties and the need for future improvements, the preceding studies which have used MPD-based statistics in tourism destination analysis, have shown the vast potential of the data and its ability to describe tourism activities in unprecedented detail and volume that is not possible with other data sets. Compared with traditional accommodation, border, and visitor statistics, and survey data from questionnaires or trip diaries, MPD enables the study of tourism and its impacts more precisely and effectively because the spatial and temporal accuracy of the data is better, the tracking periods are longer, the tracking can follow tourists throughout their visit, and digital data collection and processing is easy and less time consuming. Good coverage of the data enables one to provide detailed guidance when it comes to dealing with the impacts of tourism or making tourism planning, marketing, and management related decisions.
Nevertheless, there is still room for progress, as the use of MPD in national statistics and research is currently possible in a limited number of countries in the world. Partnership models are needed for cooperation between different interested stakeholders such as the data providers (MNOs), public authorities interested in the statistics (e.g., tourism and ICT ministries), and national statistical offices. There is no one-size-fits-all partnership model, as the national legislation and interests vary among countries. However, the most successful projects using MPD for producing tourism statistics so far have used the model in which the data remains at the MNO’s premises but is fully accessible by third-party government-assigned data scientists either physically or through secure remote connections. The results from the example countries (Estonia and Indonesia) confirm the usefulness of MPD in tourism analysis and pave the way for further developments in this field.
4.2. World Wide Web Data
Online big data sources have surfaced in recent years as a source with a lot of promise for tourism research and evaluation. Whereas satellite imagery or mobile phone data are relatively well-defined as data sources, big data generated from Internet users’ online activities constitute more of a mixed basket, including data from various social media sites, online searches, website traffic, online booking and review sites, and so on. A general common denominator of such data is that they are disseminated throughout the Internet. Further, most data collected comes from text messages, images, video, or searches voluntarily submitted by persons. Against this background, the following section explores which kind of online data could be collected, analyzed, and processed into (statistical) information that will be useful for tourism governance purposes.
4.2.1. Social Media Data
Over the past decade, geotagged data from social networks like Twitter, Foursquare, Flickr, or Instagram have emerged as a major data source on the movement of people. Travel patterns can be especially well mined from people’s voluntary uploads of photos with time and geo-references [79]. According to Chua and colleagues [80], tourism studies have utilized this new data source for estimating the number of inbound tourists [81] and to measure tourist activities at specific urban [82] and nature-based attractions [83,84]. A major benefit—and a potential privacy concern—of this data is that it allows to profile travelers in terms of their country of residence, interests, other tourist attractions visited, etc.
Previous studies have successfully used data from Flickr photographs to quantify visits to tourist sites. For example, Wood and colleagues [84] found that crowdsourced information from geotagged Flickr photographs corresponded well to empirical information about people’s mobility. While not all visitors share geotagged photographs online, a reliable statistical relationship was found between the number of people counted and the Flickr-generated estimate of user-days. Compared to data recorded at immigration entry points, Flickr data also served as a good indicator of the travelers’ country of origin. Although focused on nature-based tourist attractions, the same model can be used to generate visitor statistics about cultural tourism, which would reduce the need for conducting time- and labor-intensive visitor surveys [84].
Time series data on Flickr photos have also been used to predict tourism demand for different demographic groups and extract trend and seasonal patterns for forecasting demand [32]. Moreover, the analysis of textual metadata and image recognition techniques on Flickr photos can identify potential tourist interests, which can be related to popular locations for the identified interests using geographic data clustering [32]. This can give destination management organizations valuable information on which activities tourists take interest in and engage in when visiting different sites, allowing them to adapt their marketing strategies accordingly. Public photo sites such as Flickr may also allow building heat maps of photos that have been taken in specific geographic areas. One might assume that the ‘photo density’ in each time period would be a rough indication of the number of visitors that found a site or event significant enough for collecting memories.
In addition to photo-based social media networks, the use of geotagged data from microblogging services, such as Twitter, also constitute a potentially valuable source of data for tourism assessment. The advantage of Twitter messages is that they contain photo attachments and spatial coordinates, but also textual information, hashtags and social links expressed through likes and retweets [85]. Twitter messages have been used, for example, to assess users’ mobility patterns on a regional and global scale, uncover trip purposes, and analyze users’ engagement with specific sites within a tourism destination. Brandt and colleagues [85] analyzed the location data, text, and attached pictures and videos of more than 600,000 geo-tagged Twitter messages in the city of San Francisco and found that Twitter analytics can be used to assess spatiotemporal fluctuations in mobility across a selected region, identify popular times for visiting certain sites, and identify appealing emerging destinations. The analysis of pictures and videos attached to tweets can be used to plan potential attractions that could be offered to tourists by assessing users’ engagement with their environment. Further, textual analysis enables the assessment of the topical engagement of tourism regarding certain events—including how festivals and sports events lead to crowding in specific areas and how the crowds disperse after the event [85].
4.2.2. Web Traffic and Search Data
Tourists increasingly rely on online sources when planning their trip. A key tool used for this purpose is online search engines such as Google, Yahoo, or Baidu [38]. The big data generated from millions of web searches is thus now increasingly used to measure and forecast tourism arrivals [86,87]. The World Economic Forum’s Travel and Tourism Competitiveness Index includes the new indicator of ‘digital demand’ for culture and entertainment, which infers tourists’ level of interest in a country’s cultural resources based on the number of related online searches. The indicator is calculated based on analyzing global online search data using destination-specific keywords in nine languages and relating them to specific brand tags such as Historical Sites, Museums, Performing Arts, Local Gastronomy, etc.
In addition to search engines, website traffic can also be used for forecasting tourist demand. Previous studies have used website traffic data on Google Analytics for predicting tourism arrivals [88] and Google Trends to predict numbers of visitors to specific tourist attractions such as museums [89]. Similarly, the potential of big data from Wikipedia page views is being actively explored as a source of data on tourism flows. In 2017, Eurostat launched a specific project for this purpose [24]. In 2016, Signorelli and colleagues [90] analyzed monthly Wikipedia page views of all articles with geo-coordinates that relate to the cities of Barcelona, Vienna, and Bruges. Page view statistics from 2012–2015 of relevant pages in 31 languages were combined with the cities’ official tourism data on tourists’ monthly arrivals and overnight stays by country of origin. Based on the number of Wikipedia page views (retrieved from Wikidata), they were able to build interactive maps visualizing the popularity of different points of interest (POI) in each city. They then classified the topics of all articles into categories such as public transport, buildings, museums, culture, and art. This enabled building a ranking of the categories based on their popularity on Wikipedia. Finally, the authors compared the official statistics on tourism flows to the cities to the number of Wikipedia page views and found a positive correlation between the monthly number of tourists arriving to Barcelona and the number of page views concerning parks in Barcelona. Similar positive relations between actual tourism flows and online demand were found for Wikipedia visits related to the buildings category in Bruges, and places of worship, mountains, and cemeteries in Vienna. The authors concluded that more work was needed in building predictive models of tourism flows based on Wikipedia data but considered this a promising avenue [90].
4.2.3. Online Travel Reviews
A tremendous growth in online travel reviews (OTR) can be observed in the field of tourism and hospitality [91]. One of the ways in which the vast amount of user-generated data from OTRs have been used is to study the image of tourism destinations. Marine-Roig and Clavé [91] studied the online social media-transmitted image of Barcelona by conducting a qualitative and quantitative content analysis of more than 100,000 travel blog posts and OTRs written in English by tourists who had visited the city in the last 10 years. Several sites, most prominently Tripadvisor, TravelBlog.org, VirtualTourist.com, TravelPod.com, and VirtualTourist.com, were included in the sample. The authors analyzed the frequency of keywords that visitors used to describe the city, being able to observe both the cognitive and affective components of the destination image, and segment keyword frequency according to specific territorial brands (e.g., Barcelona City and Barcelona Coast). The analysis was also able to reveal recurring problems regarding specific attractions (e.g., long queues at the basilica of La Sagrada Familia) and discrepancies between the city’s branding and marketing efforts and visitors’ perceptions—for example, Barcelona’s promoted image of a ’smart city’ was not mentioned by visitors at all. In the future, such insights could assist both the management of tourism assets and help target destination marketing efforts [91].
A study by Tilly and colleagues [92] also provides evidence supporting the use of online travel reviews as a source of macro-level information on the spatio-temporal distribution of tourism that could replace traditional survey-based data sources. Assessing the quality, completeness, and timeliness of user-generated data from OTRs, they found that information quality had greatly increased over the years. The data was also available earlier compared to official statistical sources (e.g., UNWTO), while being highly correlated to the UNWTO statistics.
4.2.4. Opportunities and Limitations
Web and social media analytics are especially promising avenues for new ways of online marketing and sales. Some of the larger hotel chains, such as Starwood Hotels and Resorts have already started to utilize big data and advanced analytics for dynamic pricing and revenue optimization. Starwood combines data about weather, economic factors, and local events to extract insights that help them decide when to launch promotions or how to price offerings.
From a cultural tourism perspective, user-generated data and content serve as a promising source both for collecting macro-level mobility statistics regarding visits to tourism destinations, and for understanding (and potentially predicting) mobility patterns related to specific cultural attractions and events. Furthermore, textual data posted by visitors as Twitter messages or comments to photos shared on platforms such as Flickr help analyze people’s sentiment and engagement with specific POIs, revealing visitors’ interests and helping to understand what activities visitors actually engage with at different sites. This information may be useful for developing management and marketing strategies around existing cultural tourism attractions but could also reveal visitors’ emerging interests in new sites and activities before official statistics are able to grasp the trends.
The main advantage of web traffic and social media data is that the data is shared voluntarily and is usually freely accessible online without legal restrictions on reuse. They often become available in real time and can be processed at a relatively low cost. However, although some social media services (e.g., Twitter) provide access to data via APIs, the data is not always readily available in aggregated, open, and machine-processable datasets. Processing the data thus often involves manual work related to collecting, storing, cleaning, and analyzing the data.
Moreover, some methodological limitations should be noted. For example, when extracting information from Twitter messages, analysts should consider the possible lag between the time when visitors conduct specific activities and the time they tweet about the activities [93]. Further, the use of social media data has been associated with validity problems such as platform biases (stemming from the specifics of platform design, user base and platform-specific behavior), data availability biases, data authenticity issues, and sampling biases [94]. Possible sampling biases which emerge from relying on a single platform as a data source could be mitigated by triangulating between different methods and data sources [94]. However, it is also important to keep in mind that users of social media services are not entirely representative of the overall population, slightly over-representing the younger and better educated segments of the population [95].
4.3. Data on Sharing and Collaborative Economy
One of the recent trends that greatly impacts tourism, and cultural tourism more specifically, is related to the rapid growth of the sharing and collaborative economy. Some authors make a distinction between these two terms, stating that sharing refers to predominantly private, and often non-commercial transactions, while the collaborative economy is focused on mediating commercial business-to-peer exchanges, virtually always involving platforms owned by global corporations [96]. In general, however, these terms are used interchangeably [97] and refer to “business models where activities are facilitated by collaborative platforms that create an open marketplace for the temporary usage of goods or services often provided by private individuals” either for profit or not-for-profit [98].
The collaborative economy involves three categories of actors:
- Service providers who share assets, resources, time, and/or skills—these can be private individuals offering services on an occasional basis or service providers acting in their professional capacity; users of these;
- Intermediaries that connect—via an online platform—providers with users and that facilitate transactions between them [98].
Collaborative economy is identified as one of the key disruptive innovations in the tourism sector [99,100,101]. The growth has been most notable in transportation and accommodation [102] and continues further. For example, the projected annual growth rate for the global peer-to-peer accommodation economy is estimated at 31% between 2013 and 2025, six times the growth rate of traditional bed-and-breakfasts (B&Bs) and hostels, and 23% for car sharing [103]. For various reasons, access to detailed comprehensive data covering all goods is limited and more nuanced understandings of the collaborative economy and its relationship with tourism remains challenging [97]. Collaborative economy is also seen as a potentially significant contributor to the SDGs [104,105]. At the same time, critical questions are raised about whether the collaborative economy is really in the broader public interest and on its regulation (e.g., [106,107,108]).
It was concluded in [6] that impact assessment frameworks have been developed to measure, next to monetary transactions, also non-monetary transactions related to tourism consumption. However, the measurement of non-monetary transactions is more complicated as it requires the use of data sources beyond the data typically collected from visitors, e.g., the estimation of rents from vacation homes. Given the recent emergence of new platform-type travel and tourism services, assessing the effects the related monetary and non-monetary transactions has become more important. For example, AirBnB/Booking.com for accommodation reservations may allow for mapping of accommodation facilities at detailed regional/city/village levels. Furthermore, such data may prove a useful data source on occupancy rates of facilities, average price per night, etc. The average price per night and client rating may also allow the customer to derive further information on the quality of facilities, etc.
Even if these collaborative platforms do not allow easy access to their data, access is sometimes facilitated by third parties. That is the case of AirBnB—although they launched an official application programming interface (API) in 2017, it is not open as interested parties must apply for access, and it appears to be focused on property owners. Instead, data can be accessed through applications such as AirDNA. The company gathers its information from AirBnB, HomeAway, and VRBO public website using data scraping methods and they track the daily performance of over 10 million listings in 80,000 markets globally [109]. A growing number of consulting studies, peer-reviewed manuscripts, and policy analyses rely on AirDNA data to estimate AirBnB activities [110]. Alternatively, Inside AirBnB is an independent, non-commercial set of tools and data that allows exploration of AirBnB data for selected countries and cities (see [111] for application). Articles have also been written about other data scraping possibilities (e.g., [112]).
An example of an opinion-related collaborative economy practice is Tripadvisor. Tripadvisor “can be identified as a significant source of open data given the figures and reviews on attractions/destinations. For example, in 2015, Tripadvisor reached 320 million reviews and had 6.2 million opinions on places to stay, to eat, and on things to do including 995,000 hotels and forms of accommodation, 770,000 vacation rentals, 3.8 million restaurants and 625,000 attractions in 125,000 destinations throughout the world” [113] (p. 432). Tripadvisor is offering API access for registered users [114]. Publicly available data has been also scraped anonymously and analyzed by Sidor and colleagues [115]. In another study, TripAdvisor big data has been complemented with Eurostat data to identify spatiotemporal patterns in hospitality in the whole of the EU [116].
Various car sharing or short-term car or bike rental services, such as Uber, Grab, or DriveNow, might potentially prove equally useful for collecting and analyzing tourist mobility data. The main difficulty is the negotiation of access to such proprietary data. For years, local governments have been trying to access the data of major ride share operators such as Uber for city planning purposes—so far with limited success. This is because the businesses which have amassed a massive amount of data about how and when we move, have understood the enormous value of their data and are not willing to give it away. However, governments have a possibility to use their regulatory power in establishing minimum requirements for accessing ride share data for the public good.
Also, on a smaller scale, there are some promising cases to study. For example, the City Government of Tartu (Estonia) runs its own bike share service as a part of a smart city initiative. The bike tracking data that is collected routinely for the maintenance of the bike service can also be used for analyzing the visitor flows around major cultural attractions or events. The underlying technology for the establishment and maintenance of shared mobility solutions is readily available. Hence, it is increasingly easy to establish local ride sharing networks that bring multiple benefits to the community.
The important lesson from the above is that the various sharing economy solutions routinely generate a lot of data that can prove highly beneficial for city planners, tourism promotion agencies, and the management of various cultural attractions. However, to make effective use of the data, “it is necessary to introduce predictive models that support information selection within a huge amount of data” [113] (p. 432). Open and big data-based predictive models could help predict tourists’ decisions (e.g., based on Tripadvisor ratings of certain tourist attractions) and judgements about a certain tourist attraction. Such analyses, if repeated regularly, could also help evaluate the effectiveness of marketing strategies.
4.4. Passenger Data
Passenger data refers to information about the movement of individuals to, from, and within a geographic location. There are several (proprietary) big data sources that can be used for analyzing passenger traffic flows, including tourist flows.
Road sensors are the most established data source. The most common road sensor type is the induction loop, which is installed in a road. However, there are also ‘mobile’ road sensors that can be set up in a particular location and, after a period of time, moved to a different location. They measure the number of passing vehicles in order to provide detailed data on traffic over time. The initial intention of such data collection is to predict congestions and to optimize traffic flows. However, road sensor data can also prove useful in planning the road network, analyzing tourist flows, etc. For example, Scuttari and colleagues used traffic flow data to estimate the environmental impact of tourism traffic on Italy’s South Tyrol region [117].
On a similar token, taxi GPS logs have been used to trace tourists’ movements starting and ending at tourist destinations (e.g., [118]). Similar functionality could be achieved by analyzing the logs of Uber, Bolt, or Grab ride-sharing trips. Likewise, the various on-line traffic and navigation services, such as Google Maps or TomTom, are other sources of near-real-time information on the intensity of traffic flows that could be valuable. Compared with mobile phone positioning, GPS provides more detailed behavioral data in time and space as it continuously collects information without intervals.
Similar research is also looking into pedestrian monitoring and visitor-flow calculation. Within the Smart Heritage City project, pedestrian counting cameras were designed and installed that enable policy makers to understand visitor flows and avoid overcrowding or underuse of heritage sites and locations in the Historic City of Ávila [119].
A common difficulty of the above data sources is that it is usually difficult or even impossible to distinguish between local and tourist traffic. This is where integrating road traffic data with additional data sources and sensors can prove highly valuable. For example, there is an experiment ongoing in Spain to complement road sensor data with computer vision from traffic control cameras [120]. Such integration of data sources allows:
- An analysis of the license plates of the cars, e.g., to detect local cars, cars registered in other parts of the country, and foreign cars in order to estimate the number of inbound tourists, time and duration of their stay, share of returning visitors, main border crossing points, etc.;
- To augment the road sensor data with visual data that can offer further insights on the size and type of the vehicle or even the number of passengers, origins and destinations, travel speeds, queue length, etc.
Likewise, CCTV surveillance cameras in parking lots, especially in the neighborhoods of tourism attractions could potentially play a valuable role in analyzing cultural tourism when equipped with computer vision and image detection systems. For example, an extensive transport survey carried out in 2007 and 2008 for the Helsinki Metropolitan Area combined “automatic plate recognition origin/destination surveys (with 80,000 cars), automatic traffic counts and household interviews with travel diary of around 20,000 persons. This initiative aimed at replacing the traditional survey design that involved stopping vehicles and passing a questionnaire directly to the driver. With these three elements, the aim is to construct origin/destination matrices differentiated by purpose of trips and time periods” [120]. Estonia has experimented with the use of passenger data, where the number plates of cars (e.g., from parking services providers) allow to track the approximate number of domestic and foreign tourists or event visitors [121].
Furthermore, other environmental sensors, such as sunlight, temperature, direction and strength of wind, humidity, rainfall, and public travel data sources, e.g., Google Maps and Places, TripAdvisor, could also be used to enrich the traffic data as a part of a further analysis.
Beyond road traffic data, aviation data, marine passenger traffic data, and rail traffic data may be relevant, especially when it comes to the frequency, travel time, ticket costs, and occupancy rates of passenger traffic connections. Such data may prove especially relevant when it comes to analyzing the choice of international tourism destinations. Some of the relevant passenger traffic data sets include:
- INRIX Trip Reports, which provides travel path data related to the start, end, and waypoints of trips to, from, through and within user defined zones or corridors;
- Patterns place traffic and demographic aggregations that answer the question: How often people visit, where they came from, where else they go;
- Google Maps, TomTom, and Here that offer point of interest, location, map, and traffic data.
- Amadeus for Developers offers several APIs that allow to search for flight offers, and to check for most travelled flight destinations and for the busiest travel period, etc.
Overall, passenger data can be relevant from several different aspects. Tourism authorities and site managers may make sure that the attractions draw adequate traffic. City planners and businesses may want to analyze where to locate new facilities. Detailed information on tourist mobility patterns would allow to develop more effective marketing and sales campaigns, and to identify potential co-operation partners (other attractions and facilities) that are likely to be of interest for the target groups of a specific tourist attraction, etc.
5. Tools for Cultural Tourism Impact Assessment in the Piloting Regions
5.1. Introduction of the Piloting Regions
To understand whether and how cultural tourism regions use these novel data sources in practice, 15 IMPACTOUR pilots informed this research. The pilots described their data use practices, gave examples of how they use novel data sources for assessing the impacts of tourism, and discussed the barriers and challenges of using innovative data sources in tourism management. Some general background information on the pilot sites is given in Table 2.
The piloting regions cover 10 European countries, including cross-border regions. While several piloting sites in France and Spain represent municipalities and regions on the famous pilgrimage route of Camino de Santiago (Way of St James), the pilots overall comprise a variety of sizes (from small villages to large cultural regions) and different types of cultural tourism.
5.2. Data Sources and Tools Used by the Piloting Regions
Most IMPACTOUR pilots rely heavily on traditional data sources in monitoring and assessing the impacts of tourism, while the use of newer tools remains limited. All pilots consistently monitor visitor numbers to their regions. The main sources used for the monitoring include official (national level) tourism statistics, which are most often based on visitor surveys and do not distinguish cultural tourism from other types of tourism. Visitor statistics are also collected directly from accommodation facilities, tourism site operators, and event organizers. Some pilots, such as Aldeia dos Biscoitos in the Azores, conduct visitor surveys at specific visitation points.
In many cases, pilots receive relevant data from other data providers, rather than collecting the data on their own. For example, visitor numbers for museums are sometimes provided by the relevant ministries. Some pilots also source market research from private companies or research provided by universities—for instance, the Vidzeme region in Latvia uses MPD-based research from the Vidzeme University. Estonia has also used mobile positioning data in tourism policy planning on several occasions. For example, in 2018–2019, tourists’ trajectories in Estonia were analyzed. Based on the data, it was possible to visualize the routes of visitors before and after visiting a selected destination. Figure 2 shows the trajectories of domestic visitors of the Saaremaa island (in yellow). The regions visualized in deeper blue indicate the regions where the most visitors stayed immediately before/after visiting Saaremaa.
Some also collect data from transportation hubs, such as airports. Sales data from ticket outlets are also an important source for several regions. The city of Milan has an exemplary open data portal, which contains datasets about the flow of tourists in accommodation facilities by country/region of origin, month, and type of accommodation. For the municipality, these datasets are a key source for monitoring tourism flows.
Regarding the supply side of tourism (see [6] for details), several pilots use data and research from Chambers of Commerce, for instance, on the number of companies started and closed within a given year or the annual turnover of tourism industries in the region. Some regions have the possibility of using national or regional databases on tourism supply. For example, Chemin d’Arles (France–Spain) and Chemin de Compostelle en Aveyron (France) use data from the tourist information system (TIS) collected by the Departmental Tourism Committees and consolidated by the Regional Tourism Committee. The TIS consolidates information supplied by tourist sites on accommodation, heritage, leisure, activities, centers, events, etc., and gives a comprehensive picture of tourism supply in the region.
Some pilots make use of specific data analytics and visualization tools. For example, the Departments of Haute-Garonne (Chemin d’Arles) and Aveyron (Chemin du Puy) use the tourism vision flow tool provided by the French mobile operator Orange. The tool converts large volumes of technical information from Orange’s mobile network in real time into anonymized and aggregated statistical indicators, enabling the analysis of tourism flows to geographic areas and the mobility of people both in terms of general trends and specific events. Haute-Garonne also uses the Géotrek tool for collecting and analyzing all data related to the management of hiking paths, e.g. data on works, signs, installations, maps, photos, illustrations and other.
Regarding the use of the tools in the focus of the current article, most pilots have started to use social media data one way or another, although social media still tends to be used more for marketing than for analysis and impact assessment purposes. Nevertheless, pilots expressed a great deal of interest in using social media data more for analysis and planning in the future. Only a few pilots have tested the use of mobile positioning data, road sensors and data on collaborative and sharing economy. However, several also noted they do not plan to start using these sources soon. The current usage and plans for using these data sources are summarized in Figure 3.
In addition to the above-mentioned data sources, some pilots have also used additional novel tools and data sources, mostly relying on digital technologies. Such data sources include bank card payments, visitor booking data, online ticket sales, event registration systems, video data recording car license plate numbers, online media monitoring for analyzing the use of tourism destination related hashtags and keywords, WiFi login data, and so on. To measure the environmental impacts of visitor-attracting events, some pilots have also used sensors to measure noise and CO2 levels. A few pilots mentioned their interest in developing collaborative data platforms to aggregate data from tourism site managers, event organizers, local producers, etc.
5.3. Barriers Regarding the Use of Innovative Tools
Despite tourism governance organizations’ interest in integrating some of the new tools into tourism measurement and management, the use of non-conventional data sources is regarded to entail substantial challenges and barriers. The most frequently mentioned impediment is privacy regulations, which pilots see as creating challenges for the exploitation of data sources such as mobile positioning data (MPD). Since MPD in its raw form involves personal data and sensitive information about individuals’ locations, the use of MPD by tourism management organizations is considered legally complicated or even impossible in several countries.
In Germany, the data protection regulation contains specifications for the protection of natural persons when processing personal data. This also applies to MPD, data collected by online applications, and use of hashtags on social media. Due to natural persons’ fundamental right to protection of their personal data, the legislation is interpreted as not allowing to forward or use data without an explicit consent of the data subject. At the same time, the Route of the Romanesque in Saxony-Anhalt in Germany has still managed to use some new data sources, such as user data from the free WiFi that is provided in 58 sites along the route. Before visitors log in to use the WiFi, they are informed of the conditions of using the WiFi, which includes agreeing to and accepting the data security policy and the use of the data that they share.
Legal issues regarding the use of MPD have also emerged in Estonia. For more than a decade, a private company regularly analyzed mobility patterns and tourism flows based on pseudonymized data from mobile operators. However, since the end of 2019, mobile operators are no longer allowed to provide the data due to changes in the national data protection agency’s interpretation of privacy regulations. Although the data that mobile operators used to provide to analytics companies was pseudonymized (no actual phone numbers were revealed to those processing the data), the new and stricter interpretation is based on the theoretical risk of still being able to identify individual persons based on the locations they frequently visit (home, workplace, etc.).
Next to legal restrictions, several barriers pertain to tourism destinations’ capacity to collect and process vast amounts of data. First, smaller tourism destinations’ awareness of new tools and their usage opportunities tends to be rather limited. Several pilots referred to their limited data analysis capabilities, which often relate to human and financial resource constraints, particularly in smaller localities. The existing staff often also lack the required digital and data analytics skills, which points to the need for more training and capacity-building. These limitations are exacerbated by a high fragmentation of data sources and problems with the comparability and compatibility of data aggregated from different sources. This calls for greater efforts for the standardization and interoperability of systems and tools across regions and country borders. Furthermore, some pilots pointed to the need for setting up automatic data collection systems to minimize the need for manual labor, both on the side of data providers and data users. In many cases, relevant data is owned by various actors, often private parties, who may require fees in return for access to their data. This creates usage barriers for tourism organizations with fewer resources. Lastly, even if data are available, data quality may be an issue. Interviewed pilots expressed caution about using incomplete data due to possible biases in the analysis.
6. Discussion and Conclusions
Based on the current research, it can be concluded that major changes are currently taking place in the fields of policy monitoring and evaluation, and the use of data and tools generally. The main trends include: (1) The importance of evidence has increased considerably in policy planning, implementation, and evaluation; (2) the unprecedented availability of open and big data; and (3) the rapid developments in the intelligence and analytical tools.
Such trends are also taking place in the field of tourism, specifically, the role of data science and open and big data analytics are becoming increasingly important (Table 3). Traditional surveys are already being complemented with other data sources, while in the long run, the role of surveys will diminish even further and the role of other data sources will continue to increase. New sources of data and analytical tools make it possible to process the immense volume of information collected from digital sources, work with data not previously available, achieve (close to) the real-time synchronization of sources, and carry out analyses on a more detailed level. The importance of predictive analytics is also on the rise.
The shift is accompanied with challenges related to the co-ordination between different stakeholders, data issues (access, complexity, objectivity, quality), and competencies. Access to proprietary data is particularly a constraint and regulation of the access to such (anonymized) data for public purposes is likely to remain a subject for debate in the years to come.
Travel and tourism are sectors that have been hit particularly hard by the COVID-19 crisis and feedback from cultural tourism experts and the interviewed regions indicated that, due to recent developments, these previously identified trends are receiving additional attention. Hence, governments and tourism managers need timely information regarding the cultural tourism sector and tourism companies to develop policy instruments; and there is potential for learning from each other in Europe regarding the instruments that work the best. These aspects make the adoption of open and big data in cultural tourism management even more appealing than it might have been otherwise.
In further research and development of methodologies and tools to assess the impact of cultural tourism on European economic and social development, one of the challenges encountered is related to the definition of cultural tourism (see also [6]). So, one of the next steps should be related to the development of the definition. Building a conceptual framework around the precise definition of what is being measured and linking it with the most suitable data sources prevents tourism managers from falling into the “data supply” trap, i.e., measuring something which is not really relevant. Any further work should also be aligned with the ongoing work taking place in the statistical offices and national tourism development agencies. These bodies seem to be most informed on alternative and emerging sources of information and tools.
Due to the widespread use of mobile phones and the fact that standardized MPD is collected automatically, mobile positioning data has been identified as a valuable source to analyze tourism patterns. Eurostat, the United Nations, and national agencies from various countries are looking into the use of MPD. It is also currently the only new digital data source used for official national tourism statistics (in Estonia and Indonesia), while it has been used elsewhere for studies on domestic tourist flows between cities, seasonality for foreign tourists, travel distances of events visitors and regular visitors, etc.
One of the most important indicators derived from MPD that can be used in the assessment of cultural tourism impacts on destinations is the number of tourists at destinations on a detailed temporal and spatial level. MPD also helps to capture same-day visitors who do not stay overnight at the destination. In addition, MPD includes information about tourists who are taking advantage of shared and collaborative economy, which are often not captured in official statistics.
The main limitations of MPD are the differences in phone use, lack of qualitative information and difficulties in access to data. The latter has so far been the biggest obstacle in the use of MPD. Problems in access arise from (inter)national regulatory limitations and legislation. Also, network operators might be unwilling to provide data due to the necessity for maintaining business confidentiality, privacy issues, fear of being tracked, and a general disapproval by society of such methods. The current barriers emerging from conflicting interpretations of privacy regulations call for governments’ dedicated efforts to clearly regulate the conditions on which MPD data can be used for statistical purposes. Regulatory attention may also be needed to facilitate anonymized access to (proprietary) data, e.g., from major ride share apps or location data for public good purposes.
User-generated big data from social media, web searches, and website visits constitute another promising data source for monitoring and planning cultural tourism. Such data can be used both for analyzing tourism flows and understanding how visitors perceive and use tourism attractions. As online big data is often public, available in real time, and freely accessible online, this data source has low usage barriers in terms of access and legal restrictions. A number of studies have shown the data quality and reliability to be close to official tourism statistics, creating avenues for replacing costly visitor surveys with analyzing people’s behavior online at lower costs, and with fewer time lags.
So far, the use of web and social media data in tourism monitoring and assessment has been mostly experimental. Hence, replicable models and good practices are still in development. The data also has certain limitations in terms of representativeness and possible biases emanating from the specifics of different platforms and demographics of internet and social media users. Despite the limitations, web and social media data are likely to soon become the key tools in tourism impact assessment and policy planning, greatly reducing reliance on traditional visitor surveys.
Passenger data can be relevant from several different aspects. Tourism authorities and site managers can make sure that the attractions draw adequate traffic; city planners and businesses may want to analyze where to locate new facilities. This type of detailed information on tourist mobility patterns would allow the development of more effective marketing and sales campaigns, and to identify potential co-operation partners (other attractions and facilities) that are likely to be of interest for the target groups of a specific tourist attraction, etc.
However, the use of passenger traffic data (or sensor generated data more generally) is challenging in the short-term. While there several relevant data sources that can be used for analyzing passenger traffic flows, including tourist flows, some of this data can be proprietary. Road sensors are the most established data sources, but for measuring cultural tourism, integrating road traffic data with additional data sources and sensors is needed. However, this could potentially lead to technical (such as need for proper infrastructure, interoperability) and legal challenges. The benefits of using sensor data also currently appear to be lower than those of other novel data sources.
As discussed earlier, one of the recent trends that impacts tourism generally and cultural tourism more specifically is related to the rapid growth of the sharing and collaborative economy. It was concluded in [2] that given the recent emergence of new platform-type travel and tourism services, assessing the effects of the related monetary and non-monetary transactions has become more important. Data from many key players of the sharing and collaborative economy is available either directly or indirectly, there are numerous academic publications available with methodological guidelines and, as the feedback from cultural tourism experts and the participating regions indicated, there are some attempts to use such data in tourism assessment and planning. However, such data still seems to be underused in tourism governance. To harness the benefits of data on collaborative and sharing economy, it would be particularly interesting to link this with official (open) data sources.
As far as new data sources and tools are concerned, we recommend concentrating the development efforts on various World Wide Web and API data, paying specific attention to data on sharing and collaborative economy. Such data could be of interest to various tourism policy stakeholders and would also allow for comparative analysis across tourism regions. The competencies needed to interpret the data and use it in the policy governance should be enhanced further, though.
It is also advisable to further explore the opportunities regarding mobile positioning data. Considering the benefits associated with this approach, it is recommended to develop respective analytical methods further and pay special attention to how to overcome barriers regarding the wider use of MPD. For regions that have no experience with MPD, the first steps would be understanding how to access the data, the legal limits that are associated with it, and the competencies on how to process the data into meaningful and suitable information to be used in policy planning and implementation.
Author Contributions
Conceptualization, T.K.; methodology, T.K.; formal analysis and investigation, T.K., M.O., M.T., J.R.; writing—original draft preparation, T.K., M.O., M.T., J.R.; writing—review and editing, T.K., M.O., M.T., J.R.; supervision, T.K.; project administration, T.K.; funding acquisition, T.K. All authors have read and agreed to the published version of the manuscript.
Funding
This research was funded by the European Commission, grant number 870747—Improving Sustainable Development Policies and Practices to assess, diversify and foster Cultural Tourism in European regions and areas (IMPACTOUR).
Acknowledgments
Authors are grateful to the project partners that contributed with data on pilots and with overall comments and edits: ACIR, AMRAA, ENAT, ETB, EUROPA NOSTRA, CULTUR, CUT, MTHUB, UNINOVA, TECNALIA, TRANSROMANICA.
Conflicts of Interest
The authors declare no conflict of interest.
References
- UNWTO. Tourism and Culture. Available online: https://www.unwto.org/tourism-and-culture (accessed on 24 July 2020).
- UNWTO. Tourism and Culture Synergies; UNWTO: Madrid, Spain, 2018; ISBN 9789284418978. [Google Scholar]
- Richards, G. Cultural tourism: A review of recent research and trends. J. Hosp. Tour. Manag. 2018, 36, 12–21. [Google Scholar] [CrossRef]
- Noonan, D.S.; Rizzo, I. Economics of cultural tourism: Issues and perspectives. J. Cult. Econ. 2017, 41, 95–107. [Google Scholar] [CrossRef] [Green Version]
- Richards, G.; Marques, L. Creating Synergies between Cultural Policy and Tourism for Permanent and Temporary Citizens; Committee on Culture of United Cities and Local Governments: Barcelona, Spain, 2018. [Google Scholar]
- Kalvet, T.; Olesk, M.; Tiits, M. Report on Cultural Tourism Leading to Sustainable Economic and Social Development; IMPACTOUR Deliverable 1.1; European Commission: Brussels, Belgium, 2020. [Google Scholar]
- OECD. Embracing Innovation in Government: Global Trends 2019; OECD Publishing: Paris, France, 2019. [Google Scholar]
- Saltelli, A.; Giampietro, M. What is wrong with evidence based policy, and how can it be improved? Futures 2017, 91, 62–71. [Google Scholar] [CrossRef]
- Janssen, M.; Kuk, G. Big and Open Linked Data (BOLD) in research, policy, and practice. J. Organ. Comput. Electron. Commer. 2016, 26, 3–13. [Google Scholar] [CrossRef] [Green Version]
- Malamud, C.; O’Reilly, T.; Elin, G.; Sifry, M.; Holovaty, A.; O’Neil, D.X.; Migurski, M.; Allen, S.; Tauberer, J.; Lessig, L.; et al. The 8 Principles of Open Government Data. Available online: https://opengovdata.org/ (accessed on 13 July 2020).
- Zuiderwijk, A.; Janssen, M.; Poulis, K.; van de Kaa, G. Open data for competitive advantage: Insights from open data use by companies. In Proceedings of the ACM International Conference Proceeding Series, Phoenix, AZ, USA, 27–30 May 2015; Association for Computing Machinery: New York, NY, USA, 2015; Volume 27, pp. 79–88. [Google Scholar]
- McBride, K.; Aavik, G.; Toots, M.; Kalvet, T.; Krimmer, R. How does open government data driven co-creation occur? Six factors and a “perfect storm”; Insights from Chicago’s food inspection forecasting model. Gov. Inf. Q. 2019, 36, 88–97. [Google Scholar] [CrossRef]
- Aguilera, U.; Peña, O.; Belmonte, O.; López-de-Ipiña, D. Citizen-centric data services for smarter cities. Future Gener. Comput. Syst. 2017, 76, 234–247. [Google Scholar] [CrossRef] [Green Version]
- Furht, B.; Villanustre, F. Big Data Technologies and Applications; Springer: Cham, Switzerland, 2016; ISBN 9783319445502. [Google Scholar]
- United Nations Statistical Commission Big Data and Modernization of Statistical Systems. In Report of the Secretary-General, Proceedings of the E/CN.3.2014/11 of the Forty-Fifth Session of UNSC, New York, NY, USA, 4–7 March 2014; United Nations: New York, NY, USA, 2014.
- Gandomi, A.; Haider, M. Beyond the hype: Big data concepts, methods, and analytics. Int. J. Inf. Manag. 2015, 35, 137–144. [Google Scholar] [CrossRef] [Green Version]
- Oussous, A.; Benjelloun, F.Z.; Ait Lahcen, A.; Belfkih, S. Big Data technologies: A survey. J. King Saud Univ. Comput. Inf. Sci. 2018, 30, 431–448. [Google Scholar] [CrossRef]
- Newell, S.; Marabelli, M. Strategic opportunities (and challenges) of algorithmic decision-making: A call for action on the long-term societal effects of “datification”. J. Strateg. Inf. Syst. 2015, 24, 3–14. [Google Scholar] [CrossRef]
- McAfee, A.; Brynjolfsson, E. Big Data: The Management Revolution. Harv. Bus. Rev. 2012, 90, 60–68. [Google Scholar]
- MacFeely, S. The Big (data) Bang: Opportunities and Challenges for Compiling SDG Indicators. Glob. Policy 2019, 10, 121–133. [Google Scholar] [CrossRef] [Green Version]
- Höchtl, J.; Parycek, P.; Schöllhammer, R. Big data in the policy cycle: Policy decision making in the digital era. J. Organ. Comput. Electron. Commer. 2016, 26, 147–169. [Google Scholar] [CrossRef]
- Poel, M.; Meyer, E.T.; Schroeder, R. Big Data for Policymaking: Great Expectations, but with Limited Progress? Policy Internet 2018, 10, 347–367. [Google Scholar] [CrossRef]
- Eurostat European Statistical System. Available online: https://ec.europa.eu/eurostat/web/european-statistical-system (accessed on 13 July 2020).
- Demunter, C. Tourism Statistics: Early Adopters of Big Data; Publications Office of the European Union: Luxembourg, 2017. [Google Scholar]
- Eurostat Big Data Task Force. Big Data Action Plan and Roadmap. Available online: https://ec.europa.eu/eurostat/cros/content/ess-big-data-action-plan-and-roadmap-10_en (accessed on 13 July 2020).
- ESSnet Big Data. Available online: https://webgate.ec.europa.eu/fpfis/mwikis/essnetbigdata/index.php/Main_Page (accessed on 13 July 2020).
- Berryhill, J.; Heang, K.K.; Clogher, R.; McBride, K. Hello, World: Artificial intelligence and its use in the public sector. In OECD Working Papers on Public Governance; No. 36; OECD Publishing: Paris, France, 2019. [Google Scholar]
- Dupeyras, A.; Maccallum, N. Indicators for Measuring Competitiveness in Tourism: A Guidance Document. In OECD Tourism Papers, 2013/02; OECD Publishing: Paris, France, 2013. [Google Scholar]
- IMPACTOUR. Improving Sustainable Development Policies and Practices to Access, Diversify and Foster Cultural Tourism in European Regions and Areas. Available online: https://www.impactour.eu/ (accessed on 4 August 2020).
- Grover, P.; Kar, A.K. Big Data Analytics: A Review on Theoretical Contributions and Tools Used in Literature. Glob. J. Flex. Syst. Manag. 2017, 18, 203–229. [Google Scholar] [CrossRef]
- Xiang, Z.; Fesenmaier, D.R. Big Data Analytics, Tourism Design and Smart Tourism. In Analytics in Smart Tourism Design, Tourism on the Verge; Xiang, Z., Fesenmaier, D., Eds.; Springer: Cham, Switzerland, 2017; pp. 299–307. [Google Scholar]
- Miah, S.J.; Vu, H.Q.; Gammack, J.; McGrath, M. A Big Data Analytics Method for Tourist Behaviour Analysis. Inf. Manag. 2017, 54, 771–785. [Google Scholar] [CrossRef] [Green Version]
- Gretzel, U.; Sigala, M.; Xiang, Z.; Koo, C. Smart tourism: Foundations and developments. Electron. Mark. 2015, 25, 179–188. [Google Scholar] [CrossRef] [Green Version]
- United Nations/UN World Tourism Organisation. International Recommendations for Tourism Statistics; United Nations: New York, NY, USA, 2008; ISBN 978-92-1-161521-0. [Google Scholar]
- Eurostat. Methodological Manual for Tourism Statistics-Version 3.1; Publications Office of the European Union: Luxembourg, 2014. [Google Scholar]
- ESSnet Big Data WPJ Innovative Tourism Statistics. Available online: https://webgate.ec.europa.eu/fpfis/mwikis/essnetbigdata/index.php/WPJ_Innovative_tourism_statistics (accessed on 13 July 2020).
- Pérez Guilarte, Y.; Barreiro Quintáns, D. Using Big Data to Measure Tourist Sustainability: Myth or Reality? Sustainability 2019, 11, 5641. [Google Scholar] [CrossRef] [Green Version]
- Xu, F.; Nash, N.; Whitmarsh, L. Big data or small data? A methodological review of sustainable tourism. J. Sustain. Tour. 2020, 28, 147–166. [Google Scholar] [CrossRef]
- Herschel, R.; Miori, V.M. Ethics & Big Data. Technol. Soc. 2017, 49, 31–36. [Google Scholar] [CrossRef]
- Culnan, M.J.; Williams, C.C. How ethics can enhance organizational privacy: Lessons from the Choicepoint and TJX data breaches. MIS Q. Manag. Inf. Syst. 2009, 33, 673–687. [Google Scholar] [CrossRef]
- Nunan, D.; di Domenico, M. Market Research and the Ethics of Big Data. Int. J. Mark. Res. 2013, 55, 505–520. [Google Scholar] [CrossRef] [Green Version]
- Apte, A.; Ingole, V.; Lele, P.; Marsh, A.; Bhattacharjee, T.; Hirve, S.; Campbell, H.; Nair, H.; Chan, S.; Juvekar, S. Ethical considerations in the use of GPS-based movement tracking in health research-Lessons from a care-seeking study in rural west India. J. Glob. Health 2019, 9, 1–7. [Google Scholar] [CrossRef] [PubMed]
- Hesse, A.; Glenna, L.; Hinrichs, C.; Chiles, R.; Sachs, C. Qualitative Research Ethics in the Big Data Era. Am. Behav. Sci. 2019, 63, 560–583. [Google Scholar] [CrossRef] [Green Version]
- Pesonen, J.; Lampi, M. Utilizing Open Data in Tourism. In Proceedings of the ENTER 2016 Conference on Information and Communication Technologies in Tourism, Bilbao, Spain, 2–5 February 2016; Available online: http://agrilife.org/ertr/files/2016/01/ENTER2016_submission_122.pdf (accessed on 13 July 2020).
- Longhi, C.; Titz, J.-B.; Viallis, L. Open Data: Challenges and Opportunities for the Tourism Industry. In Tourism Management, Marketing, and Development; Mariani, M.M., Baggio, R., Buhalis, D., Longhi, C., Eds.; Palgrave Macmillan US: New York, NY, USA, 2014; pp. 57–76. [Google Scholar]
- Kršák, B.; Sidor, C.; Štrba, Ľ.; Mitterpák, M. Usage of linked open data for the measurement of mining tourism POIs’ impact on the competitiveness of a destination: Research notes part 1. Acta Montan. Slovaca 2016, 21, 162–169. [Google Scholar]
- Versichele, M.; de Groote, L.; Claeys Bouuaert, M.; Neutens, T.; Moerman, I.; van de Weghe, N. Pattern mining in tourist attraction visits through association rule learning on Bluetooth tracking data: A case study of Ghent, Belgium. Tour. Manag. 2014, 44, 67–81. [Google Scholar] [CrossRef] [Green Version]
- Bonne, B.; Barzan, A.; Quax, P.; Lamotte, W. WiFiPi: Involuntary tracking of visitors at mass events. In Proceedings of the 2013 IEEE 14th International Symposium on a World of Wireless, Mobile and Multimedia Networks WoWMoM, Madrid, Spain, 4–7 June 2013; IEEE: Piscataway, NJ, USA, 2013. [Google Scholar]
- OECD’s Global Forum on Tourism Statistics. 2018. Available online: http://www.15th-tourism-stats-forum.com/Presentations.html (accessed on 13 July 2020).
- OECD’s Global Forum on Tourism Statistics. 2016. Available online: http://tsf2016venice.enit.it/download (accessed on 13 July 2020).
- Big Data Project Inventory. Available online: https://unstats.un.org/bigdata/inventory/ (accessed on 13 July 2020).
- GSMA. The Mobile Economy. Available online: https://www.gsma.com/mobileeconomy/ (accessed on 13 July 2020).
- United Nations Handbook on the Use of Mobile Phone Data for Official Statistics. UN Global Working Group on Big Data for Official Statistics. Available online: https://unstats.un.org/bigdata/taskteams/mobilephone/Handbook%20on%20Mobile%20Phone%20Data%20for%20official%20statistics%20-%20Draft%20Nov%202017.pdf (accessed on 8 September 2020).
- Ahas, R.; Aasa, A.; Roose, A.; Mark, Ü.; Silm, S. Evaluating passive mobile positioning data for tourism surveys: An Estonian case study. Tour. Manag. 2008, 29, 469–486. [Google Scholar] [CrossRef]
- Shoval, N.; Ahas, R. The use of tracking technologies in tourism research: The first decade. Tour. Geogr. 2016, 18, 587–606. [Google Scholar] [CrossRef]
- Ahas, R.; Aasa, A.; Mark, Ü.; Pae, T.; Kull, A. Seasonal tourism spaces in Estonia: Case study with mobile positioning data. Tour. Manag. 2007, 28, 898–910. [Google Scholar] [CrossRef]
- Raun, J. Mobile Positioning Data for Tourism Destination Studies and Statistics. Ph.D. Thesis, University of Tartu, Tartu, Estonia, 2020. [Google Scholar]
- Asakura, Y.; Hato, E. Tracking survey for individual travel behaviour using mobile communication instruments. Transp. Res. Part C Emerg. Technol. 2004, 12, 273–291. [Google Scholar] [CrossRef]
- Ahas, R.; Mark, Ü. Location based services-New challenges for planning and public administration? Futures 2005, 37, 547–561. [Google Scholar] [CrossRef]
- Ratti, C.; Frenchman, D.; Pulselli, R.M.; Williams, S. Mobile Landscapes: Using Location Data from Cell Phones for Urban Analysis. Environ. Plan. B Plan. Des. 2006, 33, 727–748. [Google Scholar] [CrossRef]
- Silm, S.; Ahas, R. The Seasonal Variability of Population in Estonian Municipalities. Environ. Plan. A Econ. Space 2010, 42, 2527–2546. [Google Scholar] [CrossRef]
- Vanhoof, M.; Hendrickx, L.; Puussaar, A.; Verstraeten, G.; Ploetz, T.; Smoreda, Z. Exploring the Use of Mobile Phone Data for Domestic Tourism Trip Analysis. Netcom. Réseaux Commun. Et Territ. 2017, 31-3/4, 335–372. Available online: http://journals.openedition.org/netcom (accessed on 8 September 2020). [CrossRef]
- Kuusik, A.; Tiru, M.; Ahas, R.; Varblane, U. Innovation in destination marketing: The use of passive mobile positioning for the segmentation of repeat visitors in Estonia. Balt. J. Manag. 2011, 6, 378–399. [Google Scholar] [CrossRef]
- Tiru, M.; Kuusik, A.; Lamp, M.-L.; Ahas, R. LBS in marketing and tourism management: Measuring destination loyalty with mobile positioning data. J. Locat. Based Serv. 2010, 4, 120–140. [Google Scholar] [CrossRef]
- Nilbe, K.; Ahas, R.; Silm, S. Evaluating the Travel Distances of Events Visitors and Regular Visitors Using Mobile Positioning Data: The Case of Estonia. J. Urban Technol. 2014, 21, 91–107. [Google Scholar] [CrossRef]
- Raun, J.; Ahas, R.; Tiru, M. Measuring tourism destinations using mobile tracking data. Tour. Manag. 2016, 57, 202–212. [Google Scholar] [CrossRef]
- Baggio, R.; Scaglione, M. Strategic visitor flows and destination management organization. Inf. Technol. Tour. 2018, 18, 29–42. [Google Scholar] [CrossRef]
- Raun, J.; Shoval, N.; Tiru, M. Gateways for intra-national tourism flows: Measured using two types of tracking technologies. Int. J. Tour. Cities 2020, 6, 261–278. [Google Scholar] [CrossRef]
- Silm, S.; Ahas, R. Ethnic Differences in Activity Spaces: A Study of Out-of-Home Nonemployment Activities with Mobile Phone Data. Ann. Assoc. Am. Geogr. 2014, 104, 542–559. [Google Scholar] [CrossRef]
- Masso, A.; Silm, S.; Ahas, R. Generational differences in spatial mobility: A study with mobile phone data. Popul. Space Place 2019, 25, e2210. [Google Scholar] [CrossRef] [PubMed]
- Eesti Pank International Travel Statistics. Available online: https://statistika.eestipank.ee/#/en/p/MAKSEBIL_JA_INVPOS/1410 (accessed on 13 July 2020).
- Lestari, T.K.; Esko, S.; Sarpono, B.P.S.; Saluvee, E.; Rufiadi, R. Indonesia’s Experience of using Signaling Mobile Positioning Data for Official Tourism Statistics. Available online: http://www.15th-tourism-stats-forum.com/pdf/Papers/S3/3_2_Indonesia’s_Experience_of_using_Signaling_MPD_for_Official_Tourism_Statistics.pdf (accessed on 13 July 2020).
- Gitton, F. Testing the Use of Cell Phone Data for Inbound Tourism Statistics for France. Available online: http://tsf2016venice.enit.it/images/articles/Papers_Forum/1.5_Paper_testing%20the%20use%20of%20cell%20phone%20data%20for%20inbound%20tourism%20statistics%20for%20France.pdf (accessed on 13 July 2020).
- Nurmi, O. Improving the Accuracy of Outbound Tourism Statistics with Mobile Positioning Data. Available online: http://www.15th-tourism-stats-forum.com/pdf/Papers/S3/3_3_Improving_the_accuracy_of_outbound_tourism_statistics_with_mobile_positioning_data.pdf (accessed on 13 July 2020).
- Eurostat Feasibility Study on the Use of Mobile Positioning Data for Tourism Statistics; Publications Office of the European Union: Luxembourg, 2014.
- Kuusik, A.; Nilbe, K.; Mehine, T.; Ahas, R. Country as a Free Sample: The Ability of Tourism Events to Generate Repeat Visits. Case Study with Mobile Positioning Data in Estonia. Procedia Soc. Behav. Sci. 2014, 148, 262–270. [Google Scholar] [CrossRef] [Green Version]
- Saluveer, E.; Raun, J.; Tiru, M.; Altin, L.; Kroon, J.; Snitsarenko, T.; Aasa, A.; Silm, S. Methodological framework for producing national tourism statistics from mobile positioning data. Ann. Tour. Res. 2020, 81, 102895. [Google Scholar] [CrossRef]
- European Parliament Regulation (EU) 2016/679 of the European Parliament and of the Council of 27 April 2016 on the Protection of Natural Persons with Regard to the Processing of Personal Data and on the Free Movement of Such Data, and Repealing Directive 95/46/EC (General Data Protection Regulation). Available online: https://eur-lex.europa.eu/eli/reg/2016/679/oj (accessed on 13 July 2020).
- Zheng, Y.T.; Zha, Z.J.; Chua, T.S. Mining travel patterns from geotagged photos. ACM Trans. Intell. Syst. Technol. 2012, 3, 1–18. [Google Scholar] [CrossRef]
- Chua, A.; Servillo, L.; Marcheggiani, E.; Moere, A.V. Mapping Cilento: Using geotagged social media data to characterize tourist flows in southern Italy. Tour. Manag. 2016, 57, 295–310. [Google Scholar] [CrossRef]
- Barchiesi, D.; Moat, H.S.; Alis, C.; Bishop, S.; Preis, T. Quantifying International Travel Flows Using Flickr. PLoS ONE 2015, 10, e0128470. [Google Scholar] [CrossRef]
- Önder, I.; Koerbitz, W.; Hubmann-Haidvogel, A. Tracing Tourists by Their Digital Footprints. J. Travel Res. 2016, 55, 566–573. [Google Scholar] [CrossRef]
- Orsi, F.; Geneletti, D. Using geotagged photographs and GIS analysis to estimate visitor flows in natural areas. J. Nat. Conserv. 2013, 21, 359–368. [Google Scholar] [CrossRef]
- Wood, S.A.; Guerry, A.D.; Silver, J.M.; Lacayo, M. Using social media to quantify nature-based tourism and recreation. Sci. Rep. 2013, 3, 1–7. [Google Scholar] [CrossRef]
- Brandt, T.; Bendler, J.; Neumann, D. Social media analytics and value creation in urban smart tourism ecosystems. Inf. Manag. 2017, 54, 703–713. [Google Scholar] [CrossRef]
- Gunter, U.; Önder, I. Forecasting city arrivals with Google Analytics. Ann. Tour. Res. 2016, 61, 199–212. [Google Scholar] [CrossRef]
- World Economic Forum. The Travel & Tourism Competitiveness Report 2019 Travel and Tourism at a Tipping Point; World Economic Forum: Geneva, Switzerland, 2019. [Google Scholar]
- Yang, Y.; Pan, B.; Song, H. Predicting Hotel Demand Using Destination Marketing Organization’s Web Traffic Data. J. Travel Res. 2014, 53, 433–447. [Google Scholar] [CrossRef] [Green Version]
- Volchek, K.; Liu, A.; Song, H.; Buhalis, D. Forecasting tourist arrivals at attractions: Search engine empowered methodologies. Tour. Econ. 2019, 25, 425–447. [Google Scholar] [CrossRef]
- Signorelli, S.; Reis, F.; Biffignandi, S. What Attracts Tourists While Planning for a Journey? An Analysis of Three Cities through Wikipedia Page Views. Available online: https://www.researchgate.net/publication/310605164 (accessed on 13 July 2020).
- Marine-Roig, E.; Anton Clavé, S. Tourism analytics with massive user-generated content: A case study of Barcelona. J. Destin. Mark. Manag. 2015, 4, 162–172. [Google Scholar] [CrossRef]
- Tilly, R.; Fischbach, K.; Schoder, D. Mineable or messy? Assessing the quality of macro-level tourism information derived from social media. Electron. Mark. 2015, 25, 227–241. [Google Scholar] [CrossRef]
- Abbasi, A.; Rashidi, T.H.; Maghrebi, M.; Waller, S.T. Utilising location based social media in travel survey methods: Bringing twitter data into the play. In Proceedings of the 8th ACM SIGSPATIAL International Workshop on Location-Based Social Networks, LBSN 2015-Held in Conjunction with ACM SIGSPATIAL, Seattle, WA, USA, 3 November 2015; Association for Computing Machinery, Inc.: New York, NY, USA, 2015; pp. 1–9. [Google Scholar]
- Xiang, Z.; Du, Q.; Ma, Y.; Fan, W. A comparative analysis of major online review platforms: Implications for social media analytics in hospitality and tourism. Tour. Manag. 2017, 58, 51–65. [Google Scholar] [CrossRef]
- Pew Research Center Demographics of Social Media Users and Adoption in the United States. Available online: https://www.pewresearch.org/internet/fact-sheet/social-media/ (accessed on 13 July 2020).
- Gössling, S.; Michael Hall, C. Sharing versus collaborative economy: How to align ICT developments and the SDGs in tourism? J. Sustain. Tour. 2019, 27, 74–96. [Google Scholar] [CrossRef] [Green Version]
- Dredge, D.; Gyimóthy, S. Collaborative Economy and Tourism; Springer: Cham, Switzerland, 2017. [Google Scholar]
- European Parliament A European Agenda for the Collaborative Economy, Communication from the Commission to the European Parliament, the Council, the European Economic and Social Committee and the Committee of the Regions, COM (2016) 356 Final. Available online: https://eur-lex.europa.eu/legal-content/EN/TXT/?uri=COM%3A2016%3A356%3AFIN (accessed on 13 July 2020).
- OECD. OECD Tourism Trends and Policies; OECD Publishing: Paris, France, 2020; ISBN 978-92-64-70314-8. [Google Scholar]
- OECD. Tourism Trends and Policies 2016. Available online: https://www.oecd-ilibrary.org/industry-and-services/oecd-tourism-trends-and-policies-2016_tour-2016-en (accessed on 13 July 2020).
- Bakker, M.H.E.; Twining-Ward, L.D. Tourism and the Sharing Economy: Policy & Potential of Sustainable Peer-to-Peer Accommodation; World Bank: Washington, DC, USA, 2018. [Google Scholar]
- OECD. OECD Tourism Trends and Policies; OECD Publishing: Paris, France, 2018; ISBN 9789264287389. [Google Scholar]
- Mastercard. The Sharing Economy: Understanding the Opportunities for Growth. Available online: https://newsroom.mastercard.com/eu/files/2017/06/Mastercard_Sharing-Economy_v7.compressed2.pdf (accessed on 13 July 2020).
- Avelino, F.; Dumitru, A.; Longhurst, N.; Wittmayer, J.; Hielscher, S.; Weaver, P.; Cipolla, C.; Afonso, R.; Kunze, I.; Dorland, J.; et al. Transitions towards New Economies? A Transformative Social Innovation Perspective. Available online: http://www.transitsocialinnovation.eu/content/original/Book%20covers/Local%20PDFs/180%20TRANSIT_WorkingPaper3_NewEconomy_Avelinoetal_September2015.pdf (accessed on 8 July 2020).
- O’Rourke, D.; Lollo, N. Transforming Consumption: From Decoupling, to Behavior Change, to System Changes for Sustainable Consumption. Annu. Rev. Environ. Resour. 2015, 40, 233–259. [Google Scholar] [CrossRef] [Green Version]
- Dredge, D.; Gyimóthy, S. The collaborative economy and tourism: Critical perspectives, questionable claims and silenced voices. Tour. Recreat. Res. 2015, 40, 286–302. [Google Scholar] [CrossRef] [Green Version]
- Altinay, L.; Taheri, B. Emerging themes and theories in the sharing economy: A critical note for hospitality and tourism. Int. J. Contemp. Hosp. Manag. 2019, 31, 180–193. [Google Scholar] [CrossRef]
- Buhalis, D.; Andreu, L.; Gnoth, J. The dark side of the sharing economy: Balancing value co-creation and value co-destruction. Psychol. Mark. 2020, 37, 689–704. [Google Scholar] [CrossRef]
- AirDNA. Data Science Meets Real Estate Investing in Vacation Rentals. Available online: https://www.airdna.co/about-2 (accessed on 13 July 2020).
- Agarwal, V.; Koch, J.V.; McNab, R.M. Differing Views of Lodging Reality: Airdna, STR, and Airbnb. Cornell Hosp. Q. 2019, 60, 193–199. [Google Scholar] [CrossRef]
- Lagonigro, R.; Martori, J.C.; Apparicio, P. Understanding Airbnb spatial distribution in a southern European city: The case of Barcelona. Appl. Geogr. 2020, 115, 102136. [Google Scholar] [CrossRef]
- Ki, D.; Lee, S. Spatial Distribution and Location Characteristics of Airbnb in Seoul, Korea. Sustainability 2019, 11, 4108. [Google Scholar] [CrossRef] [Green Version]
- Pantano, E.; Priporas, C.V.; Stylos, N. “You will like it!” using open data to predict tourists’ response to a tourist attraction. Tour. Manag. 2017, 60, 430–438. [Google Scholar] [CrossRef]
- Tripadvisor Content API|Tripadvisor Developer Portal. Available online: https://developer-tripadvisor.com/content-api/ (accessed on 13 July 2020).
- Sidor, C.; Kršák, B.; Štrba, L.; Cehlár, L.; Khouri, M.; Stričík, M.; Dugas, J.; Gajdoš, J.; Bolechová, B. Can Location-Based Social Media and Online Reservation Services Tell More about Local Accommodation Industries than Open Governmental Data? Sustainability 2019, 11, 5926. [Google Scholar] [CrossRef] [Green Version]
- Batista e Silva, F.; Marín Herrera, M.A.; Rosina, K.; Ribeiro Barranco, R.; Freire, S.; Schiavina, M. Analysing spatiotemporal patterns of tourism in Europe at high-resolution with conventional and big data sources. Tour. Manag. 2018, 68, 101–115. [Google Scholar] [CrossRef]
- Scuttari, A.; della Lucia, M.; Martini, U. Integrated planning for sustainable tourism and mobility. A tourism traffic analysis in Italy’s South Tyrol region. J. Sustain. Tour. 2013, 21, 614–637. [Google Scholar] [CrossRef]
- Pan, G.; Qi, G.; Wu, Z.; Zhang, D.; Li, S. Land-use classification using taxi GPS traces. IEEE Trans. Intell. Transp. Syst. 2013, 14, 113–123. [Google Scholar] [CrossRef]
- Zubiaga, M.; Izkara, J.L.; Gandini, A.; Alonso, I.; Saralegui, U. Towards smarter management of overtourism in historic centres through visitor-flow monitoring. Sustainability 2019, 11, 7254. [Google Scholar] [CrossRef] [Green Version]
- Jarvi, T. A Pilot of Using Automatic Number Plate Recognition for OD-Survey of Vehicles, Paper presented to ISCTSC, Annecy, France, 25–31 May 2008. Available online: http://www.isctsc.cl/archivos/2008/33%20B2%20TuuliJarvi.doc (accessed on 13 July 2020).
- Kalvet, T.; Olesk, M.; Tiits, M.; Raun, J. Identification of Tools for Cultural Tourism Impact Assessment. IMPACTOUR Deliverable 1.3; European Commission: Brussels, Belgium, 2020. [Google Scholar]
- Estonian Tourist Board Domestic and International Tourists. Extract Provided in Direct Communication. Available online: https://www.puhkaeestis.ee/et/turismiprofessionaalile/turismiuuringud-ja-ulevaated/sise-ja-valiskulastajad-omavalitsustes-2017-2018-mobiilpositsioneerimise-andmed (accessed on 6 August 2020).
Figure 1.
IMPACTOUR’s methodological approach.

Figure 2.
Trajectories of domestic visitors of Saaremaa in August 2018 based on mobile positioning data (MPD) [122].
Figure 2.
Trajectories of domestic visitors of Saaremaa in August 2018 based on mobile positioning data (MPD) [122].

Figure 3.
Number of pilots reporting current use of and intention to use novel data sources (n = 15).
Figure 3.
Number of pilots reporting current use of and intention to use novel data sources (n = 15).


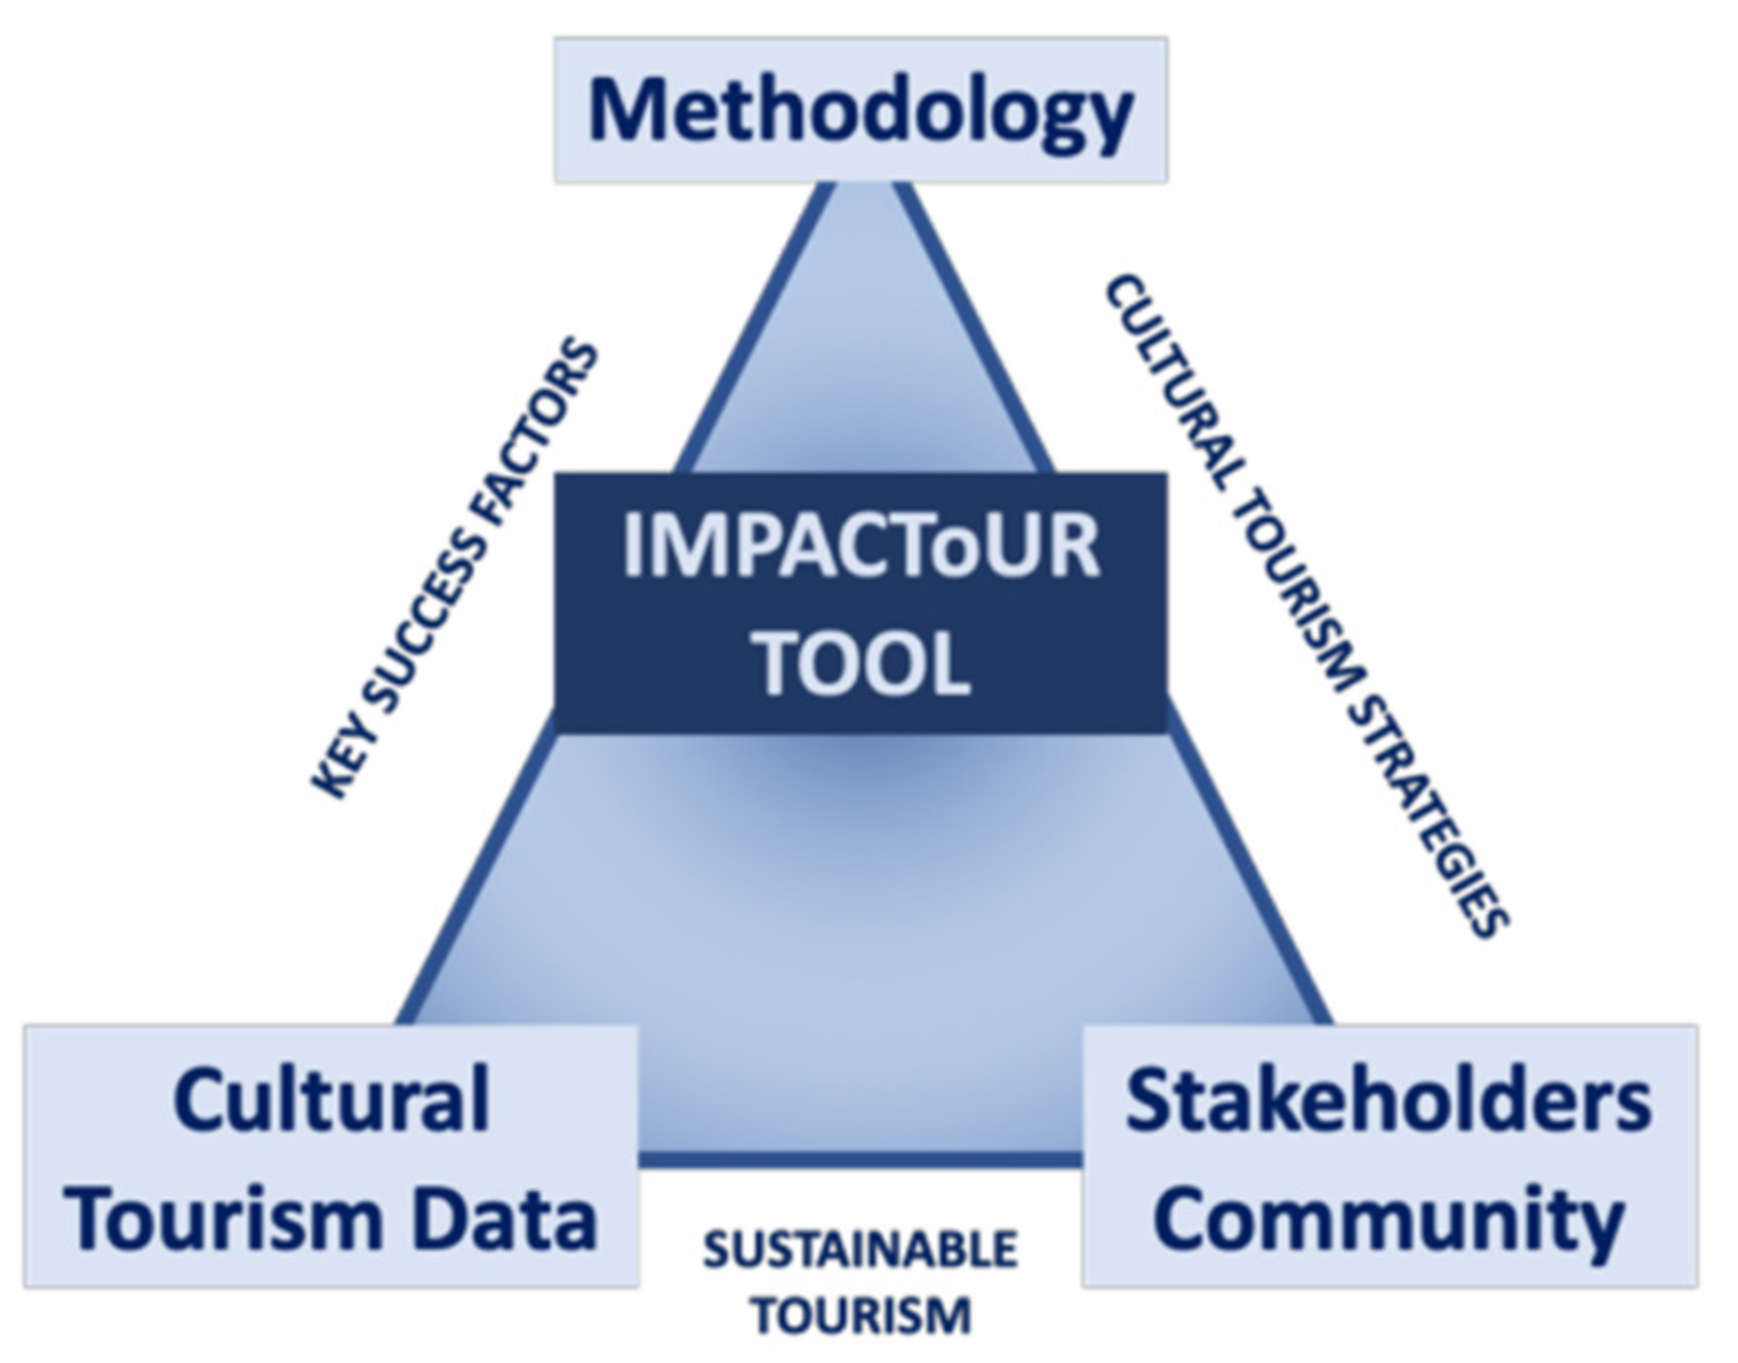
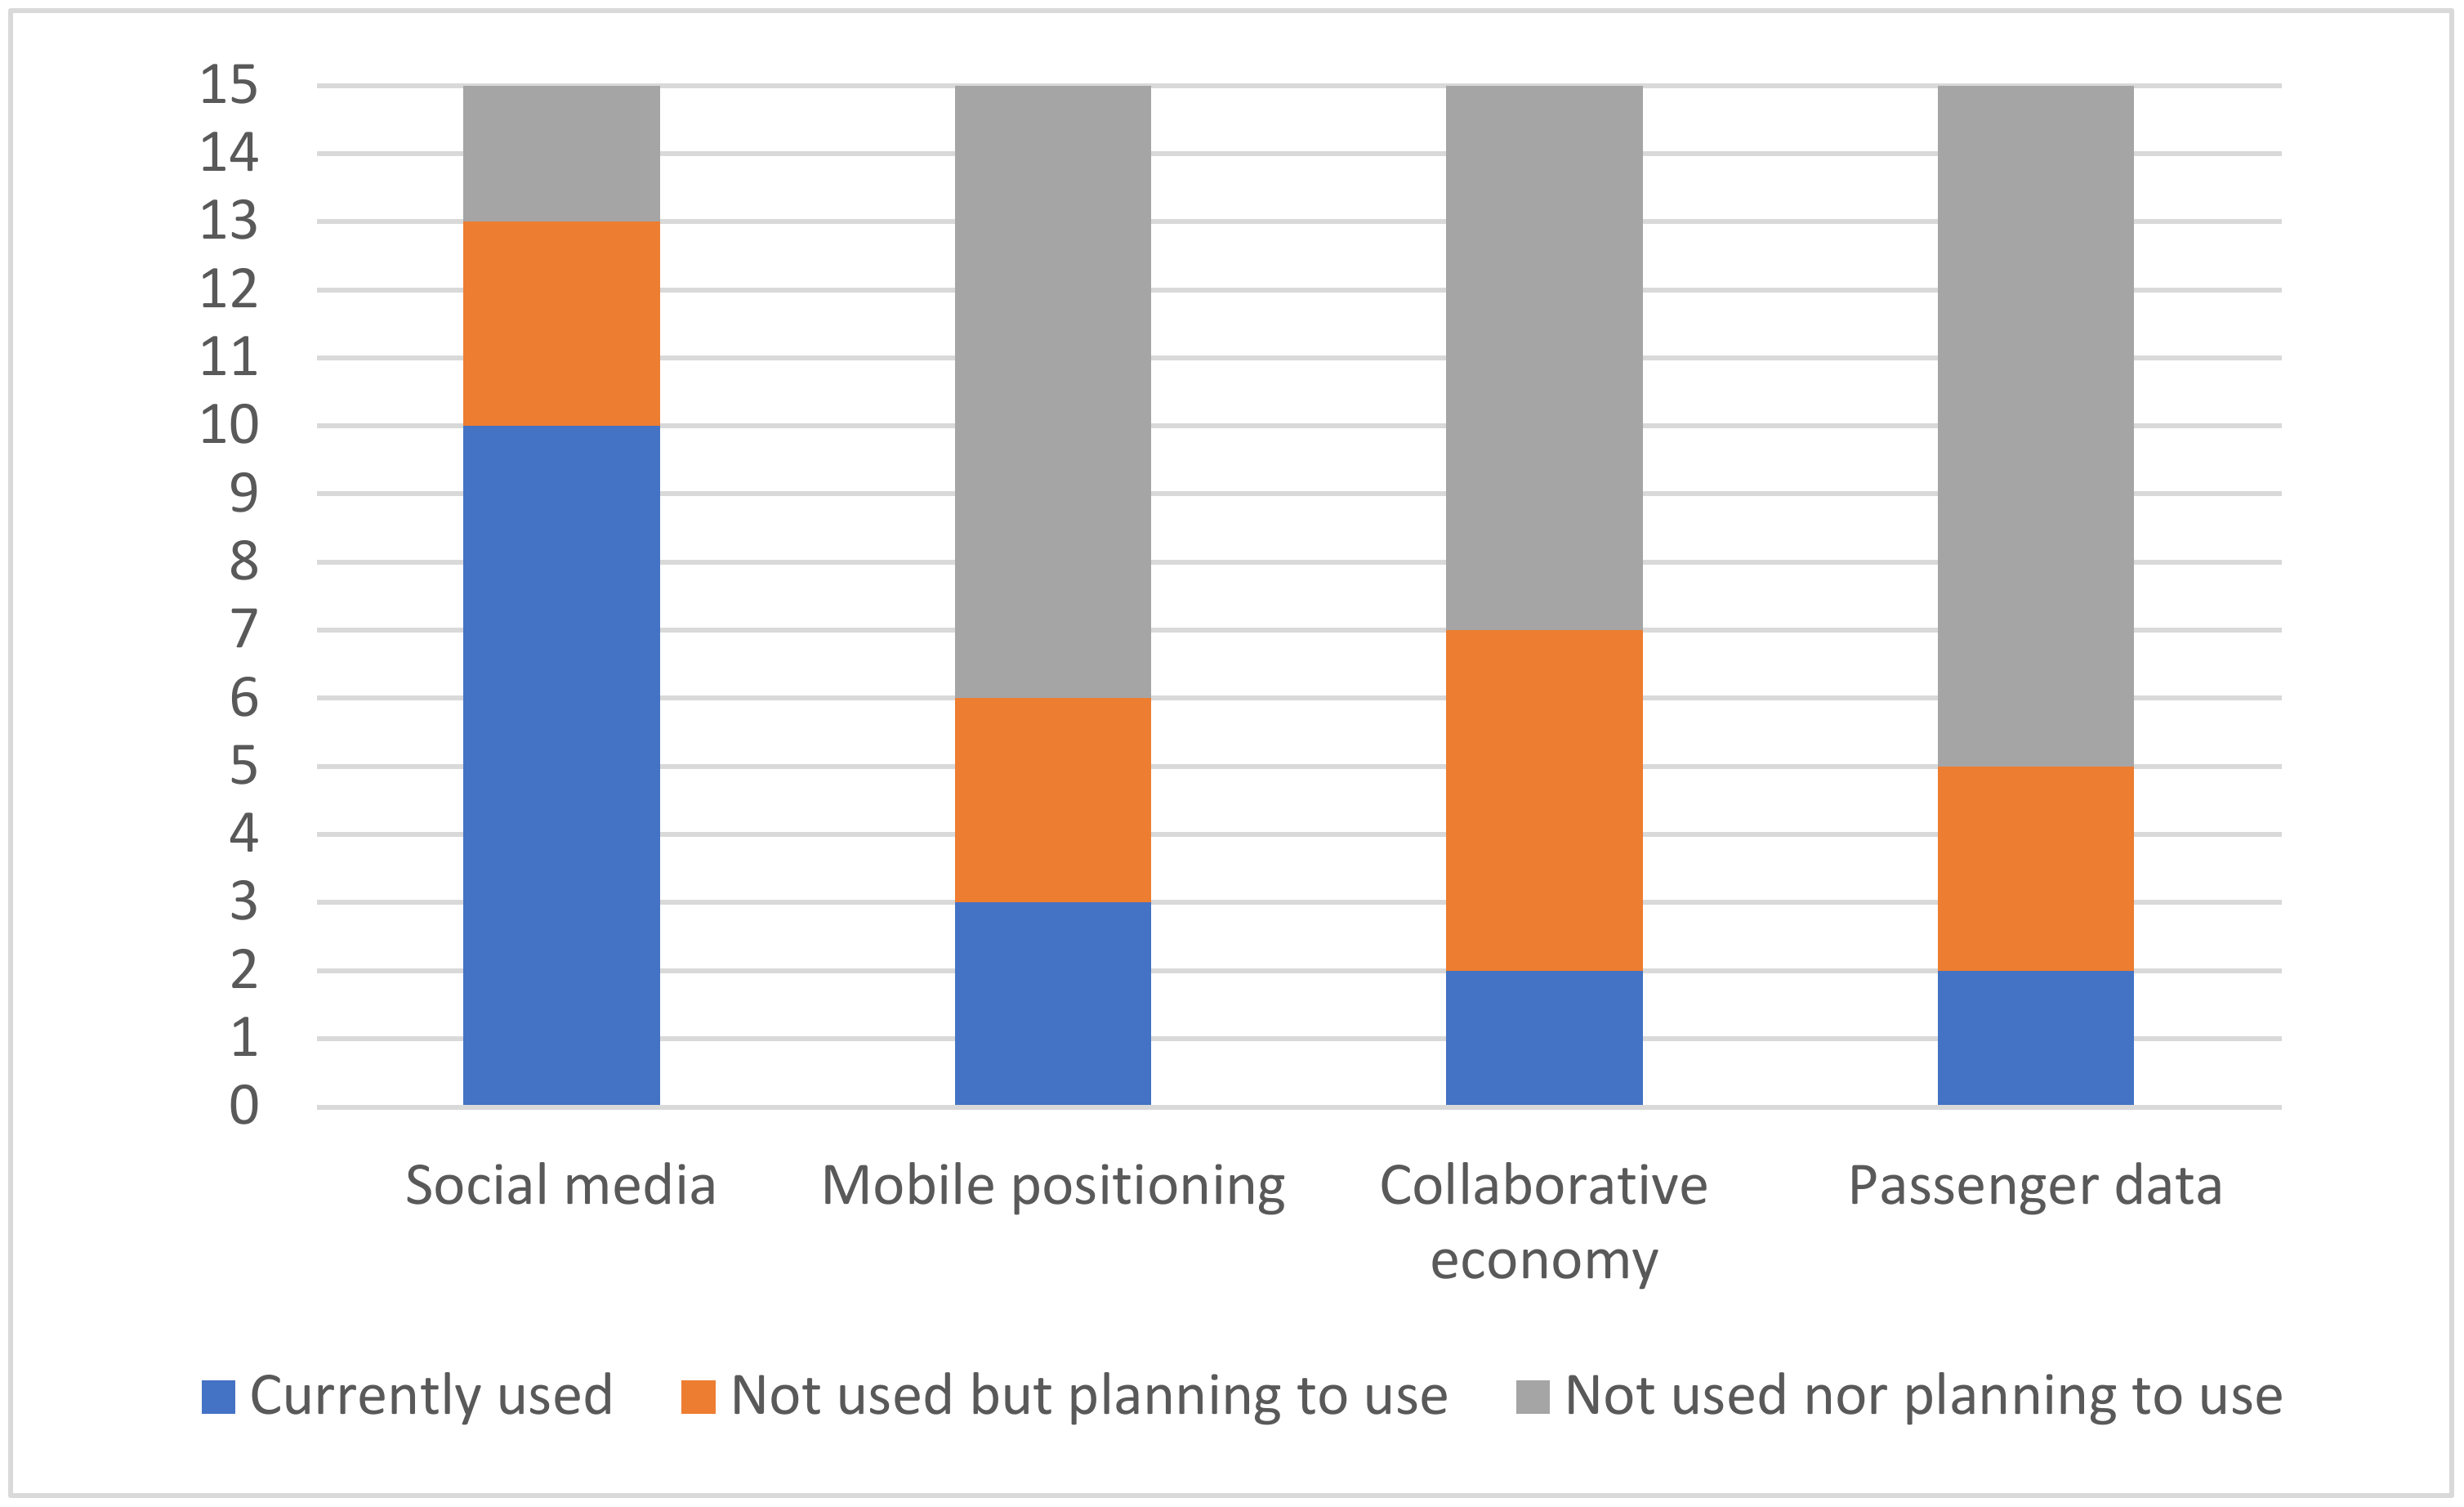
Table 1.
Potential of big data for tourism statistics.
| Strengths and Opportunities | Weaknesses and Threats |
|---|---|
| Big data: Immense volume of data, potentially (close to) real time, processable at a relatively low cost, geographical granularity, benefits of mobile positioning data demonstrated. | Complexity, quality, and unstructured nature of data, access to some key data sources restricted, concepts and definitions sometimes different for similar data sources, |
| Open data: Increasing availability, favorable conditions to use data, APIs (application programming interfaces). | |
| Applications: New indicators, cross-border dimension (e.g., to govern cultural routes), co-creation of analytical tools and public services, predictive analytics, appealing visualization to communicate messages, major expectations regarding benefits by stakeholders, rapid developments regarding tools, benefits of mobile positioning data demonstrated. | Need for interdisciplinary skills for the development, stakeholder collaboration, privacy protection, ethical issues, legislative gaps to access the data, cultural tourism specific aspects difficult to extract. |
Table 2.
Overview of IMPACTOUR pilot sites.
| Pilot Name | Country | Population | Area | Nature of Region | Nature of Cultural Tourism |
|---|---|---|---|---|---|
| Aldeia dos Biscoitos | Portugal | 1400 | 27 km2 | Civil parish on the Terceira island in the Azores | Historic-cultural and religious sites, events and festivals, wine tourism |
| Camino de Santiago (municipality of Sahagún) | Spain | 2800 | 124 km2 | Rural municipality on the Camino de Santiago pilgrimage route | Mostly religious-spiritual, but also historical-artistic, gastronomic, and enological |
| Chemin d’Arles (region of Occitania) | France-Spain | 5,900,000 | 72,724 km2 | Region on the Camino de Santiago pilgrimage route | Mostly religious-spiritual, but also historical-artistic, gastronomic, and enological |
| Chemin de Compostelle en Aveyron | France | 280,000 | 8735 km2 | Department on the Camino de Santiago pilgrimage route | Mostly religious-spiritual, but also historical-artistic, gastronomic, and enological |
| Kyperounta | Cyprus | 1500 | 11 km2 | Mountain village, mainly agricultural | Architecture, religious monuments, cultural events, gastronomy, and wine |
| Municipio 2 di Milano | Italy | 155,000 | 13 km2 | Urban administrative zone | Historical architecture, parks |
| Palentian romanesque (Aguilar de Campoo municipality) | Spain | 6800 | 237 km2 | Municipality on the Northern Way of Camino de Santiago | Artistic and cultural heritage, festivals, and sports |
| Route of the Romanesque (Sousa, Tâmega and Douro) | Portugal | 520,000 | 1988 km2 | Region with rich nature between the coast and the northern interior of Portugal | Outdoor sports, religious tourism, gastronomy, and wine |
| Route of the Romanesque (Saxony-Anhalt) | Germany | 2,400,000 | 20,446 km2 | Primarily agricultural region | Historical-cultural sites, music events, and festivals |
| Sassi (city of Matera) | Italy | 60,500 | 390 km2 | City in Southern Italy, UNESCO World Heritage site | Historical-cultural, most prominently the historical Sassi districts |
| Tartu county | Estonia | 153,300 | 3349 km2 | Region in the South of Estonia encompassing the city and county of Tartu | Historical-cultural heritage including Russian Old Believers and Estonian peasant cultures, festivals, and fairs |
| Trebinje | Bosnia-Herzegovina | 9313 | 904 km2 | Border city in the southernmost part of the Republic of Srpska region in Bosnia-Herzegovina | Cultural heritage, Old Town, events, and festivals |
| Trikala Prefecture | Greece | 131,085 | 3376 km2 | Rural region in the north-western part of Thessaly | Religious-cultural and archaeological sites, gastronomic tourism, festivals |
| Vidzeme | Latvia | 1,000,000 | 19,792 km2 | Socio-cultural region encompassing the capital Riga and the surrounding area | Heritage sites, coastal pilgrimage route, gastronomy, festivals |
| Võru county | Estonia | 36,133 | 2733 km2 | Rural region in South of Estonia | Distinct cultural heritage of the Seto and Võro people, folk traditions, food, and festivals |
Table 3.
Summary of advantages and barriers of novel data sources.
| Data Source | Usage Potential in Cultural Tourism | Advantages | Barriers |
|---|---|---|---|
| Mobile positioning data | Provides detailed information on tourism flows and mobility patterns (including geographic and seasonal). This helps monitor tourists’ interest in specific cultural attractions and trajectories of their visits. | Collected automatically, highly representative of population. High level of temporal and spatial detail. Captures same-day visitors. Captures visitors using sharing/collaborative economy services. Existing replicable usage models. | Differences in phone use. Lack of qualitative information. Legal restrictions (privacy regulations), ethical issues. Business confidentiality concerns. Public fears of being tracked. |
| Big data from social media and web use | Provides information on tourism flows, visitors’ usage, and perceptions of tourism attractions, enables prediction of tourists’ decisions regarding certain sites—useful for managing cultural tourism sites, discovering emerging interests, marketing and suggesting itineraries based on tourists’ interests. | Includes qualitative information. Data often available in real time, Commonly easily accessible online at low or no cost. Few legal restrictions on use. Relatively high data reliability. | Data may not be available in machine-readable formats. Issues with representativeness and platform bias. Usage still in experimental stage. Ethical issues. |
| Passenger data (e.g., road sensors, GPS) | Provides information on tourist mobility patterns, enables monitoring traffic to specific cultural sites, helps plan new cultural tourism facilities. | Data generated automatically. Captures same-day visitors. Allows identifying different facilities of interest to the target group. Allows monitoring main border-crossing points and share of returning visitors. | Data often proprietary. Difficult to distinguish between local and tourist traffic. Requires investment in technical infrastructure and interoperability. Requires combination with additional data sources. Ethical issues |
| Data from sharing and collaborative economy (e.g. accommodation, rideshare) | Provides information on visitors’ mobility and consumption not captured in official tourism statistics; data from ridesharing platforms could help cultural tourism planners acquire more detailed data on visits to specific cultural sites. | Enables monitoring of movement and consumption of tourists not using traditional accommodation and transportation services. High volumes of data at detailed geographical level. Increasingly important data source due to increasing use. | Predominantly proprietary data. Data not easily accessible (access often facilitated by third parties). Requires high-quality predictive models to support information selection. Ethical issues. |
© 2020 by the authors. Licensee MDPI, Basel, Switzerland. This article is an open access article distributed under the terms and conditions of the Creative Commons Attribution (CC BY) license (http://creativecommons.org/licenses/by/4.0/).
Share and Cite
MDPI and ACS Style
Kalvet, T.; Olesk, M.; Tiits, M.; Raun, J. Innovative Tools for Tourism and Cultural Tourism Impact Assessment. Sustainability 2020, 12, 7470. https://doi.org/10.3390/su12187470
AMA Style
Kalvet T, Olesk M, Tiits M, Raun J. Innovative Tools for Tourism and Cultural Tourism Impact Assessment. Sustainability. 2020; 12(18):7470. https://doi.org/10.3390/su12187470
Chicago/Turabian StyleKalvet, Tarmo, Maarja Olesk, Marek Tiits, and Janika Raun. 2020. "Innovative Tools for Tourism and Cultural Tourism Impact Assessment" Sustainability 12, no. 18: 7470. https://doi.org/10.3390/su12187470
Note that from the first issue of 2016, this journal uses article numbers instead of page numbers. See further details here.