Article

A Mixed Integer Linear Programming Based Load Shedding Technique for Improving the Sustainability of Islanded Distribution Systems

by
Sohail Sarwar
1,
Hazlie Mokhlis
1,*,
Mohamadariff Othman
1,
Munir Azam Muhammad
1,
J. A. Laghari
2,
Nurulafiqah Nadzirah Mansor
1,
Hasmaini Mohamad
3 and
Alireza Pourdaryaei
1,4
1
Department of Electrical Engineering, Faculty of Engineering, University of Malaya, Kuala Lumpur 50603, Malaysia
2
Department of Electrical Engineering, Quaid-e-Awam University of Engineering Science and Technology, Nawabshah, Sindh 67480, Pakistan
3
Faculty of Electrical Engineering, University of Technology Mara, Shah Alam 40450, Malaysia
4
Department of Electrical and Computer Engineering, University of Hormozgan, Bandar Abbas 7916193145, Iran
*
Author to whom correspondence should be addressed.
Sustainability 2020, 12(15), 6234; https://doi.org/10.3390/su12156234
Submission received: 22 June 2020 / Revised: 21 July 2020 / Accepted: 29 July 2020 / Published: 3 August 2020
(This article belongs to the Section Energy Sustainability)

Abstract

:
In recent years significant changes in climate have pivoted the distribution system towards renewable energy, particularly through distributed generators (DGs). Although DGs offer many benefits to the distribution system, their integration affects the stability of the system, which could lead to blackout when the grid is disconnected. The system frequency will drop drastically if DG generation capacity is less than the total load demand in the network. In order to sustain the system stability, under-frequency load shedding (UFLS) is inevitable. The common approach of load shedding sheds random loads until the system’s frequency is recovered. Random and sequential selection results in excessive load shedding, which in turn causes frequency overshoot. In this regard, this paper proposes an efficient load shedding technique for islanded distribution systems. This technique utilizes a voltage stability index to rank the unstable loads for load shedding. In the proposed method, the power imbalance is computed using the swing equation incorporating frequency value. Mixed integer linear programming (MILP) optimization produces optimal load shedding strategy based on the priority of the loads (i.e., non-critical, semi-critical, and critical) and the load ranking from the voltage stability index of loads. The effectiveness of the proposed scheme is tested on two test systems, i.e., a 28-bus system that is a part of the Malaysian distribution network and the IEEE 69-bus system, using PSCAD/EMTDC. Results obtained prove the effectiveness of the proposed technique in quickly stabilizing the system’s frequency without frequency overshoot by disconnecting unstable non-critical loads on priority. Furthermore, results show that the proposed technique is superior to other adaptive techniques because it increases the sustainability by reducing the load shed amount and avoiding overshoot in system frequency.

1. Introduction

The electrical power system is at the epicenter of any country’s economic development. Conventionally, electricity is generated in bulk from fossil fuels and transmitted to consumers. This convention ensures security of supply and reliability; however, it is the cause of one-third of world’s total greenhouse gas (GHC) emissions [1]. Alternatively, renewable energy resources (RES) generate emission-free electrical power and are projected to reduce GHG emissions to less than 80% by the year 2050 [2]. In addition, GHG emission and electricity consumption are correlated in which a one-degree increment in ambient temperature due to emissions will result in an increase in electricity consumption per person between 0.5% and 0.85% [3]. This phenomenon is one of the driving forces behind the inclination towards the integration of distributed generators (DGs) based on renewable sources to achieve universal energy access by 2030 [4,5].
Despite numerous advantages, DGs have their own limitations [6]. A grid-connected DG usually has as its capacity less than the total load demand of the network. Frequency instability is a common occurrence in the event of islanded operation of the DG, which affects consumers downstream [7,8]. However, load shedding can be initiated to prevent further blackout [9]. Conventional load shedding entails disconnecting predefined loads from the power supply through under-frequency relay [10]. The setting of the relay depends on the degree to which the frequency has declined [11,12]. Adaptive settings for under-frequency relay settings were proposed in [13]. This technique optimizes the frequency setpoint, time delay, and load shed amount for each step using mixed-integer linear programming. However, it can be observed from the result that the load shedding technique performs excessive disconnection of the load that causes overshoot in the frequency response. On the other hand, semi-adaptive load shedding involves calculating the power imbalance using frequency response to determine the appropriate number of loads to be shed. This is achieved by calculating the second derivative of the frequency based on Newton’s method approximation [14,15]. The system frequency response identified from phasor measurement units is used in [16] to form a new multistage load shedding scheme. Imperialist competitive algorithm, an application of evolutionary programming, evaluates the estimates of the load to be shed. This technique analyzes the under- or over-shedding in multiple stages to validate the recovery level of the system frequency. Although these previous schemes improve the frequency response and open up new paths for load shedding, predetermined frequency thresholds and sequential selection of loads result in un-optimized load shedding. Furthermore, the threshold value also needs to be changed when the system is upgraded.
Unlike conventional techniques, computational intelligence-based techniques can measure and predict the power imbalance more accurately and result in a better solution for load shedding. Hooshmand et al. [17] proposed such an adaptive technique for under-frequency load shedding (UFLS) using an artificial neural network (ANN). The ANN model together with appropriate data analysis is capable of minimizing load shedding compared to conventional techniques in steps of 10%, 20%, and 25% of the total load with 0.1 s of delay in each step. This technique opened a new frontier for UFLS techniques for the researchers. Instantaneous and average rate of change of system frequency is used in another technique to train the ANN network. Load equal to the value of the calculated power imbalance is shed from the system using a relay in [18]. A new method for load shedding was also proposed in [19] using ANN and a hybrid co-evolutionary algorithm, culture-particle swarm optimization. The scheme produces a more accurate solution in a faster time compared to the conventional schemes. Additionally, the scheme calculates the active as well as reactive power to be shed in each predefined step. Monte Carlo Simulation (MCS) is also employed for the load shedding problem in [20] to find generation deficiency to shed the loads accordingly using four different load shedding scenarios, i.e., increasing, decreasing, equal block, and a sandwich plan employing predefined frequency relay setting in five steps. The employment of fuzzy logic for accurate measurement of the power imbalance has also gained traction in the past. A fuzzy-based load shedding scheme for a small university distribution system is implemented in [21]. UFLS-based on fuzzy logic is tested for a steam-driven sugar industry plant in which steam input and frequency deviation are considered as the inputs. The algorithm generates two-layer outputs that decide loads to be shed on load cluster and number of loads. The method minimizes the load shed in comparison to conventional UFLS in [22]. The distribution state estimator in [23] measures the power consumption on each bus using historical data and load flow analysis. Event and frequency calculator modules are used to estimate the power imbalance, and loads are shed one by one, according to the priority for a distribution test system of 102 buses.
From the above literature review of various schemes for UFLS, it is evident that forecast of power imbalance using ANN, MCS, and fuzzy logic anticipates more accurate estimates. However, load shedding is executed in a conventional approach that results in an overshoot in the system frequency response (SFR) due to excessive load shedding. Prioritized selection of non-critical or more unstable loads is a better alternative to the conventional approach of sequential selection. Location and the type of disturbance have a significant effect on system stability and load shedding [24], which was not investigated in the techniques discussed above. The stability index of loads for different disturbances is a vital factor; a study in [25] showed that prioritization of loads utilizing fuzzy logic considering social, economic, or political aspects of connected loads can further improve the response. Estimation of stability indices of loads [26,27] to prefer unstable loads for shedding results in an improved voltage profile of the system, avoiding operation of undervoltage protection. Sequential selection of loads in [26,27] results in frequency overshoot due to excessive shedding, despite prioritizing the loads. Therefore, finding an optimal combination of loads to be shed is an alternative approach to sequential selection.
In order to improve the frequency response, the combination selection approach based on an exhaustive search was proposed to find the best combination that matches the power imbalance in the system [28]. However, this technique is only suitable for a small number of loads in the system, since it will be time-consuming for a larger-scale system. In [29], a meta-heuristic technique was used to find the best combination of random priority loads. The technique takes more time to find the optimal solution, especially when the number of loads is increased.
In view of the aspects discussed above, it can be summarized that conventional techniques result in excessive load shedding due to predefined relay settings, whereas the practical implementation of computational intelligence-based techniques is still questionable for utility grids [30]. On the other hand, UFLS techniques based on the stability index increase the voltage stability by detaching the more unstable loads on priority. However, sequential selection of unstable loads hinders the accuracy of such techniques and produces overshoot in frequency. Therefore, a new efficient load shedding scheme is proposed in this paper. The optimal load combination from unstable non-critical and semi-critical loads is found using mixed-integer linear programming (MILP) optimization. The main contributions of this paper are:
The reliability of the system is increased by prioritized selection of non-critical loads to ensure supply to semi-critical and critical loads, although load shedding is initiated.
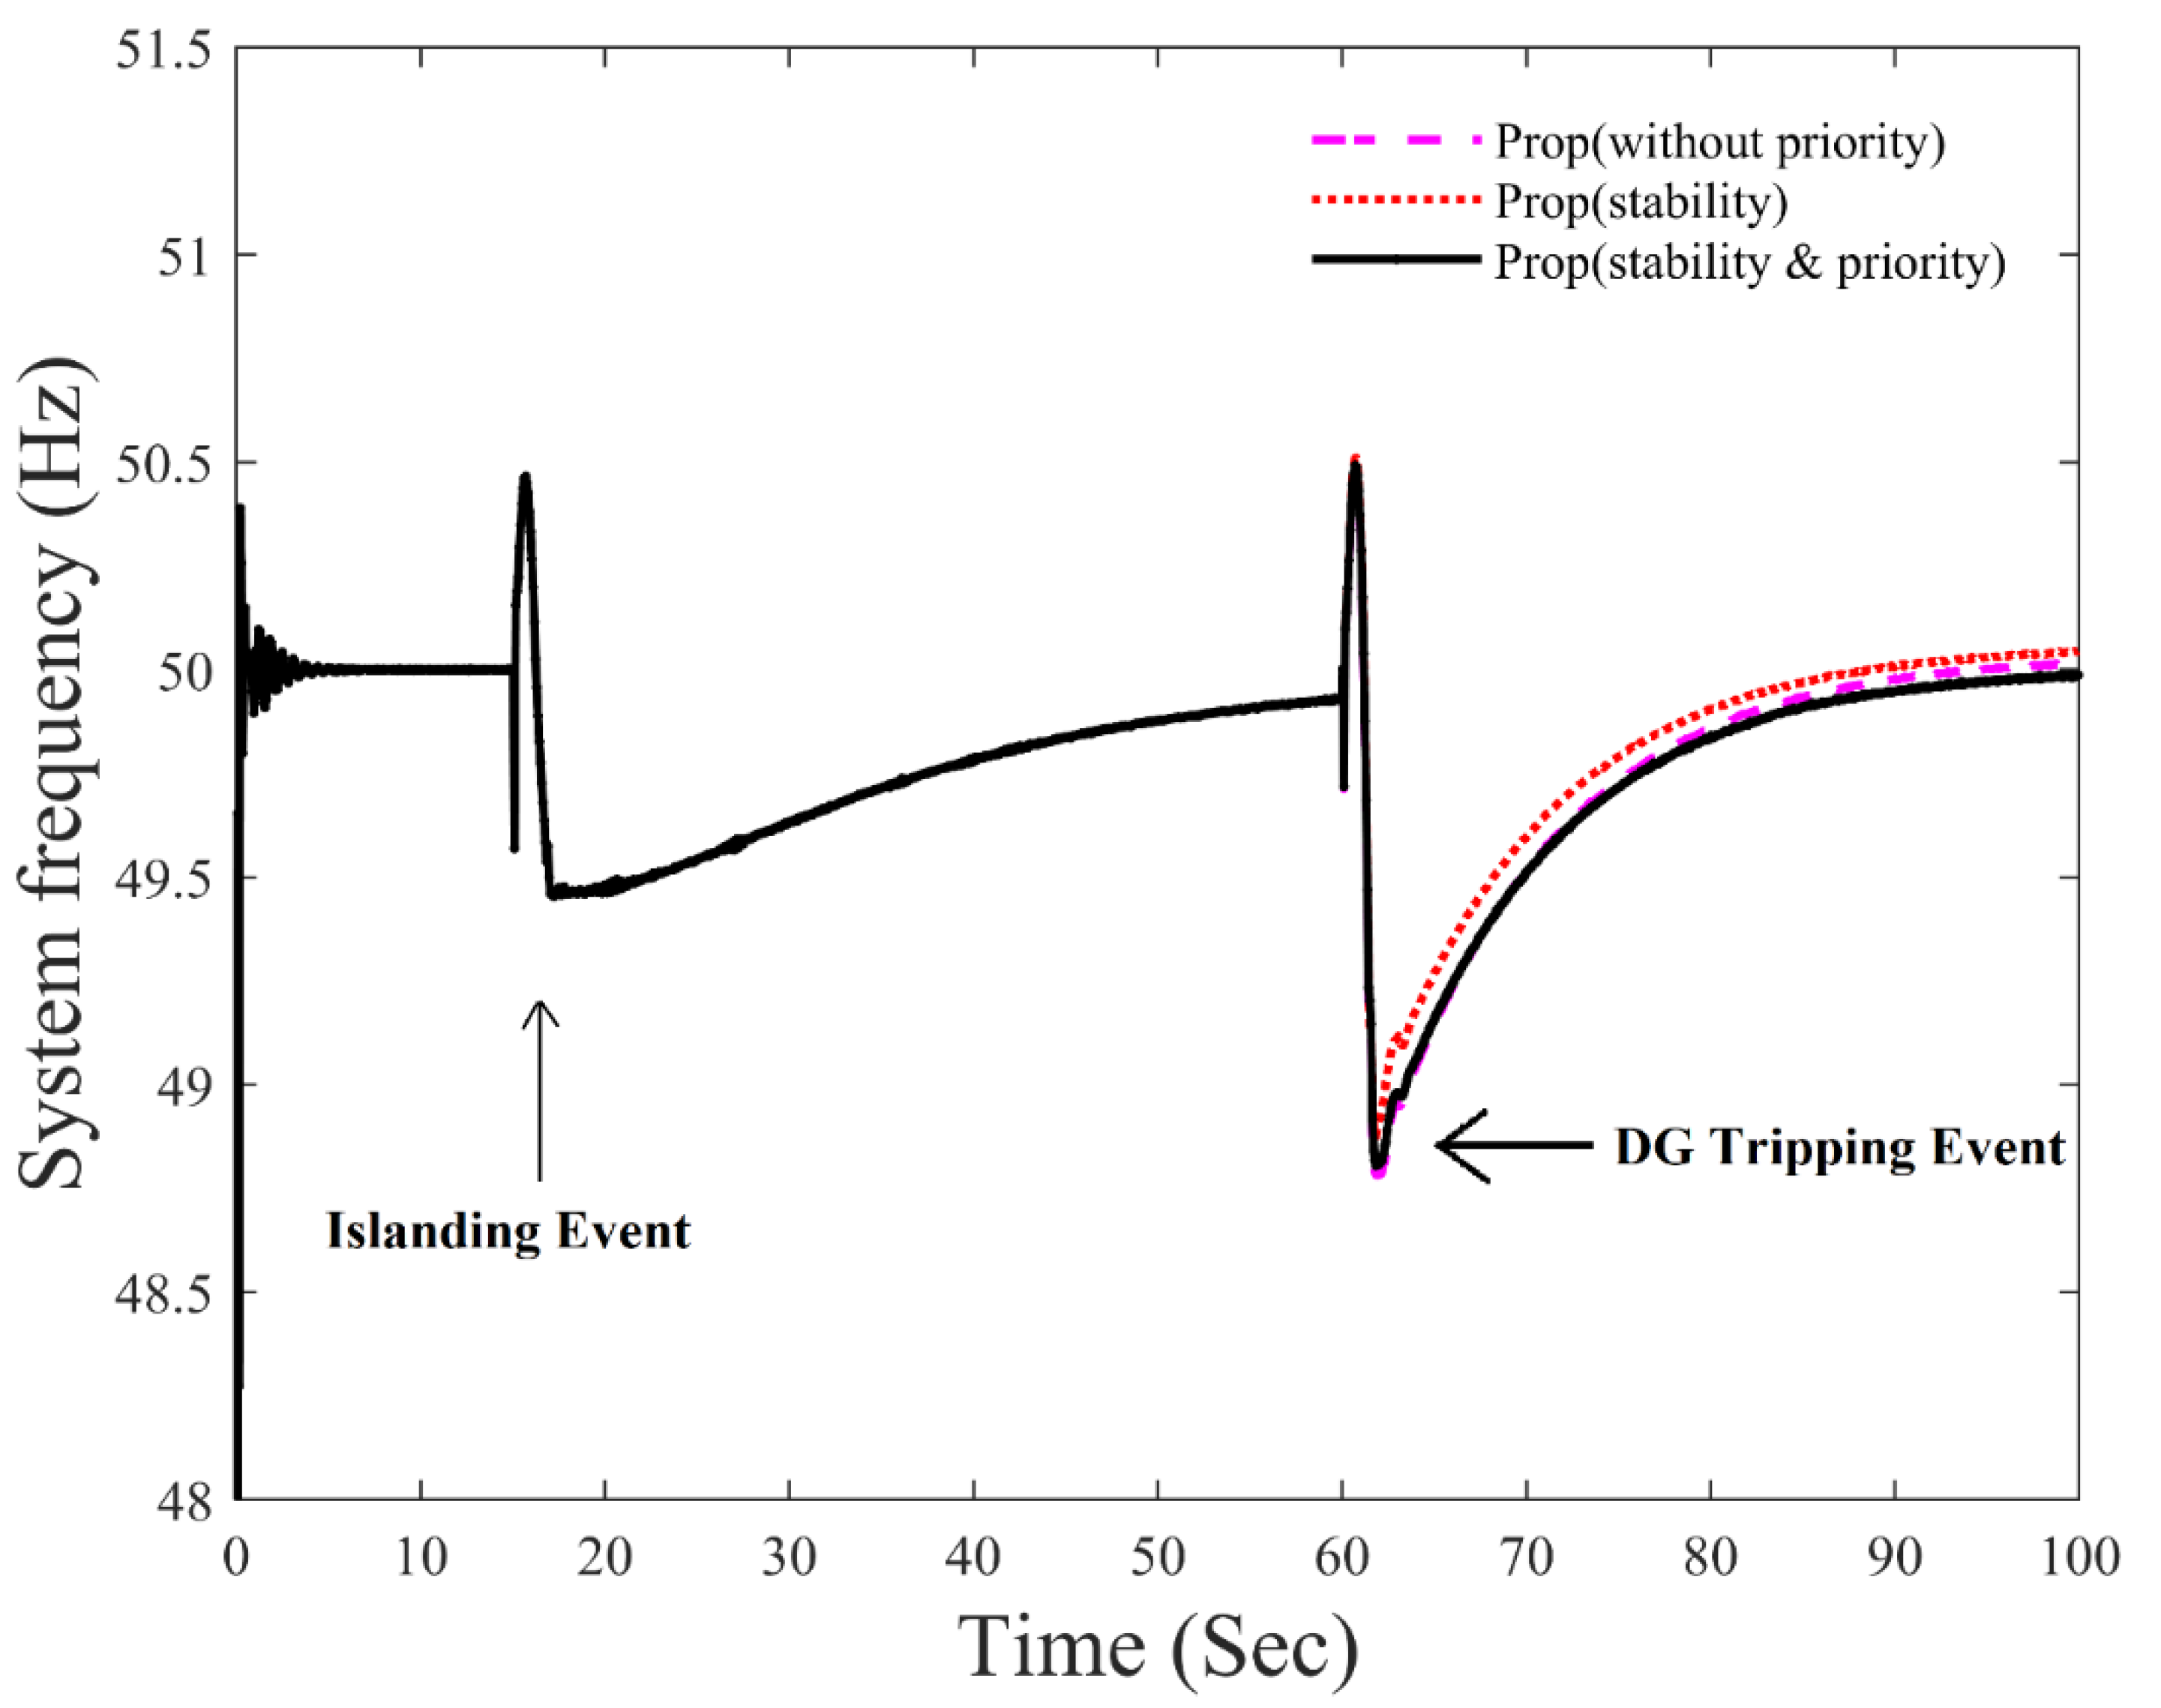
  • The stability of the system voltage and frequency is improved by prioritizing the loads based on their stability index so that more unstable load buses are disconnected on priority.
  • Mathematical modeling-based strategy for optimal selection of loads from unstable and non-critical loads to be shed using MILP to improve frequency response with minimum frequency overshoot during islanded operation of the distribution system connected with the DGs.
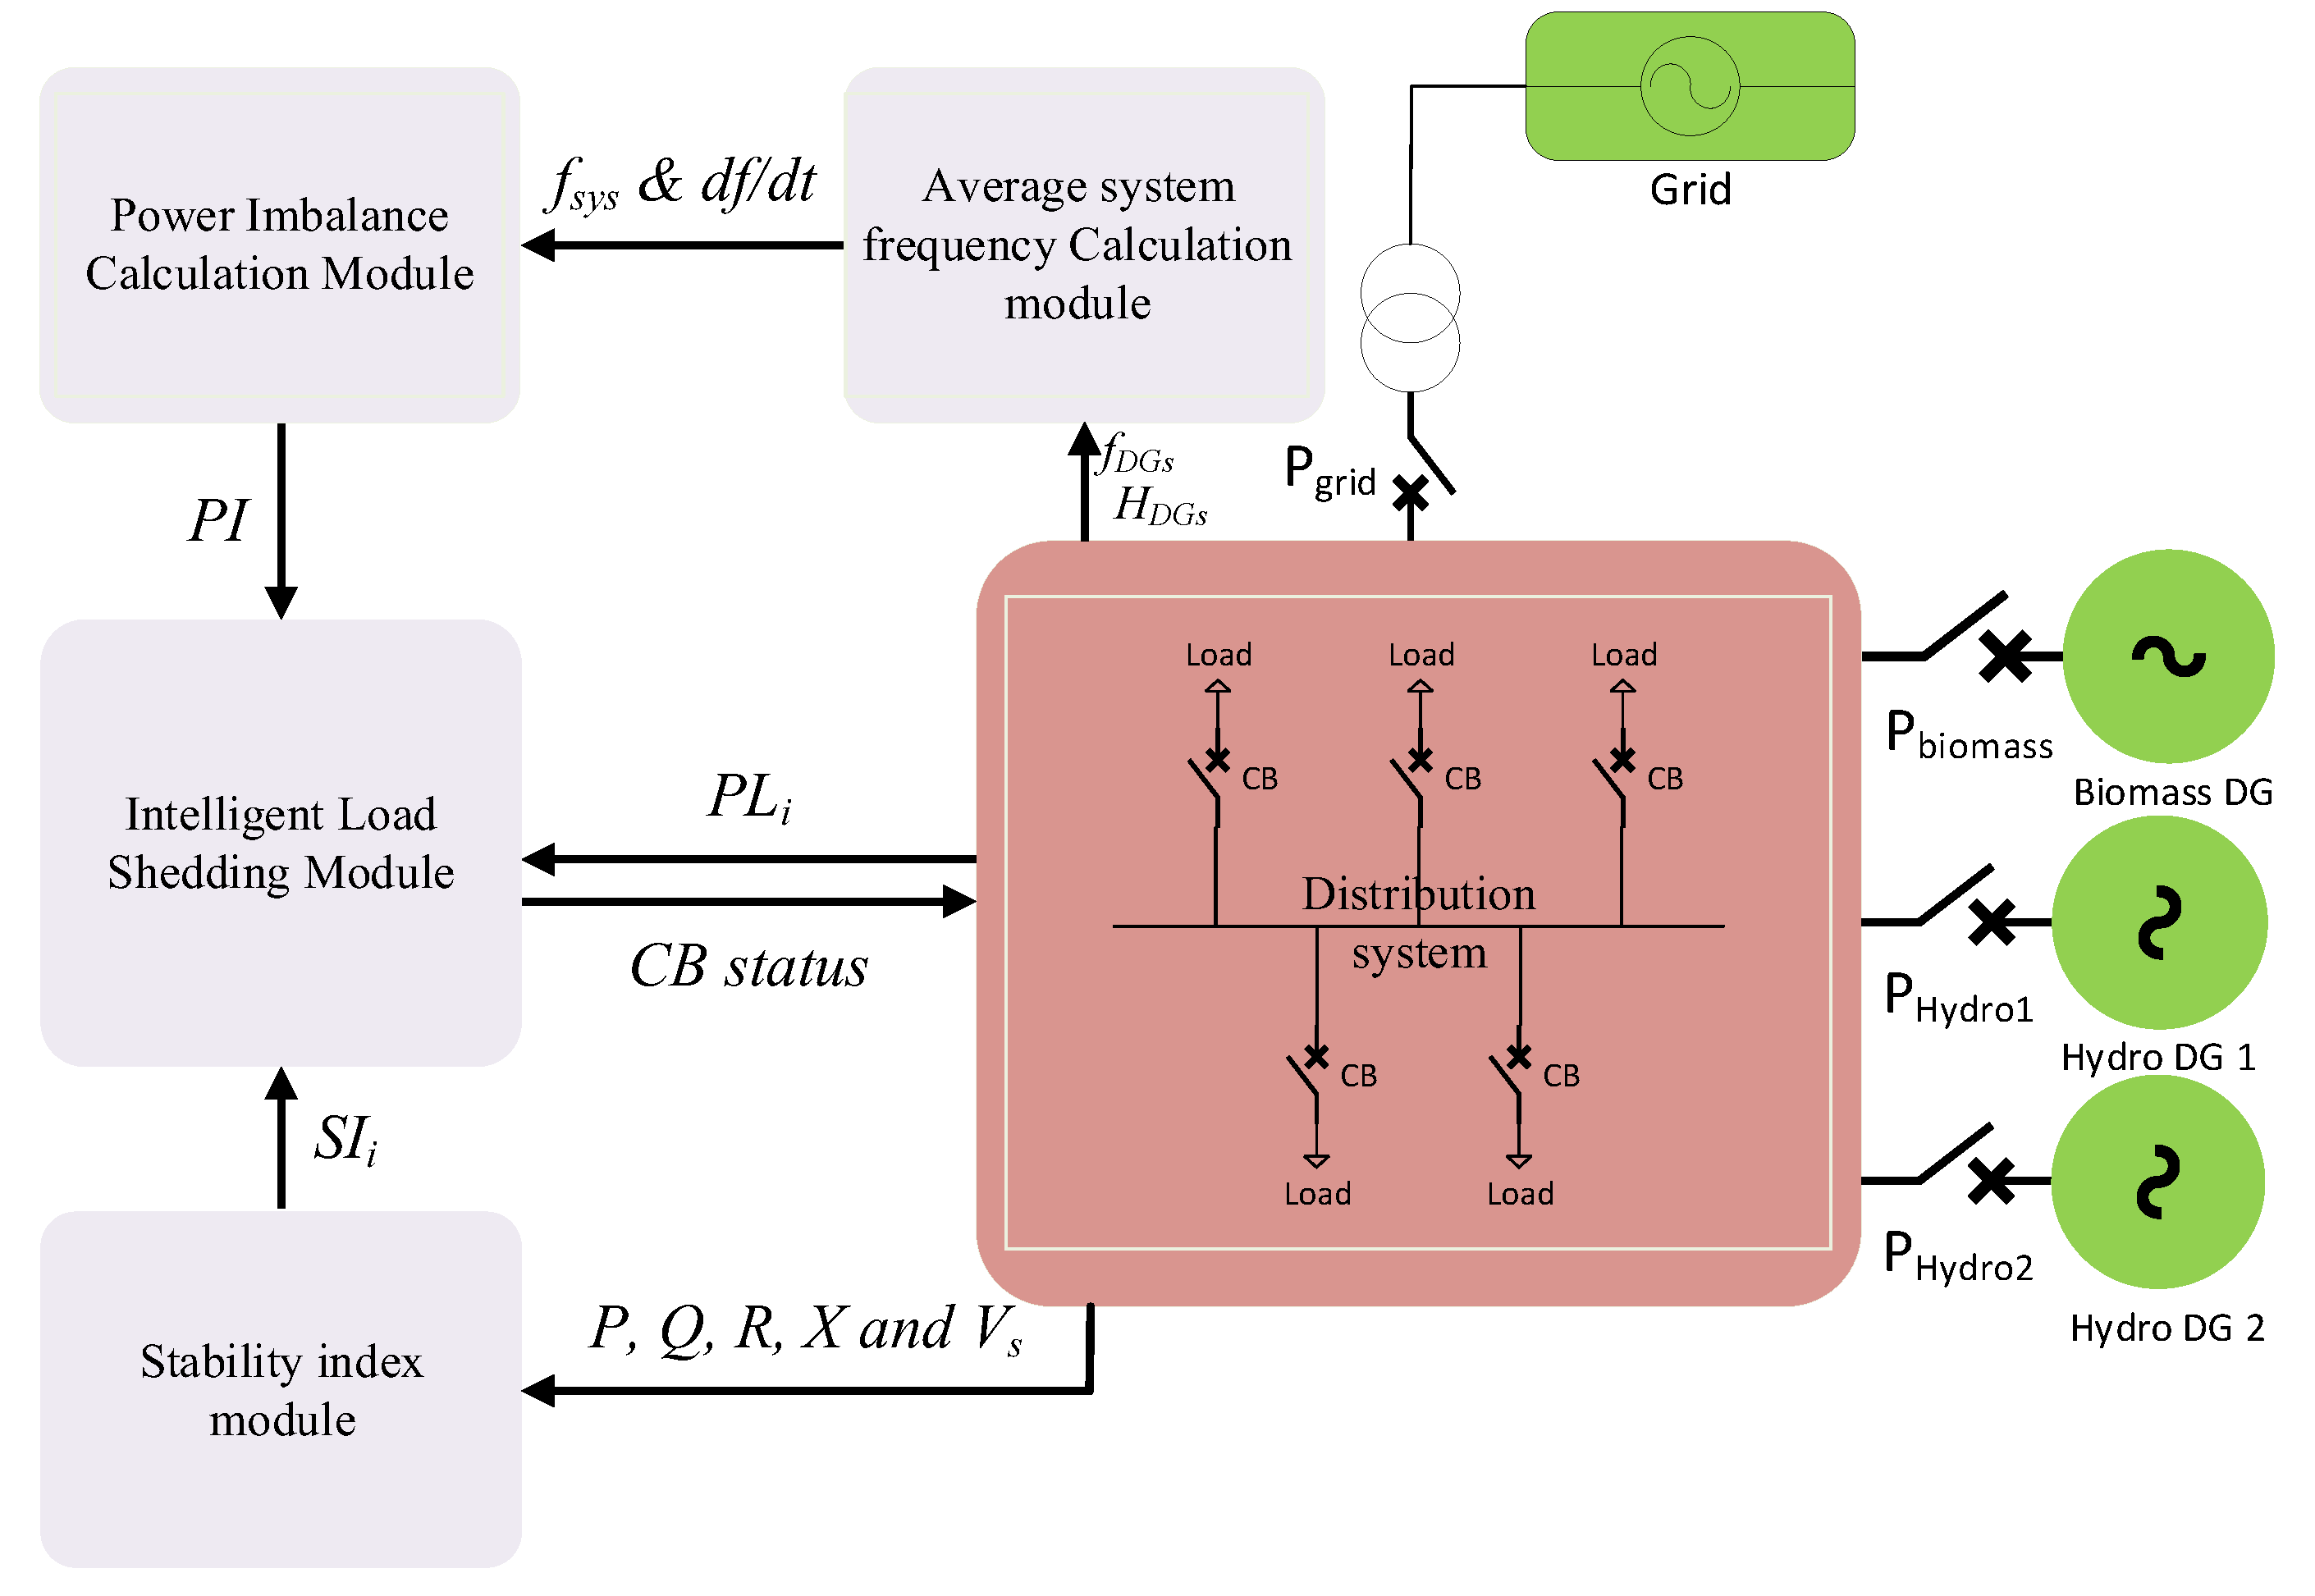
The rest of this paper is arranged as follows: Section 2 demonstrates the proposed methodology and Section 3 explains the modeling of the system under observation. Results and Discussions are illustrated in Section 4 and Section 5. Section 6 concludes the research paper.

2. Methodology

This research aims to propose a new UFLS technique that yields an optimal solution for the frequency stabilization of an islanded distribution system. The working principle of the proposed technique is explained in a block diagram shown in Figure 1. The proposed technique in this paper comprises four modules:
  • Average system frequency calculation module
  • Power imbalance calculation module
  • Stability index calculation module
  • Intelligent load shedding module
The working of all above modules is explained in the following sections.

2.1. Average System Frequency Calculation Module

The basic parameter of any load shedding scheme is frequency. In grid-connected mode, the grid controls the system frequency with DGs supplying some of the load demands. However, in islanded mode, the system frequency will behave abnormally. Furthermore, the inertia constant, spinning reserve, and turbine control mechanism of each DG further alter the system frequency. Thus, an average system frequency needs to be considered during islanded mode as presented in Equation (1):
f s y s = i = 1 M H i f i i = 1 M H i ,
where Hi is the inertia constant of the ith generator in seconds, fi is the frequency of the ith generator, and M is the number of DGs connected in the system. The rate of change of system frequency is evaluated from the derivative of fsys. This decaying frequency information is used to calculate the power imbalance in the system.

2.2. Power Imbalance Calculation Module (PICM)

The PICM calculates the power imbalance in the system and subsequently the equivalent amount of load to be shed following any system changes that cause frequency drop. A grid-coupling circuit breaker continuously monitors the condition of the system and indicates an islanding event when it happens. In this case, the tripping of any circuit breaker coupling a DG to the distribution system in islanding condition is recorded as a DG-tripping event. The total power imbalance, ∆P in the system for such a scenario, is calculated using Equation (2), considering the spinning reserves of the generators.
Δ P = i = 1 N P L i ( z · P G r i d + i = 1 M P D G i ) ( 1 z ) · P S R
P in Equation (2) is the power imbalance of the system, N is the total number of loads in the system, M is the total number of DGs connected in the system, PGrid is the grid power, PLi is the real-time load value at bus i, PDGi is the total dispatched power of DGi and PSR is the total spinning reserves in the system, whereas z in the above equation is a binary variable to indicate the operational state of the distribution system. A value of 1 for variable z indicates grid-connected mode and 0 value indicates the islanded mode. Spinning reserves PSR is the total maximum capacity of the DGs at which they can operate without violating the frequency limits. These reserves must be utilized while designing load shedding schemes, which can be calculated by Equation (3).
P S R = i = 1 M M a x D G i i = 1 M P D G i
where MaxDGi is the maximum generation capacity of DGi. On the other hand, a sudden connection of loads into the stabled islanded distribution system may significantly change the system frequency, resulting in a power imbalance condition that might not be captured by Equation (3). In this regard, power imbalance ∆P in the system for such scenarios can be computed using the following equation:
Δ P = { ( 2 × i = 1 M H i f n ) × d ( f s y s ) d t }
where Hi is the inertia constant of the ith generator in seconds, fn is the nominal frequency, and d(fsys)/dt is the rate of change of the system frequency. This PICM can monitor all the changes in the system. The power imbalance threshold level is set to be equivalent to the smallest value of the active power load in the distribution system, which is 0.05 MW in the case studies, to avoid unnecessary activation of the load shedding scheme. In the case that the power imbalance is more than the set threshold level, the same power imbalance value will be passed over to the intelligent load shedding module (ILSM) for shedding of an equivalent amount of load. Moreover, this module will transmit an activation signal to the stability index calculation module (SICM) to estimate the stability indices of load buses.

2.3. Stability Index Calculation Module (SICM)

The stability index of a bus in a distribution system depends upon the connected load and the sending end voltage to that bus. Furthermore, it also depends upon the impedance of that distribution line [31]. This module will capture real-time sending end voltage, load, and impedance values of each bus when the activation signal from the PICM is received. The stability index for this scheme is calculated using Equation (5), which was proposed in [31] and utilized for load shedding in [27].
S I i = ( V s i ) 4 4 ( P i . R i Q i . X i ) 2 4 ( P i . X i Q i . R i ) . ( V s i ) 2
where SIi is stability index of the ith load bus, Pi, Qi, Ri, Xi, and Vsi are active power, reactive power, resistance, reactance, and sending end voltage, respectively, for the ith bus. The stability indices calculated in this module are then transmitted to the ILSM for activating optimal load shedding selection.

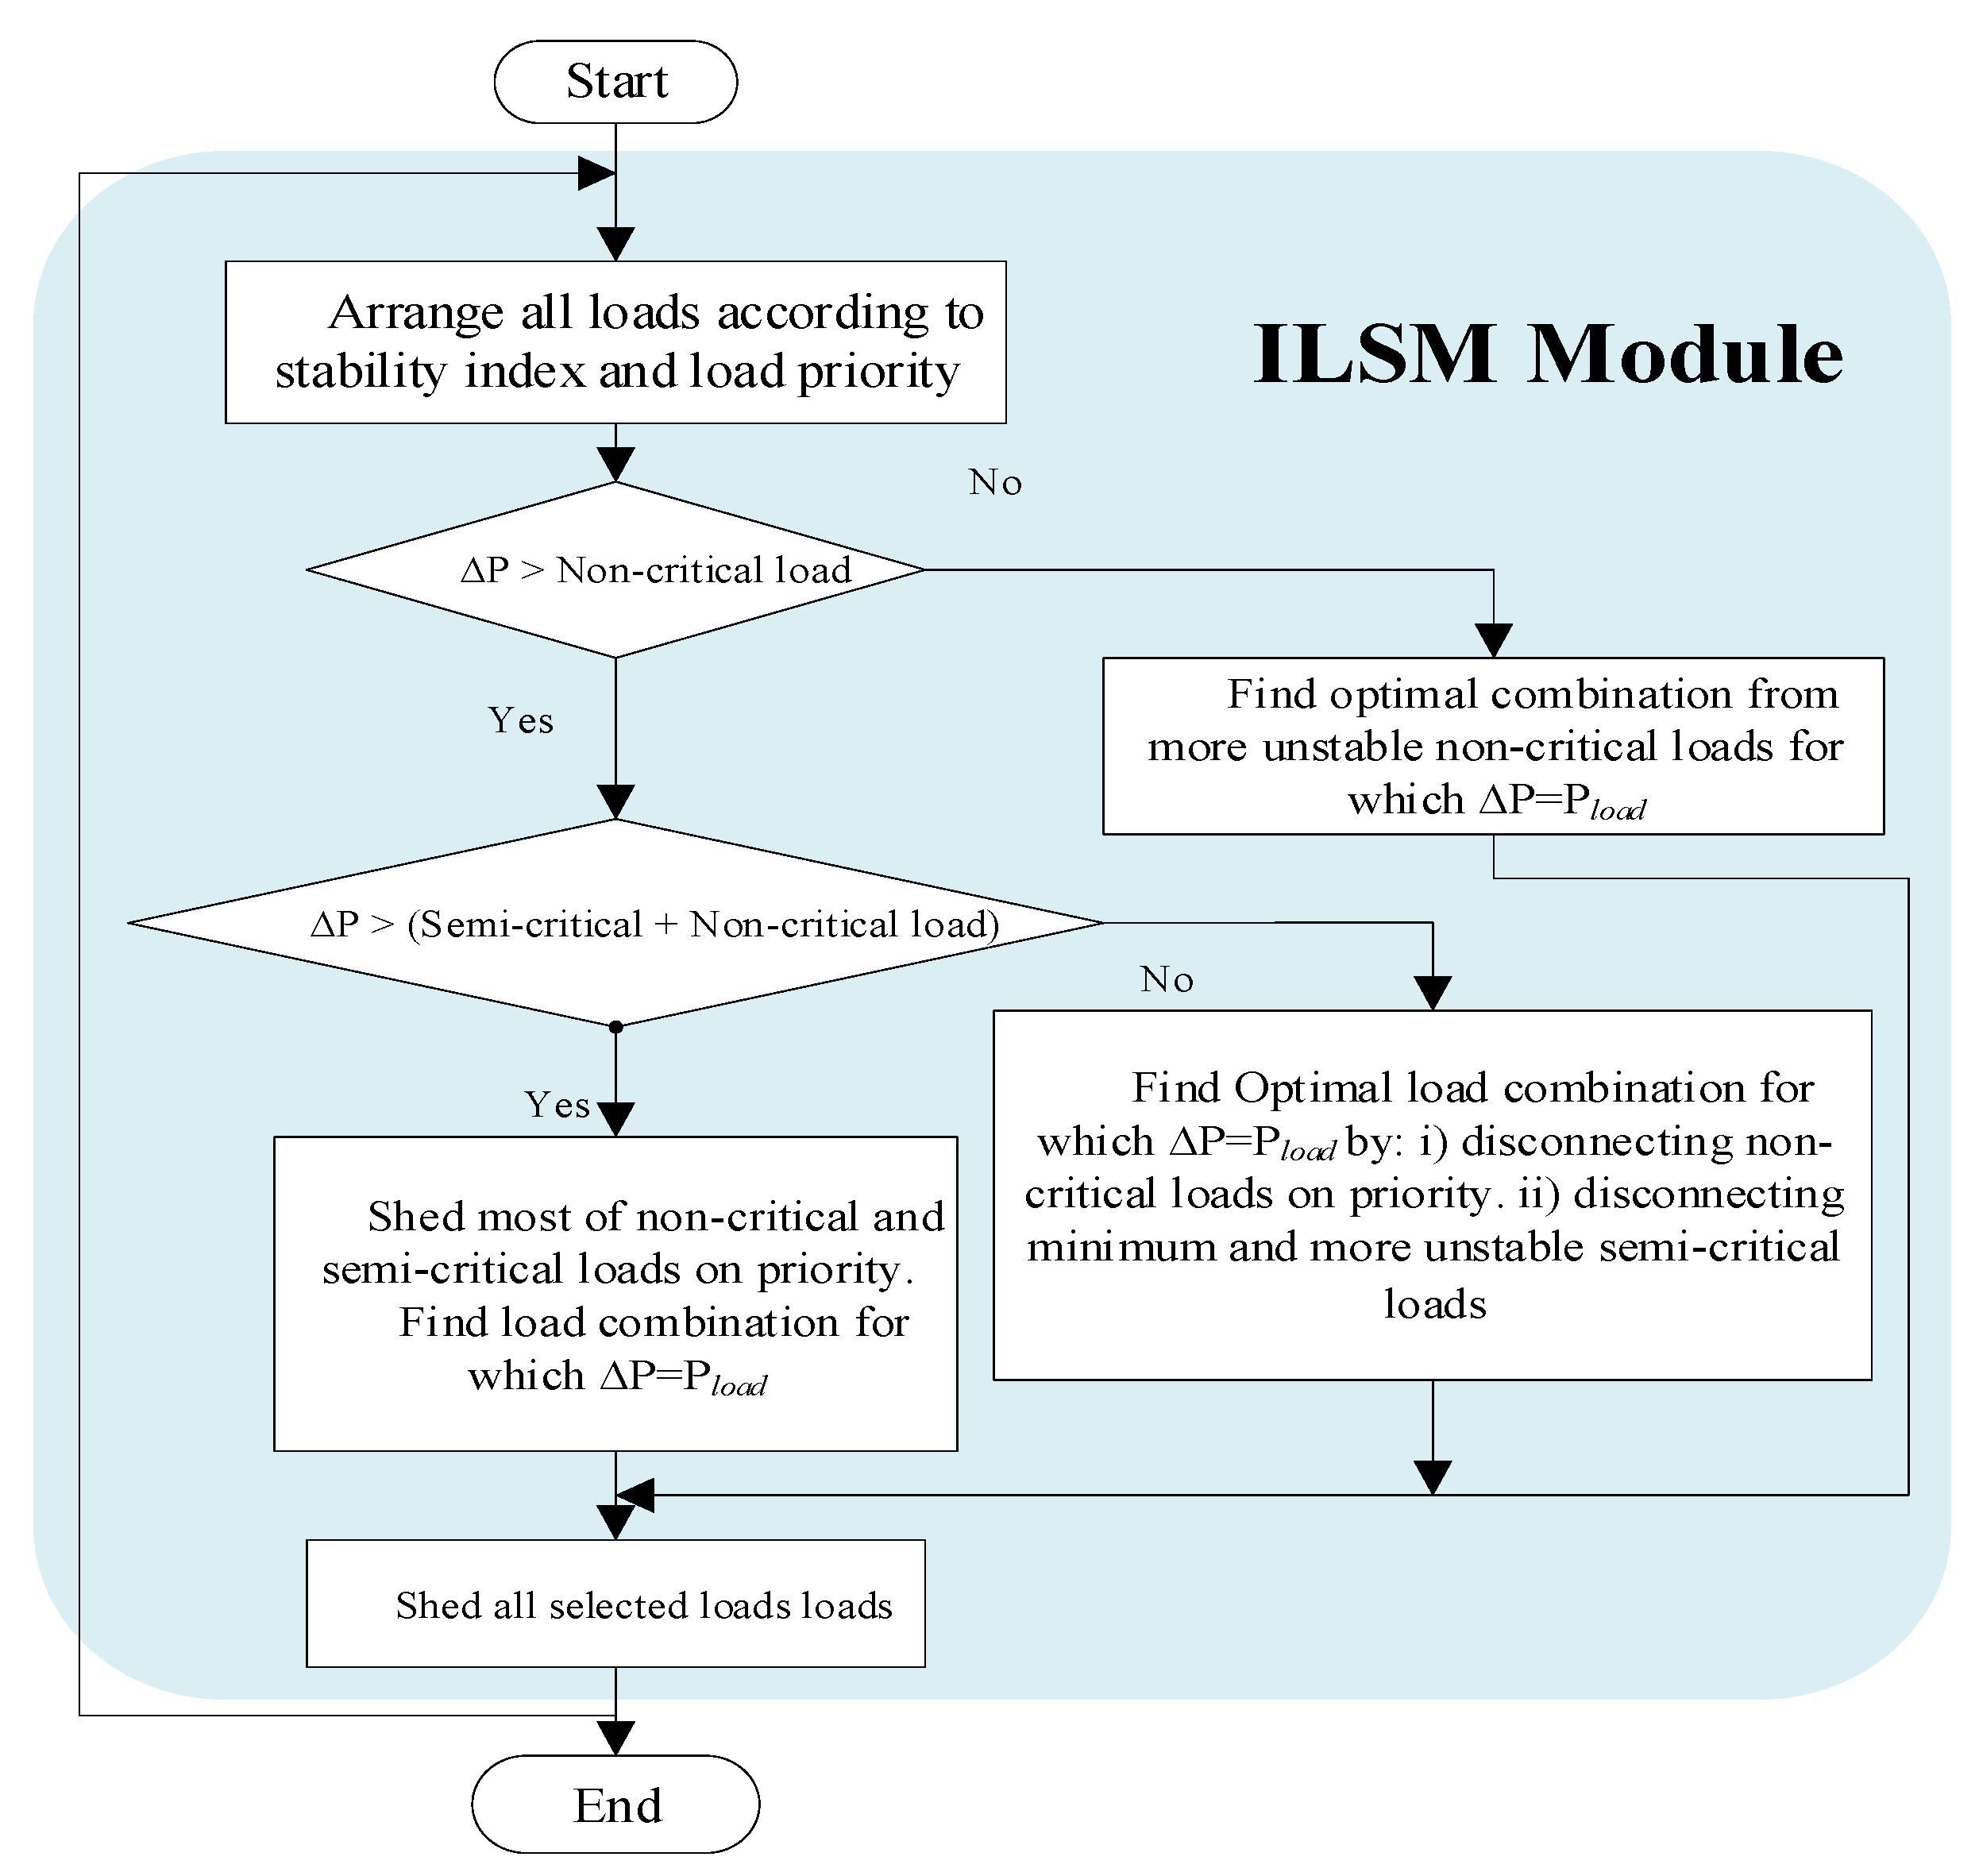
2.4. Intelligent Load Shedding Module (ILSM)

The ILSM provides an optimal solution for load shedding, where it captures the real-time load values from PSCAD. These loads have been categorized as non-critical, semi-critical, and critical loads. The power imbalance forecasted in the PICM is analyzed and a combination of loads for shedding if the power imbalance is greater than Pthreshold is determined by solving the MILP optimization. The MILP model and objective function of the problem are shown in canonical form, Equation (6) is the objective function, Equations (7) and (8) are constraints to follow, and Equations (9) and (10) present parameter limits.
O F = min j N C L α . S I j . x j + k S C L β . S I k . x k + l C L γ . S I l . x l + δ . w
Subject to
i = 1 N ( x i . P L i ) w P I P L i 0
i = 1 N { x i . ( P L i ) } w ( P I ) P L i 0
α , β , γ a n d δ a r e n o n n e g a t i v e n u m b e r s
x i = { 0 1 D i s c o n n e c t e d C o n n e c t e d i = 1 , 2 , 3 N
where PLi is the real-time load value at bus i, N is the total number of loads in the system, SI is the stability index of the load, NCL, SCL, and CL are noncritical, semi-critical and critical load sets, respectively, and the binary variable x takes a value of 1 if the load’s circuit breaker disconnects the load from the system, 0 otherwise. α, β, and γ are coefficients of the linear problem for load priority and optimization These values are calculated so that the model should not select any additional semi-critical or critical load and only shed the non-critical loads. w in the objective function is a dummy variable and δ is its coefficient. The objective function is to minimize the difference of the estimated power imbalance, and ideally it should be 0. However, it cannot be 0 for all possible scenarios, therefore, a dummy variable is needed to satisfy the designed constraints in certain conditions. Its coefficient δ is given a very high value so that the objective function minimizes this dummy variable value. The block diagram of this module is shown in Figure 2.
This module finds the optimal combination of loads to be shed to match the power imbalance of the system with minimum error, incorporating stability indices of loads and load priority. The following conditions are performed during the load shedding process:
(1)
A combination of only non-critical and more unstable loads will be shed if the power mismatch is less than the total non-critical load in the system.
(2)
If the power mismatch is more than the total amount of non-critical loads in the system, the module will shed an optimal combination of more unstable non-critical and semi-critical loads to match the power imbalance in the system. However, non-critical loads will be shed on priority.
(3)
Lastly, if the power imbalance is more than the amount of non-critical plus the semi-critical loads, all the non-critical and semi-critical loads will be shed and an optimal combination of critical loads will be determined for balancing the load and supply. It is a better solution to disconnect a few of the critical loads instead of total blackout in case of extreme contingency.

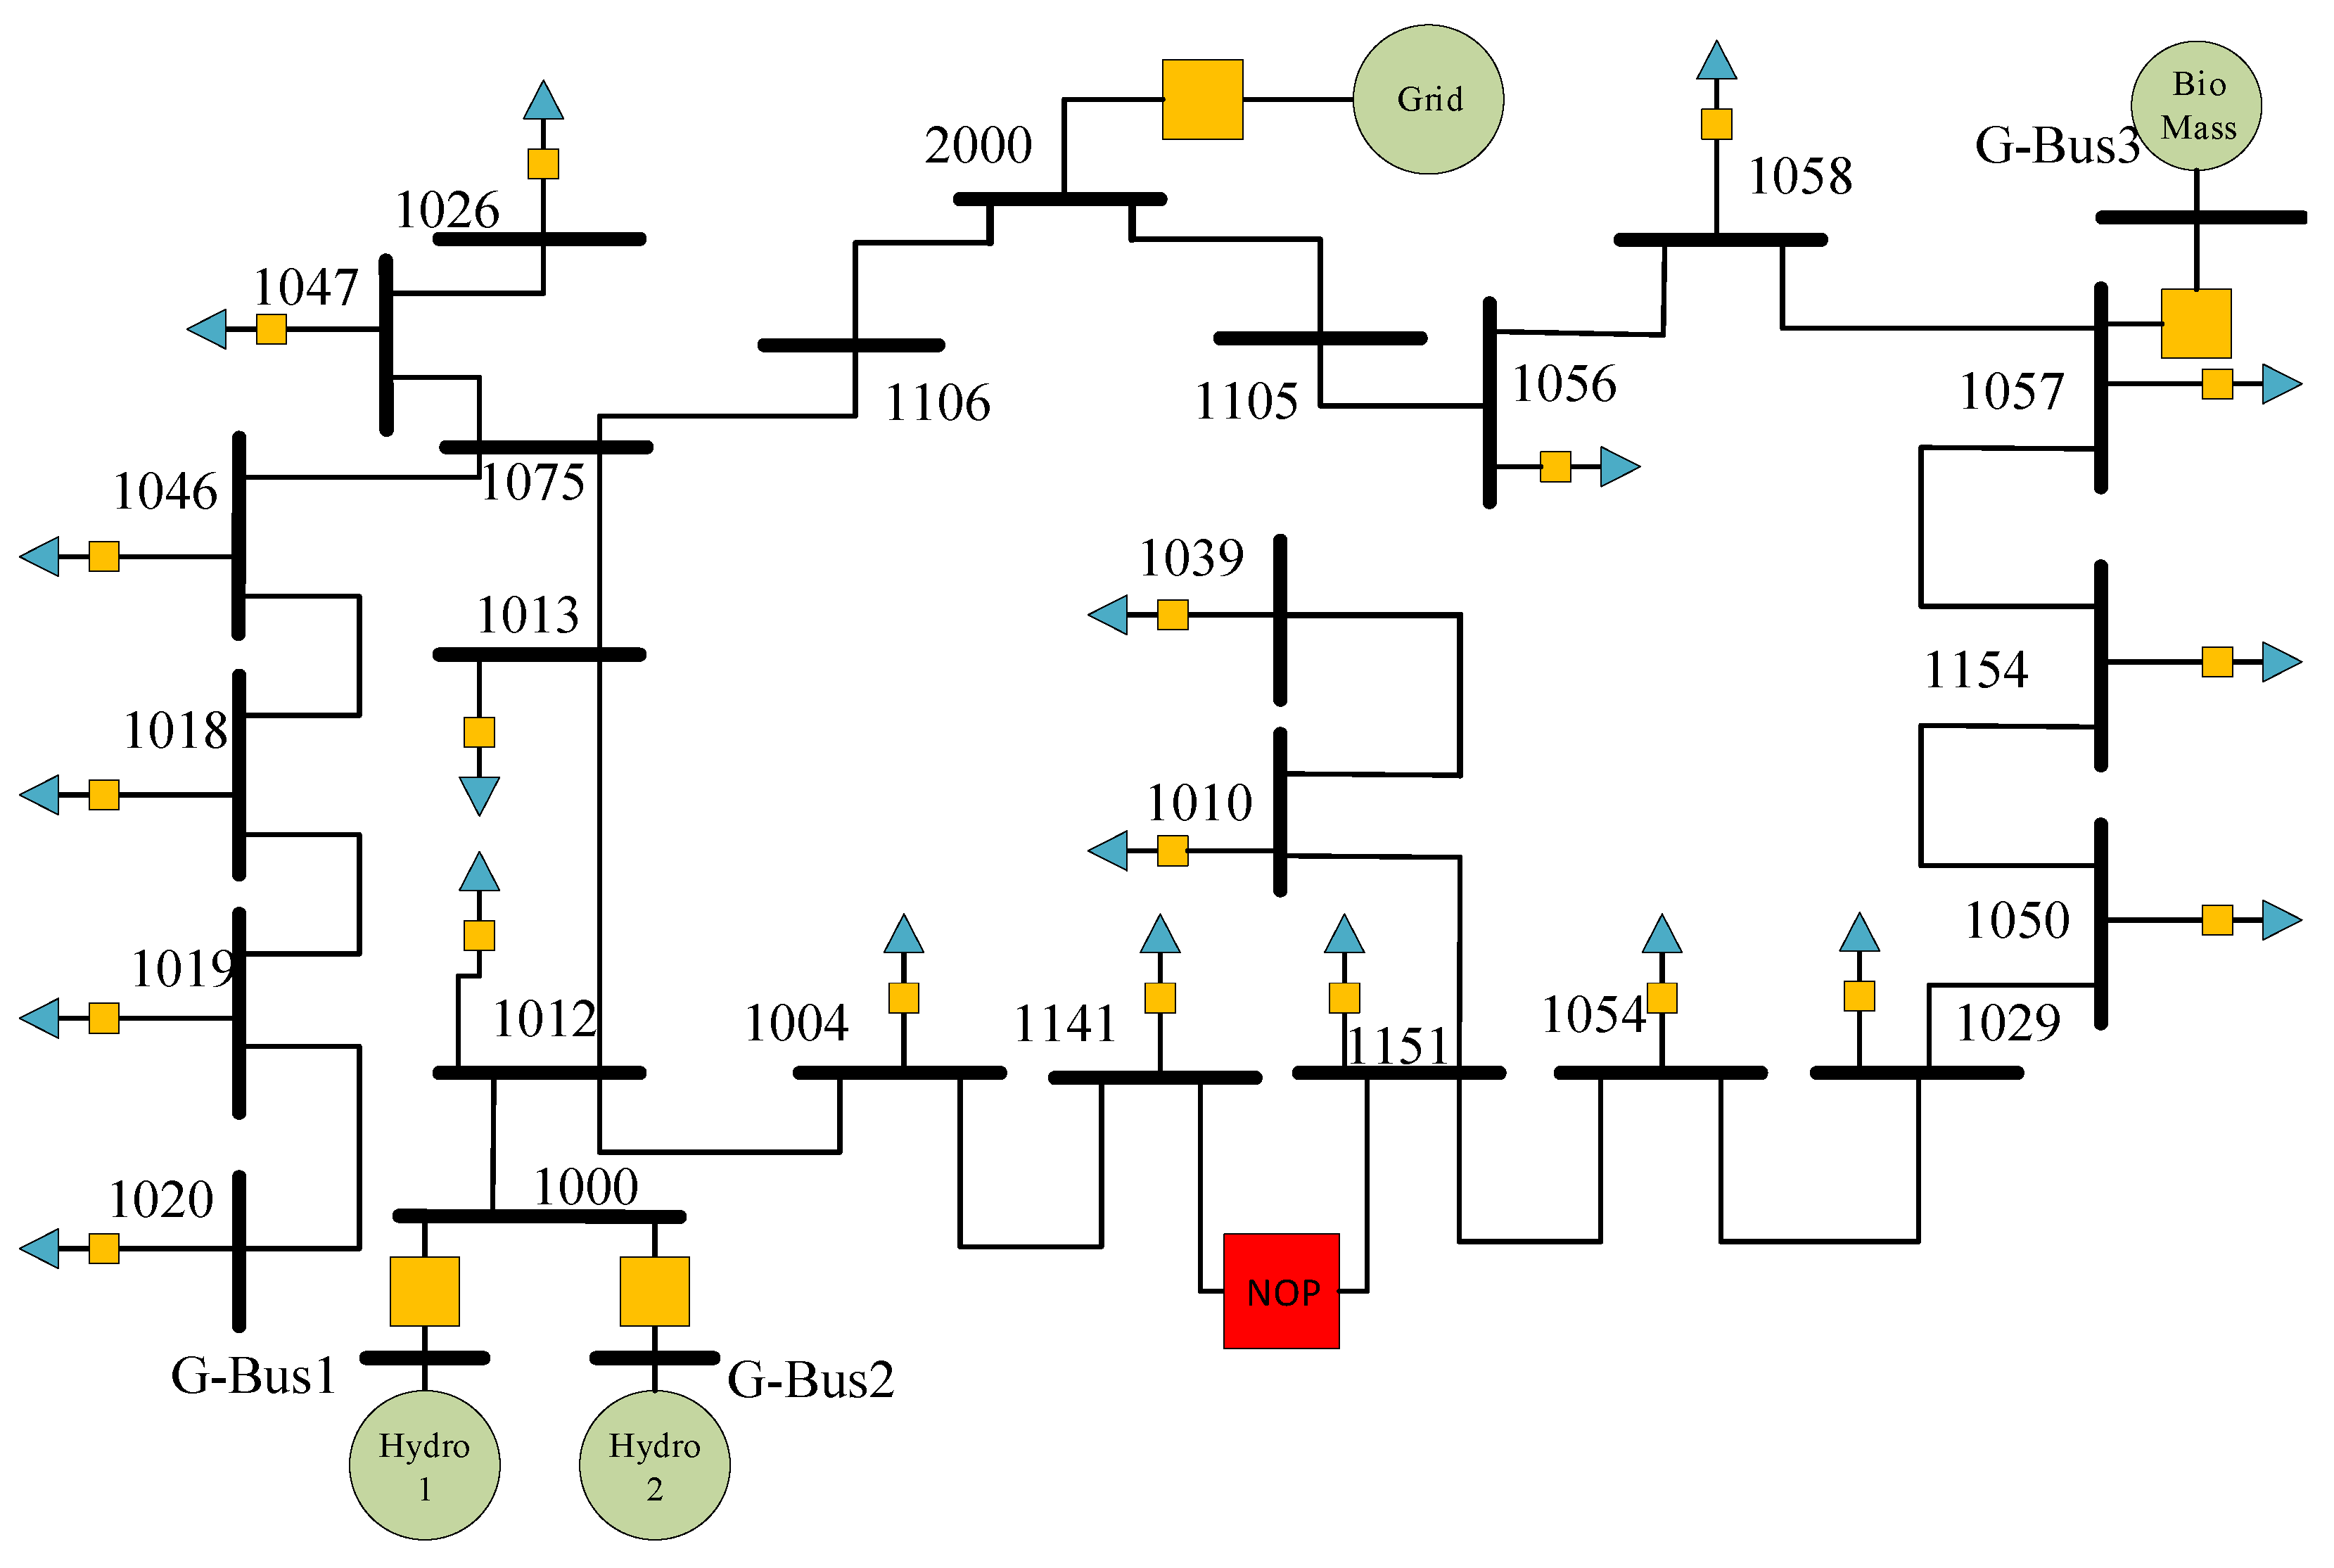
3. Test System Modeling

The effectiveness of the proposed technqiue was validated on two different systems, i.e., an 11-kV/28-bus practical system that was part of the Malaysian distribution network, and the IEEE 69-bus shown in Figure 3 and Figure 4, respectively. The 28-bus system comprised three DGs, of which two DGs were mini-hydro generators and one a bio-mass generator, coupled with the grid supply and 20 lumped loads. A step-down transformer unit (132 kV/11 kV, 50 MVA) interconnected the distribution network and transmission grid through a grid circuit breaker (BRKG). Each DG was rated at 2 MVA at a voltage level of 3.3 kV. The maximum dispatch capacity was 1.82 MW for the hydro DGs and 1.86 MW for the bio-mass DG. The DGs used a synchronous generator with an exciter of IEEE type AC1A. The hydro DG governor was modeled with a proportional, integral, derivative (PID) controller and a hydraulic turbine with non-elastic water columns without a surge tank, available in the PSCAD library. The mechanical hydraulic governor with PID control and generic turbine model including the intercept valve effect was used to model the bio-mass DG. A schematic view of the test system is presented in Figure 3.
Loads were modeled as voltage- and frequency-dependent loads using the standard load model in the PSCAD library. Classification of loads as non-critical, semi-critical, or critical was based on the type of load, i.e., residential, industrial, municipal, and commercial. The loads and their rankings in the system are shown in Table 1. Loads ranked 1 to 11 were assumed to be non-critical, loads ranked 12 to 16 were classified as semi-critical, and the remaining four loads were ranked as critical, as seen in Table 1.
The IEEE 69-bus system load data were taken from [32] and presented in Table 2; one bio-mass DG and two hydro DGs were placed in an optimal location with optimal ratings, as proposed in [32] and shown in Table 3. This system consisted of 48 lumped loads and three DGs: two mini-hydro DGs and one bio-mass DG. The DGs and loads for this system were modeled with the standard components available in the PSCAD library. The loads were prioritized as critical, semi-critical, and non-critical. Loads ranked 1 to 24 were assumed to be non-critical, loads ranked 25 to 36 were classified as semi-critical, and the remaining 12 loads were categorized as critical, as seen in Table 2.
This system was modeled in PSCAD/EMTDC for a real-time simulation. Meanwhile, agents for advance control were coded in MATLAB, interfacing with PSCAD. The proposed modules were designed as a new PSCAD component with multiple inputs and outputs. These new PSCAD components were programmed using Fortran language for real-time communication between MATLAB and PSCAD. The MATLAB function was called from PSCAD incorporating the Fortran compiler when there was a contingency in the system. To consider the practical aspects in the simulation, circuit breaker operation time and communication delay between grid operation and load center were assumed to be 100 ms, as in [9]. It was assumed that the remote circuit breaker operation facility and real-time measurements were ensured for all the connected loads. Simulation was carried out with a time step of 250 uS on PSCAD (4.5.3) educational version interfaced with MATLAB R2014a, installed on a Core i5, 9th generation laptop.

Conventional and Adaptive Technique Modeling

The performance of the proposed scheme was compared with conventional and two adaptive techniques. The conventional technique relied on under-frequency load shedding relay settings. Pre-defined load values were shed one by one for each threshold level of frequency. In this paper, an eight-step conventional load shedding utilized in [28] was resimulated to compare the results. On the other hand, the adaptive technique based on random and fixed priority loads (Adaptive-I) was resimulated in PSCAD/EMTDC by measuring the power imbalance of the system using swing equation and, subsequently, combinations of loads to be shed were selected using an exhaustive search, as in [28]. Loads were prioritized as random and fixed priority loads. The proposed method in the Adaptive-I technique found a combination of loads from random priority loads using an exhaustive search. If the power imbalance was higher than the sum of all random priority loads, it would shed all random priority loads and sequentially shed the fixed priority loads until the load shed amount was equal to or greater than the power imbalance. Another adaptive load shedding technique based on the voltage stability index (Adaptive-II) was also resimulated in PSCAD, which was proposed in [27]. The voltage stability index was calculated and loads were arranged in ascending order with respect to stability. More unstable loads were shed sequentially until the load shed amount was equal to or greater than the estimated power imbalance.

4. Results

Validation of the proposed technique was done by comparing the results of the proposed technique with the results obtained by the conventional and adaptive load shedding schemes. The proposed scheme was tested for different events: islanding, overloading, and DG tripping, with three different scenarios.
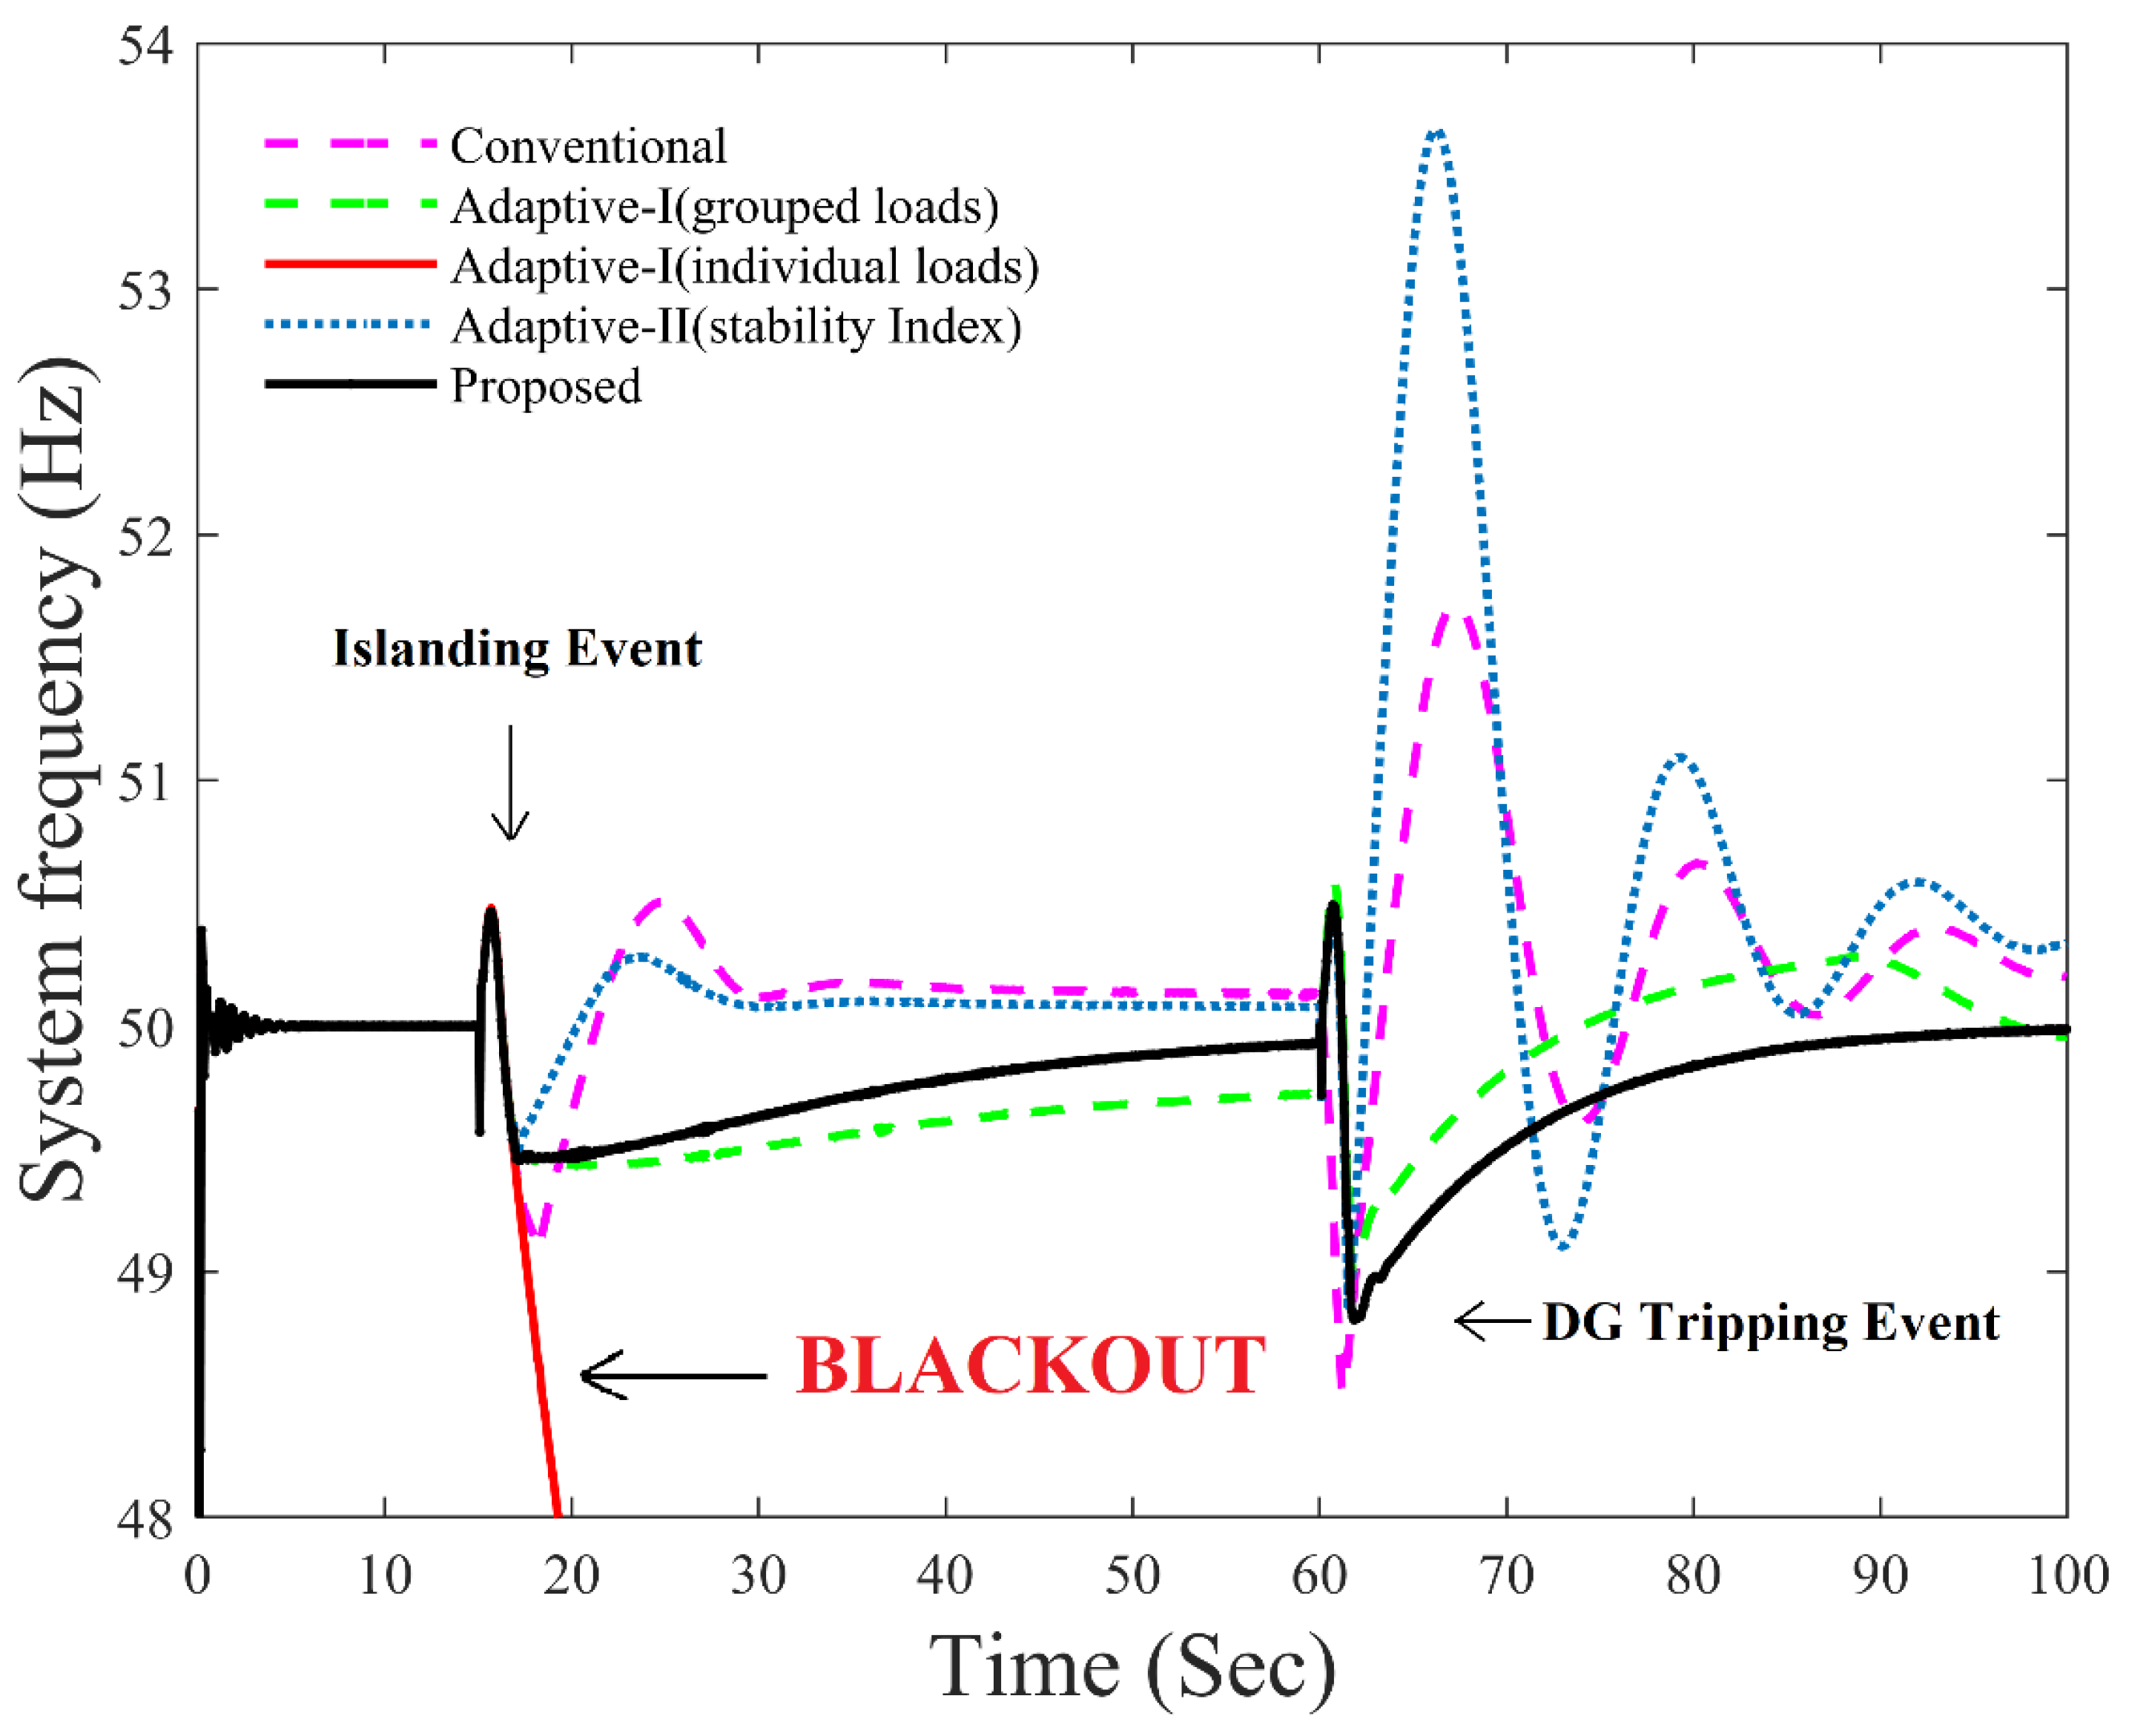
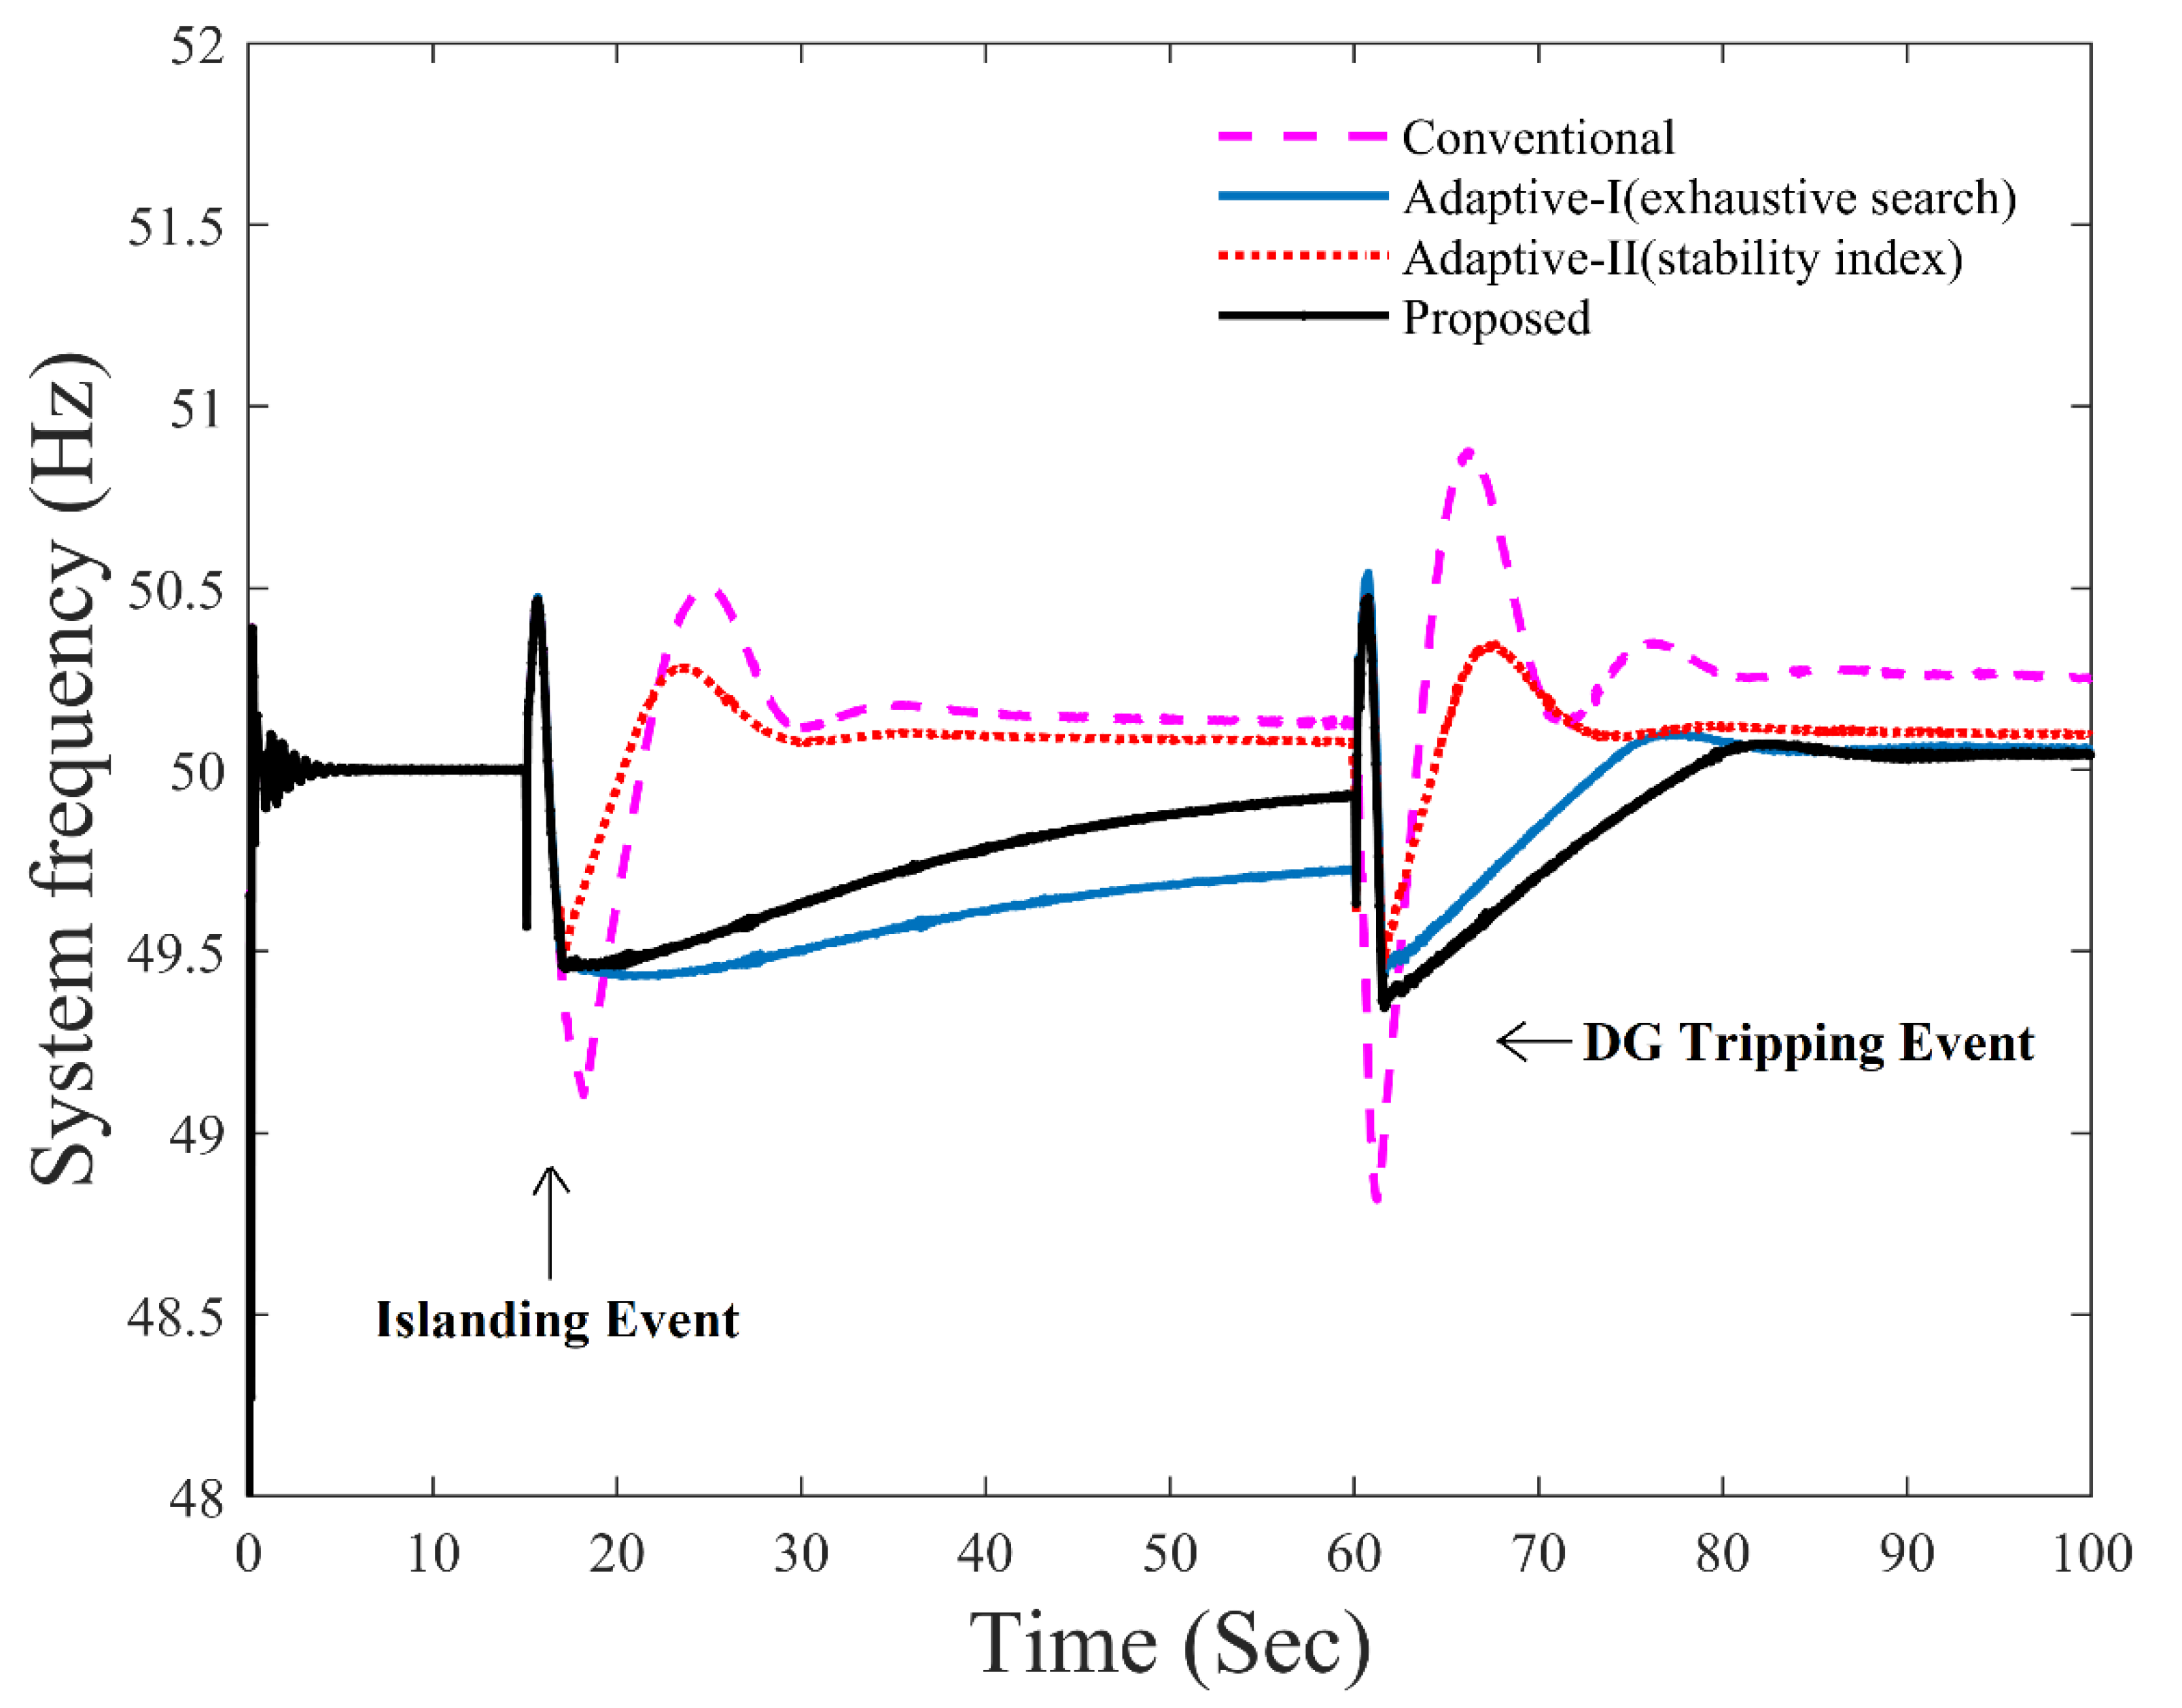
  • Scenario I: Islanding and DG-tripping events were simulated in this scenario for the 28-bus system to compare the system frequency response (SFR) of the proposed technique with two adaptive techniques, one based on an exhaustive search tool [28] to locate an optimal combination of loads and other based on stability index calculation [27] to disconnect unstable loads on priority.
  • Scenario II: An overloading event was simulated in an islanded system for the 28-bus system to compare the SFR for conventional, Adaptive-I, Adaptive-II, and proposed techniques to validate the effectiveness.
  • Scenario III: Islanding and DG-tripping events were simulated in this scenario for the IEEE 69-bus system to compare the SFR of the proposed technique with both adaptive techniques presented in [27,28].

4.1. Scenario I

In this scenario, the proposed technique based on load priority and stability index was compared with the conventional and both adaptive techniques to validate the efficacy. Thirteen loads from the system were selected to form eight load groups (shown in Table 4) and were used for load shedding in the Adaptive-I technique presented in [28]. The Adaptive-I technique was also simulated in this scenario with all the system loads to test the effect of increasing the number of loads on the methodology in [28].
The results of another adaptive technique based on the stability index of loads (Adaptive-II) were also compared in this scenario. The Adaptive-II technique calculated the stability index of each load bus when there was a power imbalance in the system and loads were sequentially detached based on their stability index, until the load shed amount was equal to or higher than the power imbalance. For each event, the power mismatch calculation module determined the power imbalance using Equations (2)–(4), and subsequently handed over the estimated power mismatch value to the load shedding module and activated the stability index module for the proposed technique. The frequency response for this scenario is shown in Figure 5 and detailed load shedding parameters for islanding and DG-tripping events are summarized in Table 6.

4.1.1. Islanding Event

In this event, the system was disconnected from the grid supply through a circuit breaker at a simulation time of 15 s. As the combined generation capacity of all the three DGs was less than the total load demands, the system frequency decreased. The total load before islanding was 5.89 MW, with DGs supplying a maximum of 5.50 MW at their rated conditions. The PICM of the proposed technique estimated a power imbalance of 0.39 MW in the system. The ILSM then captured and processed this power mismatch to determine the best combination of loads to be shed.
It can be observed from Figure 5 that the conventional technique shed loads ranked 1–5 and resulted in a significant overshoot of 50.7 Hz and a lower undershoot in the system frequency. This was due to the extra amount of loads being shed and the multistage load shedding, respectively. The results of the proposed method indicated a smoother frequency response without any overshoot and disconnected an optimal combination of the more unstable loads ranked 2 and 11, which exactly matched with an estimated power imbalance. It can be seen from Table 5 and Table 6 that the load ranked 11 was disconnected instead of the more unstable loads 6 and 7 because disconnecting load 6 or load 7 would have caused an excessive load shedding, resulting in a high overshoot in the SFR, which can be seen for the SFR of the Adaptive-II technique in Figure 5. It was evident from Figure 5 that the Adaptive-I technique performed inadequate load shedding, as grouping of the loads limited the possible solutions. Any other solution for the Adaptive-I technique from Table 4 would have caused a very high overshoot. The stability of loads was also violated in the Adaptive-I technique (Table 5). Furthermore, the Adaptive-I technique based on an exhaustive search failed to perform load shedding at an appropriate time, when all the loads in the system were used for load shedding, which resulted in a cascaded blackout. This problem occurred because there are 1,048,575 possible combinations for 20 loads, and the time required to evaluate all these combinations was such that the system collapsed before the initialization of load shedding. On the other hand, the Adaptive-II technique shed first the most unstable load 7, as shown in Table 5. Table 6 shows that, although the Adaptive-II technique shed the unstable load first, it shed an excessive 0.063 MW load in this event, causing an overshoot of 50.28 Hz due to excessive load shedding. However, the load shed amount for the proposed technique was optimal, as compared to the inadequate load shed amount of 0.32 MW and excessive load shed amounts of 0.453 MW and 0.57 MW for the Adaptive-I, Adaptive-II, and conventional techniques, respectively.

4.1.2. DG Tripping in an Islanded System

For validation of the proposed method, one of the DGs was disconnected from the system during the islanded mode. The bio-mass DG was disconnected at time t = 60 s when the system was operating in islanded mode. Figure 5 shows the frequency response of the system, and frequency stability parameters are compared in Table 6. The conventional technique shed loads ranked 6–13 in addition to loads shed in Scenario 1, resulting in a frequency overshoot of 51.7 Hz. Loads ranked ‘a’ to ‘g’ in Table 4 were shed for the Adaptive-I technique. It is visible from Figure 5 that frequency was stabled for the proposed technique without any overshoot, as compared to an overshoot of 50.28 Hz, 53.6 HZ, and 51.7 Hz for the Adaptive-I, Adaptive-II, and conventional techniques, respectively.
The overshoot in the SFR for the Adaptive-I technique was due to the fact that the power imbalance was higher than the total random priority loads, and a fixed priority load was disconnected in addition to all random priority loads. Therefore, an additional 0.18 MW load was shed for the Adaptive-I technique, as can be seen in Table 6. However, the Adaptive-II technique shed more unstable non-critical loads sequentially, as seen in Table 7, to match with an estimated power imbalance. The power imbalance for this event was higher than the total non-critical loads, therefore the Adaptive-II technique shed the most unstable load from the semi-critical loads, which was ranked 15. This resulted in an excessive load shed amount of 0.414 MW, causing a huge overshoot of 53.6 Hz in the SFR, whereas the proposed technique disconnected more unstable non-critical loads on priority and found an optimal combination of one semi-critical and six non-critical loads for this event. Table 7 shows that the proposed scheme selected unstable loads to match with the estimated power imbalance. It can be estimated from Table 6 that the load retained in the system was 5.72%, 11.5%, and 6.58% higher than the Adaptive-I, Adaptive-II, and conventional techniques, respectively. Therefore, the SFR in Figure 5 proves that the optimal amount of load was shed for the proposed technique and the frequency response was smoother and more accurate than the conventional and adaptive techniques.
It can be concluded from this scenario that, although the Adaptive-I technique based on an exhaustive search produced accurate results, its application, however, was quite limited. An increase in n number of loads exponentially increased the possible load combination to 2n. It became an infeasible approach to load shedding as the memory space required to store and evaluate 2n combinations became unreal. Moreover, the time taken to find a solution also increased with the number of loads, which would have triggered the operation of protective relays, resulting in a blackout before the load shedding could take place. It is clear from the results in this scenario that the Adaptive-II technique shed more unstable loads on priority to avoid any operation of undervoltage protection; the frequency of the system was assumed to be stabilized in [29]. However, the SFR in Figure 5 clearly reveals that optimal load shedding was needed to avoid overshoot in the system frequency.

4.2. Scenario II

The practical load of an islanded system is usually variable. This variation in load causes instability in system frequency. The total load in the system may increase due to the additional load being connected to the system during islanded operation. This creates an imbalance between generation and load. Therefore, a practical load shedding scheme must be able to withstand this variation and stabilize the system frequency to avoid a blackout. To validate this condition, an additional load of 0.75 MW was intentionally connected in this scenario at time t=60s in the islanded system. All the four techniques discussed in this paper were compared in this scenario. The stability index of loads for this scenario is shown in Table 8, the frequency response of the system is plotted in Figure 6, and Table 9 presents different parameters of load shedding.
It is visible from Table 9 that the conventional technique shed loads 6 and 7, in addition to loads 1 to 5 that were shed in the previous case, and caused a high overshoot of 50.89 Hz and excessive load shedding of 0.15 MW. The Adaptive-I technique also yielded an overshoot of 50.09 Hz and the load ranked as ‘f’ in Table 4 was shed in addition to loads ‘b’ and ‘d’. It is evident from Table 4 that the only possible solution for a power imbalance of 0.75 was to disconnect load ‘f’, which yielded excessive load shedding of 0.068 MW. The frequency response did not depict any prominent overshoot for the Adaptive-I technique because of the fact that inadequate load shedding was performed for the islanding event, as discussed in Scenario I. Conversely, frequency was restored to the nominal value in the proposed technique by shedding the comparatively unstable loads ranked 7, 8, and 9 (Table 8) in addition to loads shed during the islanding event. The SFR for the Adaptive-II technique in Figure 6 indicates that excessive load shedding was performed due to sequential shedding of the most unstable loads ranked 6 and 11, as highlighted in Table 8, which yielded an overshoot of 50.33.

4.3. Scenario III

In this scenario, islanding and DG-tripping events were simulated on the IEEE 69-bus system to validate the robustness of the proposed technique. Load shedding was performed using the proposed and both adaptive techniques discussed in the above sections. The system frequency response for this scenario is shown in Figure 7, and detailed load shedding parameters are presented in Table 10.

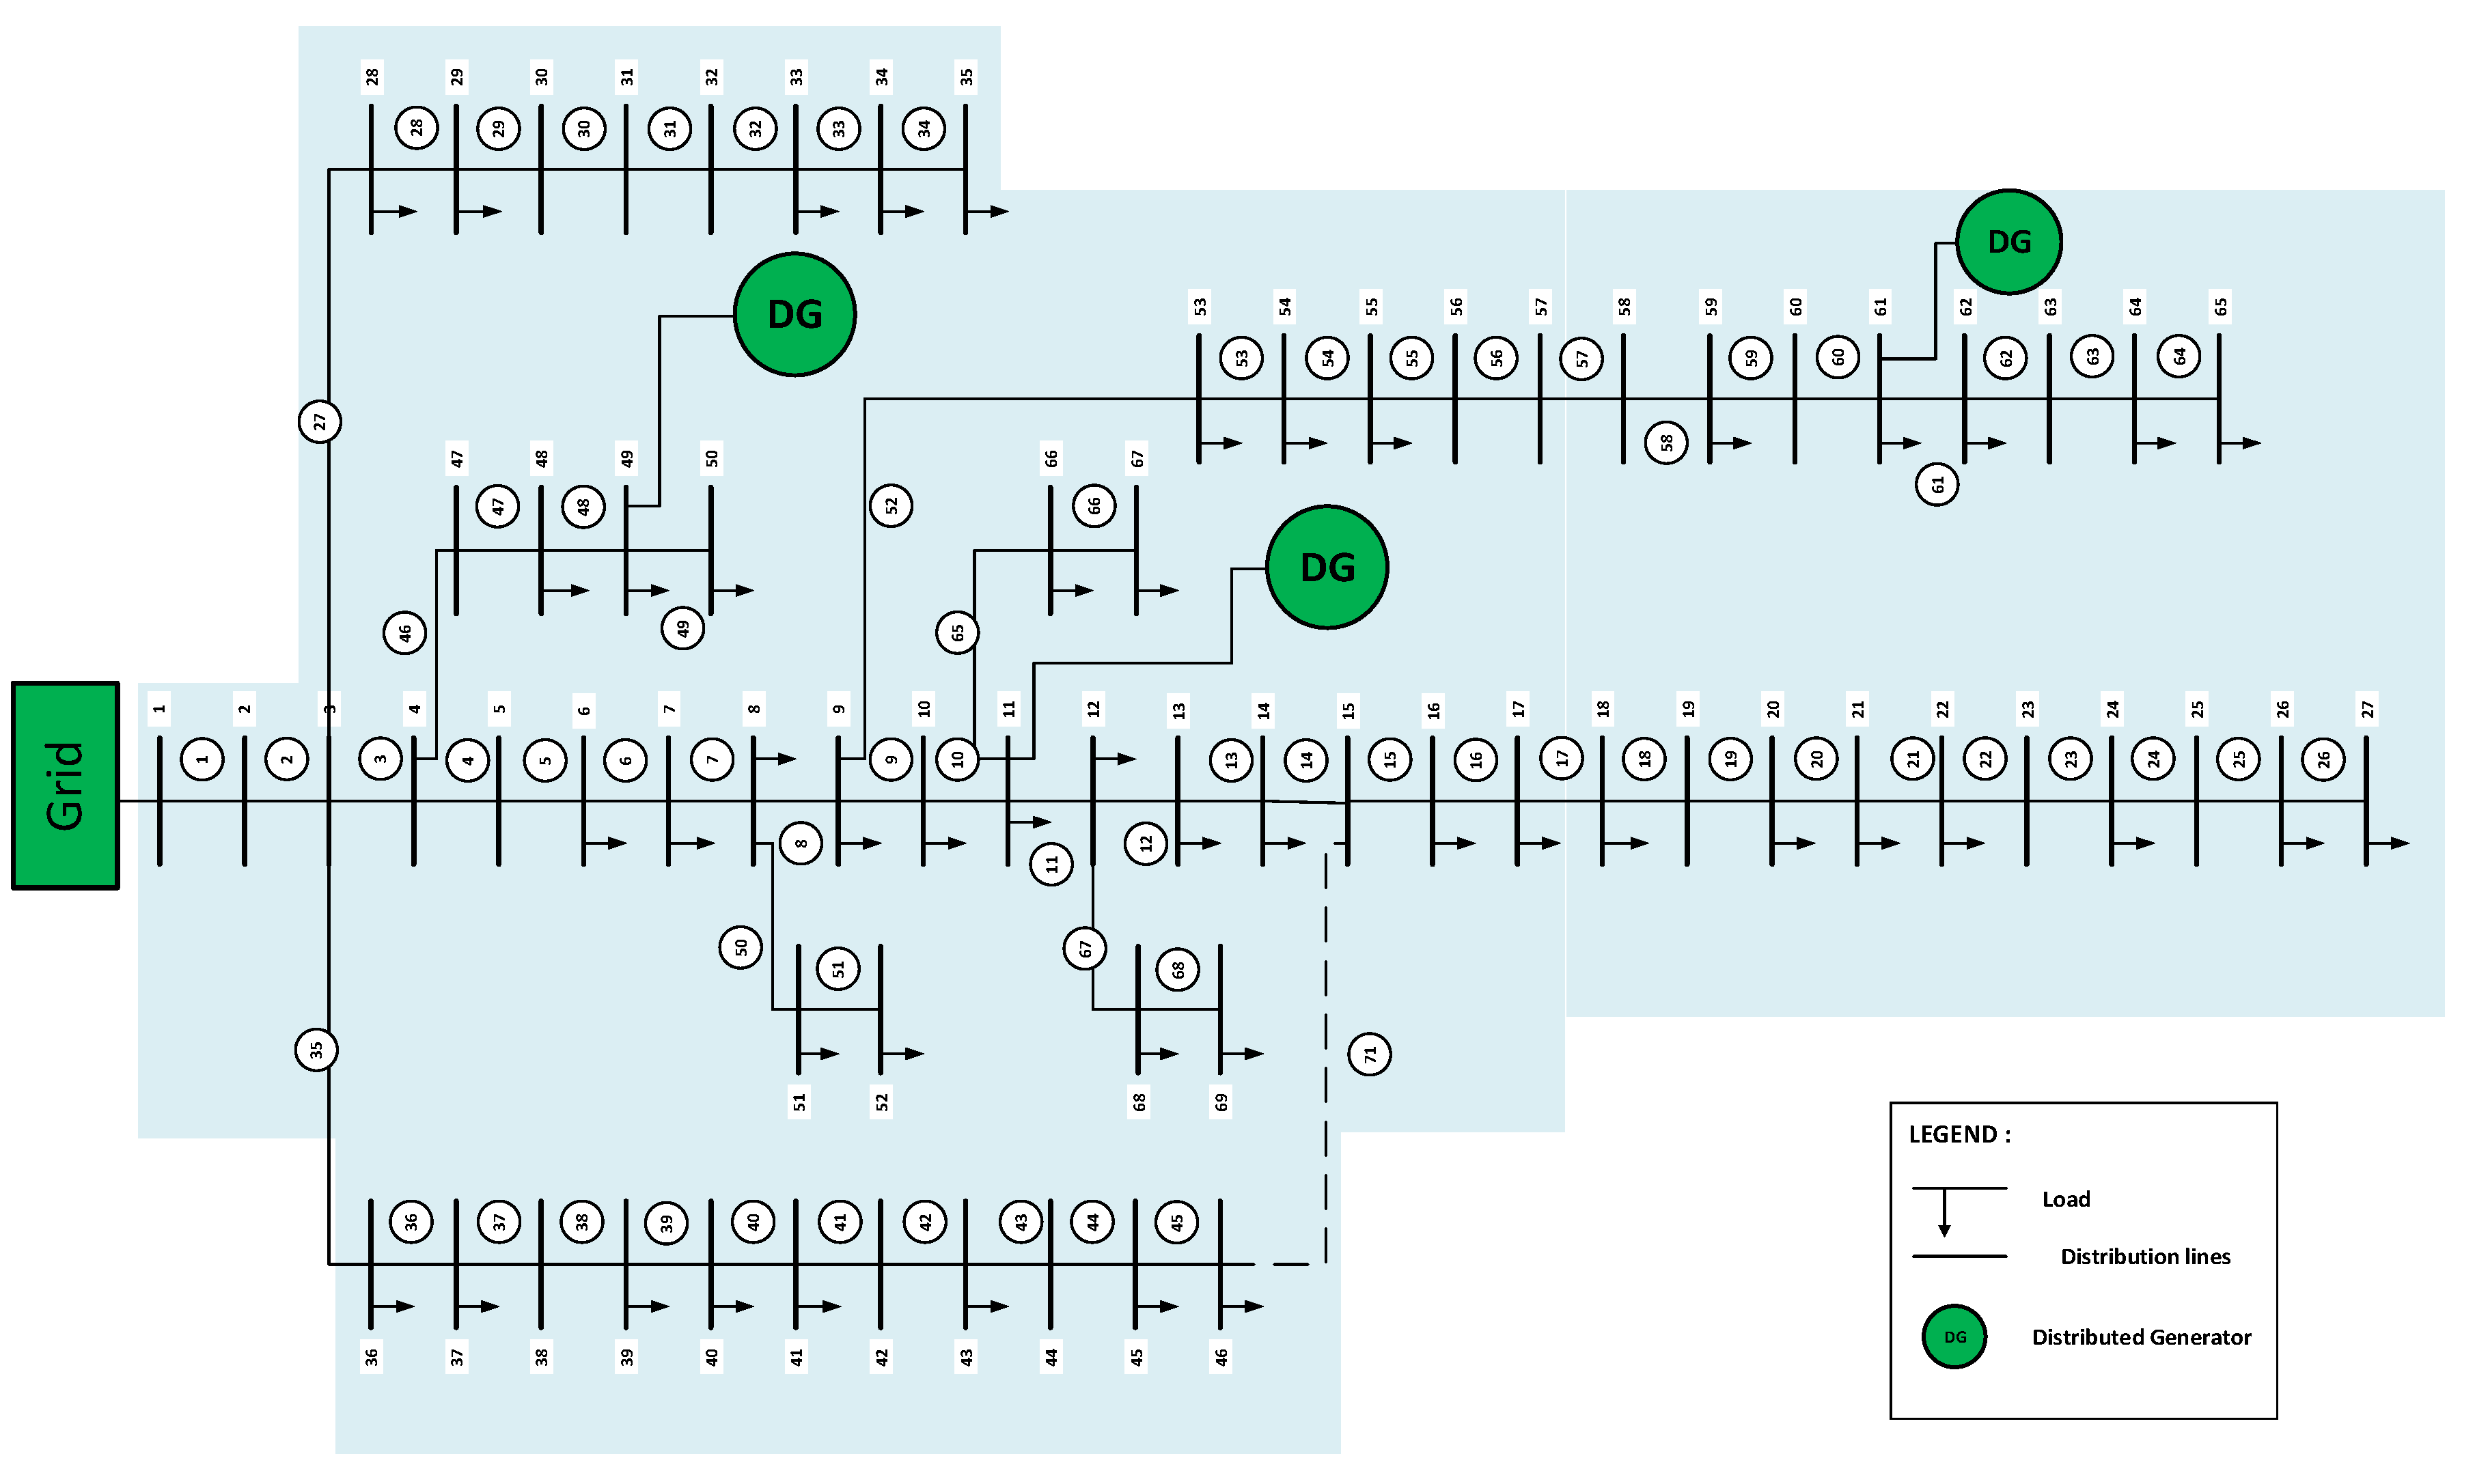
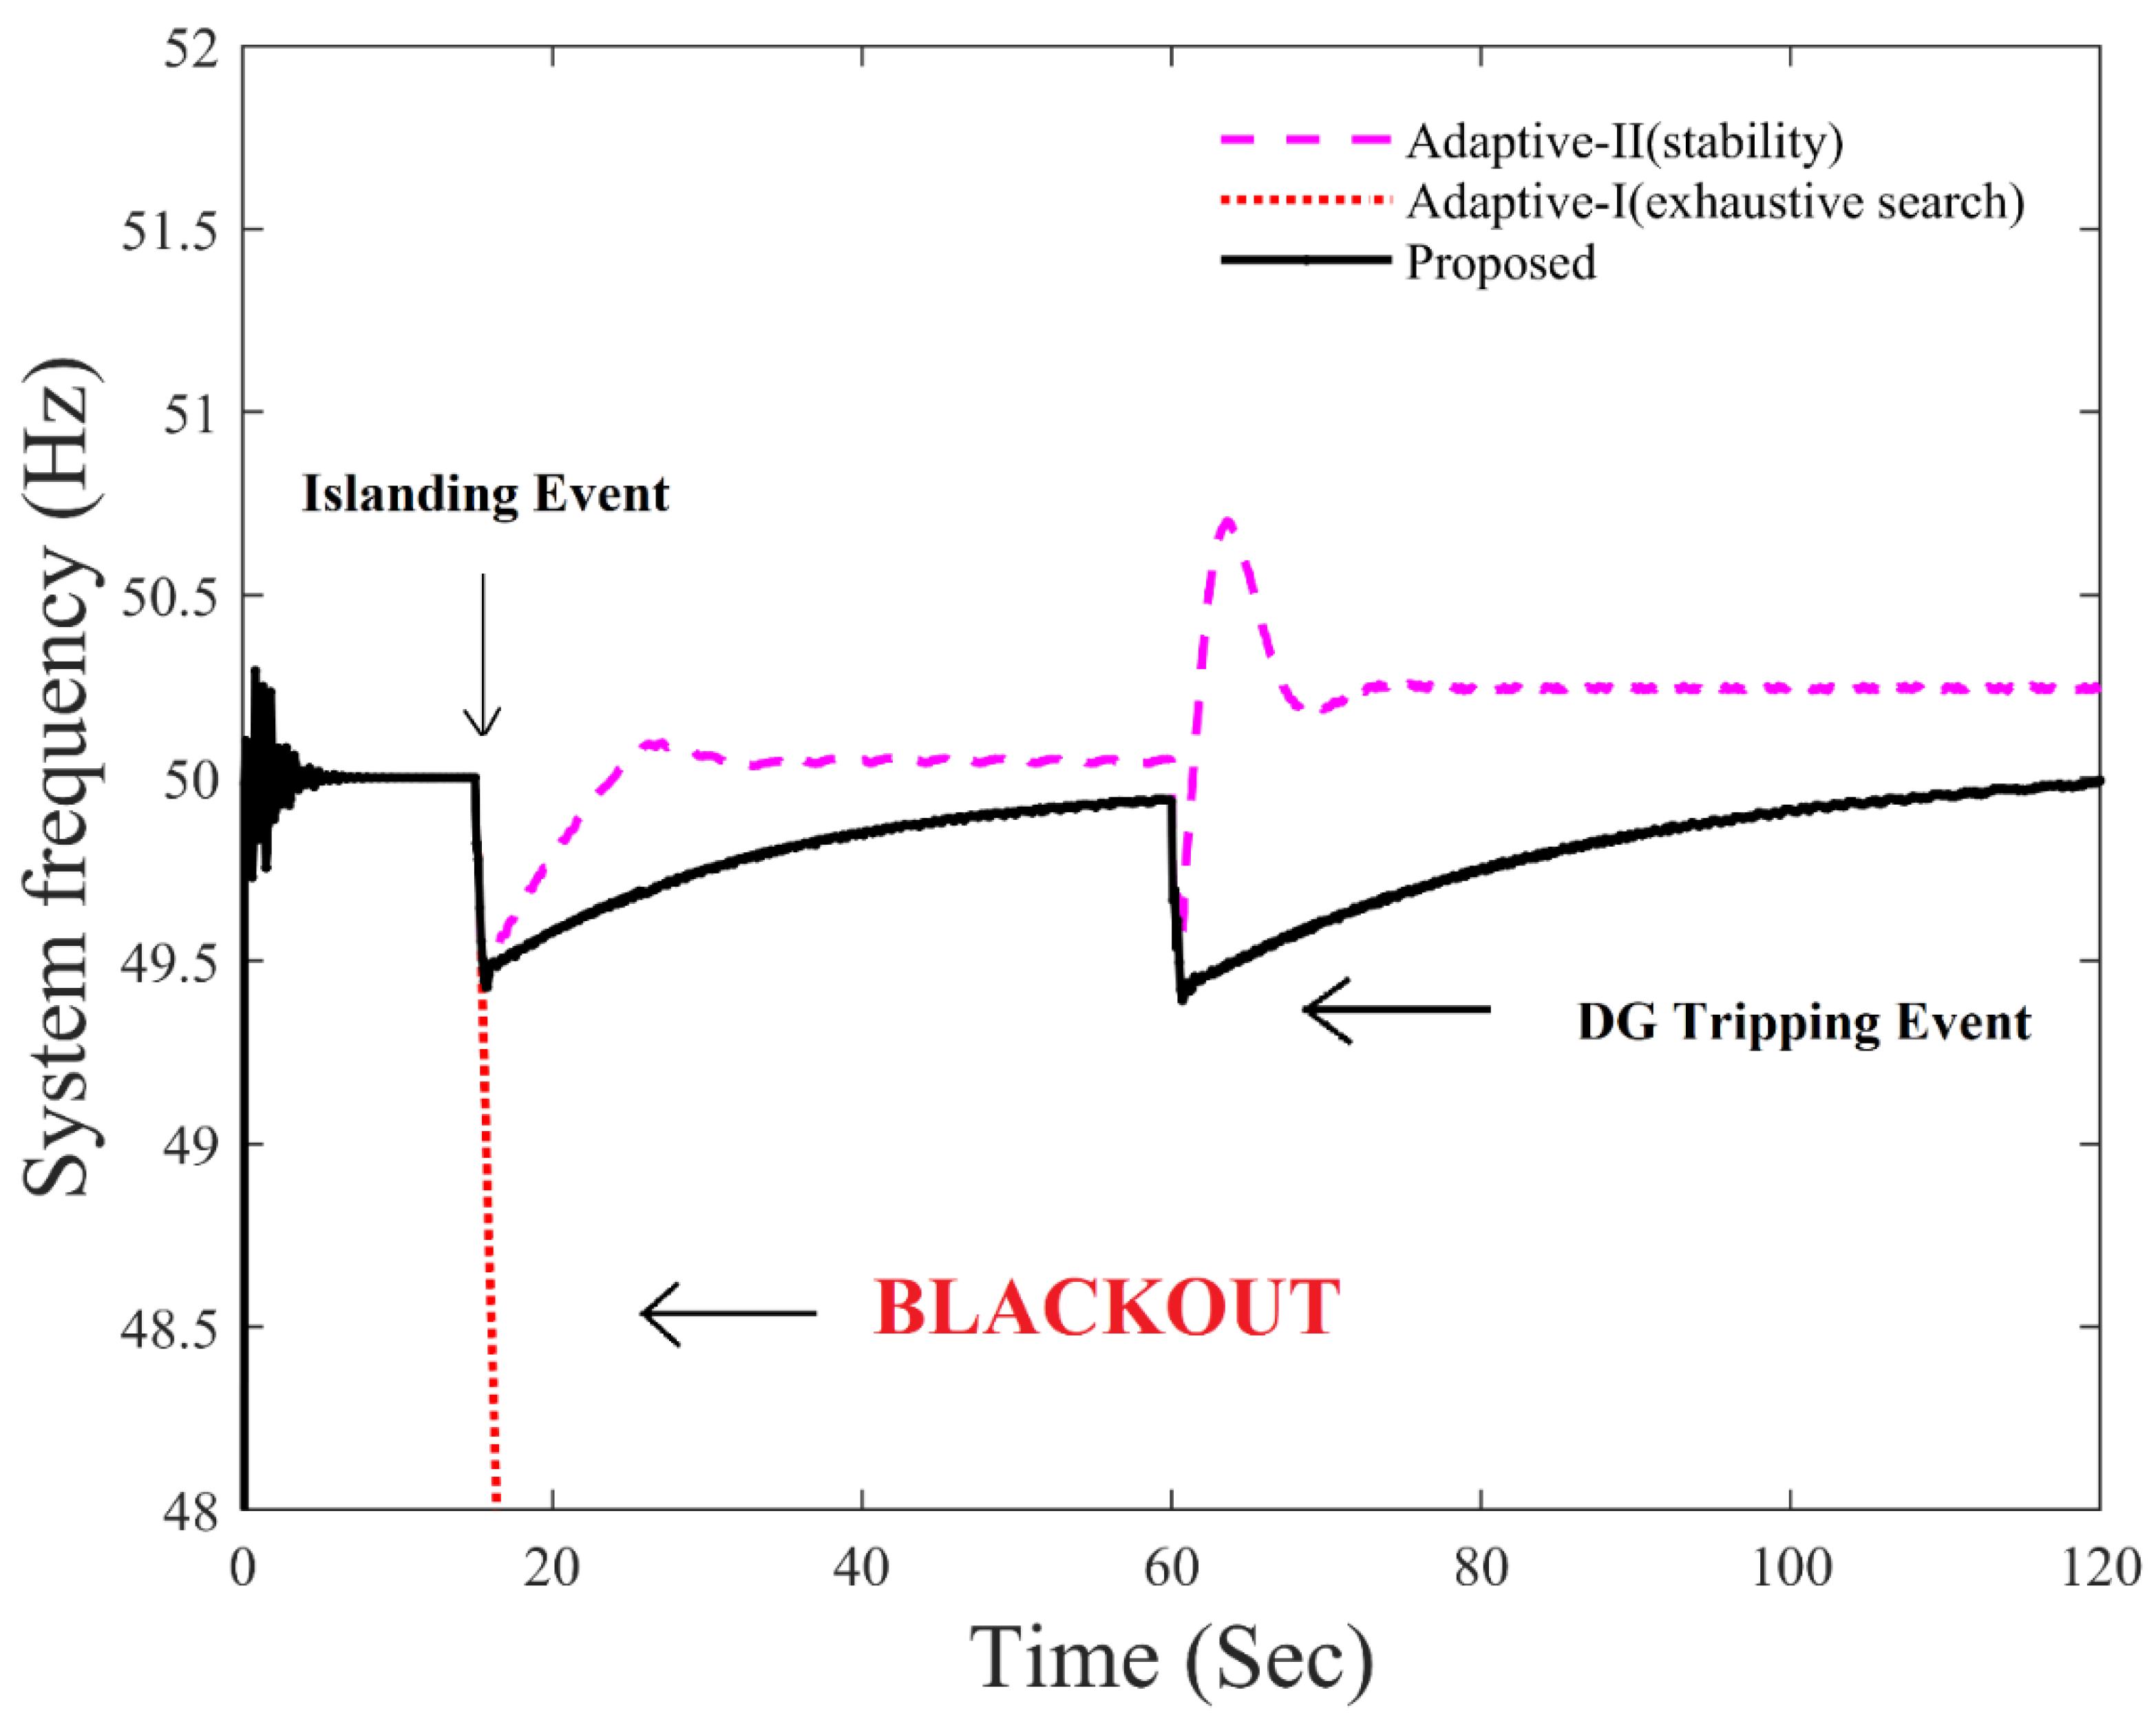
4.3.1. Islanding Event (69-Bus System)

The grid-coupling circuit breaker was disconnected at a simulation time of t = 15 s to create intentional islanding for the IEEE 69-bus system. The total connected load in the system was 3.806 MW in this event, which was higher than the combined generation capacity of the DGs. Therefore, the PICM estimated a power imbalance of 0.563 MW in the system, and the SICM calculated the stability index of all load buses. Loads were arranged in ascending order according to stability index, incorporating load priority. Critical loads were not shed in any case, hence the stability indices of only non-critical and semi-critical loads are presented in Table 11.
The SFR in Figure 7 depicts that the adaptive technique based on an exhaustive search could not perform load shedding in time and resulted in a blackout. Possible combinations for 48 loads of the IEEE 69-bus system reached beyond 281 billion. Therefore, it was infeasible for a practical computer system to store and evaluate all combinations, whereas the adaptive technique based on the stability index shed the unstable loads from Table 11 sequentially and resulted in an overshoot of 50.09 (Figure 7). This overshoot in the SFR suggested that an additional load of 0.031 MW had been shed. On the other hand, the SFR for the proposed technique in Figure 7 indicates indicated that an accurate amount of load was shed to avoid any overshoot. The stability index table and detailed load shedding parameters in Table 10 indicate that minimum and comparatively unstable non-critical loads were selected for shedding to ensure stable islanding operation of the distribution system.

4.3.2. DG-Tripping Event (69-Bus System)

A DG was intentionally desynchronized from the islanded system to validate the performance of the proposed technique in case of a suspected cascaded blackout. One of the DGs in the system was disconnected at a simulation time of t = 60 s when the system was operating in stable islanding condition. The PICM estimated a power imbalance of 0.797 MW in the system for this event. Stability indices of connected loads for this event are arranged in ascending order and shown in Table 11. Stability indices of already disconnected loads in the islanding event are replaced by dashes in the table. Table 10 indicates that all the non-critical and semi-critical loads except loads ranked 32 and 34 were disconnected for the adaptive technique based on the stability index, shedding an additional 0.125 MW load. The excessive load shedding caused a high overshoot of 50.7 in the SFR for the Adaptive-II technique. The SFR in Figure 7 and load shedding parameters in Table 10 show that proposed techniques performed a better load shedding without any overshoot in the SFR by disconnecting a combination of two semi-critical and 19 non-critical loads in this event.
It is obvious to conclude from the simulation results in this scenario that the performance of the proposed technique was not affected by increasing the number of loads. However, the Adaptive-I technique based on an exhaustive search failed to find the best combination of loads to be shed at an appropriate time, when all the loads in the system were used for load shedding, and this led the system frequency to drop in no time, which resulted in a cascaded blackout. This problem occurred because there are 281 trillion possible combinations for 48 loads. The search space required to evaluate these combinations became huge and practically infeasible, which increased the computational time. Hence the system collapsed before the load shedding took place, which can be noticed from Figure 7. Furthermore, the connected load after the islanding and DG-tripping events was maximum for the proposed technique.

5. Discussions

The main objective of all the load shedding techniques was to maximize load connection in the system with a stable frequency. It is visible from the comparison of results that a maximum load was connected in the system for the proposed technique. Moreover, the proposed load shedding scheme selected an optimal combination of loads for any contingency, incorporating load priority and the stability index to produce an SFR without any significant overshoot. The advantage of incorporating load priority and the stability index simultaneously for a load shedding technique is apparent from the SFR in Figure 8. The proposed technique was simulated with three different objective functions, as shown in Equations (11) to (13), for load shedding. The basic objective function for the proposed mathematical model found an optimal combination of loads that exactly matched an estimated power imbalance, shown in Equation (11).
O F 1 = min [ i = 1 N A i . x i + δ . w ]
O F 2 = min [ i = 1 N S I i . x i + δ . w ]
O F 3 = min [ j N C L α . S I j . x j + k S C L β . S I k . x k + l C L γ . S I l . x l + δ . w ]
The objective function in Equation (11) will estimate a combination of loads from all the system loads without any load priority. This function can be modified to include the stability index of loads for load shedding as shown in Equation (12). Including the stability index improves the voltage profile of the system as the buses with more unstable voltages are preferred for load shedding. The reliability of the system can be improved by assuring the supply to critical and semi-critical loads. Therefore, the objective function proposed for this technique shown in Equation (13) utilizes the voltage stability index and proposed load priority simultaneously to disconnect more unstable and non-critical loads first. Semi-critical loads are only shed when the power imbalance is more than the total non-critical load in the system. Intentional islanding and DG-tripping events are simulated. Figure 8 presents the frequency response of the system for this scenario, and detailed parameters of load shedding for this scenario are presented in Table 12.

5.1. Islanding Event

The grid-coupling circuit breaker was operated at a simulation time of t = 15 s to implement intentional islanding. The generation capacity of all DGs in the system was less than the total load demand, and frequency started decreasing. The proposed PIFM estimated a power imbalance of 0.39 MW in this case and activated the SICM and ILSM. The SICM then processed the system data to calculate the stability indices of all load buses and transmitted them to the ILSM. The load shedding module found the optimal combination of loads to be shed as directed by the objective functions. Stability indices of all loads are summarized in Table 7. It is evident from Figure 8 that the system frequency response (SFR) was similar in the islanding event for all three proposed objective functions. This was due to the fact that the power imbalance was smaller and the mathematical model found a unique solution which fulfilled constraints for all three objective functions. Hence optimal load shedding was performed. Table 12 also shows that loads ranked 2 and 11 were selected for shedding with minimum error and no overshoot.

5.2. DG Tripping in Islanded System

A distribution system operating in islanding is vulnerable to instability due to unplanned disconnection of a DG, which may yield a cascaded blackout. Hence a load shedding scheme should be able to compensate this scenario to prevent the system from blackout. To validate the proposed technique, the biggest DG in the system was disconnected at a simulation time of t = 60 s. The system frequency declined rapidly and the PICM actuated load shedding and it forecasted a power imbalance of 1.891 MW.
The SFR in Figure 8 for the DG-tripping event reveals that accurate load shedding was performed for the proposed technique with all three objective functions. An almost similar amount of load was shed with the three different solutions for all discussed objective functions. The stability index of all loads for this contingency is shown in Table 7. It can be observed from Table 7 and Table 12 that semi-critical loads 14, 15, and 16 were switched off when the proposed technique was tested with the load priority based on the stability index only. On the other hand, comparatively stable and semi-critical loads 14 and 16 were shed when the proposed technique was tested without any load priority. Therefore, it is conclusive that the proposed technique performed better and disconnected more unstable and non-critical loads when loads were prioritized based on both their type and stability index. Semi-critical and stable loads were disconnected from the system when it was simulated without any load priority and stability. Furthermore, it can be observed from Figure 8 and Table 7 that a load shedding solution that incorporated the stability index and load priority simultaneously increased the reliability of the power supply for critical loads and improved the stability of load buses. Hence, the proposed load shedding scheme based on MILP optimization, stability index, and load priority solved the load shedding problem much more efficiently and its performance was not affected, regardless of the number of loads.

6. Conclusions

A high number of DGs based on renewable sources in the distribution system increases the risk of blackouts when the system is disconnected from the grid. Blackouts can be avoided by performing load shedding to mitigate the unbalanced supply and load demand. Excessive, sequential, and random load shedding results in frequency response overshoot. The absence of load priority endangers the functionality of vital loads. This paper presents a robust load shedding scheme for the successful islanding operation of the distribution system. The frequency rate of change is used to estimate power imbalance, and MILP optimization finds the optimal combination from the prioritized loads. The proposed scheme was validated for different events such as islanding, generator tripping, and overloading on a Malaysian distribution network and an IEEE 69-bus system. Simulation results showed that the proposed technique produces better results and smoother frequency response as compared to adaptive techniques. The adaptive technique based on an exhaustive search is applicable to only a limited number of loads. Increasing the number of loads yields a huge number of possible combinations and thus requires a large memory size to store these combinations (281 trillion for 69-bus system loads). Moreover, it is infeasible to evaluate all the possible combinations that will require high computational time. Therefore, a blackout will occur for the IEEE 69-bus system due to the delayed response and infeasible computation memory requirement for an exhaustive search. The adaptive technique, based on a stability index of loads, increases the system voltage stability by disconnecting more unstable loads on priority to avoid unnecessary operation of under-voltage protection; however, sequential shedding of unstable loads yields excessive load shedding, resulting in overshoot, and endangers the stability of system frequency. On the other hand, prioritized shedding of comparatively more unstable non-critical loads in the proposed technique produces a smooth recovery of frequency response without any overshoot. This proves that the proposed technique is an optimal solution to the load shedding problem for any distribution network.

7. Future Works

The high share of non-synchronous generation sources in future power systems presents low or no inertia. As a result, power imbalance estimation for load shedding based on the rate of change of frequency and inertia of the system may not be reliable and efficient in practice. Moreover, AC/DC microgrids are gaining traction in modern power systems. Therefore, future work on this technique will be to propose a new load shedding scheme to mitigate the effect of low inertia of the system. Furthermore, the bidirectional power share in modern AC/DC microgrids will be investigated to avoid load shedding and maximize the power supply in the system.

Author Contributions

Conceptualization, S.S. and M.A.M.; methodology, S.S.; software, H.M. (Hasmaini Mohamed); validation, H.M. (Hazlie Mokhils) and M.A.M.; formal analysis, N.N.M.; investigation, M.O. and J.A.L.; resources, S.S., H.M. (Hazlie Mokhils) and A.P.; data curation, S.S.; writing—original draft preparation, S.S.; writing—review and editing, H.M. (Hazlie Mokhils), N.N.M. and J.A.L.; supervision, H.M. (Hazlie Mokhils) and M.O.; project administration, H.M. (Hazlie Mokhils); funding acquisition, H.M. (Hasmaini Mohamed) and A.P. All authors have read and agreed to the published version of the manuscript.

Funding

This research received no external funding.

Acknowledgments

The authors thank the University of Malaya for supporting this research under RU Grant Faculty Program (Grant code: GPF055A-2018).

Conflicts of Interest

The authors declare no conflict of interest.

Nomenclature

HiInertia constant of the ith generator
MNumber of DGs connected in the system
NTotal number of loads in the system
PDGiTotal dispatched power of DGi
MaxDGiMaximum generation capacity of DGi
d(fsys)/dtRate of change of the system frequency
Pi, Qi, Ri, and Xi,Active power, reactive power, resistance, and reactance, respectively
NCL, SCL, and CLNon-critical, semi-critical, and critical load sets, respectively
wDummy variable for MILP problem
α, β, and γCoefficients of the linear problem for load priority and optimization
fnNominal frequency
SIiStability index of ith load
PSRTotal spinning reserves
xiLoad’s circuit breaker status
PPower imbalance
PLiReal-time load value at bus i
fiFrequency of ith generator
VsiSending end voltage for the ith bus
δCoefficient of dummy variable

References

  1. Xu, T.P.D.; Li, Z.; Shieh, S.S.; Jang, S.S. Efficiency improvement of cogeneration system using statistical model. Energy Convers. Manag. 2013, 68, 169–176. [Google Scholar]
  2. Williams, J.H.; DeBenedictis, A.; Ghanadan, R.; Mahone, A.; Moore, J.; Morrow, W.R., III; Price, S.; Torn, M.S. The Technology Path to Deep Greenhouse Gas Emissions Cuts by 2050: The Pivotal Role of Electricity. Science 2012, 335, 53–59. [Google Scholar] [CrossRef] [PubMed] [Green Version]
  3. Santamouris, M.; Cartalis, C.; Synnefa, A.; Kolokotsa, D. On the impact of urban heat island and global warming on the power demand and electricity consumption of buildings—A review. Energy Build. 2015, 98, 119–124. [Google Scholar] [CrossRef]
  4. Narula, K.; Nagai, Y.; Pachauri, S. The role of Decentralized Distributed Generation in achieving universal rural electrification in South Asia by 2030. Energy Policy 2012, 47, 345–357. [Google Scholar] [CrossRef]
  5. Silva, M.; Morais, H.; Vale, Z. An integrated approach for distributed energy resource short-term scheduling in smart grids considering realistic power system simulation. Energy Convers. Manag. 2012, 64, 273–288. [Google Scholar] [CrossRef] [Green Version]
  6. Barker, P.P.; Mello, R.W.D. Determining the impact of distributed generation on power systems. I. Radial distribution systems. In Proceedings of the 2000 Power Engineering Society Summer Meeting (Cat. No.00CH37134), Seattle, WA, USA, 16–20 July 2000; pp. 1645–1656. [Google Scholar]
  7. Azmy, A.M.; Erlich, I. Impact of distributed generation on the stability of electrical power system. In Proceedings of the IEEE Power Engineering Society General Meeting, San Francisco, CA, USA, 16 June 2005; pp. 1056–1063. [Google Scholar]
  8. Xypolytou, E.; Gawlik, W.; Zseby, T.; Fabini, J. Impact of Asynchronous Renewable Generation Infeed on Grid Frequency: Analysis Based on Synchrophasor Measurements. Sustainability 2018, 10, 1605. [Google Scholar] [CrossRef] [Green Version]
  9. Lopes, J.A.P.; Moreira, C.L.; Madureira, A.G. Defining control strategies for MicroGrids islanded operation. IEEE Trans. Power Syst. 2006, 21, 916–924. [Google Scholar] [CrossRef] [Green Version]
  10. Girgis, A.A.; Ham, F.M. A New FFT-Based Digital Frequency Relay for Load Shedding. IEEE Trans. Power Syst. 1982, 2, 433–439. [Google Scholar] [CrossRef]
  11. Anderson, P.M.; Mirheydar, M. An adaptive method for setting underfrequency load shedding relays. IEEE Trans. Power Syst. 1992, 7, 647–655. [Google Scholar] [CrossRef]
  12. Jiang, H.; Yan, G.; Ji, H.; Liu, L.; Shan, D. An improved under frequency load shedding scheme based on rate of change of frequency. In Proceedings of the International Conference on Electrical and Control. Engineering (ICECE), Wuhan, China, 25–27 June 2010; pp. 292–3295. [Google Scholar]
  13. Rafinia, A.; Moshtagh, J.; Rezaei, N. Stochastic optimal robust design of a new multi-stage under-frequency load shedding system considering renewable energy sources. Int. J. Electr. Power Energy Syst. 2020, 118, 105735. [Google Scholar] [CrossRef]
  14. Chuvychin, V.N.; Gurov, N.S.; Venkata, S.S.; Brown, R.E. An adaptive approach to load shedding and spinning reserve control during underfrequency conditions. IEEE Trans. Power Syst. 1996, 11, 1805–1810. [Google Scholar] [CrossRef]
  15. Ford, J.J.; Bevrani, H.; Ledwich, G. Adaptive load shedding and regional protection. Int. J. Electr. Power Energy Syst. 2009, 31, 611–618. [Google Scholar] [CrossRef]
  16. Wang, Z.; Guo, L.; Wu, K.; Liu, W.; Zhou, J. Minimum load-shedding calculation approach considering loads difference. In Proceedings of the IEEE Innovative Smart Grid Technologies-Asia (ISGT Asia), Kuala Lampur, Malaysia, 20–23 May 2014; pp. 344–348. [Google Scholar]
  17. Nourollah, S.; Aminifar, F.; Gharehpetian, G.B. A Hierarchical Regionalization-Based Load Shedding Plan to Recover Frequency and Voltage in Microgrid. IEEE Trans. Smart Grid. 2019, 10, 3818–3827. [Google Scholar] [CrossRef]
  18. Hooshmand, R.; Moazzam, M.I. Optimal design of adaptive under frequency load shedding using artificial neural networks in isolated power system. Int. J. Electr. Power Energy Syst. 2012, 42, 220–228. [Google Scholar] [CrossRef]
  19. Santos, A.Q.; Monaro, R.; Coury, D.; Oleskovicz, M. Real-time closed loop system controlled by an Artificial Neural Network for estimation of the optimal load shedding. In Proceedings of the 12th IET International Conference on Developments in Power System Protection, Copenhagen, Denmark, 31 March–3 April 2014. [Google Scholar]
  20. Moazzami, M.; Khodabakhshian, A.; Hooshmand, R.-A. A New Optimal Under-frequency Load-shedding Method Using Hybrid Culture–Particle Swarm Optimization–Co-evolutionary Algorithm and Artificial Neural Networks. Electr. Power Compon. Syst. 2015, 43, 69–82. [Google Scholar] [CrossRef]
  21. Amraee, T.; Darebaghi, M.G.; Soroudi, A.; Keane, A. Probabilistic under frequency load shedding considering rocof relays of distributed generators. IEEE Trans. Power Syst. 2018, 33, 3587–3598. [Google Scholar] [CrossRef] [Green Version]
  22. Çimen, H.; Aydın, M. Optimal Load Shedding Strategy for Selçuk University Power System with Distributed Generation. Procedia-Soc. Behav. Sci. 2015, 195, 2376–2381. [Google Scholar] [CrossRef] [Green Version]
  23. Khezri, R.; Golshannavaz, S.; Vakili, R.; Memar-Esfahani, B. Multi-layer fuzzy-based under-frequency load shedding in back-pressure smart industrial microgrids. Energy 2017, 132, 96–105. [Google Scholar] [CrossRef]
  24. Alhelou, H.H.; Hamedani-Golshan, M.E.; Njenda, T.C.; Siano, P. Wide-area measurement system-based optimal multi-stage under-frequency load-shedding in interconnected smart power systems using evolutionary computing techniques. Appl. Sci. 2019, 9, 508. [Google Scholar] [CrossRef] [Green Version]
  25. Santos, A.Q.; Shaker, H.R.; Jørgensen, B.N. A Holistic Fuzzy Measure for Load Priority in Under Frequency Load Shedding Schemes. In Proceedings of the International Symposium on Advanced Electrical and Communication Technologies (ISAECT), Rabat-Kenitra, Morocco, 21–23 November 2018; pp. 1–6. [Google Scholar]
  26. López, K.; Pérez, S.; Rodríguez, L. Optimal under voltage load shedding based on voltage stability index. Ing. Investig. 2016, 36, 43–50. [Google Scholar]
  27. Yusof, N.A.; Rosli, H.M.; Mokhlis, H.; Karimi, M.; Selvaraj, J.; Sapari, N.M. A new under-voltage load shedding scheme for islanded distribution system based on voltage stability indices. IEEE Trans. Power Syst. 2017, 12, 665–675. [Google Scholar] [CrossRef]
  28. Laghari, J.A.; Mokhlis, H.; Karimi, M.; Bakar, A.H.A.; Mohamad, H. A New Under-Frequency Load Shedding Technique Based on Combination of Fixed and Random Priority of Loads for Smart Grid Applications. IEEE Trans. Power Syst. 2015, 30, 2507–2515. [Google Scholar] [CrossRef]
  29. Dreidy, M.; Mokhlis, H.; Mekhilef, S.J.E. Application of meta-heuristic techniques for optimal load shedding in islanded distribution network with high penetration of solar PV generation. Energies 2017, 10, 150. [Google Scholar] [CrossRef] [Green Version]
  30. Laghari, J.A.; Mokhlis, H.; Bakar, A.H.A.; Mohamad, H. Application of computational intelligence techniques for load shedding in power systems: A review. Energy Convers. Manag. 2013, 75, 130–140. [Google Scholar] [CrossRef]
  31. Chakravorty, M.; Das, D. Voltage stability analysis of radial distribution networks. Int. J Electr. Power Energy Syst. 2001, 23, 129–135. [Google Scholar] [CrossRef]
  32. Muhammad, M.A.; Mokhlis, H.; Naidu, K.; Amin, A.; Franco, J.F.; Othman, M. Distribution Network Planning Enhancement via Network Reconfiguration and DG Integration using Dataset Approach and Water Cycle Algorithm. J. Mod. Power Syst. Clean Energy 2020, 8, 86–93. [Google Scholar] [CrossRef]
Figure 1. Block diagram of the proposed load shedding scheme.
Sustainability 12 06234 g001
Figure 2. Flowchart of the proposed intelligent load shedding module (ILSM).
Sustainability 12 06234 g002
Figure 3. The 28-bus distribution system.
Sustainability 12 06234 g003
Figure 4. The IEEE 69-bus system.
Sustainability 12 06234 g004
Figure 5. System frequency response (SFR) comparison for islanding and DG tripping (28-bus system).
Sustainability 12 06234 g005
Figure 6. SFR for all discussed techniques in islanding and overloading events (28-bus system).
Sustainability 12 06234 g006
Figure 7. SFR comparison (IEEE 69-bus system).
Sustainability 12 06234 g007
Figure 8. SFR comparison for the proposed technique.
Sustainability 12 06234 g008
Table 1. Load data for the 28-bus Malaysian distribution system.
Load RankingBus No.LoadLoad RankingBus No.Load
P (MW)Q (MVAR)P (MW)Q (MVAR)
110500.0440.041110460.320.16
210130.0690.0421211410.220.214
310470.0590.0881310640.220.192
410260.0910.0281410570.460.125
510120.3140.1251510580.3850.213
610100.450.081611540.3150.126
710390.45320.2441710040.330.128
810200.0780.061811510.4550.106
910190.220.141910560.5950.344
1010180.20.122010290.5320.425
Table 2. Load data for the IEEE 69-bus system.
Load RankBus No.P
(MW)
Q
(MVAR)
Load RankBus No.P
(MW)
Q
(MVAR)
Load RankBus No.P
(MW)
Q
(MVAR)
162.62.2172614103349384.7274.5
2740.430182714103450384.7274.5
38755419282618.6355140.528.3
49302220292618.636523.62.7
51028192133141037534.353.5
61114510422349.514385426.419
71214510423356439552417.2
8138524362618.6405910072
91485.525372618.5541611244888
101645.5302639241742623223
11176035274024174364227162
1218603528411.2144655942
132010.6294364.345661813
142111481304539.2226.346671813
152253.5314639.2226.347682820
1624282032487956.448692820
Table 3. Optimal distributed generator (DG) size and location for the IEEE 69-bus system.
DGBus No.P
(MW)
Q
(MVAR)
Hydro 1110.790.54
Hydro 2490.860.62
Biomass611.591.13
Table 4. Load data for the adaptive technique.
Loads RankedBus No.P
(MW)
a10500.044
b10130.069
c1047,10260.15
d10120.314
e1010,10390.903
f1020, 1019, 1018, 10460.818
g11410.22
h10640.22
Table 5. Stability indices for the islanding event.
Sr. NoProposedAdaptive-IAdaptive-IIConventional
RankStabilityRankStabilityRankStabilityRankStability
170.075770.075770.075770.0757
260.168660.168660.168660.1686
3110.236110.236110.236110.236
490.31390.31390.31390.313
5100.3161100.3161100.3161100.3161
620.326720.326720.326720.3267
710.333610.333610.333610.3336
840.344840.344840.344840.3448
980.349180.349180.349180.3491
1050.361950.361950.361950.3619
1130.424430.424430.424430.4244
12140.1975140.1975140.1975140.1975
13150.2487150.2487150.2487150.2487
14160.2644160.2644160.2644160.2644
15130.2964130.2964130.2964130.2964
16120.4083120.4083120.4083120.4083
17180.0874180.0874180.0874180.0874
18170.2291170.2291170.2291170.2291
19200.2318200.2318200.2318200.2318
20190.2842190.2842190.2842190.2842
Colored boxes show the load shed in the current event. Sustainability 12 06234 i001 proposed scheme, Sustainability 12 06234 i002 adaptive-I scheme, Sustainability 12 06234 i003 adaptive-II scheme and Sustainability 12 06234 i004 conventional scheme.
Table 6. Frequency stability parameters for comparison (Scenario I).
ParametersIslanding EventDG-Tripping Event
PropAdap-IAdap-IIConvPropAdap-IAdap-IIConv
Power imbalance (MW)0.390.390.390.391.8911.8911.8911.89
Load shed amount (MW)0.380.320.4530.571.8902.0712.3042.127
Excessive load shed (MW)−0.001−0.0070.0630.18−0.0010.180.4140.237
Loads switched off2, 11b, d71–51, 4, 5, 6, 7, 10, 15a–g1–11,141–13
Frequency undershoot (Hz)49.45349.45249.4849.148.84948.8648.54
Frequency overshoot (Hz)--50.2850.5-50.2853.651.7
Table 7. Stability index of load buses for DG-tripping event.
Sr. NoProposedAdaptive-IAdaptive-IIConventional
RankStabilityRankStabilityRankStabilityRankStability
12-2-7-1-
211-5-60.16672-
370.074970.0749110.23934-
460.166760.166790.31865-
590.3186110.239310.32063-
610.320690.3186100.321470.0749
7100.321410.320620.339560.1667
840.3488100.321440.3488110.2393
980.355540.348880.355590.3186
1050.378380.355550.3783100.3214
1130.428730.428730.428780.3555
12140.1894140.1894140.1894140.1894
13150.2465150.2465150.2465150.2465
14160.2504160.2504160.2504160.2504
15130.2906130.2906130.2906130.2906
16120.4234120.4234120.4234120.4234
17180.0851180.0851180.0851180.0851
18200.2225200.2225200.2225200.2225
19170.2404170.2404170.2404170.2404
20190.285190.285190.285190.285
Colored boxes show the load shed in the current event. Sustainability 12 06234 i001 proposed scheme, Sustainability 12 06234 i002 adaptive-I scheme, Sustainability 12 06234 i003 adaptive-II scheme and Sustainability 12 06234 i004 conventional scheme.
Table 8. Stability index of load buses for the overloading event.
Sr. NoProposedAdaptive-IAdaptive-IIConventional
RankStabilityRankStabilityRankStabilityRankStability
12-2-7-1-
211-5-60.16892-
370.076270.0762110.23393-
460.168960.168990.3124-
590.312110.2339100.31515-
6100.315190.31220.327270.0762
710.3311100.315110.331160.1689
840.342410.331140.3424110.2339
980.348340.342480.348390.312
1050.363180.348350.3631100.3151
1130.421630.421630.421680.3483
12140.1941140.1941140.1941140.1941
13150.2437150.2437150.2437150.2437
14160.2615160.2615160.2615160.2615
15130.2959130.2959130.2959130.2959
16120.409120.409120.409120.409
17180.0875180.0875180.0875180.0875
18170.2295170.2295170.2295170.2295
19200.2301200.2301200.2301200.2301
20190.2804190.2804190.2804190.2804
Colored boxes show the load shed in the current event. Sustainability 12 06234 i001 proposed scheme, Sustainability 12 06234 i002 adaptive-I scheme, Sustainability 12 06234 i003 adaptive-II scheme and Sustainability 12 06234 i004 conventional scheme.
Table 9. Frequency stability parameters for overloading after islanding.
ParametersPropAdap-IAdap-IIConv
Power imbalance (MW)0.750.750.750.75
Excessive load shed (MW)0.0010.0680.020.15
Loads switched off7, 8, 9F6, 116, 7
Frequency undershoot (Hz)49.3849.4349.4448.81
Frequency overshoot (Hz)50.0750.0950.3350.87
Table 10. Frequency stability parameters for comparison with Adaptive-II and conventional techniques.
ParametersIslanding EventDG Tripping Event
PropAdap-IIAdap-IPropAdap-IIAdap-I
Power imbalance (MW)0.5630.5630.5630.7970.797Blackout
Excessive load shed (MW)00.031Blackout00.125
Loads switched off3, 4, 6, 7, 14, 16, 207, 10, 11, 12, 13–242–7, 9–12, 14–17, 19–22, 24, 32, 331–31, 33, 35, 36
Frequency undershoot (Hz)49.4249.4449.3949.53
Frequency overshoot (Hz)-50.09-50.7
Table 11. Stability indices for islanding and DG tripping (69-bus System).
Sr.
No
IslandingDG Tripping
ProposedAdaptive-IIProposedAdaptive-II
RankStabilityRankStabilityRankStabilityRankStability
170.499570.49957-7-
2230.5135230.513514-10-
3220.5179220.517916-11-
4210.5344210.53444-12-
5140.5399140.53996-13-
6160.5987160.598720-14-
7170.6075170.60753-15-
8180.6108180.6108110.203916-
9110.6201110.6201230.208417-
10150.6276150.6276220.208918-
11130.6440130.6440210.217119-
12200.6483200.6483170.223320-
13120.6638120.6638180.225521-
14100.6731100.6731100.229822-
15240.6896240.6896150.232123-
16190.6896190.6896130.233224-
1740.707140.7071120.235740.2343
1890.712890.712890.240390.2519
1910.729010.729080.244980.252
2080.731080.731050.256250.2587
2120.734820.734820.276260.2672
2230.753830.753810.281320.2765
2350.770450.7704240.283630.2766
2460.784860.7848190.283610.2837
25310.5748310.5748310.2283310.2379
26300.5806300.5806300.2306300.2404
27290.5974290.5974290.2389290.249
28280.6144280.6144280.2469280.2574
29270.6254270.6254270.2522270.2629
30260.6399260.6399260.2591360.2673
31250.6746250.6746360.267260.2702
32360.7151360.7151350.276350.2763
33330.7303330.7303250.2767250.2885
34350.7344350.7344330.3233330.331
35320.7825320.7825320.3559320.3641
36340.7989340.7989340.365340.3733
Colored boxes show the load shed in the current event. Sustainability 12 06234 i001 proposed scheme, Sustainability 12 06234 i002 adaptive-II scheme.
Table 12. Load shedding parameters for the proposed scheme.
ParametersIslandingDG Tripping
Prop.St.PrPro.StProp(W/O) PriorityProp.St.PrProp.StProp(W/O) Priority
Power imbalance (MW)0.390.390.391.8911.8911.891
Additional load disconnected (MW)0.0010.0010.001−0.00100
Loads switched off2, 112, 112, 111, 4, 5, 6, 7, 10, 157, 8, 10, 14, 15, 161, 4, 6, 7, 8, 14, 16
Frequency undershoot (Hz)49.45349.45349.45348.848.8948.78
Frequency overshoot (Hz)----50.0350.01

