Article

Evaluation of the Effects of Grouping High Capacity Students in Academic Achievement and Creativity

by
Dolores Valadez
1,
Julián Betancourt
2,*,
Juan Francisco Flores Bravo
1,
Elena Rodríguez-Naveiras
3 and
Africa Borges
4
1
University Center of Health Sciences, University of Guadalajara, Guadalajara, Jalisco 44340, Mexico
2
Jalisco Educational Center for High Abilities, Jalisco Education Secretary, Guadalajara, Jalisco 44100, Mexico
3
Faculty of Social Sciences, Universidad Europea de Canarias, 38300 La Orotava, Spain
4
Departament of Clinical Psychology, Psychobiology and Methodoly, Universidad de La Laguna, 38205 Santa Cruz de Tenerife, Spain
*
Author to whom correspondence should be addressed.
Sustainability 2020, 12(11), 4513; https://doi.org/10.3390/su12114513
Submission received: 23 April 2020 / Revised: 19 May 2020 / Accepted: 29 May 2020 / Published: 2 June 2020
(This article belongs to the Special Issue High Abilities, Talent and Creativity)

Abstract

:
The objective of this research was to determine the effect of grouping on the academic performance and creativity of 87 students from the Jalisco educational center for high abilities (CEPAC). Gains in academic performance and creativity due to grouping were hypothesized to be correlated with time spent at CEPAC. The Creative Imagination Test for Children (PIC-N) and for young people (PIC-J) were used, as well as the scores obtained in Spanish, mathematics and the general average at the entrance to the center at the end of the 2019 school year. The test was applied collectively to students when they joined the educational center, and after the end of the 2019 school year. In order to determine if there are improvements in academic scores after being included in CEPAC and to determine if there were changes in creativity, ANOVA split plot were carried out. To determine the relationship between school scores and creativity, Pearson correlations were performed. The results showed gains in academic performance and creativity when the permanence of students in the educational center is longer. It is concluded that grouping by ability produces gains in academic performance and in some components of creativity.

1. Introduction

The high ability students have characteristics that differentiate them from the community samples [1]: speed in learning [2], faster understanding of abstract or highly complex problems [3,4], mastery of the verbal area, good problem-solving skills [5], great capacity to store and manage information, good level of understanding and varied interests and great curiosity about the environment [6], better organization of information and greater capacity for abstraction [3] and neural efficiency [7]. All these attributes make it necessary to offer them a specific educational response, according to their abilities, since, if they do not do so, problems may arise. Thus, it is common for boredom to occur due to a lack of challenges [8] or due to excessively repetitive tasks [9] with their consequent effect on motivation and poorer school performance [10,11]. Another important problem is, given the excessive ease of school content, that study habits are not acquired [12].
Within the school, three responses have been given to this student body: enrichment, acceleration and ability grouping. While enrichment is about providing opportunities for highly capable students to go beyond the regular curriculum, either by broadening topics or by deepening content from different approaches [13,14,15], acceleration, which can take various forms [16], allows students to move at a faster pace in their transit through school [17,18].
The ability grouping, on the other hand, brings together students with high capacities according to their intellectual abilities and skills with the aim of improving their academic performance through an enriched, differentiated curriculum in accordance with their characteristics, needs and learning pace. It is based on the idea that teaching is best suited to the specific needs of students, particularly high ability students [19,20,21].
Grouping began in 1920 in the United States with the heyday of psychological testing, as the influence of the Stanford-Binet approach to diagnosis spread [22], with the creation of educational centers with the grouping modality, especially in the area of science [23]. It had its greatest development until the 1980 s, when its use began to decline, due to negative opinions about this practice in various political, social and academic sectors where it was considered not to favor equity and equality in the classroom, as it was a form of non-inclusive intervention. During this period, the attention to students with intellectual disabilities increased and that of the most capable students decreased, seeking an egalitarian space for all and ceasing to be fair and equitable with those of high ability [24,25,26], although this type of program is still in force today, and the subject has a great deal of research. In Kulik’s classic study [27] the author pointed out that American education could be damaged if ability grouping programs were eliminated.
As with other educational procedures for high ability students, grouping may be done in many different ways. Following the classification of [28], four clustering groups can be established: (a) between-class ability grouping, where students are assigned of the same grade into high, average or low classes based on their prior achievement or ability levels; (b) within-class ability grouping, where students are assigned by teachers within a class to several small homogeneous groups for instruction based on students’ prior achievement or learning capacities; (c) cross-grade subject grouping, which involves grouping students of different grade levels together to learn a particular subject based on their prior achievement or learning potential; and (d) special grouping for the gifted, which often refers to educational and instructional programs that were designed specifically for gifted and talented students.
The scientific literature concerning the advantages and disadvantages of grouping is very broad, both for aspects of personal and social adjustment (big-fish-little-pond [29]) and for the effect it has on academic performance. Studies on BFLP produce disparate results, ranging from an effect of diminished academic self-concepts [29], decreases in self-concept, but not in school satisfaction [30] or that these effects may be short-lived or even not occur at all [31,32].
In terms of academic performance, research also shows very mixed results, from inconclusive [33], to no academic advantage [34] to positive effects [35,36]. Clear differences in effects have also been found for all forms of clustering designed for gifted or talented students [28,37]. The lack of effects may be due to the disparity of educational responses that fall under the grouping label.
Another aspect of great relevance is the design of the curriculum for this student body. The theory behind their training will have global implications, including objectives, guidelines, participant selection and educational methods [15]. A fundamental challenge for schools is to prepare students to develop skills that will prepare them for the world of work in the 21st century [38,39].
Among the various approaches, problem-based learning (PBL, [40]) proves to be especially suitable for this student body, since it confronts students with complex problems of daily life that they must solve following the same protocol used by professionals in the area, which implies that the student body employs alternative processes to those of the regular curriculum. They are particularly suitable for the training of high capacity students [39,41,42].
In addition, in the same sense of preparing students for working life, social changes and the introduction of technology into daily life, it requires a different approach to education. In this scenario, creativity plays a fundamental role, especially in addressing STEM (science, technologies, engineering & mathematics) careers [43]. However, creativity, despite being a rising value, does not receive the attention it would require within the school. Without entering here into the debate on the relationship between high capacity and creativity, as it remains unresolved whether both constructs are independent [44], highly related or even that creativity is necessary to achieve excellence [45] or connected by threshold [46].
On the other hand, it is important to note that the relationship between creativity and performance is also under discussion. The contribution of creativity to performance continues to yield mixed results, which may have various explanations: (a) the instruments for measuring creativity; (b) the measurement of academic qualifications; (c) the influence of the g-factor of intelligence and creativity; (d) different methods of analysis; and (e) mediating factors, such as place and time [47].
Despite the fact that creativity is considered fundamental in the development of the school curriculum [48] and the statements of teachers in favor of creativity, many teachers prefer less creative students [49], although it is also important that they are trained in the use of creativity in their classes [50,51]. Gralewski [47] found mixed results: while in some schools the relationship between school grades and creativity was zero or negative, in others (large schools, large cities) the relationship was positive. The meta-analysis by [52] points to the existence of a modest, but significantly positive association, which only explains 5% of the variance in creativity and academic achievement. However, they found that the way in which both academic achievement and creativity are measured are important moderating variables.
In view of the findings shown in the specialized literature on clustering, it is essential to assess the effects that this type of academic response has on students. In addition, special grouping is growing in Mexico recently, which requires that the effectiveness of special grouping in academic performance be evaluated. However, the evaluation of effects should not be limited to the academic aspect, but, given the importance of creativity for integration into new professional challenges, it should also include whether this academic response allows for increased creativity. For this reason, this research was carried out with the objective of determining the effect of special grouping for the gifted on academic achievement and creativity. Gains in both academic performance and creativity due to gifted are hypothesized to be greater the longer they have spent at the High Ability Education Center (Centro Educativo para Altas Capacidades, CEPAC in its Spanish acronym).

2. Materials and Methods

2.1. Participants

The procedure for selecting participants was by convenience sampling. Twenty-two primary and 65 secondary students from the Centro Educativo para Altas Capacidades, a public school under the clustering modality, participated and were previously selected after applying all the eligibility instruments and obtaining a high intellectual capacity (minimum IQ of 130) or an academic talent with a minimum school grade of 9 on a scale of 1 to 10.
The average age of primary school students was 10.32 years, with a standard deviation of.995, ranging from 9 to 12 years. A total of 54.50% were female and 45.50% were male. The average age of secondary school students was 13 years, with a standard deviation of 0.923 and a range of 11 to 15 years. A total of 29% were female and 71% were male. Table 1 shows the number of students by year of stay in CEPAC and gender.

2.2. Instruments

The Creative imagination test for children (PIC-N, [53]) and for youth (PIC-J, [54]) was used. Both tests provide a total score for creativity and a score for narrative and graphic creativity. It also provides a score for each variable that makes up narrative creativity (fluidity, flexibility and originality) and graphic creativity (originality, title, elaboration and special details). The PIC-N was aimed at children from 8 to 12 years old, it had a reliability of 0.83, while the PIC-J was aimed at adolescents from 12 to 18 years old, it had a reliability of 0.85.
Furthermore, used were the grades obtained in Spanish, mathematics and the general average upon entry into CEPAC as at the end of the 2019 school year.

2.3. Procedure

The Center started in 2017, but registrations were still opened every year. In Primary School a maximum of 15 students were admitted for each grade, while in Secondary School there were two groups per grade, also with 15 students per group.
CEPAC was located in Guadalajara, Jalisco, Mexico. It was a full-time public school of educational innovation at the basic level under the modality of clustering, offering specialized attention to students with high abilities by providing spaces adapted and equipped to meet the educational needs they demand, which makes it unique in its kind in the west of the country.
Its educational model was based on an innovative program, which takes as a reference the curricular plan established by the Ministry of Public Education (SEP) of Mexico, but making the curricular differentiation and working on the deepening and complexity of the contents. One of its main teaching strategies was project based learning (PBL). Through this, students acquire knowledge and skills of reflective thinking, learn to solve complicated problems and develop complex tasks to address the contents of learning units throughout the school cycle.
PBL activities were linked to the areas of science, Technology, engineering, arts, mathematics and Humanities (STEAM+H) for problem solving from a multifaceted and interdisciplinary perspective. STEAM+H includes the integration of all subjects that can be problematized, thus addressing aspects related to various fields of human endeavor through the development of projects so that the most gifted students were aware of the possible relationship between art, science, creativity, technology and humanities in a given topic in order to satisfactorily face the challenges of today’s world.
Creativity was one of CEPAC’s cross-cutting themes; it was worked on using three teaching methods: (1) The analogical method, which seeks similar relationships between different problems or situations; (2) The antithetical methods, which break problems down into parts, crumbling them until they cannot be recognized; (3) The random methods, which make it possible to make forced, casual, artificial correlations between what was already known and what was not.
In CEPAC’s educational model, technology was the neuralgic part of the learning process. It was through digital media that students will build and develop projects, design and make decisions to solve problems.
Likewise, in order to carry out the integral learning that high ability students demand, specific extracurricular enrichment actions were developed through laboratories, which were offered from Monday to Friday for two hours a day. Each laboratory offers new ideas, specific vocabulary, specialized technology and new challenges, each one of them differentiated by the level of content, process and products, encouraging students to work independently and in teams during the sessions, during their free time and at home.
The aforementioned methodology was deepened through the creativity and Innovation Laboratory, which aims to develop creative and innovative thinking for problem solving through innovative projects that impact the community and link up with companies and institutions for their realization.
Throughout different moments of intervention, students develop basic creative thinking skills (fluency, flexibility, originality, sensitivity, imagination, evaluation and critical thinking), which allows them to go from a novice to an expert level of creativity. The modules that make up their work methodology were: (a) Let it rain! This was an awareness stage through which, by means of exploratory activities, we seek to motivate students to discover their innovative and creative potential. (b) creativity in action. Taking specific methodologies as a reference, students develop projects linked to the real context to offer a possible solution to the problems of their environment. (c) Change agent. Students start to research their own interests and carry out innovative projects that generate a positive impact on some area of human activity and were profitable. In order to make this possible, the student was encouraged to link up with the entrepreneurial environment either in person or online through conferences, workshops and the advice of experts in the subjects developed, to carry out their own business plan (market study, value proposal, investment, project evaluation), to implement it, to supervise it and to improve it continuously.
Through various digital tools, the work developed by the students was guided and monitored. At the end of each module, the students present their products and results obtained inside and outside the school.
The academic performance grades that make up the data in this study were collected at two points in time: at the end of the studies at the center prior to CEPAC (pre) and after the end of the 2019 school year (post). The creativity test was applied collectively to the admission of the student to the educational center (pre), and after the end of the 2019 school year (post), once the parents had signed the informed consent, where they were informed of the objective of the study.
When students join the center, their parents were asked for informed consent to apply psychological tests for research purposes and to assess the student’s pedagogical process by the Educational Institution.
Second, the Ethics Committee for Research and Animal Welfare of the University of La Laguna was asked for authorization to carry out this research, which was granted by means of certification, with Registration Number: CEIBA2020-0385.
Finally, the confidentiality of the data had been guaranteed, without the existence of records that would allow individual identification of the participants in the research.

2.4. Data Analysis

To determine the reliability of the PIJ test of creativity, the Cronbach’s alpha was calculated, both in the first and second phase of data collection, using SPSS v.21 software.
The ANOVA assumptions were checked, calculating in the case of normality the Shapiro–Wilk test for small samples and, for n values above 50, Kolmogorov–Smirnov. The contrast of heterostaticity was performed with Levene’s test. In case of heteroscedastic distributions, the Brown–Forsythe was carried out.
In order to determine whether there were improvements in academic scores after being included in the CEPAC school and to determine whether there were changes in creativity, ANOVA split plot or mixed model design, was carried out, taking as the intra-group variable the time of data collection (before starting school and after participating in it) and the inter-group variable the amount of years spent in school (1, 2 or 3). To determine the relationship between school scores and creativity, Pearson correlations were made. The software used was SPSS, version 21.

3. Results

3.1. Reliability

In this research, only the PIJ creativity test was used, so the reliability was calculated, for the two passing moments, using Cronbach’s alpha. The coefficient obtained for the data collected in the first pass of the test was 0.817 and in the last data collection was 0.801.

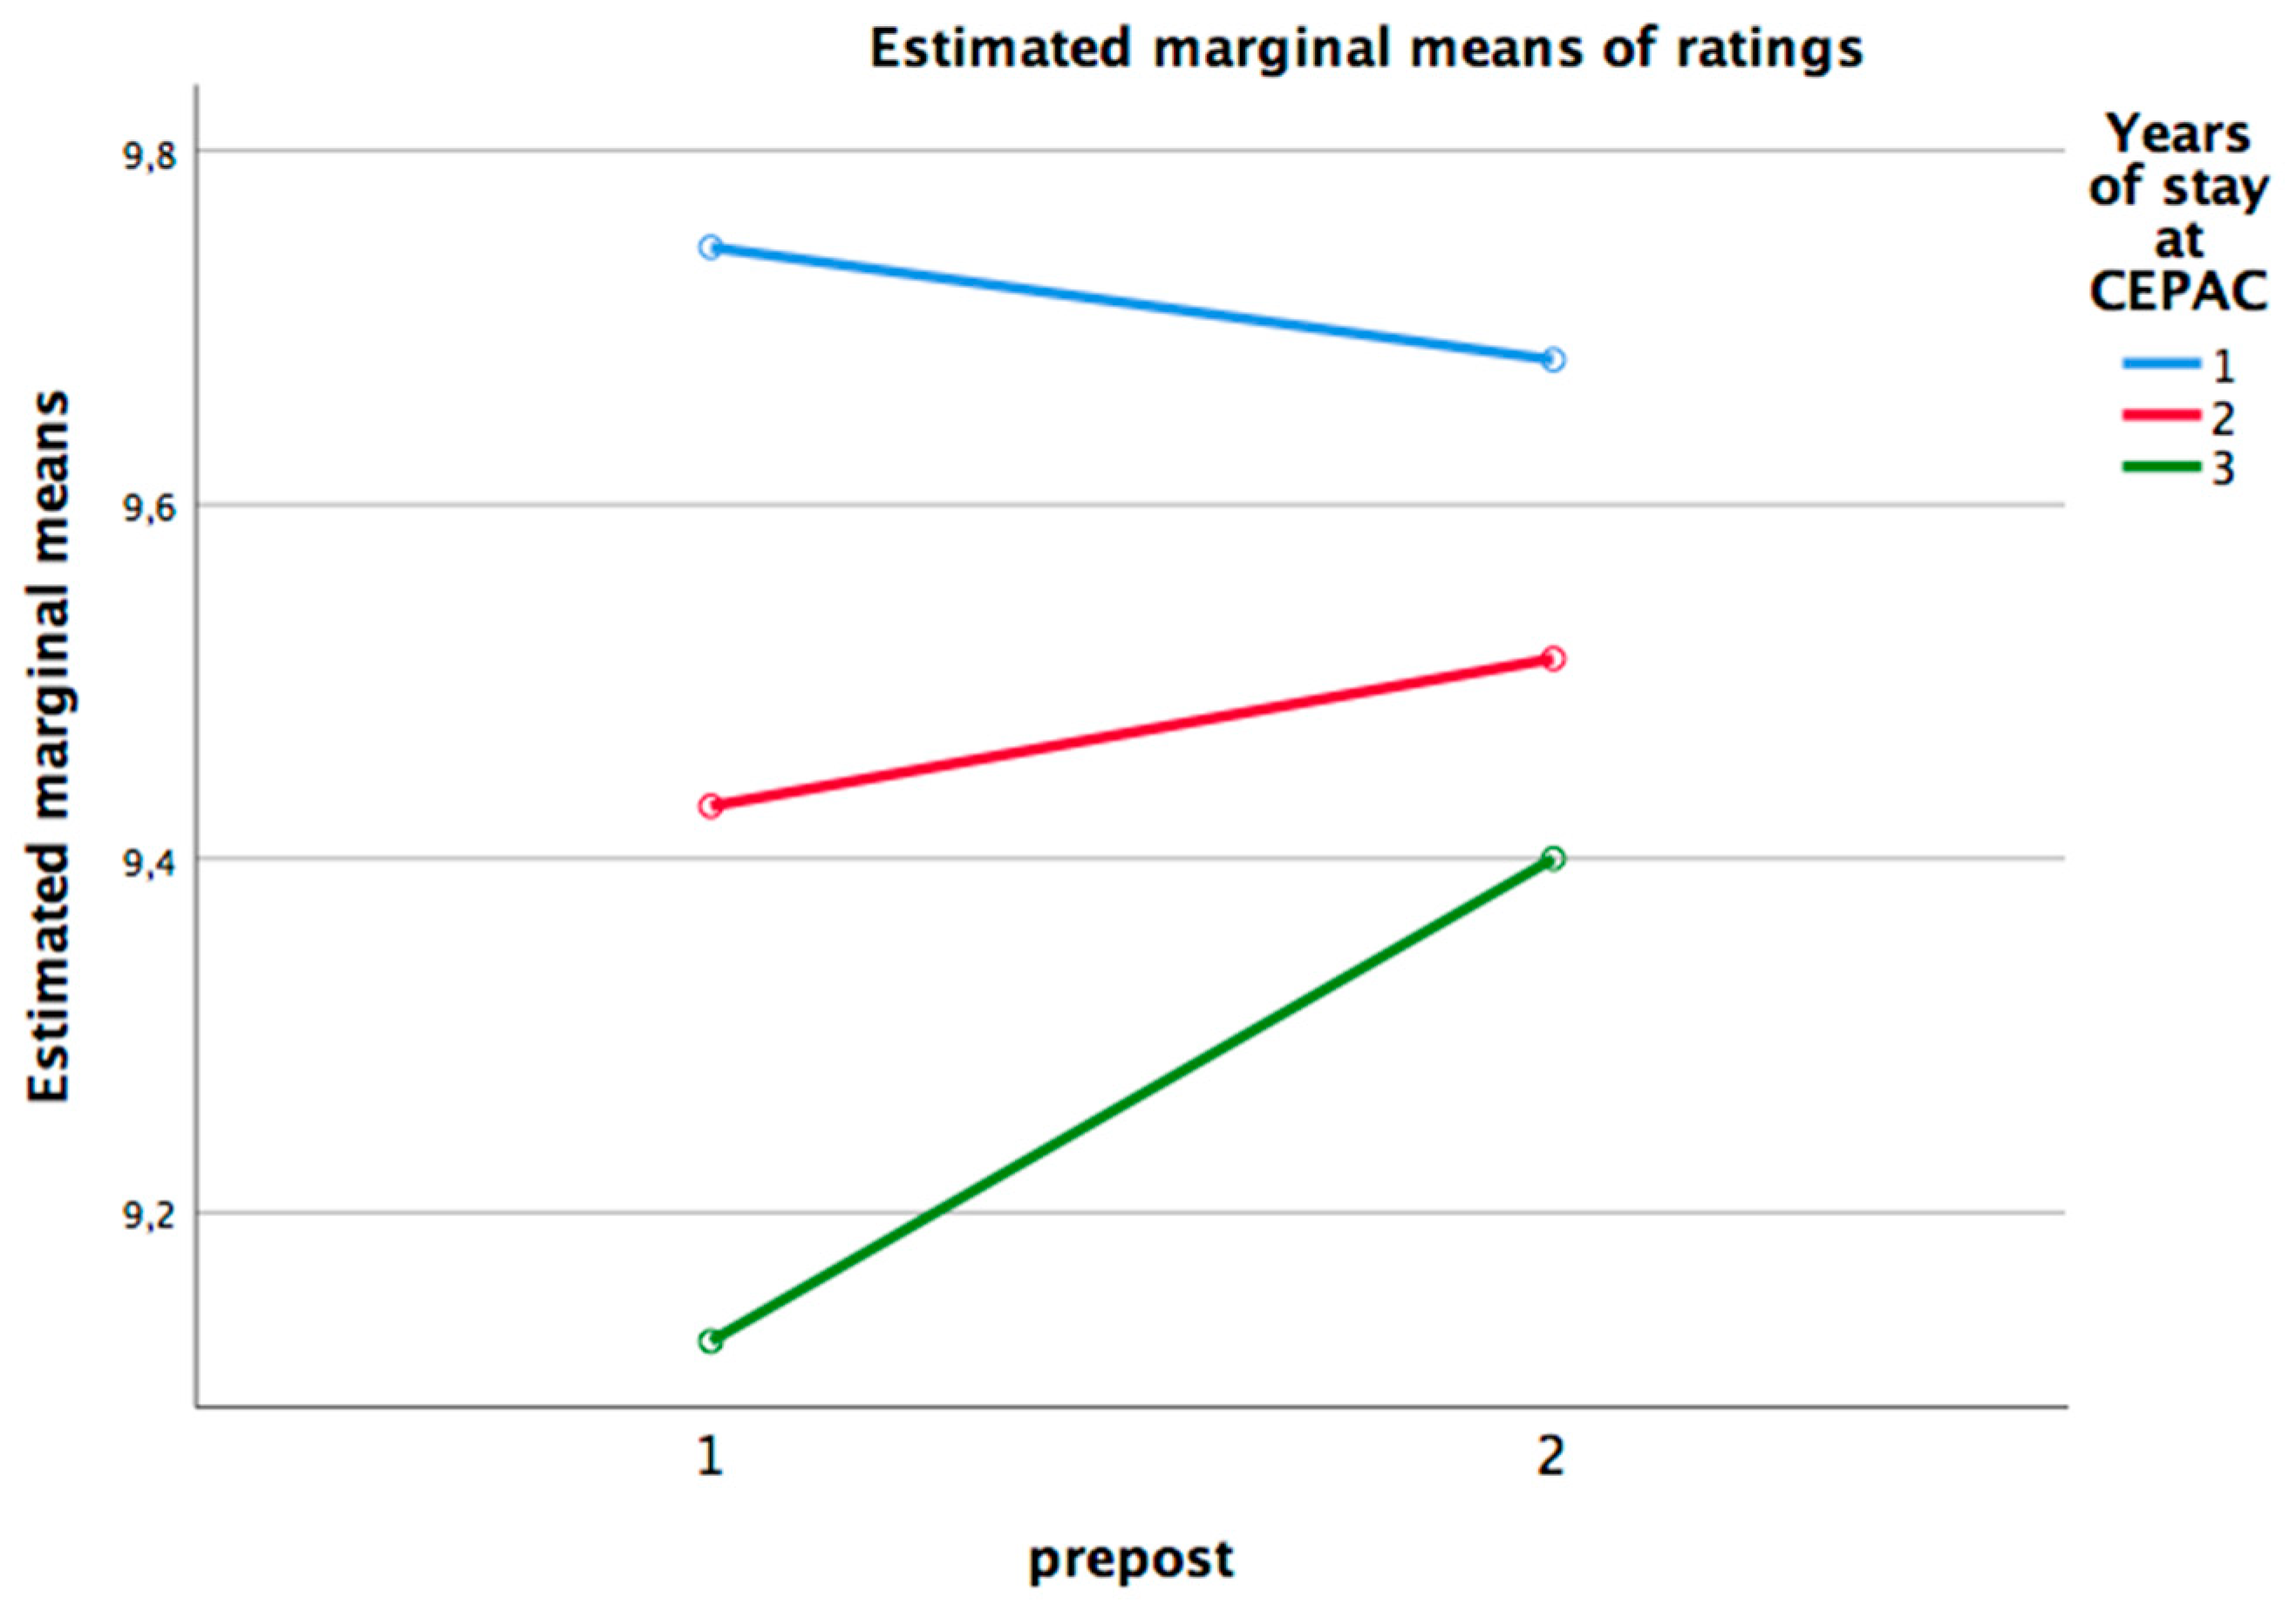
3.2. Effect of Clustering on Academic Achievement

To determine the effect of the grouping on academic grades (average, Spanish and mathematics), ANOVA split plot was carried out, taking as the intra-group variable the time of data collection (before starting school and after participating in it) and the inter-group variable the years spent in CEPAC (one year, two or three). The descriptive results are shown in Table 2.
To determine the normality of the distributions, the Kolmogorov–Smirnov test was calculated for the group with two years of stay (n greater than 50) and Shapiro–Wilk for the other two groups (Table 3).
Homoscedasticity was tested using Levene’s test and the results are shown in Table 4.
As shown in Table 5, significant differences were obtained in the three contrasts of the Grade point average score (pre–post, years of stay and interaction). The effect sizes are medium. In Spanish, both the pre–post difference and the years of stay in CEPAC are significant, with the effect size being medium for the pre–post variable and large for the years of stay in CEPAC. In mathematics, none of the contrasts were significant, although the effect sizes for the stay years and for the interaction are medium.
As it is verified heteroscedasticity in grade point average and Spanish, both in the pre measurement, the robust statistic Brown–Forsythe is calculated (Table 6). Differences are significant in both cases.
Given that the interaction between grade point average and years of stay at CEPAC was significant, Figure 1 was obtained.
To check where the differences in the interaction occur, simple effects contrasts were made. Significant differences appear in the second and third year, with medium and large effect sizes, respectively (Table 7).
To check between which values of the variable years of stay in CEPAC there were significant differences, the contrast Tukey’s HDS was made in the variable grade point average and in Spanish (years of stay al CEPAC, Mean difference, error deviation (error dev.) and significance (sig.)). There were significant differences between the one-year and three-year stay, with improvements in performance. In Spanish there are differences between students who have stayed one year and those who have stayed two years and those who have stayed three years (Table 8).

3.3. Creativity and Academic Achievement

To verify the type of relationship between creativity and academic achievement, we analyzed Pearson’s correlation between Grade point average at the end of the previous school (pre) with the total score in creativity when entering CEPAC (r = 0.085, p = 0.435), making another correlation between Grade point average and total creativity post, both scores obtained at the end of the 2019 school year. A significant correlation was obtained (r = 0.272, p = 0.011), which means that both variables share a 7% variance.

3.4. Effects in Narrative Creativity of the Ability Grouping

To study whether there are differences between the different scales of narrative creativity depending on the time of the evaluation (when entering CEPAC and in the subsequent evaluation) and the years spent at the center, ANOVA split plot contrasts were made. The descriptive results for the three scales of narrative creativity, both in terms of the time of evaluation, before starting their studies at CEPAC and at the current time (pre–post) are presented in Table 9.
The calculation to verify the assumption of normality was carried out with the Kolmogorov–Smirnov tests for the group with two years of stay (n greater than 50) and Shapiro–Wilk for the other two groups (Table 10). In general, the distributions are normal, except in the second year, fluency pre, flexibility pre and narrative originality post.
In order to determine the equality of variances, a Levene’s test was calculated (Table 11).
The ANOVA split plot contrasts are presented in Table 12, being the intra-group variable the time of evaluation (pre–post) and the inter-group variable the years of stay in the Center.
There were no significant effects due to interaction, although the effect sizes are small in fluency and flexibility and medium in narrative originality.
The differences were significant for the time of evaluation (pre–post) in all scales. Gains are observed in all scales of narrative creativity. The effect sizes are large in fluency and narrative originality and medium in flexibility.
In the variable time spent in CEPAC there are only significant differences in flexibility. The Tukey’s HDS test is presented in Table 13, noting that the differences are significant between two and three years of stay in CEPAC, with higher scores obtained for students who have been at the center for three years. The effect sizes are medium in Fluency and flexibility and small in narrative originality.

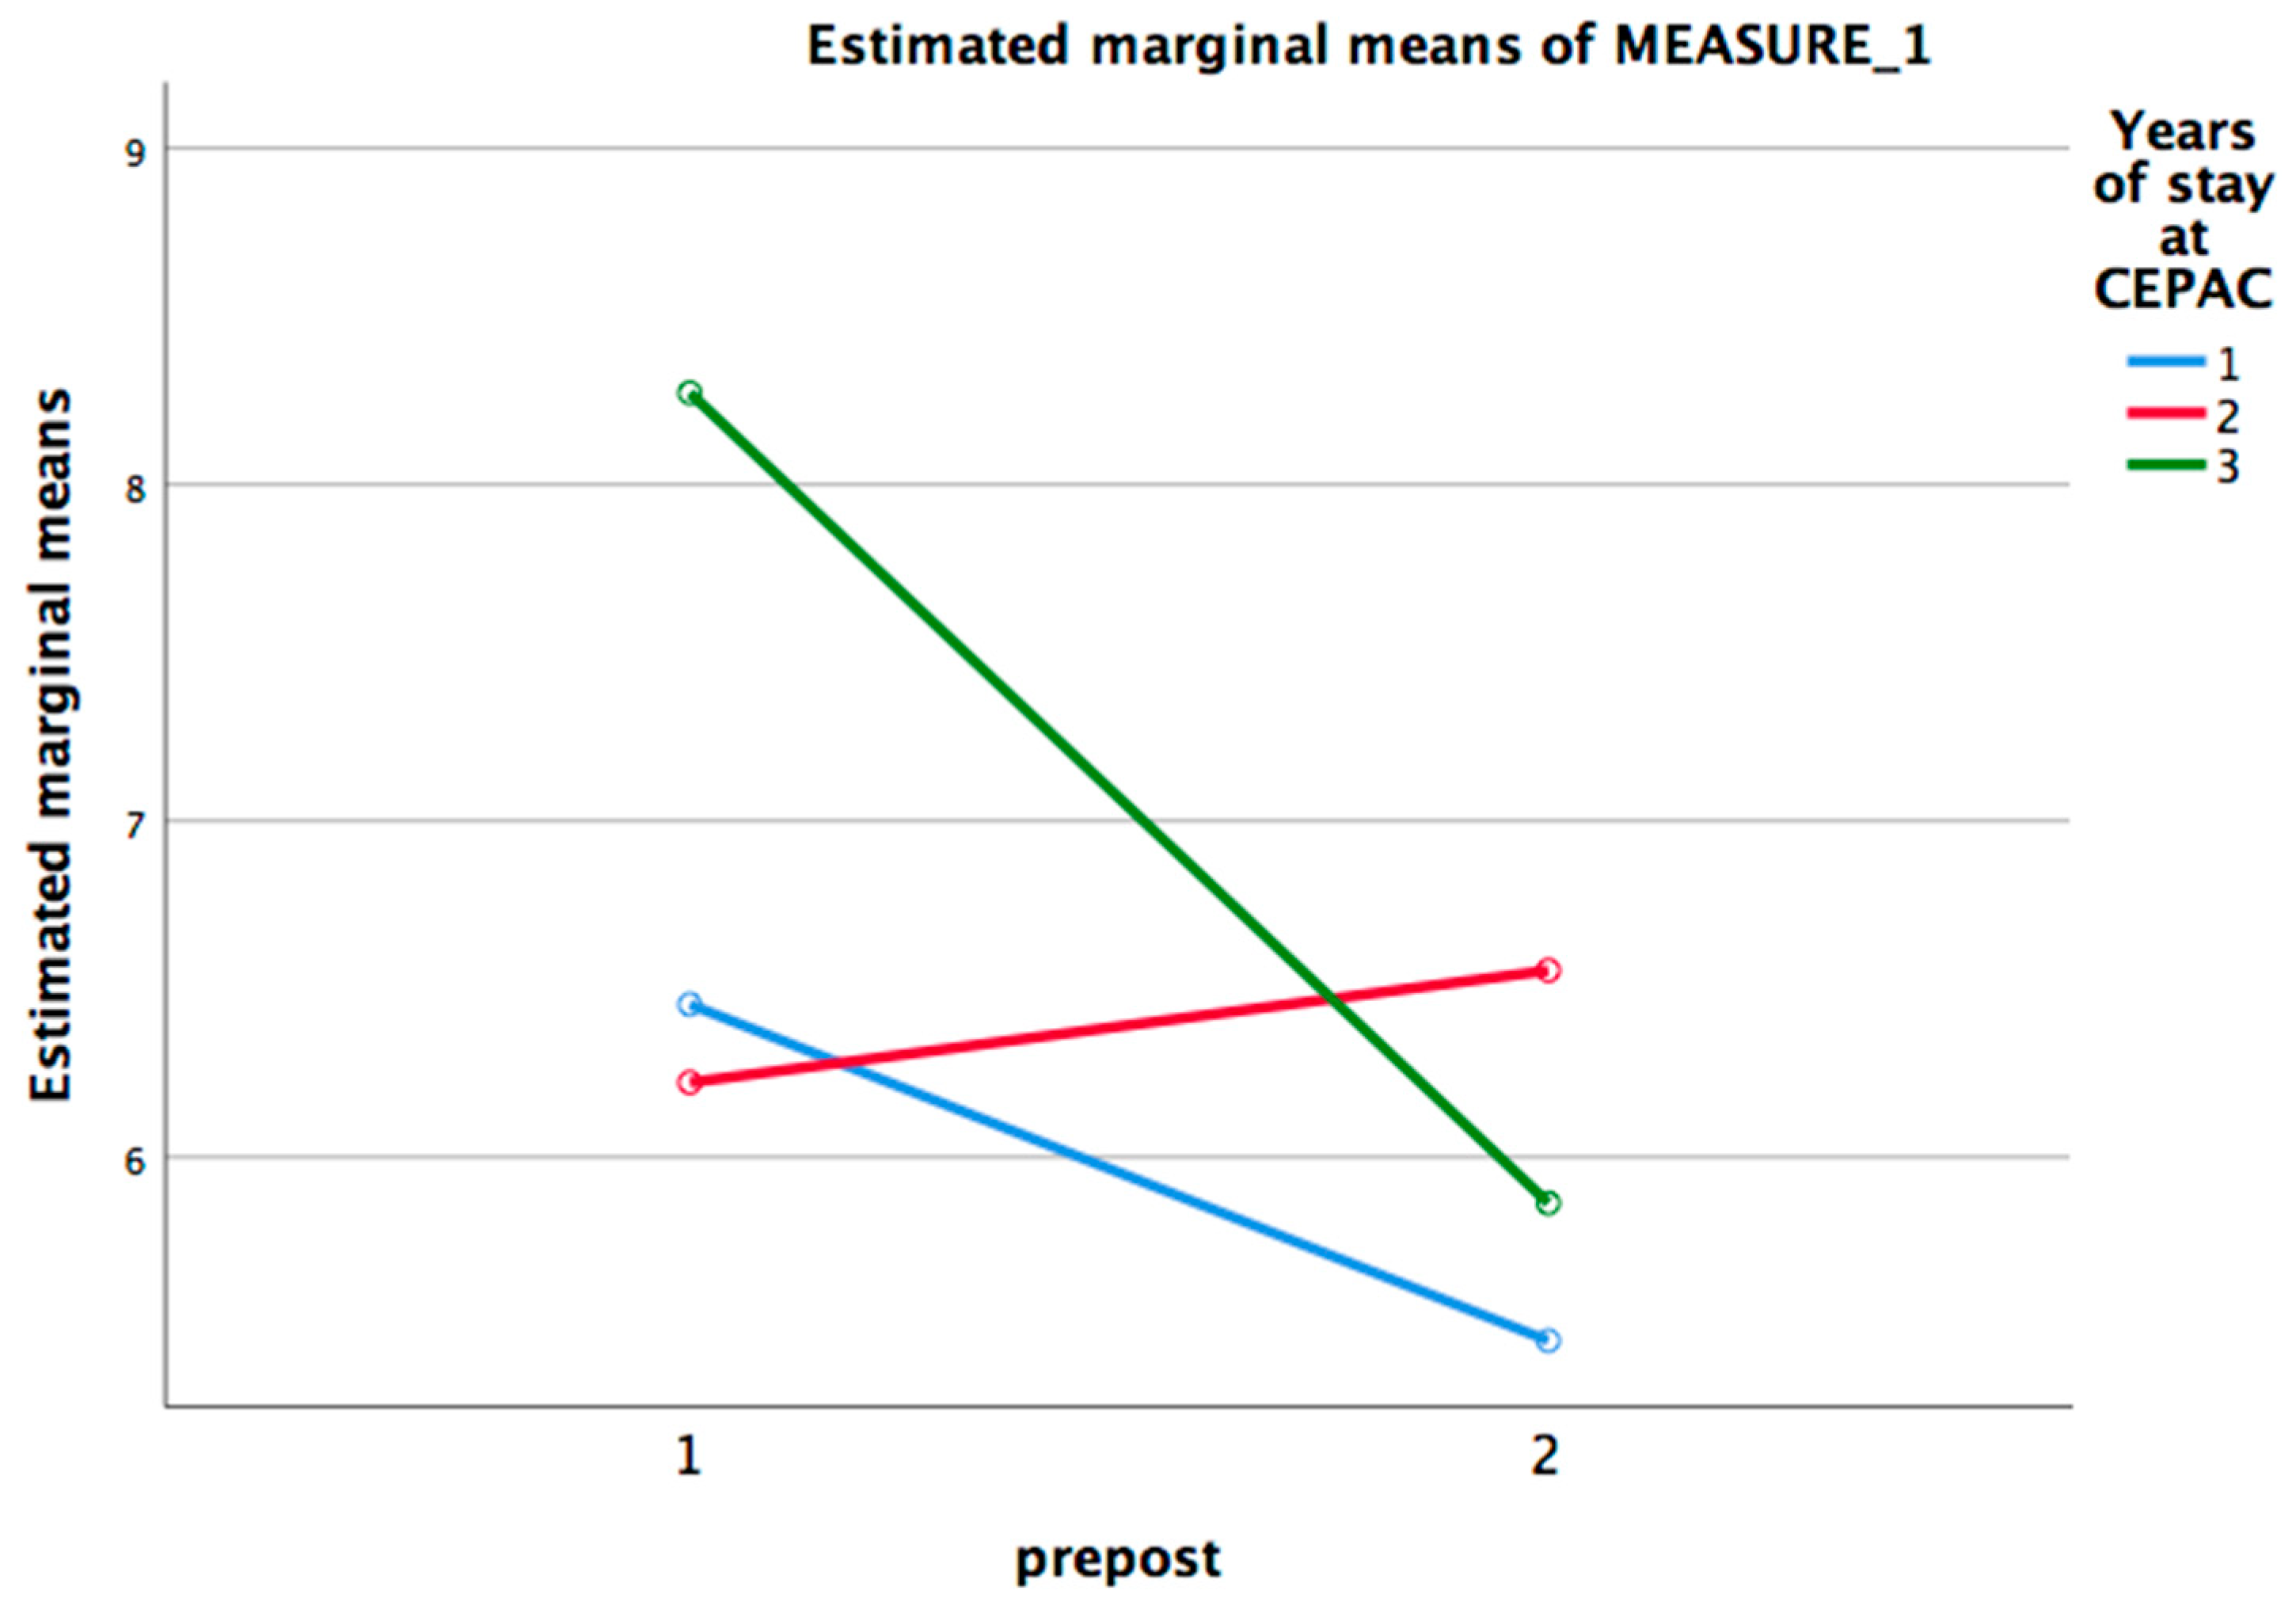
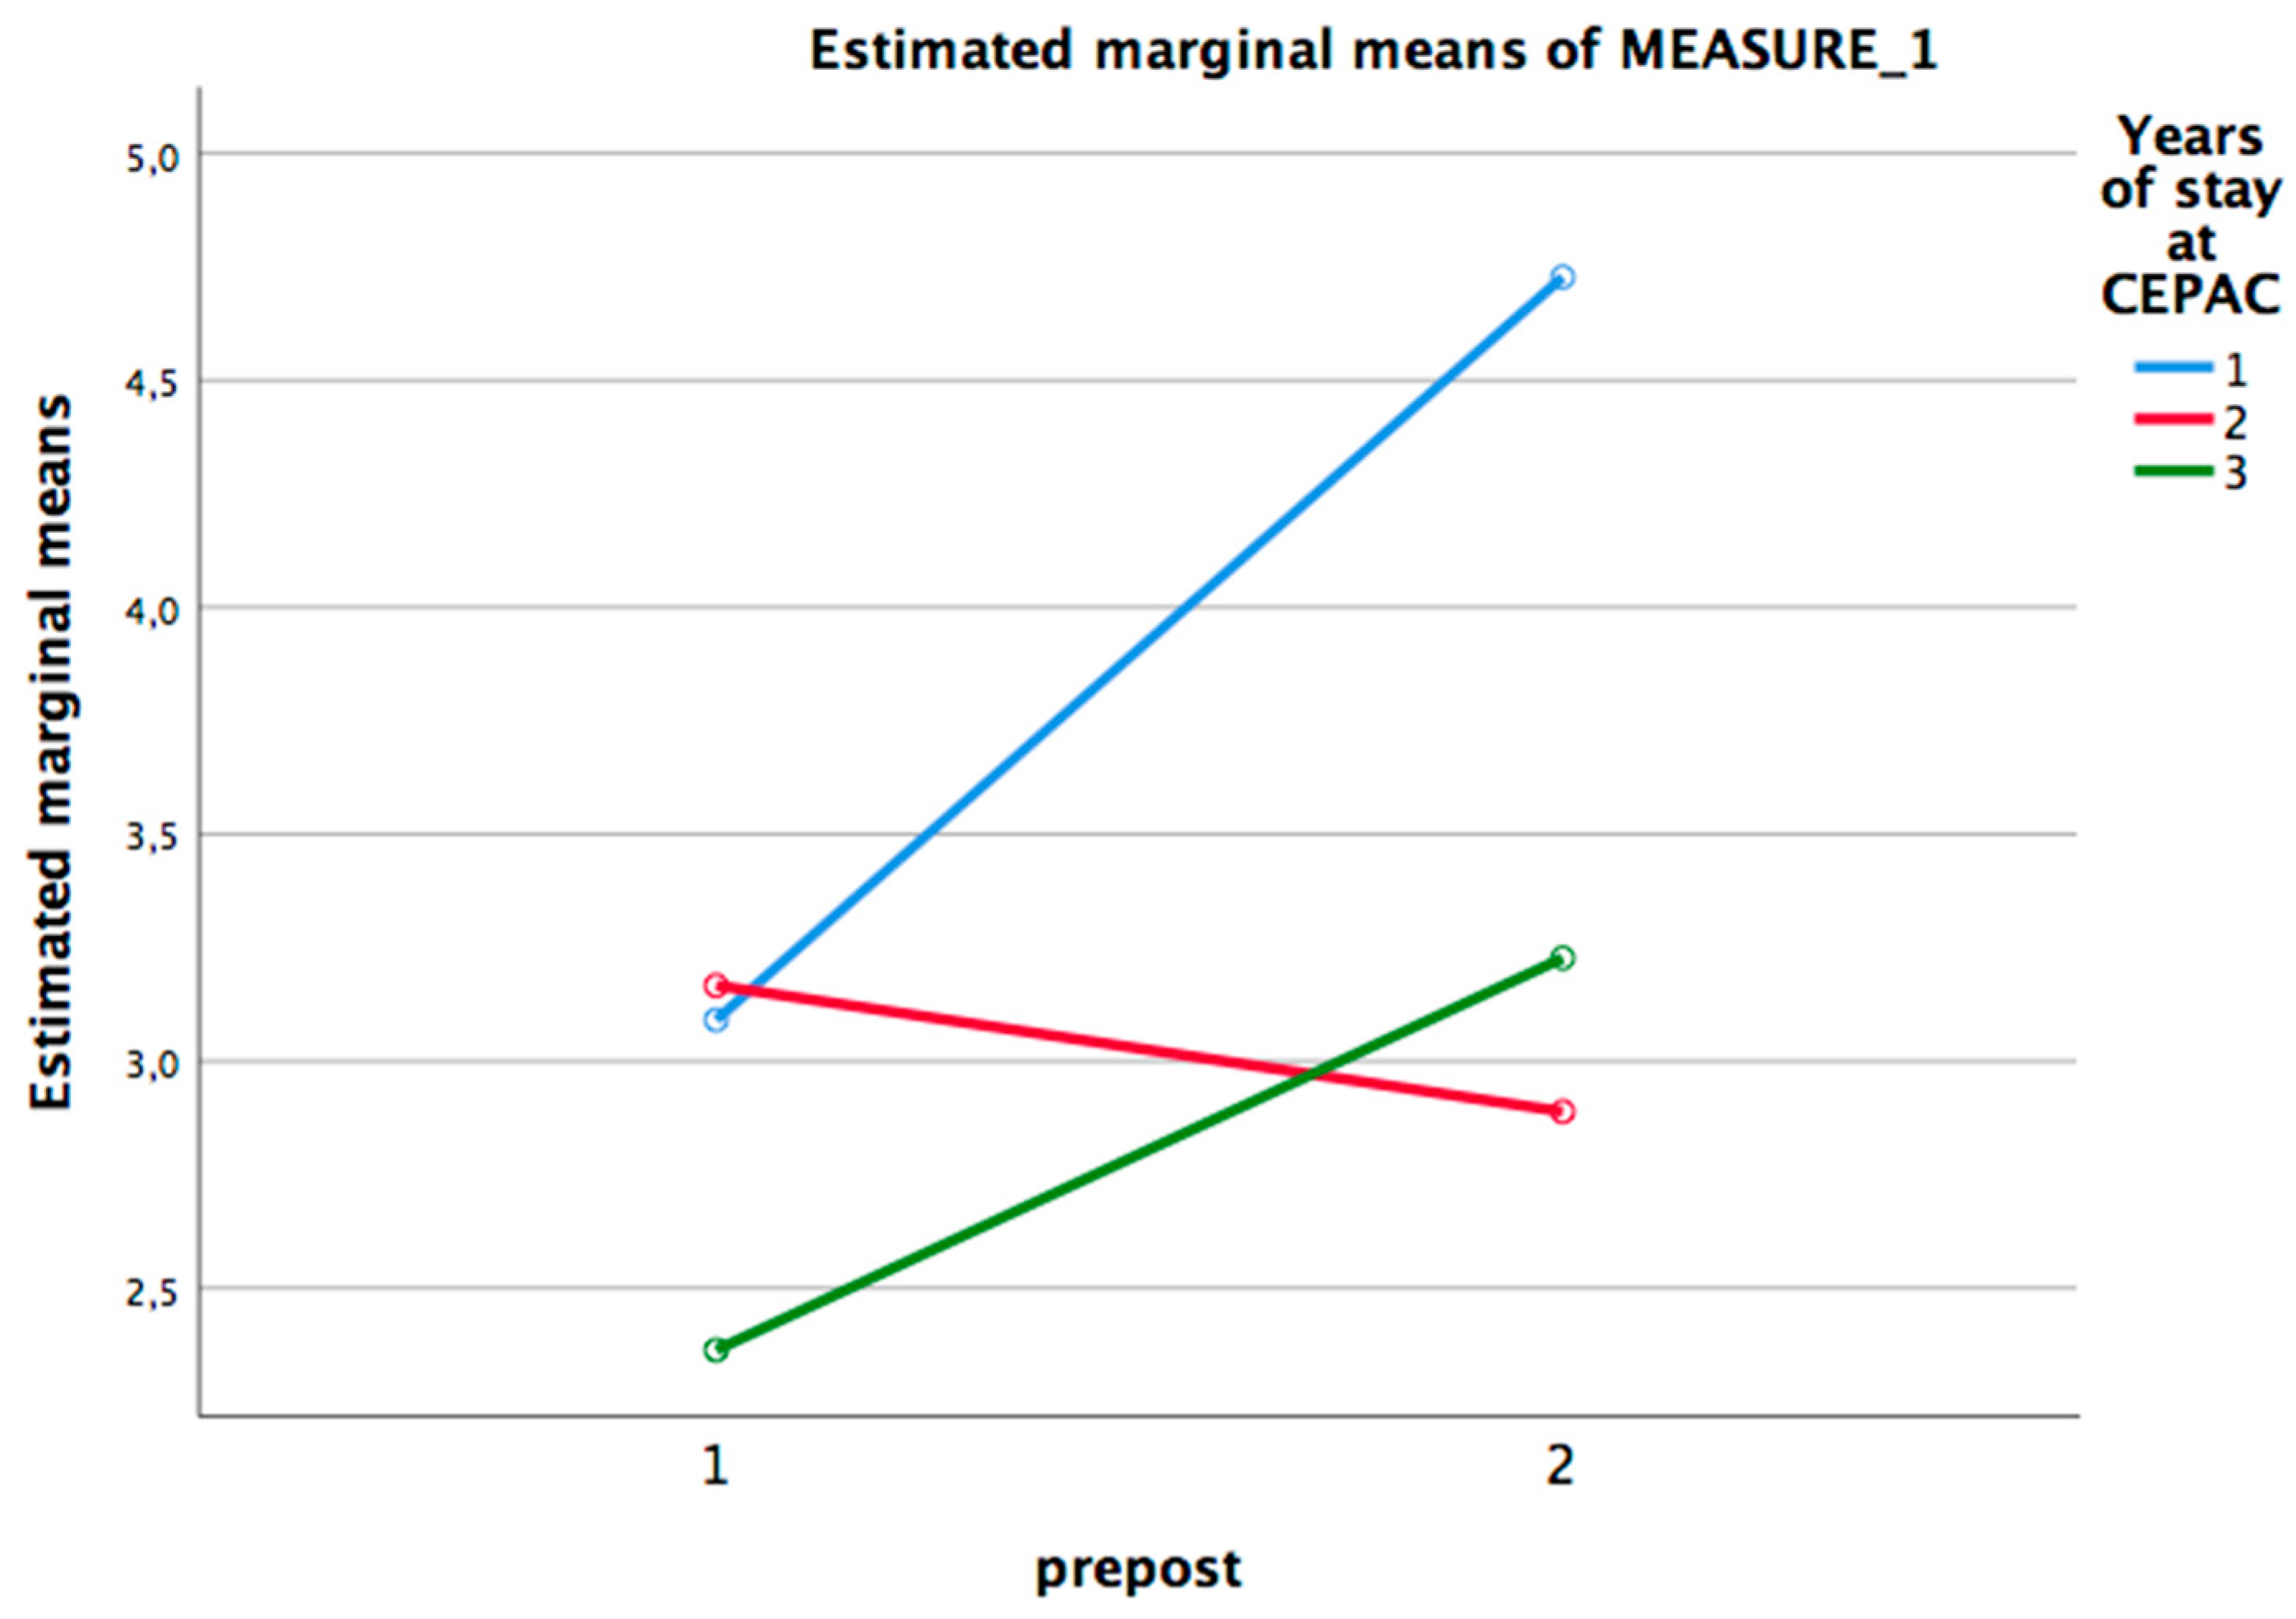
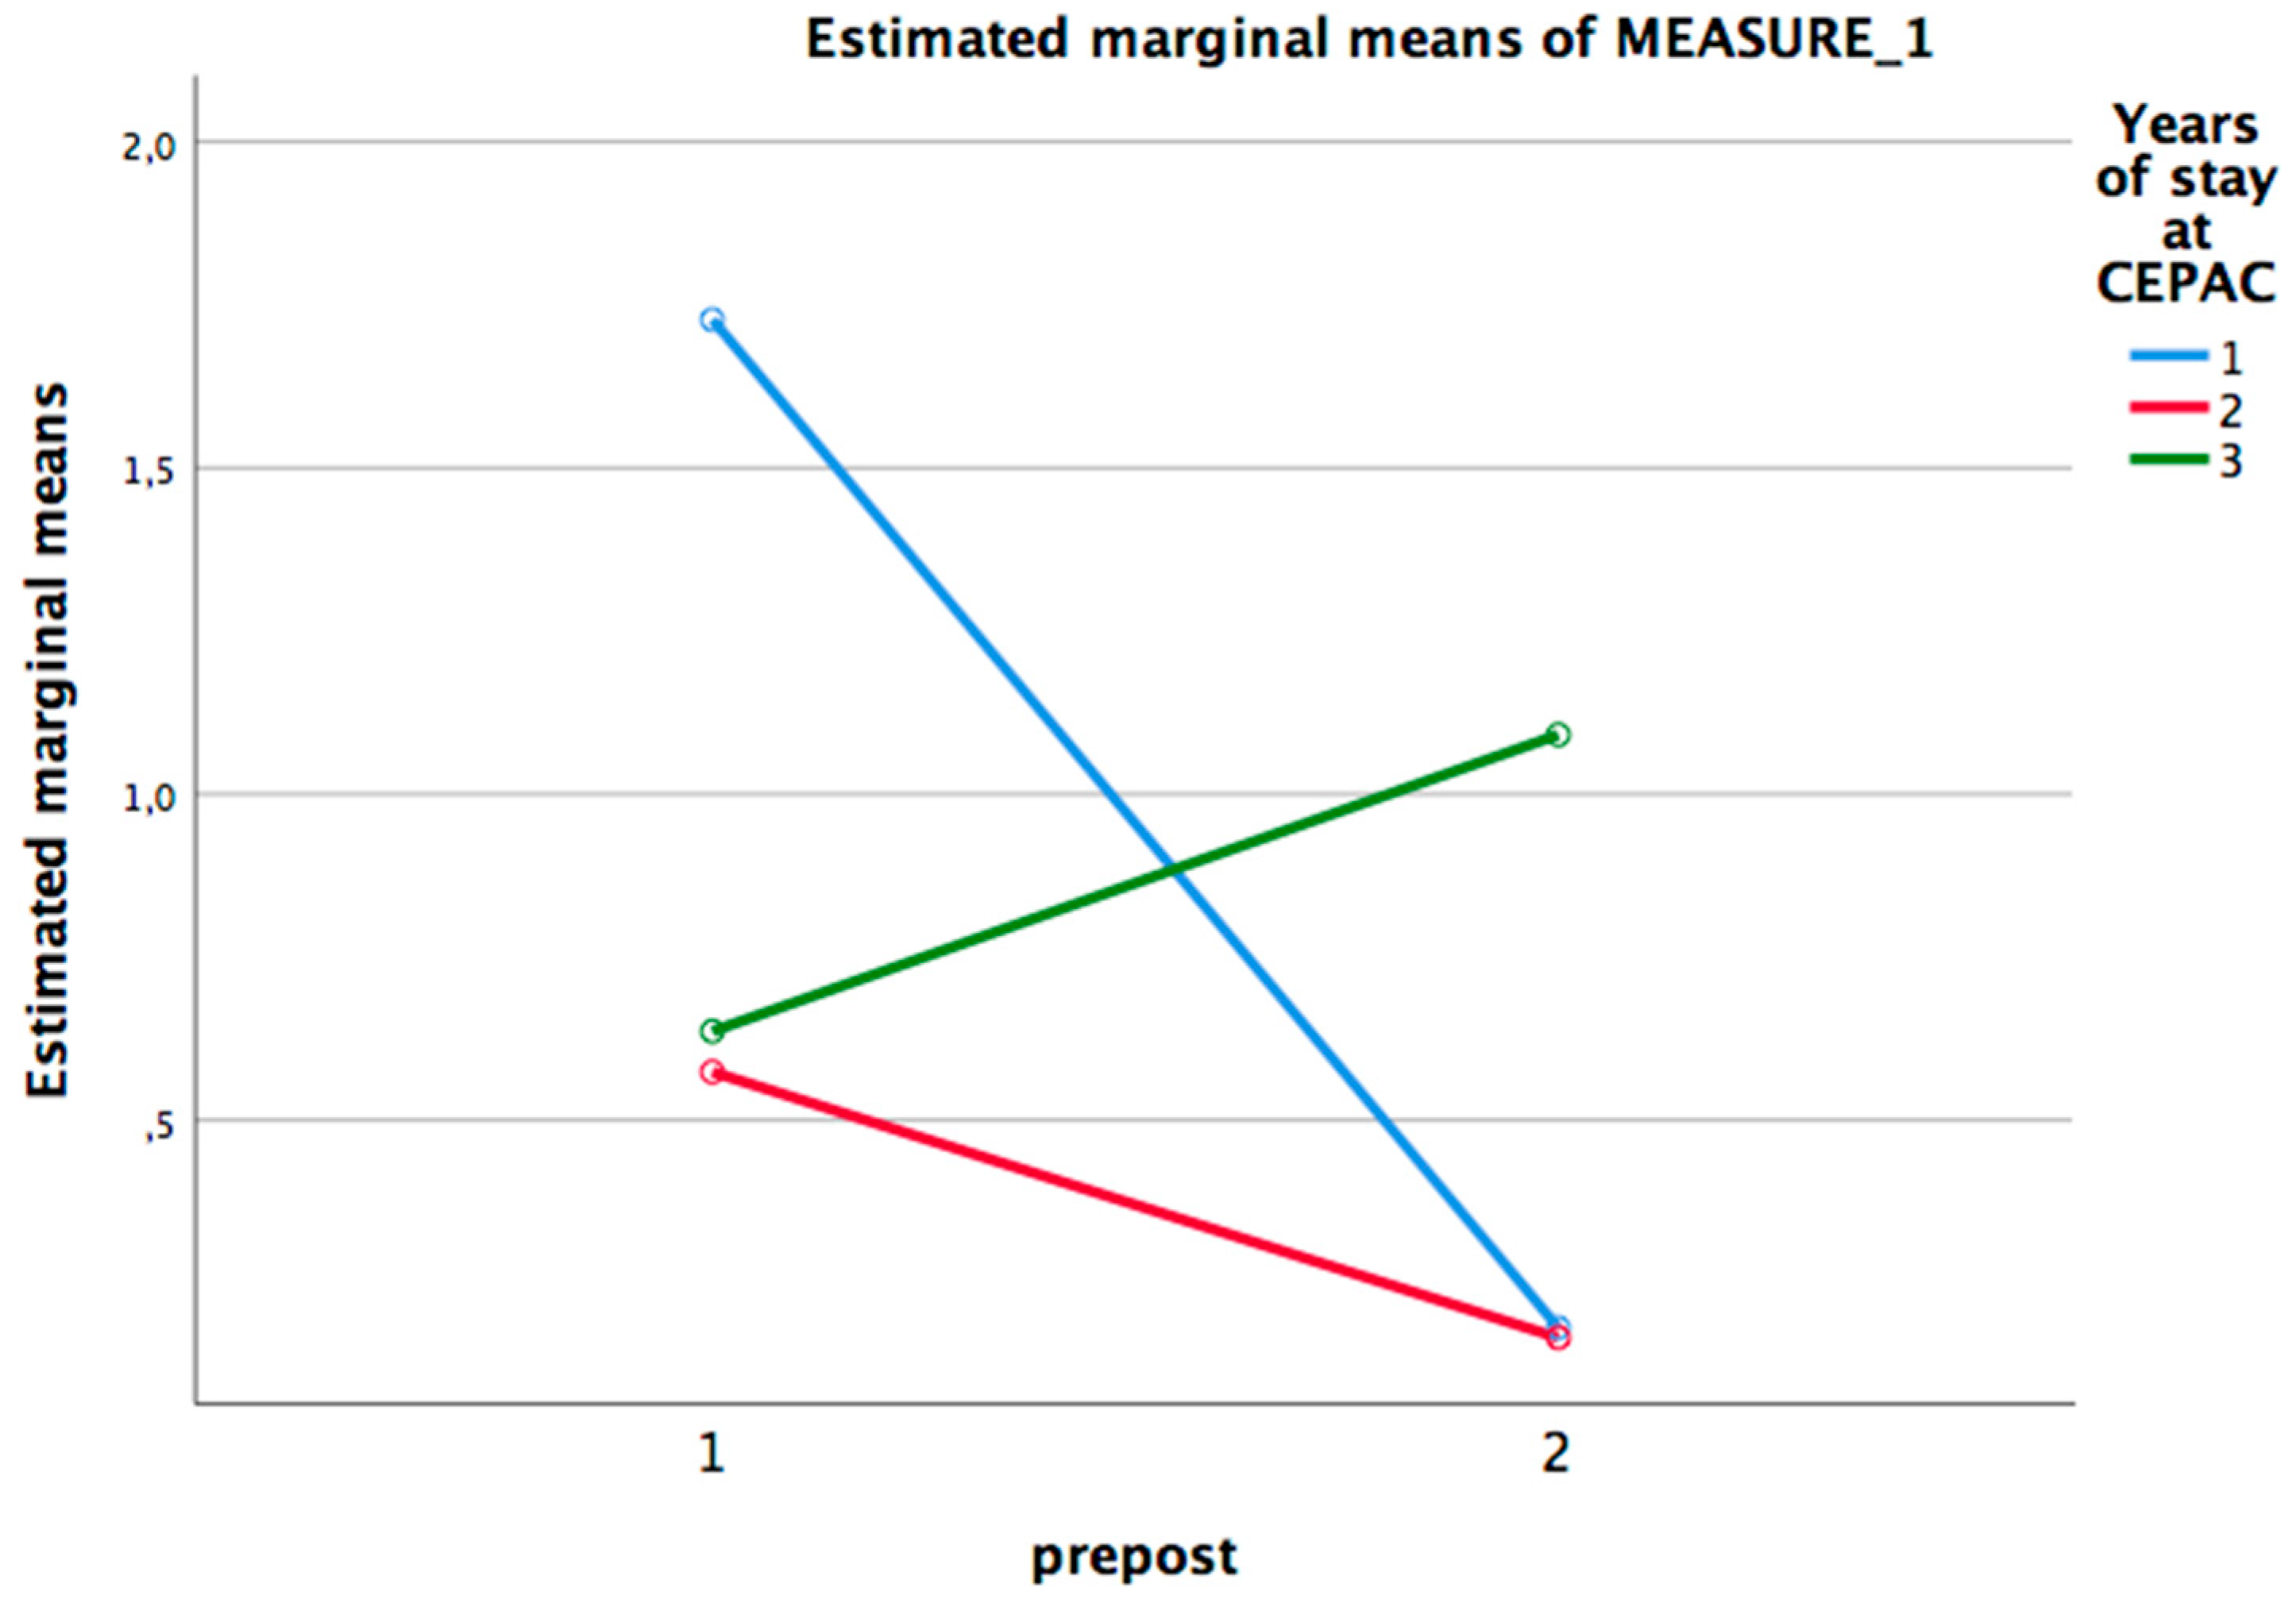
3.5. Effects in Graphic Creativity of the Ability Grouping

Likewise, ANOVA split plot contrasts were made for the four scales of graphic creativity. The averages and standard deviations in each scale, by years of stay in CEPAC and in both the first and second evaluations, are shown in Table 14.
To contrast the normality of the distributions, a Kolmogorov–Smirnov test was calculated for the group with two years of stay (n greater than 50) and Shapiro–Wilk for the other two groups (Table 15).
To check the equality of variances, a Levene’s test was calculated (Table 16).
The results of the contrasts carried out, with the intra-group variable being the time of the test (pre–post, at the beginning of admission to CEPAC and at the end of academic year 2019) and the intergroup variable being the years of stay in CEPAC, are presented in Table 17.
The results in graphic creativity follow a different pattern (Figure 2). There are significant interactions on three of the four scales, but with different interpretation that can be better understood with simple effects analysis. The effect sizes are medium, except in title, where in addition to no significant interaction effect, it has a small effect size.
To check where the differences in the interaction occur, simple effects contrasts were made (Table 18). As can be seen, there are significant decrease only among those students who have remained in CEPAC for three years. The size of the effect is large. In the first-year stay group, although the effects are not significant, the size of the effect is medium. The Figure 3 was obtained to show these results.
The simple effect check for the elaboration variable is presented in Table 19. None of the effects are significant, but it should be noted that the effect sizes in one year of stay and in three years of stay are large. In both cases, higher scores are observed in the second phase of data collection.
Figure 4 shows the graph of the interaction of special details. The effect of the timing of the evaluation is significant in graphic originality and in title, but in the opposite direction: the scores are higher at the beginning in CEPAC.
Simple effects were calculated for special details, which are shown in Table 20. Only the second year scores are significant, where a decrease in this variable is observed, with a large effect size. However, although no significant differences are obtained, the effect size of the first year students is large, also with a decrease in scores, and in those in the third year, who obtain improvements in scores, the effect size is small.
There are only differences in years of stay at CEPAC in title, with significant differences between first- and second–year students, with higher scores for the former. The Tukey’s HSD contrast is presented in Table 21.
Taking into account that special details, both in the first pass of the test and in the second one, show significant differences in variability, the Brown–Forsythe test was calculated, proving that there are significant differences between the years of stay in CEPAC and special details post (Table 22).
The multiple comparisons of special details, calculated with the Tukey’s test, are shown in Table 23. As can be seen, the greatest gains are in group 3, which is significant compared to both one and two years of stay.

3.6. Correlations among Grades and Creativity

To check the relationships between academic grades and creativity, two Pearson correlations were made: between grade point average at the beginning of the school year (Pre) with the total creativity score at the beginning, and another between the same variables at the end of the 2019 school year. The results are presented in Table 24.
As can be observed, the relationship between academic qualifications and creativity changes after the training received at the Center, going from not significant and very low to moderate and significant at the second moment of data collection.

4. Discussion

The first thing to note is that the hypothesis raised, of gains in academic performance and creativity by attending an ability grouping school has been fulfilled.
The results show significant increases in grade point average comparing this measure obtained in the year before entering CEPAC with that of the end of the 2019 academic year. However, the gains are not the same for all students: the score decreases for the new incoming students. Probably, adaptation to a different educational system with a large presence of PBL can explain this result. The decreases in scores in the first year of clustering have also been reported in the literature [55], finding decreases in mathematics, but not in reading, as also shown in our results.
In Spanish, there is no interaction between the time of the evaluation (pre–post) and the years of stay in CEPAC. There is an increase in scores for all students, with a size of the average effect, and significant differences according to the years of stay at the center, with significantly higher scores among the third-year students than among the newcomers. These gains in Spanish are also explained by the teaching methodology employed, since all the teachers considered it important to work on the reading and comprehension of texts in all subjects, offering students techniques for extracting information. The technology, which is systematically incorporated into the teaching at CEPAC, thus expanding the possibility of presenting information in a fun, creative and original way, using digital platforms such as CANVA, GENIALLY, G suite, etc.
However, there are no gains in mathematics. Most CEPAC’s students were outstanding students in mathematics in their home schools. On the other hand, CEPAC works primarily with PBL and this implies a greater number of skills put into play than just the problem solving or exercises that were customary in a traditional education.
There are also important effects on creativity. In the first place, the relation between academic performance and creativity, which was non-existent upon entry into CEPAC, shows a significant correlation in the assessment carried out at the end of the 2019 school year, explaining a 7% common variance. Evidently, the educational system used, which promotes creativity, as well as the creativity and Innovation Laboratory may be responsible for the change.
In terms of the scores on the various scales of narrative creativity, the greatest effects are found in Fluency and flexibility, which is not surprising given the strong load in language that this measure of creativity has, which, as mentioned, is worked on across all subjects. In contrast, graphic creativity does not show a clear effect. This study will allow us to review the contents taught in the creativity laboratory in order to give greater prominence to graphic creativity.
On the other hand, second year students seem to have less gains in creativity. The explanation is that, just as the creativity and innovation laboratory is compulsory in primary school, in secondary school there is a greater offer of complementary activities, so they do not always select the creativity seminar. These results show the importance of training creativity directly, so from now on we will try to ensure that all students benefit from training in creativity.
In summary, our results clearly show that skill grouping has a beneficial effect on both academic performance and creativity. From skill to eminence, education plays a key role [56]. High ability students need an appropriate environment to enhance their creativity [3]. The development of the talents of high-achieving students is important for them, but also for society [57], which needs creative thoughts and productions of talented people [58].
In the same way, it was shown that the relations between academic qualifications and creativity are modified by training, since they are practically non-existent when students enter CEPAC, the final correlation is moderate and significant. Once again, the importance of incorporating creativity is evident, both with educational methodology that encourages it and through specific training.
In view of these results, it is important to consider what is the most appropriate educational response for high-ability students. It is, therefore, obligatory to carry out rigorous research to shed light on this issue.
The limitations of the present study are the lesser presence of primary school students. Although all students were evaluated at the beginning of their incorporation into CEPAC, the second creativity evaluation was collected massively for secondary school students and there are no data available on those students who, due to illness or some other specific reason, missed class that day. On the other hand, the data collection in primary school was done later and in a less systematic way. The global situation of quarantine for COVID-19 prevented the testing of missing pupils.
This work has theoretical implications, since it points out that when grouping by ability there are effective gains in performance. Specifically, in the modality of special grouping for the gifted, which goes in the same direction as various studies that analyze the effect of grouping [28,36,37,59]: when training is given in specific courses for high ability students. With respect to creativity, it is clear that specific training must be given to enhance it. These findings have practical implications, since, as it was mentioned, educational centers with special grouping for the gifted are increasing in Mexico, so these results can be encouraging, in the sense that it is going in the right direction.
In order to be able to assert what is the appropriate educational response for this student group, it is necessary to carry out studies such as the one presented here, both replicating the current results in the same school, as well as in other schools of the grouping and in different countries.
Nevertheless, and since, as has been commented on in the introduction, the effects of special grouping for high ability students on other factors are also important—especially in aspects of personal and social adjustment, in order to contrast the big-fish-little-pond approach [29]. We will address this issue in a subsequent research study to obtain a full assessment of the effect of special grouping on high ability students.

5. Conclusions

In this study, we have evaluated the effect that the grouping by ability has both in school performance and in creativity for the students of the center, also taking into account if a greater permanence in it also affects the results.
As it is a small sample, it is of great importance to ensure that the parametric assumptions of the contrasts used for the analysis are fulfilled. Therefore, the testing of these assumptions was carried out, confirming that the distributions are generally normal. However, although the ANOVA is a robust test against the violation of normality [60,61], it is not robust against heteroscedasticity. Therefore, in those contrasts that showed significant differences in variances, the robust test for F, Brown–Forsythe was used.
In summary, our results clearly show that skill grouping has a beneficial effect on both academic performance and creativity. From skill to eminence, education plays a key role [56]. For this reason, it is essential that these students receive the appropriate educational response they need for their best development. However, in addition, this response must be evaluated, and its effectiveness contrasted, in various factors, beginning with academic performance.
Our results show gains in Grade point average and in Spanish, although not in mathematics. It will be convenient to analyze in depth the contents and the methodology followed in this subject and not only by means of an academic grade, but with other evaluation procedures, since the initial scores, being very high, may not be the best indicator of increases in the knowledge and use of mathematics.
High ability students need an appropriate environment to enhance their creativity [3]. The development of the talents of high-achieving students is important for them, but also for society [57], which needs creative thoughts and productions of talented people [58]. The results show improvements in narrative creativity, but specific procedures will have to be designed to increase graphic creativity, where achievements were more uneven.
Another important aspect in this research is analyzing what effect staying in the center has. It was possible to contrast that gains in academic performance and in narrative creativity are greater for those who have been at CEPAC for three years.
In view of these results, it is important to consider what the most appropriate educational response is for high-ability students. Therefore, it is obligatory to carry out rigorous research to shed light on this issue.
The limitations of the present study are the lesser presence of primary school students. Although all students were evaluated at the beginning of their incorporation into CEPAC, the second creativity evaluation was collected massively for secondary school students, and there are no data available on those students who, due to illness or some other specific reason, missed class that day. On the other hand, the data collection in primary school was done later, and in a less systematic way. The global situation of quarantine for COVID-19 prevented the testing of missing pupils.
This work has both theoretical and practical implications. In the first case, it is evident that grouping by ability shows increases in academic performance and creativity. From the practical point of view, including educational methodology and training to enhance creativity in educational programs for high ability students, seems especially advisable.

Author Contributions

Conceptualization, J.B., D.V., E.R.-N. and A.B.; methodology, A.B. and E.R.-N.; validation, A.B.; formal analysis, A.B. and J.F.F.B.; investigation, J.B., D.V. and J.F.F.B.; resources, J.B., D.V. and J.F.F.B.; data curation, J.B. and J.F.F.B.; writing—original draft preparation, A.B.; writing—review and editing J.B., D.V., J.F.F.B., E.R.-N. and A.B.; visualization, E.R.-N.; supervision, E.R.-N.; project administration, D.V. and A.B.; funding acquisition, J.B. and D.V. All authors have read and agreed to the published version of the manuscript.

Funding

This research received no external funding.

Conflicts of Interest

The authors declare no conflict of interest.

References

  1. Reis, S.; Sullivan, E. Characteristics of gifted learners. Consistently varied; refreshingly diverse. In Methods and Materials for Teaching the Gifted; Karnes, F.A., Bean, S.M., Eds.; Prufrock Press Inc.: Waco, TX, USA, 2009; pp. 3–35. [Google Scholar]
  2. Cross, T.L.; Coleman, L.J. School-based conception of giftedness. In Conceptions of Giftedness; Sternberg, R., Davidson, J.E., Eds.; Cambridge University Press: Cambridge, UK, 2005; pp. 52–63. [Google Scholar]
  3. Gómez-León, M.I. Bases psicobiológicas de la creatividad en los niños con altas capacidades. Psiq. Biol. 2020, 27, 28–33. [Google Scholar] [CrossRef]
  4. Renzulli, J.S. The three-ring conception of giftedness: A developmental model for creative productivity. In Conceptions of Giftedness; Sternberg, R., Davidson, J.E., Eds.; Cambridge University Press: Cambridge, UK, 1986; pp. 53–93. [Google Scholar]
  5. Reis, S.M. Reflections on policy affecting the education of gifted and talented students: Past and future perspectives. Am. Psychol. 1989, 44, 399–408. [Google Scholar] [CrossRef]
  6. Manning, S. Recognizing gifted students: A practical guide for teachers. Kappa Delta Pi Rec. 2006, 42, 64–68. [Google Scholar] [CrossRef]
  7. Basten, U.; Hilger, K.; Fiebach, C.J. Where smart brains are different: A quantitative meta-analysis of functional and structural brain imaging studies on intelligence. Intelligence 2015, 51, 10–27. [Google Scholar] [CrossRef]
  8. Rimm, S.B. Underachievement: A National Epidemic. In Handbook of Gifted Education; Colangelo, N., Davis, G.A., Eds.; Allyn and Bacon: Boston, MA, USA, 2003; pp. 424–443. [Google Scholar]
  9. Borges, A.; Hernández-Jorge, C. La superdotación intelectual: Algo más que un privilegio. Acta Cient. Y Tecnol. 2006, 10, 28–33. [Google Scholar]
  10. Baum, S.M.; Renzulli, J.S.; Hébert, T.P. Reversing underachievement: Creative productivity as a systematic intervention. Gift Child. Q. 1995, 39, 224–235. [Google Scholar] [CrossRef]
  11. Morisano, D.; Shore, B.M. Can personal goal setting tap the potential of the gifted underachiever? Roeper Rev. 2010, 32, 249–258. [Google Scholar] [CrossRef]
  12. Brodley, L.E.; Stanley, J.C. Youth who reason exceptionally well mathematically and/or verbally. In Conceptions of Giftednes; Sternberg, R., Davidson, J.E., Eds.; Cambridge University Press: Cambridge, UK, 2005; pp. 20–37. [Google Scholar]
  13. Ferrandíz, C.; Ruíz-Melero, M.; Bermejo, R. Programas de enriquecimiento para el desarrollo del talento y la excelencia. In Educacao de Superdotados e Talentosos. Emocao E Criatividade; Ribeiro, F.H., Stoltz, T., Costa-Lobo, C., Rocha, A., Vásquez-Justo, E., Eds.; (Organizadores) Juruá Editora: Curitiba, Brazil, 2018; pp. 167–187. [Google Scholar]
  14. Golle, J.; Zettler, I.; Rose, N.; Trautwein, U.; Hasselhorn, M.; Nagengast, B. Effectiveness of a “Grass Roots” statewide enrichment program for gifted elementary school children. J. Res. Educ. Eff. 2018, 11, 375–408. [Google Scholar] [CrossRef] [Green Version]
  15. Hoogeveen, L. Social Emotional Consequences of Accelerating Gifted Students. Ph.D. Thesis, Radboud Universiteit Nijmegen, Nijmegen, Germany, 2008. [Google Scholar]
  16. Southern, W.T.; Jones, E.D. Typesofacceleration: Dimensions and issues. In A Nationdeceived: Howschoolshold Back America’s Brightest Students; Colangelo, N., Assouline, S.G., Gross, M.U.M., Eds.; National Association for Gifted Children: Washington, DC, USA, 2004; Volume 2, pp. 5–12. [Google Scholar]
  17. Assouline, S.G.; Colangelo, N.; Vantassel-Baska, J. A Nationempowered; Belin-Blank Center: Iowa City, IA, USA, 2015; Volume 1. [Google Scholar]
  18. Colangelo, N.; Aussoline, S.; Gross, M. A Nation Deceived: How Schools Hold Back America’s Brightest Students; Gifted Education Research, Resource and Information Centre (GERRIC): Sydney, Australia, 2004. [Google Scholar]
  19. Neihart, M. The socioaffective impact of acceleration and ability grouping: Recommendations for best practice. Gift Child. Q. 2007, 51, 330–341. [Google Scholar] [CrossRef]
  20. Collins, C.C.; Gan, L. Does Sorting Students Improve Scores? An Analysis of Class Composition; National Bureau of Economic Research: Cambridge, UK, 2013. [Google Scholar]
  21. Gentry, M. Commentary on “Does sorting students improve scores?” An analysis of class. J. Adv. Acad. 2016, 27, 124–130. [Google Scholar] [CrossRef]
  22. Adelson, J.L.; Carpenter, B.D. Grouping for achievement gains: For whom does achievement grouping increase kindergarten reading growth? Gift Child. Q. 2011, 55, 265–278. [Google Scholar] [CrossRef]
  23. Gentry, M. Total School Cluster Grouping: A Comprehensive, Research-Based Plan Forraising Student Achievement and Improving Teacher Practices, 2nd ed.; Prufrock: Waco, TX, USA, 2014. [Google Scholar]
  24. Feldhusen, J.F.; Moon, S.M. Grouping of gifted students: Problems and concerns. Gift Child. Q. 1994, 36, 63–67. [Google Scholar] [CrossRef]
  25. Slavin, R.E. Achievement effect sof ability grouping in secondary schools: A best-evidence synthesis. Rev. Educ. Res. 1990, 60, 471–499. [Google Scholar] [CrossRef]
  26. Subotnik, R.F.; Almarode, J.; Lee, G.M. STEM schools as incubators of talent development. Gift Child. Today 2016, 39, 236–241. [Google Scholar] [CrossRef]
  27. Kulik, J.A. An analysis of the research on ability grouping. NRC/GT Newsl. 1993, 8, 9. [Google Scholar]
  28. Steenbergen-Hu, S.; Makel, M.C.; Olszewski-Kubilius, P. What one hundred years of research says about the effects of ability grouping and acceleration on K–12 students’ academic achievement: Findings of two second-order meta-analyses. Rev. Educ. Res. 2016, 86, 849–899. [Google Scholar] [CrossRef]
  29. Marsh, H.W. The big-fish-little-pond effect on academic self-concept. J. Educ. Psychol. 1987, 79, 280–295. [Google Scholar] [CrossRef]
  30. Becker, M.; Neumann, M.; Tetzner, J.; Böse, S.; Knoppick, H.; Maaz, K. Is early ability grouping good for high-achieving students’ psychosocial development? Effects of the transition into academically selective schools. J. Educ. Psychol. 2014, 106, 555–568. [Google Scholar] [CrossRef]
  31. Dai, Y.D.; Rinn, A.N. The big-fish-little-pond effect: What do we know and where do we go from here? Educ. Psychol. Rev. 2008, 20, 283–317. [Google Scholar] [CrossRef]
  32. Preckel, F.; Brull, M. The benefit of being a big fish in a big pond: Contrastand assimilation effects on academic self-concept. Learn. Individ. Differ. 2010, 20, 522–531. [Google Scholar] [CrossRef]
  33. Borland, J.H. Evaluating gifted programs: A broader perspective. In Handbook of Gifted Education; Colangelo, N., Davis, G.A., Eds.; Allyn and Bacon: Boston, MA, USA, 2003; pp. 293–310. [Google Scholar]
  34. Hattie, J.C. Classroom composition and peer effects. Int. J. Int. Educ. J. 2002, 8, 60–67. [Google Scholar] [CrossRef]
  35. Betancourt, J.; Borges, A.; Rodríguez-Naveiras, E. Desempeño Académico de Los Alumnos Que Cursan 6 to Año de Primaria en el Centro Educativo Para Altas Capacidades; Congreso Nacional de Psicología: Vitoria, España, 2019. [Google Scholar]
  36. Preckel, F.; Stumpf, E.; Motschenbacher, M.; Vogl, K.; Scherrer, V.; Schneider, W. High-ability grouping: Benefits for gifted students’ achievement development without costs in academic self-concept. Child. Dev. 2019, 80, 1185–1201. [Google Scholar] [CrossRef] [PubMed]
  37. Allan, A.S.D. Ability-Grouping research reviews: What do they say about grouping and the gifted? Educ. Lead. 1991, 48, 60–65. [Google Scholar]
  38. Dole, S.F.; Bloom, L.A.; Doss, K.K. Rocket to creativity: A field experience in project-based and problem-based learning. Glob. Educ. Rev. 2016, 3, 19–32. [Google Scholar] [CrossRef] [Green Version]
  39. Horak, A.K.; Galluzzo, G.R. Gifted middle school students’ achievement and perceptions of science classroom quality during problem-based learning. J. Adv. Acad. 2016, 28, 28–50. [Google Scholar] [CrossRef]
  40. Stepien, W.J.; Gallagher, S.A.; Workman, D. Problem-based learning for traditional and interdisciplinary classrooms. J. Educ. Gift 1993, 16, 338–357. [Google Scholar] [CrossRef]
  41. Langbeheim, E. A project-based course on Newton’s laws for talented junior high-school students. Phys. Educ. 2015, 50, 410–415. [Google Scholar] [CrossRef]
  42. Mioduser, D.; Betzer, N. The contribution of Project-based-learning to high-achievers’ acquisition of technological knowledge and skills. Int. J. Technol. Des. Educ. 2007, 18, 59–77. [Google Scholar] [CrossRef] [Green Version]
  43. Plucker, J. Increasing student creativity: Recent advances and future directions. In Proceedings of the Creativity Research & Innovation In Gifted Education: Social, Individual and Educational Perspective, Dubrovnik, Croatia, 12 April 2019. [Google Scholar]
  44. López-Martínez, O.; Navarro-Lozano, J. Creatividad e inteligencia: Un estudio en Educación Primaria. Rev. Investig. Educ. 2010, 28, 283–296. [Google Scholar]
  45. Renzulli, J.S. The Enrichment Triad Model: A Guide for Developing Defensible Programs for the Gifted and Talented; Creative Learning Press: Wethersfield, CT, USA, 1997. [Google Scholar]
  46. Dai, D.Y. The Nature and Nurture of Giftedness: A New Framework for Understanding Gifted Education; Teachers College Press: New York, NY, USA, 2010. [Google Scholar]
  47. Gralewski, J.; Karwowski, M. Creativity and school grades: A case from Poland. Think. Skills Creat. 2012, 7, 198–208. [Google Scholar] [CrossRef]
  48. Lucas, B. A five-dimensional model of creativity and its assessment in schools. Appl. Mes. Educ. 2016, 29, 278–290. [Google Scholar] [CrossRef] [Green Version]
  49. Kettler, T.; Lamb, K.E.; Willerson, A.; Mullet, D.R. Teachers’ perceptions of creativity in the classroom. Creat. Res. J. 2018, 30, 164–171. [Google Scholar] [CrossRef]
  50. Hsu, E.; Kysh, J.; Ramage, K.; Resek, D. Helping teachers un-structure: A promising approach. Mont. Math. Enthus. 2009, 16, 423–434. [Google Scholar]
  51. Melievna, M.D. Methodology for the formation of creative competence of future teachers in the process of teaching mathematics based on a special complex of tasks. J. Psychosoc. Rehabil. 2020, 24, 616–627. [Google Scholar] [CrossRef]
  52. Gajda, A.; Karwowski, M.; Beghetto, R.A. Creativity and academic achievement: A meta-analysis. J. Educ. Psychol. 2017, 109, 269–299. [Google Scholar] [CrossRef]
  53. Artola, T.; Ancillo, I.; Mosteiro, P.; Barraca, J. Prueba de Imaginación Creativa Para Niños—PICN; TEA Ediciones S.A.: Madrid, Spain, 2003. [Google Scholar]
  54. Artola, T.; Barraca, J.; Martín, A.; Mosteiro, P.; Ancillo, I.; Poveda, B. Prueba de Imaginación Creativa Para Jóvenes—PICJ; TEA Ediciones S.A.: Madrid, Spain, 2008. [Google Scholar]
  55. Matthews, M.S.; Ritchotte, J.A.; McBeec, M.T. Effects of schoolwide cluster grouping and within-class ability grouping on elementary school students’ academic achievement growth. High Abil. Stud. 2013, 24, 81–97. [Google Scholar] [CrossRef]
  56. Subotnik, R.F.; Rickoff, R. Should eminence based on outstanding innovation be the goal of gifted education and talent development? Implications for policy and research. Learn Individ. Differ. 2010, 20, 358–364. [Google Scholar] [CrossRef]
  57. Subotnik, R.F.; Olszewski-Kubilius, P.; Worrell, F.C. A proposed direction forward for gifted education based on psychological science. Gift Child. Q. 2012, 56, 176–188. [Google Scholar] [CrossRef]
  58. Freeman, J. Giftedness in the long term. J. Educ. Gift 2006, 29, 384–403. [Google Scholar] [CrossRef]
  59. Kulik, J.A.; Kulik, C.C. Meta-analytic findings on grouping programs. Gift Child. Q. 1992, 36, 73–77. [Google Scholar] [CrossRef]
  60. Borges, A.; Sánchez-Bruno, A. La simulación al servicio de los contrastes estadísticos: Resumen de métodos y estado de la cuestión en grupos pequeños e independientes. Psicothema 2002, 4, 255–271. [Google Scholar]
  61. Cañadas-Osinski, I.; Borges, A.; Sánchez-Bruno, A.; San Luis, C. Estudio de la potencia de los contrates de medias con dos y tres grupos con tamaño de efecto pequeño y en condiciones de no normalidad y homo-heterocedasticidad. Psicothema 2000, 12, 114–116. [Google Scholar]
Figure 1. Interaction between grade point average and years of stay at Jalisco educational center for high abilities (CEPAC).
Sustainability 12 04513 g001
Figure 2. Interaction among pre–post and years of stay in CEPAC in graphic originality.
Sustainability 12 04513 g002
Figure 3. Interaction among pre–post and years of stay in CEPAC in elaboration.
Sustainability 12 04513 g003
Figure 4. Special details.
Sustainability 12 04513 g004
Table 1. Characteristics of the participants.
Years of StayGender
FemaleMaleTotal
Primary School
2121022
High School
15611
282432
341822
Total295887
Table 2. Descriptive statistics, academic grades.
VariablesYears of StayInitial AverageCurrent AverageN
MeanSDMeanSD
Grade point averageYear 19.750.1759.680.22711
Year 29.430.4749.510.38254
Year 39.130.5279.400.46622
LanguageYear 19.7730.325910.3452.621611
Year 29.0500.84749.3370.609554
Year 38.6730.92809.2270.751622
MathematicsYear 19.7820.38169.5730.654411
Year 29.4370.55649.4890.579754
Year 39.1050.65799.3860.754922
Table 3. Normality of grades.
Years of StayStatisticdfpStatisticdfp
Grade Point Average Pre-TestGrade Point Average Post-Test
10.915110.2830.944110.567
20.179540.0000.144540.007
30.955220.3990.917220.065
Spanish preSpanish post
10.664110.0000.557110.000
20.164540.0010.179540.000
30.955220.3980.796220.000
Mathematics preMathematics post
10.620110.0000.726110.001
20.156540.0020.189540.000
30.929220.1150.754220.000
Table 4. Homoscedasticity.
GradeTimeLevene’s Testdf1df2p
Grade point averagePre-test5.3312840.007
Post-test2.3222840.104
SpanishPre-test4.6642840.012
Post-test5.3592840.006
MathematicsPre-test13732840.259
Post-test2.7602840.069
Table 5. ANOVA split-plot: pre–post grades and years of stay.
Sums of SquaresdfMean SquareFpPartial η2Power
Grade point average
Pre–post0.27610.2766.7170.0110.740.726
Interaction0.47620.2385.7910.0040.1210.858
Error3.452840.326
Years of stay3.10621.5534.7670.0110.1020.780
Error27.369840.326
Spanish
Pre–post6.45716.45710.2440.0020.1090.726
Interaction0.47620.2380.6090.5460.0140.858
Error3.452840.041
Years of stay3.10621.5537.5110.0010.1520.936
Error27.369840.326
Mathematics
Pre–post0.05010.0500.2730.6030.0030.081
Interaction0.92920.4642.5300.0860.0570.494
Error15.418840.184
Years of stay2.95721.4782.7230.0710.0610.525
Error45.595840.543
Table 6. Differences in grade point average and Spanish—pre-test.
Brown–Forsythedf1df2p
Grade point average (pre)9376245.2100.001
Spanish (pre)8.801246.2900.001
Table 7. Simple effects: grade point average.
Sums of SquaresdfMean SquareFpPartial η2Power
1 year of stay
Pre–post0.02210.0220.9180.3610.0840.140
Error0.243100.024
2 years of stay
Pre–post0.18810.1884.5020.0390.0780.549
Error2.207530.042
3 years of stay
Pre–post0.81810.81817.1510.0010.4500.976
Error9.382210.447
Table 8. Multiple comparisons, grade point average.
Years of Stay at CEPACMean Difference (I-J)Error Dev.Sig.
Grade point average
Tukey’s HDS1–20.240.1340.171
1–30.450.1490.009
2–30.210.1020.110
Spanish
Tukey’s HDS1–20.8660.26090.004
1–31.1090.29130.001
2–30.2440.19950.444
Table 9. Descriptive statistics, narrative creativity variables.
VariablesYears of StayPre-TestPost-TestN
MTDMTD
FluencyYear 153.5520.92166.1820.48311
Year 243.9319.73267.4630.11554
Year 356.8225.92679.6428.09822
FlexibilityYear 126.007.5030.186.49.311
Year 222.897.61028.690.09754
Year 324.777.71535.559.05922
Narrative originalityYear 129.7322.97034.6415.66711
Year 222.6114.78640.1320.79154
Year 332.0019.63545.7722.87822
Table 10. Distribution normality—narrative creativity variables.
Years of StayStatisticdfpStatisticdfp
Fluency PreFluency Post
10.969110.8760.969110.879
20.141540.0090.115540.072
30.949220.2980.925220.095
Flexibility preFlexibility post
10.938110.5020.966110.839
20.121540.0490.069540.200
30.962220.5250.915220.059
Narrative originality preNarrative originality post
10.891110.1440.971110.893
20.117540.0610.149540.004
30.955220.3920.928220.112
Table 11. Homoscedasticity.
Narrative CreativityTimeLevene’s Testdf1df2p
FluencyPre1.7552840.179
Post1.7222840.185
flexibilityPre0.0802840.923
Post1.3592840.263
narrative originalityPre1.6062840.207
Post1.1272840.329
Table 12. ANOVA split-plot: pre–post narrative creativity and years of stay.
Sums of SquaresdfMean SquareFpPartial η2Power
Fluency
Pre–post11,234.370111,234.37026.4210.0000.2390.999
Interaction553.3552276.6770.6510.5240.0150.156
Error35,717.62284425.210
Years of stay4916.19022458.0952.8580.0630.0640.546
Error72,252.23584860.146
Flexibility
Pre–post1390.0811139.08110.2440.0020.10910.000
Interaction238.3992119.2000.6090.5460.0140.518
Error3740.1308444.525
Years of stay618.3092309.5547.5110.0010.1520.619
Error7741.8068492.164
Narrative originality
Pre–post117496.3011117496.301133.6120.0000.61410.000
Interaction4714.73422357.3672.6810.0740.0600.518
Error73,868.48584879.387
Years of stay7160.51223580.2562.4510.0920.0550.480
Error13,532.86484161.106
Table 13. Multiple comparisons, flexibility.
Years of Stay at CEPACMean Difference (I-J)Error Dev.Sig.
Tukey’s HDS1–21–32.302.2460.563
−2.072.5070.689
2–3−4.371.7170.034
Table 14. Descriptive statistics, graphic creativity variables.
VariablesYears of StayPretestPosttestN
MSDMSD
Graphic originalityYear 16.452.1155.452.84111
Year 26.223.1066.562.36154
Year 38.272.3745.861.88522
ElaborationYear 13.091.7584.732.00511
Year 23.171.8812.892.18654
Year 32.361.7063.232.48722
TitleYear 14.272.6113.362.20311
Year 22.351.6842.572.19454
Year 33.591.8693.002.37022
Special detailsYear 11.732.6110.180.40511
Year 20.571.1260.170.46644
Year 30.641.7331.091.77022
Table 15. Distribution normality—graphic creativity variables.
Years of StayStatisticdfpStatisticdfp
Graphic Originality PreGraphic Originality Post
10.891110.1440.971110.893
20.117540.0610.149540.004
30.955220.3920.928220.112
Elaboration preElaboration post
10.915110.2760.966110.839
20.140540.0100.909220.046
30.909220.0460.902220.033
Title preTitle post
10.962110.7970.900110.184
20.206540.0000.128540.027
30.897220.0260.870220.008
Special details preSpecial details post
10.725110.0010.486110.000
20.399540.0000.510540.000
30.412220.0000.673220.000
Table 16. Homoscedasticity.
Narrative CreativityTimeLevene’s Testdf1df2p
Graphic originalityPre2.8962840.061
Post1.0952840.339
ElaborationPre0.4012840.386
Post1.0112840.263
TitlePre2.4802840.090
Post0.6382840.531
Special detailsPre5.1052840.008
Post20.9832840.001
Table 17. ANOVA Split-plot: pre–post narrative creativity and years of stay.
Sums of SquaresdfMean SquareFpPartial η2Power
Graphic originality
Pre–post30.520130.5404.1600.0450.0470.522
Interaction60.180230.0904.0990.0200.0890.712
Error616.659847.347
Years of stay22.078211.0394.0990.0200.0890.371
Error508.417846.053
Elaboration
Pre–post15,942115,9425.6990.0190.0640.655
Interaction22.2342119.20011.1170.0220.0860.698
Error234.985842.797
Years of stay18.98029.4901.7040.1880.0390.349
Error467.894845.570
Title
Pre–post5.27115.2711.3980.2400.0160.215
Interaction9.02424.5121.1960.3070.0280.255
Error316.780843.771
Years of stay45.527222.7634.8190.0100.1030.785
Error396.784844.724
Special details
Pre–post7.24717.2475.0060.0280.0560.599
Interaction15.05727.5295.2000.0070.1100.817
Error121.609841.448
Years of stay11.35125.6753.0600.0520.0680.577
Error155.822841.875
Table 18. Simple effects: graphic originality.
Sums of SquaresdfMean SquareFpPartial η2Power
1 year of stay
Pre–post5.50015.5000.8210.3860.0760.130
Error67.000106.700
2 years of stay
Pre–post3.00013.0000.3730.5440.0070.092
Error426.000538.038
3 years of stay
Pre–post63.841163.84110.8420.0030.3400.881
Error9.382210.447
Table 19. Simple effects: elaboration.
Sums of SquaresdfMean SquareFpPartial η2Power
1 year of stay
Pre–post14.727114.7274.2970.0650.3010.466
Error67.000106.700
2 years of stay
Pre–post2.08312.0830.3730.7340.0140.134
Error426.000538.038
3 years of stay
Pre–post8.20518.2053.4260.0780.1400.423
Error50.295210.447
Table 20. Simple effects: special details.
Sums of SquaresdfMean SquareFpPartial η2Power
1 year of stay
Pre–post13.136113.1363.5160.0900.2600.396
Error37.364103.736
2 years of stay
Pre–post4.48114.4816.3310.0150.1070.695
Error37.51953708
3 years of stay
Pre–post2.27312.2731.0210.3240.0460.162
Error46.727212.225
Table 21. Multiple comparisons.
Years of Stay at CEPACMean Difference (I-J)Error Dev.Sig.
Tukey’s HDS1–21.360.5080.025
1–30.520.5680.629
2–3−0.830.3890.088
Table 22. Differences in special details.
Brown–Forsythedf1df2p
Special details (pre)2.580221.1120.099
Special details (post)5.440225.0960.011
Table 23. Multiple comparisons, special details—post.
Years of Stay at CEPACMean Difference (I–J)Error Dev.Sig.
Tukey’s HDS1–20.0150.3210.999
1–3−0.9090.3580.034
2–3−0.9240.2450.001
Table 24. Correlations among grades and creativity.
Creativity PreCreativity Post
rprp
Grade point average pre0.0850.435
Grade point average post0.2720.011

