A Model for Sustainable Courier Services: Vehicle Routing with Exclusive Lanes


School of Air Transport, Transportation and Logistics, Korea Aerospace University, Goyang, Gyeonggi-do 10540, Korea
*
Author to whom correspondence should be addressed.
Sustainability 2020, 12(3), 1077; https://doi.org/10.3390/su12031077
Submission received: 31 December 2019
/
Revised: 23 January 2020
/
Accepted: 31 January 2020
/
Published: 3 February 2020
(This article belongs to the Special Issue City Logistics)
Abstract
:In Southeast Asian cities, it is common for logistic companies to operate a heterogeneous fleet of delivery vehicles with motorcycles being the preferred vehicle to handle the final phase of delivery. In such scenarios, heterogeneous fleet vehicle routing problem (HFVRP) is generally applied to plan an optimal delivery. However, in many downtown cores of large and rapidly developing Southeast Asian cities, HFVRP is neither viable nor reliable because of road usage restrictions. The purpose of this article is to develop and test a different approach that accurately takes these restrictions into account and provides viable and more sustainable results. Restrictions in this paper refer to situations of urban areas in Vietnam where (i) certain vehicle types are prohibited in specified areas or where narrow alleyways limit the utilization of vehicles that exceed the road capacity and (ii) certain roads are exclusive to certain vehicle types. In networks, limited access and exclusive lanes are represented as links, or arcs, exclusive to one or another. Taking these limitations into consideration, we have developed a unique model, which we have termed Vehicle Routing Problem with Exclusive Links (VRP-EL). The model was validated and tested for its performance on scenarios with varying ratios of exclusive links. Scenarios up to 500 customers were tested on a meta-heuristic algorithm, simulated annealing. VRP-EL produces realistic outcomes. Limiting certain links to be selected according to vehicle types increases overall travel distance. However, this increase outweighs the cost of re-planning and rerouting had they not been constrained initially. The reduction in traveling distance leads to fossil fuel reduction for the overall system. The estimation of reduced carbon emissions through applying the proposed model is presented. Considering the severe traffic congestion and carbon emissions caused by motorcycles in Vietnam, the proposed model leads to a sustainable road environment.
1. Introduction
Of all the possible modes of private transportation, the motorcycle is, by far, the most common mode in many urban centers in Southeast Asia [1]. In Vietnam, motorcycles account for 95% of all motor vehicles [2]. Almost 80% of all private vehicles in Indonesia are motorcycles, and the numbers are growing at a rate of 12% per year [3,4]. In Taiwan, motorcycles represent 67% of all motor vehicles [5,6]. In Thailand, some 56% of all registered motor vehicles are motorcycles [7]. Motorcycles comprise the lion’s share of vehicles in the Bangkok Metropolitan Region (BMR) with some 20 million in number [8].
Naturally, with so many in use, a motorcycle-based delivery service is well-developed in the region. Particularly in Vietnam, where 85% of all courier deliveries, in the downtown cores of Ho Chi Minh and Hanoi, are exclusively performed by motorcycles with the remainder carried out by larger vehicles such as trucks or vans. Such heterogenous fleets complicate the delivery planning, which includes allocating vehicles to customers and planning routes. For this, heterogeneous fleet vehicle routing problem (HFVRP), an extension of vehicle routing planning (VRP), can be used to optimize the planning.
However, HFVRP does not take into consideration some important constraints in the region, and its results are not viable for actual delivery operations. Trucking is restricted during most of the daytime to ease traffic congestion in the downtown area of Ho Chi Minh and Hanoi. In addition, the Vietnamese Traffic Authority has implemented exclusive motorcycle lanes to alleviate traffic congestion and collisions. Some high-volume bridges are allocated solely to motorcycles. From a delivery network point of view, limited access areas and exclusive lanes complicate the network by exclusively allowing certain links, or arcs, to motorcycles, trucks, or both.
In this paper, we aim to correctly reflect this accessibility and exclusivity of the region by employing a different approach than HFVRP providing feasible and efficient results. This paper models Vehicle Routing Problem with Exclusive Links (VRP-EL) and tests the model’s performance in scenarios with different numbers of customers and ratios of exclusive links. The mathematical model was tested on CPLEX for sample sizes of 15 to 25 customers. Further tests for sample sizes of up to 100 customers were carried out using simulated annealing (SA), a randomized heuristic algorithm. Limiting certain links, according to vehicle types, will inevitably increase the total travel distance of each delivery. To answer the question if this increase is worth it or not, a cost comparison is provided with some mathematical assumptions.
The proposed model incorporates smart planning and thus contributes to sustainability. Specifically, sustainability encompasses improved road safety, traffic flow, and air quality at the same time. Considering the severe traffic congestion and astronomical carbon emissions caused by motorcycles in Vietnam, the proposed model is hypothesized to lead to a sustainable urban courier service in these two cities. Motorcycles in the region cause various traffic related issues, such as severe traffic congestion, road injuries, or casualties. One of the roots of this problem is poor road design and permitting mixed traffic on these roads [7]. Emissions from motorcycles also matter. According to United Nations Environment Program (UNEP) [8], less than eight percent of the population in Asia and the Pacific region, with the largest number residing in South and East Asia, breath healthy air that meets WHO standards. The VRP-EL model optimizes the routing by selecting exclusive lanes for motorcycles that will separate motorcycles from other vehicles. This directly reduces conflicts between other motorized vehicles, resulting in safer driving and less congestion. Alleviated traffic congestion is hypothesized to lower emissions and improve air quality. The model also prevents drivers from making detours by correctly planning in the first place.
It is noted that the model we propose is not limited only to the Vietnamese case or to the high motorcycle density cases. There are numerous possible cases where links in the network are exclusive to one or another. Motorcycles are banned from entering arterial roads, expressways, or freeways in most countries. Exclusive lane designs for motorcycles or bicycles are being encouraged and promoted by the WHO [9]. Often, trucks are not able to reach delivery points across narrow alleys. Height limits for passing under bridges or tunnels might exclude some trucks from being utilized in the delivery. Roads often have entrance weight restrictions for maintenance reasons.
This paper is organized as follows. Section 2 provides a review of the literature. Exclusive lane systems are summarized, the vehicle routing problems (VRPs) are reviewed, and grounds for carbon emissions calculation are provided. Section 3 summarizes the constraints for the problems that we aim to solve and mathematically model in such scenarios. Section 4 provides the computational results. Selected details of the heuristic algorithm and the results are shown. Through a comparison of results, this paper highlights the efficiency of the model. Expected reduction in carbon emissions is also presented. Section 5 provides discussion and concludes the paper with a summary of the study and suggested areas for future research.
2. Backgrounds and Literature Review
2.1. Motorcycles in Southeast Asia
Motorcycles, among various transportation modes, are largely responsible for choking the air in Southeast Asia. In Vietnam, motorcycles account for 95% of all types of motor vehicles, and they account for 93% of CO emissions in Hanoi and Ho Chi Minh City [2]. PM2.5 concentrations from on-road vehicles are dangerously high, resulting in 4600 years of life lost in Ho Chi Minh City each year [10]. Almost 80% of private vehicles in Indonesia are motorcycles, and the numbers are growing at a rate of 12% per year [3,4]. In Taiwan, motorcycles represent 67% of all motor vehicles contributing to 38% of all CO emissions [5,6]. In Thailand, some 56% of all registered motor vehicles are motorcycles [11]. Motorcycles comprise the lion’s share of vehicles in Bangkok Metropolitan Region (BMR) with some 20 million in number, which are responsible for 19% of total CO emissions [12]. Without a doubt, motorcycles are the preferred transportation mode in the region. They not only significantly contribute to air pollution but also worsen traffic congestion.
2.2. Exclusive Motorcycle Lanes
To accommodate a huge number of motorcycles and relieve congestion in Southeast Asia, exclusive motorcycle lanes have been implemented and tested over recent decades. Le and Nurhidayati [13] state that exclusive motorcycle lanes are designed to separate motorcycles from mixed traffic and to decrease conflicts between them. According to their research, more than 50% of motorcycle accidents in Taiwan occur at intersections. Exclusive motorcycle lanes have reduced conflicts at intersections and have increasingly reduced the number of accidents. In Columbia [14], the transportation authority implemented an exclusive motorcycle lane, named Motovia (or Motomia), to separate these vehicles and optimize the traffic loads. In a follow-up survey, the transportation authority asked users to evaluate Motovia; 88% of respondents noted a decreased in travel time, and 87% of them responded that motorcycle-only lanes made commuting easier. Most motorcyclists (90.8%) believed that there were fewer conflicts or road rage incidents between drivers. Singkham [15] mentions that in Thailand, there is strong correlation between the severity of a driver’s injuries and the size of vehicle that a motorcyclist collides with. He concluded that separate lanes for motorcycles would reduce the number and severity of vehicular injuries. The WHO reports that Malaysia has proved motorcycle-only lanes dramatically reduce collisions and injuries [9]. Evaluation of the federal highway in Malaysia, which includes an exclusive motorcycle lane, revealed that crashes were reduced by 39% after building such lanes. In the report, the WHO implies that exclusive motorcycle lanes should be encouraged and be promoted. Exclusive motorcycle lanes are on the rise, and in Vietnam, where motorcycles account for 95% of all vehicles, they are also being implemented, as can be found in Figure 1.
2.3. Vehicle Routing Problems (VRPs)
VRP typically accompanies a homogeneous fleet of vehicles that are fixed in capacity, visiting a set of customers, and departing from and returning to a single depot. The objective is to assign deliveries to the fleet so that all customers are served, while minimizing travel distance or time required for the fleet. Diverse VRP variations are studied, including the multi-depot vehicle routing problem (MVRP), in which vehicles depart from and return to multiple depots, and the open vehicle routing problem (OVRP), in which vehicles do not return to the depot. A detailed list of variations and their descriptions can be found in the literature [16,17]. Of note, a variation called the green vehicle routing problem (GVRP) focuses on minimizing the environmental impact of fuel consumption. Detailed solution approaches for GVRP are available in the literature [18].
The HFVRP model can be used to represent a mixed fleet of vehicles. In HFVRP, the vehicles differ, and their operating costs and capacities vary. In general, HFVRP variations can be used to tackle many real-life routing problems. Privé et al. [19] developed a VRP model with a heterogeneous fleet of vehicles for distributing soft drinks and collecting reusable containers using time window constraints. Tarantilis and Kiranoudis [20] applied HFVRP to real-life problems in construction and dairy sectors. Ceschia et al. [21] formulated a model that incorporates heterogeneous fleet, multiple planning horizons, and options for leaving some orders unscheduled. Mancini [22] formalized a real-life problem with heterogeneous fleet and multiple depots. More detailed lists of variations and solutions are referred to in the literature [23,24].
Among many real-life considerations, the accessibility constraint that identifies vehicle types that can or cannot serve certain customers has been studied in some research. Semet and Taillard [25] presented a heterogeneous problem with vehicle-dependent accessibility restrictions on customers. Brandão and Mercer [26] introduced a model that accommodates a large number of realistic conditions where access to some customers is designated to only certain vehicles.
The model we propose, Vehicle Routing Problem with Exclusive Links (VRP-EL), also focuses on the accessibility constraint. However, the proposed approach is quite the opposite. The restrictions were on customers (nodes) in the previous studies, while they are on the paths (links) in our model. The two approaches, limiting access to customers and access to paths by the type of the vehicle, are designed for different purposes and thus provide different results. Figure 2 illustrates a simple example with two different types of vehicles that explains how results may vary. When the limitations are on customers, choosing the path from to in a motorcycle’s routing is a feasible option, since and both can be served by motorcycles. However, when the constraints are on the links, such constraints as a long detour are likely to be rejected in this model, which leads to more realistic results. In the same way, our model reflects the fact that the path from to should not be a factor in determining the truck’s routing.
The restrictions on paths in the model account for exclusive road systems, such as exclusive motorcycle lanes. Figure 3 is a simple example of VRP-EL. In the figure, links that can be selected for motorcycles are illustrated as dotted lines and links that can be selected for trucks as solid lines. A route for a vehicle only includes links that can be selected by the specified vehicle type. For instance, trucks cannot traverse a route that contains a sequence of (), and motorcycles cannot traverse a route that contains ().
The model was originally developed to optimize courier services specifically in Southeast Asian urban areas. The main properties of this region are a high density of motorcycles, exclusive motorcycle lanes, and accessibility limitations from congestion and narrow alleys. However, the model can be extended and applied to a vast variety of problems reflecting realistic delivery network problems, where links, or arcs, in the networks are restricted to one specific mode of transportation.
2.4. CO2 Emissions Calculation
The VRP-EL model can reduce operating cost and travel distance of the vehicles by eliminating unfeasible delivery plans. Aside from the proposed benefit, VRP-EL is expected to reduce carbon emissions as well. To estimate the carbon reduction, precise criterion for such calculation need to be set. With respect to Vietnam, we consider two types of vehicles for delivery, motorcycles and trucks (vans). For accurate calculations, we employ different standards for each mode of transportation.
For emissions resulting from trucks, a calculation method advised by 2006 IPCC guidelines for national greenhouse gas inventories [27,28] is used. The guideline advises using the Tier 3 method when country-specific technology-based emission factors and the vehicle kilometers traveled (VKT) by fuel are available. If VKT data are available but country-specific factors are not, the Tier 2 method is recommended. When neither can be obtained, the guideline suggests using the Tier 1 method. This paper uses the Tier 1 method, which calculates the emissions in relation to the amount of fuel consumed. The guideline provides a calculation formula as presented below. Notations are provided in Table 1. In this calculation, carbons emissions, in any form, are included with the assumption that full oxidization has occurred [28].
From this calculation, it is estimated that 2.57 kg CO2 is emitted from 1 liter of diesel. If one delivery truck can travel 7.5 kilometer per liter, then 0.343 kg CO2 are emitted per kilometer.
The Tier 1 method may also be used to calculate emissions emitted by motorcycles. However, this method cannot be accurately applied to Vietnam, where over 95% of transportation modes are motorcycles, and over 50% of the motorcycles on the road exceed legal emission levels [2]. Instead, an actual measurement may be helpful. Hoang et al. [29] measured emission characteristics of the most popular motorcycle model in Vietnam. The emissions of the motorcycle were tested with the ECE R40 standard [30] that imitates cycles of idle, acceleration, cruising, and deceleration of urban driving. The results show that a motorcycle emits 4.582 grams of CO, 35.291 grams of CO2, and 0.696 grams of HC per kilometer. For comparison, the carbon emissions from the motorcycles are converted into CO2 equivalent units. Considering relative atomic weights and the assumption of full oxidization, motorcycles emit 0.044405 kg CO2 per kilometer in this paper.
3. Problem Descriptions and Model Formulation
3.1. Courier Service in Vietnam
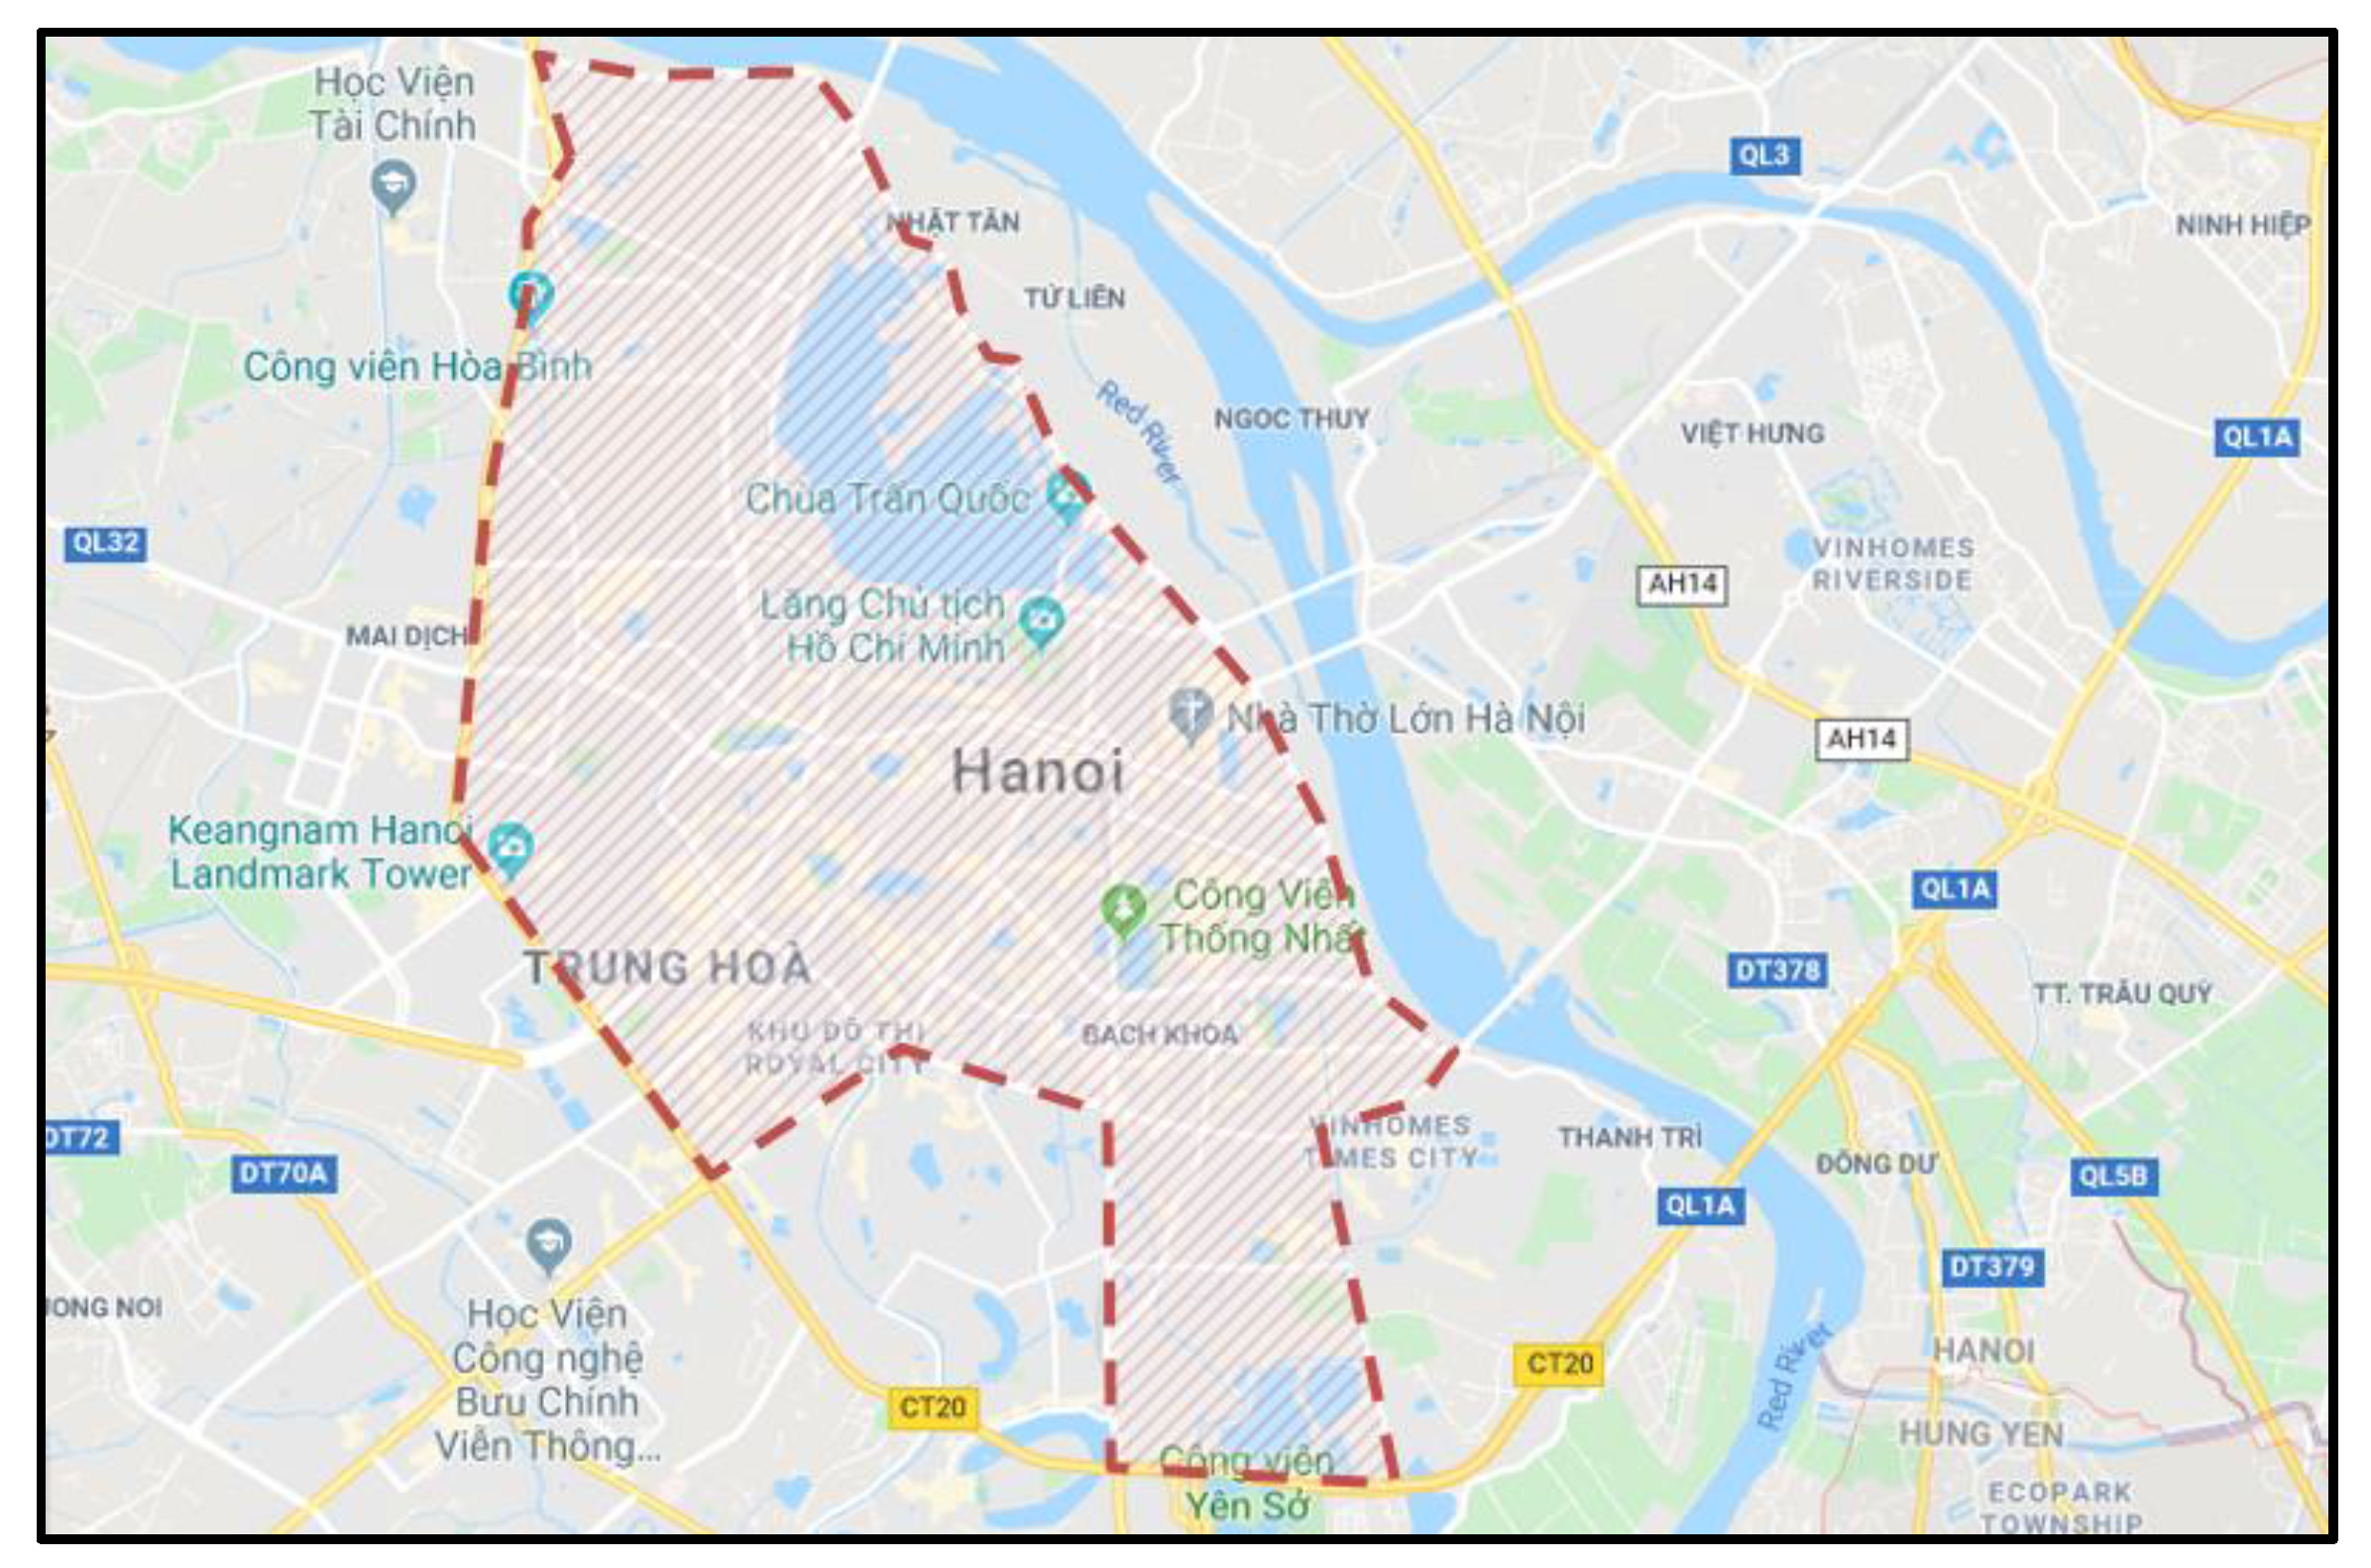
Courier services in urban Vietnamese cities are assumed to differ from services in other countries because nearly all deliveries are carried out using motorcycles. This is mainly because motorcycle ownership in the country accounts for 95% of all transportation modes [2], but there are other reasons why using trucks to deliver goods is difficult in major cities in Vietnam. Alleyways between households are very narrow, restricting the entrance of trucks. In the downtown area of Ho Chi Minh and Hanoi, trucks are restricted from 06:00 to 20:00 to ease traffic congestion. An example case from Hanoi is illustrated in Figure 4 below. The congestion itself limits the use of trucks or vans on the road and encourages the use of motorcycles. It can also be argued that the lack of cold chain infrastructure causes the purchase orders to be smaller and more frequent [31]. A survey on last mile delivery [32] conducted in Vietnam shows that residents prefer their packages to be carried by motorcycles (53%), over cars (33%). Thus, the development of motorcycle delivery service has been inevitable and continues to expand today.
The Korea Trade-Investment Promotion Agency Ho Chi Minh Trade Center verifies that motorcycles are the main means of parcel delivery in Vietnam. In 2013, fewer than 10 courier service providers used motorcycles for deliveries, but as of September 2017, more than 50 companies were in business. Three boxes can be mounted on the back and sides of a motorcycle. For goods that cannot be carried by motorcycles, vans are utilized. The trade center also reports that on average, 85% of delivery is conducted by motorcycles and the remaining 15% by trucks.
3.2. The VRP-EL Model
When there are only two different kinds of vehicles, for trucks (vans) and for motorbikes, VRP-EL model is defined as follows. Let be a complete undirected graph. The node set is made of a depot () where sets of homogeneous fleets of vehicles, and , of capacity, and , must start and end, and customers () with a given demand , for goods. Each edge [, ] from represents shortest path between nodes and in a real road network. Its associate cost and is known. The HFVRP decides a set of vehicle routes where the total cost is minimized. Each customer is visited exactly once, and the aggregated demand of each route does not exceed the capacity of the vehicle assigned. The mathematical formulation of the model is as follows. Notations are provided in Table 2.
(2) is the objective function that minimizes total cost of routes; constraints and represent the conservative constraint—all customers must be visited exactly once; constraint is to set the numbers of trucks and bikes; is for capacity limitation for each mode and each vehicle.
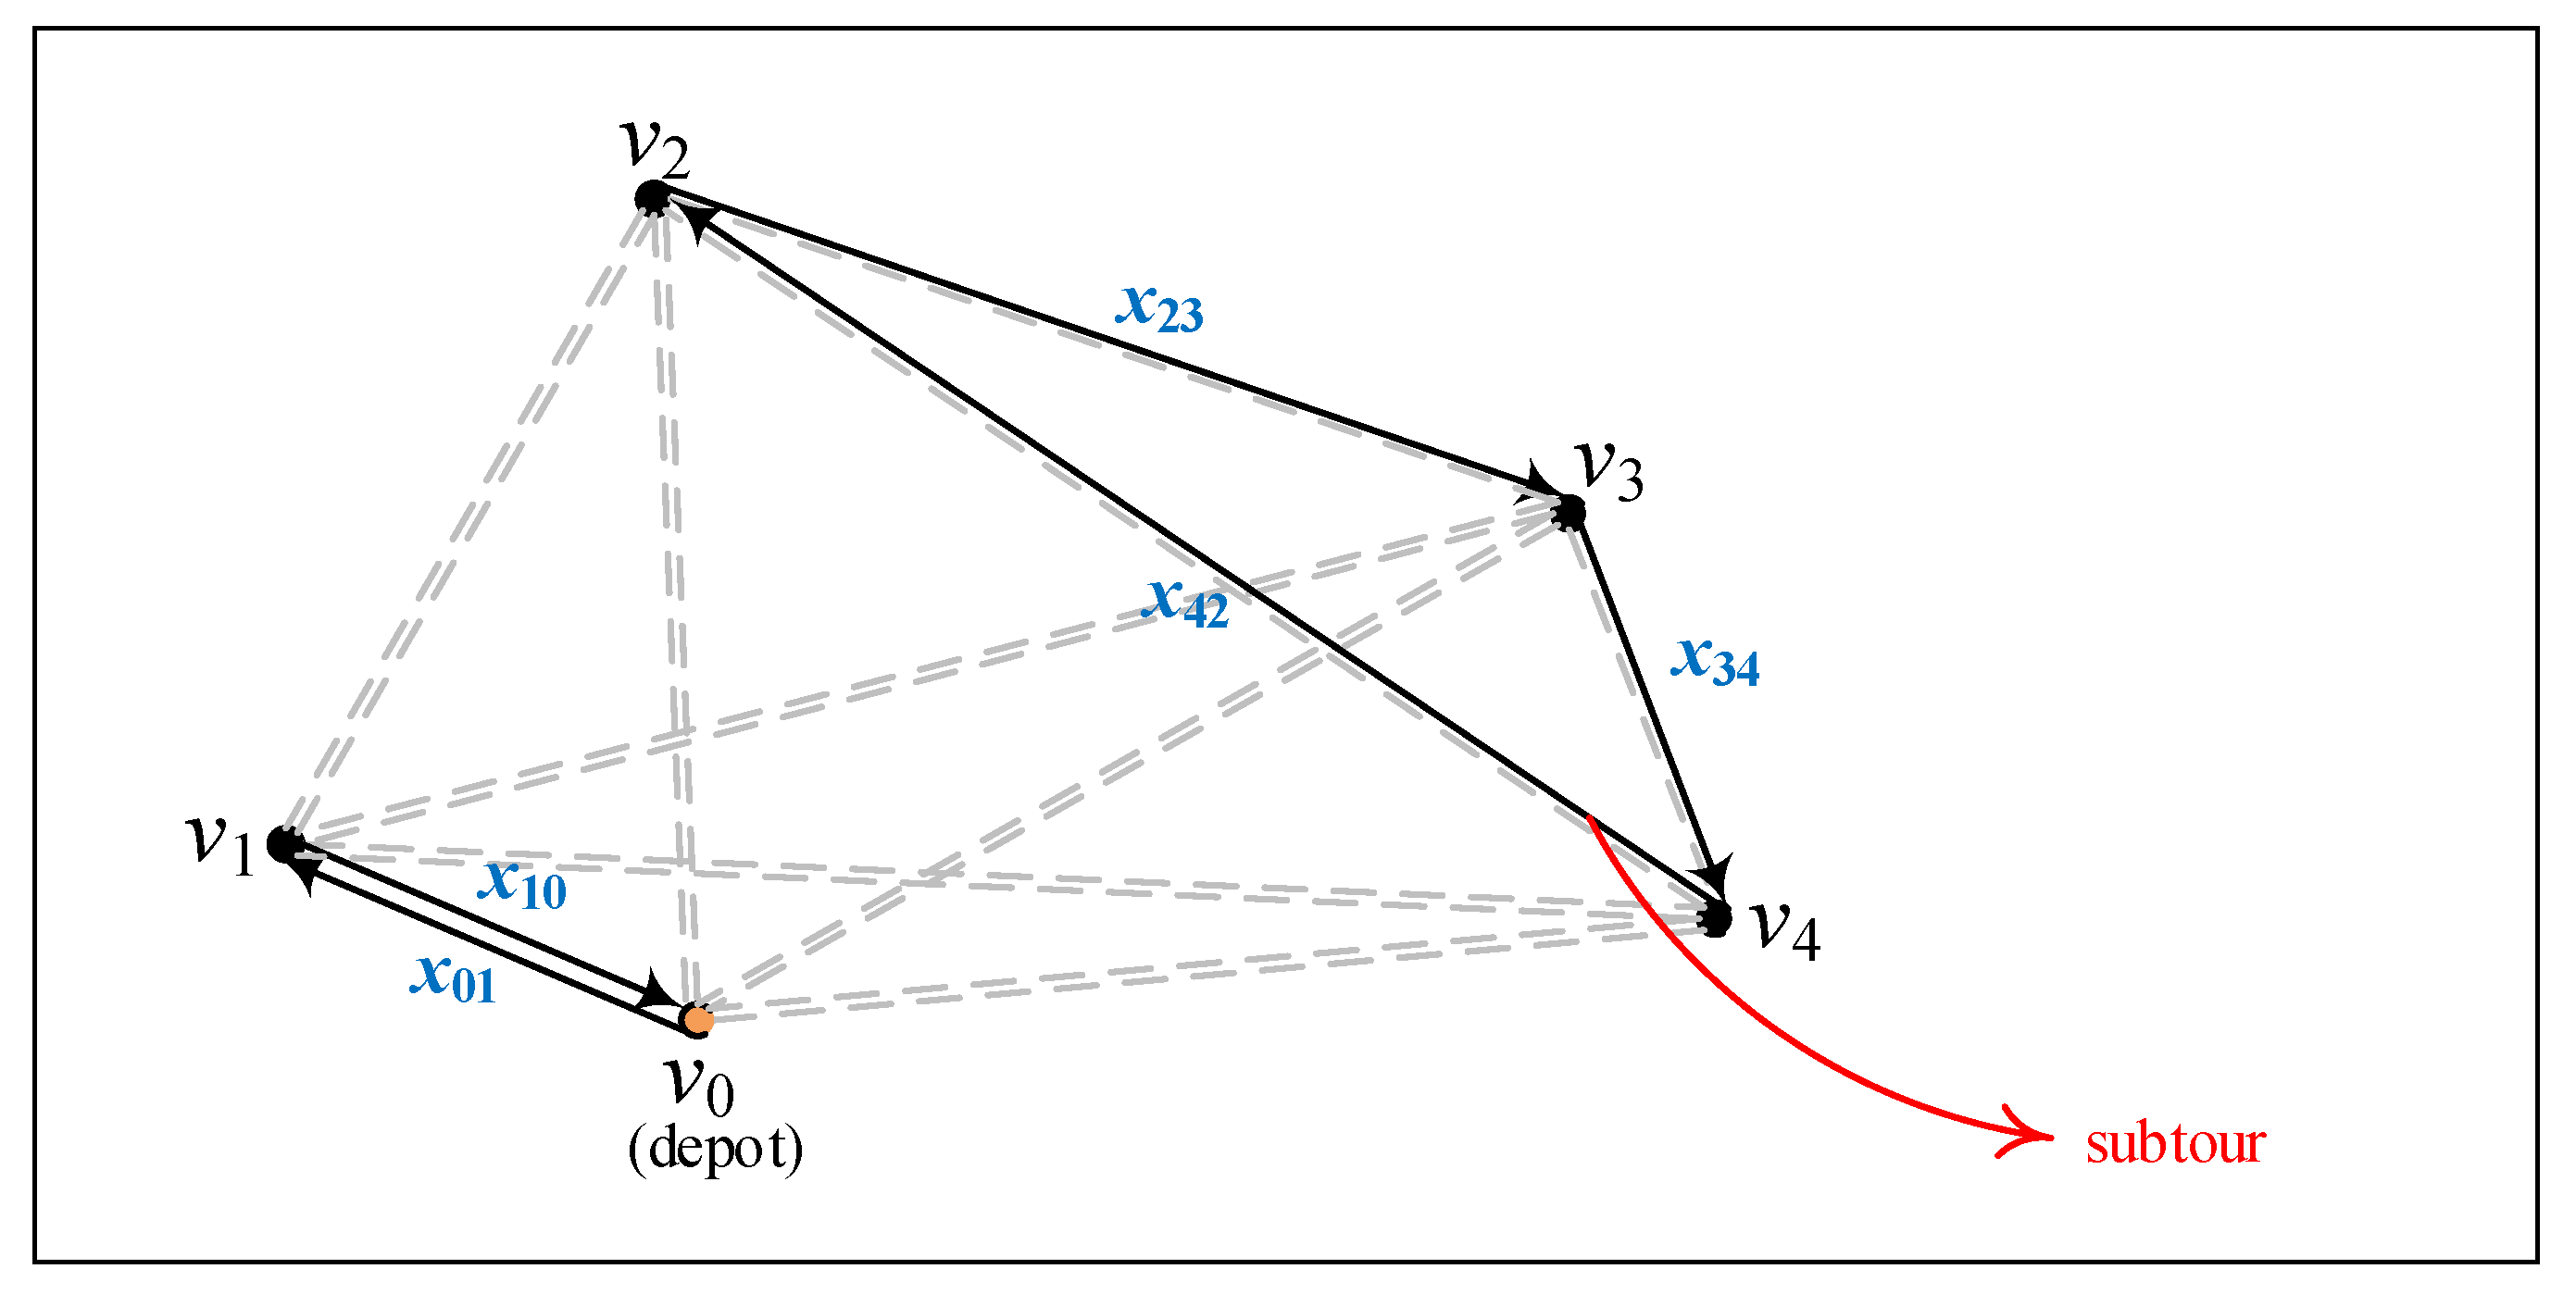
Subtour elimination constraint, which is denoted as in the model, is not quite self-explanatory, and some insight is provided here. Suppose there is one depot () and four customers (). There are two trucks (, ) we can use, and tours are designed as described in Figure 5.
Selected edges satisfy the constraints (3)–(6). Without constraint , subtours are allowed. However, adhering to . in the case would mean satisfying the constraints listed below—only these four constraints are active for the given example.
The constraint (11) indicates the tour restriction for the first truck that departs from the depot. Note that (12)–(14) cannot be satisfied at the same time even if we set to 0. When is greater or less than other values, it is easily noticed that they are contradicting. By and , is less than , and is less than . Naturally, must be less than . However, the argument of is the opposite. Only when there are no subtours does the relation of values remain consistent, and the constraint is satisfied. Constraint is not the only way of achieving subtour elimination. More detailed lists and descriptions can be found in the literature [33,34].
To take the case of courier service in Vietnam into account, exclusivity constraints (8)–(10) are included in the model. We assume all paths in the network are one of the following three types. Paths are exclusive to motorcycles, exclusive to trucks, or allowed to be both modes. If the path from to can only be used by motorcycles, then we set to 1 and if not set to 0. Likewise, we set to 1 if the path from to is dedicated to trucks and 0 if not. Then, the additional constraints reflect this exclusivity.
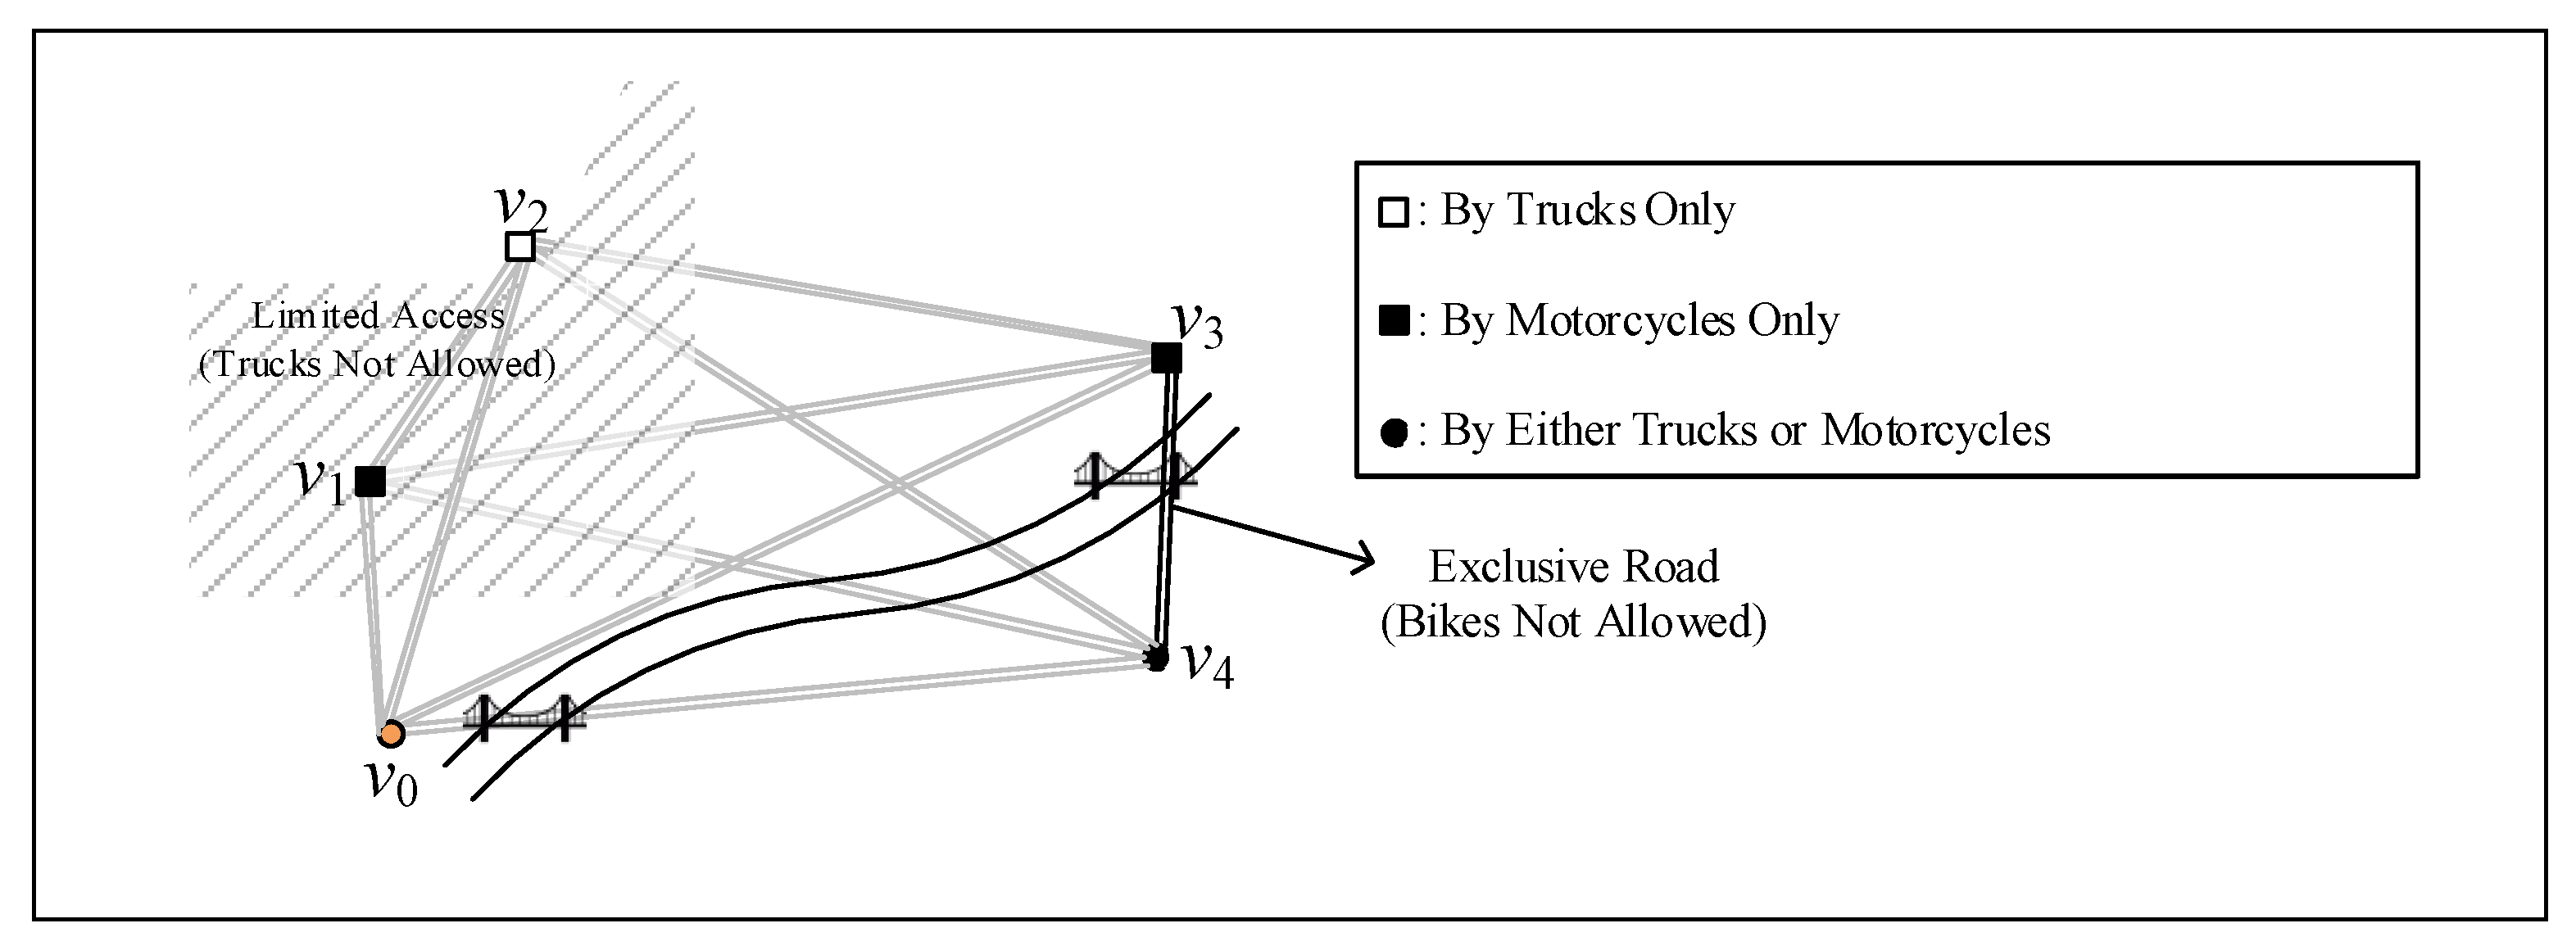
The exclusivity takes into account the limited access areas and exclusive lanes in the network. Figure 6 describes how these constraints can reflect situations with limited access. Vertices that fall within the restricted area for trucks can easily be identified, and value can be determined accordingly. In the figure, five nodes, including the depot (), and all 10 links are described. Nodes and fall within the excluded area, which is the shaded area on the map, and links that are connected to them must not be selected by trucks. The value of can be set to 1 for all combinations of and that relate to and .
Figure 7 illustrates how these constraints can take into account cases with exclusive lanes in the system. Four nodes, including the depot (), six links connecting the nodes, and exclusive lanes are illustrated. Exclusive lanes are highlighted in yellow and black. Traversing from to is considered exclusive to motorcycles because trucks would have to take a longer detour, which more than doubles the distance. Node is in close proximity to truck exclusive lanes, and the road is the only way of accessing the node. Links that connects to are for trucks only, and the value of is set to 1 accordingly.
The link from to can only be selected by either truck or motorcycle or not selected at all. The model considers that a route must include only links allowed for the vehicle in use. The constraints can also be used to represent one-way roads. For instance, can be set to 1 and to 0.
4. Computational Results and Analysis
4.1. VRP-EL on CPLEX
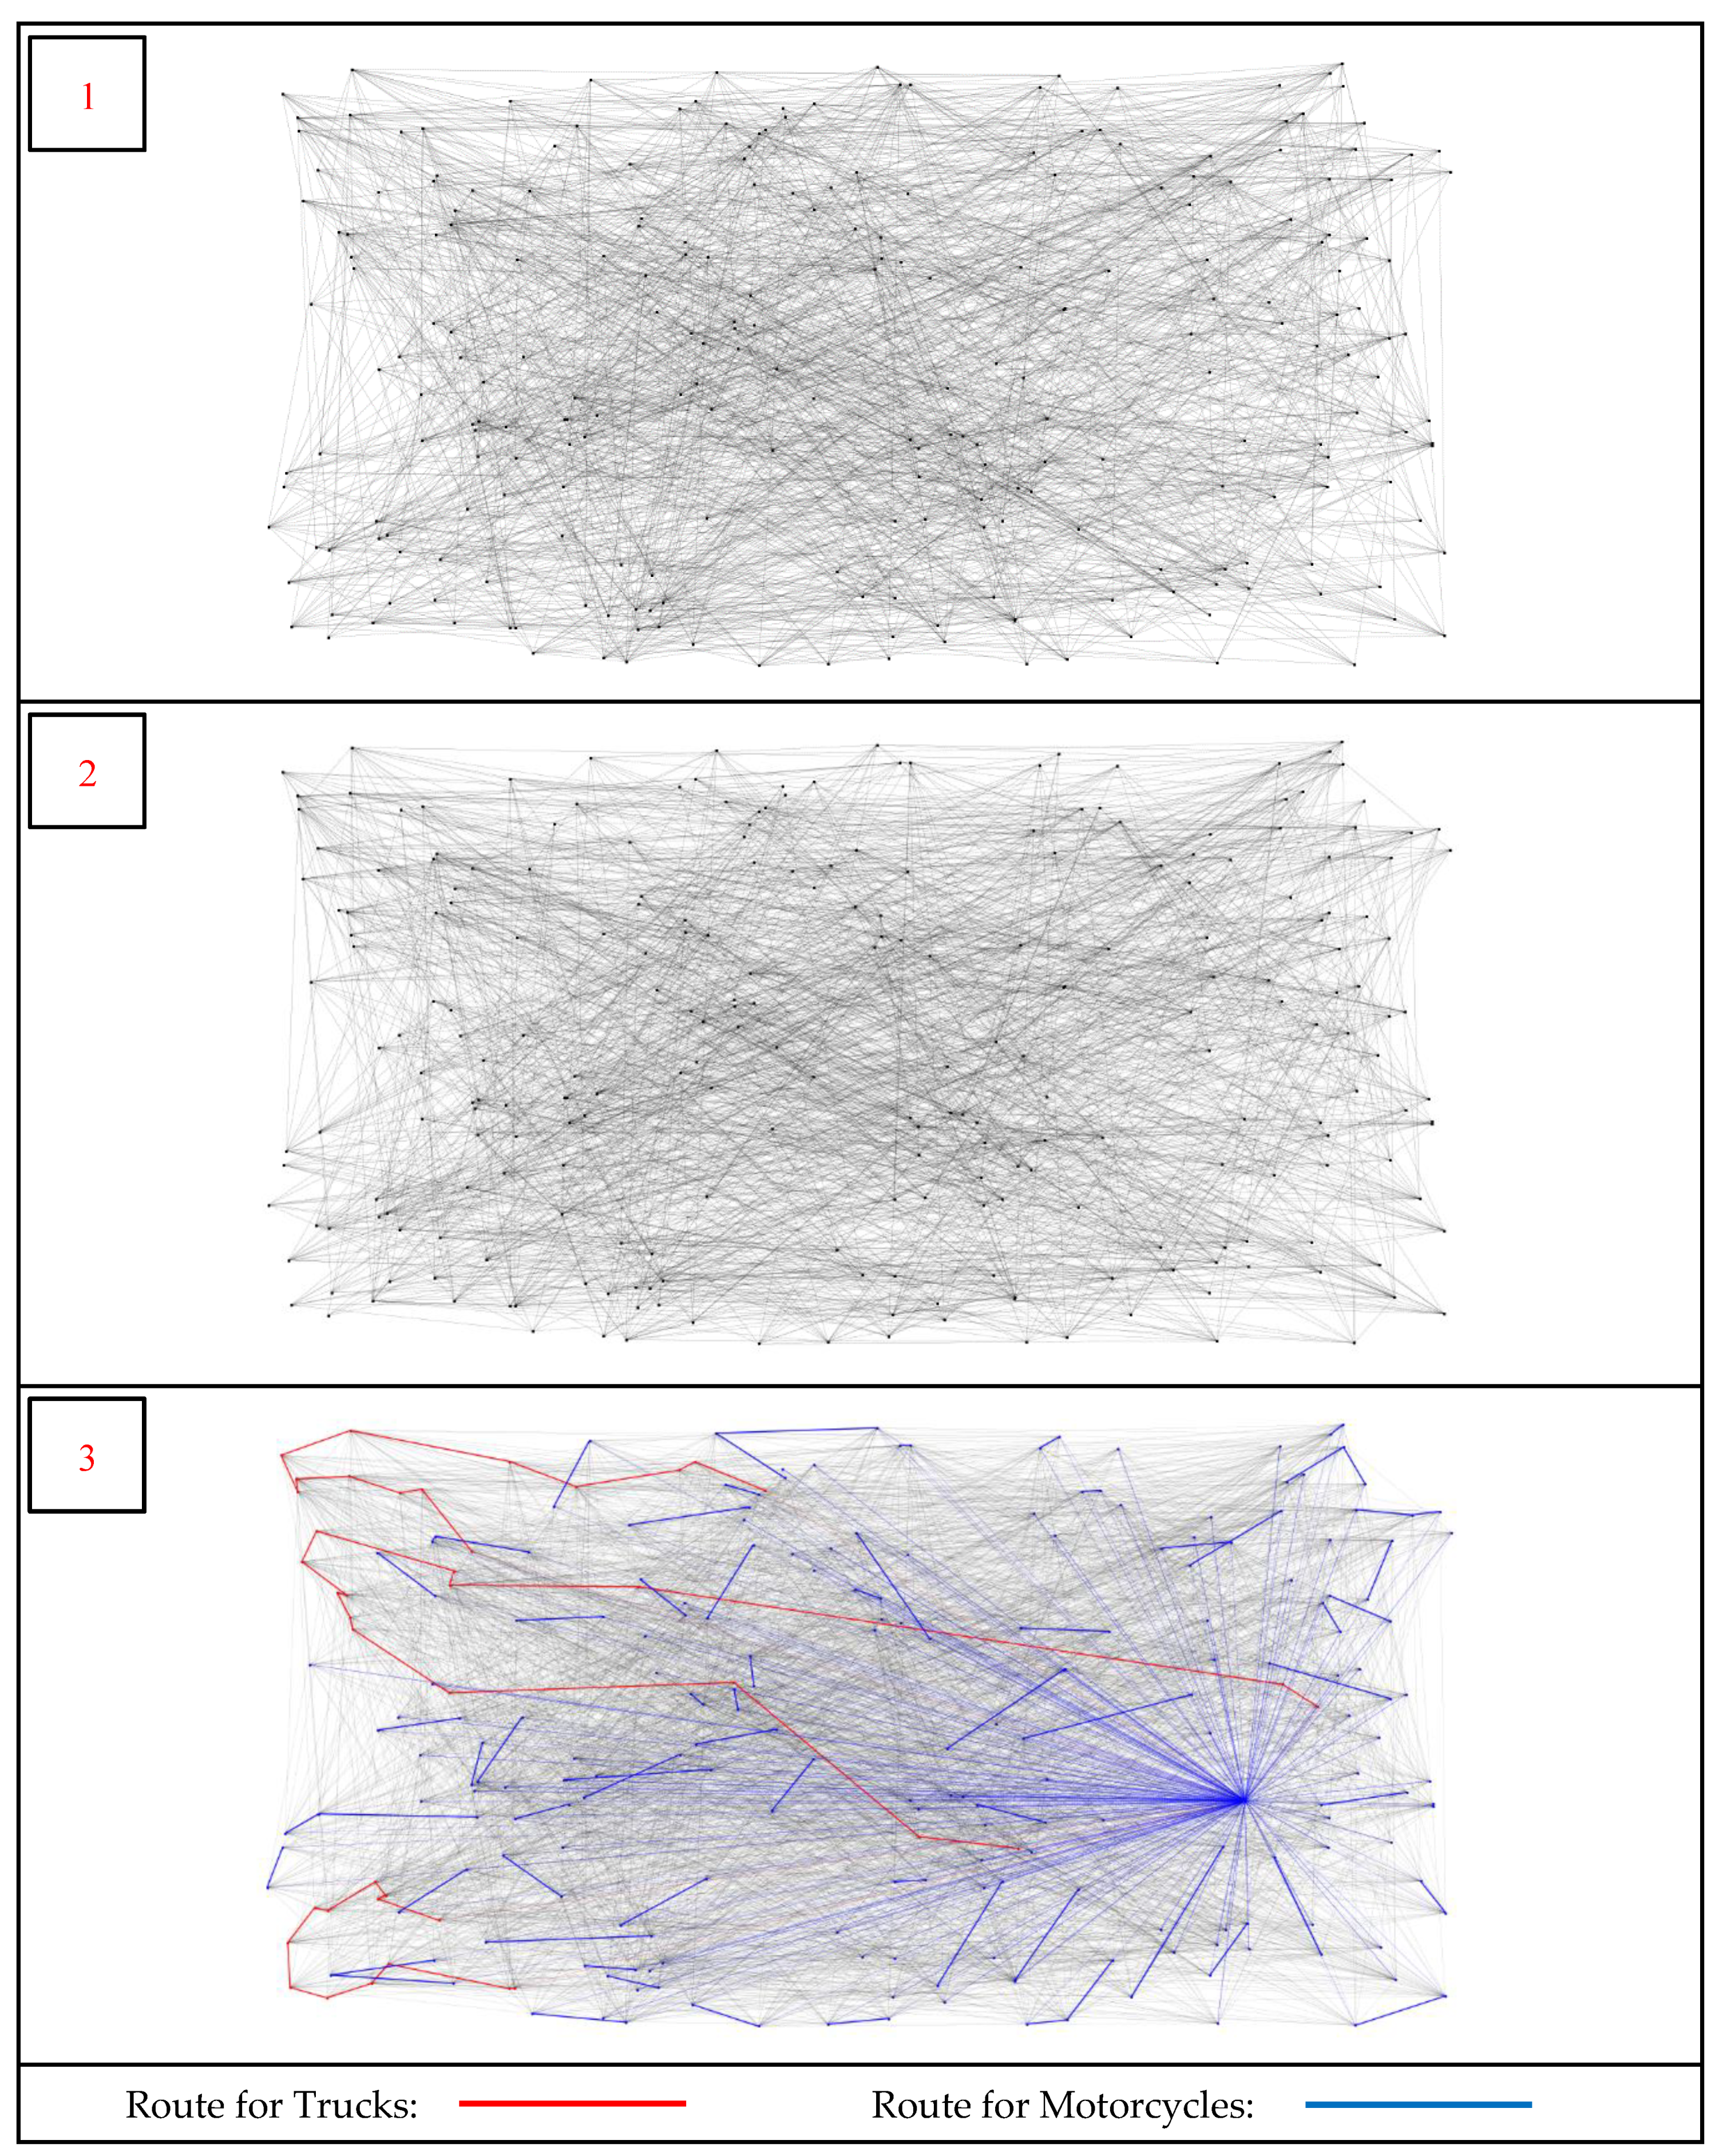
VRP is known to be NP-hard [35]. The VRP-EL was programmed on CPLEX and tested for its performance. The experiment was carried out on Intel® Core™ i9-7900X CPU @ 3.30 GHz with 32 GB RAM. Figure 8 shows an example solution. The first graph shows exclusive link sets for trucks and motorcycles. The second graph is a solution of HFVRP, where exclusive links in the first graph are not considered. VRP-EL considers the exclusive links, and the optimal solution is provided in the third graph. It is easily noted that the results of VRP-EL are different from standard HFVRP.
A total of 12 scenarios have been created to test the performance of the model and to determine the change in the total distance due to the ratio change between and (change in the ratio of the path dedicated only to the motorcycles and trucks). Scenarios 1, 2, and 3 deliver to 15 customers, 20 customers, and 25 customers, respectively. More details are listed in Table 3 below. Scenarios 1-1, 1-2, 1-3, and 1-4 have and ratios of 0%, 10%, 20%, 30%, respectively, and the same was applied to Scenarios 2 and 3. Computational results for 12 scenarios are provided in Table 4.
The run time for the model to find the optimum solution is found to be unaffected by changes in the ratio of and . Scenario 1 (15 customers) takes 83 seconds on average to find the optimal solution. Scenario 2 (20 customers) takes an average of 1474 seconds to find the optimal solution, and in very rare cases, an optimal solution was not found within 12 h. Optimum in Scenario 3 (25 customers) is often not found within 12 h. It is observed that as the ratio of and increases from 0% to 10%, 20%, and 30%, the objective function value (total distance) also increases. On average, the objective function value increased 4.08% for the case where and ratios are 10%, 7.85% for 20% cases, and 14.18% for 30% cases.
4.2. A Heuristic Approach: Simulated Annealing
Exact algorithms are applicable in only small problems with less than 25 customers [36]. Various heuristic and meta-heuristic methods have been used to solve VRP, and comprehensive surveys are referred to in the literature [16,17]. This paper applies a meta-heuristic approach, simulated annealing (SA), to solve the problems. SA has been repeatedly used in VRP research papers. SA is a random search algorithm introduced by Kirkpatrick et al. [37] inspired by the annealing process used in steel production.
The algorithm starts at an initial temperature, . The current temperature, , is updated to after a predefined number of swap or move operations of nodes (customers). Parameter is a cooling factor usually set between 0.6 and 1 to be used to lower the temperature. While heuristic algorithms mostly get stuck in a local optimum, SA can probabilistically escape locally optimal solutions. With probability ), where is the deteriorated amount of the objective function value, the algorithm allows uphill movements. The acceptance probability of degenerating solutions is based on Boltzmann’s factor, which indicates the probability of a state of energy, E. The formula implies that if is fixed, a smaller results in a higher probability of accepting uphill movements and that if is the same, higher temperature has a higher chance of acceptance. This is like the annealing process in that the atomic bonds break easily with higher kinetic energy at higher temperatures. A pseudo code is provided in Algorithm 1 [38].
| Algorithm 1. Pseudo Code for Simulated Annealing |
|
The SA algorithm was programmed on Java with an Intel® Core™ i5-5200U CPU @ 2.20 GHz. Initial temperature, , and final temperature, , were respectively set to 100 and 10. The cooling rate was set to 0.95, and for each temperature, (number of trucks + motorcycles) × 10,000 permutations were made to search the solution. Summarized results are provided in Table 5. Note that scenario 4 with 50 customers, scenario 5 with 100 customers, scenario 6 with 250 customers, and scenario 7 with 500 customers were added to the experiment to test the viability of the suggested model in more complicated transportation networks.
From scenarios 1 to 7, the number of trucks and motorcycles are set according to the delivery ratio of 85% for motorcycles and 15% for trucks. Run time to optimality is measured with pre-determined optimal solutions. The algorithm is set to record time when a solution is found within 0.1% gap from the optimum. Time saved is calculated as the optimality time ratio of the algorithm to the model on CPLEX, subtracted from 100%. Optimal solutions for scenarios 3, 4, 5, 6, and 7 have not been found by the mathematical model, so the run time to optimality and time saved values are not listed in the table. Whether the optimal solution is found or not, the algorithm proceeds until it reaches the stopping criteria, the final temperature. Run time to termination is also recorded in the table.
Figure 9 below presents an example solution for 250 customers applying the SA application. The first graph shows exclusive link sets for motorcycles within 5% of . The second graph shows exclusive links sets for trucks within 5% of . The third graph is a solution solved by SA. In the third figure, routes found for trucks and motorcycles are drawn as red and blue lines, respectively. The exclusive links are accurately considered in the solution, which makes the solution a feasible one.
By varying the ratio of and , a total of 112 extended scenarios were made, and detailed results are provided in Table 6. For each extended scenario, 20 replications were solved, and the results were averaged. The variance of and ratios had no relation to the run time of the algorithm.
In Table 6, HFVRP (①) is the value of planned total distance when exclusive links are neglected, and penalty (②) is the sum of distance exclusive links that are chosen by prohibited vehicle types in solution HFVRP, then multiplied by 0.5. That is, (length of links selected by trucks plus length of links selected by motorcycles) × 0.5. The penalty value represents the cost of re-planning and making detours when the plan turns out to be impractical. On the other hand, VRP-EL (③) takes exclusive links into account when solving the problem, so penalty does not occur. With increments mostly under 10%, it is indicated that the distance of VRP-EL is greater than HFVRP, since part of the links in the networks are limited. However, when penalty cost is factored in, the opposite happens. Except for some scenarios with very low and ratios, we were able to observe that the benefit favors the VRP-EL model. It is observed that the larger the ratio of and , or the larger the number of customers, the greater the benefit.
4.3. Reduction in Emissions
Reduced travel distances reduce carbon emissions. Since the cost calculation is based on the total distance traveled and penalty for selecting prohibited paths, it is reasonable to infer that the VRP-EL model contributes to lower emissions. To support this argument, we estimated expected reduction in carbon emissions. The estimation is based on the literature review; the trucks and motorcycles emit 0.343 kg CO2 per kilometer and 0.044405 kg CO2 per kilometer, respectively. The ratio of trucks and motorcycles was also set to reflect to the Vietnamese case; 85% of deliveries are carried out by motorcycles and 15% by trucks.
The amount of carbon reduction was calculated supposing probable cases in Vietnam. In an area of 20 × 20 kilometers, which is similar in size to the metropolitan areas of Ho Chi Minh and Hanoi cities, 500 delivery orders were randomly generated for a day. Each order can include from one to three items. Motorcycles are limited to carrying three items in one cycle, while trucks can deliver 30. All orders are delivered from a depot located in the center—283 routes for motorcycles and six routes for trucks are created. The Euclidean distances between nodes are multiplied by 1.5 to imitate actual road distances. Varying and from 0% to 30%, daily expected carbon reductions were calculated, and the results are presented in Table 7.
For each permutation of and , 20 replications were made and averaged. The reductions are the result of correctly taking exclusive links into account, which avoids costly detours or re-planning. The saved distances for both vehicle types are directly transformed into carbon emissions by multiplying the amount of CO2 emission per kilometer that is pre-calculated in this paper.
Of note, this is just one case of many probable scenarios, and we expect to see a much larger overall reduction. As the demand for courier service increased in relation to the growth in e-commerce, the Korea Trade-Investment Promotion Agency reported that by September 2017, a company named Giao hang nhanh (GHN) accounted for 98% of nearly 10,000 daily parcel deliveries in Vietnam.
5. Discussion and Conclusions
In downtown areas of Vietnam, delivery trucks have limited access. There are many reasons for this: Poorly developed infrastructure, lack of access to older areas, and government restrictions on trucking during the daytime. Motorcycles are the dominant transportation mode, and naturally courier services using motorcycles have been extensively developed. Motorcycles are the most versatile and the most efficient transportation means on the road, but in many cases, motorcycles are also banned from certain areas for many reasons. For example, they are not allowed on highways, or on roads that restricts motorcycle access. This creates planning difficulties because some links, or arcs, in delivery networks are exclusive to motorcycles or to trucks.
From a sustainability point of view, motorcycles are not exactly a welcomed transportation mode. This is because, especially in Southeast Asian regions, they are the main source of vehicular injuries and atmospheric carbon emissions. However, banning the use of motorcycles is not a realistic option. Rather, ways to reduce carbon emissions need to be examined. One way is to implement exclusive motorcycle lanes. In Taiwan, Columbia, Thailand, and Malaysia, exclusive motorcycle lanes have shown to reduce traffic congestion and vehicular accidents. The World Health Organization is even encouraging the implementation of exclusive motorcycle lanes. Fewer road injuries and less congestion will help improve sustainability.
To consider limited access areas and exclusive lanes in the mathematical model, we have extended the VRP model by adding exclusivity constraints and named it VRP-EL (exclusive links). The model was tested on CPLEX with a total of 12 scenarios. The run time for the model to find the optimum solution was found not to be affected by changes in the ratio of exclusive roads. In rare cases, optimal solutions for 20 customers were not found within 12 h. Optimal solutions for 25 customers were not found within 12 h in most cases. The average optimality gap of the 25 customer cases was 4.35%.
To solve the problem within a reasonable time frame and to solve for even larger instances of up to 500 customers, we implemented the simulated annealing algorithm. Solutions for HFVRP and VRP-EL were compared. VRP-EL produces realistic results and can prevent costs of re-planning or taking detours. With penalty cost added to HFVRP, it is rather advantageous to use VRP-EL. In some scenarios, the savings were more than 30%. Aside from the benefit to operating costs, a quantitative estimation on expected atmospheric carbon reductions in Vietnam was carried out to support the argument that this model reduces emission.
The model we proposed in this paper can be used to model many other real-world cases, where links in networks are exclusive to one or another. For instance, paths that pass under bridges or through tunnels might be accessible only to motorcycles. For maintenance reasons, roads can be closed to delivery trucks or can have weight restrictions.
Looking at the statistics, motorcycles are currently the major mode of transportation in many Southeast Asian countries, and they will continue to be so. Authorities are aware of the harmful effects of the motorcycles on sustainability and are taking actions. Their 2030 and 2050 plans to reduce carbon emissions have already begun. It is highly possible that electric bicycles (e-bikes) and electric scooters (e-scooters) are to replace the combustion engine motorcycles. The global market of e-scooters is expected to increase from 4.1 million in 2015 to over 4.4 million in 2025, with the largest gains expected in India, Indonesia, and Vietnam [39].
This study argues traffic congestion would be reduced with exclusive road systems, and the emissions would also be reduced accordingly. This paper has limited its area of research to evaluating atmospheric carbon reductions though reduced travel distance of deliveries. The limitation of this study is that this study only examines two cities in Vietnam. Applying the proposed models to other large cities in Southeast Asia and to those cities where motorcycles dominate the roads should provide access to more data that could be run in the model proposed in this paper. Lastly, estimation on the reduction of non-carbon pollutants, such as particulate matter (PM), is an intriguing direction for future research.
Author Contributions
Conceptualization, J.C.; Data curation, K.L.; Formal analysis, K.L.; Methodology, K.L.; Project administration, J.C.; Resources, B.S. and D.C.; Software, K.L.; Supervision, J.C.; Validation, K.L., J.C., B.S. and D.C.; Visualization, K.L.; Writing—original draft, K.L.; Writing—review & editing, J.C., B.S. and D.C. All authors have read and agreed to the published version of the manuscript.
Funding
This work was partially supported by Jungseok Logistics Foundation Grant.
Conflicts of Interest
The authors declare no conflict of interest.
References
- Chemonics International Inc. Cairo Air Improvement Project Vehicle Emissions Testing Component: Motorcycle Emissions. 2000. Available online: https://pdf.usaid.gov/pdf_docs/Pnacy042.pdf (accessed on 1 February 2020).
- Do, H.D. Roadmap for motorcycle emission standard and fuel quality in Vietnam. 2011. Available online: http://www.uncrd.or.jp/content/documents/6EST-5B02.pdf (accessed on 1 February 2020).
- International Council on Clean Transportation (ICCT). Opportunities to Reduce Vehicle Emissions in Jakarta. 2014. Available online: https://theicct.org/sites/default/files/publications/ICCT_Jakarta-briefing_20141210.pdf (accessed on 1 February 2020).
- Yudison, A.; Iman, K.R.; Sulaeman, A. Motorcycle Emission Profiles in Bandung City, Indonesia. Small Engine Technol. Conf. Exhib. 2017. Available online: https://www.sae.org/publications/technical-papers/content/2017-32-0076/ (accessed on 1 February 2020).
- Lin, C.W.; Lu, S.J.; Lin, K.S. Test emission characteristics of motorcycles in Central Taiwan. Sci. Total Environ. 2006, 368, 435–443. [Google Scholar] [CrossRef] [PubMed]
- Chen, Y.C.; Chen, L.Y.; Jeng, F.T. Analysis of motorcycle exhaust regular testing data —A case study of Taipei City. J. Air Waste Manag. Assoc. 2009, 59, 757–762. [Google Scholar] [CrossRef] [PubMed]
- Wang, M.-H.; Professor, A. Principles for Developing Traffic Control Devices for Mixed Traffic Flow with Numerous Motor Scooters. 93rd TRB Annu. Meet. 2013. Available online: https://pdfs.semanticscholar.org/77a7/a789103503993a78e4e828dc3dbef8f99fa5.pdf (accessed on 1 February 2020).
- United Nations Environment Programme (UNEP). Air Pollution in Asia and the Pacific: Science-based Solutions. 2019. Available online: https://www.ccacoalition.org/en/resources/air-pollution-asia-and-pacific-science-based-solutions-summary-full-report (accessed on 1 February 2020).
- World Health Organization. Saving Millions of lives: Decade of action for road safety 2011–2020. WHO Publ. 2011, 11, 5–7. [Google Scholar]
- Le, L.T.P.; Leung, A. Associations between urban road-traffic emissions, health risks, and socioeconomic status in Ho Chi Minh City, Vietnam: A cross-sectional study. Lancet Planet. Heal. 2018, 2, S5. [Google Scholar] [CrossRef]
- Satiennam, T.; Seedam, A.; Radpukdee, T.; Satiennam, W.; Pasangtiyo, W.; Hashino, Y. Development of on-road exhaust emission and fuel consumption models for motorcycles and application through traffic microsimulation. J. Adv. Transp. 2017, 1876, 1–10. [Google Scholar] [CrossRef]
- Cheewaphongphan, P.; Junpen, A.; Garivait, S.; Chatani, S. Emission inventory of on-road transport in Bangkok Metropolitan Region (BMR) development during 2007 to 2015 using the GAINS model. Atmosphere 2017, 8, 167. [Google Scholar] [CrossRef] [Green Version]
- Le, T.Q.; Nurhidayati, Z.A. A study of motorcycle lane design in Some Asian countries. Procedia Eng. 2016, 142, 292–298. [Google Scholar] [CrossRef]
- Osorio-Cuéllar, G.V.; Pacichana-Quinayaz, S.G.; Bonilla-Escobar, F.J.; Fandiño-Losada, A.; Jaramillo-Molina, C.; Gutiérrez-Martínez, M.I. First motorcycle-exclusive lane (Motovia) in Colombia: perceptions of users in Cali, 2012–2013. Int. J. Inj. Contr. Saf. Promot. 2017, 24, 145–151. [Google Scholar] [CrossRef]
- Singkham, P. Separate Lane for Motorcycle to Reduce Severity of Road Traffic Injury among Motorcyclist in Thailand. Master’s Thesis, Royal Tropical Institute, Amsterdam, The Netherlands, 2016. [Google Scholar]
- Eksioglu, B.; Vural, A.V.; Reisman, A. The vehicle routing problem: A taxonomic review. Comput. Ind. Eng. 2009, 57, 1472–1483. [Google Scholar] [CrossRef]
- Braekers, K.; Ramaekers, K.; Van Nieuwenhuyse, I. The vehicle routing problem: State of the art classification and review. Comput. Ind. Eng. 2016, 99, 300–313. [Google Scholar] [CrossRef]
- Park, Y.; Chae, J. A review of the solution approaches used in recent G-VRP (Green Vehicle Routing Problem). Int. J. Adv. Logist. 2014, 3, 27–37. [Google Scholar] [CrossRef]
- Privé, J.; Renaud, J.; Boctor, F.; Laporte, G. Solving a vehicle-routing problem arising in soft-drink distribution. J. Oper. Res. Soc. 2006, 57, 1045–1052. [Google Scholar] [CrossRef]
- Tarantilis, C.D.; Kiranoudis, C.T. A flexible adaptive memory-based algorithm for real-life transportation operations: Two case studies from dairy and construction sector. Eur. J. Oper. Res. 2007, 179, 806–822. [Google Scholar] [CrossRef]
- Ceschia, S.; Di Gaspero, L.; Schaerf, A. Tabu search techniques for the heterogeneous vehicle routing problem with time windows and carrier-dependent costs. J. Sched. 2011, 14, 601–615. [Google Scholar] [CrossRef] [Green Version]
- Mancini, S. A real-life Multi Depot Multi Period Vehicle Routing Problem with a Heterogeneous Fleet: Formulation and Adaptive Large Neighborhood Search based Matheuristic. Transp. Res. Part C Emerg. Technol. 2016, 70, 100–112. [Google Scholar] [CrossRef]
- Soonpracha, K.; Mungwattana, A.; Janssens, G.K.; Manisri, T. Heterogeneous VRP review and conceptual frameworks. Lect. Notes Eng. Comput. Sci. 2014, 2210. [Google Scholar]
- Koç, Ç.; Bektaş, T.; Jabali, O.; Laporte, G. Thirty years of heterogeneous vehicle routing. Eur. J. Oper. Res. 2016, 249, 1–21. [Google Scholar] [CrossRef] [Green Version]
- Semet, F.; Taillard, E. Solving real-life vehicle routing problems efficiently using tabu search. Ann. Oper. Res. 1993, 41, 469–488. [Google Scholar] [CrossRef]
- Brandão, J.; Mercer, A. A tabu search algorithm for the multi-trip vehicle routing and scheduling problem. Eur. J. Oper. Res. 1997, 100, 180–191. [Google Scholar] [CrossRef]
- Intergovernmental Panel on Climate Change (IPCC). 2006 IPCC Guidelines for National Greenhouse Gas Inventories, Overview. 2006. Available online: https://www.ipcc-nggip.iges.or.jp/public/2006gl/ (accessed on 1 February 2020).
- Intergovernmental Panel on Climate Change (IPCC). 2006 IPCC Guidelines for National Greenhouse Gas Inventories, Chapter 3, Mobile Combustion. 2006. Available online: https://www.ipcc-nggip.iges.or.jp/public/2006gl/ (accessed on 1 February 2020).
- Hoang, A.T.; Tran, Q.V.; Al-Tawaha, A.R.M.S.; Pham, V.V.; Nguyen, X.P. Comparative analysis on performance and emission characteristics of an in-Vietnam popular 4-stroke motorcycle engine running on biogasoline and mineral gasoline. Renew. Energy Focus 2019, 28, 47–55. [Google Scholar] [CrossRef]
- DELPHI, Worldwide Emissions Standards, Passenger Cars & Light Duty Trucks. 2008. Available online: https://www.delphi.com/sites/default/files/inline-files/delphi-worldwide-emissions-standards-passenger-cars-light-duty-2016-7.pdf (accessed on 1 February 2020).
- The Southeast Asia Centre of Asia-Pacific Excellence, Last Mile Delivery in Vietnam COLD CHAIN LOGISTICS. 2019. Available online: https://seacape.org.nz/media/1950/last-mile-delivery-in-vietnam.pdf (accessed on 1 February 2020).
- Le, T.V.; Ukkusuri, S.V. Crowd-shipping services for last mile delivery: Analysis from survey data in two countries. arXiv 2018, 1–23. Available online: https://arxiv.org/abs/1810.02856 (accessed on 1 February 2020).
- Desrochers, M.; Laporte, G. Improvements and extensions to the Miller-Tucker-Zemlin subtour elimination constraints. Oper. Res. Lett. 1991, 10, 27–36. [Google Scholar] [CrossRef]
- Achuthan, N.R.; Caccetta, L.; Hill, S.P. A new subtour elimination constraint. Eur. J. Oper. Res. 1996, 91, 573–586. [Google Scholar] [CrossRef]
- Lenstra, J.K.; Rinnooy-Kan, A.H.G. Complexity of Vehicle Routing and Scheduling Problems. Networks 1981, 11, 221–227. [Google Scholar] [CrossRef] [Green Version]
- Fisher, L. Optimal Solution of Vehicle Routing Problems K-Trees. Oper. Res. 2013, 42, 626–642. [Google Scholar] [CrossRef]
- Kirkpatrick, S.; Gelatt, C.D.; Vecchi, M.P. Optimization by Simulated Annealing. Science 1983, 220, 671–680. [Google Scholar] [CrossRef]
- Lee, K.; Chae, J.; Kim, J. A courier service with electric bicycles in an Urban Area: The case in Seoul. Sustainability 2019, 11, 1255. [Google Scholar] [CrossRef] [Green Version]
- Andrada, P.; Martínez, E.; Blanqué, B.; Torrent, M.; Perat, J.I.; Sánchez, J.A. New axial-flux switched reluctance motor for e-scooter. In Proceedings of the 2016 International Conference on Electrical Systems for Aircraft, Railway, Ship Propulsion and Road Vehicles & International Transportation Electrification Conference (ESARS-ITEC), Toulouse, France, 2–4 November 2016. [Google Scholar] [CrossRef]
Figure 1.
Exclusive motorcycle lanes in Ho Chi Minh City.

Figure 2.
Illustration of limiting customers (nodes) and paths (links).

Figure 3.
An illustrative example of Vehicle Routing Problem with Exclusive Links (VRP-EL).

Figure 4.
Restricted area for trucks in downtown Hanoi. (Trucks are not permitted to operate in the shaded area from 06:00 to 20:00).
Figure 4.
Restricted area for trucks in downtown Hanoi. (Trucks are not permitted to operate in the shaded area from 06:00 to 20:00).

Figure 5.
An example of subtour.

Figure 6.
Consideration of limited access in VRP-EL.

Figure 7.
Consideration of exclusive roads in VRP-EL.

Figure 8.
An example solution of HFVRP and VRP-EL.

Figure 9.
An example solution of VRP-EL with 250 deliveries.


Table 1.
Notations on carbon emission calculations for trucks.
| Parameter | Notation |
|---|---|
| Greenhouse gas emission by fuel consumption | |
| Fuel consumption () | |
| Caloric value liquid (MJ/L), gas (MJ/N) | |
| Conversion factor (1 TJ = MJ) | |
| Greenhouse gas emission factor, in fuels suggested by the IPPC |
Table 2.
Parameter and Notation of heterogeneous fleet vehicle routing problem (HFVRP) model.
| Parameter | Notation |
|---|---|
| Transportation mode = { (truck), (bike)} | |
| Index of origin and destination | |
| If path from to with mode is selected, then 1, otherwise 0 | |
| Cost (time, distance, etc.) of selecting path from to with mode | |
| Maximum capacity of mode | |
| Demand quantity of customer | |
| Time (cost) accumulated with mode until arriving at customer | |
| Service time (cost) at customer | |
| A big real number (bigM) | |
| If path from to is exclusive to mode , then 1, otherwise 0 | |
| If path from to is exclusive to mode , then 1, otherwise 0 |
Table 3.
Details of basic scenarios for VRP-EL model.
| Scenarios | 1 | 2 | 3 |
|---|---|---|---|
| Number of customers | 15 | 20 | 25 |
| Total demand quantity | 30 | 39 | 49 |
| Capacity/number of trucks | 10/3 | 10/4 | 10/5 |
| Capacity/number of motorcycles | 3/2 | 3/2 | 3/2 |
Table 4.
Computational results of 12 scenarios on CPLEX.
| Scenarios | Alpha, Beta | OFV (Total Distance) | Run Time (s) | Optimality Gap | |
|---|---|---|---|---|---|
| 1 | 1-1 | 0% | 2335 | 63 | 0% |
| 1-2 | 10% | 2392 | 156 | 0% | |
| 1-3 | 20% | 2448 | 67 | 0% | |
| 1-4 | 30% | 2581 | 46 | 0% | |
| 2 | 2-1 | 0% | 5588 | 3310 | 0% |
| 2-2 | 10% | 5787 | 6341 | 0% | |
| 2-3 | 20% | 6080 | 125 | 0% | |
| 2-4 | 30% | 6601 | 160 | 0% | |
| 3 | 3-1 | 0% | 6664 | 21,743 | 3.26% |
| 3-2 | 10% | 7079 | 43,312 | 8.15% | |
| 3-3 | 20% | 7324 | 37,174 | 2.05% | |
| 3-4 | 30% | 7587 | 25,354 | 3.92% | |
Table 5.
Summary of basic scenarios and results of simulated annealing (SA) application.
| Scenarios | 1 | 2 | 3 | 4 | 5 | 6 | 7 |
|---|---|---|---|---|---|---|---|
| Number of customers | 15 | 20 | 25 | 50 | 100 | 250 | 500 |
| Total demand quantity | 30 | 39 | 49 | 99 | 199 | 499 | 999 |
| Capacity/number of trucks | 10/1 | 10/1 | 10/1 | 10/2 | 10/4 | 30/3 | 30/6 |
| Capacity/number of motorcycles | 3/8 | 3/11 | 3/14 | 3/27 | 3/55 | 3/141 | 3/283 |
| Run time to optimality (s) | 2.5 | 4 | - | - | - | - | - |
| Time saved | 97% | 99.7% | - | - | - | - | - |
| Run time to termination (s) | 16 | 25 | 28 | 74 | 258 | 865 | 2652 |
Table 6.
Scenarios and detailed results of SA application.
| Scenarios | Alpha | Beta | HFVRP (①) | Penalty (②) | ①+② | VRP-EL (③) | ③/① | ③/(①+②) | ||
|---|---|---|---|---|---|---|---|---|---|---|
| 1 | 1-1 | 1-1-1 | 0% | 0% | 5439 | 0 | 5439 | 5439 | 1.000 | 1.000 |
| 1-1-2 | 10% | 5517 | 241 | 5758 | 5813 | 1.054 | 1.009 | |||
| 1-1-3 | 20% | 5648 | 326 | 5974 | 6090 | 1.078 | 1.019 | |||
| 1-1-4 | 30% | 5328 | 512 | 5839 | 5924 | 1.112 | 1.014 | |||
| 1-2 | 1-2-1 | 10% | 0% | 5616 | 215 | 5832 | 5647 | 1.005 | 0.968 | |
| 1-2-2 | 10% | 5278 | 410 | 5688 | 5522 | 1.046 | 0.971 | |||
| 1-2-3 | 20% | 5067 | 459 | 5525 | 5604 | 1.106 | 1.014 | |||
| 1-2-4 | 30% | 5504 | 733 | 6237 | 6075 | 1.104 | 0.974 | |||
| 1-3 | 1-3-1 | 20% | 0% | 5093 | 385 | 5478 | 5150 | 1.011 | 0.940 | |
| 1-3-2 | 10% | 5496 | 595 | 6091 | 5840 | 1.063 | 0.959 | |||
| 1-3-3 | 20% | 5236 | 800 | 6036 | 5697 | 1.088 | 0.944 | |||
| 1-3-4 | 30% | 5291 | 959 | 6251 | 6107 | 1.154 | 0.977 | |||
| 1-4 | 1-4-1 | 30% | 0% | 5642 | 719 | 6361 | 5808 | 1.029 | 0.913 | |
| 1-4-2 | 10% | 5631 | 752 | 6383 | 6080 | 1.080 | 0.953 | |||
| 1-4-3 | 20% | 5494 | 1156 | 6650 | 6252 | 1.138 | 0.94 | |||
| 1-4-4 | 30% | 5642 | 1252 | 6893 | 6306 | 1.118 | 0.915 | |||
| 2 | 2-1 | 2-1-1 | 0% | 0% | 6885 | 0 | 6885 | 6885 | 1.000 | 1.000 |
| 2-1-2 | 10% | 6941 | 236 | 7177 | 7285 | 1.050 | 1.015 | |||
| 2-1-3 | 20% | 6870 | 488 | 7358 | 7503 | 1.092 | 1.020 | |||
| 2-1-4 | 30% | 6949 | 833 | 7782 | 7714 | 1.110 | 0.991 | |||
| 2-2 | 2-2-1 | 10% | 0% | 7499 | 250 | 7749 | 7527 | 1.004 | 0.971 | |
| 2-2-2 | 10% | 7125 | 490 | 7615 | 7344 | 1.031 | 0.964 | |||
| 2-2-3 | 20% | 7527 | 769 | 8296 | 8076 | 1.073 | 0.973 | |||
| 2-2-4 | 30% | 6532 | 963 | 7494 | 7204 | 1.103 | 0.961 | |||
| 2-3 | 2-3-1 | 20% | 0% | 7251 | 582 | 7834 | 7343 | 1.013 | 0.937 | |
| 2-3-2 | 10% | 7193 | 627 | 7820 | 7680 | 1.068 | 0.982 | |||
| 2-3-3 | 20% | 7319 | 1225 | 8544 | 7991 | 1.092 | 0.935 | |||
| 2-3-4 | 30% | 7690 | 1324 | 9014 | 8423 | 1.095 | 0.934 | |||
| 2-4 | 2-4-1 | 30% | 0% | 6730 | 760 | 7491 | 6829 | 1.015 | 0.912 | |
| 2-4-2 | 10% | 7198 | 871 | 8070 | 7624 | 1.059 | 0.945 | |||
| 2-4-3 | 20% | 7152 | 1399 | 8551 | 7944 | 1.111 | 0.929 | |||
| 2-4-4 | 30% | 6870 | 1275 | 8145 | 7754 | 1.129 | 0.952 | |||
| 3 | 3-1 | 3-1-1 | 0% | 0% | 8863 | 0 | 8863 | 8863 | 1.000 | 1.000 |
| 3-1-2 | 10% | 8789 | 249 | 9039 | 9163 | 1.043 | 1.014 | |||
| 3-1-3 | 20% | 8720 | 766 | 9487 | 9522 | 1.092 | 1.004 | |||
| 3-1-4 | 30% | 8552 | 935 | 9487 | 9196 | 1.075 | 0.969 | |||
| 3-2 | 3-2-1 | 10% | 0% | 9139 | 329 | 9468 | 9186 | 1.005 | 0.970 | |
| 3-2-2 | 10% | 8932 | 689 | 9621 | 9272 | 1.038 | 0.964 | |||
| 3-2-3 | 20% | 8684 | 1025 | 9709 | 9456 | 1.089 | 0.974 | |||
| 3-2-4 | 30% | 8753 | 1330 | 10,083 | 9206 | 1.052 | 0.913 | |||
| 3-3 | 3-3-1 | 20% | 0% | 7892 | 578 | 8470 | 7947 | 1.007 | 0.938 | |
| 3-3-2 | 10% | 8841 | 1175 | 10,016 | 9401 | 1.063 | 0.939 | |||
| 3-3-3 | 20% | 8523 | 1417 | 9940 | 9451 | 1.109 | 0.951 | |||
| 3-3-4 | 30% | 8898 | 1547 | 10,445 | 9399 | 1.056 | 0.900 | |||
| 3-4 | 3-4-1 | 30% | 0% | 8558 | 932 | 9489 | 8704 | 1.017 | 0.917 | |
| 3-4-2 | 10% | 8948 | 1400 | 10,347 | 9462 | 1.058 | 0.914 | |||
| 3-4-3 | 20% | 8305 | 1720 | 10,025 | 9371 | 1.128 | 0.935 | |||
| 3-4-4 | 30% | 8584 | 1637 | 10,221 | 9109 | 1.061 | 0.891 | |||
| 4 | 4-1 | 4-1-1 | 0% | 0% | 17,497 | 0 | 17,497 | 17,488 | 1.000 | 1.000 |
| 4-1-2 | 10% | 17,008 | 733 | 17,741 | 17,568 | 1.033 | 0.990 | |||
| 4-1-3 | 20% | 17,389 | 1619 | 19,008 | 18,596 | 1.069 | 0.978 | |||
| 4-1-4 | 30% | 17,003 | 2710 | 19,713 | 17,757 | 1.044 | 0.901 | |||
| 4-2 | 4-2-1 | 10% | 0% | 17,821 | 936 | 18,757 | 17,960 | 1.008 | 0.957 | |
| 4-2-2 | 10% | 17,150 | 1521 | 18,671 | 18,057 | 1.053 | 0.967 | |||
| 4-2-3 | 20% | 15,568 | 2456 | 18,024 | 17,069 | 1.096 | 0.947 | |||
| 4-2-4 | 30% | 17,043 | 3443 | 20,486 | 17,884 | 1.049 | 0.873 | |||
| 4-3 | 4-3-1 | 20% | 0% | 18,161 | 1661 | 19,822 | 18,270 | 1.006 | 0.922 | |
| 4-3-2 | 10% | 16,391 | 2673 | 19,063 | 17,151 | 1.046 | 0.900 | |||
| 4-3-3 | 20% | 16,404 | 3638 | 20,042 | 17,951 | 1.094 | 0.896 | |||
| 4-3-4 | 30% | 16,355 | 4060 | 20,415 | 18,048 | 1.104 | 0.884 | |||
| 4-4 | 4-4-1 | 30% | 0% | 16,294 | 2592 | 18,886 | 16,516 | 1.014 | 0.875 | |
| 4-4-2 | 10% | 16,585 | 3539 | 20,124 | 17,642 | 1.064 | 0.877 | |||
| 4-4-3 | 20% | 18,130 | 4731 | 22,861 | 19,513 | 1.076 | 0.854 | |||
| 4-4-4 | 30% | 15,838 | 4686 | 20,524 | 17,081 | 1.078 | 0.832 | |||
| 5 | 5-1 | 4-1-1 | 0% | 0% | 33,300 | 0 | 33,300 | 33,184 | 0.997 | 1.000 |
| 4-1-2 | 10% | 34,066 | 1630 | 35,696 | 34,917 | 1.025 | 0.978 | |||
| 4-1-3 | 20% | 32,866 | 2216 | 35,082 | 35,159 | 1.070 | 1.002 | |||
| 4-1-4 | 30% | 31,996 | 3884 | 35,880 | 33,418 | 1.044 | 0.931 | |||
| 5-2 | 4-2-1 | 10% | 0% | 32,490 | 904 | 33,393 | 32,673 | 1.006 | 0.978 | |
| 4-2-2 | 10% | 32,947 | 2515 | 35,463 | 33,950 | 1.030 | 0.957 | |||
| 4-2-3 | 20% | 35,021 | 2850 | 37,871 | 37,195 | 1.062 | 0.982 | |||
| 4-2-4 | 30% | 31,700 | 4173 | 35,872 | 33,766 | 1.065 | 0.941 | |||
| 5-3 | 4-3-1 | 20% | 0% | 31,715 | 1723 | 33,438 | 31,871 | 1.005 | 0.953 | |
| 4-3-2 | 10% | 33,472 | 3775 | 37,247 | 34,717 | 1.037 | 0.932 | |||
| 4-3-3 | 20% | 31,276 | 4494 | 35,770 | 33,907 | 1.084 | 0.948 | |||
| 4-3-4 | 30% | 33,331 | 4534 | 37,866 | 35,012 | 1.050 | 0.925 | |||
| 5-4 | 4-4-1 | 30% | 0% | 32,123 | 3806 | 35,928 | 32,552 | 1.013 | 0.906 | |
| 4-4-2 | 10% | 33,887 | 5585 | 39,472 | 35,363 | 1.044 | 0.896 | |||
| 4-4-3 | 20% | 33,255 | 5083 | 38,338 | 35,981 | 1.082 | 0.939 | |||
| 4-4-4 | 30% | 32,005 | 6865 | 38,869 | 34,173 | 1.068 | 0.879 | |||
| 6 | 6-1 | 6-1-1 | 0% | 0% | 70,652 | 0 | 70,652 | 70,623 | 1.00 | 1.000 |
| 6-1-2 | 10% | 66,145 | 6334 | 72,478 | 71,588 | 1.08 | 0.989 | |||
| 6-1-3 | 20% | 68,894 | 13,231 | 82,125 | 78,664 | 1.14 | 0.959 | |||
| 6-1-4 | 30% | 74,495 | 23,555 | 98,050 | 81,608 | 1.11 | 0.841 | |||
| 6-2 | 6-2-1 | 10% | 0% | 65,302 | 6085 | 71,386 | 65,354 | 1.00 | 0.916 | |
| 6-2-2 | 10% | 75,642 | 16,321 | 91,963 | 82,096 | 1.09 | 0.894 | |||
| 6-2-3 | 20% | 76,051 | 23,244 | 99,296 | 85,068 | 1.12 | 0.860 | |||
| 6-2-4 | 30% | 74,533 | 29,312 | 103,844 | 84,632 | 1.14 | 0.822 | |||
| 6-3 | 6-3-1 | 20% | 0% | 75,645 | 15,176 | 90,821 | 76,210 | 1.01 | 0.839 | |
| 6-3-2 | 10% | 68,379 | 20,924 | 89,303 | 75,121 | 1.10 | 0.843 | |||
| 6-3-3 | 20% | 61,714 | 25,782 | 87,496 | 71,331 | 1.16 | 0.817 | |||
| 6-3-4 | 30% | 68,910 | 35,248 | 104,158 | 70,257 | 1.02 | 0.677 | |||
| 6-4 | 6-4-1 | 30% | 0% | 68,770 | 19,762 | 88,532 | 69,878 | 1.02 | 0.790 | |
| 6-4-2 | 10% | 72,193 | 28,296 | 100,489 | 79,063 | 1.10 | 0.787 | |||
| 6-4-3 | 20% | 69,171 | 33,733 | 102,904 | 81,878 | 1.19 | 0.797 | |||
| 6-4-4 | 30% | 74,680 | 45,733 | 120,413 | 75,038 | 1.00 | 0.623 | |||
| 7 | 7-1 | 7-1-1 | 0% | 0% | 134,392 | 0 | 134,392 | 134,385 | 1.00 | 1.000 |
| 7-1-2 | 10% | 147,247 | 14,143 | 161,389 | 158,705 | 1.08 | 0.986 | |||
| 7-1-3 | 20% | 145,697 | 28,107 | 173,804 | 166,633 | 1.15 | 0.961 | |||
| 7-1-4 | 30% | 156,018 | 48,908 | 204,925 | 156,029 | 1.00 | 0.764 | |||
| 7-2 | 7-2-1 | 10% | 0% | 141,441 | 14,914 | 156,355 | 142,032 | 1.00 | 0.910 | |
| 7-2-2 | 10% | 150,358 | 29,933 | 180,291 | 162,893 | 1.08 | 0.905 | |||
| 7-2-3 | 20% | 150,158 | 46,683 | 196,842 | 171,319 | 1.14 | 0.872 | |||
| 7-2-4 | 30% | 144,707 | 56,226 | 200,933 | 149,298 | 1.03 | 0.745 | |||
| 7-3 | 7-3-1 | 20% | 0% | 143,431 | 29,608 | 173,039 | 144,613 | 1.01 | 0.836 | |
| 7-3-2 | 10% | 148,305 | 44,941 | 193,246 | 161,454 | 1.09 | 0.837 | |||
| 7-3-3 | 20% | 149,380 | 60,396 | 209,776 | 172,099 | 1.15 | 0.820 | |||
| 7-3-4 | 30% | 139,888 | 70,259 | 210,147 | 143,366 | 1.03 | 0.685 | |||
| 7-4 | 7-4-1 | 30% | 0% | 138,485 | 42,394 | 180,879 | 140,318 | 1.01 | 0.777 | |
| 7-4-2 | 10% | 140,784 | 56,529 | 197,313 | 153,950 | 1.10 | 0.783 | |||
| 7-4-3 | 20% | 150,337 | 76,028 | 226,365 | 172,711 | 1.15 | 0.764 | |||
| 7-4-4 | 30% | 152,003 | 91,022 | 243,025 | 154,419 | 1.02 | 0.637 | |||
Table 7.
Daily carbon reduction estimation for each permutation.
| Permutation | |||||
|---|---|---|---|---|---|
| 0% | 10% | 20% | 30% | ||
| 0% | 0 kg CO2 | 1.8 kg CO2 | 2.7 kg CO2 | 3.7 kg CO2 | |
| 10% | 86.5 kg CO2 | 91.0 kg CO2 | 103.5 kg CO2 | 83.4 kg CO2 | |
| 20% | 230.8 kg CO2 | 210.3 kg CO2 | 205.2 kg CO2 | 227.8 kg CO2 | |
| 30% | 654.0 kg CO2 | 632.4 kg CO2 | 631.3 kg CO2 | 692.4 kg CO2 | |
© 2020 by the authors. Licensee MDPI, Basel, Switzerland. This article is an open access article distributed under the terms and conditions of the Creative Commons Attribution (CC BY) license (http://creativecommons.org/licenses/by/4.0/).
Share and Cite
MDPI and ACS Style
Lee, K.; Chae, J.; Song, B.; Choi, D. A Model for Sustainable Courier Services: Vehicle Routing with Exclusive Lanes. Sustainability 2020, 12, 1077. https://doi.org/10.3390/su12031077
AMA Style
Lee K, Chae J, Song B, Choi D. A Model for Sustainable Courier Services: Vehicle Routing with Exclusive Lanes. Sustainability. 2020; 12(3):1077. https://doi.org/10.3390/su12031077
Chicago/Turabian StyleLee, Keyju, Junjae Chae, Bomi Song, and Donghyun Choi. 2020. "A Model for Sustainable Courier Services: Vehicle Routing with Exclusive Lanes" Sustainability 12, no. 3: 1077. https://doi.org/10.3390/su12031077
Note that from the first issue of 2016, this journal uses article numbers instead of page numbers. See further details here.