1. Introduction
In these last years, the number of satellites, spacecrafts, astronaut crews, and other technological artifacts launched into space has grown significantly. In launch campaigns, for the tracking of rockets and their payloads, there is an essential element: the trajectography radar. It performs a Single-Target-Tracking (STT) [
1] by automatically tracking a specific target, recording its trajectory accurately and in real time. Among its main applications stand out the tracking of rockets, missiles, satellites and space debris.
Two trajectography radars are used at a Brazilian Air Force launch base named Centro de Lançamento da Barreira do Inferno (CLBI), located in Parnamirim city, state of Rio Grande do Norte. This base performs and provides support for launches, tracking activities and research. One of these activities is the tracking of rockets launched by the Guiana Space Centre at Kourou, in French Guiana, in cooperation with the European Space Agency (ESA). For the tracking activities, CLBI has the Adour and Béarn trajectography radars and a telemetry station.
The radars are French-made, C-band operated, and designed to track targets over long distances. For that, the Béarn radar has a high gain (about 44 dBi) narrow beam (about 0.92° half power beam width) antenna, a high-sensitivity receiver and a transmitter capable of delivering high-power pulsed electromagnetic signals, reaching levels around 1 kW of average power and 1 MW of peak power [
2].
Trajectography radars emit high power of non-ionizing radiation (NIR), concentrated in a narrow beam. This set of specifications constitutes a quite unusual radiofrequency emission scenario when compared to the general telecommunication broadcasts, such as TV signal transmission, personal mobile service coverage and satellite communication. Radars’ high-power emissions cause concerns about the possible danger to human health, especially in public areas. For health safety reasons, there is interest in measuring the NIR levels that people who work daily with the radar and those who visit it are exposed to. From the measured values, it is possible to make a comparative analysis with the human exposure limits to NIR specified by the International Commission for the Protection of Non-Ionizing Radiation (ICNIRP) [
3] and also by the Brazilian National Telecommunication Agency (Anatel) [
4]. Then, measures can be taken to prevent and control this exposure.
In this work, field measurements are performed to obtain the power density values of Béarn’s emissions, which operate with a higher power than Adour radar and are located only 690 m from a public space museum. This is one of the chosen measurement points, as it receives daily visits from children and teenagers from local schools and tourists from various parts of Brazil and the world. The objective is to measure only radar emissions, avoiding capturing signals from other sources. For that, a specific setup for trajectography radars was proposed. Up to now, there are no records of RNI levels in CLBI’s area.
2. Regulation of Human Exposure Limits to Non-Ioninzing Radiation
Non-ionizing radiation is a kind of electromagnetic radiation that, as opposed to ionizing radiation, does not cause an electron withdrawal from molecular structures. Nevertheless, the incidence of NIR on a material produces thermal and non-thermal effects. The thermal effects are a consequence of the increased vibration in the material’s molecules caused by the NIR. Concerning the non-thermal effects, there is no evidence that they pose a danger to human health, particularly with regard to long-term exposure [
14].
The Electric and Magnetic Fields (EMF) project of the World Health Organization (WHO) has been developing a program that, among other objectives, evaluates the scientific literature and reports on health effects to facilitate the development of internationally acceptable standards for exposure to EMF. In addition, this program intends to advise national authorities, other institutions, the general public and workers about any risks arising from exposure to EMF and any necessary mitigation actions [
15].
In Brazil, law No. 11934, of 5 May 2009, establishes that the definition of exposure limits to non-ionizing radiation must follow WHO recommendations, which adopted ICNIRP numbers [
16]. Currently, these limits are defined by Anatel Act No. 458, of 24 January 2019 [
4]. Compliance verification is based on field measurements so that preventive procedures can be adopted to avoid the impact on human health [
17,
18,
19]. Anatel Act No. 458 regulates the limits of human exposure to electric, magnetic and electromagnetic fields in the radiofrequency range between 8.3 kHz and 300 GHz, generated by radio-communication stations and user terminals. The regulation also defines evaluation methods for exposure to non-ionizing radiation and procedures to be followed for the licensing of stations.
Different values of exposure limit are defined to the occupational and to the general population. Occupational exposure refers to that in which people are exposed as a result of their professional activity, as long as they are aware of the potential exposure, and they can exercise control over their permanence in the place or adopt preventive measures.
Limit values are the same for the entire range from 2 GHz to 300 GHz, where the Béarn radar operates. For the general population, the equivalent plane wave density should be less than 10 W/m² and, for the occupational public, 50 W/m². Other limits are shown in
Table 1 [
4].
The power density limits are related to the average power from the emissions. However, the peak power level from the radar emission (1 MW) is much higher than its average power. Although there is not much information about the relationship between biological effects and peak values of pulsed fields, it is suggested that, for frequencies exceeding 10 MHz, the equivalent plane wave density, averaged over the pulse width, should not exceed 1000 times the reference levels [
3]. Since the peak power of the radar signal is exactly 1000 times the average power value, it is within the suggested limit. Therefore, our measurements are focused on the average power density.
3. Materials and Methods
The unique characteristics of trajectography radars require an appropriate method and setup for NIR measurements, which are presented below, as well as the measurement scenario.
3.1. Proposed Method
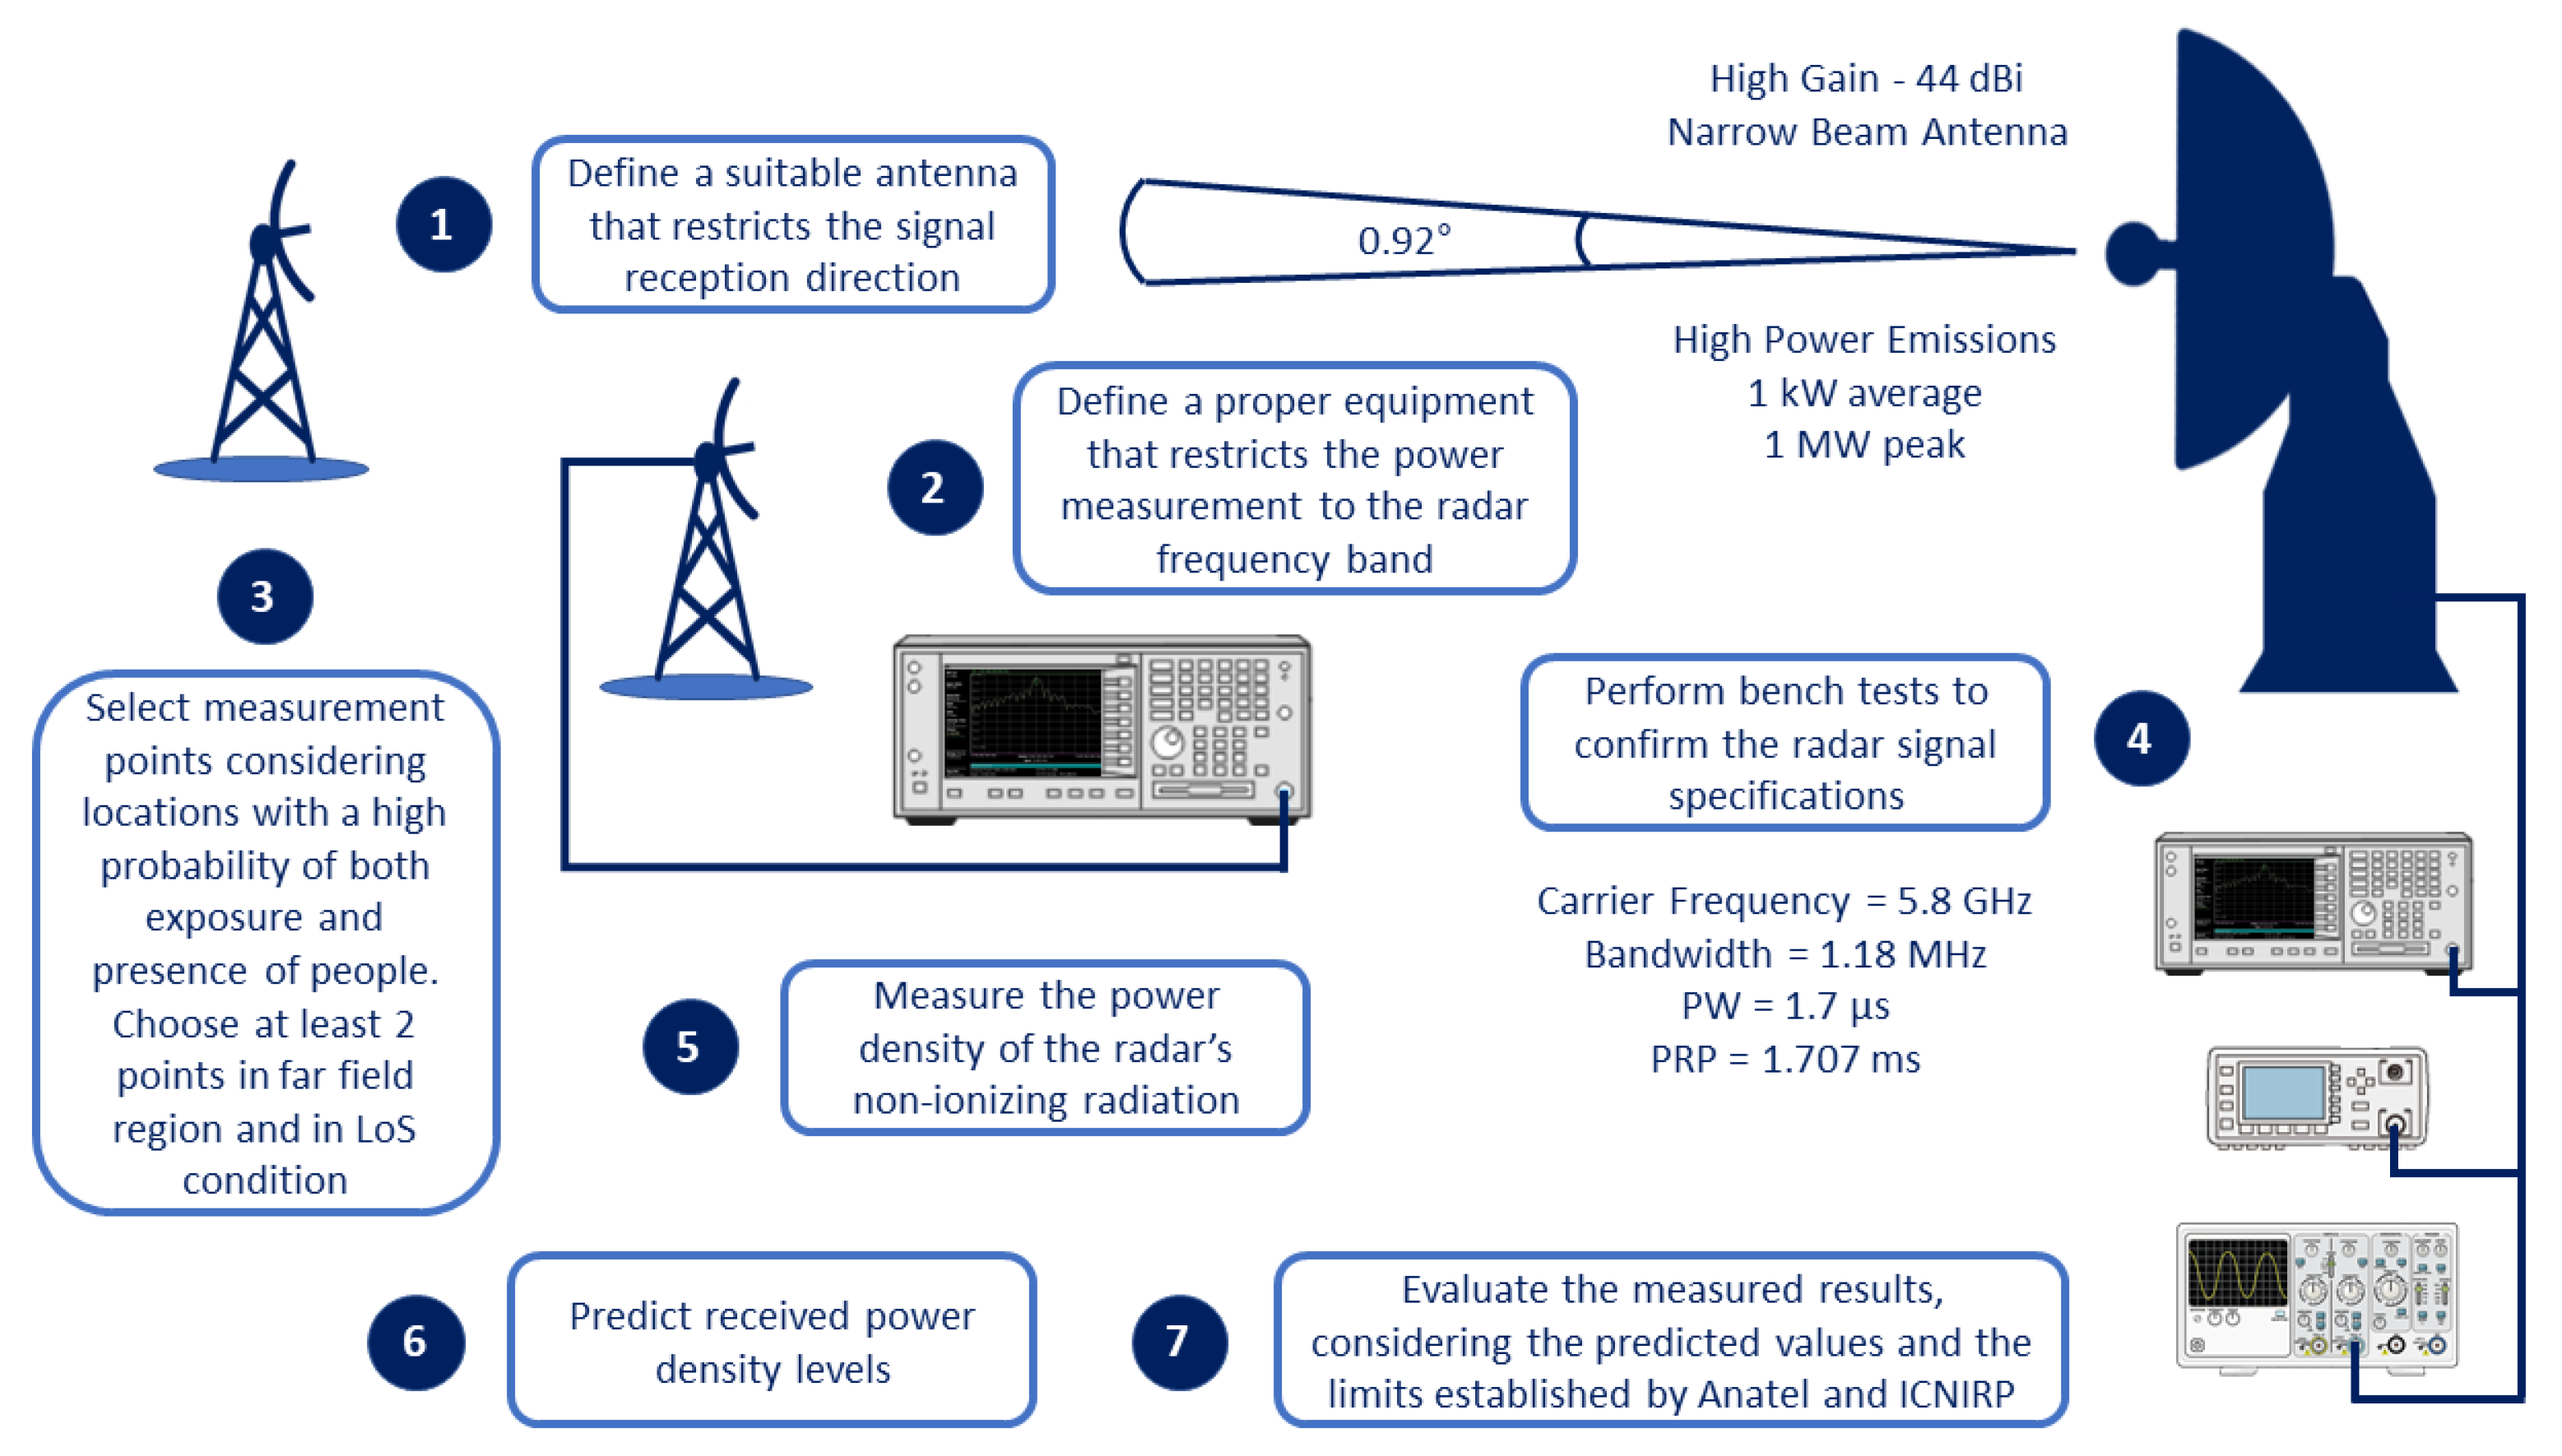
Since the goal of this paper is to measure NIR levels exclusively from the trajectography radar, specific actions and instruments are defined, considering its narrow band (1.18 MHz) signal spectrum and its high gain (about 44 dBi) narrow beam (about 0.92° half power beam width) antenna. A summary of the proposed steps is presented in
Figure 1 and detailed below.
- 1.
Define a suitable receiving antenna for the setup, allowing the restriction of the reception direction, considering only the direction of the radar antenna;
- 2.
Define proper equipment for measuring received power in the frequency domain to restrict the reception of other signals outside the radar frequency band;
- 3.
Select measurement points considering two main criteria: locations with a high probability of both exposure and presence of people. Among them, choose at least 2 measurement points with Line-of-Sight (LoS) and in the far-field region, in order to evaluate and compare the measurement results with more precise predictions, using free space propagation equations;
- 4.
Perform bench tests to confirm the radar signal specifications and the adequate performance of the measurement equipment;
- 5.
Prepare the setup and perform the average power density measurements, during 6 min, according to Anatel and ICNIRP instructions [
3,
4];
- 6.
Predict received power density levels;
- 7.
Evaluate the measured results, considering the predicted values and the limits established by Anatel and ICNIRP [
3,
4].
3.2. Measurement Scenario
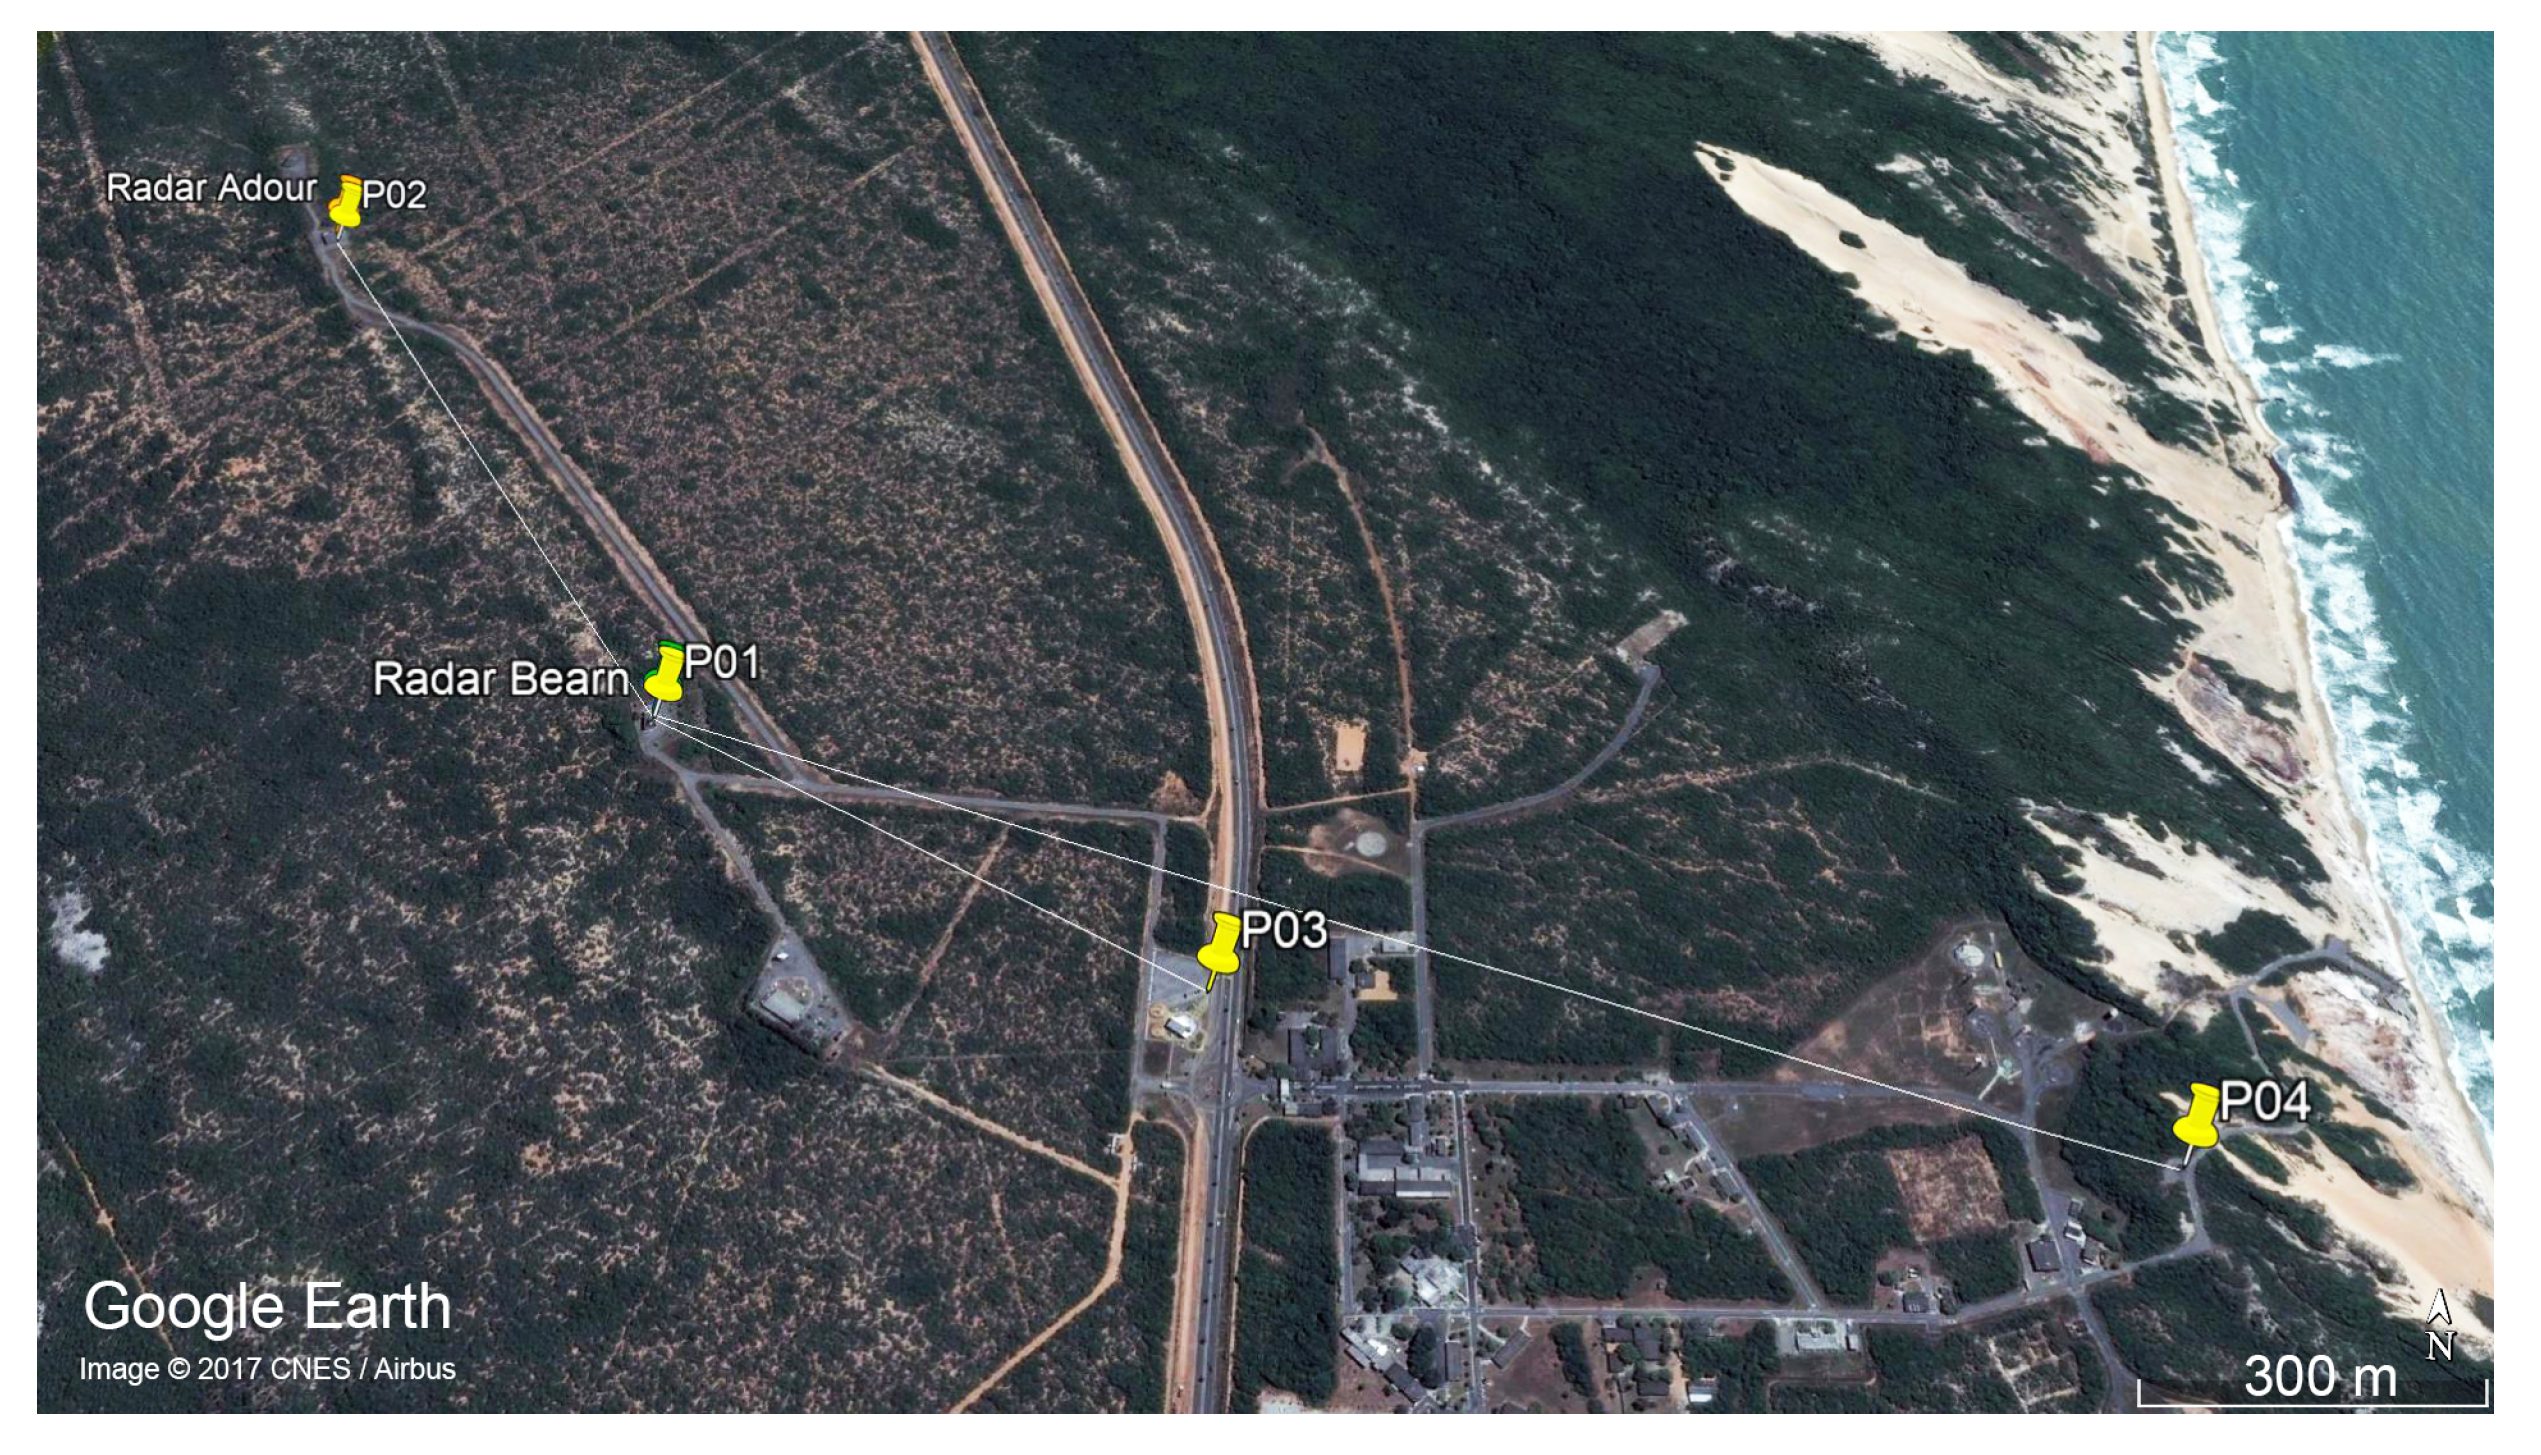
In order to analyze the NIR levels from the Béarn radar, four measurement points are chosen and named P01, P02, P03 and P04. Their positions are shown in
Figure 2. They are 9, 960, 690 and 1570 m away from the radar’s antenna, respectively. To locate the radar’s antenna and all measurement points, we use the WGS-84 and the SIRGAS 2000 coordinate systems.
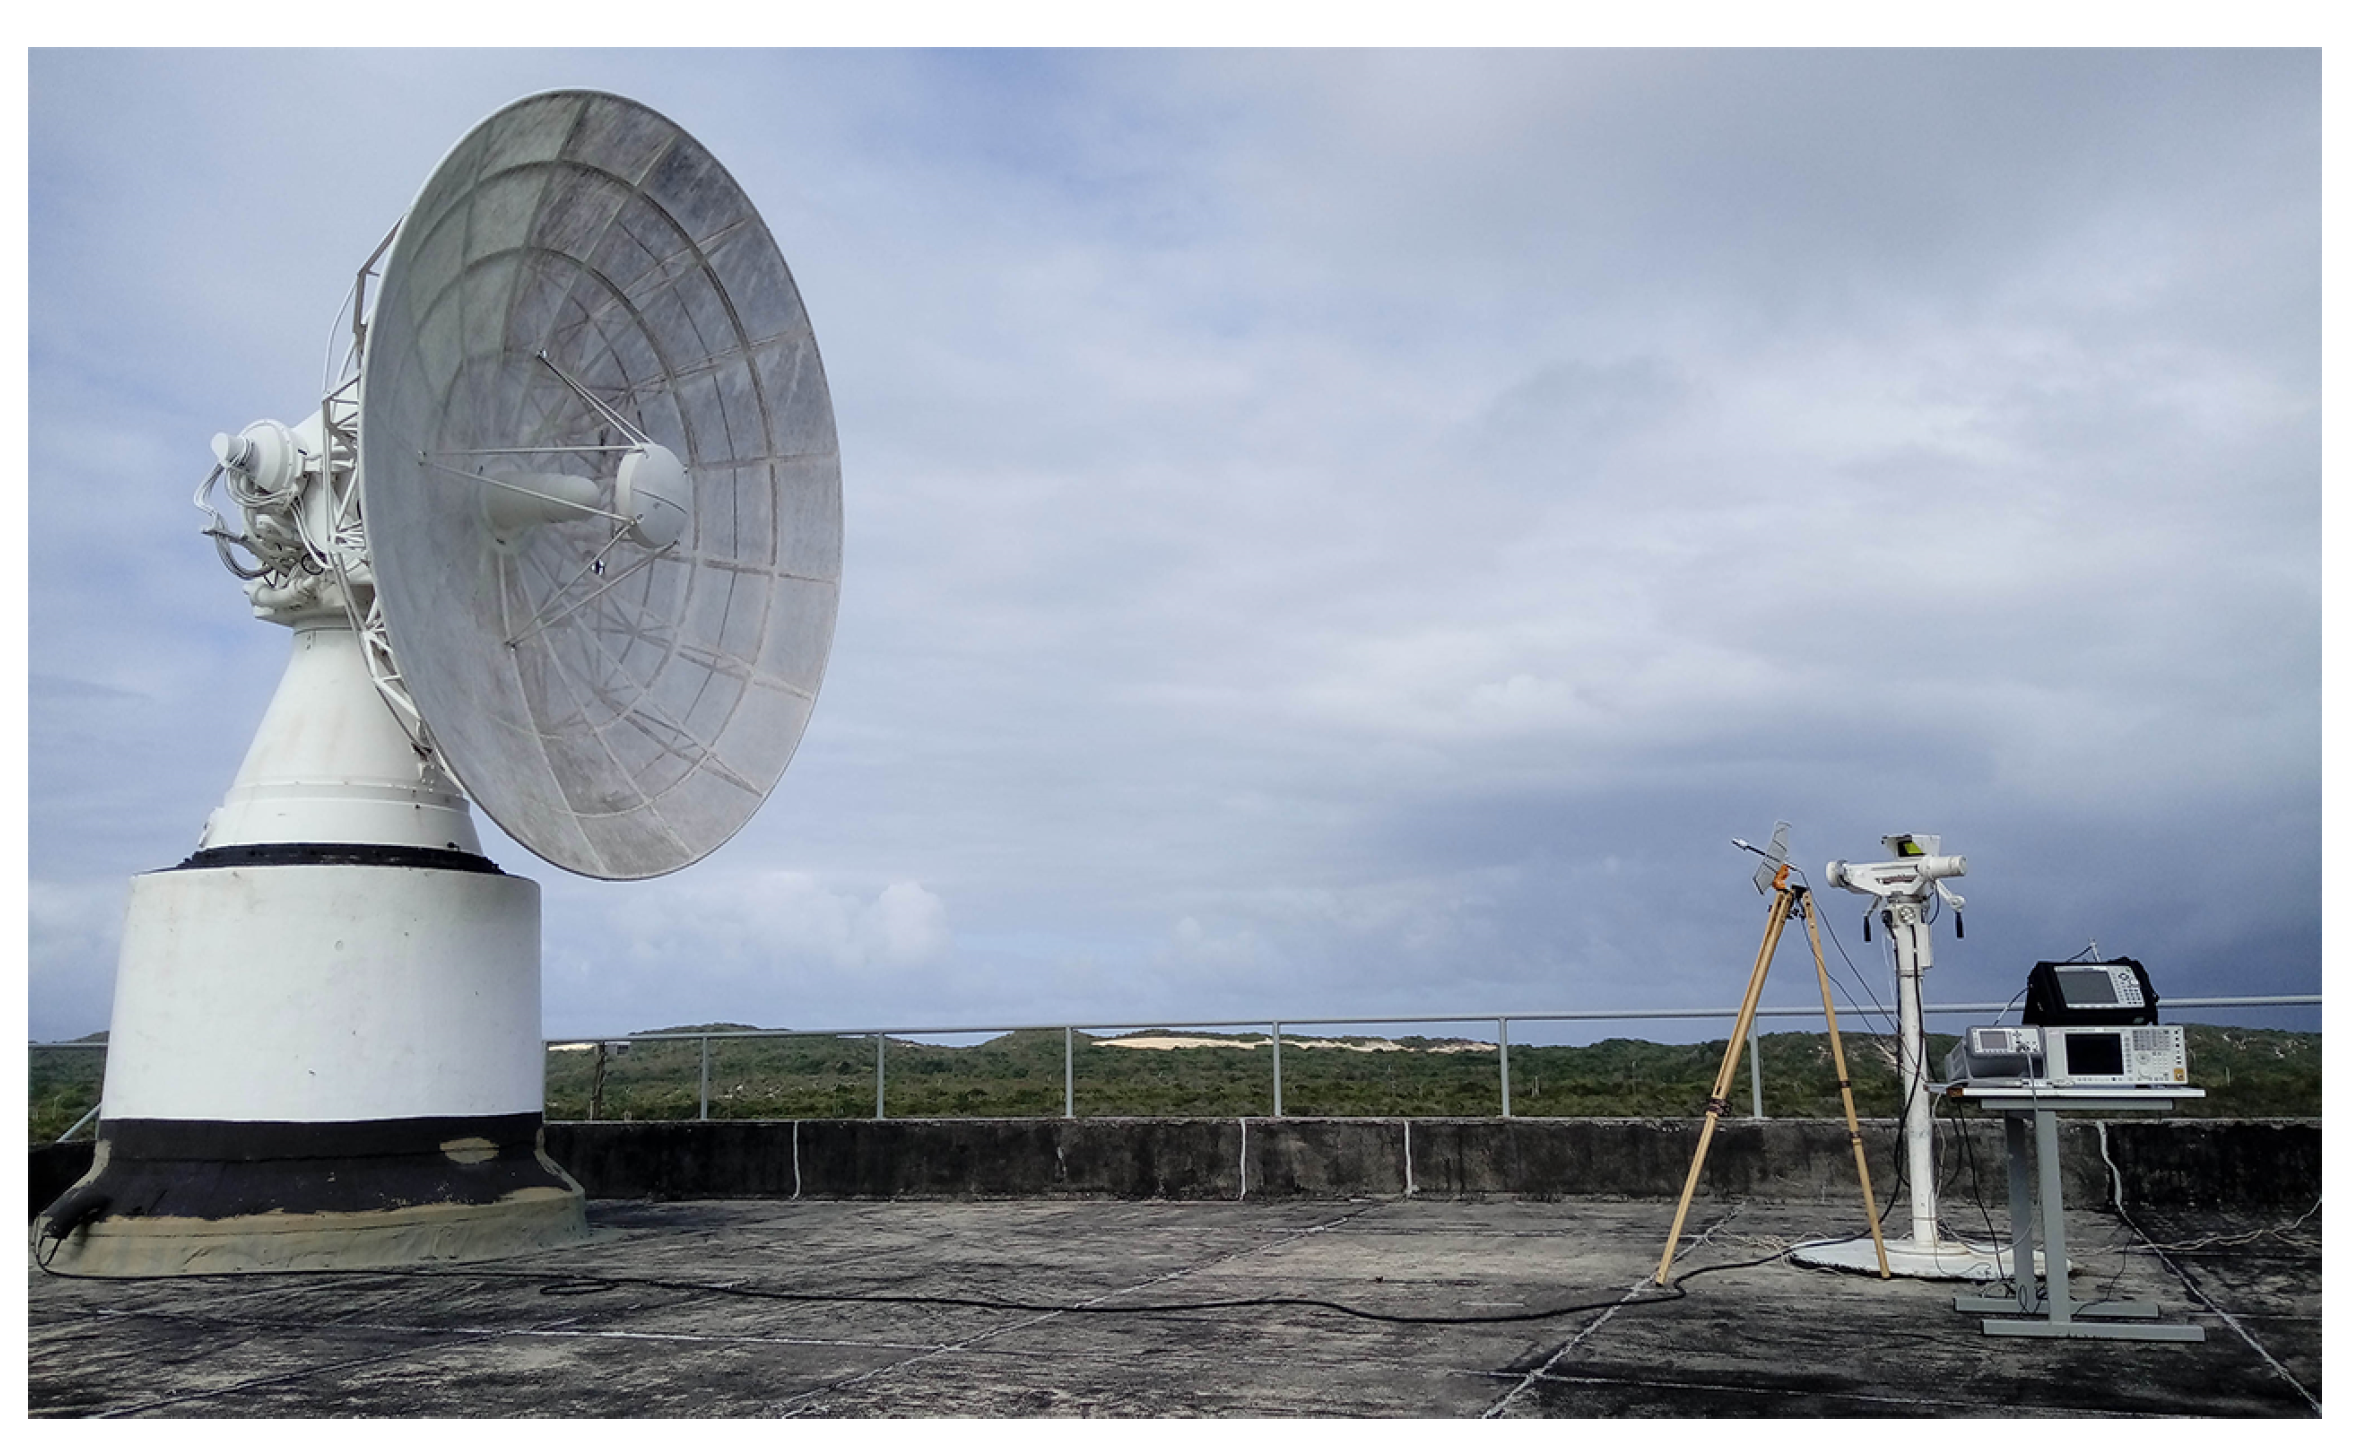
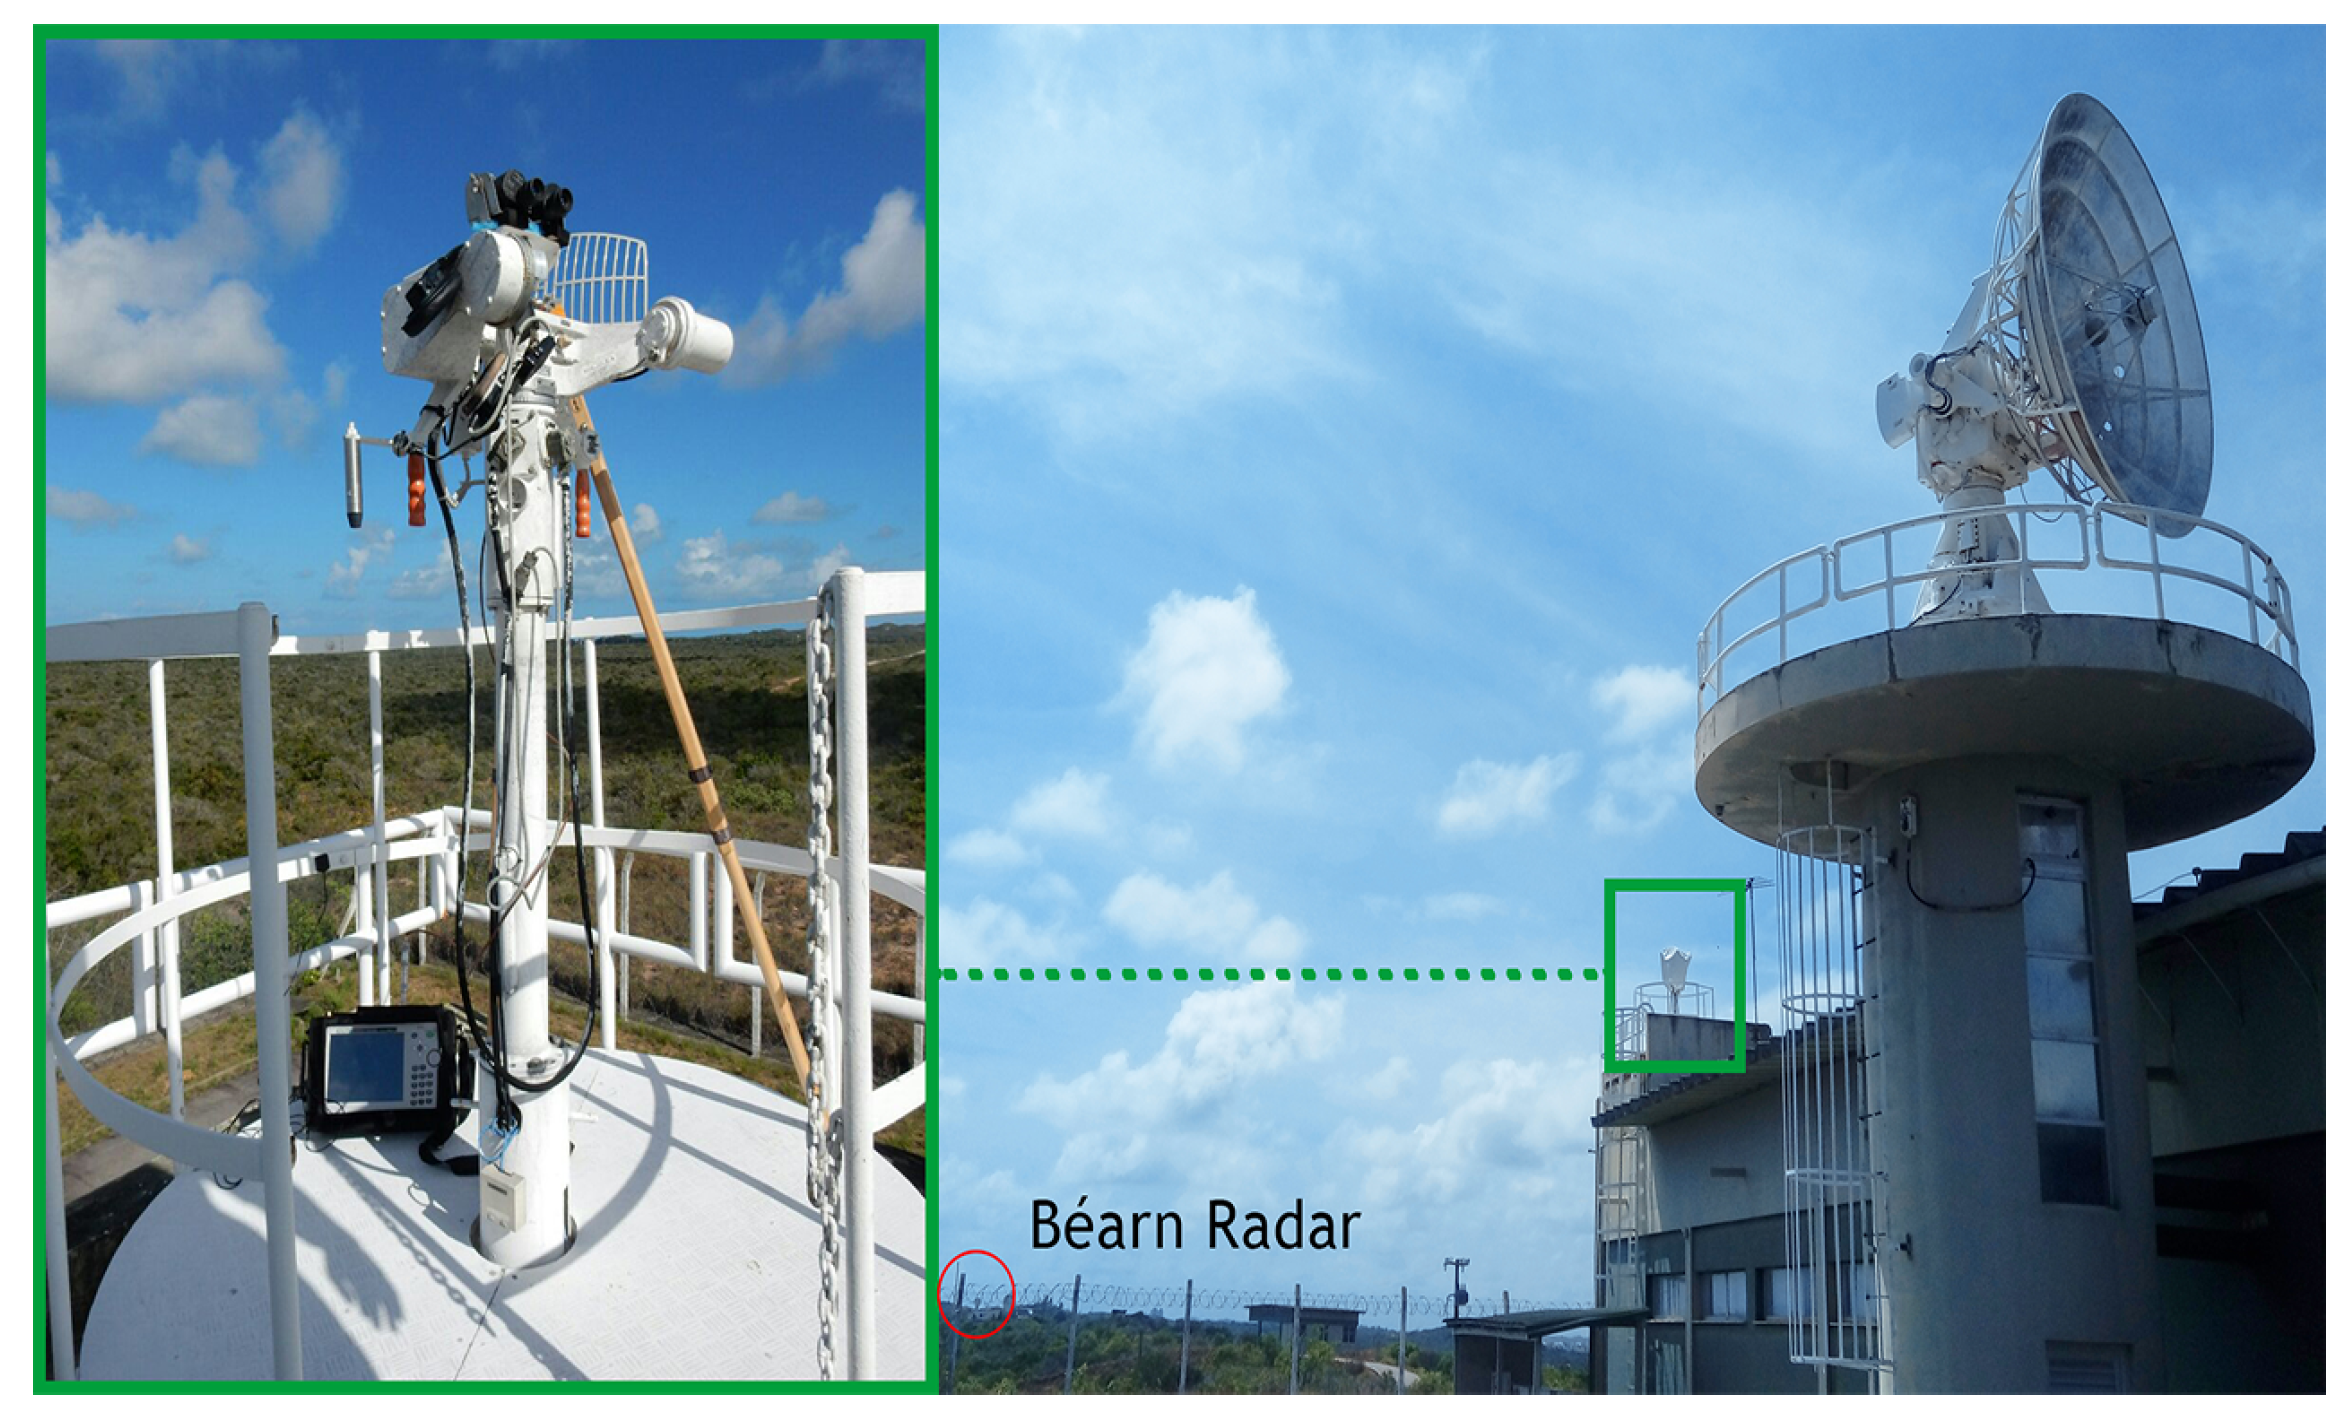
Points P01 and P02 are located at the optic designation instruments of Béarn (
Figure 3) and Adour (
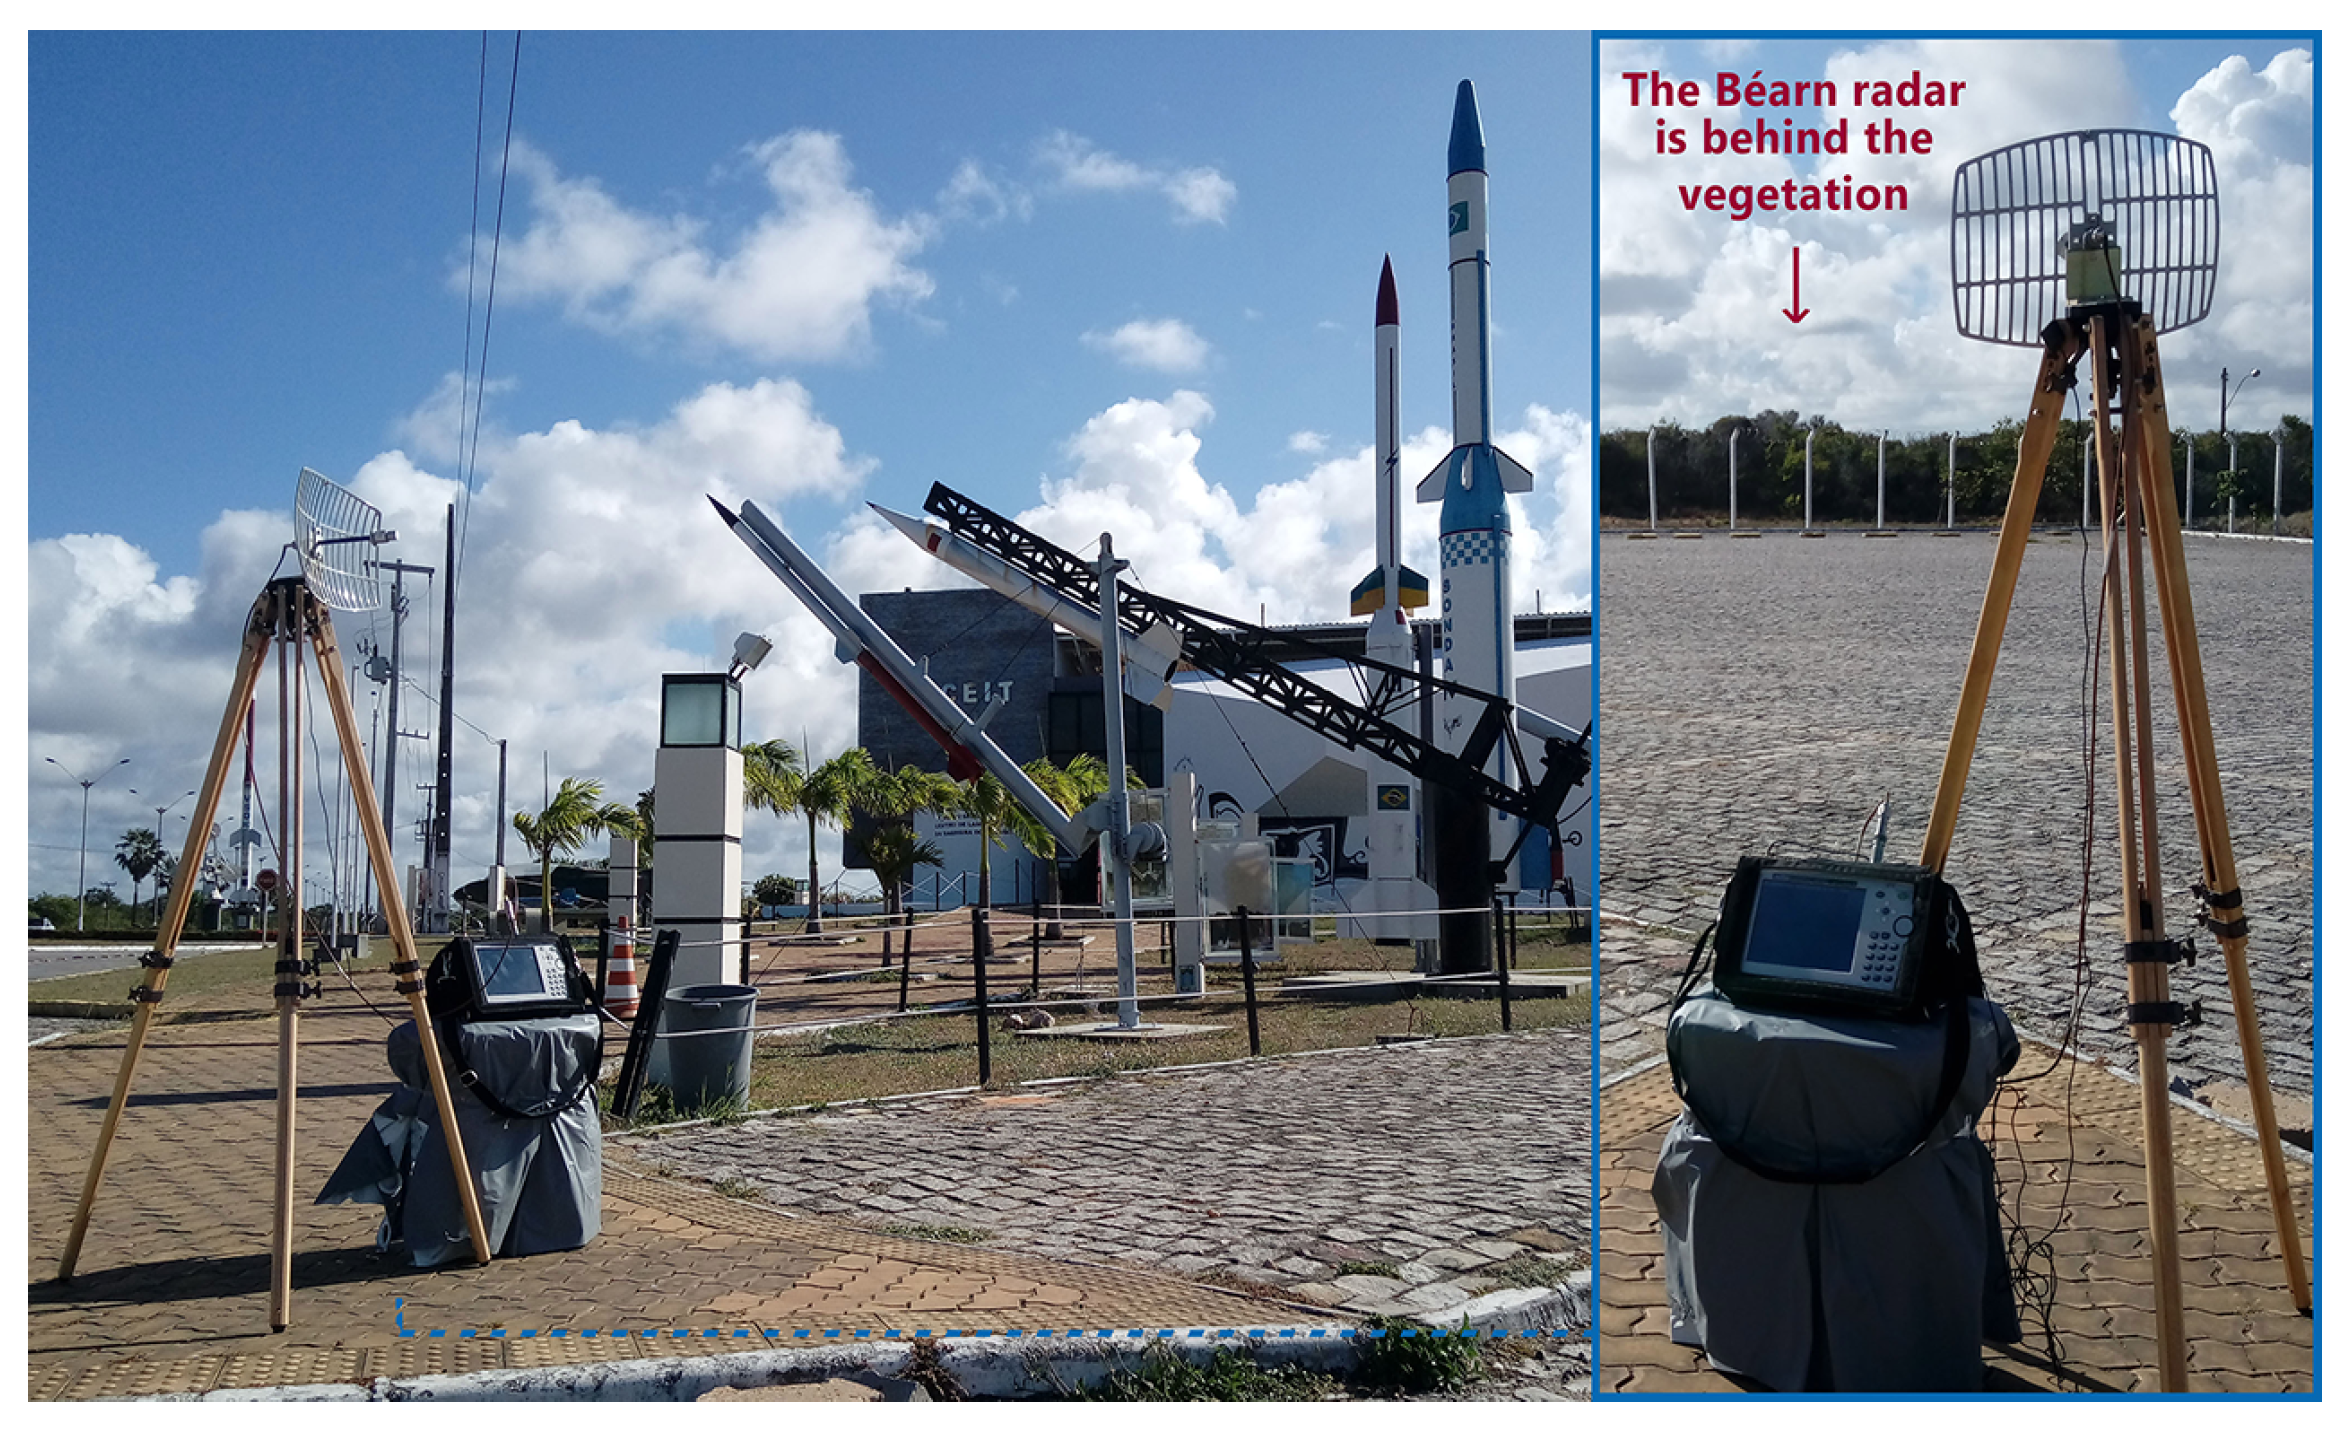
Figure 4) radars, which are operated by professionals during launching campaigns to obtain the aerospace artifact position at its visual flight phase. Point P03 is located at a space museum (
Figure 5), which is one of the most visited places by tourists in the region. The last point, P04, is located at a mobile launch platform area (
Figure 6), where people work during launching campaigns. These points were selected following two criteria: locations with a high probability of both exposure and presence of people.
Three of the four measurement points (P01, P02 and P04) have a LoS propagation condition with first Fresnel zone clearance, as shown in
Figure 3,
Figure 4 and
Figure 6. Otherwise, there is no LoS for the P03 link due to a shadowing caused by vegetation on the signal path, as shown in
Figure 5.
All measurement points, with exception of P01, are considered to be in the far field region of the transmitter, in which the waves can be considered plane. Point P01, the closest one to the radar’s antenna, is in the near field region. The limit distance between the near field and far field can be calculated by Equation (
1) [
4], where L is the maximum dimension of the radar’s antenna,
is the wavelength,
f is the carrier frequency and
c is the light speed (3 · 10
m/s).
Assuming
L equals to 4 m [
2] and
f equals to 5800 MHz, the calculated near far field limit distance is 618.67 m, which confirms that only P01 is within the near field region.
3.3. Measurement Setup
A spectrum analyzer and a directional antenna (22 dBi of gain) are used to restrict signals from other sources into the frequency and space domains, respectively. The spectrum analyzer allows the average power measurement of a specific bandwidth centered on the carrier frequency of the radar signal, excluding emissions from sources in other frequency bands. The directional antenna allows the signal reception to be mainly from the direction of the radar’s antenna. Furthermore, the use of a receiving antenna with such a gain ensures a high dynamic range for the setup.
An isotropic probe – a quasi-isotropic antenna – is the most used on NIR measurements, because it can capture signals from all directions and in the three polarization axes, which will eventually compose the total human exposure. In the specific case of this work, the possible drawback of not measuring multipath signals due to the high receiving antenna directivity, its fixed linear polarization and cross-polarization discrimination, is avoided since radar half power beam width is extremely narrow (about 0.92º) and there are no significant features causing reflections in the scenario. Therefore, it is possible to use a directional antenna to measure the NIR levels exclusively from a trajectography radar, as proposed. Anatel establishes the possibility of using either an isotropic or a directional antenna [
4].
To measure the higher NIR levels possible, by capturing the main lobe of the radar emission, both radar and receiving antennas were precisely directed towards each other for all measurement points, except at point P01, due to a characteristic of the radar design. Its antenna could not be exactly positioned toward the receiving antenna, as shown in
Figure 3. There is a difference of 16.43° in elevation between the desired position and the lowest possible radar antenna position. Thus, for the point P01, the NIR levels were measured from a side lobe of the radar antenna. Since P01 corresponds to the position of the optical designation instrument, this means an operator cannot receive radiation from the antenna’s main lobe.
The receiving antenna was connected to the spectrum analyzer and was placed at 1.60 m from the ground, assuming to be approximately the mean height of the Brazilian people. Furthermore, the radar’s antenna and the receiving antenna were set to vertical polarization, and the measurements were performed for 6 min, resulting in a mean value of power. This measurement period is in accordance with Anatel regulations [
4].
The Channel Power function of the spectrum analyzer was used to perform the power measurement of the radar signal. It is designed to measure the average power across a given frequency band. So, it was set to 5800 MHz of center frequency and to 6 MHz of integrated bandwidth (IBW), encompassing at least the main and the first adjacent sidelobes of the signal spectrum [
20]. The average power measurement was performed for all points, using the setup shown in
Figure 3,
Figure 4,
Figure 5 and
Figure 6.
3.4. Bench Tests
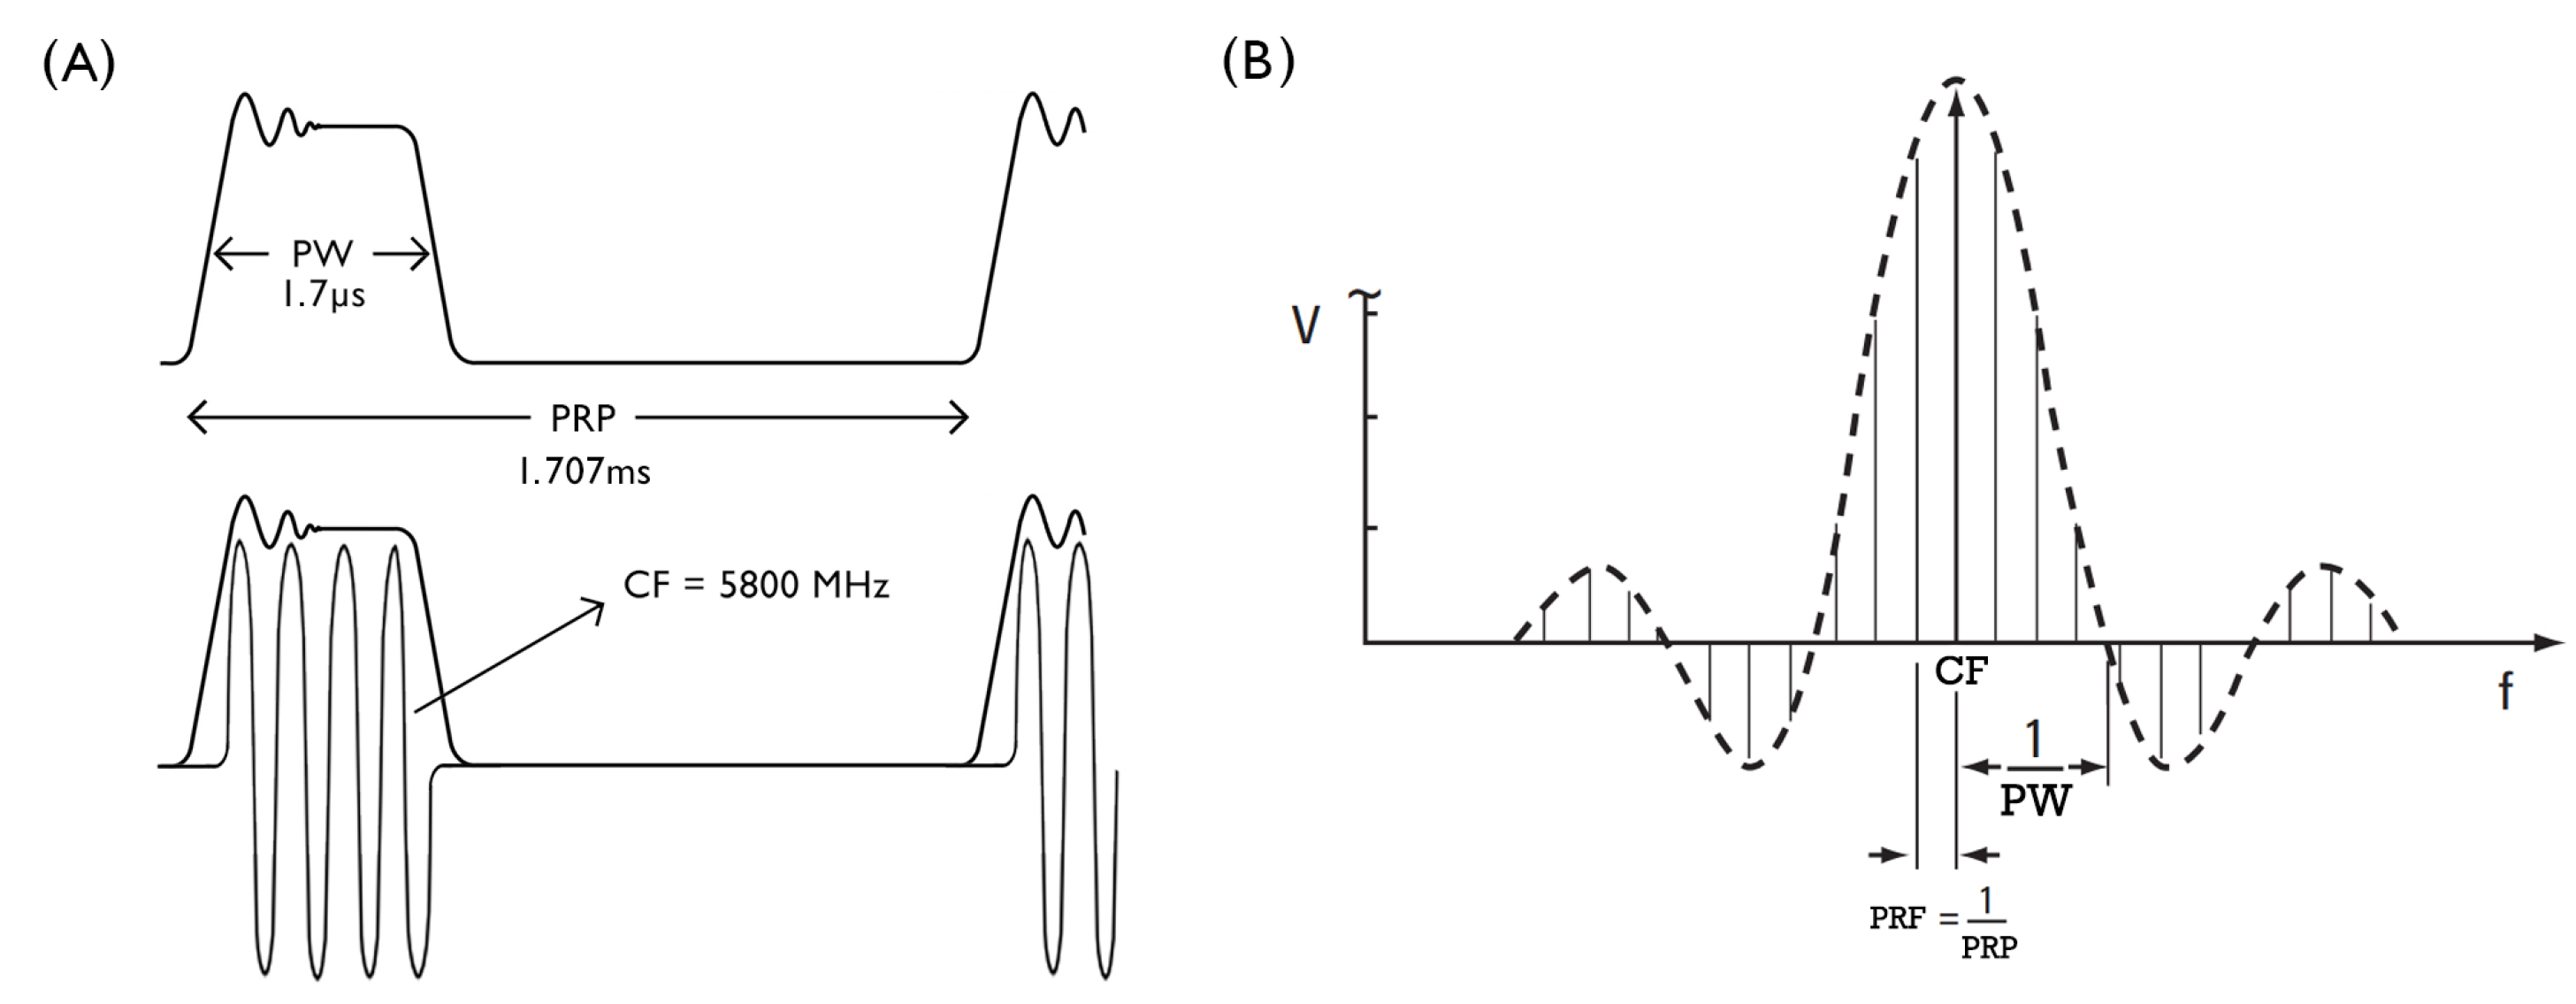
Before starting field measurements, some tests were performed to confirm the specifications of the radar transmitted pulsed signal. In order to measure the pulse width (PW) and the pulse repetition period (PRP) of the signal, a Schottky Diode Detector and an oscilloscope connected to the radar transmitter output were used. This measurement confirmed a pulse width of 1.7 µs and a pulse repetition period of 1.707 ms, as specified in the radar technical specs [
2].
Figure 7A illustrates a representation of the signal pulse in the time domain. A power meter and both spectrum analyzers connected to the output of the radar transmitter confirmed the transmitted power. Our records measured 0.851 kW of average power (59.3 dBm), a value 0.7 dB lower than the radar technical specification. This measurement also confirmed the signal carrier frequency of 5800 MHz.
Tests were also performed to ensure the reliability of the spectrum analyzers’ measurements. The equipment was tested with a simulated signal, produced by an RF signal generator, with the same characteristics as the radar signal. Its spectrum is illustrated in
Figure 7B. Since the signal has a pulsed shape, its frequency spectrum is similar to a sync function. A power meter was used to confirm the average power measurement of the spectrum analyzers.
3.5. Equipment
All equipment was calibrated before each measurement campaign.
Table 2 presents the full list of equipment used.
4. Results and Discussion
This section presents measurements and prediction results, followed by comparative analyzes regarding the limits established by Anatel and ICNIRP.
4.1. Measurement Results
By measuring the average power level of the radar signal, it is possible to calculate the power density level of the emission, which has a limiting value as specified by ICNIRP [
3] and Anatel [
4].
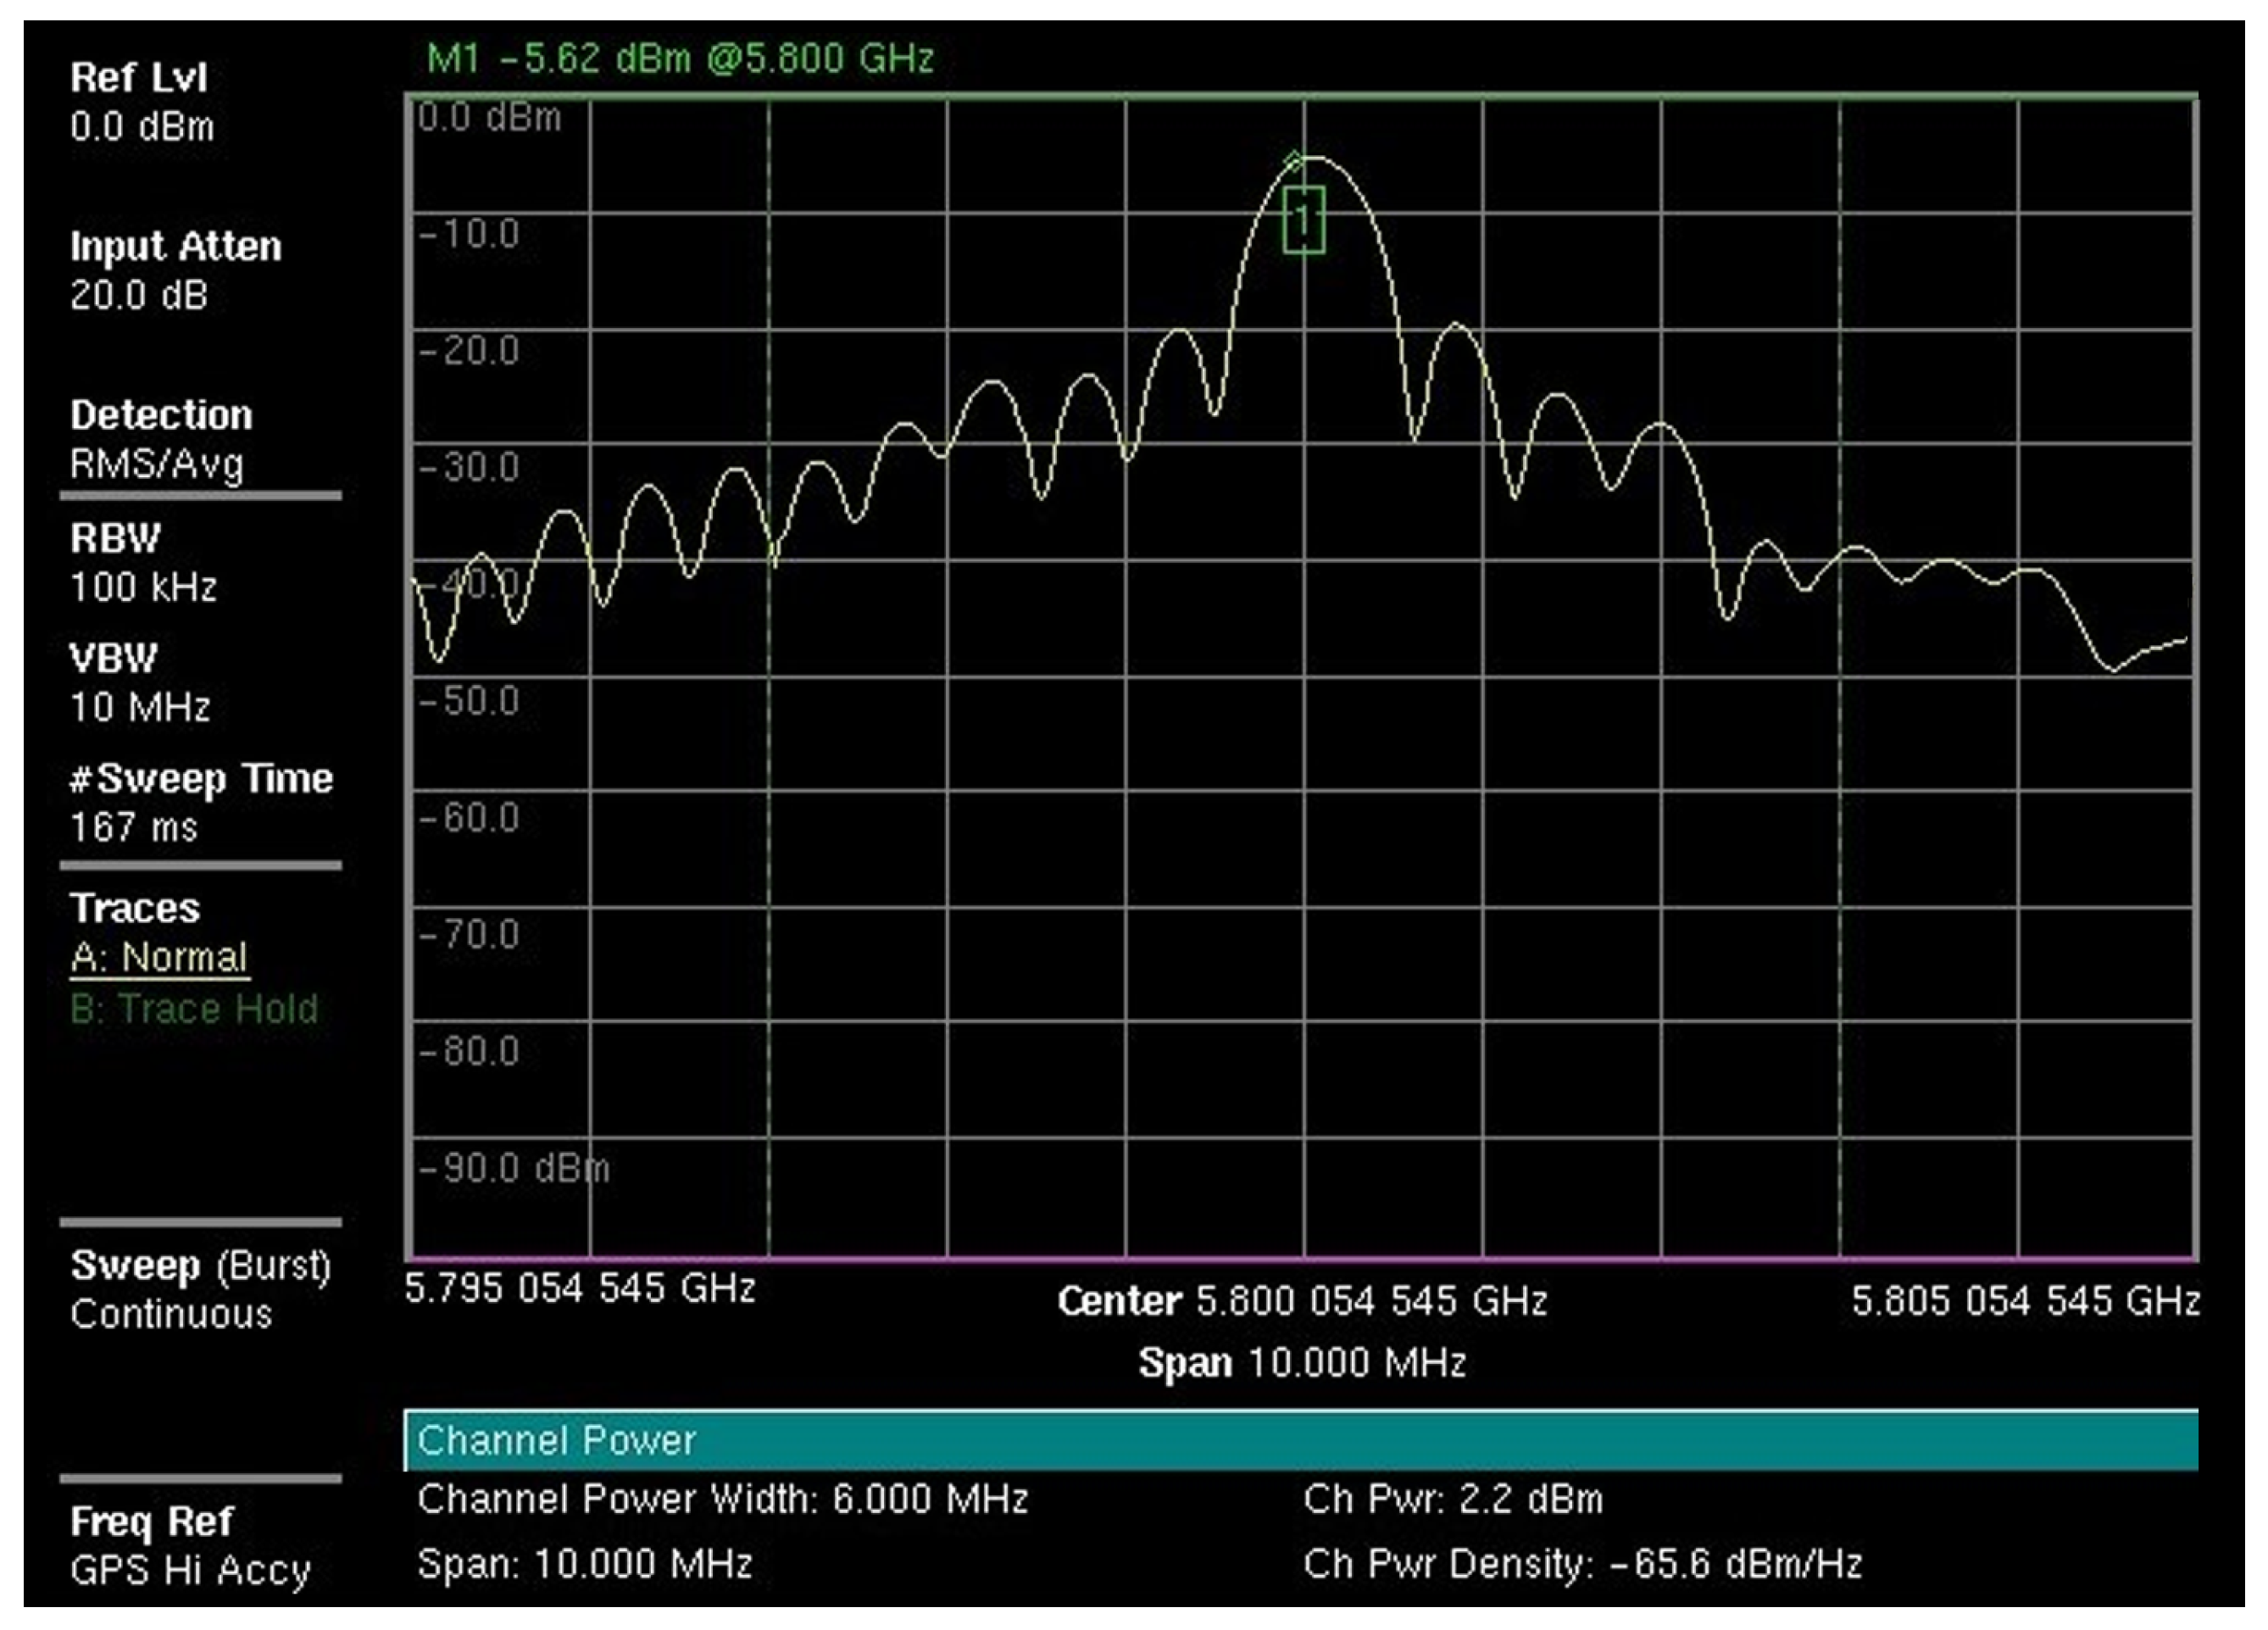
Figure 8 shows the spectrum of the received signal at point P01 and its average power value measured by the Anritsu MS2720T spectrum analyzer.
From the average power values, we calculate the average power at the terminals of the receiving antenna by using Equation (
2).
where
is the average power at the terminals of the receiving antenna (dBm),
is the average power measured by the instrument (dBm),
is the total attenuation between the measurement instrument and the terminals of the receiving antenna (dB) and
is the instrument power offset (dB). The calculated values of the average power at the terminals of the receiving antenna are shown in
Table 3. From these values, we calculate the power density values by using Equation (
3).
where
S is the power density (W/m
),
is the average power at the terminals of the receiving antenna (W),
is the receiving antenna gain and
is the signal wavelength (m). The calculated power density values are also shown in
Table 3.
4.2. Predictions
The power density values for the points in the far field region (P02, P03 and P04) were predicted using Equation (
4) [
22], which assumes free space propagation.
where
is the transmitted average power,
is the transmitting antenna gain and
d is the distance from the measurement point to the transmitting antenna. We assume a transmitter average power of 0.851 kW and a transmitter antenna gain of 44 dBi.
Equation (
5) [
22,
23], which evaluates the maximum power density expected for the near field, was used for point P01, located in this region.
where
is the maximum power density (W/m
) and
A is the area of the transmitting antenna (m
). Equation (
5) provides the maximum power density that can exist on the axis of the antenna beam that is focused at infinity, with no reflections. However, if the calculated prediction reveals a power density value equal or greater than the maximum permissible exposure (MPE), we must assume that this value may exist at any point in the near field region [
22]. The predicted and measured values for all four points are shown in
Table 4.
4.3. Analysis and Discussion
Comparative analyzes between measurements and predictions and between measurem ents and limits established by Anatel and ICNIRP are presented here for each measurement point.
4.3.1. Measurements and Predictions
Comparing the predicted and measured power density values for point P01, the power density measured value is considerably lower. We advocate the coherence of these results because the measurement was taken in a point (P01) misaligned to the antenna axis and the predicted value represents the maximum possible power density level that occurs at the axis of the antenna beam.
In contrast, the predicted and measured values are very close for points P02 and P04. This result is also reasonable since they are in a LoS condition scenario, with no additional meaningful attenuation other than free space, a consequence of a static link configured by a directional receiving antenna and a very narrow beam transmitting antenna.
Otherwise, for the P03 point, the measured value is 96.44% far from the predicted value. This result is explained by the shadowing caused by vegetation located on the signal path, configuring a Non-Line of Sight (NLoS) scenario condition, as shown in
Figure 5.
4.3.2. Measurements and Limits
Comparing the results of measured power density with the ICNIRP’s [
3] and Anatel’s [
4] limits (
Table 1 or the last column of
Table 4), the values for all measurement points are below the limit for occupational public (50 W/m
). However, for general population power density limit (10 W/m
), the measured value at P01 is above the limit. It evidences that the general population cannot have access to the P01 area. In addition, as stated by regulations, the occupational public needs to be warned about the non-ionizing radiation risk at point P01 and the permanence time at this area needs to be controlled when the radar is in operation.
5. Conclusions
This paper presents an NIR measurement campaign using a specific method for trajectography radars. We perform and analyze the power density measurements from a C-band trajectography radar considering the radar’s high gain and locations with a high probability of both exposure and presence of people.
The main contributions of this work are summarized below.
- 1.
A specific method for measuring non-ionizing radiation power density levels due to trajectography radars is proposed. To the best of our knowledge, there are no studies about it;
- 2.
Unpublished NIR measurement results are obtained;
- 3.
The need to adopt control and alert measures was verified due to the high NIR level (above the limit for the general population) at a point close to the radar antenna.
The measurement setup is able to characterize the NIR exclusively from the radar emissions, by using the spectrum analyzer channel power function and a directional receiving antenna. Four measurement points were selected, three at the far field region and one at the near-field region of the radar’s antenna.
All measured and predicted values were presented and discussed, considering each measurement scenario. As the main qualitative results, we concluded that all measured power density values are below the occupational population limit established by ICNIRP and Anatel. However, the general population limit is exceeded at one point located near the radar antenna. It shows the need for restricting general population access to the area very close to the Béarn’s antenna as well as the need for preventive actions to avoid health injuries to the occupational population, by giving orientation about the risks and controlling the permanence time at the area around the radar’s antenna (actions already performed by CLBI regarding its radars).
Author Contributions
Conceptualization and methodology: J.M.L.B.F. and M.E.C.R.; software and data curation: J.M.L.B.F., M.M.d.M.C., D.L.F. and W.S.A.; validation: M.E.C.R. and V.A.d.S.J.; formal analysis and investigation: J.M.L.B.F., M.E.C.R. and V.A.d.S.J.; resources: J.M.L.B.F. and A.G.D.; writing—original draft preparation: J.M.L.B.F. and M.M.d.M.C.; writing—review, editing and visualization: J.M.L.B.F., M.E.C.R. and V.A.d.S.J.; supervision: M.E.C.R. and V.A.d.S.J. All authors have read and agreed to the published version of the manuscript.
Funding
This study was financed in part by the Coordenação de Aperfeiçoamento de Pessoal de Nível Superior—Brasil (CAPES)—Finance Code 001.
Institutional Review Board Statement
Not applicable.
Informed Consent Statement
Not applicable.
Data Availability Statement
Not applicable.
Acknowledgments
The authors would like to thank the Centro de Lançamento da Barreira do Inferno of Brazilian Air Force for the partnership. Special thanks to the Béarn radar’s team and to the members of the research and innovation sector of CLBI.
Conflicts of Interest
The authors declare no conflict of interest.
References
- Lacomme, P.; Hardange, J.P.; Marchais, J.C.; Normant, E. Air and Spaceborne Radar Systems: An Introduction, 1st ed.; William Andrew Publishing: Norwich, NY, USA, 2001; pp. 249–251. ISBN 9781891121135. [Google Scholar]
- THOMSON-CSF. Béarn Radar Technical Order, Paris; THOMSON-CSF: La Défense, France, 1964. [Google Scholar]
- ICNIRP. International Commission on Non-Ionizing Radiation Protection, ICNIRP Guidelines for Limiting Exposure to Electromagnetic Fields (100 kHz to 300 GHz). Health Phys. 2020, 118, 483–524. [Google Scholar] [CrossRef] [PubMed]
- Anatel. Agência Nacional de Telecomunicações (Anatel), Ato n°458; Anatel: Brasília, Brazil, 2019. [Google Scholar]
- Bhargava, D.; Rattanadecho, P. Microstrip Antenna for Radar-Based Microwave Imaging of Breast Cancer: Simulation Analysis. Int. J. Commun. Antenna Propag. 2022, 12, 47–53. [Google Scholar] [CrossRef]
- Meng, Y.; Lin, C.; Zang, J.; Qing, A.; Nikolova, N.K. Ka Band Holographic Imaging System Based on Linear Frequency Modulation Radar. Sensors 2020, 20, 6527. [Google Scholar] [CrossRef] [PubMed]
- Owda, A.Y.; Owda, M.; Rezgui, N.D. Synthetic aperture radar imaging for burn wounds diagnostics. Sensors 2020, 20, 847. [Google Scholar] [CrossRef] [PubMed]
- Peleg, M.; Nativ, O.; Richter, E.D. Radio frequency radiation-related cancer: Assessing causation in the occupational/military setting. Environ. Res. 2018, 163, 123–133. [Google Scholar] [CrossRef] [PubMed]
- Yakymenko, I.; Sidorik, E.; Kyrylenko, S.; Chekhun, V. Long-term exposure to microwave radiation provokes cancer growth: Evidences from radars and mobile communication systems. Exp. Oncol. 2011, 33, 62–70. [Google Scholar] [PubMed]
- Goldsmith, J.R. Epidemiologic evidence of radiofrequency radiation (microwave) effects on health in military, broadcasting, and occupational studies. Int. J. Occup. Environ. Health 1995, 1, 47–57. [Google Scholar] [CrossRef] [PubMed]
- Joseph, W.; Goeminne, F.; Vermeeren, G.; Verloock, L.; Martens, L. Occupational and public field exposure from communication, navigation, and radar systems used for air traffic control. Health Phys. 2012, 103, 750–762. [Google Scholar] [CrossRef] [PubMed]
- Martin, I.M.; Alves, M.A.; Gomes, M.P. The electromagnetic spectrum from 1 Hz to 9.4 GHz near ground level in the region of São José dos Campos, SP, Brazil. In Proceedings of the 2013 SBMO/IEEE MTT-S International Microwave & Optoelectronics Conference (IMOC), Rio de Janeiro, Brazil, 4–7 August 2013; pp. 1–4. [Google Scholar]
- Halgamuge, M.N. Radio hazard safety assessment for marine ship transmitters: Measurements using a new data collection method and comparison with ICNIRP and ARPANSA Limits. Int. J. Environ. Res. Public Health 2015, 12, 5338–5354. [Google Scholar] [CrossRef] [PubMed]
- Wollinger, P.R. Estudo dos Níveis de Radiação Eletromagnética em Ambiente Urbano. Master’s Thesis, Universidade Federal de Santa Catarina (UFSC), Florianópolis, SC, Brazil, 2003. [Google Scholar]
- WHO. World Health Organization (WHO)—International EMF Project. Available online: https://www.who.int/initiatives/the-international-emf-project (accessed on 13 October 2021).
- ICNIRP. International Commission on Non-Ionizing Radiation Protection, ICNIRP Guidelines for Limiting Exposure to Time-Varying Electric, Magnetic and Electromagnetic Fields (up to 300 GHz). Health Phys. 1998, 74, 494–522. [Google Scholar]
- de F. Diniz, A.B.; de Sousa Jr., V.A.; Rodrigues, M.E.C.; Mendonça, H.B.; da Silva, G.S.; Pinheiro, F.S.R. Non-Ionizing Radiation Analysis in Close Proximity to Antenna Tower: A Case Study in Northeast Brazil. J. Microwaves Optoelectron. Electromagn. Appl. 2021, 20, 126–142. [Google Scholar] [CrossRef]
- Pinheiro, F.S.R.; de Oliveira Maranhão, T.M.; Filho, M.B.; da Costa Rodrigues, M.E.; da Silva, G.S.; de Sousa, T.P.; Sanchis, M.A.B.; Câmara, A.L.S.; da Silva Gonçalo, J.P.; de Abiahy Carneiro da Cunha Braga, A. Assessment of non-ionizing radiation from radio frequency energy emitters in the urban area of Natal City. Sci. Res. Essays 2015, 2, 79–85. [Google Scholar] [CrossRef]
- Rodrigues, M.E.C.; Pinheiro, F.S.R.; Braga, A.A.C.C.; Sousa, T.P.; Gonçalo, J.P.S.; Sanchis, M.A.B.; Câmara, A.L.S. Measurements of non-ionizing radiation on urban environment and preliminary assessment of relative contribution among different services. In Proceedings of the 2013 SBMO/IEEE MTT-S International Microwave & Optoelectronics Conference (IMOC), Rio de Janeiro, Brazil, 4–7 August 2013; pp. 1–4. [Google Scholar]
- Schwarz, R. Power Measurement on Pulsed Signals with Spectrum Analyzers; Application Note; Rohde & Schwarz Regional Headquarters Singapore Pte Ltd.: Singapore, 2003. [Google Scholar]
- Keysight. Radar Measurements; Application Note; Keysight: Santa Rosa, CA, USA, 2014. [Google Scholar]
- Recommended Practice for Measurements and Computations of Radio Frequency Electromagnetic Fields with Respect to Human Exposure to Such Fields, 100 kHz–300 GHz; IEEE Standard C95.3-2002; IEEE: Piscataway, NJ, USA, 2002.
- Mumford, W. Some technical aspects of microwave radiation hazards. Proc. IRE 1961, 49, 427–447. [Google Scholar] [CrossRef]
| Publisher’s Note: MDPI stays neutral with regard to jurisdictional claims in published maps and institutional affiliations. |
© 2022 by the authors. Licensee MDPI, Basel, Switzerland. This article is an open access article distributed under the terms and conditions of the Creative Commons Attribution (CC BY) license (https://creativecommons.org/licenses/by/4.0/).


 ,
, 


