Article

Dual-Gas Sensor of CH4/C2H6 Based on Wavelength Modulation Spectroscopy Coupled to a Home-Made Compact Dense-Pattern Multipass Cell

1
Anhui Institute of Optics and Fine Mechanics, Chinese Academy of Science, Hefei 230031, China
2
Science Island Branch of Graduate School, University of Science and Technology of China, Hefei 230026, China
3
Laboratoire de Physicochimie de l’Atmosphère, Université du Littoral Côte d’Opale, 189A, Av. Maurice Schumann, 59140 Dunkerque, France
*
Author to whom correspondence should be addressed.
Sensors 2019, 19(4), 820; https://doi.org/10.3390/s19040820
Submission received: 10 January 2019 / Revised: 2 February 2019 / Accepted: 14 February 2019 / Published: 17 February 2019
(This article belongs to the Special Issue Optical Sensing and Imaging, from UV to THz Range)

Abstract

:
A sensitive dual-gas sensor for the detection of CH4 and C2H6 is demonstrated. Two tunable semiconductor lasers operating at 1.653 μm (for CH4 monitoring) and 1.684 μm (for C2H6) were used as the light source for spectroscopic measurements of CH4 and C2H6. Long-path absorption in a home-made compact dense-pattern multipass cell (Leff = 29.37 m) was employed, combined with wavelength modulation and second harmonic detection. Simultaneous detection of CH4 and C2H6 was achieved by separated wavelength modulations of the two lasers. Modulation frequencies and amplitudes were optimized for sensitivity detection of CH4 and C2H6 simultaneously. The dual-gas sensor exhibits 1σ detection limits of 1.5 ppbv for CH4 in 140 s averaging time and 100 ppbv for C2H6 in 200 s.

1. Introduction

Natural gas is the third largest source of thermal energy in the world, accounting for 22.1% of primary energy consumption after petroleum (31.9%) and coal (27.1%). The methane (CH4) content in natural gas reaches over 90%. Biogas, which contains mainly CH4, is a naturally occurring gas that forms from the breakdown of organic matter in the presence of anaerobic bacteria. CH4 is also a main greenhouse gas, whose greenhouse effect is 25 times higher than that of carbon dioxide (CO2). Ethane (C2H6) is the second largest component in natural gas, accounting for about 5–10%. It can be used as an indicator to discriminate whether the measured leaking gas is from natural gas, underground biogas, or other combustible gas. Monitoring C2H6 can be applied to diagnose leaking natural gas pipelines [1,2,3,4,5,6].
Laser spectroscopy-based gas sensors is an effective tool for environmental monitoring, medical diagnosis, industrial process control, food industry, and pollution monitoring [7], and includes quartz-enhanced photoacoustic spectroscopy (QEPAS) [8,9,10], off-axis integrated cavity output spectroscopy (OA-ICOS) [11], and tunable diode laser absorption spectroscopy (TDLAS) with a multipass cell. In general, long-path absorption is combined with wavelength modulation to improve measurement sensitivity and precision [12,13]. Krzempek demonstrated C2H6 concentration measurement based on 2f wavelength modulation spectroscopy (WMS) using a continuous-wave (CW) distributed feedback diode laser emitting in the mid-infrared near 3.36 µm. A 1σ minimum detectable concentration of 740 pptv with a 1 s lock-in amplifier time constant was achieved [14]. Zheng and co-workers utilized two CW interband cascade lasers (ICLs) operating at 3291 nm (CH4) and 3337 nm (C2H6) for the simultaneous measurement of CH4/C2H6 in the mid-infrared. Detection limits of ~1.7 ppbv for CH4 in 9 s and ~0.36 ppbv for C2H6 in 65 s [15] were achieved. Li et al. realized ppbv-level measurement of C2H6 using 3.34 µm CW-ICL-based WMS with a detection limit of ~1.2 ppbv in a 4 s averaging time [16].
Though C2H6 absorption intensity is relatively weak in the near-infrared spectral region [17,18], the photonic devices in this spectral region have the characteristics of being low cost and relatively mature. Therefore, it is of great significance to develop a high-sensitivity dual-gas sensor for CH4/C2H6 by TDLAS for leakage detection applications [19].
In this paper, we report on the development of an optical sensor for the simultaneous measurement of CH4 (at 1.653 µm) and C2H6 (at 1.684 µm) based on long-path absorption in a newly home-made dense-pattern multipass cell combined with wavelength modulation and second harmonic detection [20].

2. Basics of Wavelength-Modulation Spectroscopy

Wavelength-modulation spectroscopy (WMS) is a spectroscopic measurement technique widely used for trace gas measurements in harsh environments owing to its high noise-rejection capability over direct absorption spectroscopy. Only a brief description of some of the fundamental theory will be given here to explain certain experimental choices (e.g., modulation index) made in this study [21,22,23]. The instantaneous laser frequency with sinusoidal modulation can be written as:
ν ( t ) = ν 0 + Δ v cos ( ω t )
where ν0 (cm−1) is the center laser emission frequency, ω is the angular frequency, and Δν (cm−1) is the modulation depth.
The time-dependent transmission coefficient τ(ν) can be expanded in a Fourier cosine series:
τ [ ν ( t ) ] = τ [ ν 0 + Δ v cos ( ω t ) ] = n = 0 n = + H n ( ν 0 , Δ v ) cos ( n ω t )
where Hn (ν0, Δν) is the n-th component of the Fourier series, which can be expressed as:
H 0 ( ν 0 , Δ v ) = 1 2 π π π τ ( ν 0 + Δ v cos θ ) d θ ( n = 0 )
H n ( ν 0 , Δ v ) = 1 π π π τ ( ν 0 + Δ v cos θ ) cos ( n θ ) d θ ( n > 0 )
In practice, second harmonic is usually used for the detection (n = 2):
H 2 ( ν 0 , Δ v ) = 1 π π π τ ( ν 0 + Δ v cos θ ) cos ( 2 θ ) d θ ( n = 2 )
In the case of trace gas absorption described by the Beer-Lambert law [24] (α(ν)L << 1 ), the transmission can be simplified as:
τ ( ν ) = I o u t ( ν ) I i n ( ν ) = exp [ α ( ν ) L ] 1 α ( v ) L = 1 N 0 S C L χ ( v - v 0 )
where Iout(ν) and Iin(ν) are the transmitted and incident light intensities at frequency ν, respectively, L is the optical absorption path length in [cm]. α(ν) = σ(ν)N0C = χ(νν0)SN0C (at standard temperature and pressure) is the absorption coefficient of the target gas with concentration C (mixing ratio) and the Loschmidt constant N0 = 2.6868 × 10¹⁹ molecule/cm3. σ(ν) = χ(νν0)S is the absorption cross-section of the target gas with S the line strength in [cm−1/(molecules/cm−2)] and χ(νν0) the absorption line shape function. ν0 is the central frequency of the absorption line.
From Equations (5) and (6), the Fourier series of the second harmonic can be expressed as:
H 2 ( ν 0 , Δ v ) = - N 0 S C L π π π χ ( ν 0 + Δ v cos θ ) cos ( 2 θ ) d θ
According to Equation (7), the harmonic signal is hence proportional to the concentration of the gas. In addition to the absorption parameters, the WMS-2f signal also depends on the modulation depth Δν. The WMS-2f signal can be maximized by choosing the optimal modulation index m, which is defined as:
m = Δν/ΔνD
where ΔνD [cm−1] is the full width at half maximum (FWHM) of the absorption line shape, and the 2f signal amplitude is maximized at a modulation index m = 2.2 [25,26].
In addition, the background signal is caused by the 2f residual–amplitude–modulation (2f-RAM) signal in the presence of linear intensity modulation [27]. In the present work, we use the second harmonic signal deducting the background to determine the concentrations of CH4 and C2H6.

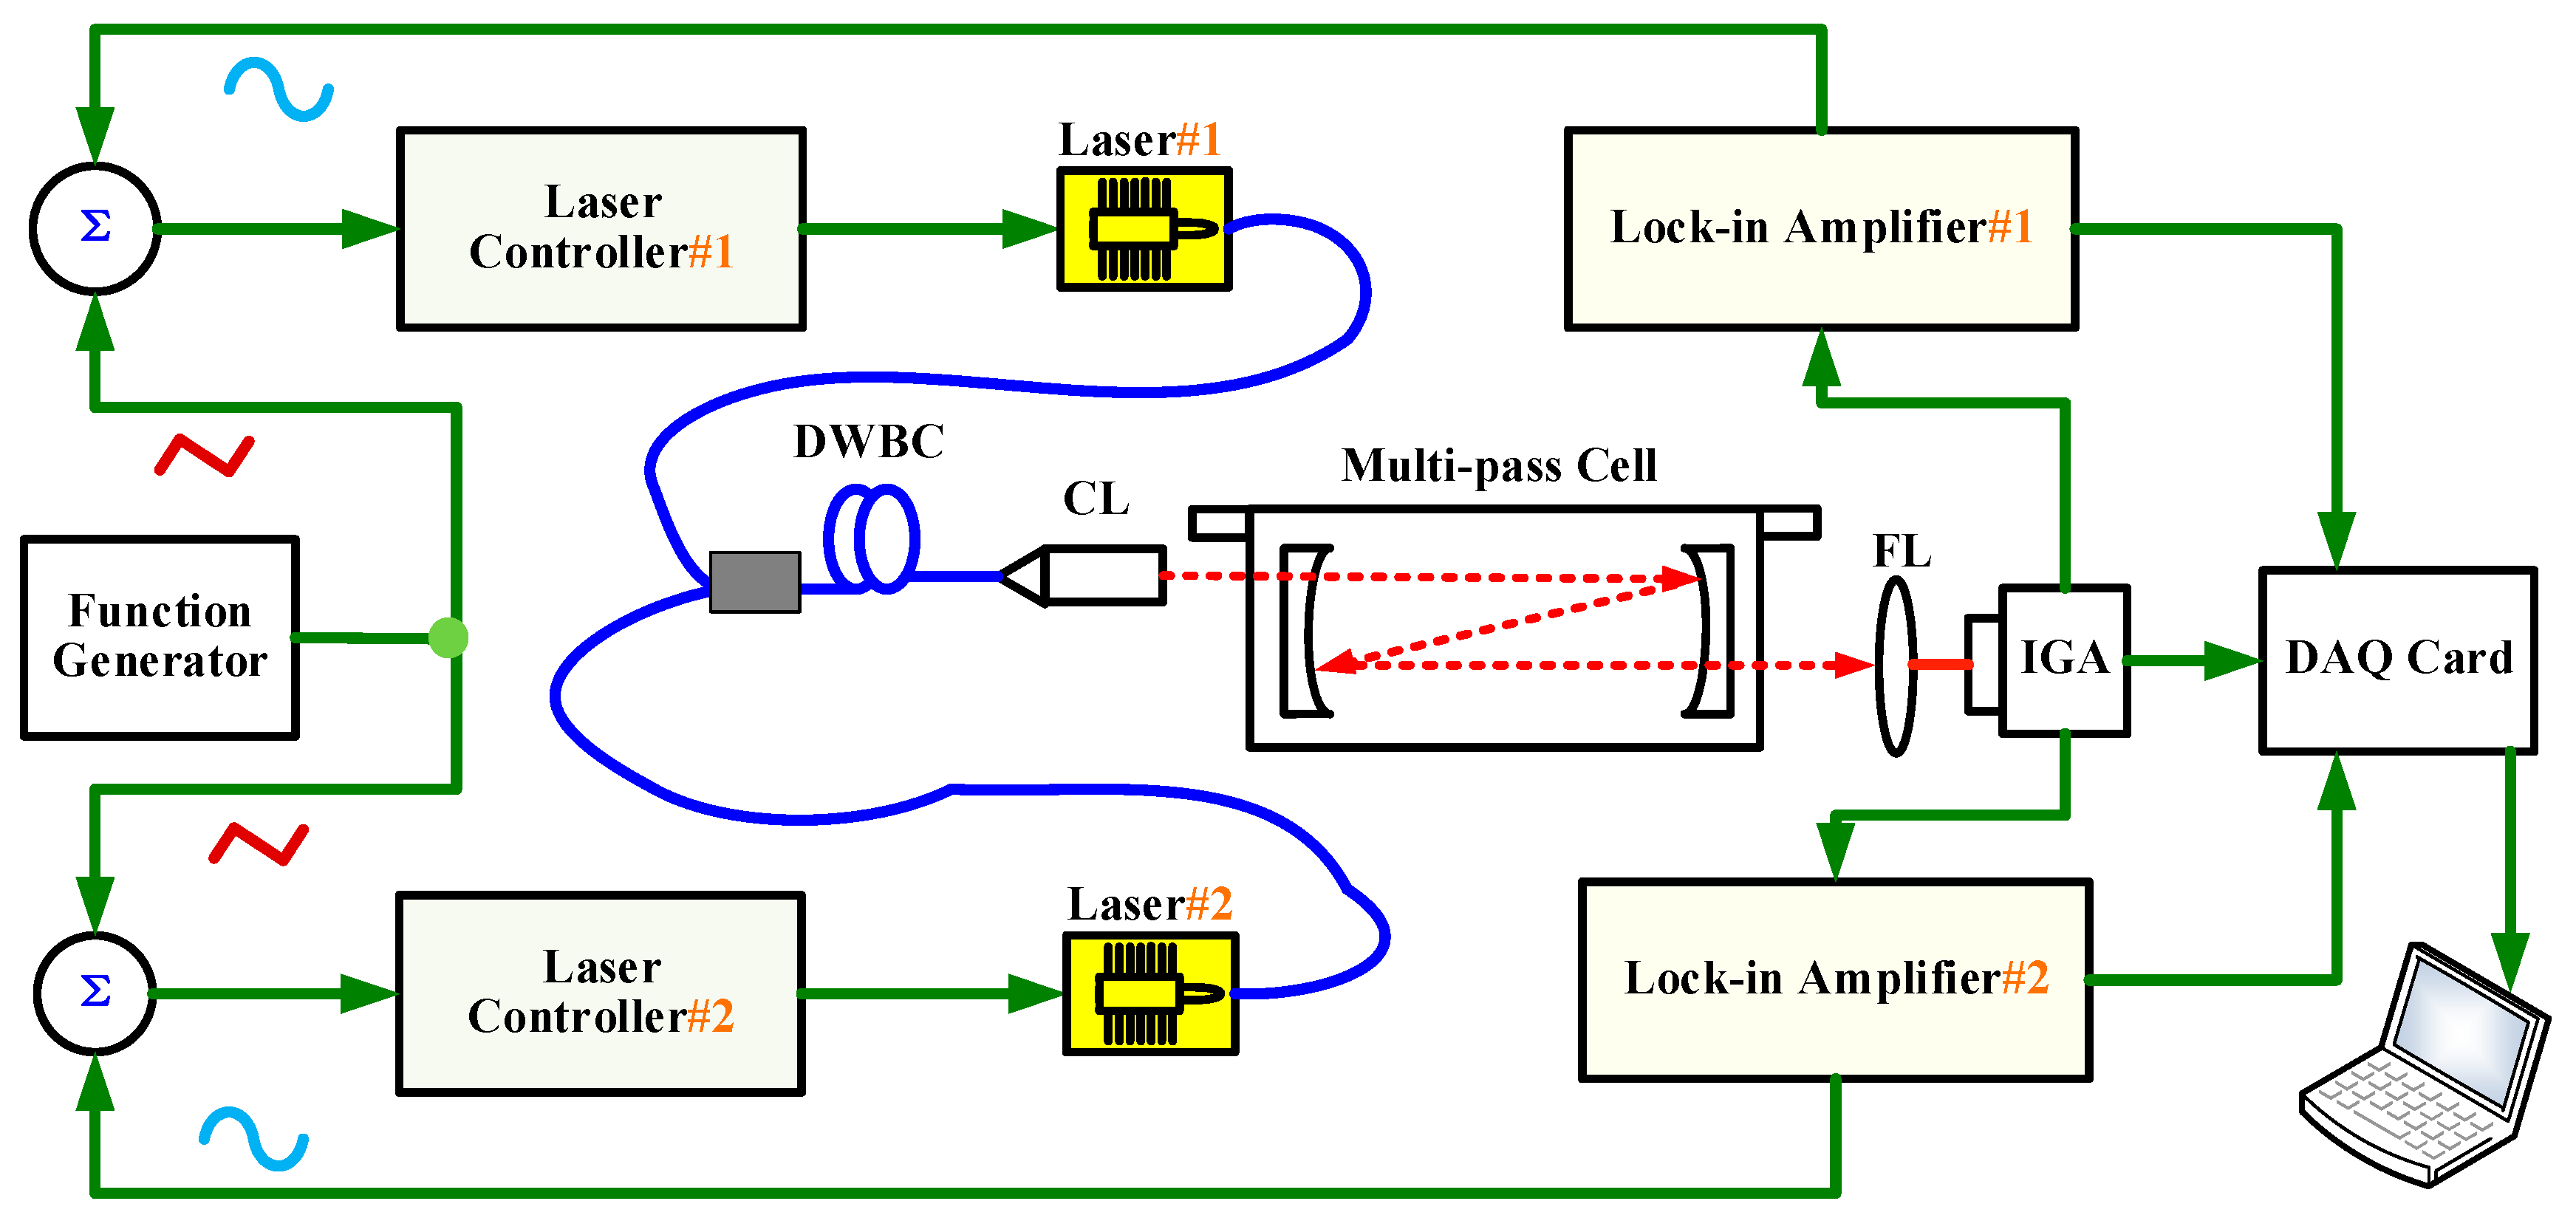
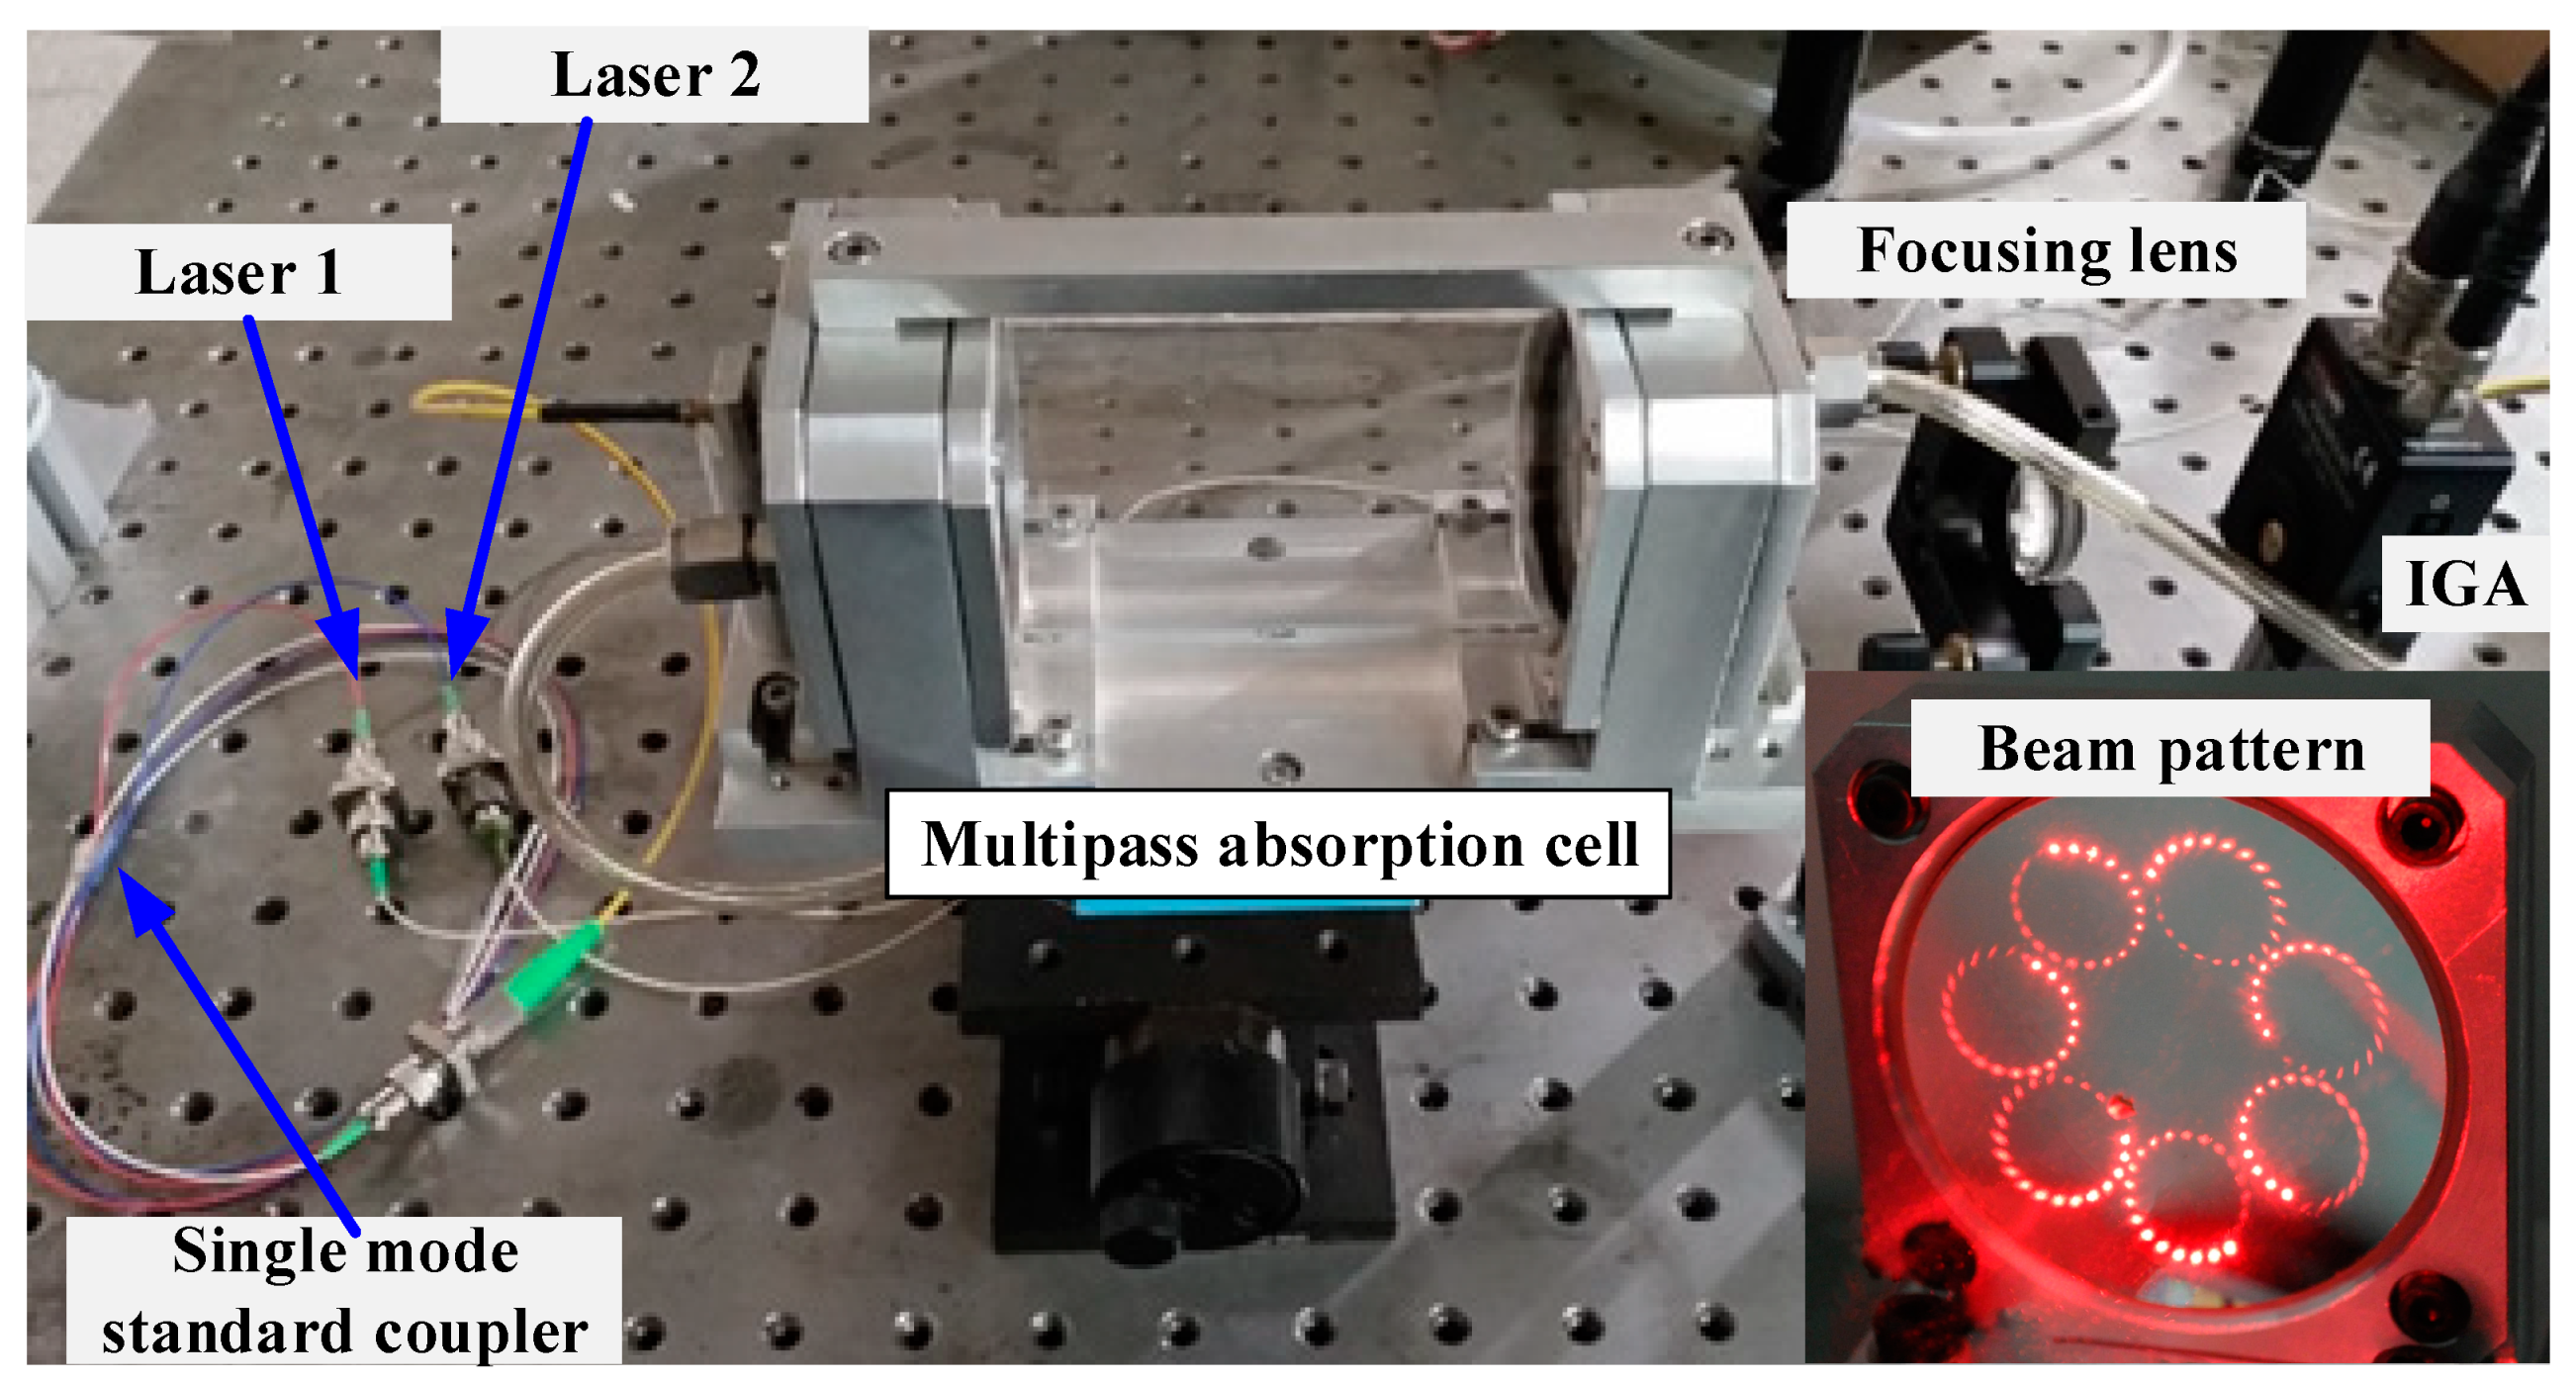
3. Experimental Details

3.1. Design of the Dual-Gas Sensor for CH4 and C2H6

The developed dual-gas sensor is shown in Figure 1. Two tunable distributed feedback (DFB) diode lasers operating at 1.653 µm and 1.684 µm were used for the measurements of CH4 and C2H6, respectively. The temperature and current of both lasers were controlled by laser diode controllers LDC501 (Stanford Research Inc., Sunnyvale, CA, USA). Both lasers currents were scanned by feeding an external voltage ramp at a rate of 1 Hz from a function generator (RIGOL DG4162). Wavelength modulations (6 kHz for CH4 and 0.6 kHz for C2H6) were achieved through the modulation of each laser current via a sine form wave from lock-in amplifiers #1 and #2 (SR 830 DSP, Stanford Research Systems), respectively. The voltage ramp and the sine wave were combined with a home-made adder before being coupled to the laser diode controllers.
The two laser beams were coupled together into a 2 × 1 single mode standard coupler (DWBC) with the maximum insertion loss 0.3 dB/km. The output beams were collimated through a single fiber optical collimator with the beam diameter not exceeding 0.35 mm and then injected into a home-made multipass absorption cell. The multipass cell consisted of two 2” silver-coated concave spherical mirrors separated by a distance of 12 cm, which was similar to that previously reported in [20]. An effective optical path of 29.37 m was achieved with 243 multiple reflections of laser beam inside the cell.
The transmitted beam was detected with an indium gallium arsenic photodetector (PDA20CS-ES) via a focusing lens (f = 30 mm) as shown in Figure 2. The signal detected by the photodetector was sent to lock-in amplifiers #1 and #2, respectively, for demodulations at 6 kHz for CH4 and 0.6 kHz for C2H6, so as to distinguish the signals from different lasers and realize simultaneous detection of CH4 and C2H6. The demodulated signals were subsequently digitalized with a data acquisition card (DA, NI-USB-6212) and displayed on a laptop via LabVIEW interface.

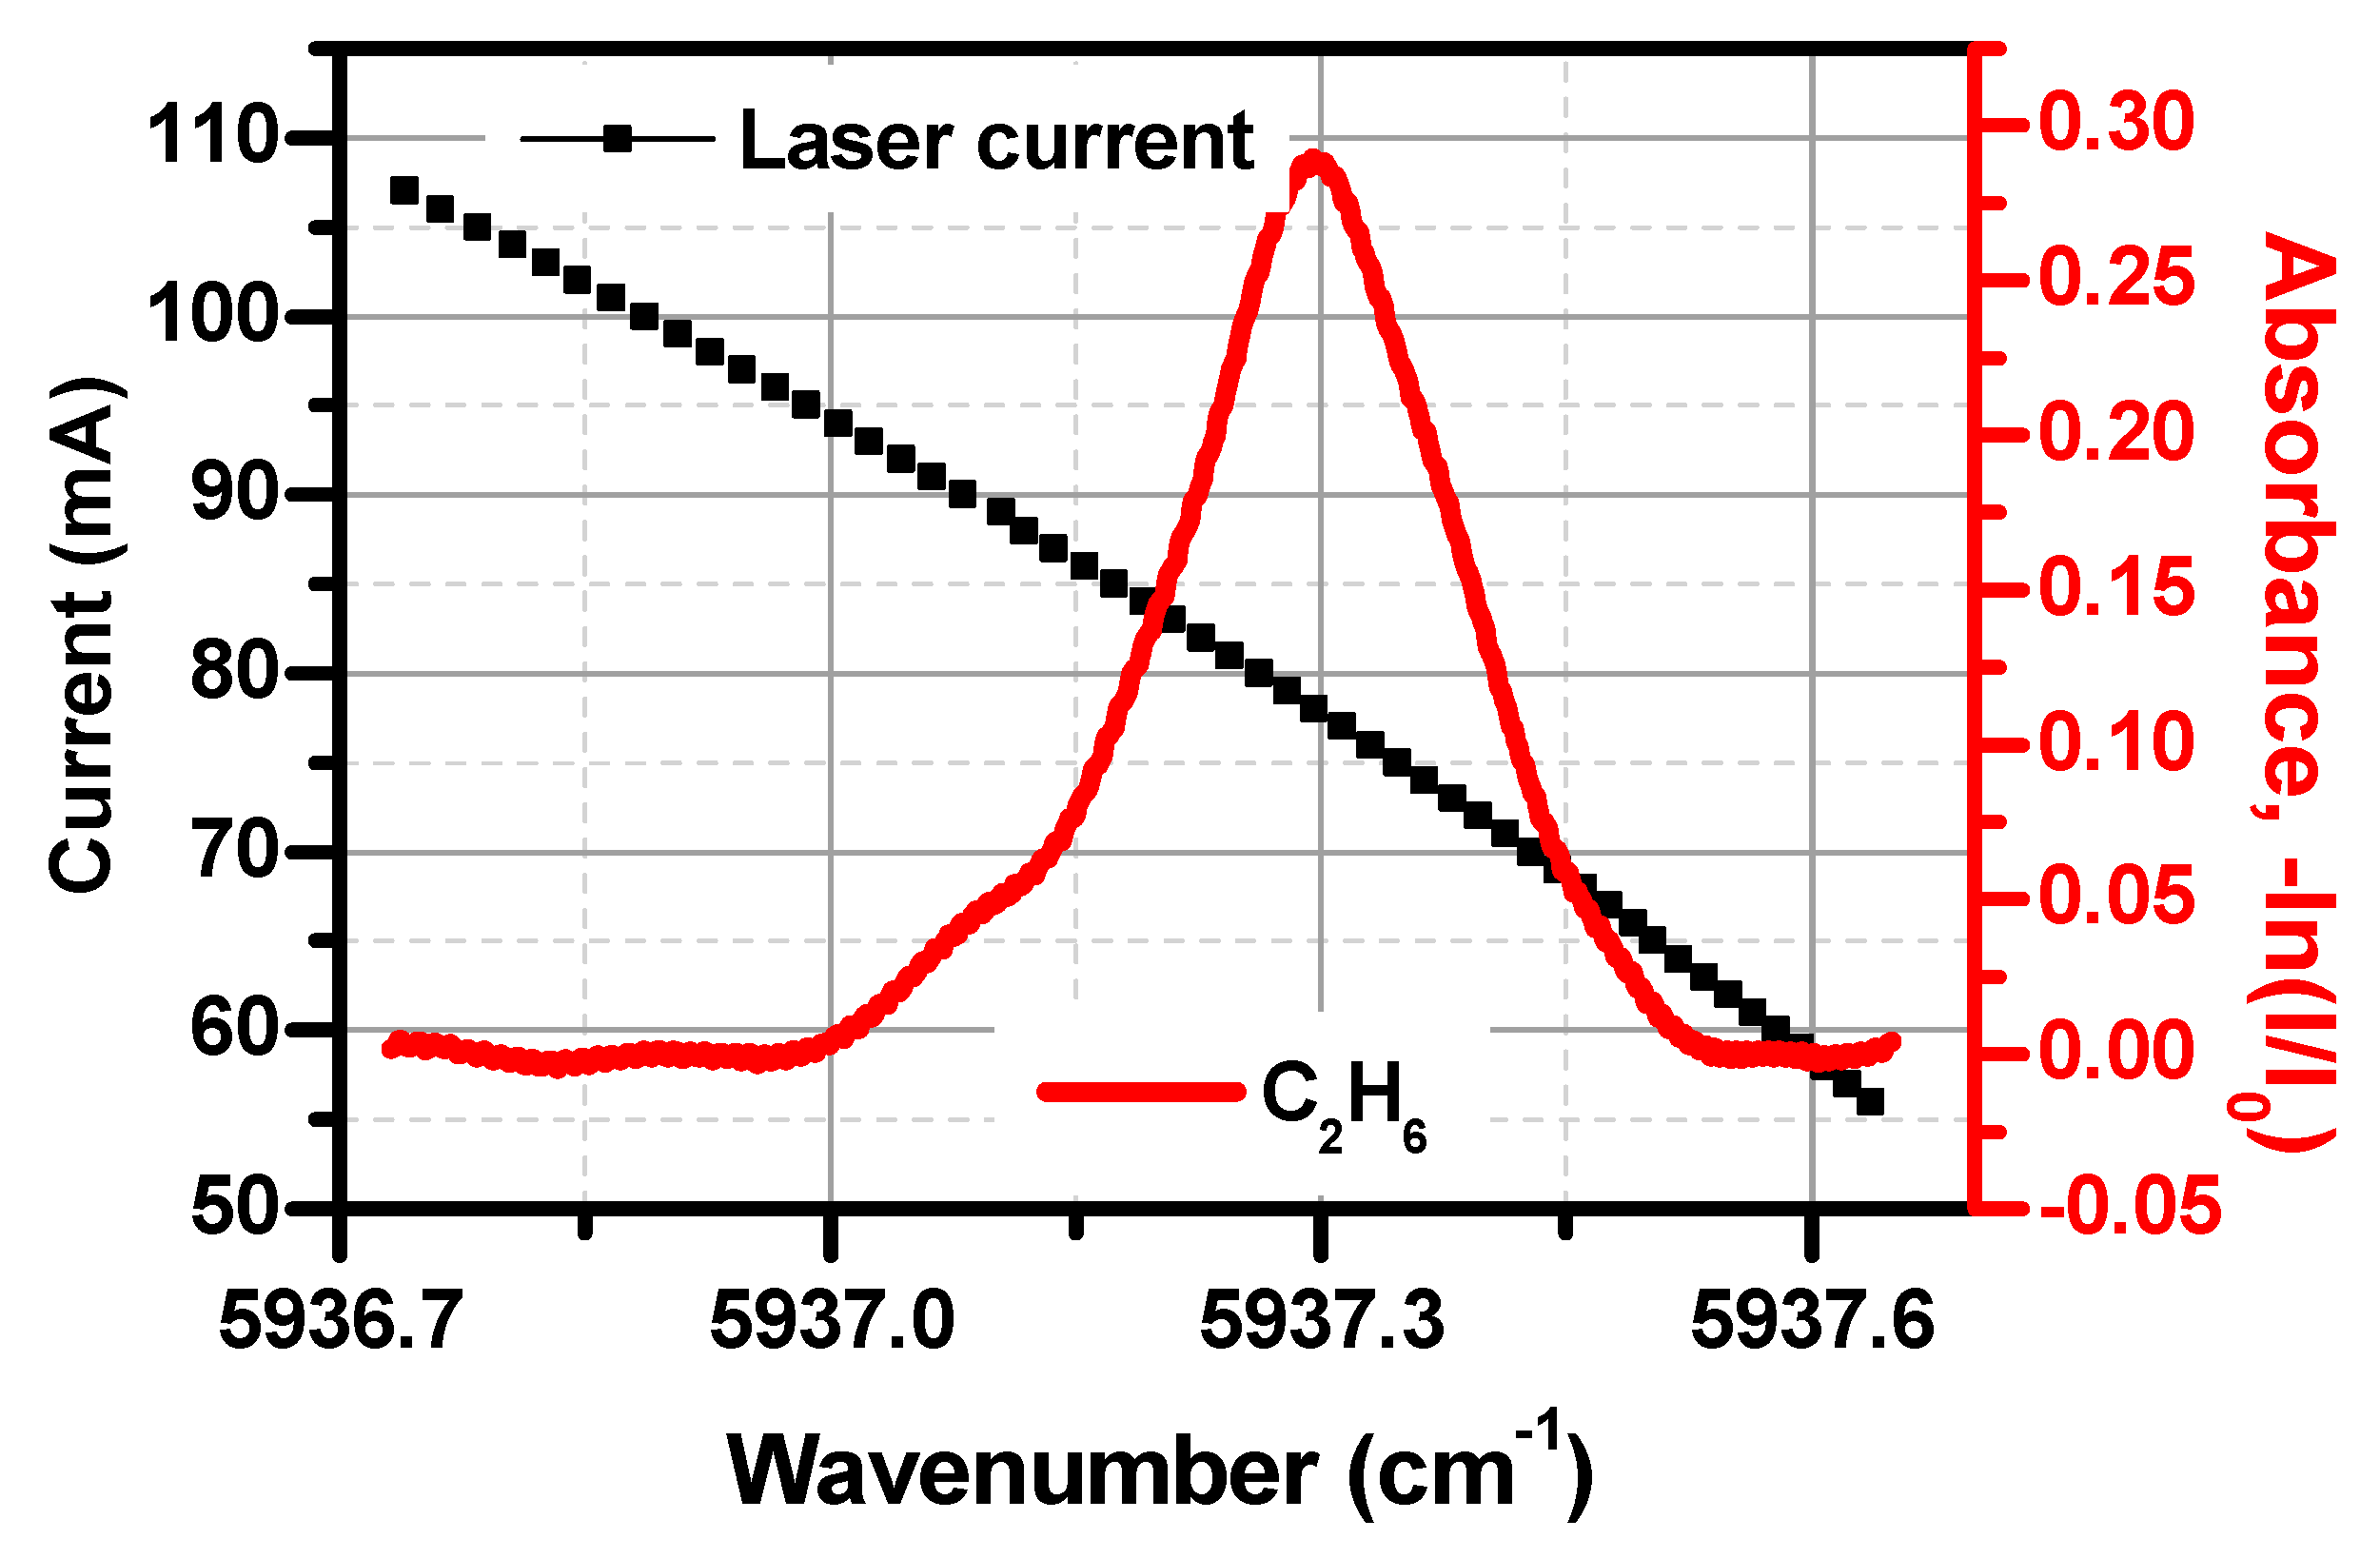
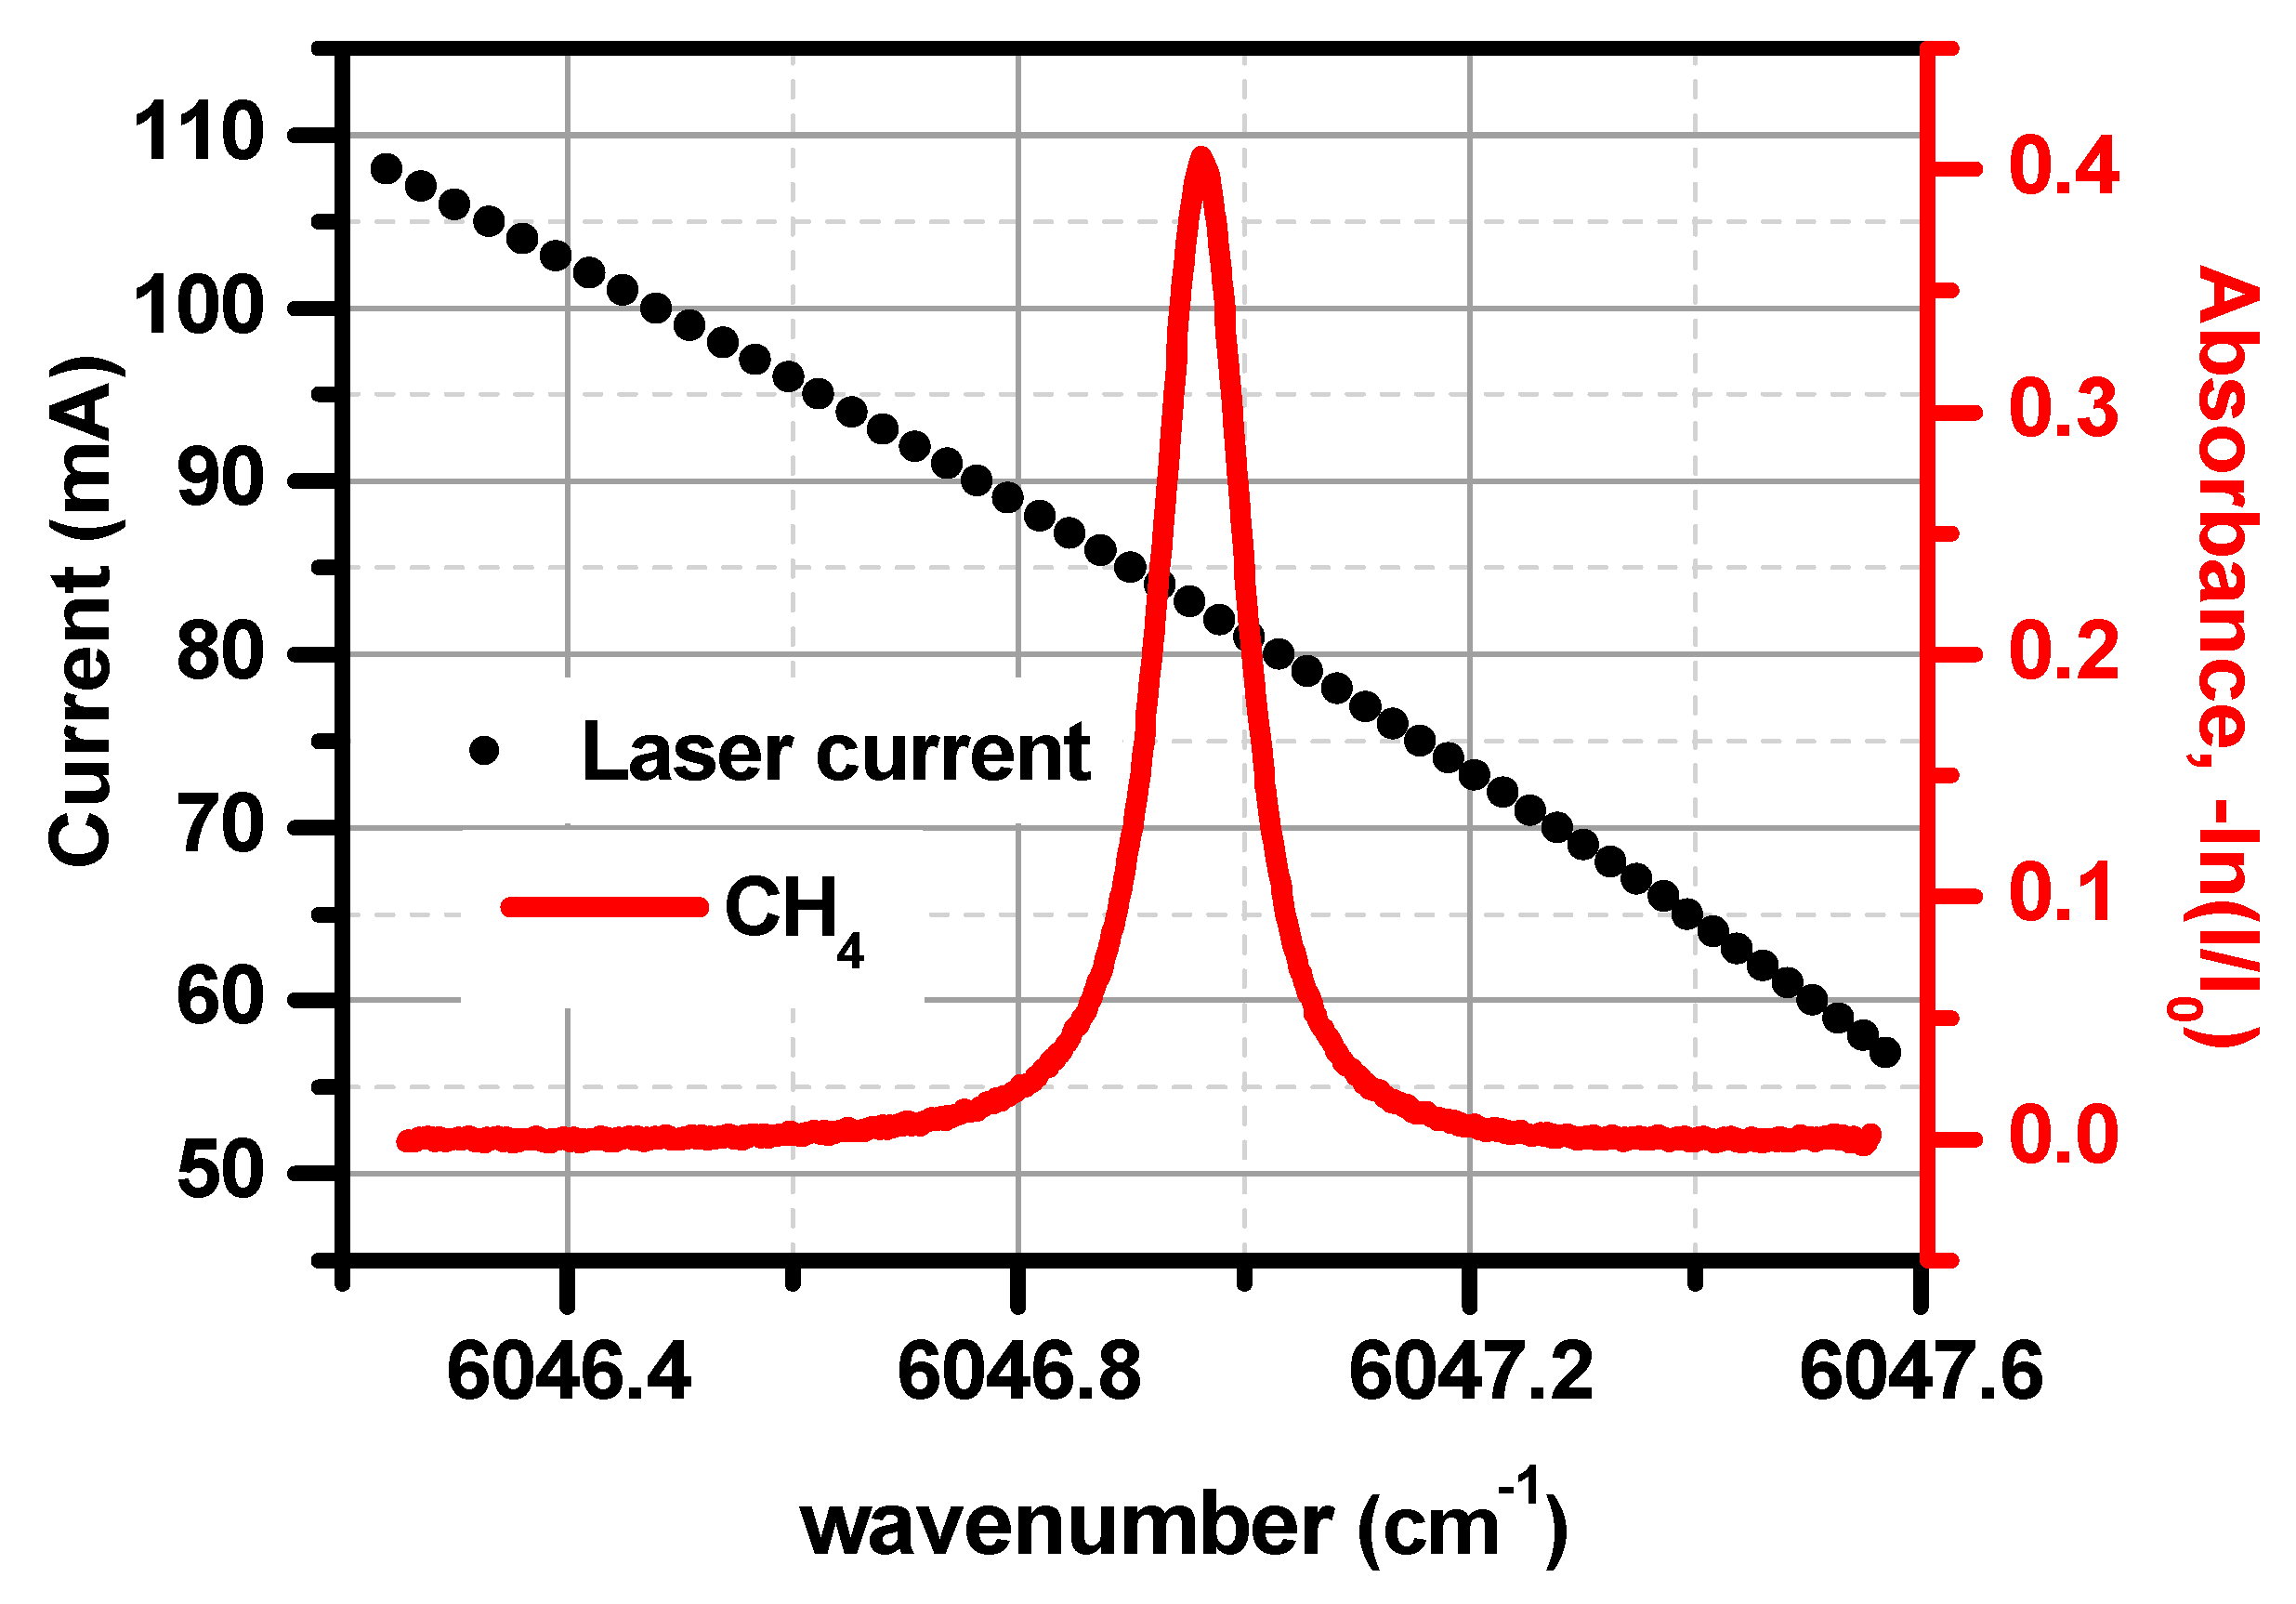
3.2. Spectral Line Selection

C2H6 shows an unresolvable absorption band near 1.684 µm [28,29]. There is no information on its spectral line parameters in the common database (such as HITRAN) for ethane in the near-infrared. In order to determine the laser temperature and the current corresponding to the maximum ethane absorption, 10,000 ppm ethane gas was filled in the multipass cell at a pressure of 0.5 atm. Direct C2H6 absorption spectrum was obtained by a wavelength scan of the 1.684 µm DFB laser across the C2H6 absorption lines, as shown in Figure 3. The laser temperature and the current needed to probe the strong absorption band of C2H6 near 1.684 µm were found to be 31 °C and 78 mA, respectively.
While the best CH4 absorption lines within the spectral tuning range of the used 1.653 µm diode laser are the R3 triplet of the 2ν3 band near ~6046.95 cm−1, they have the highest line intensities and are free of interference from other molecules (such as H2O and CO2). The R3 triplet of the 2ν3 band at ~6046.95 cm−1 was selected for the measurement of CH4 concentration. Figure 4 shows an absorption spectrum of 492 ppm CH4 at a pressure of 0.5 atm. The laser center current was set at 85 mA with a temperature set at 22 °C for targeting the selected CH4 absorption lines. The amplitude of the triangular ramp was 1.3 V, which scanned the laser diode current from 52.5 to 117.5 mA (50 mA/V).
The calibration curves of laser current vs. frequency were realized with the help of a wavelength meter (Bristol 621).

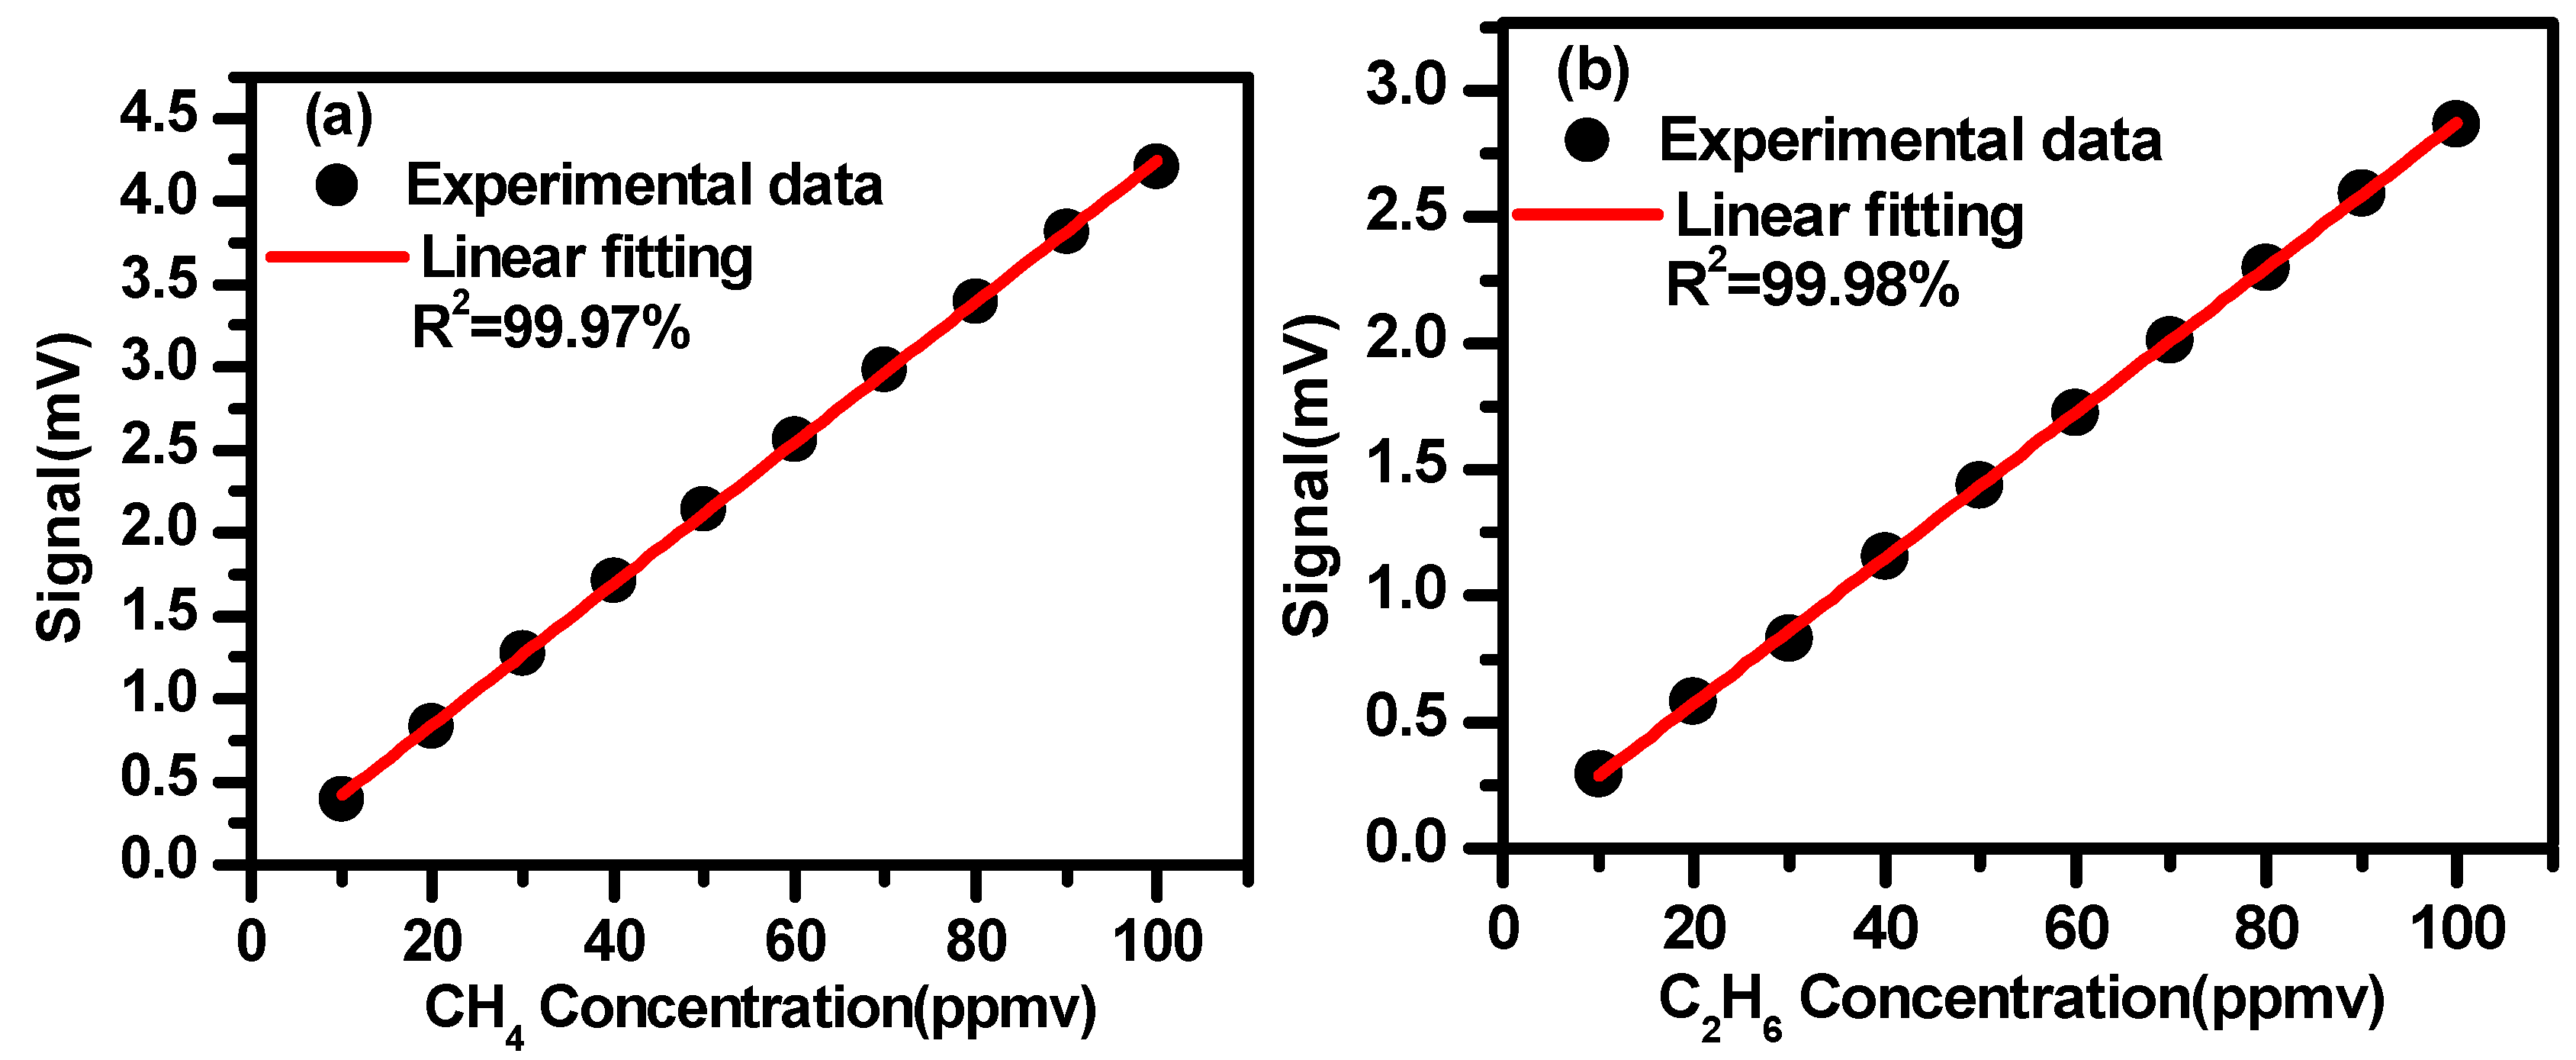
4. Results and Discussions

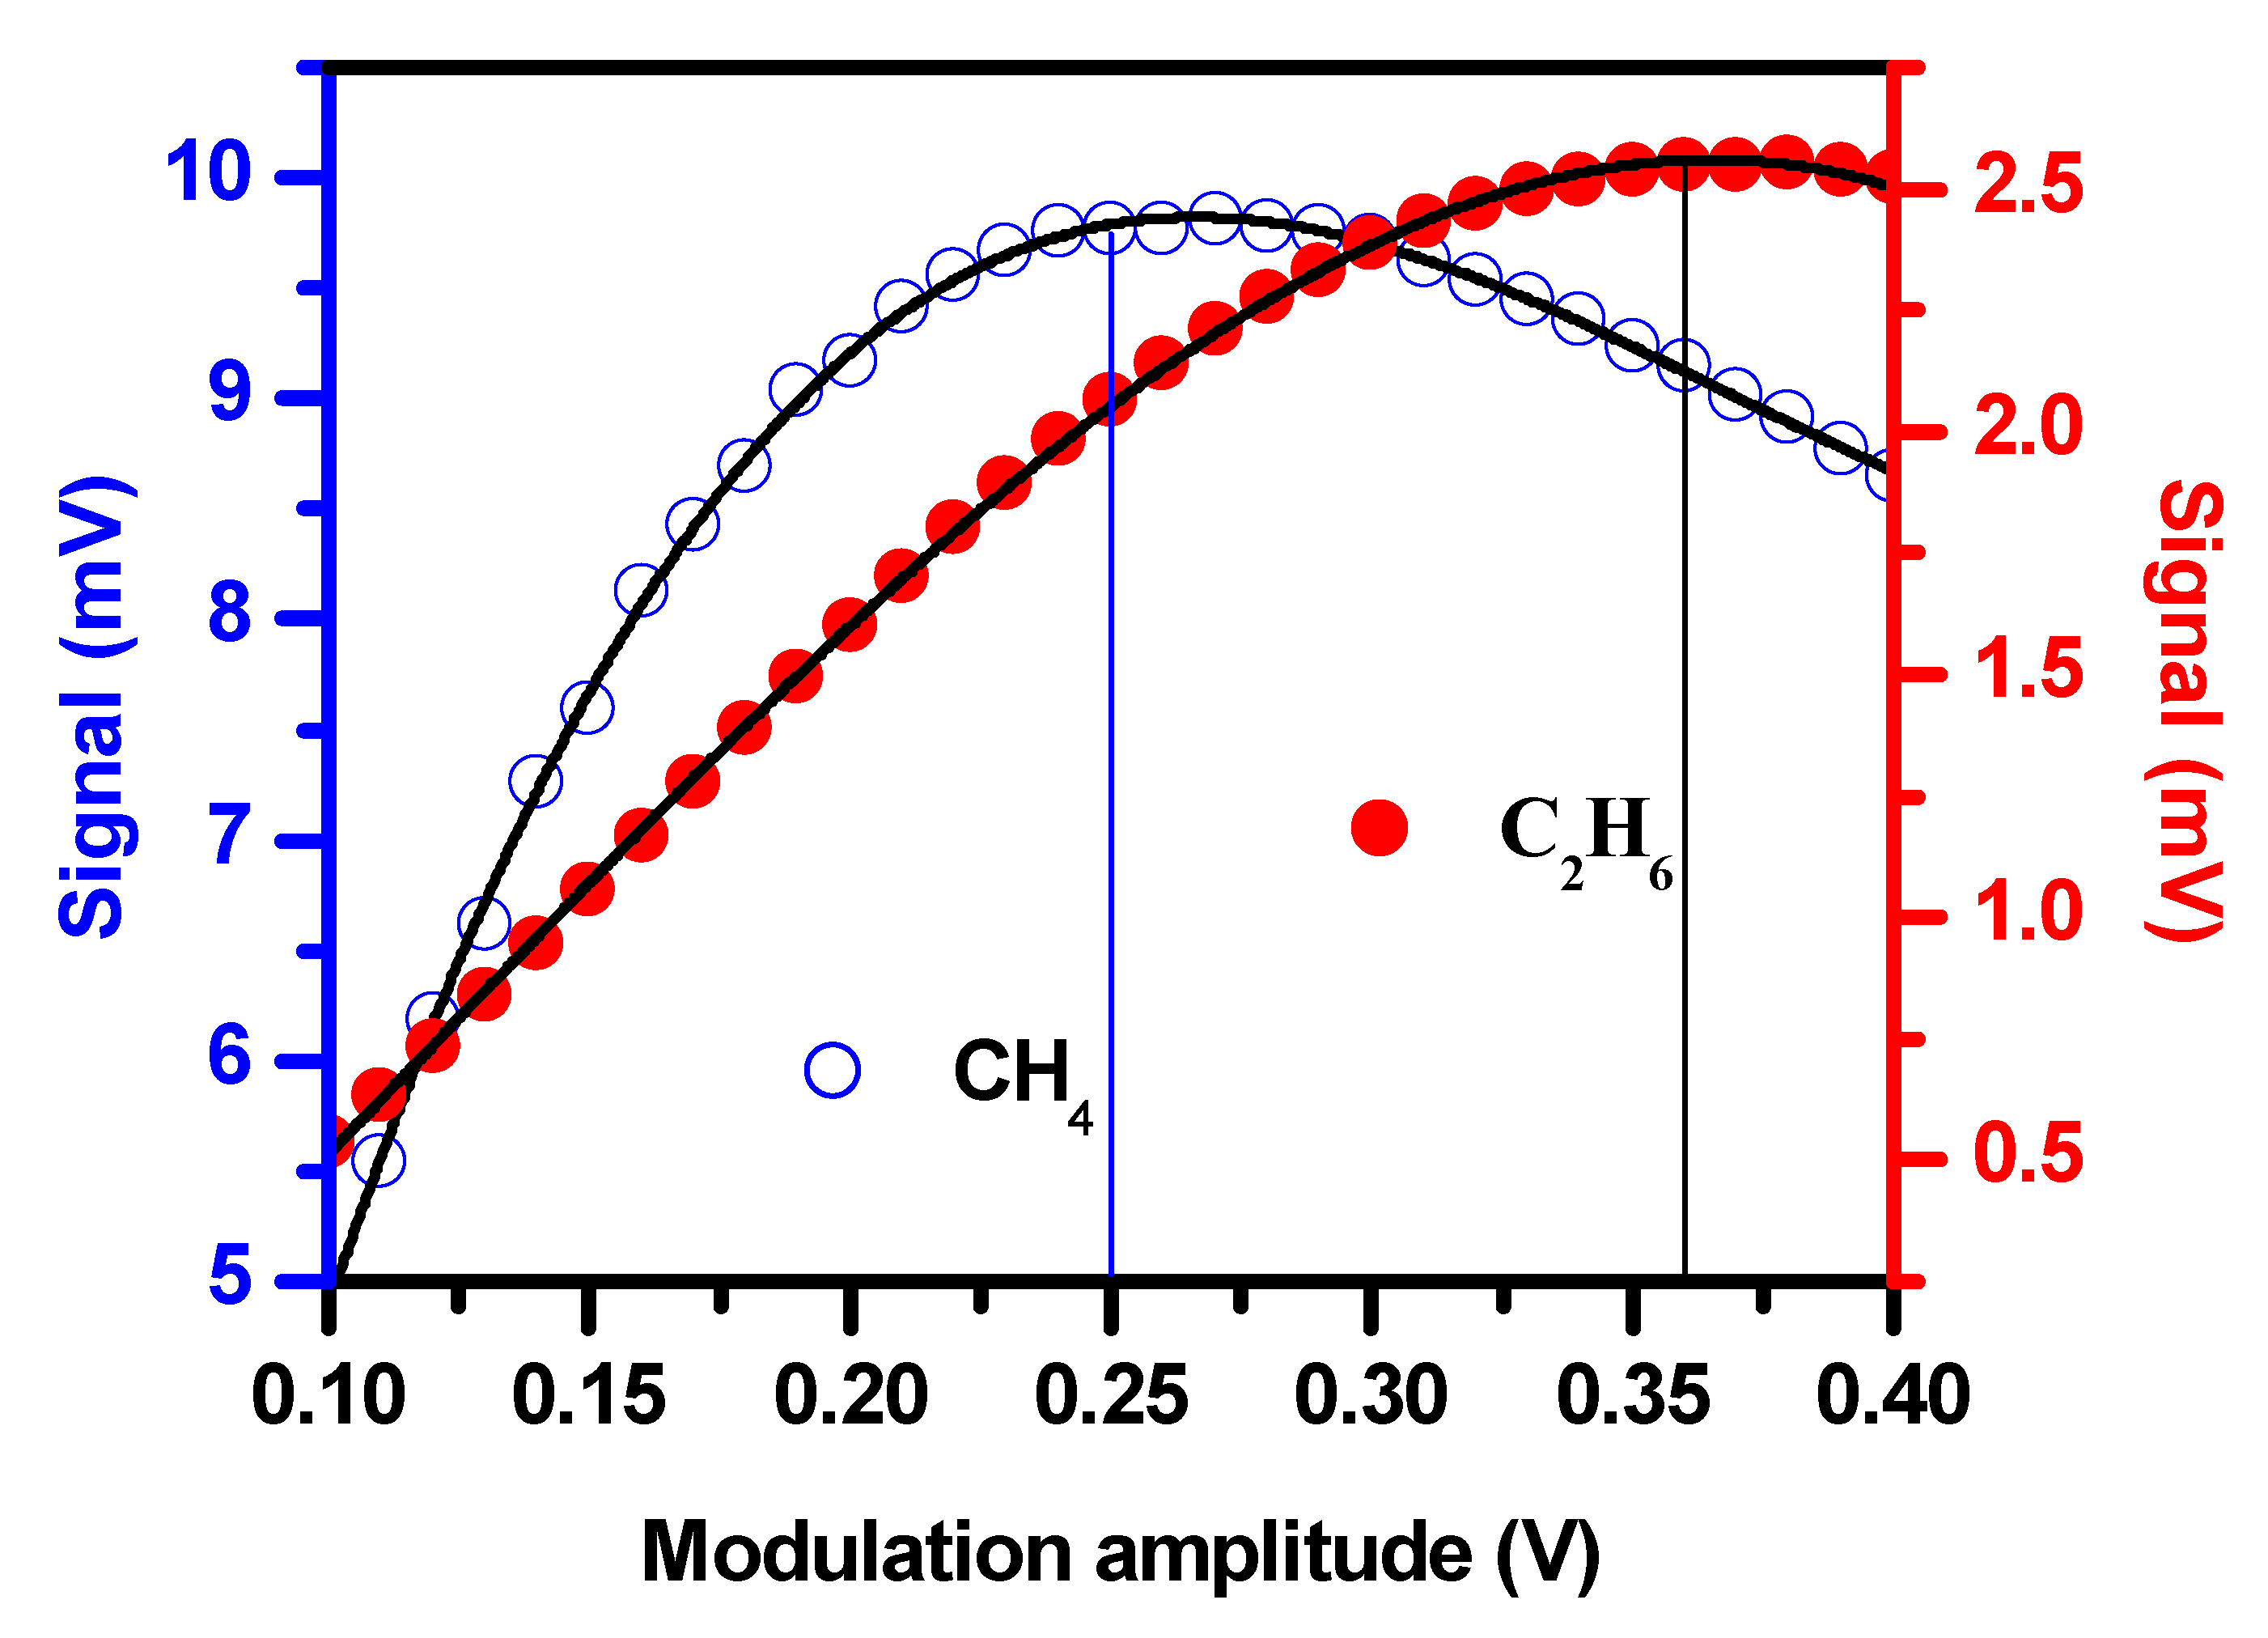
4.1. Optimization of Modulation Amplitude for WMS

In WMS, the second harmonic (2f) signal amplitude depends on the modulation amplitude [30]. In order to obtain optimal modulation amplitude for maximum second harmonic signals, a mixture of 200 ppm CH4 and 300 ppm C2H6 in nitrogen was prepared using a gas diluter (Environics SERIES 4000) and then filled in the multipass cell at 1 atm. The 2f signals of 200 ppm CH4 and 300 ppm C2H6 at different modulation amplitudes were investigated. The measured results of the 2f signals versus the modulation amplitudes are shown in Figure 5. As can be seen, the optimal modulation amplitude was 0.25 V for CH4 and 0.36 V for C2H6. The optimal modulation amplitude of the sine wave for CH4 detection was found to be 0.25 V, and the corresponding laser wavelength modulation amplitude was Δνm ≈ 0.2921 cm−1. According to the HITRAN database, the 200 ppm CH4 line width (HWHM) of the targeted absorption lines was ΔνD ≈ 0.1316 cm−1. The optimal modulation amplitude Δνm ≈ 2.22 ΔνD for wavelength modulation with second harmonic demodulation was basically consistent with the theoretical result Δνm = 2.2 ΔνD [25,26].

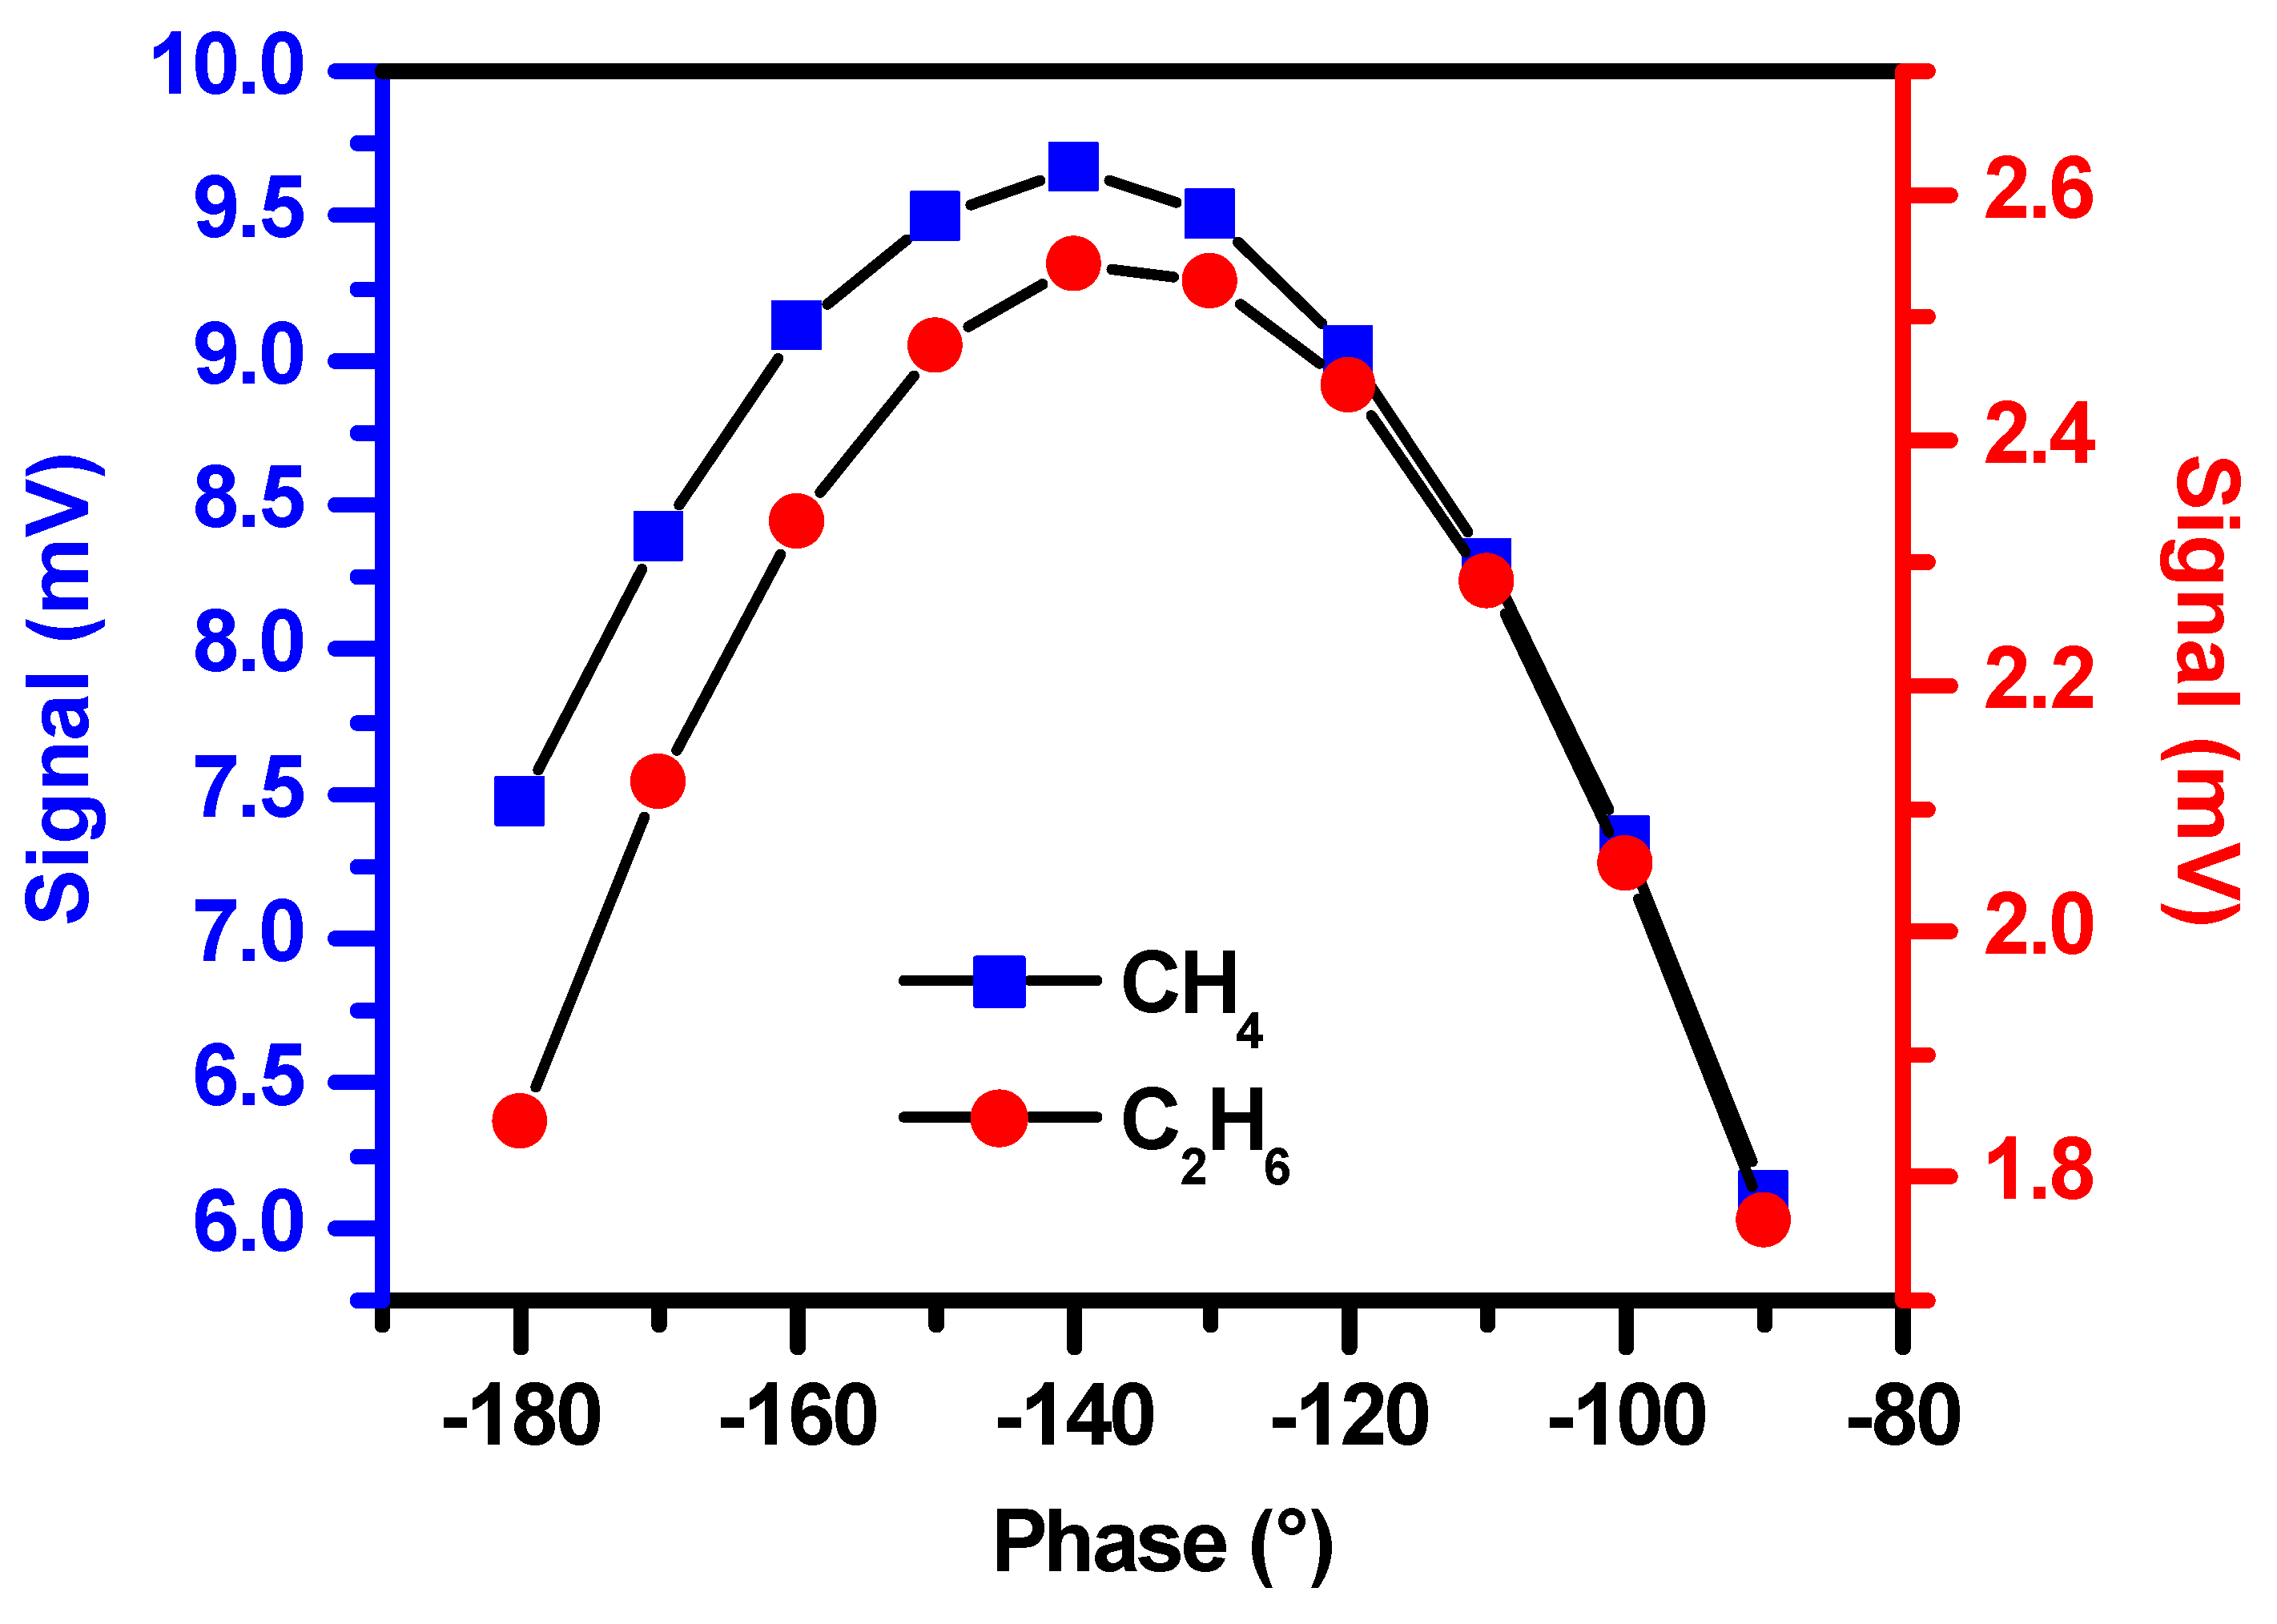
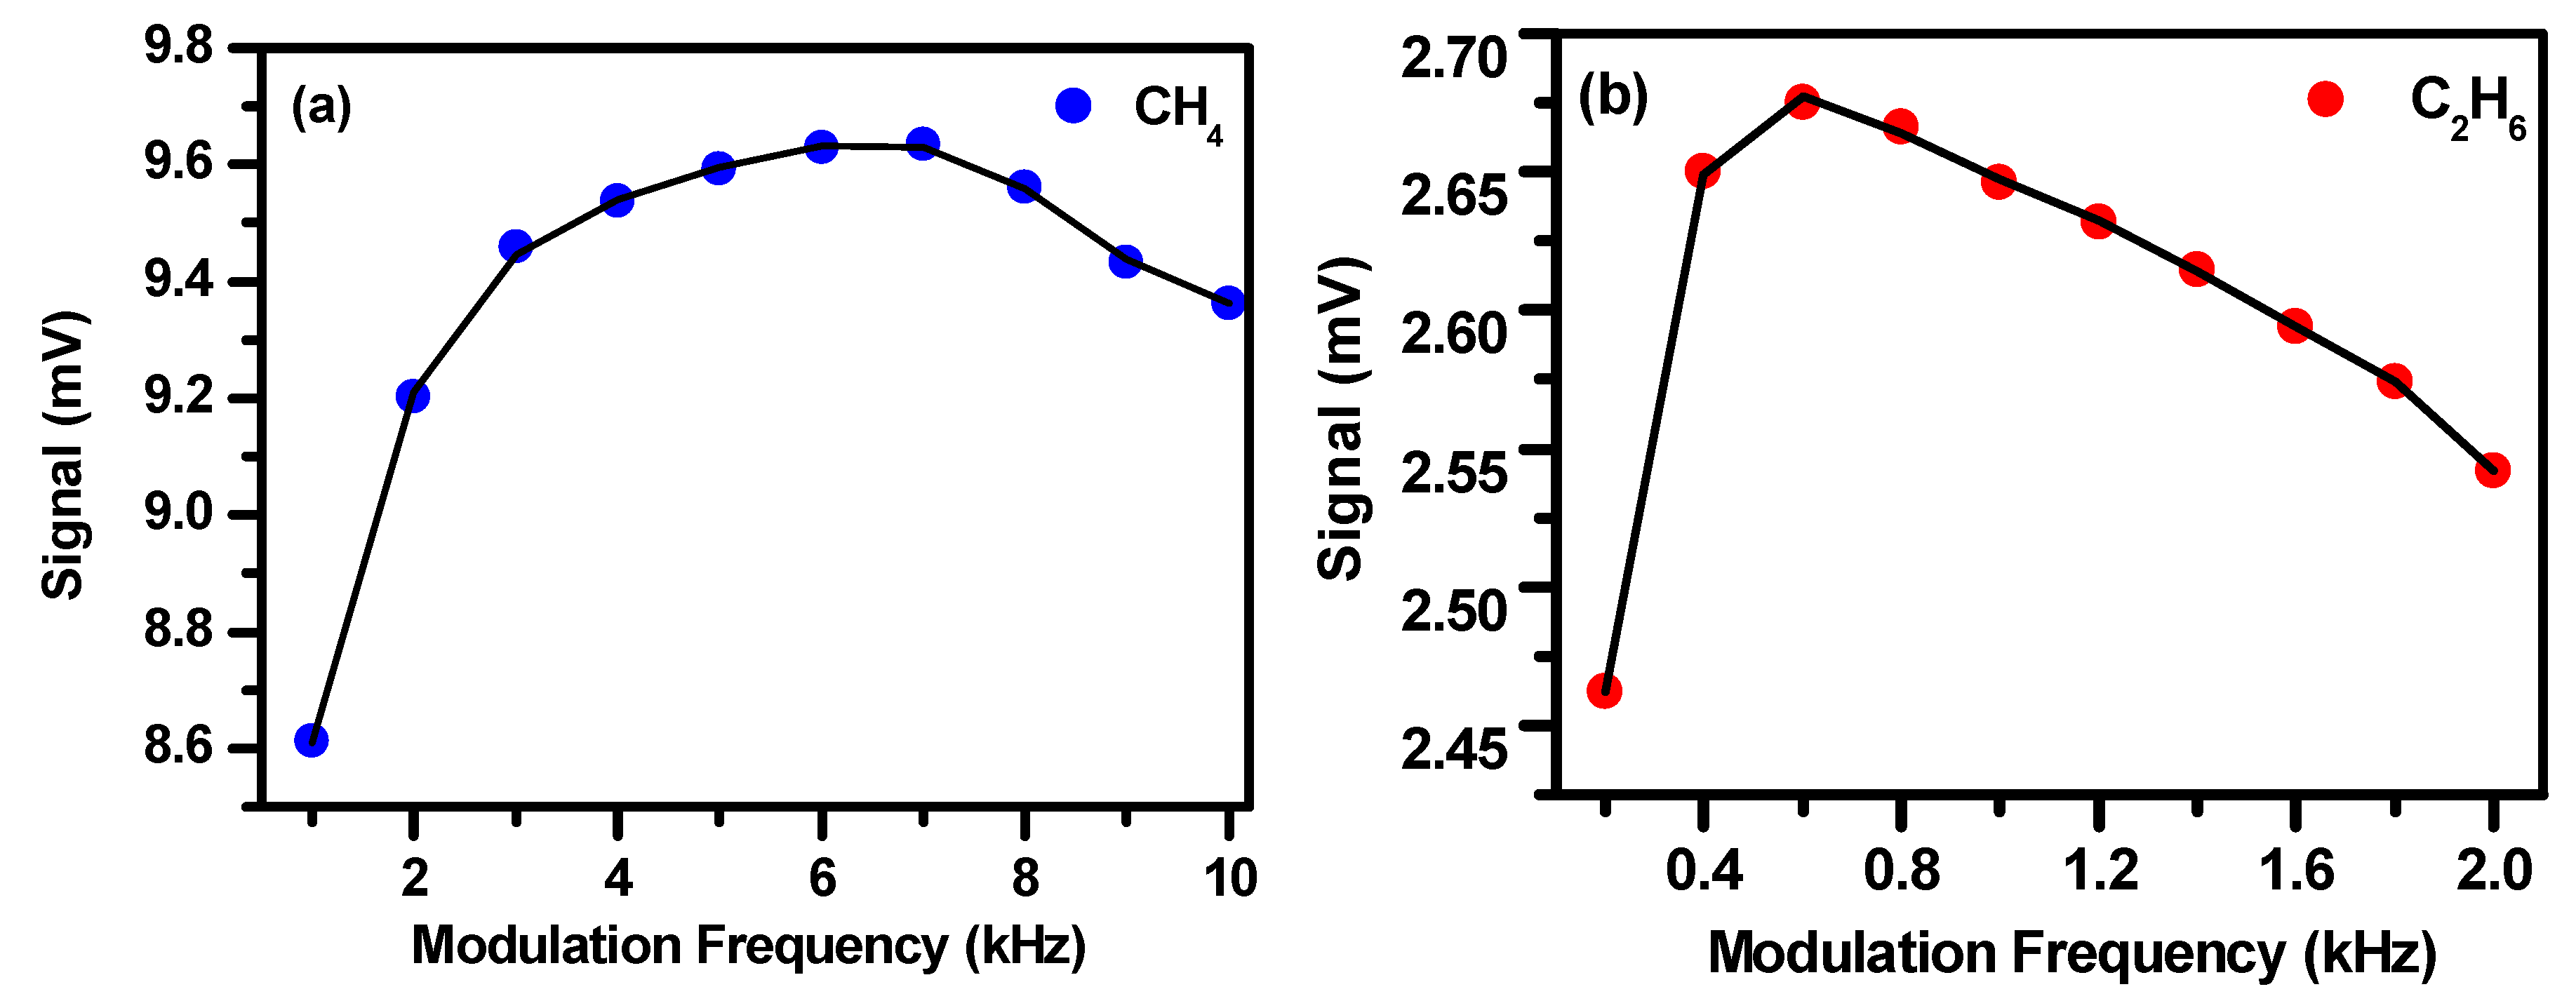
4.2. Optimization of Modulation Frequency and Phase for WMS

In addition to the modulation amplitude, the modulation frequency and phase may also affect the amplitude of the second harmonic signal [31,32]. Under the condition of the optimal modulation amplitude, the effects of the modulation frequency and phase on the second harmonic signal amplitude were investigated, experimentally. Figure 6 shows the phase effect and Figure 7 shows the modulation frequency effect. The optimal phase was found to be −140° for both CH4 and C2H6 detections. The optimal modulation frequency was 6 kHz for CH4 detection and 0.6 kHz for C2H6 detection.

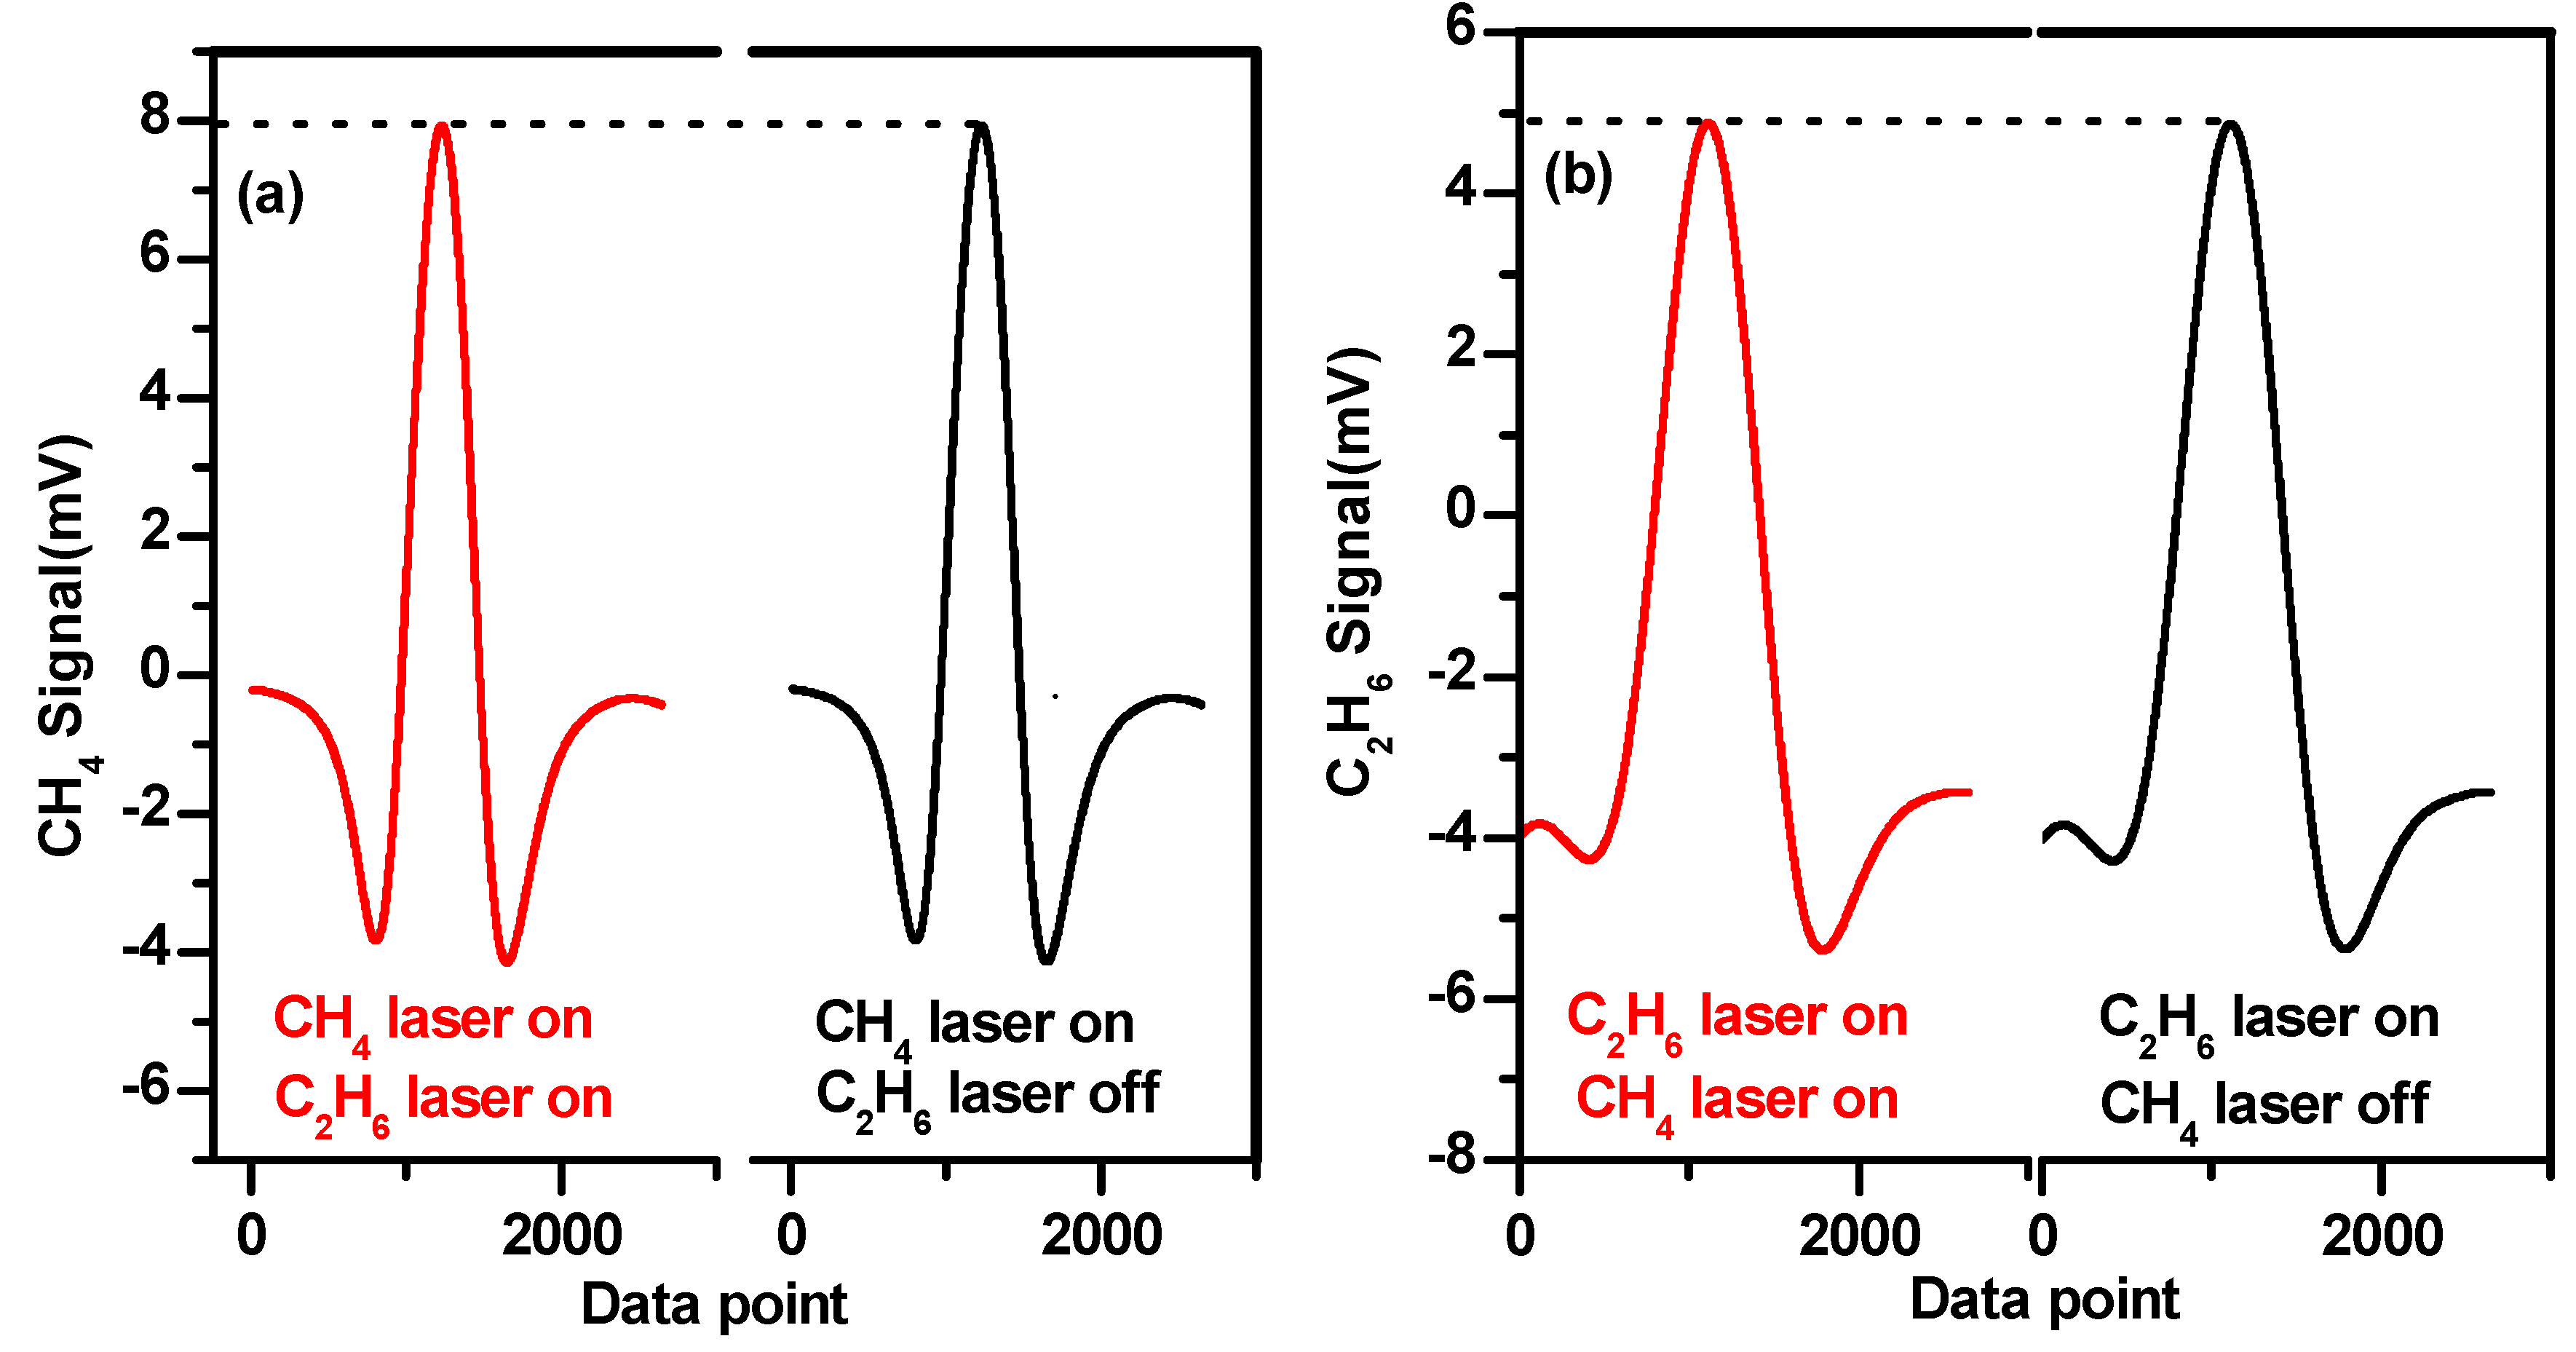
4.3. Investigation on the Potential Cross-Talk

Two lasers operating at different wavelengths were injected into the same absorption cell. It might cause cross-talk effects between two signals if the selection of the modulation frequencies is not appropriate [33]. For example, cross-talk occurs when modulation frequencies are fixed at 6 kHz for CH4 and at 5.8 kHz for C2H6 detection, as shown in Figure 8. The cross-talk effect was determined by the low-pass filter of the lock-in amplifier. The amplitude of the sinuous residual was determined by the stopband edge and the response of the filter.
Figure 9 shows the experimental study of the cross-talk effects in the simultaneous detection of CH4 (190 ppmv) and C2H6 (170 ppmv). In order to verify that there is no cross-talk between two signal channels, two lasers work simultaneously under wavelength modulation at their specific optimal modulation frequencies, i.e., 6 kHz for CH4 and 0.6 kHz for C2H6. Figure 9a plots the second harmonic signals of CH4 with and without the operation of the laser for C2H6 detection. The amplitude of the CH4 signal was 7.931 mV when the two lasers were on. When the C2H6 laser was turned off, the amplitude of the CH4 signal was 7.926 mV. The difference between the peak heights of the CH4 second harmonic signals was about 0.06%. Figure 9b compares the case for C2H6 detection. The amplitude of the C2H6 signal was 4.873 mV when the two lasers worked together. When the CH4 laser was turned off, the amplitude of the C2H6 signal was 4.865 mV. The deviation between the peak heights of C2H6 second harmonic signals was 0.16%. It can be concluded that the cross-talk effects can be ignored when the two lasers are both operational at their specific optimal modulation frequency in the present work.
The optimal parameters used for the present work are listed in Table 1 and are the default values in the subsequent experimental measurements.

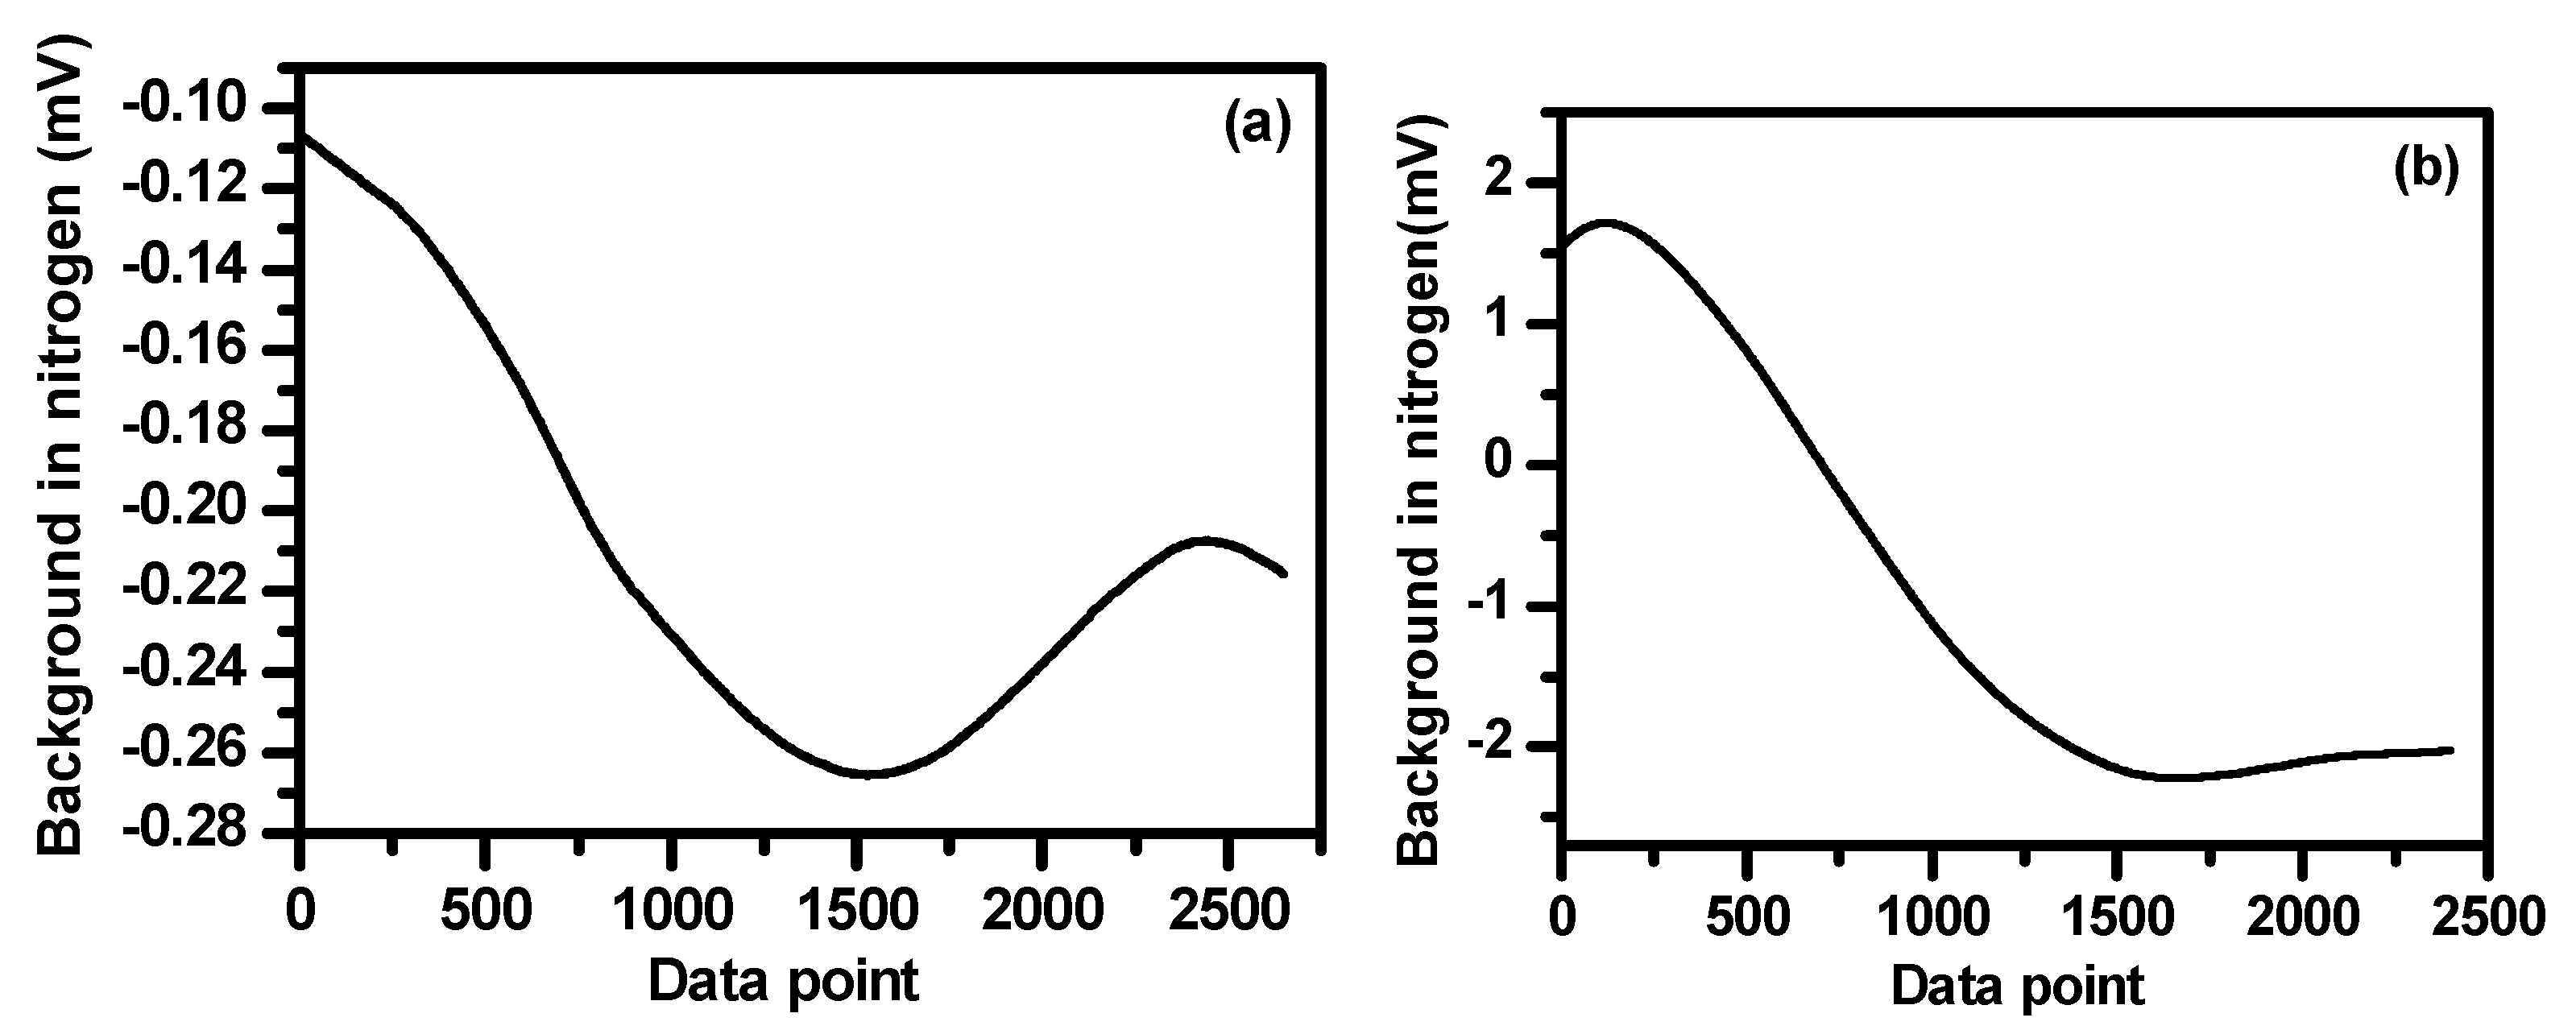
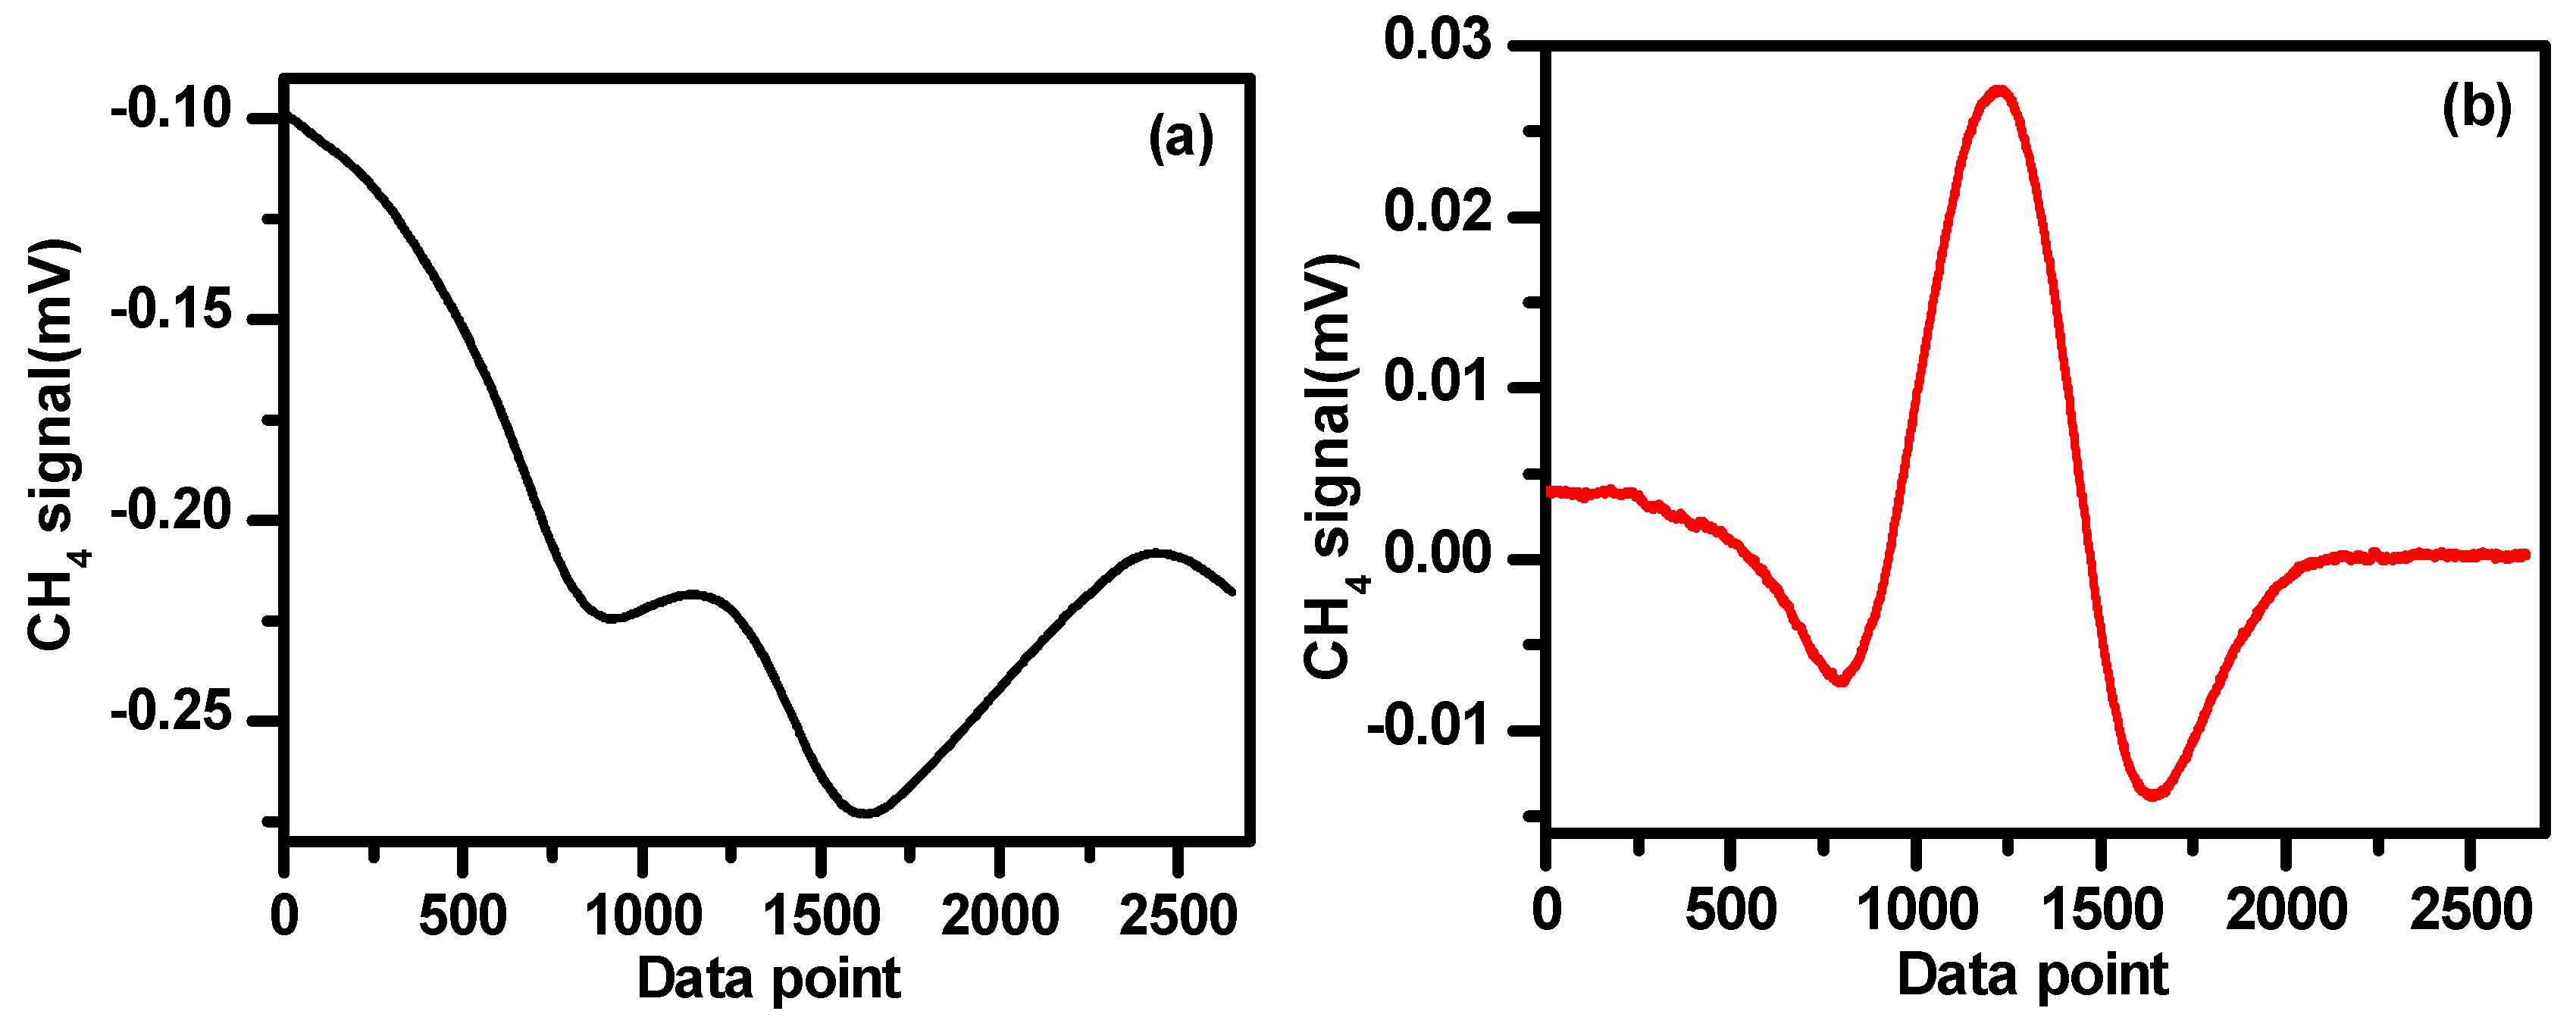
4.4. Baseline Removal

Using WMS could significantly reduce the 1/f noise. However, when the baseline is not a “linear” ramp, the derivation cannot remove such “curve shape” baseline [27]. In the present work, the baseline of the sensor was investigated using high purity (99.99%) nitrogen (N2) filled in the multipass cell. The N2 background baselines were measured in the CH4 and C2H6 channels as shown in Figure 10a,b, respectively. In the present work, the 2f signals of CH4 and C2H6 were obtained by subtracting the N2 background baselines. As an example, Figure 11a shows a 0.6 ppm CH4 signal, obtained directly from the lock-in amplifier associated with the baseline. Figure 11b shows the 2f signal of 0.6 ppmv CH4 after subtracting the baseline shown in Figure 10a.
The standard reference gases of 492 ppmv CH4 and 500 ppmv C2H6 were mixed with high purity nitrogen to obtain a gas mixture with concentrations ranging from 10 ppmv to 100 ppmv. A gas dilution system (Model 4000, Environics Inc., Tolland, CT, USA) was used to make these mixtures. The second harmonic signals of CH4 and C2H6 at different concentrations and under normal atmospheric pressure are plotted in Figure 12a,b.
Based on the results shown in Figure 12a,b, the second harmonic amplitudes vs. different concentrations are plotted in Figure 13a,b for CH4 and C2H6, respectively. Good linear correlations are observed with a correlation coefficient of 99.97% for CH4 and 99.98% for C2H6, which can be used for calibration of the measured 2f signal amplitudes to their corresponding concentrations.

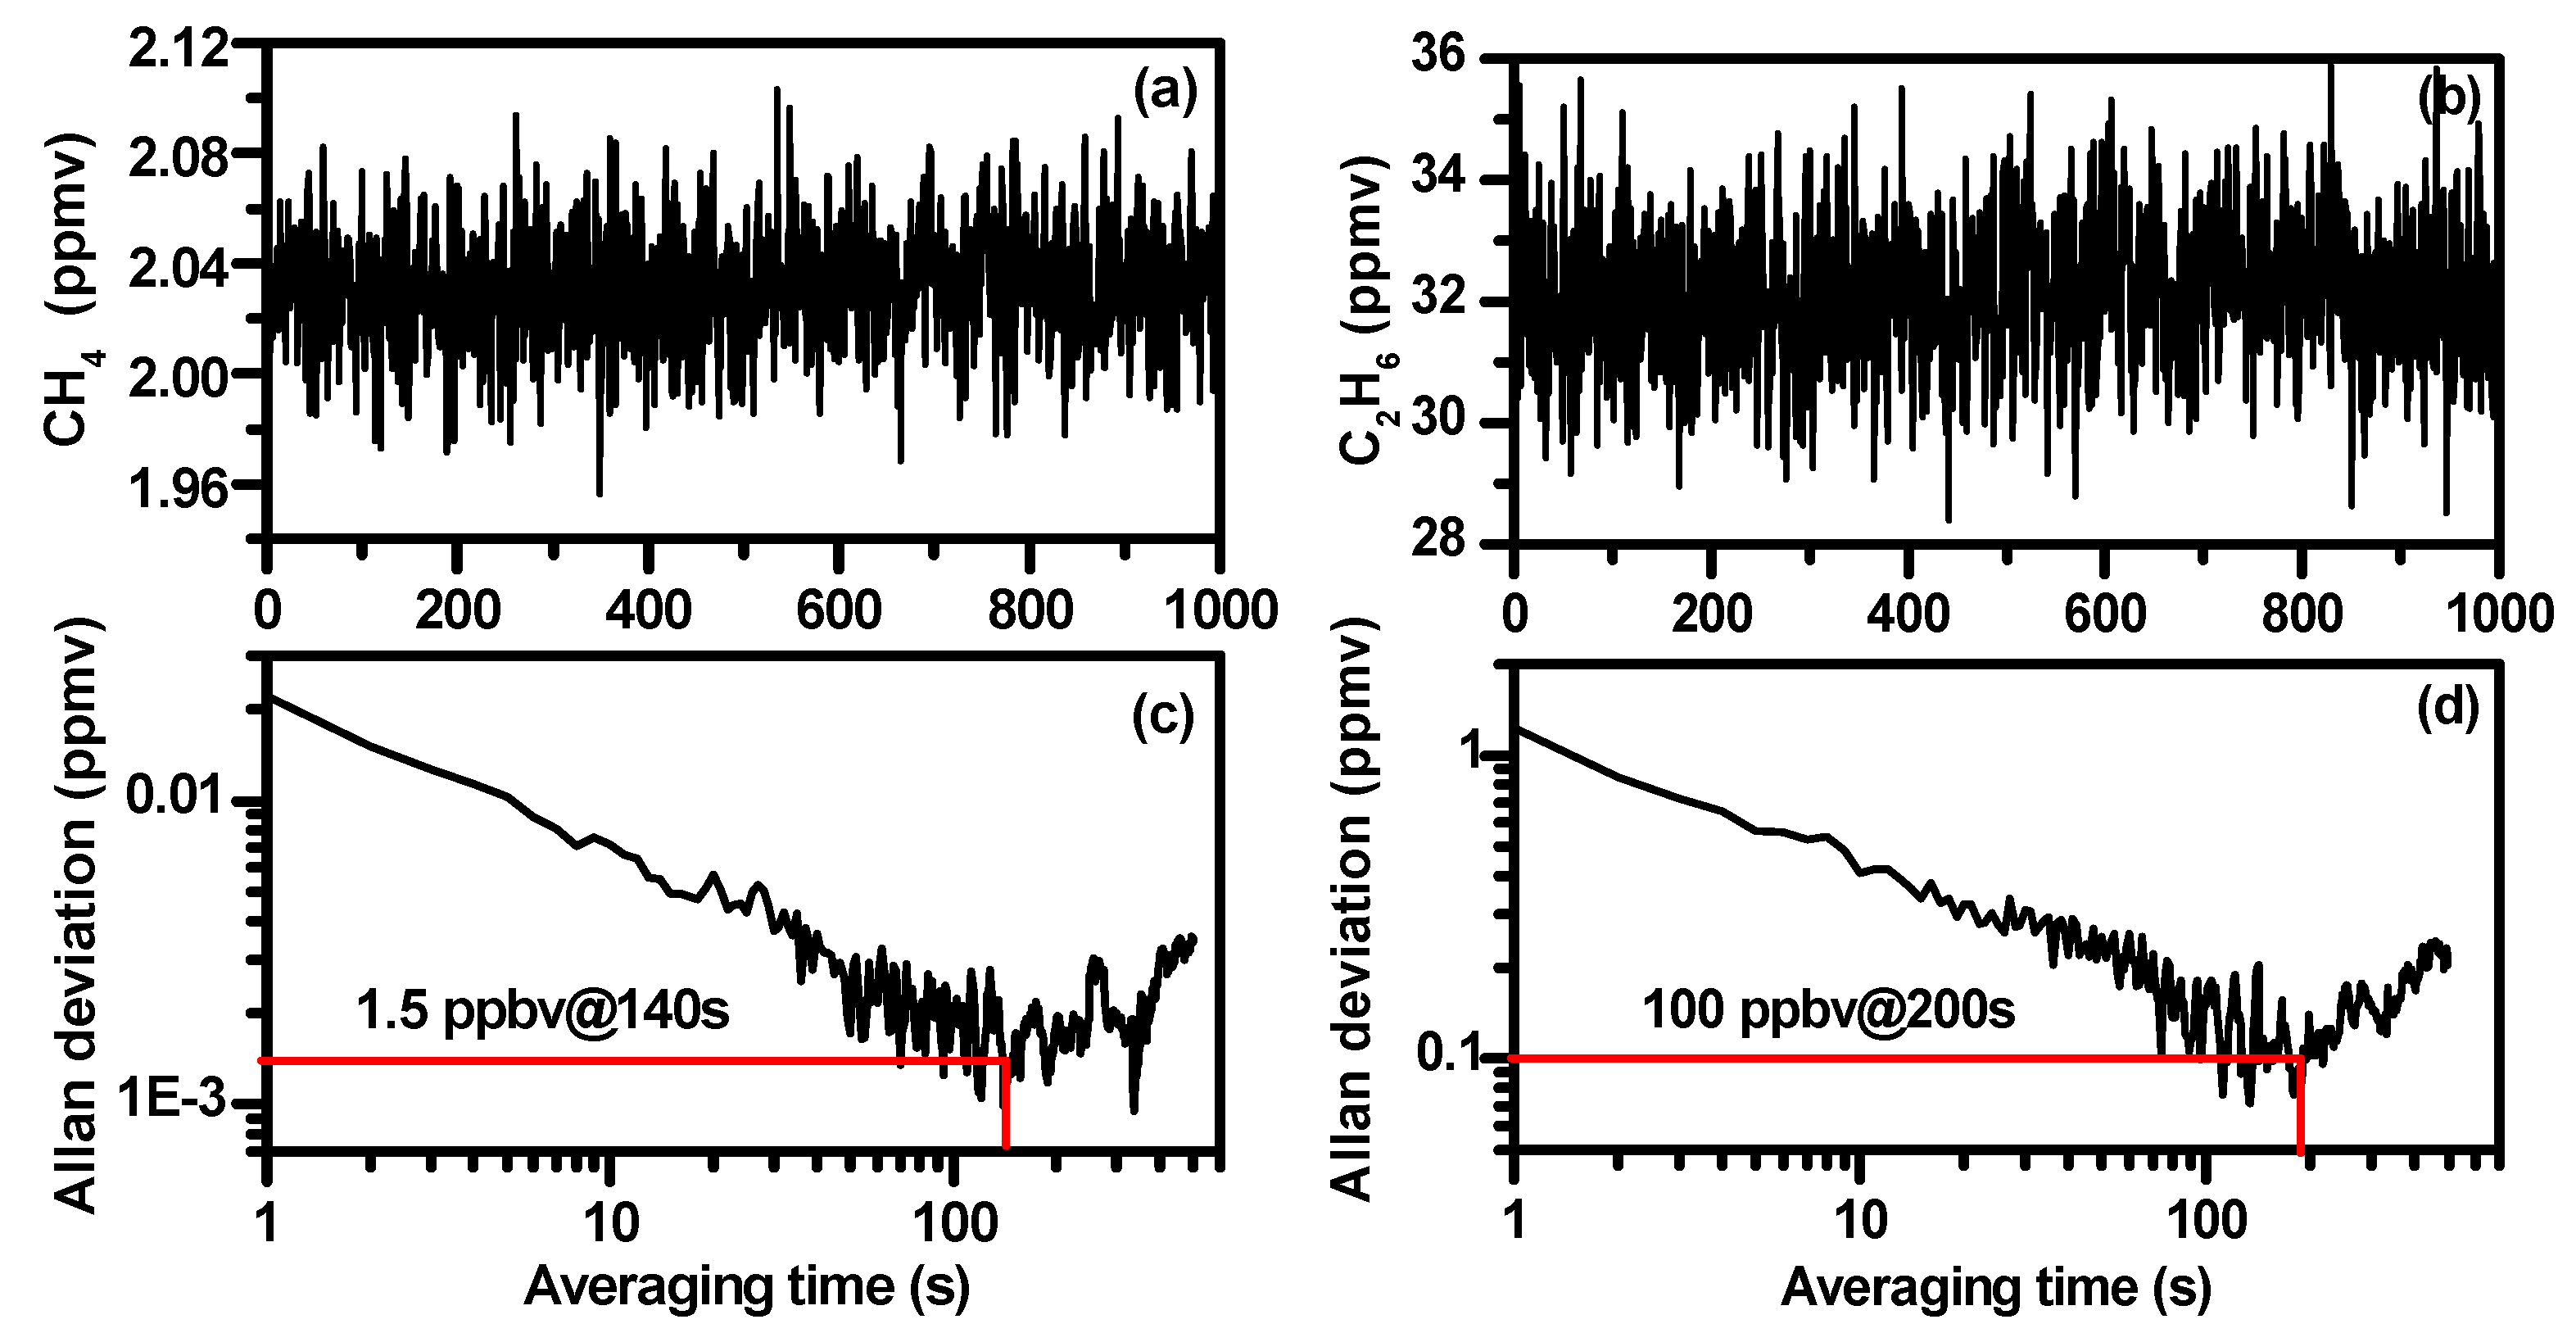
4.5. Allan Deviation

In order to determine the sensor stability and limit of detection (LoD), analyses of Allan variance were carried out. Figure 14a,b plot time series measurements of CH4 and C2H6 at a constant concentration of 2 ppmv and 32 ppmv diluted with the concentration 2.1 ppmv of CH4 and 500 ppmv of C2H6 standard gas, respectively. The corresponding Allan deviations as a function of the averaging time t are plotted in Figure 14c,d. Allan variance analysis shows that the measurement precision of the developed dual-gas sensor was ~20 ppbv for CH4 and 1.2 ppmv for C2H6 with an acquisition time of 1 s. A detection limit of 1.5 ppbv for CH4 could be achieved by averaging in 140 s and 100 ppbv could be achieved for C2H6 by averaging 200 s.

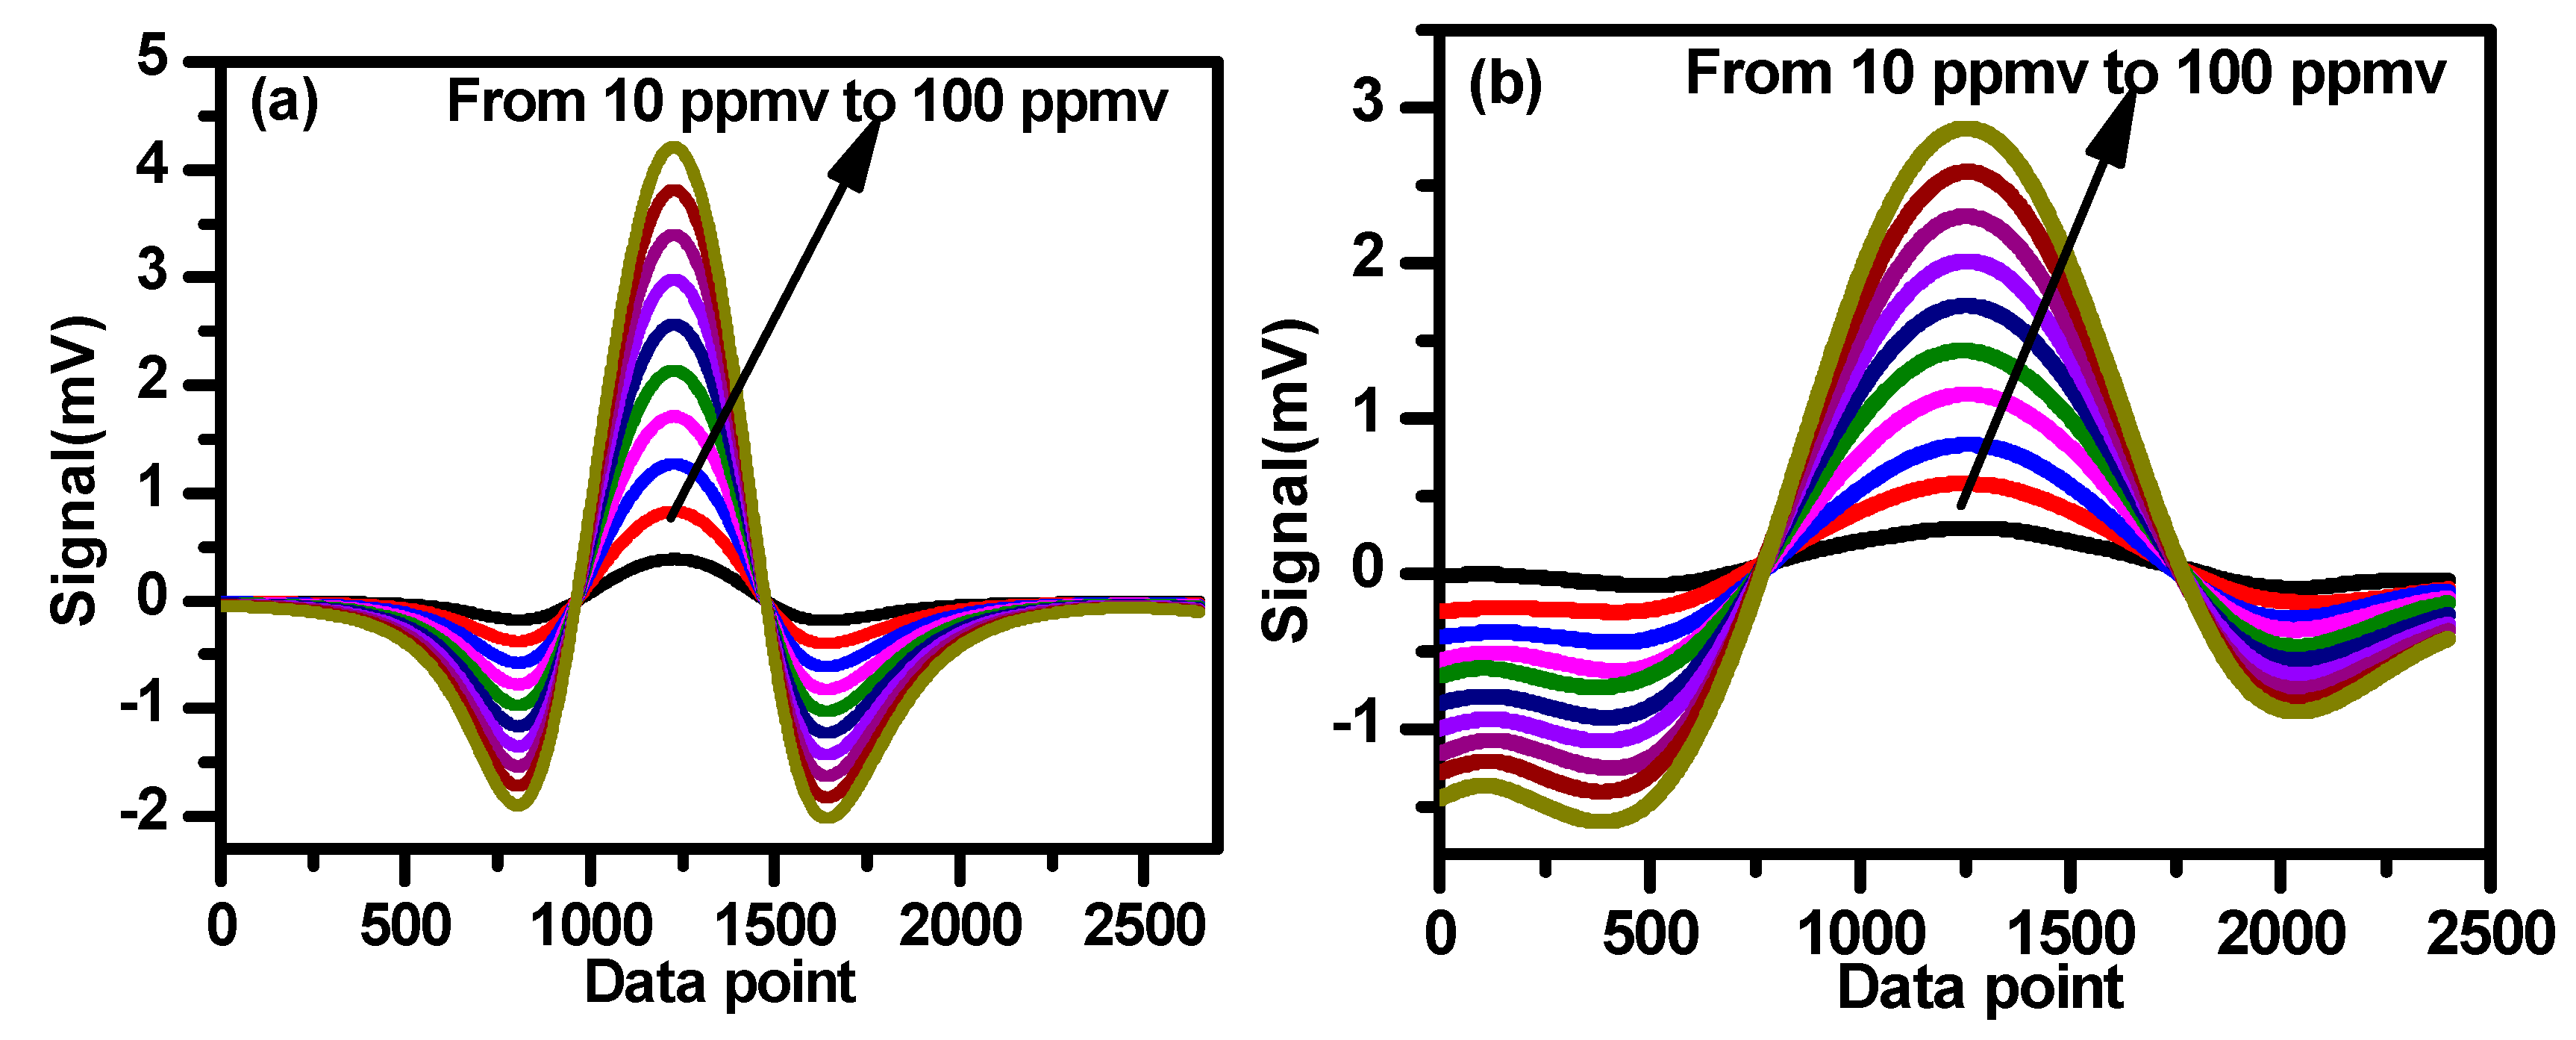
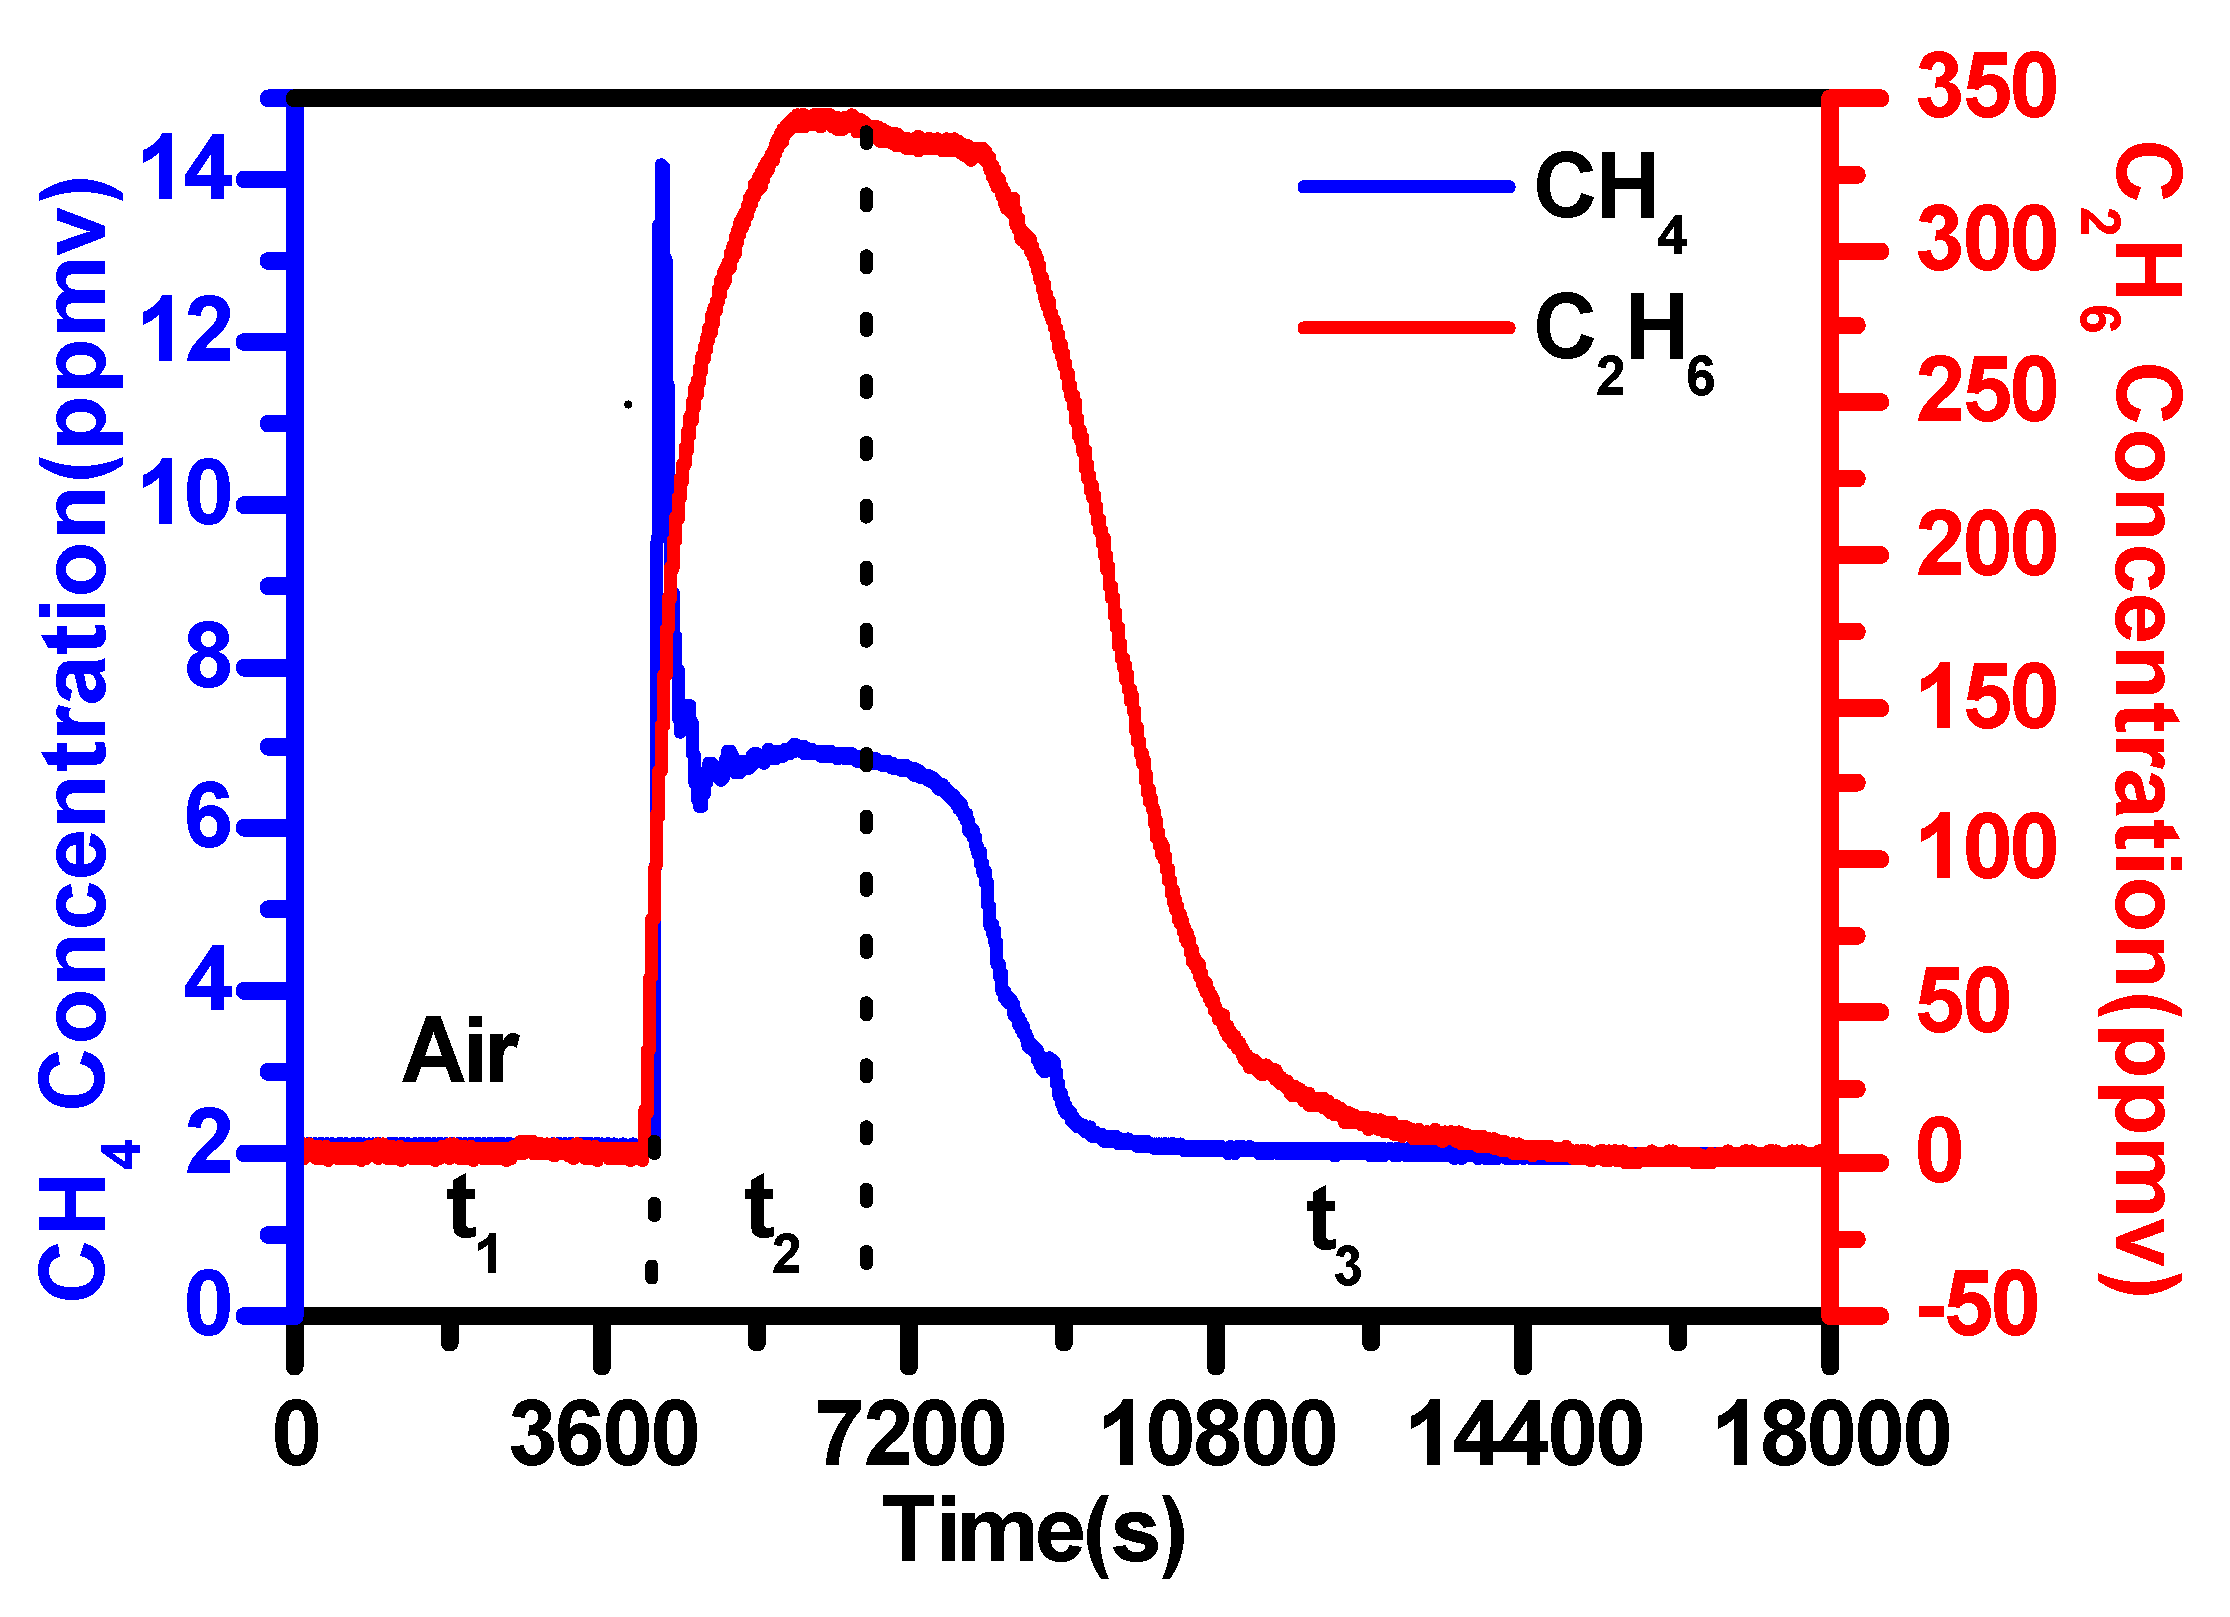
4.6. Simultaneous Detection of Methane and Ethane Leakage

The sensor performance was evaluated by simultaneous detection of methane and ethane leakage with the current locked at the absorption peak, respectively. The outside air was pumped into an airbag (60 cm × 80 cm) and then injected into the gas cell through a long sampling tube.
Based on the calibration curves shown in Figure 13, measured second signals of CH4 and C2H6 can be converted to their corresponding concentrations.
Time series measurements of the test are plotted in Figure 15. Methane and ethane in air were measured in the period of t1. The atmospheric CH4 concentration of about 2.1 ppmv was observed, while the C2H6 concentration in ambient air was lower than the detection limit of the current sensor and was not observed. CH4 and C2H6 were then added in the airbag and changes in the concentrations of CH4 and C2H6 were observed in the period of t2. The CH4 concentration varied from 2.1 to 14.1 ppmv and the C2H6 concentration varied from 0 to 344.7 ppmv. Subsequently, we stopped the “leakage” of CH4 / C2H6 and flushed only air into the absorption cell; the concentrations of CH4 and C2H6 returned to their atmospheric levels (t3).
It is worth noting that the minimum detection limit of the commercial PGC ethane analyzer (Schutz, German) is 10 ppmv. The present experimental results of simultaneous detection of methane and ethane demonstrate the real potential of the developed dual-gas sensor of CH4/C2H6 for use in leakage detection.

5. Conclusions and Outlook

In this paper, we demonstrated a compact dual-gas sensor for monitoring CH4 and C2H6 based on wavelength modulation spectroscopy coupled to a compact home-made dense-pattern multipass cell using a single photodetector. Detection limits were 1.5 ppbv for CH4 by averaging 140 s and 100 ppbv for C2H6 by averaging 200 s. The developed dual-gas sensor can be used to distinguish between natural gas and biogas, which has strong potential for gas sensing applications in natural gas pipeline leakage analysis.

Author Contributions

Conceptualization, X.T. and Y.C.; Methodology, X.T. and X.G.; Software, J.C. and G.W.; Validation, K.L. and X.G.; Formal Analysis, J.M. and W.C.; Investigation, K.L.; Resources, T.T. and X.G.; Writing-Original Draft Preparation, X.T.; Writing-Review & Editing, K.L. and W.C.

Funding

This research was funded by the National Key Research and Development Program of China (NO. 2017YFC0209700, No. 2016YFC0303900) and the National Natural Science Foundation of China (No. 61775221, 41730103). K. Liu thanks the program “Youth Innovation Promotion Association of Chinese Academy of Sciences (NO. 2015263)” for support.

Conflicts of Interest

The authors declare no conflict of interest.

References

  1. Baker, R.W.; Lokhandwala, K. Natural Gas Processing with Membranes: An Overview. Ind. Eng. Chem. Res. 2008, 47, 2109–2121. [Google Scholar] [CrossRef]
  2. Faramawy, S.; Zaki, T.; Sakr, A.E. Natural gas origin, composition, and processing: A review. J. Nat. Gas Sci. Eng. 2016, 34, 34–54. [Google Scholar] [CrossRef]
  3. Xiao, Y.; Logan, J.A.; Jacob, D.J.; Hudman, R.C.; Yantosca, R.; Blake, D.R. Global budget of ethane and regional constraints on U.S. sources. J. Geophys. Res. 2008, 113, D21306. [Google Scholar] [CrossRef]
  4. Moore, C.W.; Zielinska, B.; Pétron, G.; Jackson, R.B. Air impacts of increased natural gas acquisition, processing, and use: A critical review. Environ. Sci. Technol. 2014, 48, 8349–8359. [Google Scholar] [CrossRef] [PubMed]
  5. Effuggi, A.; Gelosa, D.; Derudi, M.; Rota, R. Mild Combustion of Methane-Derived Fuel Mixtures: Natural Gas and Biogas. Combust. Sci. Technol. 2008, 180, 481–493. [Google Scholar] [CrossRef]
  6. Abbasi, T.; Tauseef, S.M.; Abbasi, S.A. Anaerobic digestion for global warming control and energy generation—An overview. Renew. Sust. Energy Rev. 2012, 16, 3228–3242. [Google Scholar] [CrossRef]
  7. Dong, L.; Tittel, F.K.; Li, C.L.; Sanchez, N.P.; Wu, H.P.; Zheng, C.T.; Yu, Y.J.; Sampaolo, A.; Griffin, R.J. Compact TDLAS based sensor design using interband cascade lasers for mid-IR trace gas sensing. Opt. Express 2016, 24, A528–A535. [Google Scholar] [CrossRef]
  8. Jahjah, M.; Jiang, W.Z.; Sanchez, N.P.; Ren, W.; Patimisco, P.; Spagnolo, V.; Herndon, S.C.; Griffin, R.J.; Tittel, F.K. Atmospheric CH4 and N2O measurements near Greater Houston area landfills using a QCL-based QEPAS sensor system during DISCOVER-AQ 2013. Opt. Lett. 2014, 39, 957–960. [Google Scholar] [CrossRef]
  9. Wu, H.P.; Yin, X.K.; Dong, L.; Pei, K.L.; Sampaolo, A.; Patimisco, P.; Zheng, H.D.; Ma, W.G.; Zhang, L.; Yin, W.B.; et al. Simultaneous dual-gas QEPAS detection based on a fundamental and overtone combined vibration of quartz tuning fork. Appl. Phys. Lett. 2017, 110, 121104. [Google Scholar] [CrossRef] [Green Version]
  10. Sampaolo, A.; Csutak, S.; Patimisco, P.; Giglio, M.; Menduni, G.; Passaro, V.; Tittel, F.K.; Deffenbaugh, M.; Spagnolo, V. Methane, ethane and propane detection using a compact quartz enhanced photoacoustic sensor and a single interband cascade laser. Sens. Actuators B Chem. 2019, 282, 952–960. [Google Scholar] [CrossRef]
  11. Parameswaran, K.R.; Rosen, D.I.; Allen, M.G.; Ganz, A.M.; Risby, T.H. Off-axis integrated cavity output spectroscopy with a mid-infrared interband cascade laser for real-time breath ethane measurements. Appl. Opt. 2009, 48, 73–79. [Google Scholar] [CrossRef]
  12. Chang, H.T.; Chang, J.; Wang, P.P.; Zhu, C.G. Comparison of preprocessing technique of second harmonic detection with tunable diode laser. Opt. Quant. Electron. 2016, 48, 211. [Google Scholar] [CrossRef]
  13. Reid, J.; Labrie, D. Second-harmonic detection with tunable diode lasers—Comparison of experiment and theory. Appl. Phys. B 1981, 26, 203–210. [Google Scholar] [CrossRef]
  14. Krzempek, K.; Jahjah, M.; Lewicki, R.; Stefański, P.; So, S.; Thomazy, D.; Tittel, F.K. CW DFB RT diode laser-based sensor for trace-gas detection of ethane using a novel compact multipass gas absorption cell. Appl. Phys. B 2013, 112, 461–465. [Google Scholar] [CrossRef]
  15. Zheng, C.T.; Ye, W.L.; Sanchez, N.P.; Gluszek, A.K.; Hudzikowski, A.J.; Li, C.G.; Dong, L.; Griffin, R.J.; Tittel, F.K. Infrared Dual-Gas CH4/C2H6 Sensor Using Two Continuous-Wave Interband Cascade Lasers. IEEE Photonic Tech. Lett. 2016, 28, 2351–2354. [Google Scholar] [CrossRef]
  16. Li, C.G.; Zheng, C.T.; Dong, L.; Ye, W.L.; Tittel, F.K.; Wang, Y.D. Ppb-level mid-infrared ethane detection based on three measurement schemes using a 3.34-μm continuous-wave interband cascade laser. Appl. Phys. B 2016, 122, 1–13. [Google Scholar] [CrossRef]
  17. Reed, Z.D.; Hodges, J.T. Self- and air-broadened cross sections of ethane (C2H6) determined by frequency-stabilized cavity ring-down spectroscopy near 1.68 µm. J. Quant. Spectrosc. Radiat. Transfer. 2015, 159, 87–93. [Google Scholar] [CrossRef]
  18. Hepp, M.; Herman, M. Research note vibration-rotation bands in ethane. Mol. Phys. 2000, 98, 57–61. [Google Scholar] [CrossRef]
  19. Xia, H.; Liu, W.Q.; Zhang, Y.Z.; Kan, R.F.; Wang, M.; He, Y.; Cui, Y.B.; Ruan, J.; Geng, H. An approach of open-path gas sensor based on tunable diode laser absorption spectroscopy. Chin. Opt. Lett. 2008, 6, 437–440. [Google Scholar] [CrossRef]
  20. Liu, K.; Wang, L.; Tan, T.; Wang, G.S.; Zhang, W.J.; Chen, W.D.; Gao, X.M. Highly sensitive detection of methane by near-infrared laser absorption spectroscopy using a compact dense-pattern multipass cell. Sens. Actuators B Chem. 2015, 220, 1000–1005. [Google Scholar] [CrossRef] [Green Version]
  21. Li, C.L.; Wu, Y.F.; Qiu, X.B.; Deng, L.H. Pressure-Dependent Detection of Carbon Monoxide Employing Wavelength Modulation Spectroscopy Using a Herriott-Type Cell. Appl. Spectrosc. 2017, 71, 809–816. [Google Scholar] [CrossRef]
  22. Philippe, L.C.; Hanson, R.K. Laser diode wavelength-modulation spectroscopy for simultaneous measurement of temperature, pressure, and velocity in shock-heated oxygen flows. Appl. Opt. 1993, 32, 6090–6103. [Google Scholar] [CrossRef] [PubMed]
  23. Li, J.; Parchatka, U.; Fischer, H. Development of field-deployable QCL sensor for simultaneous detection of ambient N2O and CO. Sens. Actuators B-Chem. 2013, 182, 659–667. [Google Scholar] [CrossRef]
  24. Wei, W.; Chang, J.; Wang, Q.; Qin, Z. Modulation Index Adjustment for Recovery of Pure Wavelength Modulation Spectroscopy Second Harmonic Signal Waveforms. Sensors 2017, 17, 163. [Google Scholar] [CrossRef] [PubMed]
  25. Arndt, R. Analytical Line Shapes for Lorentzian Signals Broadened by Modulation. J. Appl. Phys. 1965, 36, 2522–2524. [Google Scholar] [CrossRef]
  26. Chen, J.; Hangauer, A.; Strzoda, R.; Amann, M.C. Laser spectroscopic oxygen sensor using diffuse reflector based optical cell and advanced signal processing. Appl. Phys. B 2010, 100, 417–425. [Google Scholar] [CrossRef] [Green Version]
  27. Kluczynski, P.; Lindberg, A.M.; Axner, O. Background signals in wavelength-modulation spectrometry by use of frequency-doubled diode-laser light. II. Experiment. Appl. Opt. 2001, 40, 794–805. [Google Scholar] [CrossRef]
  28. Smith, L.G. The infrared spectrum of C2H6. J. Chem. Phys. 1949, 17, 139–167. [Google Scholar] [CrossRef]
  29. Cheng, G.; Cao, Y.; Liu, K.; Zhu, G.D.; Wang, G.S.; Gao, X.M. Photoacoustic Measurement of Ethane with Near-Infrared DFB Diode Laser. J. Spectrosc. 2018, 2018, 1–5. [Google Scholar] [CrossRef]
  30. Schilt, S.; Thévenaz, L. Experimental method based on wavelength-modulation spectroscopy for the characterization of semiconductor lasers under direct modulation. Appl. Opt. 2004, 43, 4446–4453. [Google Scholar] [CrossRef] [Green Version]
  31. Schilt, S.; Thévenaz, L.; Robert, P. Wavelength modulation spectroscopy: Combined frequency and intensity laser modulation. Appl. Opt. 2003, 42, 6728–6738. [Google Scholar] [CrossRef]
  32. Peng, Z.M.; Ding, Y.J.; Jia, J.W.; Lan, L.J.; Du, Y.J.; Li, Z. First harmonic with wavelength modulation spectroscopy to measure integrated absorbance under low absorption. Opt. Express 2013, 21, 23724–23735. [Google Scholar] [CrossRef]
  33. Oh, D.B.; Paige, M.E.; Bomse, D.S. Frequency Modulation Multiplexing for Simultaneous Detection of Multiple Gases by use of Wavelength Modulation Spectroscopy with Diode Lasers. Appl. Opt. 1998, 37, 2499–2501. [Google Scholar] [CrossRef]
Figure 1. Schematic diagram of the dual-gas sensor. Laser #1 and #2: lasers for CH4/C2H6; DWBC: single mode standard coupler; CL: collimator; FL: focusing lens; IGA: InGaAs detector.
Sensors 19 00820 g001
Figure 2. Photograph of the dual-gas sensor associated with a beam pattern (shown with a red laser) on one mirror of a home-made dense-pattern multipass cell.
Sensors 19 00820 g002
Figure 3. Absorption spectrum of ethane near 5937.3 cm−1. Left axis: laser current (vs. laser frequency); Right axis: absorbance of ethane in the tuning wavelength range.
Sensors 19 00820 g003
Figure 4. Absorption spectrum of methane near 6046.95 cm−1. Left axis: laser current (vs. laser frequency); Right axis: absorbance of the methane absorption line.
Sensors 19 00820 g004
Figure 5. The 2f signals of CH4 and C2H6 vs. the modulation voltage amplitude.
Sensors 19 00820 g005
Figure 6. The 2f signal amplitudes of CH4 and C2H6 vs. modulation phase.
Sensors 19 00820 g006
Figure 7. The 2f signal amplitudes vs. modulation frequencies for CH4 (a) and C2H6 (b).
Sensors 19 00820 g007
Figure 8. Second harmonic signals of CH4 modulated at 6 kHz (a) and C2H6 modulated at 5.8 kHz (b) showing cross-talk induced interference fringes superimposed on the second harmonic signal.
Sensors 19 00820 g008
Figure 9. Comparison of the second harmonic signal amplitudes with two lasers on and only one laser on. (a) Methane detection and (b) ethane detection.
Sensors 19 00820 g009
Figure 10. Baselines of nitrogen measured in the methane (a) and ethane (b) channels.
Sensors 19 00820 g010
Figure 11. (a) 2f signal of 0.6 ppmv CH4 associated with baseline and (b) 2f signal of 0.6 ppmv CH4 after subtracting the baseline.
Sensors 19 00820 g011
Figure 12. Second harmonic signals of CH4 (a) and C2H6 (b) at different concentrations ranging from 10 ppmv to 100 ppmv.
Sensors 19 00820 g012
Figure 13. 2f signal amplitudes vs. gas concentrations of CH4 (a) and C2H6 (b).
Sensors 19 00820 g013
Figure 14. Time series measurements of CH4 (a) and C2H6 (b). Allan deviation plots for the CH4 (c) and the C2H6 (d) measurements.
Sensors 19 00820 g014
Figure 15. Simultaneous detection of methane and ethane “leakage”.
Sensors 19 00820 g015
Table 1. Optimal modulation amplitude, phase, and frequency of CH4 and C2H6.
Target GasOptimal Modulation AmplitudeOptimal Modulation PhaseOptimal Modulation Frequency
CH40.25 V−140°6 kHz
C2H60.36 V−140°0.6 kHz

