
Comparison of GEDI LiDAR Data Capability for Forest Canopy Height Estimation over Broadleaf and Needleleaf Forests

1
CIRAD, CNRS, INRAE, TETIS, University of Montpellier, AgroParisTech, CEDEX 5, 34093 Montpellier, France
2
Kayrros SAS, 75009 Paris, France
3
Laboratoire des Sciences du Climat et de l’Environnement, LSCE/IPSL, CEA-CNRS9 UVSQ, Université Paris-Saclay, 91191 Gif-sur-Yvette, France
*
Author to whom correspondence should be addressed.
Remote Sens. 2023, 15(6), 1522; https://doi.org/10.3390/rs15061522
Submission received: 24 January 2023
/
Revised: 27 February 2023
/
Accepted: 7 March 2023
/
Published: 10 March 2023
Abstract
:The GEDI LiDAR system was specifically designed to detect vegetation structure and has proven to be a suitable tool for estimating forest biophysical parameters, especially canopy height, at a global scale. This study compares the GEDI relative height metric (RH100) over different forest types, especially deciduous broadleaf and evergreen coniferous located in Thuringia, Germany, to understand how the forest structural differences affect the GEDI height estimation. A canopy height model that was produced using digital terrain and surface models (DTM and DSM) derived from airborne laser scanning data is used as the reference data. Based on the result, GEDI canopy height over needleleaf forest is slightly more accurate (RMSE = 6.61 m) than that over broadleaf (RMSE = 8.30 m) and mixed (RMSE = 7.94 m) forest. Evaluation of the GEDI acquisition parameters shows that differences in beam type, sensitivity, and acquisition time do not significantly affect the accuracy of canopy heights, especially over needleleaf forests. Considering foliage condition impacts on canopy height estimation, the contrasting result is observed in the broadleaf and needleleaf forests. The GEDI dataset acquired during the winter when deciduous species shed their leaves (the so-called leaf-off dataset), outperforms the leaf-on dataset in the broadleaf forest but shows less accurate results for the needleleaf forest. Considering the effect of the plant area index (PAI) on the accuracy of the GEDI canopy height, the GEDI dataset is divided into two sets with low and high PAI values with a threshold of median PAI = 2. The results show that the low PAI dataset (median PAI < 2) corresponds to the non-growing season (autumn and winter) in the broadleaf forest. The slightly better performance of GEDI using the non-growing dataset (RMSE = 7.40 m) compared to the growing dataset (RMSE = 8.44 m) in the deciduous broadleaf forest and vice versa, the slightly better result using the growing dataset (RMSE = 6.38 m) compared to the non-growing dataset (RMSE = 7.24 m) in the evergreen needleleaf forest is in line with the results using the leaf-off/leaf-on season dataset. Although a slight improvement in canopy height estimation was observed using either the leaf-off or non-growing season dataset for broadleaf forest, and either the leaf-on or growing season dataset for needleleaf forest, the approach of filtering GEDI data based on such seasonal acquisition time is recommended when retrieving canopy height over pure stands of broadleaf or needleleaf species, and the sufficient dataset is available.
1. Introduction
Forest canopy structure determines many of the environmental factors and functions of a forest, both in terms of the forest ecosystem and its ability to benefit people (e.g., soil erosion prevention, rural livelihood, mitigating climate change, etc.); therefore, it should be monitored. Canopy height is a vital element of forest vertical structure that can be measured on the ground or estimated using remote sensing techniques, such as satellite or airborne laser scanning altimetry systems. Remote sensing is a relatively cheap and constructive method of producing a base map in the absence of detailed land survey methods. It allows easy collection of data over a variety of scales and resolutions at a lower cost than in situ measurements and is also less time-consuming.
LiDAR (Light Detection and Ranging) is a remote sensing technology with powerful application potential in forest ecosystem management. Airborne and spaceborne LiDAR systems have been widely used to determine individual tree heights [1,2,3] and maximum or average stand heights [4,5,6,7,8,9] over various environmental conditions. However, all LiDAR data have limitations, and despite the unprecedented accuracy achieved by airborne systems, their spatial coverage remains limited for regional or continental scales. Global Ecosystem Dynamics Investigation (GEDI), a spaceborne LiDAR system operated by NASA on the International Space Station (ISS), provides high-resolution laser-ranging observations of the 3D structure of the Earth since April 2019. It enables the assessment of forest structural properties at larger spatial scales and shorter temporal resolution than was previously possible [10]. The main two advantages of GEDI data, i.e., rather dense observational coverage and free availability, have encouraged many researchers to investigate its capability for estimating forest structural parameters, and the influence of different GEDI acquisition and environmental parameters on the estimations [4,6,11,12,13,14,15,16,17]. This data has been also used as a source of training data for models that estimate forest structure from wall-to-wall imaging sensors, such as Tandem-X [18], Landsat [19], or Sentinel-1 [20]. We concentrate on research concerning the forest canopy height as it is the essential factor for determining other forest biophysical parameters and functions, such as forest volume and biomass, forest productivity, biodiversity, forest resilience to disturbances, and climate extremities [9,21,22,23,24].
Evaluation of GEDI capability for forest canopy height has highlighted the importance of GEDI beam intensity and beam sensitivity over tall and dense forests [5,6,8]. Fayad et al. [5] investigated the potential of GEDI to derive the maximum canopy height over the tropical forest of French Guiana. Based on their results, however, while GEDI’s full-power lasers outperform coverage beams, both types of beams underestimate tree heights in densely vegetated, tall forests. Assessing the importance of beam sensitivity and acquisition time, they stated that shots with beam sensitivity > 98% tend to better detect the ground and canopy tops for both laser types, but acquisition time affects only coverage beams. A variable importance analysis by Lahssini et al. [8] highlighted the fact that beam sensitivity and beam type are the most important variables for canopy height estimation using GEDI data over dense tropical forests. They reported an RMSE value of 11.6 m and 6.7 m respectively for GEDI RH95 (relative height at 0.95 of the waveform’s accumulated energy) as a direct proxy of canopy height and height estimated through a random forest model based on GEDI height metrics that described the vertical structure of the forest, sensitivity and beam type regardless of the configuration of the acquisition. They also reported an improvement in accuracy (RMSE = 5.9 m for both RH95 and random forest model) when shots acquired with the coverage beams were removed. Researchers have also investigated the influence of environmental parameters on GEDI canopy height estimations. Among environmental parameters, the topographic slope has been a crucial factor affecting the accuracy of canopy height estimates using LiDAR systems [25,26,27]. Dhargay et al. [6] assessed the effect of terrain slope on GEDI canopy height density over temperate complex forests of south-eastern Australia. They reported an increasing trend in the error of canopy height estimation with increasing slope. However, the power beam was more adversely affected at greater slopes than the coverage beam. Liu et al. [25] believed that areas with dense canopy cover or steep slopes pose a major challenge for retrieving canopy height from GEDI. In the research across different sites of Eucalyptus plantations by Fayad et al. [27], the authors explained an RMSE increase of 14% for the estimation of dominant height over slopes higher than 20% in comparison to slopes between 10 and 20%.
Prior research using GEDI data has shown dependency of metrics calculated from laser scanning data on the forest structure properties, such as forest density, canopy cover, forest height, etc. As is well known, significant structural differences, especially between broadleaf and coniferous species (e.g., different shapes of the tree crowns, different properties of needles and leaves, and different distribution of canopy cover among forest strata) could cause substantial differences between the reflection behavior of deciduous and coniferous trees [28]. However, how these differences and their interaction with GEDI acquisition parameters and environmental conditions will affect the accuracy of GEDI canopy height estimation over diverse forest types during different phonological seasons is still questionable. Very few studies have compared GEDI relative height metrics in different forest ecosystems, such as even/non-even aged forests that are dominated by evergreen/deciduous species [29]. Wang et al. [30] analyzed the performance of GEDI relative height estimates against the ALS LiDAR data from 33 sites as reference data, mainly covering 12 forest types, including loblolly/shortleaf pine, longleaf/slash pine, ponderosa pine, lodgepole pine, Douglas-fir, fir/spruce/mountain hemlock, California mixed conifer, oak/pine, aspen/birch, oak/hickory, oak/gum/cypress, and maple/beech/birch, across the conterminous United States. They showed that the RMSE of GEDI RH100 is the lowest in longleaf/slash pine forest (2.31 m) and the highest in California mixed conifer (7.74 m); however, they used only the leaf-on dataset of both the GEDI and the reference data. When this paper was written, no research had considered the forest vertical structure in leaf-off/leaf-on conditions and its effect on GEDI height metrics. A study published in 2023 [31] compared the GEDI RH98 with simulated GEDI-RH98 derived from reference ALS datasets in diverse African savannas under leaf-off/leaf-on conditions. The authors stated that the simulated GEDI RH98 was more representative of the canopy top when trees had full green canopies, which led to better results during the leaf-on period. It is worth noting that savanna is a specific mixed woodland/grassland ecosystem characterized by an open tree canopy (i.e., scattered trees) above a continuous tall grass understory, with a maximum canopy height of 20 m. Therefore, how apparent phenological changes, such as winter leaf fall, affect canopy height estimates remains a question. Answering this question by comparing GEDI canopy height estimates over deciduous and evergreen forests is the main objective of this study.
To achieve this aim, we first consider the best GEDI processing algorithm in the temperate forests of Thuringia, Germany, to determine the useful part of the waveform and extract the required information. We performed a comparative analysis of the influence of GEDI acquisition parameters, such as beam sensitivity, beam type, and acquisition time on GEDI height estimates over deciduous broadleaf, evergreen needleleaf, and mixed forest, considering the leaf-on/leaf-off condition. The effect of phenological changes on some GEDI metrics, such as canopy cover and plant area index (PAI), which are important structural properties of terrestrial vegetation canopies, are also investigated, and their impact on canopy height estimation is assessed. The accuracy of GEDI canopy heights is assessed using high-resolution airborne measurements as reference data.
2. Materials and Methods
2.1. Study Area
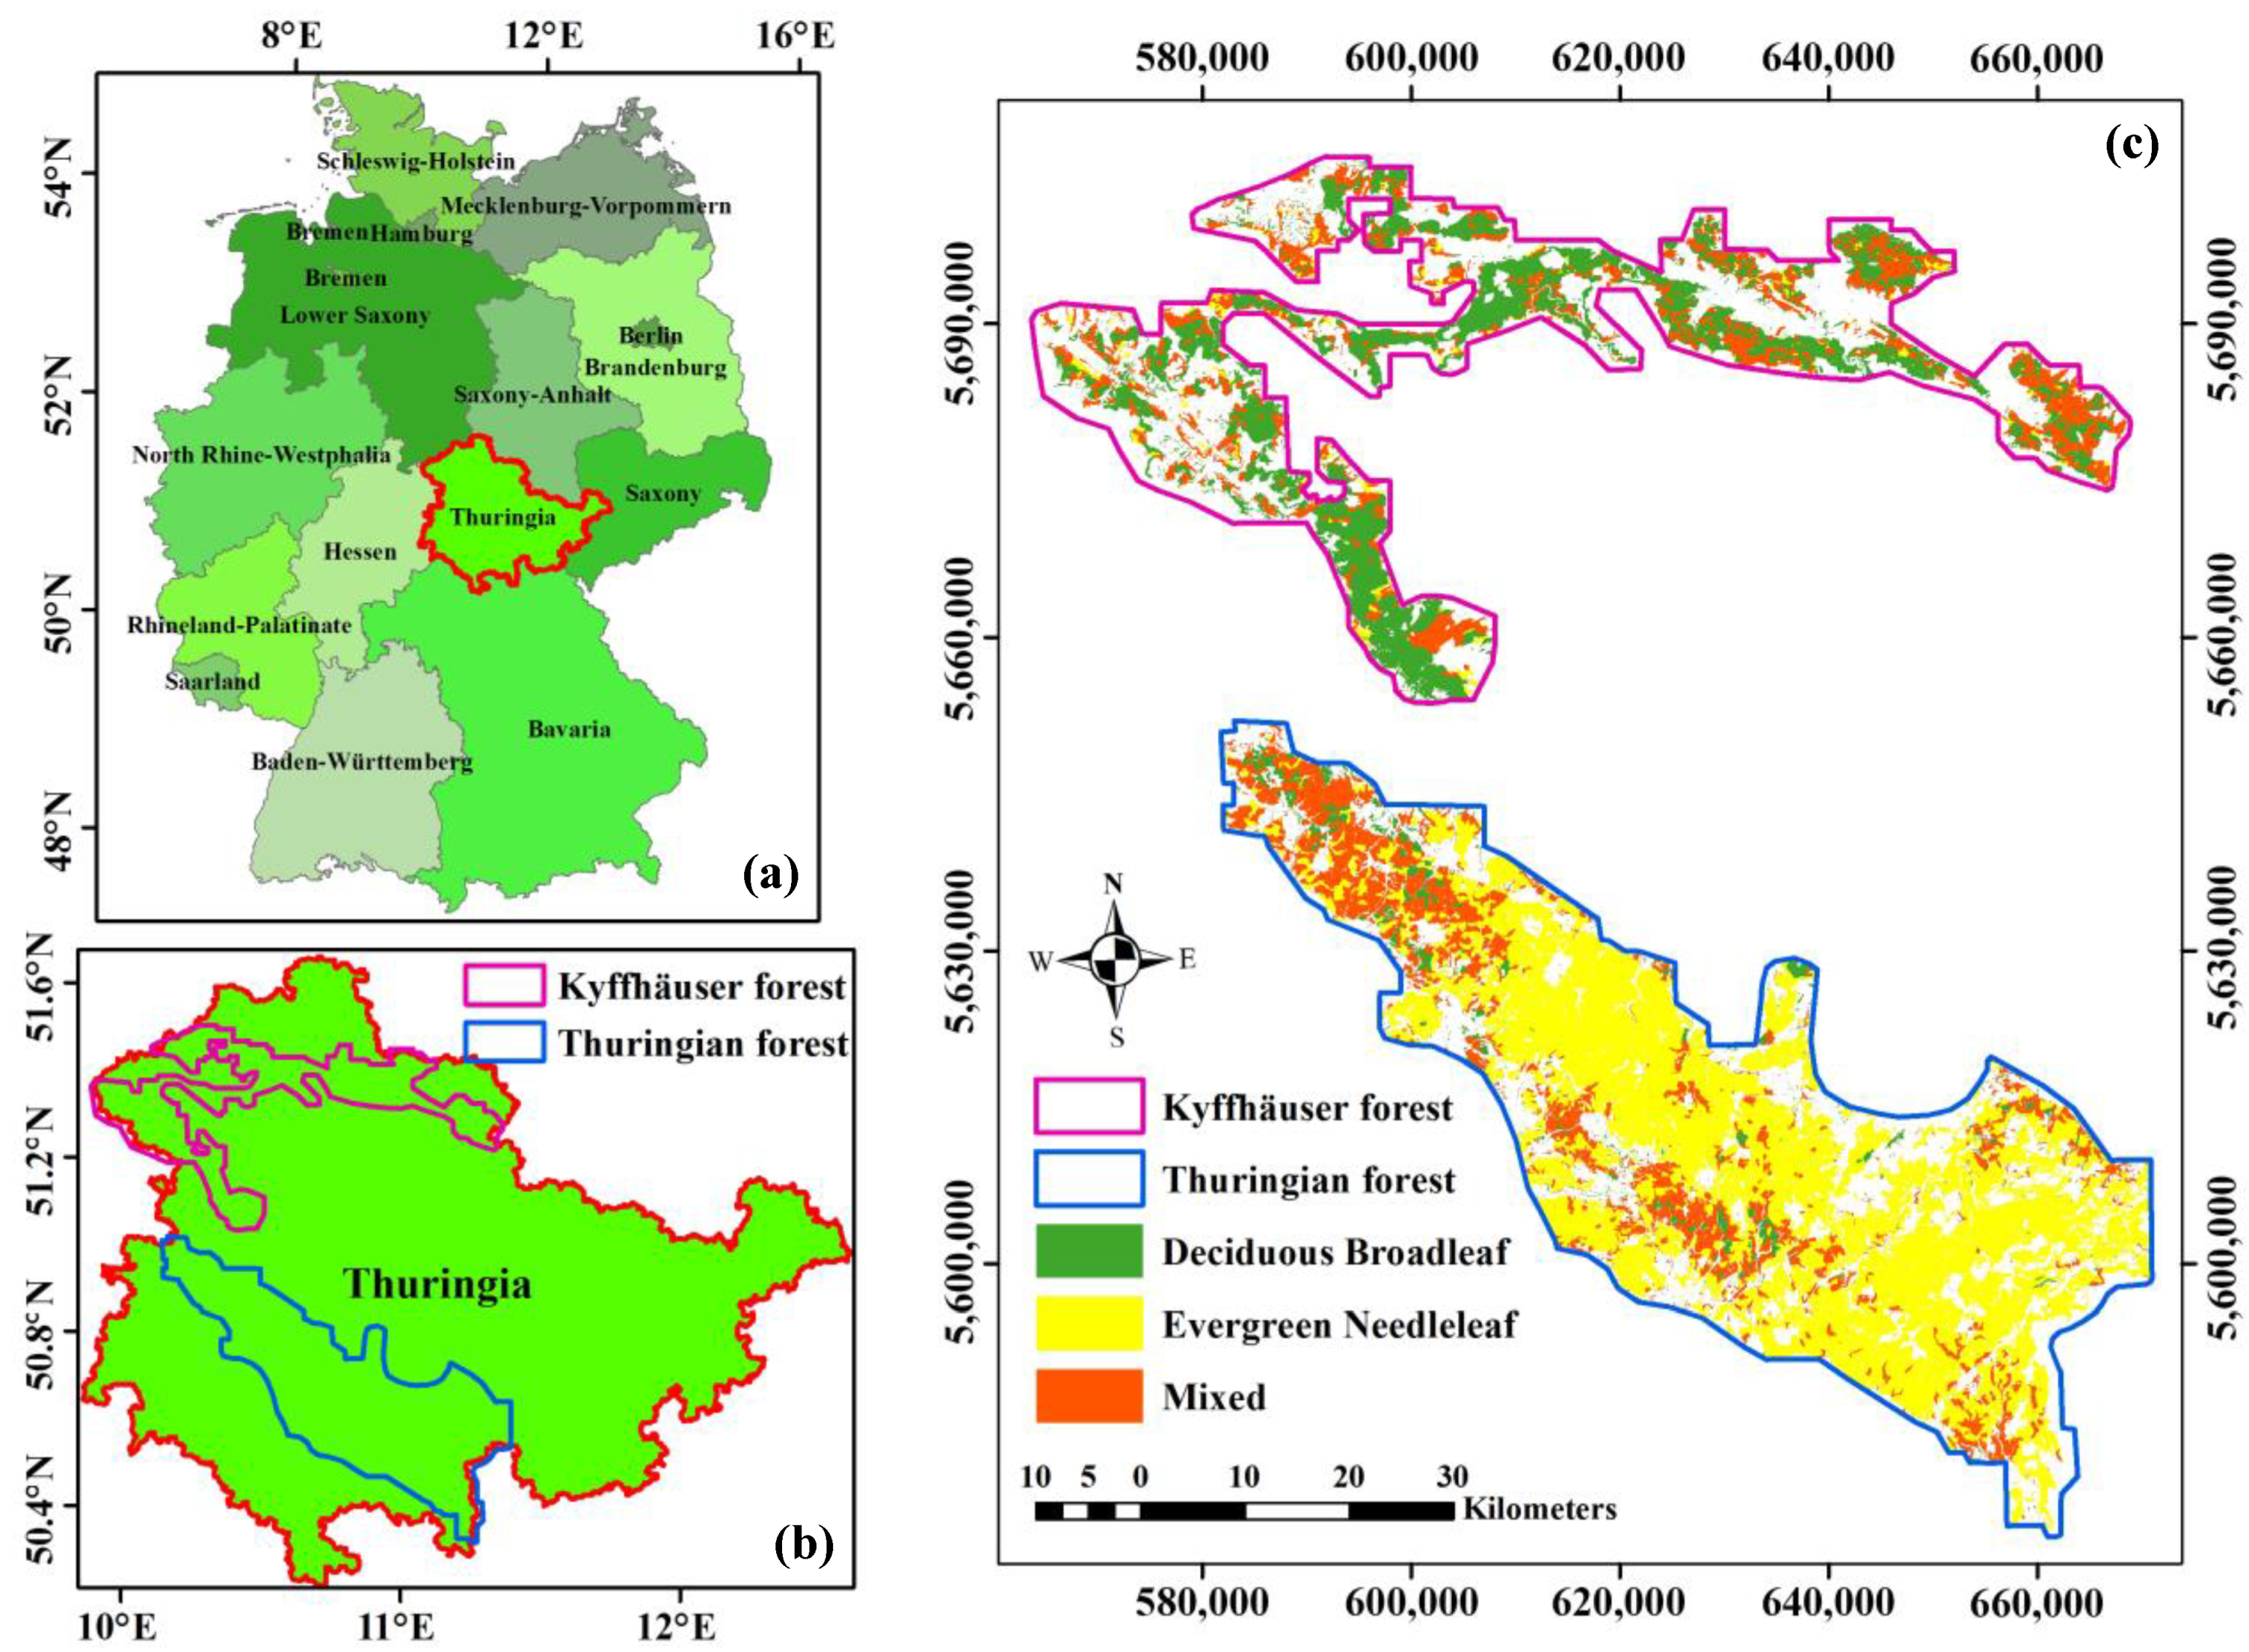
Considering the aim of this study, two forest areas, including broadleaf and needleleaf forests, were selected in the Free State of Thuringia, central Germany, at latitude 50°55′48.00″N, longitude 11°16′12.00″E (Figure 1). Thuringia is the coldest region in Germany, with an average high temperature of only 12 °C and annual precipitation of 767 mm [32]. The first study site, which is mostly covered by broadleaf forest, has an area of 1444 km2 located within the rural districts of Eichsfeld, Kyffhäuserkreis, Nordhausen, Sömmerda, and Unstrut-Hainich in northern Thuringia (called Kyffhäuser forest in Figure 1). The dominant tree species in this site are beech (Fagus sylvatica) and oak (Quercus petraea and Quercus robur) [33,34].
The second study site, with an area of about 2343 km2, is in the Thuringian forest and is situated within the rural districts of Gotha, Hildburghausen, Ilm-Kreis, Saalfeld-Rudolstadt, Schmalkalden-Meiningen, Sonneberg, and Wartburgkreis, and the urban district of Suhl Städte. The Thuringian Forest in southern Thuringia is composed of about 60% coniferous forests, dominated by Norway spruce (Picea abies) and Scots pine (Pinus sylvestris), and 40% deciduous forests, with beech and oak as the dominant broadleaf trees [4,33,35].
The study areas were chosen mainly because of the availability of high-resolution digital elevation and land cover models that can be used as reference data, as well as the existence of two integrated forest types dominated by deciduous (i.e., the tree leaves change color and fall off in the autumn and grow back in the spring.) and evergreen species, providing the environmental requirement of this research objective.
Figure 1.
Study areas. (a) location of the Thuringia state in Germany (the state with red border), (b) location of the Kyffhäuser forest (pink) and Thuringian forest (blue) in Thuringia; (c) Forest type map (WGS84/UTM zone 32N) over study sites available at geoportal-th.de (accessed on 2 September 2022) [36]. Since only forest type map has been downloaded and used, the white spaces show other land covers.

2.2. Dataset
2.2.1. GEDI Data
The Global Ecosystem Dynamics Investigation (GEDI) as a full-waveform LiDAR instrument provides global measures of vegetation structure. It contains three lasers that generate eight ground tracks; four power and four coverage tracks illuminate the Earth’s surface in footprints with 25 m diameter that are separated by 600 m across-track and 60 m along-track. Level 2 products of GEDI (L2A and L2B), which contain information derived from the geolocated GEDI return waveforms, were used in this study. The GEDI L2A data provide ground elevation, canopy top height, and relative return energy metrics, and the L2B data provide biophysical metrics, such as canopy cover and plant area index (PAI) [37].
The metrics have been extracted using six different algorithm group settings that apply different threshold and smoothing settings on each received waveform. A detailed description of the satellite data and processing approaches, methods, and other information is available in algorithm theoretical basis documents (ATBDs) [38,39].
The data used in this study were acquired between April 2019 and January 2022. Based on the setting configuration of algorithm 2, 2,598,716 shots were acquired during this period, i.e., 1,305,315 over the Kyffhäuser and 1,293,401 over the Thuringian forests, (the number of shots is slightly different using six algorithms). However, not all of these shots were usable due to undesirable atmospheric conditions (e.g., clouds) or the location of shots over non-forest areas based on the forest map, which is explained in Section 2.3.
2.2.2. ALS Data
In order to validate the accuracy of the GEDI height estimates, digital surface models (DSM) and digital terrain models (DTM) derived from Airborne Laser Scanning (ALS) were employed to extract the forest canopy heights (considered as the reference heights). The DSM and DTM with a height accuracy of 0.15 to 0.30 m were provided by the Thuringian Land Surveying Office and are available on their geoportal: geoportal-th.de [40]. The acquisition dates of the data range from 2014 to 2019 (the majority of the data were acquired between 2016 and 2019), with a coordinate reference system of ETRS89, UTM zone 32N, and horizontal and vertical accuracy of 30 and 15 cm, respectively [4]. Regarding the acquisition dates of GEDI and the ALS, it should be mentioned that, while we acknowledge the potential for changes in canopy height over time, we assumed that these changes between the acquisition dates of the data were minimal and did not significantly impact our analysis.
In total, 5700 height models (sum of DSM and DTM) as 1 m resolution raster in xyz format were downloaded, and the canopy height models (CHM) were produced by subtracting DTM values from DSM’s. The maximum of the cell values of the CHM was extracted for each GEDI footprint.
2.2.3. Ancillary Data
To derive forest types at the location of GEDI footprints, a digital land cover model (DLM) provided by the Thuringian land surveying office, which is available at geoportal-th.de [36], was used. This dataset consists of several shapefiles that represent land cover classes created between 2017 and 2020 and have a geolocation accuracy of around 3 m [4]. A 5 m raster format of DLM was provided and used to determine the forest types in each GEDI footprint. The DLM contained three classes of broadleaf, needleleaf, and mixed forest, and three integer values that corresponded to forest types. The document containing the layer information can be found on the website for the working committee of the surveying authorities of the Laender of the federal republic of Germany (AdV) [41]. In this study, if maximum and minimum DLM values for the broadleaf or the needleleaf inside a GEDI footprint were the same, the footprint belonged to that forest class, otherwise, it was considered a mixed forest. This approach was also used by Adam et al. [4] and led to the pure dataset for broadleaf and needleleaf forests, which provides a more realistic situation for comparing GEDI canopy height accuracy mainly in these two forest types.
2.3. Preprocessing of GEDI Data
First, GEDI waveforms located in the non-forest area or close to forest boundaries are eliminated. As the study sites were initially selected based on the presence of forest cover in Google Earth, some GEDI shots refer to the non-forest area on the 5 m forest map that was prepared later in the process (see the forest map in Figure 1). Moreover, due to the GEDI geolocation error that is estimated to be 10 m [6,42], the shots close to the forest map boundaries may present non-forest regions. To avoid these conditions, the GEDI footprints overlayed on the forest map with no-data values (non-forest pixels), either inside the footprint or within a distance of 100 m from the footprint center, were removed. Although the geolocation error is about 10 m (assuming normally distributed geolocation errors with a 0 m mean and a 10 m standard deviation), a 100 m buffer was used to ensure that each GEDI footprint was at a great enough distance from the non-forest area.
In addition, since the GEDI waveforms could be affected by atmospheric conditions, specifically cloud presence, not all of them represent valuable information on the illuminated surface. Hence, the waveforms that meet any of the following criteria that are mostly consequences of atmospheric impacts were eliminated (some were mentioned in similar studies, e.g., 13, 5, 8, 36):
- waveforms with zero detected modes (num_detectedmodes = 0), which mostly correspond to noisy acquisitions [8].
- Incomplete waveforms, i.e., waveforms with insufficient bins: waveforms where the end location of their useful part (search_end) equals the total number of bins in the waveforms (rx_sample_count) [8].
- waveforms in which either the difference between the center of lowest (zcross) and highest (zcross0) modes above noise level equals zero (zcross−zcross0 = 0) and the width of that mode (rx_gwidth) is lower than 20 m. These are likely to represent non-forest area (i.e., Zcross−zcross0 = 0 if rx_gwidth < 20).
- waveforms with a relative height of 100 (RH100) (defined as the distance between the elevations of detected ground return and the 100% accumulated waveform energy), lower than 3 m or greater than 70 m. RH100 < 3 m, apparently corresponds to bare soil or low vegetation and RH100 > 70 does not represent realistic vegetation heights [8,13,43].
About 20% of the waveforms remained after the above filtering steps. For example, for algorithm setting group 2, the number of waveforms before and after filtering is 2,598,716 and 507,892, respectively. Figure 2 shows examples of GEDI waveform over deciduous broadleaf and evergreen needleleaf forests during winter and summer. The waveforms acquired on two different dates are located within the shortest possible distance (the distances are presented in the figure).
In this study, the geolocation information, including longitude, latitude, and elevation, as well as the acquisition time of received waveforms, were extracted from the L1B data product. The vital variables derived from the L2A data product that was used in this research are: (1) beam sensitivity, defined as the maximum canopy cover through which the GEDI liDAR can detect the ground with 90% probability [11]; (2) the signal-to-noise ratio (SNR), calculated using maximum amplitude within an acquired waveform and the mean and the standard deviation of background noise [13]; (3) the relative height at 100% (RH100) of returned energy, which is the distance between the ground return and the canopy top [5]; (4) beam type (power/coverage). To clarify, GEDI has three 10 mJ lasers, one of which is split into two 5 mJ beams (coverage beam) and the two others remain at full power energy (power beam) [44]. The two important environmental indices, including plant area index (PAI), defined as half the total green leaf area per unit ground surface area (m2/m2), and canopy cover [45], were extracted from the L2B data product.
Assuming that the waveform start represents the highest point of the canopy within the footprint, the canopy heights in the GEDI datasets are the distance between ground elevation and the elevation of the waveform start. To obtain ALS height values at the location of GEDI footprints, the maximum of the cell values of the ALS-CHM was extracted for each footprint. The reference canopy heights are called ALS Hmax hereafter.
2.4. Analysis of GEDI Canopy Height
2.4.1. Comparing GEDI Processing Algorithms
GEDI processing algorithms were compared to find the best configuration used for waveform smoothing (to minimize the noise in the signal and determination of the useful part of the waveform). All preprocessing steps were performed using six GEDI datasets extracted by the six algorithm group settings. Then, the extracted relative height metric at 100% (RH100) of waveform accumulated energy was assumed as GEDI maximum estimated height (henceforth called GEDI H100). The accuracy assessment of GEDI H100 was performed using ALS Hmax.
2.4.2. GEDI Heights over Different Forest Types, and Leaf-On and Leaf-Off Condition
A comparative analysis of the GEDI LiDAR data for estimating canopy height in various forest types including deciduous broadleaf, evergreen needleleaf, and mixed forest was performed while investigating the influence of GEDI acquisition parameters, such as sensitivity, beam type, acquisition time (Day/Night), and some environmental parameters, including canopy cover and plant area index (PAI) in different forest types.
The structure of broadleaf and mixed forests differs during the leaf-off and leaf-on seasons. This raises the question of how the structure affects the canopy height estimation using GEDI, especially in comparison with needleleaf forests. To address this question, the accuracy of GEDI heights was also evaluated using the leaf-off/leaf-on dataset over each forest type. The leaf-off season corresponds to December, January, and February, during which trees in the broadleaf forest in the study area are definitely leaf-off. However, the so-called leaf-off season for needleleaf forests (evergreen) is generally representative of the winter, not the tree foliage condition. Data for the needleleaf forest is therefore called winter data hereafter.
Effects of GEDI Acquisition Parameters
To consider the influence of different acquisition parameters on GEDI estimates, the difference between GEDI H100 and ALS Hmax is calculated, which is called the H100-difference henceforth.
To investigate the influence of the beam sensitivity, which provides information on the penetration of the LiDAR beam in the forest canopy and has shown itself to have a vital impact in several studies [5,6,8], the H100-difference fluctuation was analyzed in different sensitivity groups (sensitivity < 0.9, 0.9–0.91, 0.91–0.92, 0.92–0.93, 0.93–0.94, 0.94–0.95, 0.95–0.96, 0.96-0.97, 0.97–0.98, 0.98–0.99, 0.99–1). Furthermore, to visualize the significance of removing shots with low sensitivity on canopy height accuracy, it was necessary to find an optimum sensitivity threshold (where we achieved high accuracy while keeping the maximum possible number of shots). Thus, the GEDI dataset was split into two groups with sensitivity lower and higher than a sensitivity threshold (0.9, 0.91, 0.92, 0.93, 0.94, 0.95, 0.96, 0.97, and 0.98), and GEDI heights were assessed in two different groups of low and high sensitivity.
The effect of GEDI beam type and acquisition time was also evaluated, as these are also important parameters. To extract the GEDI acquisition time (day/night) of each measurement, the sunrise/sunset timetable available at the Global Monitoring Laboratory website [46] was downloaded for Germany (at the location of Erfurt, the capital of Thuringia) from 1 January 2019 to 31 January 2022. The GEDI times (in UTC) were converted to local times (as sunrise/sunset timetable). If the acquisition time of a waveform was between sunrise and sunset hours, it was set as daytime; otherwise, the acquisition time was set as nighttime. It is worth mentioning that day/night acquisition time could also be deduced from the solar elevation angle information that was included in the GEDI datasets, so measurements with an elevation angle greater than zero are considered daytime acquisitions [4].
Effects of Plant Area Index (PAI)
A vital metric available in the GEDI L2b product is the plant area index (PAI), which is defined as half the total green leaf area per unit ground surface area (m2/m2) [45]. The influence of this metric, which is essential for converting leaf-level processes to the canopy level [47,48], is evaluated to explain the accuracy difference in canopy height estimation from GEDI data over three forest types. This was done by analyzing the H100-difference relationship with PAI in the three forest types. Since it was expected that there would be a clear difference in PAI during summer and winter in the broadleaf forest, but not in needleleaf, the monthly change of this parameter was investigated. In the next step, the dataset was divided by the months that had low and high PAI values using threshold derived from the previous step. An accuracy assessment of GEDI canopy height was performed using the two derived datasets in each forest type.
2.5. Accuracy Assessment
For statistical assessment of canopy height estimates, the metrics between GEDI height and ALS Hmax, presented in Table 1, were calculated; this method has been used in similar studies [4,12,13]. It is worth mentioning that, since H-differences (differences between GEDI and ALS heights) are not normally distributed, the median and median absolute deviation (MAD) were used as robust parameters for their statistical evaluation [4].
3. Results
3.1. GEDI Processing Algorithm
Figure 3 indicates the scatter plots of GEDI-H100 and ALS Hmax values for each algorithm group for all footprints over Kyffhäuser and Thuringian forests (507,892 footprints). Accuracy metrics of GEDI H100 estimates derived with different algorithm groups can be found in Table 2. As observed, the most accurate estimated height belongs to algorithm settings 2 and 6 with an RMSE of 7.46 m and 7.80 m, a median of −0.44 m and −0.19 m, and MAD values of 3.9 m and 4.24 m, respectively. The least accurate result was obtained using algorithm setting 5 (RMSE = 9.62 m, median = 2.44 m, MAD = 7.07 m). As algorithm setting 2 gave the best overall performance, the remainder of this study will be based on algorithm 2 results.
To compare the capability of GEDI in different forest types, the datasets were divided into three subsets that contained footprints over broadleaf (135,347 footprints), needleleaf (235,321 footprints), and mixed forests (137,224 footprints). Figure 4 shows the scatter plot of GEDI height against ALS Hmax for the mentioned forest types.
According to the statistics presented in Figure 4, canopy height is estimated more accurately over the needleleaf forest with an RMSE of 6.61 m. Comparing the MADs, which are resilient to outliers and the deviations of a small number of outliers are irrelevant in it [49], confirms the advantage of GEDI height estimates over needleleaf forests.
3.2. GEDI Heights over Different Forest Types
3.2.1. Effects of GEDI Beam Sensitivity
Figure 5 visualizes the relationship between H100-difference and different GEDI-beam-sensitivity groups. Since the beam sensitivity parameter provides an estimation of the maximum canopy cover through which GEDI can detect the ground with 90% probability [11], it is expected that with higher sensitivity, denser canopy covers can be penetrated. Looking at Figure 5, the median of the H100-difference in all three forest types starts from a negative value and increases with increasing sensitivity values until it reaches zero at the sensitivity of 0.97–0.98. Compared to the broadleaf and mixed forests, the needleleaf forest shows lower variation in the median values of H100-differences between GEDI points with low and high sensitivity. Furthermore, the absolute median values of H100-differences in needleleaf forests are lower than those observed in broadleaf and mixed forests. It could be deduced the parameter of sensitivity is a less effective factor for needleleaf forest than the two other forest types. This could occur either because of simple vertical structure (e.g., low number of vertical strata), which allows better beam penetration through the canopy, or homogeneity of canopy cover over the study site (Figure 6). In needleleaf forests, the mean canopy cover is around 60%, with the majority of data between 40% and 90%. For broadleaf and mixed forests, the distribution of canopy cover is bimodal, with the first most frequent canopy cover at about 90% and the second at about 30%.
The scatter plots visualizing the relationship between GEDI H100 and ALS Hmax using different groups of datasets with sensitivities lower and greater than the threshold values were provided to evaluate the extent of improvement by the exclusion of low-sensitivity data. Based on the statistical criteria, the best sensitivity threshold in our study site is 0.96. However, looking at Figure 7 reveals that the dataset with sensitivity values greater than 0.96 estimates the canopy height only 0.5 m (needleleaf forest) to 1.2 m (broadleaf and mixed forest) more accurately than the original dataset, as presented in Figure 3, in exchange for excluding about one-third of samples. We have also presented the scatterplot of GEDI H100 versus ALS Hmax for a sensitivity threshold of 0.90 in Figure 8. It shows the dataset with sensitivity > 0.90 leads to a slight improvement in accuracy (between 20 to 50 cm) by removing a small portion of samples with sensitivity < 0.90 (about 6 to 7% of samples) in comparison to the original dataset. The statistic criteria are displayed on the plots.
3.2.2. Effects of Forest Leaf-On and Leaf-OFF Condition
Following the results in Section 3.2.1, the relationship between the statistic criteria and GEDI beam sensitivity during leaf-off/leaf-on seasons was considered (Figure 9). As it is seen, there is a decreasing trend in the estimation error (RMSE) as the sensitivity level in all forest types increases; however, the trend is less linear in the needleleaf forest. Comparing leaf-off/leaf-on seasons, a reverse behavior is observed in broadleaf and needleleaf forests. While the leaf-off season dataset produces slightly higher accuracy in the broadleaf forest, an increase is realized in the accuracy of canopy height estimates over the needleleaf forest during the winter season. This behavior encouraged us to consider the relationship between H100-difference and canopy cover (Figure 10). The result shows that the estimation accuracy increases by canopy cover up to 20–30%, and decreases when canopy cover goes over 70%, which is due to lower canopy penetration.
3.2.3. Effects of GEDI Acquisition Time and Beam Type
Figure 11 and Figure 12 visualize the influence of acquisition time and beam type on canopy height estimation, respectively. The general behavior is similar in all forest types. In other words, the data acquired at night with the power beam produce a slightly higher accuracy than the daytime dataset acquired by the coverage beam. Referring to Table 3 and Table 4, height estimates acquired during the day or using the coverage beam have a slightly higher median and MAD of H100-difference compared to the data obtained at night or using a higher intensity (power beam). The intensity of the beam determines its ability to penetrate the canopy cover, whereas the atmospheric effects and noise levels are affected by the time of data acquisition. The result shows that the needleleaf forest in our study site is not highly affected by night and day, and is less affected by beam intensity in comparison to broadleaf and mixed forest. This can be explained by the canopy structure of needleleaf forests, which provide better canopy penetration, and the canopy cover percentage. As explained in Figure 6, the distribution of canopy cover shows fewer data with high canopy cover values compared to broadleaf and mixed forest.
3.2.4. Effects of Plant Area Index (PAI)
PAI defined as half the total green leaf area per unit ground surface area (m2/m2) was assumed to explain the accuracy difference in canopy height estimation from GEDI data over three forest types. Boxplots visualizing the relations between H100_difference and PAI can be found in Figure 13. A clear correlation is observed between height residuals and PAI. However, an increase is observed in the accuracy of canopy height estimates with the increase of PAI up to 3, but afterward, the general trend shows a weak negative correlation between accuracy and PAI.
To further analyze PAI and its effect on GEDI canopy height, the monthly change of PAI was plotted (Figure 14). According to Figure 14, the amount of PAI during November, December, January, February, March, and April is clearly lower than in other months of the year in broadleaf and mixed forest, which confirms a seasonal change in the vertical and horizontal profile of broadleaf and mixed forest. This observation led us to evaluate GEDI canopy height during growing and non-growing seasons other than leaf-off (meteorological winter, including October, January, and February) and leaf-on seasons. Defining the growing and non-growing seasons is closely related to plant phenological stages. For instance, spring leaf unfolding, and autumn leaf coloration implies the start and end of the period of photosynthetic CO2 uptake, respectively, and is used to define the growing season in ecosystems dominated by deciduous plant species [50]. In this study, the months showing a median PAI lower than 2 in broadleaf and mixed forests were assigned to the non-growing season.
As observed, in broadleaf and mixed forest, the median of PAI ranges between 0.5 and 3.5, and during the non-growing season, it is lower than 2. Concerning needleleaf forest, median values are between 0.7 and 2, and the low median values in February 2020 and December 2021 can be due to an extremely limited number of available footprints, which equal 16 and 4, respectively. In the next step, the GEDI dataset for each forest type was divided into two sets: one for the growing season (months of May, June, July, August, September, and October) and one for the non-growing season (months of November, December, January, February, March, and April). This approach led to splitting the dataset into equal periods (two 6-month periods) instead of leaf-off and leaf-on seasons. This would reduce the difference between the number of shots during the growing and the non-growing dataset. However, from the total dataset, only 25, 18, and 20% of the broadleaf, needleleaf, and mixed forest types, respectively, belongs to the non-growing season. This could be a result of removing the unwanted footprints affected by atmospheric conditions, specifically cloud presence, which may be more likely from late autumn to early spring. The scatter plot of GEDI H100 and ALS Hmax using the two sets of datasets was produced to visualize the effect of PAI on canopy height estimation (Figure 15). It indicates an improvement of about 1 m in the accuracy of GEDI canopy heights using the non-growing dataset with median PAI < 2 (RMSE = 7.40 m) rather than the growing season with PAI > 2 over the broadleaf forest (RMSE = 8.44 m). For the mixed forest, the same result is observed in terms of RMSE for both nongrowing and growing seasons (RMSE~7.8 m); however, other statistical criteria (median, bias, and MAD) differ by season slightly. A reverse behavior is observed in the needleleaf forest in comparison to the broadleaf forest. From the statistical criteria, higher accuracy is realized using the growing (RMSE = 6.38 m) than the non-growing dataset (RMSE = 7.24 m).
4. Discussion
In this study, we analyzed the accuracy of GEDI for estimating canopy heights in different forest types, including deciduous broadleaf, evergreen needleleaf, and mixed forests. The accuracy of height estimates was evaluated using CHM derived from ALS DTM and DSM.
GEDI metrics were based on six L2A processing algorithms with different threshold and smoothing settings to detect the canopy top and the ground return. The analysis of the GEDI canopy height derived from the six algorithm settings reveals that algorithms 2 and 6 deliver approximately similar accuracies. In practice, identifying the ground return and the top location in GEDI data can be challenging under conditions of dense canopy cover, low-altitude clouds or fog, and complex terrain. For instance, in areas with dense undergrowth or high aboveground biomass, such as tropical forests, the outperformance of algorithms with a lower signal end threshold (such as in algorithm 5) has been proven in several studies e.g., [8,12], to derive terrain elevation and canopy height. Fayad et al. [5] believe that algorithms 1 and 2 do not correctly detect ground returns over French Guiana. In this study, algorithms 4 and 5, which have the highest signal start and lowest signal end thresholds, respectively, led to low accuracy results. This can prove the lack of complexity of the study site (to some degree) in comparison to highly dense forests. However, while the highest RMSE belongs to algorithm 4 (10.33), but the median and MAD statistics (Table 2) distinguish algorithm 5 as the worst performing algorithm; this is consistent with Adam et al. [4], which was conducted over the Roda area and the Thuringian forest in Germany. According to Hilbert et al. [51], in less dense forest ecosystems, a low signal back threshold can lead to an underestimation of the ground surface (interpretation of noise below the actual ground as the ground peak), leading to an overestimation of the canopy height.
The accuracy assessment of GEDI height estimates in three forest types, including broadleaf, needleleaf, and mixed forest, shows that the overall median of the H100-difference (GEDI H100-ALS Hmax) in needleleaf forest (in Thuringian forest, Germany) is −0.34 m with a median absolute difference (MAD) of 3.42 m and root mean square error (RMSE) of 6.61 m; this is slightly better than that found in the broadleaf forest (in Kyffhäuser forest, Germany), viz. a median of −0.61 m, a MAD of 4.3 m, and RMSE of 8.30 m, using the dataset derived with algorithm setting 2 (Figure 4). In assessing the accuracy of GEDI height estimates over the Thuringian forest, Adam et al. [4] reported very similar results in terms of median and MAD statistics using algorithms 1 (median = −0.23 m, MAD = 3.17 m) and 2 (median = 0.29 m, MAD = 3.31 m) with a much lower number of footprints (19,646) compared to ours (235,321). The accuracy of height estimates over the mixed forest is almost as good as the broadleaf forest (RMSE = 7.94 m, median = −0.48 m, MAD = 4.46 m). The better performance of GEDI over the needleleaf forest may be due to the more clumped foliage and easier penetration of light to the forest floor in the needleleaf forest than in the less clumped and more uniform broadleaf forest [52,53,54].
Regarding the influence of beam sensitivity on canopy height, the relationship between height residuals and sensitivity (Figure 5) reveals a low significant role of this factor in our study site. The analysis of shots with high-beam sensitivity indicates that removing shots with sensitivity < 0.96 increases the accuracy of canopy heights, but it is not significant in exchange for the number of shots that are being discarded. In other words, excluding almost a third of the shots (sensitivity < 0.96) leads to an improvement of only about 0.5 m (needleleaf forest) to 1.2 m (broadleaf and mixed forest). This can be explained by the canopy structure and the density of the forest, as the beam sensitivity is defined as the percentage of the canopy cover through which we expect to be able to detect the ground with 90% probability. The studies that have recommended filtering the GEDI dataset with high beam sensitivity were conducted in dense, complex forests. For example, Fayad et al. [5] and Lahssini et al. [8], who recommended removal of data with a beam sensitivity < 0.98, worked in the tall and dense forests of French Guiana and Gabon, South America. A threshold of 0.95 was suggested by Dhargay et al. [6], who worked on high-density complex forests located in the Central Highlands region of Victoria, Melbourne, and Rishmawi et al. [10], who monitored key forest structure attributes of large-extent forests across the conterminous United States. In contrast, the average canopy cover in our study sites is approximately 60% (note that a canopy cover could be a proxy of forest density); based on this result, it is not recommended to eliminate a large portion of the dataset in exchange for a small improvement.
The relationship between the statistical criteria and GEDI beam sensitivity during the leaf-off/leaf-on seasons was considered in terms of the influence of both beam sensitivity and forest structure effect on GEDI height estimates (Figure 9). There is a clear decreasing trend in the RMSE as sensitivity increase in broadleaf forests. The RMSE decreases from 11.6 m and 14 m for the leaf-off and leaf-on datasets, respectively, to 5.68 m and 7.01 m by increasing the beam sensitivity from sensitivity < 0.90 to sensitivity > 0.98. For the needleleaf forest, the RMSE decreases by increasing the beam sensitivity with less acceleration compared to the broadleaf forest (the RMSE decreases from 12.6 m and 9.05 m for the leaf-off and leaf-on datasets to 8.11 m and 6.47 m, respectively, by increasing the beam sensitivity from sensitivity < 0.90 to sensitivity > 0.98). In the mixed forest, the trend of RMSE by sensitivity is more similar to the broadleaf forest. When comparing the leaf-off/leaf-on datasets in the broadleaf and mixed forest, the leaf-off dataset gives slightly better results than the leaf-on due to better penetration through the canopy and consequently more accurate detection of the ground surface (more obvious difference in the broadleaf). This is in line with Olesk et al. [55], who used the SINC model to retrieve forest height from Tandem-X InSAR data and found that the estimation accuracy of the deciduous season (leaf-off) in the broadleaf forest was higher than that of the non-deciduous season. In a study comparing GEDI terrain estimates over temperate broadleaved, mixed, and needle-leaved forests, Urbazaev et al. [12] expressed that leaf-off conditions in temperate broad-leaved forests could improve the detection of ground return. According to DEEMS et al. [56], the number of successful ground hits and therefore the final surveyed point density decreases inversely with canopy cover density. The relationship between H100-difference and canopy cover in Figure 10 shows an upward trend in canopy height estimation accuracy with increasing canopy cover up to 20–30%. At that point, the accuracy remains relatively stable with a slight increase up to 70% canopy cover; afterward, the canopy cover (above 70%) has a negative effect on GEDI canopy height estimates by reducing canopy penetration. This is in accordance with a study by Adam et al. [4] on forests in Thuringia, Germany, which reported that the GEDI canopy height estimates for areas with canopy cover <25% have a significantly lower accuracy than estimates for areas with higher canopy cover, and the accuracy is more or less stable for canopy cover classes above 25%. Therefore, less dense canopy cover during the deciduous season (leaf-off) results in higher canopy penetration, more precise ground detection, and ultimately, more accurate canopy height estimates, leading us to conclude that the deciduous season dataset is preferred for canopy height measurements over deciduous broadleaf forests.
In contrast, for the needleleaf forest, the winter season dataset (called the leaf-off season for broadleaf forest) leads to slightly higher RMSE values, which can be due to atmospheric conditions and cloud effects [14], while the vertical structure of the forest and canopy foliage is constant during summer and winter. Another possible factor affecting canopy height estimation in our study site is likely the presence of snow during winter. Although the exact effect of snow cover is still unclear, we believe the snow cover is likely to lead to incorrect canopy top and ground detection. However, in a research review on LiDAR measurement of snow depth, DEEMS et al. [56] state that: “in snow-covered landscapes, the reduction of understory vegetation due to snow burial combined with the high reflectivity of the snow surface at LiDAR wavelengths of 1064 nm or shorter should allow for increased sub-canopy ground-point density and accuracy compared with snow-free collections”. However, their work described how snow cover decreases the influence of understory vegetation on ground surface detection positively, but also strengthens the probability of incorrect ground detection under deep snow (i.e., snow surface is mistakenly identified as ground surface). The same condition is expected in a broadleaf forest, but the canopy-snow interaction should be also taken into account. Dickerson-Lange et al. [57] assessed forest-snow interactions in relatively warm winter conditions across the Pacific Northwest, United States. They expressed, generally, how forest structure reduces snow deposition by increasing snow-canopy interception, but canopy sheltering at windy sites can reverse the influence of interception on snow accumulation and cause longer snow disappearing timing. Therefore, the longer snowmelt time in needleleaf forests extends snow cover effects on canopy height estimation rather than in broadleaf forests. With all this in mind, a quantitative study of the canopy-snow interaction and its impact on GEDI canopy height detection is proposed to explain precisely the difference in accuracy between summer and winter seasons, especially in needleleaf forests.
Similar to beam sensitivity, beam type and acquisition time have little influence on canopy height estimation over our study sites. This is most likely due to the overall relatively low forest density in the study area, meaning that the GEDI beam type has a small influence on canopy height accuracy [4]. Since the power beam was designed to penetrate canopies with over 95% cover, and in our dataset, only 0.2, 1.3 and 1% of the footprints for broadleaf, needleleaf, and mixed forest, respectively, have a canopy cover of over 95%, its ability does not add an advantage to this study. It is worth noticing that the beam type had a higher importance in the estimation of canopy height in the broadleaf and mixed forests in comparison with the needleleaf forest. This could be generally due to the more complex vertical structure of the broadleaf forest that increases uncertainties in ground detection. On the other hand, although the mean canopy cover over all three forest types is around 60%, its almost normal distribution over needleleaf forest (Figure 6) indicates a more spatially and temporally homogenous structure which provides better penetration of the coverage beam than the power beam. Taking into account the small influence of the power beam and nighttime dataset on height estimation improvement, and the magnitude of the dataset collected with the coverage beam or during the day (about 50% of the dataset referring to Table 3 and Table 4), we consider it unnecessary to filter for beam intensity and data acquisition time when using GEDI canopy height products over our study site. This result is in line with Urbazaev et al. [12], which reported a similar correlation to reference data for both coverage and power beams for non-degraded samples (i.e., GEDI degrade flag parameter equal to 0) over broadleaf and needleleaf forests in central Germany. In contrast, some other studies recommend the use of only power beams, and nighttime data [4,5,7,8,11]. For example, Liu et al. [25] recommended using only power beam nighttime data for canopy height retrieval over 40 sites with a wide range of latitude, longitude, elevation, slope, canopy height, canopy cover, and land cover located in the U.S. mainland, Alaska, and Hawaii, although they state that the deletion of coverage beam and daytime data is not necessary for terrain height estimation. Lahssini et al. [8] assessed the influence of various GEDI signal acquisition parameters on canopy height estimates and recommended the use of only power and high-sensitivity beams when retrieving canopy height over tropical forests in French Guiana and Gabon, and sufficient data are available.
The plant area index (PAI), i.e., the one-sided leaf area per unit of ground area, is available in the GEDI L2b product; it defines an important structural property of terrestrial vegetation canopies. Theoretically, the power law between leaf area and tree height varies amongst forest types [58]. Based on a theoretical allometric model (Kempes et al., [59]), the power law between PAI and maximum tree height is a first-order approximation. Thus, the correlation between leaf area and tree height supports the assumption that PAI can explain the difference between canopy height estimation accuracies over three forest types during growing and non-growing seasons (assuming different PAIs in the two seasons). Figure 13 indicates a similar trend between H100-difference and PAI in all forest types, i.e., the accuracy of canopy height estimates increases by PAI up to 3, but afterward, the general trend shows a negative correlation between accuracy and PAI. Monthly changes in the plant area index (Figure 14) confirm the PAI as a critical vegetation structural parameter for monitoring the status of forests [6]. Therefore, since there was a reasonably clear change in the PAI of the broadleaf forest during each year, this metric was recognized as an essential differentiating factor of forest types. Therefore, the accuracy assessment of GEDI H100 in each forest type was carried out using two datasets: median PAI > 2 and median PAI < 2, called growing and non-growing datasets, respectively (Figure 15). The influence assessment of PAI on canopy height estimation indicates a better result using the non-growing dataset than the growing dataset with RMSE equal to 7.40 m and 8.44 m (1 m difference) and MAD equal to 3.19 m and 4.45 m, respectively. A reverse result was observed in the needleleaf forest in comparison to broadleaf, with a slightly higher accuracy using the growing (RMSE = 6.38 m) than the non-growing dataset (RMSE = 7.24 m). The improved performance of GEDI using the non-growing dataset (median PAI < 2) in broadleaf forests and growing dataset (median PAI > 2) in needleleaf forests is in line with our previous findings using leaf-off/leaf-on season dataset. The same explanation can be given, although there is a better balance between the number of shots when dividing the dataset based on median PAI rather than leaf-off/leaf-on condition.
5. Conclusions
GEDI space-born LiDAR data was analyzed to compare its ability to estimate canopy height over different forest types, mainly evergreen needleleaf and deciduous broadleaf in temperate forests of Thuringia, Germany. The relative height metric (RH100) of GEDI shots was considered to be the maximum height, and the data were evaluated based on the maximum height derived from the 1 m resolution ALS CHM model. The first minor objective was to find the best processing algorithm that fit the data in our study site to remove noise-contaminated waveforms. Algorithm 2 and Algorithm 6 delivered similar results that were more accurate than the other algorithms. It can be concluded that algorithms with a medium waveform signal end threshold appear to be preferable for deriving canopy height over temperate forests. The metrics extracted with algorithm 2 with slightly higher accuracy (RMSE = 7.46 m, median = −0.44 m, MAD = 3.9 m) were considered the best, and the rest of the analysis was conducted using a total of 507892 samples after refinement (135,347 over broadleaf, 235,321 over needleleaf, and 137,224 over mixed forests).
GEDI canopy height over needleleaf forest with RMSE = 6.61 m and MAD = 3.42 m was slightly more accurate than that over broadleaf (RMSE = 8.30 m, MAD = 4.30 m) and mixed (RMSE = 7.94 m, MAD = 4.46 m) forests, which is because needleleaf forests have more homogenous vertical structure, more clumped foliage, and easier penetration of light to the forest ground than for the more uniform and less clumped broadleaf type. Assessing the GEDI acquisition parameters over temperate forests analyzed in this study showed that differences in beam type, sensitivity, and acquisition time do not highly affect the accuracy of canopy heights, especially over the needleleaf forest.
Comparing the leaf-on/leaf-off season, contrasting results were observed in the broadleaf and needleleaf forests. Better performance of GEDI data in leaf-off season (i.e., meteorological winter, including the 3 months of December, January, and February) is interpretable by lower canopy cover density and, consequently, more successful ground hits and returns than that in leaf-on season. This leads us to the conclusion that the leaf-off season dataset is preferred for canopy height measurements over broadleaf forests. Inversely, the winter season dataset over needleleaf forest showed slightly higher RMSE values, which could be due to atmospheric conditions, cloud effects, snow, and snow-canopy interactions. However, a deep investigation into canopy-snow interaction and its impact on GEDI canopy heights is suggested.
While considering the effect of plant area index (PAI) on GEDI canopy height accuracies, dividing the dataset into the growing and non-growing seasons resulted in similar achievements as the leaf-on and leaf-off seasons, respectively. In other words, in the broadleaf forest, the GEDI dataset of the non-growing season that contains a low amount of PAI (median PAI < 2) outperformed the growing season dataset (median PAI > 2). The reverse result was observed in needleleaf forest. Such achievement is explained with the same logic as the leaf-off/leaf-on dataset. Although a slight improvement in canopy height estimation was observed using either leaf-off or non-growing season dataset for the broadleaf forest, and either leaf-on or growing season dataset for the needleleaf forest, the approach of filtering GEDI data based on such seasonal changes affecting the vertical structure of the forest is recommended when considering either pure broadleaf or needleleaf forest and a sufficient dataset is available. This approach is expected to obtain more interesting results over highly dense forests, and it is worth further investigation.
Author Contributions
Conceptualization, N.B.; Methodology, M.R.P. and N.B.; Software, M.R.P. and I.F.; Validation, M.R.P.; Formal analysis, M.R.P.; Investigation, M.R.P.; Resources, M.R.P. and I.F.; Data curation, M.R.P.; Writing—original draft, M.R.P.; Writing—review & editing, M.R.P.; Visualization, M.R.P.; Supervision, N.B.; Project administration, N.B. All authors have read and agreed to the published version of the manuscript.
Funding
This research was funded by the French Space Study Center (CNES, TOSCA 2022 project) and the National Research Institute for Agriculture, Food, and the Environment (INRAE).
Acknowledgments
The authors would like to thank the GEDI team and the NASA LPDAAC (Land Processes Distributed Active Archive Center) for providing GEDI data. The authors also thank the Thuringian land surveying office for making ALS and forest type data freely available.
Conflicts of Interest
The authors declare no conflict of interest.
References
- Chen, Q.; Gao, T.; Zhu, J.; Wu, F.; Li, X.; Lu, D.; Yu, F. Individual tree segmentation and tree height estimation using leaf-off and leaf-on UAV-LiDAR data in dense deciduous forests. Remote Sens. 2022, 14, 2787. [Google Scholar] [CrossRef]
- Kwak, D.-A.; Lee, W.-K.; Lee, J.-H.; Biging, G.S.; Gong, P. Detection of individual trees and estimation of tree height using lidar data. J. For. Res. 2007, 12, 425–434. [Google Scholar] [CrossRef]
- Douss, R.; Farah, I.R. Extraction of individual trees based on Canopy Height Model to monitor the state of the forest. Trees For. People 2022, 8, 100257. [Google Scholar] [CrossRef]
- Adam, M.; Urbazaev, M.; Dubois, C.; Schmullius, C. Accuracy Assessment of GEDI Terrain Elevation and Canopy Height Estimates in European Temperate Forests: Influence of Environmental and Acquisition Parameters. Remote Sens. 2020, 12, 3948. [Google Scholar] [CrossRef]
- Fayad, I.; Baghdadi, N.; Lahssini, K. An Assessment of the GEDI Lasers’ Capabilities in Detecting Canopy Tops and Their Penetration in a Densely Vegetated, Tropical Area. Remote Sens. 2022, 14, 2969. [Google Scholar] [CrossRef]
- Dhargay, S.; Lyell, C.S.; Brown, T.P.; Inbar, A.; Sheridan, G.J.; Lane, P.N.J. Performance of GEDI space-borne lidar for quantifying structural variation in the temperate forests of south-eastern Australia. Remote Sens. 2022, 14, 3615. [Google Scholar] [CrossRef]
- Potapov, P.; Li, X.; Hernandez-Serna, A.; Tyukavina, A.; Hansen, M.C.; Kommareddy, A.; Pickens, A.; Turubanova, S.; Tang, H.; Silva, C.E.; et al. Mapping global forest canopy height through integration of GEDI and Landsat data. Remote Sens. Environ. 2020, 253, 112165. [Google Scholar] [CrossRef]
- Lahssini, K.; Baghdadi, N.; le Maire, G.; Fayad, I. Influence of GEDI Acquisition and Processing Parameters on Canopy Height Estimates over Tropical Forests. Remote Sens. 2022, 14, 6264. [Google Scholar] [CrossRef]
- Pourrahmati, M.R.; Baghdadi, N.N.; Darvishsefat, A.A.; Namiranian, M.; Fayad, I.; Bailly, J.-S.; Gond, V. Capability of GLAS/ICESat Data to Estimate Forest Canopy Height and Volume in Mountainous Forests of Iran. IEEE J. Sel. Top. Appl. Earth Obs. Remote Sens. 2015, 8, 5246–5261. [Google Scholar] [CrossRef] [Green Version]
- Rishmawi, K.; Huang, C.; Zhan, X. Monitoring key forest structure attributes across the conterminous united states by integrating GEDI LiDAR measurements and VIIRS data. Remote Sens. 2021, 13, 442. [Google Scholar] [CrossRef]
- Duncanson, L.; Neuenschwander, A.; Hancock, S.; Thomas, N.; Fatoyinbo, T.; Simard, M.; Silva, C.A.; Armston, J.; Luthcke, S.B.; Hofton, M.; et al. Biomass estimation from simulated GEDI, ICESat-2 and NISAR across environmental gradients in Sonoma County, California. Remote Sens. Environ. 2020, 242, 111779. [Google Scholar] [CrossRef]
- Urbazaev, M.; Hess, L.L.; Hancock, S.; Sato, L.Y.; Ometto, J.P.; Thiel, C.; Dubois, C.; Heckel, K.; Urban, M.; Adam, M.; et al. Assessment of terrain elevation estimates from ICESat-2 and GEDI spaceborne LiDAR missions across different land cover and forest types. Sci. Remote Sens. 2022, 6, 100067. [Google Scholar] [CrossRef]
- Fayad, I.; Baghdadi, N.; Frappart, F. Comparative Analysis of GEDI’s Elevation Accuracy from the First and Second Data Product Releases over Inland Waterbodies. Remote Sens. 2022, 14, 340. [Google Scholar] [CrossRef]
- Fayad, I.; Baghdadi, N.; Bailly, J.S.; Frappart, F.; Zribi, M. Analysis of GEDI Elevation Data Accuracy for Inland Waterbodies Altimetry. Remote Sens. 2020, 12, 2714. [Google Scholar] [CrossRef]
- Sun, M.; Cui, L.; Park, J.; García, M.; Zhou, Y.; Silva, C.A.; He, L.; Zhang, H.; Zhao, K. Evaluation of NASA’s GEDI Lidar Observations for Estimating Biomass in Temperate and Tropical Forests. Forests 2022, 13, 1686. [Google Scholar] [CrossRef]
- Qi, W.; Lee, S.K.; Hancock, S.; Luthcke, S.; Tang, H.; Armston, J.; Dubayah, R. Improved forest height estimation by fusion of simulated GEDI Lidar data and TanDEM-X InSAR data. Remote Sens. Environ. 2019, 221, 621–634. [Google Scholar] [CrossRef] [Green Version]
- Duncanson, L.; Kellner, J.R.; Armston, J.; Dubayah, R.; Minor, D.M.; Hancock, S.; Healey, S.P.; Patterson, P.L.; Saarela, S.; Marselis, S.; et al. Aboveground biomass density models for NASA’s Global Ecosystem Dynamics Investigation (GEDI) lidar mission. Remote Sens. Environ. 2022, 270, 112845. [Google Scholar] [CrossRef]
- Qi, W.; Saarela, S.; Armston, J.; Stahl, G.; Dubayah, R. Forest biomass estimation over three distinct forest types using TanDEM-X InSAR data and simulated GEDI lidar data. Remote Sens. Environ. 2019, 232, 111283. [Google Scholar] [CrossRef]
- Healey, S.P.; Yang, Z.; Gorelick, N.; Ilyushchenko, S. Highly Local Model Calibration with a New GEDI LiDAR Asset on Google Earth Engine Reduces Landsat Forest Height Signal Saturation. Remote Sens. 2020, 12, 2840. [Google Scholar] [CrossRef]
- Chen, L.; Ren, C.; Zhang, B.; Wang, Z.; Liu, M.; Man, W.; Liu, J. Improved estimation of forest stand volume by the integration of GEDI LiDAR data and multi-sensor imagery in the Changbai Mountains Mixed forests Ecoregion (CMMFE), northeast China. Int. J. Appl. Earth Obs. Geoinf. 2021, 100, 102326. [Google Scholar] [CrossRef]
- Xu, P.; Zhou, T.; Yi, C.; Fang, W.; Hendrey, G.; Zhao, X. Forest drought resistance distinguished by canopy height. Environ. Res. Lett. 2018, 13, 075003. [Google Scholar] [CrossRef] [Green Version]
- Moradi, F.; Darvishsefat, A.A.; Pourrahmati, M.R.; Deljouei, A.; Borz, S.A. Estimating aboveground biomass in dense Hirnantian forests by the use of Sentinel-2 data. Forests 2022, 13, 104. [Google Scholar] [CrossRef]
- Marselis, S.M.; Tang, H.; Armston, J.; Abernethy, K.; Alonso, A.; Barbier, N.; Bissiengou, P.; Jeffery, K.; Kenfack, D.; Labrière, N.; et al. Exploring the relation between remotely sensed vertical canopy structure and tree species diversity in Gabon. Environ. Res. Lett. 2019, 14, 094013. [Google Scholar] [CrossRef]
- Dubayah, R.O.; Sheldon, S.L.; Clark, D.B.; Hofton, M.A.; Blair, J.B.; Hurtt, G.C.; Chazdon, R.L. Estimation of Tropical Forest Height and Biomass Dynamics Using LiDAR Remote Sensing at La Selva, Costa Rica. J. Geophys. Res. 2010, 115, G00E09. [Google Scholar] [CrossRef]
- Liu, A.; Cheng, X.; Chen, Z. Performance evaluation of GEDI and ICESat-2 laser altimeter data for terrain and canopy height retrievals. Remote Sens. Environ. 2021, 264, 112571. [Google Scholar] [CrossRef]
- Li, B.; Zhao, T.; Su, X.; Fan, G.; Zhang, W.; Deng, Z.; Yu, Y. Correction of Terrain Effects on Forest Canopy Height Estimation Using ICESat-2 and High Spatial Resolution Images. Remote Sens. 2022, 14, 4453. [Google Scholar] [CrossRef]
- Fayad, I.; Baghdadi, N.; Alcarde Alvares, C.; Stape, J.L.; Bailly, J.S.; Scolforo, H.F.; Cegatta, I.R.; Zribi, M.; Le Maire, G. Terrain slope effect on forest height and wood volume estimation from GEDI data. Remote Sens. 2021, 13, 2136. [Google Scholar] [CrossRef]
- Heurich, M.; Thoma, F. Estimation of forestry stand parameters using laser scanning data in temperate, structurally rich natural European beech (Fagus sylvatica) and Norway spruce (Picea abies) forests. For. Int. J. For. Res. 2008, 81, 645–661. [Google Scholar] [CrossRef] [Green Version]
- Dorado-Roda, I.; Pascual, A.; Godinho, S.; Silva, C.A.; Botequim, B.; Rodríguez-Gonzálvez, P.; González-Ferreiro, E.; GuerraHernández, J. Assessing the accuracy of GEDI Data for canopy height and aboveground biomass estimates in mediterranean forests. Remote Sens. 2021, 13, 2279. [Google Scholar] [CrossRef]
- Wang, C.; Elmore, A.J.; Numata, I.; Cochrane, M.A.; Shaogang, L.; Huang, J.; Zhao, Y.; Li, Y. Factors affecting relative height and ground elevation estimations of GEDI among forest types across the conterminous USA. GISci. Remote Sens. 2022, 59, 975–999. [Google Scholar] [CrossRef]
- Li, X.; Wessels, K.; Armston, J.; Hancock, S.; Mathieu, R.; Main, R.; Naidoo, L.; Erasmus, B.; Scholes, R. First validation of GEDI canopy heights in African savannas. Remote Sens. Environ. 2023, 285, 113402. [Google Scholar] [CrossRef]
- Eglitis, L. WorldData.info. Available online: https://www.worlddata.info/europe/germany/climate-thuringia.php#:~:text=Thuringia%20is%20the%20coldest%20region,rarely%20gets%20really%20warm%20here (accessed on 15 December 2022).
- Welle, T.; Aschenbrenner, L.; Kuonath, K.; Kirmaier, S.; Franke, J. Mapping dominant tree species of German forests. Remote Sens. 2022, 14, 3330. [Google Scholar] [CrossRef]
- Thonfeld, F.; Abdullahi, S.; Asam, S.; Da Ponte Canova, E.; Gessner, U.; Huth, J.; Kraus, T.; Leutner, B.; Kuenzer, C. Earth observation based monitoring of forests in Germany: A review Stefanie Holzwarth. Remote Sens. 2020, 12, 3570. [Google Scholar]
- The European State Forest Association, THÜRINGENFORST AÖR. Available online: https://eustafor.eu/members/thuringia (accessed on 25 November 2022).
- Thüringer Landesamt für Bodenmanagement und Geoinformation (TLBG). ATKIS Basis-DLM, Thüringen Komplett. Available online: https://www.geoportal-th.de/de-de/Downloadbereiche/Download-O_ene-Geodaten-Th%C3%BCringen/Download-ATKIS-Basis-DLM (accessed on 2 September 2022).
- Dubayah, R.; Blair, J.B.; Goetz, S.; Fatoyinbo, L.; Hansen, M.; Healey, S.; Hofton, M.; Hurtt, G.; Kellner, J.; Luthcke, S.; et al. The global ecosystem dynamics investigation: High-resolution laser ranging of the earth’s forests and topography. Sci. Remote Sens. 2020, 1, 100002. [Google Scholar] [CrossRef]
- Hofton, M.; Blair, J.B. Algorithm Theoretical Basis Document (ATBD) For GEDI Transmit and Receive Waveform Processing for L1 and L2 Products; Goddard Space Flight Center: Greenbelt, MD, USA, 2019. Available online: https://lpdaac.usgs.gov/documents/581/GEDI_WF_ATBD_v1.0.pdf (accessed on 10 September 2022).
- Tang, H.; Armston, J. Algorithm Theoretical Basis Document (ATBD) for GEDI L2B Footprint Canopy Cover and Vertical Profile Metrics; Goddard Space Flight Center: Greenbelt, MD, USA, 2019. Available online: https://lpdaac.usgs.gov/documents/588/GEDI_FCCVPM_ATBD_v1.0.pdf (accessed on 10 September 2022).
- Thüringer Landesamt für Bodenmanagement und Geoinformation (TLBG). Available online: https://www.geoportal-th.de/de-de/Downloadbereiche/Download-O_ene-Geodaten-Th%C3%BCringen/Download-H%C3%B6hendaten (accessed on 2 September 2022).
- Arbeitsgemeinschaft der Vermessungsverwaltungen der Länder der Bundesrepublik Deutschland (AdV). Dokumentation zur Modellierung der Geoinformationen des Amtlichen Vermessungswesens (GeoInfoDok), 6.0.1 ed.; AdV: München, Germany, 2020; Available online: https://www.adv-online.de/GeoInfoDok/GeoInfoDok-6.0/ (accessed on 29 September 2022).
- Roy, D.P.; Kashongwe, H.B.; Armston, J. The impact of geolocation uncertainty on GEDI tropical forest canopy height estimation and change monitoring. Sci. Remote Sens. 2021, 4, 100024. [Google Scholar] [CrossRef]
- Adrah, E.; Wan Mohd Jaafar, W.S.; Omar, H.; Bajaj, S.; Leite, R.V.; Mazlan, S.M.; Silva, C.A.; Chel Gee Ooi, M.; Mohd Said, M.N.; Abdul Maulud, K.N.; et al. Analyzing Canopy Height Patterns and Environmental Landscape Drivers in Tropical Forests Using NASA’s GEDI Spaceborne LiDAR. Remote Sens. 2022, 14, 3172. [Google Scholar] [CrossRef]
- Hancock, S.; McGrath, C.; Lowe, C.; Davenport, I.; Woodhouse, I. Requirements for a global lidar system: Spaceborne lidar with wall-to-wall coverage. R. Soc. Open Sci. 2021, 8, 211166. [Google Scholar] [CrossRef]
- Liu, Z.; Jin, G.; Qi, Y. Estimate of leaf area index in an old-growth mixed broadleaved-korean pine forest in northeastern China. PLoS ONE 2012, 7, e32155. [Google Scholar]
- The National Oceanic and Atmospheric Administration (NOAA), Global Monitoring Laboratory. NOAA Solar Calculator. Available online: https://gml.noaa.gov/grad/solcalc/ (accessed on 15 December 2022).
- Gower, S.T.; Norman, J.M. Rapid Estimation of Leaf Area Index in Conifer and Broad-Leaf Plantations. Ecology 1991, 72, 1896–1900. [Google Scholar] [CrossRef]
- Fang, H.; Baret, F.; Plummer, S.; Schaepman-Strub, G. An Overview of Global Leaf Area Index (LAI): Methods, Products, Validation, and Applications. Rev. Geophys. 2019, 57, 739–799. [Google Scholar] [CrossRef]
- Leys, C.; Ley, C.; Klein, O.; Bernard, P.; Licata, L. Detecting outliers: Do not use standard deviation around the mean, use absolute deviation around the median. J. Exp. Soc. Psychol. 2013, 49, 764–766. [Google Scholar] [CrossRef] [Green Version]
- Piao, S.; Liu, Q.; Chen, A.; Janssens, I.; Fu, Y.; Dai, J.; Liu, L.; Lian, X.; Shen, M.; Zhu, X. Plant phenology and global climate change: Current progresses and challenges. Glob. Chang. Biol. 2019, 25, 1922–1940. [Google Scholar] [CrossRef] [PubMed]
- Hilbert, C.; Schmullius, C. Influence of Surface Topography on ICESat/GLAS Forest Height Estimation and Waveform Shape. Remote Sens. 2012, 4, 2210–2235. [Google Scholar] [CrossRef] [Green Version]
- Liu, Y.; Liu, R.; Pisek, J.; Chen, J.M. Separating overstory and understory leaf area indices for global needleleaf and deciduous broadleaf forests by fusion of MODIS and MISR data. Biogeosciences 2017, 14, 1093–1110. [Google Scholar] [CrossRef] [Green Version]
- Pisek, J.; Chen, J.M.; Alikas, K.; Deng, F. Impacts of including forest understory brightness and foliage clumping information from multi-angular measurements on leaf area index mapping over North America. J. Geophys. Res. 2010, 115, G03023. [Google Scholar] [CrossRef] [Green Version]
- Wasser, L.; Day, R.; Chasmer, L.; Taylor, A. Influence of vegetation structure on LiDAR-derived canopy height and fractional cover in forested riparian buffers during leaf-off and leaf-on conditions. PLoS ONE 2013, 8, e54776. [Google Scholar] [CrossRef] [Green Version]
- Olesk, A.; Praks, J.; Antropov, O.; Zalite, K.; Arume, T.; Voormansik, K. Interferometric SAR coherence models for characterization of hemiboreal forests using tandem-x data. Remote Sens. 2016, 8, 700. [Google Scholar] [CrossRef] [Green Version]
- Deems, J.S.; Painter, T.H.; Finnegan, D.C. Lidar measurement of snow depth: A review. J. Glaciol. 2013, 59, 467–479. [Google Scholar] [CrossRef] [Green Version]
- Dickerson-Lange, S.E.; Gersonde, R.F.; Hubbart, J.A.; Link, T.E.; Nolin, A.W.; Perry, G.H.; Roth, T.R.; Wayand, N.E.; Lundquist, J.D. Snow disappearance timing is dominated by forest effects on snow accumulation in warm winter climates of the Pacific Northwest, United States. Hydrol. Process. 2017, 31, 1846–1862. [Google Scholar] [CrossRef]
- Kempes, C.P.; West, G.B.; Crowell, K.; Girvan, M. Predicting Maximum Tree Heights and Other Traits from Allometric Scaling and Resource Limitations. PLoS ONE 2011, 6, e20551. [Google Scholar] [CrossRef] [Green Version]
- Zhang, G.; Ganguly, S.; Nemani, R.R.; White, M.A.; Milesi, C.; Hashimoto, H.; Wang, W.; Saatchi, S.; Yu, Y.; Myneni, R.B. Estimation of forest aboveground biomass in California using canopy height and leaf area index estimated from satellite data. Remote Sens. Environ. 2014, 151, 44–56. [Google Scholar] [CrossRef]
Figure 2.
Examples of acquired GEDI waveform over broadleaf: (a) leaf-off, (b) leaf-on; and needleleaf: (c) winter, (d) summer. Location and acquisition date (year/month) of used GEDI waveforms and the distance between two dates in each forest type is noted.
Figure 2.
Examples of acquired GEDI waveform over broadleaf: (a) leaf-off, (b) leaf-on; and needleleaf: (c) winter, (d) summer. Location and acquisition date (year/month) of used GEDI waveforms and the distance between two dates in each forest type is noted.

Figure 3.
GEDI-H100 versus ALS-Hmax for each algorithm setting group ((a–f) for algorithms a1 to a6).
Figure 3.
GEDI-H100 versus ALS-Hmax for each algorithm setting group ((a–f) for algorithms a1 to a6).

Figure 4.
GEDI-H100 versus ALS-Hmax for algorithm group 2 in three forest types, including (a) broadleaf, (b) needleleaf, and (c) mixed.
Figure 4.
GEDI-H100 versus ALS-Hmax for algorithm group 2 in three forest types, including (a) broadleaf, (b) needleleaf, and (c) mixed.

Figure 5.
H100_difference (GEDI H100−ALS Hmax) versus sensitivity for (a) broadleaf, (b) needleleaf, and (c) mixed forests. In addition, the number of GEDI shots (n) is displayed for each sensitivity range.
Figure 5.
H100_difference (GEDI H100−ALS Hmax) versus sensitivity for (a) broadleaf, (b) needleleaf, and (c) mixed forests. In addition, the number of GEDI shots (n) is displayed for each sensitivity range.

Figure 6.
Distribution of canopy cover over (a) broadleaf (b) needleleaf, and (c) mixed forest.

Figure 7.
GEDI-H100 versus ALS-Hmax in the three forest types with sensitivity < 0.96 (a–c) and sensitivity > 0.96 (d–f).
Figure 7.
GEDI-H100 versus ALS-Hmax in the three forest types with sensitivity < 0.96 (a–c) and sensitivity > 0.96 (d–f).

Figure 8.
GEDI-H100 versus ALS-Hmax in the three forest types with sensitivity < 0.90 (a–c) and sensitivity > 0.90 (d–f).
Figure 8.
GEDI-H100 versus ALS-Hmax in the three forest types with sensitivity < 0.90 (a–c) and sensitivity > 0.90 (d–f).

Figure 9.
Relationship between accuracy criteria (RMSE and Bias) and sensitivity: (a) RMSE, broadleaf, (b) RMSE, needleleaf, and (c) RMSE, mixed forest, (d) Bias, broadleaf, (e) Bias, needleleaf, and (f) Bias, mixed forest in leaf-off and leaf-on seasons.
Figure 9.
Relationship between accuracy criteria (RMSE and Bias) and sensitivity: (a) RMSE, broadleaf, (b) RMSE, needleleaf, and (c) RMSE, mixed forest, (d) Bias, broadleaf, (e) Bias, needleleaf, and (f) Bias, mixed forest in leaf-off and leaf-on seasons.

Figure 10.
Boxplot of H_difference (GEDI H100-ALS Hmax) on canopy cover for (a) broadleaf, (b) needleleaf, and (c) Mixed forest.
Figure 10.
Boxplot of H_difference (GEDI H100-ALS Hmax) on canopy cover for (a) broadleaf, (b) needleleaf, and (c) Mixed forest.

Figure 11.
Boxplot of H_difference on acquisition time for (a) broadleaf, (b) needleleaf, and (c) mixed forest.
Figure 11.
Boxplot of H_difference on acquisition time for (a) broadleaf, (b) needleleaf, and (c) mixed forest.

Figure 12.
Boxplot of H_difference on beam type for (a) broadleaf, (b) needleleaf, and (c) mixed forest.
Figure 12.
Boxplot of H_difference on beam type for (a) broadleaf, (b) needleleaf, and (c) mixed forest.

Figure 13.
Boxplot of H_difference on plant area index (PAI) for (a) broadleaf, (b) needleleaf, and (c) mixed forest.
Figure 13.
Boxplot of H_difference on plant area index (PAI) for (a) broadleaf, (b) needleleaf, and (c) mixed forest.

Figure 14.
Boxplot of PAI on monthly acquisition time for (a) broadleaf, (b) needleleaf, and (c) mixed forest. The lower and upper hinge of the boxes indicates the 25th and 75th percentile of the data, respectively.
Figure 14.
Boxplot of PAI on monthly acquisition time for (a) broadleaf, (b) needleleaf, and (c) mixed forest. The lower and upper hinge of the boxes indicates the 25th and 75th percentile of the data, respectively.

Figure 15.
GEDI-H100 versus ALS-Hmax in the three forest types with median_pai < 2 (a–c) and median_pai > 2 (d–f).
Figure 15.
GEDI-H100 versus ALS-Hmax in the three forest types with median_pai < 2 (a–c) and median_pai > 2 (d–f).


Table 1.
Statistic criteria for accuracy assessment of canopy height estimates.
| Criteria | Description | Equation |
|---|---|---|
| RMSE | Root mean square error | |
| R2 | Square of the correlation coefficient | |
| Bias | Mean difference between estimated and observed value | |
| Median | The middle of a dataset when it is ordered | - |
| MAD | Median absolute deviation | 1.4826 × median (|Δhi-mΔh|) |
| xi: GEDI height; yi: ALS height; : mean GEDI height; : mean ALS height n: number of GEDI footprints; Δhi: (xi − yi); mΔh: median of Δh | ||
Table 2.
Accuracy metrics of GEDI H100 estimates derived with different algorithm groups.
| Algorithm Group | RMSE (m) | R2 | Bias (m) | Median (m) | MAD (m) | Footprints |
|---|---|---|---|---|---|---|
| a1 | 8.952 | 0.68 | −3.31 | −0.94 | 3.85 | 461802 |
| a2 | 7.458 | 0.74 | −1.63 | −0.44 | 3.9 | 507892 |
| a3 | 8.539 | 0.69 | −2.69 | −0.7 | 4.03 | 480710 |
| a4 | 10.333 | 0.65 | −5.53 | −2.71 | 4.63 | 444350 |
| a5 | 9.625 | 0.7 | 2.92 | 2.44 | 7.07 | 515869 |
| a6 | 7.805 | 0.73 | −1.2 | −0.19 | 4.24 | 504041 |
Table 3.
Statistics of H100_difference for two groups of datasets based on beam type in three forest types.
Table 3.
Statistics of H100_difference for two groups of datasets based on beam type in three forest types.
| Forest Type | Beam Type | Median H100_difference (m) | MAD H100_difference (m) | Number of Footprints |
|---|---|---|---|---|
| Broadleaf | Coverage | −1.85 | 4.82 | 63,524 |
| Power | 0.27 | 3.87 | 71,823 | |
| Needleleaf | Coverage | −1.2 | 3.53 | 113,956 |
| Power | 0.38 | 3.11 | 121,365 | |
| Mixed | Coverage | −1.59 | 4.85 | 63,467 |
| Power | 0.35 | 4.12 | 73,757 |
Table 4.
Statistics of H100_difference for two groups of datasets based on beam type and acquisition time in three forest types.
Table 4.
Statistics of H100_difference for two groups of datasets based on beam type and acquisition time in three forest types.
| Forest Type | Acquisition Time | Median H100_difference (m) | MAD H100_difference (m) | Number of Footprints (n) |
|---|---|---|---|---|
| Broadleaf | Day | −0.88 | 4.54 | 70,707 |
| Night | −0.35 | 4.08 | 64,640 | |
| Needleleaf | Day | −0.43 | 3.59 | 123,031 |
| Night | −0.25 | 3.25 | 112,290 | |
| Mixed | Day | −0.77 | 4.73 | 69,764 |
| Night | −0.2 | 4.26 | 67,460 |
Disclaimer/Publisher’s Note: The statements, opinions and data contained in all publications are solely those of the individual author(s) and contributor(s) and not of MDPI and/or the editor(s). MDPI and/or the editor(s) disclaim responsibility for any injury to people or property resulting from any ideas, methods, instructions or products referred to in the content. |
© 2023 by the authors. Licensee MDPI, Basel, Switzerland. This article is an open access article distributed under the terms and conditions of the Creative Commons Attribution (CC BY) license (https://creativecommons.org/licenses/by/4.0/).
Share and Cite
MDPI and ACS Style
Rajab Pourrahmati, M.; Baghdadi, N.; Fayad, I. Comparison of GEDI LiDAR Data Capability for Forest Canopy Height Estimation over Broadleaf and Needleleaf Forests. Remote Sens. 2023, 15, 1522. https://doi.org/10.3390/rs15061522
AMA Style
Rajab Pourrahmati M, Baghdadi N, Fayad I. Comparison of GEDI LiDAR Data Capability for Forest Canopy Height Estimation over Broadleaf and Needleleaf Forests. Remote Sensing. 2023; 15(6):1522. https://doi.org/10.3390/rs15061522
Chicago/Turabian StyleRajab Pourrahmati, Manizheh, Nicolas Baghdadi, and Ibrahim Fayad. 2023. "Comparison of GEDI LiDAR Data Capability for Forest Canopy Height Estimation over Broadleaf and Needleleaf Forests" Remote Sensing 15, no. 6: 1522. https://doi.org/10.3390/rs15061522
Note that from the first issue of 2016, this journal uses article numbers instead of page numbers. See further details here.