Communication

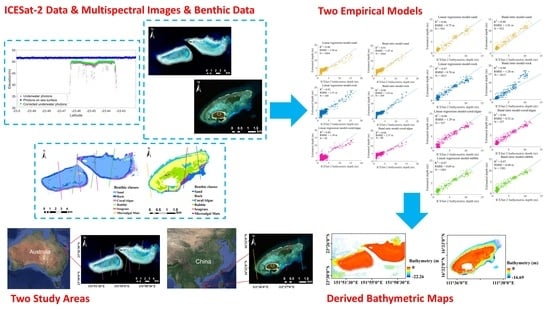
Satellite-Derived Bathymetry with Sediment Classification Using ICESat-2 and Multispectral Imagery: Case Studies in the South China Sea and Australia

1
College of Geodesy and Geomatics, Shandong University of Science and Technology, Qingdao 266590, China
2
The Sino-Australian Research Consortium for Coastal Management, School of Science, University of New South Wales (UNSW Canberra), Canberra, ACT 2600, Australia
3
School of Electronic Information, Wuhan University, Wuhan 430072, China
*
Author to whom correspondence should be addressed.
Remote Sens. 2023, 15(4), 1026; https://doi.org/10.3390/rs15041026
Submission received: 11 January 2023 / Revised: 6 February 2023 / Accepted: 9 February 2023 / Published: 13 February 2023

Abstract

:
Achieving coastal and shallow-water bathymetry is essential for understanding the marine environment and for coastal management. Bathymetric data in shallow sea areas can currently be obtained using SDB (satellite-derived bathymetry) with multispectral satellites based on depth inversion models. In situ bathymetric data are crucial for validating empirical models but are currently limited in remote and unapproachable areas. In this paper, instead of using the measured water depth data, ICESat-2 (Ice, Cloud, and Land Elevation Satellite-2) ATL03 bathymetric points at different acquisition dates and multispectral imagery from Sentinel-2/GeoEye-1 were used to train and evaluate water depth inversion empirical models in two study regions: Shanhu Island in the South China Sea, and Heron Island in the Great Barrier Reef (GBR) in Australia. However, different sediment types also influenced the SDB results. Therefore, three types of sediments (sand, reef, and coral/algae) were analyzed for Heron Island, and four types of sediments (sand, reef, rubble and coral/algae) were analyzed for Shanhu Island. The results show that accuracy generally improved when sediment classification information was considered in both study areas. For Heron Island, the sand sediments showed the best performance in both models compared to the other sediments, with mean R2 and RMSE values of 0.90 and 1.52 m, respectively, representing a 5.6% improvement of the latter metric. For Shanhu Island, the rubble sediments showed the best accuracy in both models, and the average R2 and RMSE values were 0.97 and 0.65 m, respectively, indicating an RMSE improvement of 15.5%. Finally, bathymetric maps were generated in two regions based on the sediment classification results.

Graphical Abstract

1. Introduction

Shallow waters and coastal areas play significant roles in marine and coastal ecosystems and human communities, especially in an era of rising sea levels due to global warming [1,2,3]. Underwater bathymetry is used as an quantitative indicator to define shallow waters in marine and coastal habitats [4]. Accurate water depth information is a crucial parameter for marine and coastal applications, such as ocean modeling, navigation safety, coastal management and environmental protection [5,6]. Traditionally, single-beam or multibeam echo sounders can produce high-resolution bathymetric data in shallow water areas. However, it is challenging to acquire such information in regions with complex topography, due to the limited spheres of ship-based platforms [7,8]. In recent years, airborne LiDAR bathymetry (ALB) systems have been widely used to obtain the above and underwater topography of coastal areas quickly and accurately [1,8]. However, such methods cannot be used in remote or sensitive areas that are difficult for aircraft to reach. These approaches have some spatial resolution and coverage limitations, have difficulty obtaining large-scale measurements, and are both costly and time-consuming [9].
In shallow water areas, satellite remote sensing data provide an alternative technology to conventional shipborne and airborne measurements [10,11]. Satellite-derived bathymetry (SDB) is emerging as a relatively inexpensive way to realize large-scale bathymetry rapidly and efficiently, and to support traditional surveys by assessing previously inadequately surveyed areas [12,13]. In a number of SDB studies, many empirical and physics-based models have been used and developed for deriving shallow water bathymetry from the correlation between spectral reflectance and water depth [10,14,15,16,17,18,19,20,21,22]. Commonly, empirical models require in situ bathymetric data for calibration, so there are certain limitations in remote regions wherein field-measured bathymetric data are unavailable [23].
The Advanced Topographic Laser Altimeter System (ATLAS) is a 532 nm photon-counting lidar that was launched by NASA in September 2018 onboard ICESat-2 [24]. Along the laser tracks, this device can provide precise bathymetric points up to a maximum depth of ~40 m [25]. Bathymetric points detected from ICESat-2 are in common usage in areas where in situ data are unavailable, with the SDB method in recent research [11,24,26,27,28,29,30,31,32]. Thomas et al. [11] trained three SDB models with Sentinel-2 optical imagery using ICESat-2 data, including the two classical empirical models and supporting vector regression algorithms. Li et al. [10] analyzed the potential of producing high-resolution global bathymetric data with the ICESat-2 prototype, multiple altimeter beam experimental lidar (MABEL) data, and Landsat imagery. Albright et al. [27] used ICESat-2 bathymetric data with Sentinel-2 imagery to derive the seamless nearshore bathymetry of Destin, FL, USA, in areas with similar water quality. In order to exclude the impact of clouds and tides, Xu et al. [23] used multitemporal Sentinel-2 images with ICESat-2 datasets to produce high-precision shallow-water bathymetric maps in the South China Sea.
Although many studies have combined ICESat-2 data with multispectral images to derive bathymetry in shallow waters, different sediment types also influence the available empirical models [14,33,34]. The measured radiance of multispectral images is the product of both the reflected bottom properties and the overlying shallow-water column, so it is important to determine the relationships between bathymetry and sediment types [35,36]. In this paper, ICESat-2 ATL03 data and multispectral imagery (Sentinel-2 and GeoEye-1) were used to derive precise bathymetry in two study regions: Shanhu Island in the South China Sea and Heron Island in the Great Barrier Reef (GBR), Australia. First, the ICESat-2 ATL03 bathymetric points in 2018 and 2019 were detected using a modified DBSCAN (Density-Based Spatial Clustering of Applications with Noise) method, correcting for errors arising from refraction, fluctuation, and tides. Second, the calibrated ICESat-2 bathymetric points were used a priori to train the two SDB empirical models, which are widely used and have good accuracies, along with preprocessed Sentinel-2 and GeoEye-1 images. Third, the SDB method was implemented using two empirical models combined with sediment classification data in the two study areas. Finally, bathymetric maps of the two study regions were generated. The accuracies of the two analyzed empirical models between the bathymetric results derived using all points and different sediment points were also compared.

2. Study Sites and Data Sources

2.1. Study Sites

Two study areas were analyzed using multidate ICESat-2, Sentinel-2 and GeoEye-1 multispectral data in this paper. The first study area was Heron Island in the GBR, located at 23.27°–23.30°S, 151.51°–151.59°E, southeast of Australia. The second study area was Shanhu Island located at 16.31°–16.33°N, 111.35°–111.38°E, which is located in the Yongle Atoll, South China Sea. Figure 1 shows images of Heron Island and Shanhu Island along with their geographic context.

2.2. Sentinel-2 Data

The Sentinel-2A Level-1C image acquired on 17 August 2020 was used on Heron Island and is freely available from the Sentinel Data Hub of the European Space Agency (ESA) [24]. Sentinel-2’s MultiSpectral Instrument (MSI) is equipped to provide high-resolution optical imagery of interior and coastal regions [37]. The image used here was geometrically corrected with the UTM/WGS84 projection scheme. Sen2Cor (version 2.10) was used to process the Level-1C product to a Level-2A product; this is the default Level-2A processor for atmospheric corrections. In this study, Band 2 (blue), Band 3 (green), Band 4 (red) and Band 8 (NIR: near-infrared) were used with a spatial resolution of 10 m [38].

2.3. GeoEye-1 Data

One GeoEye-1 multispectral image acquired on 18 February 2013 was selected for Shanhu Island in this study. GeoEye-1 is a commercial very-high-resolution satellite, the nominal ground sample distances at the nadir of which are 0.5 m and 2 m, respectively [39]. This satellite captures data at four multispectral bands: Band 1 (blue), Band 2 (green), Band 3 (red), and Band 4 (NIR) [39]. The image used in this study was also projected with UTM/WGS84 reference system and preprocessed with an atmospheric correction applied using the FLAASH (fast line-of-sight atmospheric analysis of spectral hypercubes) model [40] in ENVI 5.3 software. Furthermore, the extracted blue and green band values were used in this study.

2.4. ICESat-2 Lidar Data

The ICESat-2 Level-2 ATL03 datasets represented in the two study areas were used to train the SDB models and validate the bathymetric inversion results. The ATL03 datasets contain latitude, longitude, and elevation information based on the WGS84 ellipsoid datum [41], as well as time data for all photons. The ATL03 raw data include significant noise due to the solar background. The ‘confidence’ parameter could be used to identify whether the photon is a signal or noise [41]. Instead of using the ATL03 results, the modified DBSCAN method based on the ‘confidence’ values was used to detect signal photons [24]. Then, the refraction effect, fluctuating effect and tides were corrected for each laser [24]. The OTPS2 tide model [42] was used to apply tide correction to the ICESat-2 points on Shanhu Island. Tide data acquired from the Bureau of Meteorology (BOM) in the Australian Government were used for the tidal correction on Heron Island.

2.5. Allen Coral Atlas Datasets

In this study, the bottom-type data were obtained from the Allen Coral Atlas [43], as shown in Figure 2. This atlas is an online database designed to offer up-to-date global coral reef maps with specific composition and structure data [44]. Two outputs can be obtained from this atlas, including geomorphic zones and benthic type information [44]. The atlas maps were generated from satellite techniques and regional field data, with Planet Dove satellite data and a spatial resolution of ~4 m [10,45]. For Heron Island, the ICESat-2 tracks corresponded to underwater areas where sediment types were composed mainly of sand, rock, and coral/algae. On Shanhu Island, the ICESat-2 tracks mainly corresponded to underwater areas where the bottom types were composed of sand, rock, rubble, and coral/algae.

3. Methods

3.1. Bathymetric Data Extraction and Bathymetric Correction of ICESat-2 Data

The standard ATL03 product cannot be directly used as it contains both signal and noise photons [41]. In this study, a modified DBSCAN method was used to extract the signal photons, the good performance of which has been verified [24,29]. The basic parameter of the DBSCAN method is the MinPts threshold. Therefore, we used an adaptive method developed in a previous study to calculate MinPts [24]:
M i n P t s = 2 S N 1 S N 2 ln ( 2 S N 1 S N 2 )
where SN1 is the expected photon number corresponding to signals, and SN2 is the expected photon number corresponding to noise.
Then, the refraction error and the fluctuation error were corrected based on methods developed in previous studies [24,25]. The tidal effect was removed using the OTPS2 tide model [42] and the tide data from BOM. In conclusion, Equation (2) can be used to indicate the bathymetry D after correction.
D = { 1 tan [ ( θ 1 θ 2 ) / 2 ] sin ( θ 1 θ 2 ) } [ R c + ( L m L c ) ] + Δ h t
where θ1 is the incidence angle to the water surface; θ2 is the refraction angle in water column; Rc represents the corrected laser range obtained from Snell’s Law; Lm is the local mean sea level and Lc is the current sea level; and Δht is the tide height.

3.2. Bathymetry Derivation with Multispectral Imagery and ICESat-2 Data

Prior to deriving the bathymetry, the pixels covered by land and deep water areas should be removed from the multispectral imagery. The normalized difference water index (NDWI) was calculated for the Sentinel-2 image using Band 3 (green) and Band 8 (NIR: near-infrared) to distinguish land in ENVI 5.3, based on the spectral differences between water and land [46]. Similarly, Band 2 (blue) was used to distinguish deep water due to the obvious spectral differences between shallow and deep water areas [23]. For the GeoEye-1 imagery, Band 2 (green) and Band 4 (NIR) were used to calculate the NDWI to distinguish land, and Band 1 (blue) was used to distinguish deep water in ENVI 5.3. After removing the land-area and deep-water pixels, the final bathymetric maps of clear, shallow water were derived in the two study areas.
Due to their simplicity and good accuracy, two classical empirical models were applied in this study [47]. Two traditional empirical SDB models were used to produce bathymetric maps of the two study sites using the green and blue bands of preprocessed Sentinel-2 and GeoEye-1 images, as well as the corrected ICESat-2 bathymetric points.
The linear regression model was developed by Lyzenga [14,33] to derive shallow water depths from multispectral images. The model calculates water depth using a log-transformed linear spectral band:
z = a 0 + i = 1 N a i ln [ L ( λ i ) L ( λ i ) ]
where z is the water depth derived from the preprocessed multispectral image, L(λi) is the water surface reflectance at the i-th band of the preprocessed multispectral image, and a0 and ai are the linear regression coefficients between the reflectance and bathymetry, obtained using the Levenberg–Marquardt (LM) algorithm in this study.
The other empirical model is the band ratio model [15]. The blue and green bands’ reflectance values as well as the prior water depth were used in this model. A logarithmic transformation relationship was derived between the ratio of the higher and lower absorption bands, and then a linear regression was established between the ratio and inversion water depth [15]. The model can be represented as follows:
z = m 1 ln ( n L ( λ 2 ) ) ln ( n L ( λ 1 ) ) m 0
where the bathymetry z is derived from the preprocessed multispectral image, L(λ1) and L(λ2) are the reflectance of the green and blue bands, and m0 and m1 are the offset and gain values of the linear regression. By minimizing the difference between the estimated depth z and the measured depth z’ with the LM algorithm, the values of n, m0 and m1 can be obtained. The R2, root mean square error (RMSE) and mean absolute error (MAE) values were calculated to evaluate the accuracy of the SDB results in this study.

4. Results

4.1. ICESat-2 Bathymetric Data with Bathymetric Error Correction

The ICESat-2 signal photons were first extracted using the method in Section 3.1. A total of twelve ICESat-2 data tracks were measured on 8 April 2019 and 15 September 2019 for Heron Island, and three tracks were measured on 22 February 2019, 22 October 2018 and 21 April 2019 for Shanhu Island. One ICESat-2 track representing Heron Island was selected as a sample to illustrate the results. The sampled track (in Figure 3) was captured at 13:25:46 local time on 15 September 2019. Both of the ICESat-2 datasets derived for Heron Island were obtained in the daytime and were very noisy. The green points are our results using the improved DBSCAN method described in Section 3.1, which performed better than the ATL03 results (the blue points) in detecting seafloor signal photons and are essential in calculating the local water depths. In Figure 3a,b, the x-axis represents the latitude of the ICESat-2 flight route and the y-axis represents the elevation of WGS84 datum. Then, the elevations of undersea photons were corrected using the method in Section 3.2. The tidal effect was also removed.

4.2. SDB with ICESat-2 Bathymetric Data and Multispectral Imagery

For the two study areas, the linear regression model (Equation (3)) and the band ratio model (Equation (4)) were trained using the corrected ICESat-2 bathymetric points and the preprocessed multispectral images. For Heron Island, the ICESat-2 data obtained on 8 April 2019 were used as training data, and the data from 15 September 2019 were used to validate the models. Training comparisons of the two models are shown in Figure 4a. N1 is the number of the used training data for the linear regression model, and N2 is the number of the used training data for the band ratio model. The number of the training ICESat-2 bathymetric points differs between the two models because some gross error points, whose radiation values do not match the water depth to be identified as likely outliers, were discarded. The R2, RMSE and MAE values were 0.89, 1.59 m and 1.39 m, respectively for the linear regression model using a total of 2009 training points, whereas the R2, RMSE and MAE values were 0.89, 1.63 m and 1.50 m, respectively for the band ratio model with a total of 2019 training points. For Shanhu Island, the ICESat-2 data obtained on 22 February 2019, 22 October 2018 were used as training data, and the data from 21 April 2019 were used to validate the models. Training comparisons of the two models are shown in Figure 4b. N is the number of the used training data for the two models of 3957 training points. The R2, RMSE and MAE values were 0.95, 0.89 m and 0.53 m, respectively for the linear regression model, whereas the R2, RMSE and MAE values were 0.98, 0.70 m and 0.42 m, respectively for the band ratio model. Table 1 shows the accuracy assessment results of the two empirical models in the two study areas.

4.3. SDB Based on Bottom Types

First, for Heron Island, we picked ICESat-2 points corresponding to the three main bottom types of (1) sand, (2) rock, and (3) coral/algae from 8 April 2019 to train the two empirical models, and used ICESat-2 data from 15 September 2019 to test the accuracy, as shown in Figure 2a. For the sand class, the R2, RMSE and MAE values were 0.90, 1.56 m, and 1.45 m, respectively for the linear regression model and 0.91, 1.47 m and 1.45 m, respectively for the band ratio model, as shown in Figure 5a,b. For the rock class, the R2, RMSE and MAE values were 0.93, 1.51 m and 1.39 m, respectively for the linear regression model and 0.90, 1.63 m and 1.52 m, respectively for the band ratio model, as shown in Figure 5c,d. For the coral/algae class, the R2, RMSE and MAE values were 0.80, 1.39 m and 1.21 m, respectively for the linear regression model and 0.88, 2.37 m and 2.27 m, respectively for the band ratio model, as shown in Figure 5e,f. Table 2 shows the accuracy assessment results of the two empirical models used for Heron Island and for the different sediment types.
There are four main sediment types on Shanhu Island: (1) sand, (2) rock, (3) rubble, and (4) coral/algae, as shown in Figure 2b. For these different bottom types, ICESat-2 data from 22 February 2019 and 22 October 2018 were used to train the two empirical models, and ICESat-2 data from 21 April 2019 were used to test the accuracy. For the sand class, the R2, RMSE and MAE values were 0.96, 0.75 m and 0.44 m, respectively for the linear regression model and 0.98, 1.01 m and 0.88 m, respectively for the band ratio model, as shown in Figure 6a,b. For the rock class, the R2, RMSE and MAE values were 0.97, 0.76 m and 0.54 m, respectively for the linear regression model and 0.98, 1.28 m and 0.68 m, respectively for the band ratio model, as shown in Figure 6c,d. For the rubble class, the R2, RMSE and MAE values were 0.96, 0.71 m and 0.49 m, respectively for the linear regression model and 0.97, 0.60 m and 0.43 m, respectively for the band ratio model, as shown in Figure 6e,f. For the coral/algae class, the R2, RMSE and MAE values were 0.96, 1.29 m and 1.14 m, respectively for the linear regression model and 0.98, 0.52 m and 0.36 m, respectively for the band ratio model, as shown in Figure 6g,h. Table 3 shows the accuracy evaluation results of the two empirical models used for the different sediment types on Shanhu Island.
Figure 7 shows the derived bathymetric maps for the two study areas. Figure 7a shows the bathymetric map of Heron Island derived using the Sentinel-2 image and the ICESat-2 data with the band ratio model of the sand sediment classification, as this map has the best accuracy among the derived maps of this island. Figure 7b shows the bathymetric map of Shanhu Island derived from the GeoEye-1 image with ICESat-2 data using the band ratio model with the rubble sediment classification, as this map has the best accuracy among the maps representing this island. The land and deep water areas were removed from the maps. The bathymetric maps were produced to maximum depths of 22.26 m on Heron Island and 16.69 m on Shanhu Island. The water quality conditions (e.g., turbidity and chlorophyll) could also affect the derived bathymetry in capturing the maximum depths in different regions [17].
It is noted that we use different regression coefficients for different classes in two models. Specifically, the regressions or training models of different sediments are illustrated in Figure 5, Table 2 at Heron Island, and in Figure 6, Table 3 at Shanhu Island. However, when generating a complete map as shown in Figure 7, we only use one model that has the best training accuracy in each study area. If we use a separate trained model for each type to generate its corresponding map, and then combine these partial maps from different types into a complete map, some depths seriously change at the boundary pixels with different sediments, making the complete map spatially inconsistent.

5. Discussion

In this study, two traditional water depth inversion empirical models were trained using ICESat-2 ATL03 bathymetric points rather than in situ bathymetric data. According to the results, the bathymetric accuracy has a well-accepted range, and the RMSEs obtained for the two inversion models in the two research areas are less than or around 10% of the maximum depths. The new method not only integrates active and passive remote sensing data within the SDB method, but also considers the impacts of different sediment types on the results obtained with traditional empirical models. The experimental results can be summarized as follows:
(1) For the two study areas, all the evaluation parameters (i.e., the R2, RMSE and MAE values) of Shanhu Island were better than those of Heron Island, as shown in Table 1, Table 2 and Table 3. The potential reasons for this finding are discussed as follows. (1) The spatial resolutions of the utilized images of the two study areas differed. The resolution of the GeoEye-1 images used for Shanhu Island was 2 m; this resolution was higher than that of the Sentinel-2 images of Heron Island, which was 10 m. The higher resolution of the GeoEye-1 images could provide a better accuracy in the bathymetry derivations. In this study, on Heron Island in the GBR, Australia, the maximum water depth detected from the ICESat-2 lidar was ~22 m, and the bathymetric maps were produced to a depth of ~22 m. On Shanhu Island in the South China Sea, the bathymetric maps were produced to a depth of ~16 m, and the maximum water depth detected from the ICESat-2 lidar was ~17 m. (2) The number of photons on Heron Island was more uneven than that on Shanhu Island. For Heron Island, most photons were concentrated in the 0–5 m depth range, which could impact the SDB results. However, the photons in the Shanhu Island region were more evenly distributed in the water column. Indeed, after resampling the shallow-water points on Heron Island, the overall accuracy was improved, and the RMSEs were improved by 11% and 15% for the two empirical models, respectively (see further discussion below).
(2) For Heron Island, the sand sediment results obtained using both models showed better performances than the results corresponding to other sediment types, according to the mean R2, RMSE and MAE values (Table 2). The reason for this result may be that sand sediments are a main component of Heron Island, corresponding to the most training points (1664 for sand sediments, 169 for rock sediments and 82 for coral/algae sediments). For Shanhu Island, the rubble sediment results of the two models had better averages and more consistent results than the results corresponding to the other sediment types. The reason for this finding may be that rubble sediments cover most of Shanhu Island, and the number of rubble sediment training samples was greatest among all sediment types, at 1501.
(3) In the two study areas, the sand sediments obtained with both models were better than the results corresponding to the two other common sediment types, i.e., rock and coral/algae sediments. The reason for this result may be that sand sediments have higher reflectance in both the blue and green bands. Therefore, the variability of their reflectance values are less dependent on the sediment type.
(4) Considering that the large number of shallow-water points could have impacts on the accuracy of the results, the shallow-water points were resampled for the two study areas. As the ICESat-2 points on Heron Island were unevenly distributed with regard to the water depth, the number of points in water shallower than 5 m was much larger than that in water deeper than 5 m. For this reason, the points in water shallower than 5 m were resampled randomly to the same density as the points deeper than 5 m to train the models and test the resulting accuracy for Heron Island, including points corresponding to different sediment classifications. Table 4 shows the consistent improvement in all parameters both with and without sediment classifications compared to the results listed in Table 1 and Table 2. The sand sediments had the best accuracy in both models, with R2, RMSE and MAE values of 0.97, 1.28 m and 1.06 m, respectively, for the linear model and 097, 1.05 m and 0.88 m, respectively, for the band ratio model. For Shanhu Island, after resampling the shallow-water points (shallower than 2 m), the accuracy was not improved compared to that obtained without resampling. The reason for this finding may be that the bathymetric points of Shanhu Island were relatively evenly distributed with regard to the water depth.
(5) In this study, the temporal and spatial mismatch problems of different data sources introduce errors in the results. On Heron Island, the used ICESat-2 data were recorded in 2018 and 2019, while the multispectral images were captured in 2020. On Shanhu Island, the ICESat-2 data were recorded in 2019, while the multispectral images were captured in 2013. Some inevitable topographic changes over time would cause errors in the results. Moreover, considering the different spatial resolutions from different datasets, matching image pixels with ICESat-2 bathymetric points can also result in additional errors, particularly when the seafloor has a relatively high slope or roughness [24].
(6) The surrounding environmental conditions during data acquisition can also affect the accuracy of the satellite-derived bathymetry. A lot of studies illustrated that water transparency, turbidity, and chlorophyll have impacts on the SDB method [17,48,49,50,51]. For the ICESat-2 datasets, although most bathymetric errors were corrected, the data are also influenced by the scattering effect in the water column (up to centimeters) [52]. For the multispectral imagery, although atmospheric correction was carried out during image pre-processing, the residuals of whitecaps and sun glint introduce errors to the derived water depths [50,53].

6. Conclusions

Notwithstanding the issues highlighted in Section 5, our main findings can be concluded as follows: (1) The proposed sediment classification approach can improve the SDB accuracy in the two study areas. For Heron Island, the sand sediment type showed the best performance in both models compared to the other sediment types, with an RMSE improvement of 5.6% compared to that derived without considering sediment classifications. For Shanhu Island, the rubble sediment results of the two models showed the best accuracy, with an RMSE improvement of 15.5% compared to that obtained without considering sediment classifications. (2) The sand sediments had better accuracies in the results of both models than the two other common sediments, i.e., rock and coral/algae sediments. (3) Resampling shallow water points can improve the SDB accuracy when these points are highly unevenly distributed in the water column. These results indicate that the SDB method considering sediment classifications can improve the SDB accuracy of the two empirical models analyzed here. This technology can provide a feasible solution for detecting large-scale water depths in remote and sensitive shallow water areas.

Author Contributions

Conceptualization, methodology and writing—original draft, S.L.; review and editing, funding acquisition and supervision, X.H.W.; conceptualization, review and editing, supervision, Y.M., review and editing, supervision, F.Y. All authors have read and agreed to the published version of the manuscript.

Funding

This research received no external funding.

Data Availability Statement

NASA’s ICESat-2 data can be downloaded from https://search.earthdata.nasa.gov/search (accessed on 1 April 2022). Sentinel-2 data can be downloaded from https://scihub.copernicus.eu/dhus/#/home (accessed on 15 June 2022). Tide data in Australia can be downloaded from http://www.bom.gov.au/australia/tides/ (accessed on 30 August 2022). Allen Coral Atlas datasets can be downloaded from http://allencoralatlas.org (accessed on 12 August 2022).

Acknowledgments

This is publication No. 97 of the Sino-Australian Research Consortium for Coastal Management. We thank the Bureau of Meteorology, Australian Government for supplying the tide data in the study area. “The Bureau of Meteorology gives no warranty of any kind whether express, implied, statutory or otherwise with respect to the availability, accuracy, currency, completeness, quality or reliability of the information, or that the information will be fit for any particular purpose or will not infringe any third party Intellectual Property rights. The Bureau’s liability for any loss, damage, cost or expense resulting from use of, or reliance on, the information is entirely excluded”.

Conflicts of Interest

The authors declare no conflict of interest.

References

  1. Costa, B.M.; Battista, T.A.; Pittman, S.J. Comparative evaluation of airborne LiDAR and ship-based multibeam SoNAR bathymetry and intensity for mapping coral reef ecosystems. Remote Sens. Environ. 2009, 113, 1082–1100. [Google Scholar] [CrossRef]
  2. Roy, B.; Penha-Lopes, G.P.; Uddin, M.S.; Kabir, M.H.; Lourenço, T.C.; Torrejano, A. Sea level rise induced impacts on coastal areas of Bangladesh and local-led community-based adaptation. Int. J. Disaster Risk Reduct. 2022, 73, 102905. [Google Scholar] [CrossRef]
  3. Scardino, G.; Anzidei, M.; Petio, P.; Serpelloni, E.; De Santis, V.; Rizzo, A.; Liso, S.I.; Zingaro, M.; Capolongo, D.; Vecchio, A.; et al. The Impact of Future Sea-Level Rise on Low-Lying Subsiding Coasts: A Case Study of Tavoliere Delle Puglie (Southern Italy). Remote Sens. 2022, 14, 4936. [Google Scholar] [CrossRef]
  4. Dong, Y.; Liu, Y.; Hu, C.; Xu, B. Coral reef geomorphology of the Spratly Islands: A simple method based on time-series of Landsat-8 multi-band inundation maps. ISPRS J. Photogramm. Remote Sens. 2019, 157, 137–154. [Google Scholar] [CrossRef]
  5. Hiriart-Bertrand, L.; Silva, J.A.; Gelcich, S. Challenges and opportunities of implementing the marine and coastal areas for indigenous peoples policy in Chile. Ocean Coast. Manag. 2020, 193, 105233. [Google Scholar] [CrossRef]
  6. Vaitis, M.; Kopsachilis, V.; Tataris, G.; Michalakis, V.-I.; Pavlogeorgatos, G. The development of a spatial data infrastructure to support marine spatial planning in Greece. Ocean Coast. Manag. 2022, 218, 106025. [Google Scholar] [CrossRef]
  7. Wang, X.; Yang, F.; Zhang, H.; Su, D.; Wang, Z.; Xu, F. Registration of Airborne LiDAR Bathymetry and Multibeam Echo Sounder Point Clouds. IEEE Geosci. Remote Sens. Lett. 2022, 19, 1–5. [Google Scholar] [CrossRef]
  8. Li, S.; Su, D.; Yang, F.; Zhang, H.; Wang, X.; Guo, Y. Bathymetric LiDAR and multibeam echo-sounding data registration methodology employing a point cloud model. Appl. Ocean Res. 2022, 123, 103147. [Google Scholar] [CrossRef]
  9. Majozi, N.P.; Salama, M.S.; Bernard, S.; Harper, D.M.; Habte, M.G. Remote sensing of euphotic depth in shallow tropical inland waters of Lake Naivasha using MERIS data. Remote Sens. Environ. 2014, 148, 178–189. [Google Scholar] [CrossRef]
  10. Li, J.; Knapp, D.E.; Schill, S.R.; Roelfsema, C.; Phinn, S.; Silman, M.; Mascaro, J.; Asner, G.P. Adaptive bathymetry estimation for shallow coastal waters using Planet Dove satellites. Remote Sens. Environ. 2019, 232, 111302. [Google Scholar] [CrossRef]
  11. Thomas, N.; Pertiwi, A.P.; Traganos, D.; Lagomasino, D.; Poursanidis, D.; Moreno, S.; Fatoyinbo, L. Space-Borne Cloud-Native Satellite-Derived Bathymetry (SDB) Models Using ICESat-2 And Sentinel-2. Geophys. Res. Lett. 2021, 48, e2020GL092170. [Google Scholar] [CrossRef]
  12. Jégat, V.; Pe’eri, S.; Freire, R.; Klemm, A.; Nyberg, J. Satellite-derived Bathymetry: Performance and Production. In Proceedings of the Canadian Hydrographic Conference, Halifax, NS, Canada, 16–19 May 2016; pp. 16–19. [Google Scholar]
  13. Hodúl, M.; Bird, S.; Knudby, A.; Chénier, R. Satellite derived photogrammetric bathymetry. ISPRS J. Photogramm. Remote Sens. 2018, 142, 268–277. [Google Scholar] [CrossRef]
  14. Lyzenga, D.R. Passive remote sensing techniques for mapping water depth and bottom features. Appl. Opt. 1978, 17, 379–383. [Google Scholar] [CrossRef] [PubMed]
  15. Stumpf, R.P.; Holderied, K.; Sinclair, M. Determination of water depth with high-resolution satellite imagery over variable bottom types. Limnol. Oceanogr. 2003, 48 Pt 2, 547–556. [Google Scholar] [CrossRef]
  16. Gholamalifard, M.; Kutser, T.; Esmaili-Sari, A.; Abkar, A.A.; Naimi, B. Remotely Sensed Empirical Modeling of Bathymetry in the Southeastern Caspian Sea. Remote Sens. 2013, 5, 2746–2762. [Google Scholar] [CrossRef]
  17. Cahalane, C.; Magee, A.; Monteys, X.; Casal, G.; Hanafin, J.; Harris, P. A comparison of Landsat 8, RapidEye and Pleiades products for improving empirical predictions of satellite-derived bathymetry. Remote Sens. Environ. 2019, 233, 111414. [Google Scholar] [CrossRef]
  18. Lee, Z.; Carder, K.L.; Mobley, C.D.; Steward, R.G.; Patch, J.S. Hyperspectral remote sensing for shallow waters: 2 Deriving bottom depths and water properties by optimization. Appl. Opt. 1999, 38, 3831–3843. [Google Scholar] [CrossRef]
  19. Dörnhöfer, K.; Göritz, A.; Gege, P.; Pflug, B.; Oppelt, N. Water Constituents and Water Depth Retrieval from Sentinel-2A—A First Evaluation in an Oligotrophic Lake. Remote Sens. 2016, 8, 941. [Google Scholar] [CrossRef]
  20. Roelfsema, C.; Kovacs, E.; Ortiz, J.C.; Wolff, N.H.; Callaghan, D.; Wettle, M.; Ronan, M.; Hamylton, S.M.; Mumby, P.J.; Phinn, S. Coral reef habitat mapping: A combination of object-based image analysis and ecological modelling. Remote Sens. Environ. 2018, 208, 27–41. [Google Scholar] [CrossRef]
  21. Kutser, T.; Hedley, J.; Giardino, C.; Roelfsema, C.; Brando, V.E. Remote sensing of shallow waters—A 50 year retrospective and future directions. Remote Sens. Environ. 2020, 240, 111619. [Google Scholar] [CrossRef]
  22. Caballero, I.; Stumpf, R.P. Retrieval of nearshore bathymetry from Sentinel-2A and 2B satellites in South Florida coastal waters. Estuarine Coast. Shelf Sci. 2019, 226, 106277. [Google Scholar] [CrossRef]
  23. Xu, N.; Ma, X.; Ma, Y.; Zhao, P.; Yang, J.; Wang, X.H. Deriving Highly Accurate Shallow Water Bathymetry from Sentinel-2 and ICESat-2 Datasets by a Multitemporal Stacking Method. IEEE J. Sel. Top. Appl. Earth Obs. Remote Sens. 2021, 14, 6677–6685. [Google Scholar] [CrossRef]
  24. Ma, Y.; Xu, N.; Liu, Z.; Yang, B.; Yang, F.; Wang, X.H.; Li, S. Satellite-derived bathymetry using the ICESat-2 lidar and Sentinel-2 imagery datasets. Remote Sens. Environ. 2020, 250, 112047. [Google Scholar] [CrossRef]
  25. Parrish, C.E.; Magruder, L.A.; Neuenschwander, A.L.; Forfinski-Sarkozi, N.; Alonzo, M.; Jasinski, M. Validation of ICESat-2 ATLAS Bathymetry and Analysis of ATLAS’s Bathymetric Mapping Performance. Remote Sens. 2019, 11, 1634. [Google Scholar] [CrossRef]
  26. Armon, M.; Dente, E.; Shmilovitz, Y.; Mushkin, A.; Cohen, T.J.; Morin, E.; Enzel, Y. Determining Bathymetry of Shallow and Ephemeral Desert Lakes Using Satellite Imagery and Altimetry. Geophys. Res. Lett. 2020, 47, e2020GL087367. [Google Scholar] [CrossRef]
  27. Albright, A.; Glennie, C. Nearshore Bathymetry From Fusion of Sentinel-2 and ICESat-2 Observations. IEEE Geosci. Remote Sens. Lett. 2020, 18, 900–904. [Google Scholar] [CrossRef]
  28. Li, Y.; Gao, H.; Jasinski, M.F.; Zhang, S.; Stoll, J.D. Deriving High-Resolution Reservoir Bathymetry from ICESat-2 Prototype Photon-Counting Lidar and Landsat Imagery. IEEE Trans. Geosci. Remote Sens. 2019, 57, 7883–7893. [Google Scholar] [CrossRef]
  29. Xu, N.; Ma, Y.; Zhou, H.; Zhang, W.; Zhang, Z.; Wang, X.H. A Method to Derive Bathymetry for Dynamic Water Bodies Using ICESat-2 and GSWD Data Sets. IEEE Geosci. Remote Sens. Lett. 2022, 19, 1–5. [Google Scholar] [CrossRef]
  30. Le Quilleuc, A.; Collin, A.; Jasinski, M.F.; Devillers, R. Very High-Resolution Satellite-Derived Bathymetry and Habitat Mapping Using Pleiades-1 and ICESat-2. Remote Sens. 2021, 14, 133. [Google Scholar] [CrossRef]
  31. Hsu, H.-J.; Huang, C.-Y.; Jasinski, M.; Li, Y.; Gao, H.; Yamanokuchi, T.; Wang, C.-G.; Chang, T.-M.; Ren, H.; Kuo, C.-Y.; et al. A semi-empirical scheme for bathymetric mapping in shallow water by ICESat-2 and Sentinel-2: A case study in the South China Sea. ISPRS J. Photogramm. Remote Sens. 2021, 178, 1–19. [Google Scholar] [CrossRef]
  32. Babbel, B.J.; Parrish, C.E.; Magruder, L.A. ICESat-2 Elevation Retrievals in Support of Satellite-Derived Bathymetry for Global Science Applications. Geophys. Res. Lett. 2021, 48, e2020GL090629. [Google Scholar] [CrossRef] [PubMed]
  33. Lyzenga, D.R. Remote sensing of bottom reflectance and water attenuation parameters in shallow water using aircraft and Landsat data. Int. J. Remote Sens. 1981, 2, 71–82. [Google Scholar] [CrossRef]
  34. Lyzenga, D.R. Shallow-water bathymetry using combined lidar and passive multispectral scanner data. Int. J. Remote Sens. 1985, 6, 115–125. [Google Scholar] [CrossRef]
  35. Alevizos, E.; Roussos, A.; Alexakis, D.D. Geomorphometric analysis of nearshore sedimentary bedforms from high-resolution multi-temporal satellite-derived bathymetry. Geocarto Int. 2021, 1–18. [Google Scholar] [CrossRef]
  36. Cheng, J.; Ma, Y.; Zhang, J. Water-depth-zoning inversion based on the relationship between two-band radiance data and the depth-invariant index. Reg. Stud. Mar. Sci. 2021, 44, 101790. [Google Scholar] [CrossRef]
  37. Manzo, C.; Bresciani, M.; Giardino, C.; Braga, F.; Bassani, C. Sensitivity analysis of a bio-optical model for Italian lakes focused on Landsat-8, Sentinel-2 and Sentinel-3. Eur. J. Remote Sens. 2015, 48, 17–32. [Google Scholar] [CrossRef]
  38. Hedley, J.D.; Roelfsema, C.; Brando, V.; Giardino, C.; Kutser, T.; Phinn, S.; Mumby, P.J.; Barrilero, O.; Laporte, J.; Koetz, B. Coral reef applications of Sentinel-2: Coverage, characteristics, bathymetry and benthic mapping with comparison to Landsat 8. Remote Sens. Environ. 2018, 216, 598–614. [Google Scholar] [CrossRef]
  39. Aguilar, M.A.; Saldaña, M.M.; Aguilar, F.J. GeoEye-1 and WorldView-2 pan-sharpened imagery for object-based classification in urban environments. Int. J. Remote Sens. 2012, 34, 2583–2606. [Google Scholar] [CrossRef]
  40. Anderson, G.P.; Felde, G.W.; Hoke, M.L.; Ratkowski, A.J.; Cooley, T.W.; Chetwynd, J.H., Jr.; Gardner, J.A.; Adler-Golden, S.M.; Matthew, M.W.; Berk, A.; et al. MODTRAN4-based atmospheric correction algorithm: FLAASH (Fast Line-of-sight Atmospheric Analysis of Spectral Hypercubes). Proc. SPIE-Int. Soc. Opt. 2002, 4725, 65–71. [Google Scholar] [CrossRef]
  41. Neumann, T.; Brenner, A.; Hancock, D.; Robbins, J.; Saba, J.; Harbeck, K.; Gibbons, A.J.N.A. ICE, CLOUD, and Land Elevation Satellite-2 (ICESat-2) Project: Algorithm Theoretical Basis Document (ATBD) for Global Geolocated Photons: ATL03. National Aeronautics and Space Administration, Goddard Space Flight Center. Available online: https://icesat-2.gsfc.nasa.gov/sites/default/files/files/ATL03_05June2018.pdf (accessed on 21 May 2019).
  42. Egbert, G.D.; Erofeeva, S.Y. Efficient inverse modeling of barotropic ocean tides. J. Atmos. Ocean. Technol. 2002, 19, 183–204. [Google Scholar] [CrossRef]
  43. Atlas Allen Coral. Imagery, Maps and Monitoring of the World’s Tropical Coral Reefs; Zenodo: Geneva, Switzerland, 2020. [Google Scholar]
  44. Wen, W.; Bambic, B.; White, A. Allen Coral Atlas for Coral Reef Management in Indonesia: A Brief Review; USAID: Washington, DC, USA, 2020. [Google Scholar]
  45. Lyons, M.B.; Roelfsema, C.M.; Kennedy, E.V.; Kovacs, E.M.; Borrego-Acevedo, R.; Markey, K.; Roe, M.; Yuwono, D.M.; Harris, D.L.; Phinn, S.R.; et al. Mapping the world’s coral reefs using a global multiscale earth observation framework. Remote Sens. Ecol. Conserv. 2020, 6, 557–568. [Google Scholar] [CrossRef]
  46. McFeeters, S.K. The use of the Normalized Difference Water Index (NDWI) in the delineation of open water features. Int. J. Remote Sens. 2007, 17, 1425–1432. [Google Scholar] [CrossRef]
  47. Traganos, D.; Poursanidis, D.; Aggarwal, B.; Chrysoulakis, N.; Reinartz, P. Estimating Satellite-Derived Bathymetry (SDB) with the Google Earth Engine and Sentinel-2. Remote Sens. 2018, 10, 859. [Google Scholar] [CrossRef]
  48. Caballero, I.; Stumpf, R.P.; Meredith, A. Preliminary Assessment of Turbidity and Chlorophyll Impact on Bathymetry Derived from Sentinel-2A and Sentinel-3A Satellites in South Florida. Remote Sens. 2019, 11, 645. [Google Scholar] [CrossRef]
  49. Casal, G.; Harris, P.; Monteys, X.; Hedley, J.; Cahalane, C.; McCarthy, T. Understanding satellite-derived bathymetry using Sentinel 2 imagery and spatial prediction models. GIScience Remote Sens. 2019, 57, 271–286. [Google Scholar] [CrossRef]
  50. Lafon, V.; Froidefond, J.M.; Lahet, F.; Castaing, P. SPOT shallow water bathymetry of a moderately turbid tidal inlet based on field measurements. Remote Sens. Environ. 2002, 81, 136–148. [Google Scholar] [CrossRef]
  51. Vahtmäe, E.; Kutser, T. Airborne mapping of shallow water bathymetry in the optically complex waters of the Baltic Sea. J. Appl. Remote Sens. 2016, 10, 025012. [Google Scholar] [CrossRef]
  52. Xu, N.; Zheng, H.; Ma, Y.; Yang, J.; Liu, X.; Wang, X. Global Estimation and Assessment of Monthly Lake/Reservoir Water Level Changes Using ICESat-2 ATL13 Products. Remote Sens. 2021, 13, 2744. [Google Scholar] [CrossRef]
  53. Kay, S.; Hedley, J.; Lavender, S. Sun Glint Correction of High and Low Spatial Resolution Images of Aquatic Scenes: A Review of Methods for Visible and Near-Infrared Wavelengths. Remote Sens. 2009, 1, 697–730. [Google Scholar] [CrossRef] [Green Version]
Figure 1. Locations of the two study areas ((a) Heron Island in the GBR, Australia, and (b) Shanhu Island in the South China Sea). The base map of panel (a) is a Sentinel-2 image acquired on 17 August 2020. The base map of panel (b) is a GeoEye-1 image acquired on 18 February 2013. The green lines and pink lines in panel (a) represent the laser tracks of ICESat-2 on 08 April 2019 and 15 September 2019, respectively. The yellow line, red line and blue line in panel (b) represent the laser tracks of ICESat-2 on 21 April 2019, 22 February 2019, and 22 October 2018, respectively.
Remotesensing 15 01026 g001
Figure 2. Benthic type maps from the Allen Coral Atlas showing the ICESat-2 tracks over in the two study areas: (a) Heron Island in the GBR, Australia, and (b) Shanhu Island in the South China Sea. Note that the blank areas indicate land.
Remotesensing 15 01026 g002
Figure 3. Sampled ICESat-2 tracks in Heron Reef, GBR, when ICESat-2 flew over this region at 13:25:46 local time on 15 September 2019. Panel (a) shows the signal photons detected from our results and the ATL03 results, and panel (b) shows the underwater photons (green points) corrected from our photon results (pink points).
Remotesensing 15 01026 g003
Figure 4. Bathymetry inversion comparisons of the linear regression and band ratio model in the two study areas. (a) Comparisons of the two models derived combined the ICESat-2 bathymetric points with the preprocessed Sentinel-2 image on Heron Island. Two models were trained with the ICESat-2 data from 8 April 2019 and validated with data from 15 September 2019. The orange points represent the linear regression model, and blue points represent the band ratio model. The blue line is the 1:1 line. N1 is the number of the used training data for the linear regression model, and N2 is the number of the used training data for the band ratio model. (b) Comparisons of the two derived models combined the ICESat-2 bathymetric points with the preprocessed GeoEye-1 image on Shanhu Island. The two models were trained with the ICESat-2 data from 22 February 2019 and 22 October 2018, and validated with data from 21 April 2019. The orange points represent the linear regression model, and blue points represent the band ratio model. The blue line is the 1:1 line. N is the number of the used training data for the two models.
Remotesensing 15 01026 g004
Figure 5. Bathymetry inversion comparisons of the linear regression and band ratio model with three sediment types—sand, rock, and coral/algae—on Heron Island. (a) The linear regression model results for sand sediments, (b) the band ratio model results for sand sediments, (c) the linear regression model results for rock sediments, (d) the band ratio model results for rock sediments, (e) the linear regression model results for coral/algae sediments, and (f) the band ratio model results for coral/algae sediments. The blue line is the 1:1 line, and N is the number of the used ICESat-2 training bathymetric points.
Remotesensing 15 01026 g005
Figure 6. Bathymetry inversion comparison results of the linear regression model and band ratio model with three sediment types—sand, rock, rubble and coral/algae—on Shanhu Island. (a) The linear regression model results for sand sediments, (b) the band ratio model results for sand sediments, (c) the linear regression model results for rock sediments, (d) the band ratio model results for rock sediments, (e) the linear regression model results for rubble sediments, (f) the band ratio model results for rubble sediments, (g) the linear regression model results for coral/algae sediments, and (h) the band ratio model results for coral/algae sediments. The blue line is the 1:1 line, and N is the number of the used ICESat-2 training bathymetric points.
Remotesensing 15 01026 g006aRemotesensing 15 01026 g006b
Figure 7. Shallow water bathymetric maps derived using remote sensing images and ICESat-2 data. (a) Bathymetric map of Heron Island, GBR, Australia, derived by using Sentinel-2 images and ICESat-2 data. (b) Bathymetric map of Shanhu Island in the South China Sea, derived by combining the GeoEye-1 image with ICESat-2 data. The derived bathymetric results were based on the WGS84 projection in units of meters.
Remotesensing 15 01026 g007
Table 1. Accuracy evaluation of the two empirical models in the two study areas.
Study AreaTraining Data
(ICESat-2)
Test Data
(ICESat-2)
ModelR2RMSE (m)MAE (m)
Heron Island, GBR, AustraliaAll types on 8 Apirl 201915 September 2019Linear regression0.891.591.39
Band ratio0.891.631.50
Mean0.891.611.45
Shanhu Island, South China SeaAll types on 22 February 2019, 22 October 201821 April 2019Linear regression0.950.850.53
Band ratio0.980.700.42
Mean0.970.770.47
Table 2. Accuracy evaluation of the two empirical models with different sediment classifications for Heron Island.
Study AreaTraining Data
(ICESat-2)
Test Data
(ICESat-2)
ModelR2RMSE (m)MAE (m)
Heron Island, GBR, AustraliaSand sediment on 08 April 201915 September 2019Linear regression0.901.561.45
Band ratio0.911.471.34
Mean0.901.521.40
Rock sediment on 08 April 201915 September 2019Linear regression0.921.511.39
Band ratio0.901.631.52
Mean0.911.571.45
Coral/algae sediment on 08 April 201915 September 2019Linear regression0.801.391.21
Band ratio0.882.372.27
Mean0.841.881.74
Table 3. Accuracy evaluation of the two empirical models with sediment classifications for Shanhu Island.
Study AreaTraining Data
(ICESat-2)
Test Data
(ICESat-2)
ModelR2RMSE (m)MAE (m)
Shanhu Island, South China SeaSand sediment on 22 February 2019, 22 October 201821 April 2019Linear regression0.960.750.44
Band ratio0.981.010.88
Mean0.970.880.66
Rock sediment on 22 February 2019, 22 October 201821 April 2019Linear regression0.970.760.54
Band ratio0.981.280.68
Mean0.971.020.61
Coral/algae sediment on 22 February 2019, 22 October 201821 April 2019Linear regression0.961.291.14
Band ratio0.980.520.36
Mean0.970.910.75
Rubble sediment on 22 February 2019, 22 October 201821 April 2019Linear regression0.970.690.47
Band ratio0.970.600.43
Mean0.970.650.45
Table 4. Accuracy evaluation results obtained after resampling the shallow points with two inversion models for Heron Island.
Study AreaTraining Data
(ICESat-2)
Test Data
(ICESat-2)
ModelR2RMSE (m)MAE (m)
Heron Island, GBR, AustraliaAll types on 08 April 201915 September 2019Linear regression0.971.461.20
Band ratio0.961.381.18
Mean0.961.421.19
Sand sediment on 08 April 201915 September 2019Linear regression0.971.281.06
Band ratio0.971.050.88
Mean0.971.170.97
Rock sediment on 08 April 201915 September 2019Linear regression0.961.451.31
Band ratio0.971.200.98
Mean0.971.331.15
Coral/algae sediment on 08 April 201915 September 2019Linear regression0.971.341.08
Band ratio0.961.731.49
Mean0.971.541.29
Disclaimer/Publisher’s Note: The statements, opinions and data contained in all publications are solely those of the individual author(s) and contributor(s) and not of MDPI and/or the editor(s). MDPI and/or the editor(s) disclaim responsibility for any injury to people or property resulting from any ideas, methods, instructions or products referred to in the content.

