Article

Wind and Turbulence Statistics in the Urban Boundary Layer over a Mountain–Valley System in Granada, Spain

by
Pablo Ortiz-Amezcua
1,2,3,*,
Alodía Martínez-Herrera
4,
Antti J. Manninen
5,
Pyry P. Pentikäinen
6,
Ewan J. O’Connor
5,7,
Juan Luis Guerrero-Rascado
1,2 and
Lucas Alados-Arboledas
1,2
1
Andalusian Institute for Earth System Research (IISTA-CEAMA), 18006 Granada, Spain
2
Department of Applied Physics, University of Granada, 18071 Granada, Spain
3
Institute of Geophysics, Faculty of Physics, University of Warsaw (IGFUW), 02-093 Warsaw, Poland
4
Department of Statistics, University Carlos III, 28903 Getafe, Spain
5
Finnish Meteorological Institute, 00560 Helsinki, Finland
6
Institute for Atmospheric and Earth System Research/Physics, Faculty of Science, University of Helsinki, 00014 Helsinki, Finland
7
Department of Meteorology, University of Reading, Reading RG6 6BB, UK
*
Author to whom correspondence should be addressed.
Remote Sens. 2022, 14(10), 2321; https://doi.org/10.3390/rs14102321
Submission received: 5 April 2022 / Revised: 29 April 2022 / Accepted: 4 May 2022 / Published: 11 May 2022
(This article belongs to the Special Issue Selected Papers of the European Lidar Conference)

Abstract

:
Urban boundary layer characterization is currently a challenging and relevant issue, because of its role in weather and air quality modelling and forecast. In many cities, the effect of complex topography at local scale makes this modelling even more complicated. This is the case of mid-latitude urban areas located in typical basin topographies, which usually present low winds and high turbulence within the atmospheric boundary layer (ABL). This study focuses on the analysis of the first ever measurements of wind with high temporal and vertical resolution throughout the ABL over a medium-sized city surrounded by mountains in southern Spain. These measurements have been gathered with a scanning Doppler lidar system and analyzed using the Halo lidar toolbox processing chain developed at the Finnish Meteorological Institute. We have used the horizontal wind product and the ABL turbulence classification product to carry out a statistical study using a two-year database. The data availability in terms of maximum analyzed altitudes for statistically significant results was limited to around 1000–1500 m above ground level (a.g.l.) due to the decreasing signal intensity with height that also depends on aerosol load. We have analyzed the differences and similarities in the diurnal evolution of the horizontal wind profiles for different seasons and their modelling with Weibull and von Mises probability distributions, finding a general trend of mean daytime wind from the NW with mean speeds around 3–4 m/s at low altitudes and 6–10 m/s at higher altitudes, and weaker mean nocturnal wind from the SE with similar height dependence. The highest speeds were observed during spring, and the lowest during winter. Finally, we studied the turbulent sources at the ABL with temporal (for each hour of the day) and height resolution. The results show a clear convective activity during daytime at altitudes increasing with time, and a significant wind-shear-driven turbulence during night-time.

Graphical Abstract

1. Introduction

In recent decades, there have been increasing concerns about climate change and the air quality, and how natural and anthropogenic processes affect them. According to a special report by the Intergovernmental Panel on Climate Change [1], human activities are estimated to have caused approximately 1.0 °C of global warming above pre-industrial levels, and this warming is likely to reach 1.5 °C between 2030 and 2052 if it continues to increase at the current rate. Moreover, wind field is another climate impact-driver affected by climate change, with an observed weakening of mean wind speed close to the surface which is expected to continue in the coming decades, together with an increase in severe wind storms and tropical cyclone peak winds. However, there are several atmospheric components and mechanisms that are not sufficiently understood, measured or whose effect still presents high uncertainties according to the Fifth and Sixth IPCC Assessment Report [2,3] and some related studies [4].
This is the case of the behavior of the lowermost region of the atmosphere, which has a crucial role in modelling and understanding climate and air quality. This layer, known as the atmospheric boundary layer (ABL), is the place where the emission of pollutants occurs, is directly responsible for the dispersion processes, and its correct modelling is essential for numerical weather prediction and climate models [5,6,7]. It is characterized by a turbulent behavior with significant temporal and spatial variations, which makes the accurate measurement and modelling of its internal mixing and its interactions with the surface and the rest of the atmosphere a challenging task.
Wind field is one of the key variables in understanding the complex processes in the ABL. Therefore, accurate measurements of wind speed and direction profiles are required by high-resolution numerical weather prediction models [8]. Moreover, those wind profiles measured over a particular site provide valuable information about local transport or to validate homogeneity assumptions for studies comparing close sites [9,10,11,12].
On the other hand, it is important to characterize and understand turbulence mechanisms and sources due to their complex interactions with other meteorological variables. Turbulent mixing is responsible for the redistribution of momentum, mass, temperature and humidity within the ABL [13]. The sources of turbulent mixing include buoyancy (that produces upwards convective mixing), wind shear (mechanical mixing) or radiative cooling in stratocumulus clouds producing top-down convective mixing [14]. Turbulence also has a role in new aerosol particle formation [15] and cloud microphysics [16].
An important application of social interest is the study and prediction of urban pollution events. In particular, urban areas with complex topography, such as basins, usually present pollution episodes due to the combined effect with weather patterns [17]. Bossioli et al. [18] showed the importance of correct parameterization of the ABL in a complex basin terrain for different seasons, with the simulation of pollution events under different conditions. These singular conditions are also the responsibility of special ABL features in Granada, a medium-sized city in southern Spain [19,20,21,22], causing serious air pollution events [23,24] especially during winter, with long periods with low wind, dry air and stable conditions. Therefore, thorough characterization of the ABL in this kind of locations is crucial for understanding the air quality.
In this context, lidar techniques represent a powerful tool to retrieve profiles of several ABL properties. Doppler lidars, those measuring the Doppler shift due to the aerosol particles motion by the wind, have been developed and improved in recent decades [25,26,27]. The strong potential of the technique prompted the European Space Agency (ESA) to design and launch the ADM-Aeolus satellite mission in 2018, with the first ever spaceborne Doppler wind lidar system contributing to improving the accuracy of numerical weather prediction. However, ground-based Doppler lidar systems are of great importance to validate this spaceborne measurements [28,29,30] and also to measure the 3D wind field inside the ABL and to retrieve turbulent properties with high temporal and vertical resolution, with particular applications in many fields [31].
Retrieval of the horizontal wind field has been widely used for wind energy, aviation and meteorology because of the possibility of studying effects such as wind shear [32,33], low-level jets [34,35,36] or wind gusts [37,38]. The high temporal resolution for the wind field has allowed many studies on ABL turbulence [39,40,41,42,43], often in combination with other remote sensing instruments [20,21,44,45]. Lane et al. [46] demonstrated the suitability of Doppler lidar to wind field profiles in urban environments, by comparing them with point measurements from anemometers. From that study, the importance of Doppler lidar in urban studies has been shown several times [47,48,49,50,51].
The different products retrieved from Doppler lidar measurements can also be combined to classify turbulence based on its source [52]. Manninen et al. (2018) developed a classifying method that represents a powerful tool to study and deeply analyze certain ABL scenarios, or to create long-term databases of vertically resolved ABL classification. They showed the performance of the ABL classification product when applied to two particular stations, namely, Jülich (Germany) and Hyytiälä (Finland). They presented an example of a clear-sky day in Jülich, where the convective ABL was properly developed, and a cloud-topped example in Hyytiälä, where the clouds avoided any possible convection. A statistical study was also performed for those stations, finding clear differences in the main sources and their seasonal and diurnal cycles due to the different locations.
This type of systematic algorithms is crucial for the development of networks and infrastructures such as Cloudnet (https://cloudnet.fmi.fi/, accessed on 14 December 2021) [53], which is part of the European ACTRIS (Aerosol, Clouds and Trace Gases Research Infrastructure, https://www.actris.eu/, accessed on 14 December 2021). There is currently high interest in creating and validating standardized and coordinated tools and datasets in order to exploit state-of-the art technology in an efficient and homogeneous way, as is the objective of initiatives recently funded by the European Cooperation in Science and Technology (COST), TOPROF [54] and PROBE [55].
In this study, we analyzed the first ever Doppler lidar measurements of wind field with high temporal and vertical resolution throughout the ABL over a southern European ACTRIS-Cloudnet station at Granada, Spain. The objective of this study was characterization of the ABL wind field and turbulent structures over this urban site and investigating their particular features. To this end, a statistical study was carried out to characterize the ABL in terms of mean values and probability distributions of horizontal wind and diurnal frequency of observed turbulence sources. We used a software toolbox developed by [56] to systematically derive different ABL properties for a 2-year database measured with Doppler lidar deployed at Granada.
The experimental site and the Doppler lidar system used for the study are presented in Section 2. In Section 3, the software toolbox to systematically derive different wind vector fields and ABL turbulent properties is described, as well as the data availability after the measurement pre-processing. The results of the wind and turbulence analysis are shown in Section 4, and the summary and conclusions are presented in Section 5.

2. Experimental Site and Instrumentation

This work was developed at the experimental observatory AGORA (Andalusian Global Observatory of the Atmosphere). In particular, the measurements for this study were performed at the UGR station, at the Andalusian Institute for Earth System Research (IISTA-CEAMA) in Granada (37.16°N, 3.61°W, 680 m above sea level, a.s.l.). This station is part of several instrumental and research networks as well as of ACTRIS.
Granada is a medium-sized city in south-eastern Spain located in a natural basin delimited by the Sierra Nevada mountain range, which reaches more than 3000 m a.s.l (Figure 1). This city is climatically characterized by large seasonal temperature differences, with winter average minima of 2 °C and summer average maxima of 33 °C (according to Spanish Meteorological Agency, AEMET, for the period 1981–2010). It is a dry area, in terms of low relative humidity (year average of 57%) and scarce precipitation (year average around 350 mm).
Mean surface winds are also light (less than 2 m s−1 on average with more than 50% of calms), coming predominantly from west and northwest according to historical records [57,58]. An important factor characterizing the diurnal wind regime in Granada is the local mountain–valley thermal flow, which forms katabatic winds from Sierra Nevada mainly in the early night [59].
The vertical profiles of wind and of ABL turbulent properties in this study were obtained using the measurements of the Doppler lidar Stream Line (Halo Photonics), that is part of ACTRIS-Cloudnet [53]. Table 1 gives a description of the instrument main features. The system consists of a solid-state pulsed laser emitting at 1.5 µm and a heterodyne detector using fiber-optic technology. The emission is done with low pulse energy (100 µJ) and high pulse repetition rate (15 kHz), what makes the instrument eye safe. The signal acquisition is performed continuous and autonomously in vertical stare mode with a temporal resolution around 2 s, and it also has full hemispheric scanning capability. For the regular measurements, conical scans with constant elevation of 75° and 12 equidistant azimuth points have been performed every 10 min.
For this study, the instrument was configured for operation with 30 m vertical resolution and an effective range from 90 m to 6000–9000 m. The focus of the optical system was experimentally found at (535 ± 35) m, using the method described in [60], increasing the instrument sensitivity at this height, but reducing it above 2 km. With the same method, the effective beam diameter was also determined to be (17.5 ± 1.0) mm. Note that the physical lens diameter in Table 1 refers to the physical size of the lens, whereas the calculated effective (1/e2) beam diameter describes how much is it illuminated by the laser beam. A more detailed description of the instrument can be found in [27].

3. Methodology

3.1. Halo Lidar Toolbox

The vertical profiles of wind field and turbulent properties within the ABL have been retrieved from vertical and scanning Doppler lidar measurements using several linked algorithms. The Halo lidar toolbox, which was developed at the Finnish Meteorological Institute, was used as the software processing chain. The aim of this toolbox is to produce harmonized Doppler lidar retrievals applied to measurements from different sites using robust methods presented in peer-reviewed articles [41,52,60,61,62,63,64,65,66,67,68] and providing consistent uncertainty estimates. Such harmonization on calculated quantities and used methods is essential to create a broad catalogue of ABL datasets in order to address the gap between the understanding of ABL physics and its representation in high-resolution climate and numerical weather prediction models [69].
In this study, only the horizontal wind product and the ABL classification product have been systematically analyzed. Nevertheless, the rest of the quantities calculated in the chain are required for the ABL classification; thus, they are briefly described below:
  • Background correction has been applied to the raw data with methods published by [62,63]. A correction for the telescope focus of the instrument was also applied to the signal, as explained in [60]. The instrumental precision of radial velocities was estimated with the method given by [27,70], and attenuated backscatter coefficient ( β a t t ) with uncertainties were also calculated [64];
  • From scanning measurements, three-dimensional wind vector profiles were calculated using the least squares method with singular value decomposition by assuming a stationary and horizontally homogeneous wind field, and radial velocity uncertainties were propagated to wind components as described by [65]. The wind component uncertainties were estimated with the method described by [66];
  • The vertical velocity statistical momenta, i.e., variance, skewness, and kurtosis, were calculated from vertically pointing measurements at 3, 30, and 60 min resolutions. Statistics unbiased by random noise and sample size were calculated as given by [67] and standard errors were estimated with a bootstrap method described by [68];
  • Wind shear vector, which can also be a source of turbulent mixing, is also calculated. This vector is calculated from the changes in u and v wind components with height [61], as:
    s h = Δ U H Δ z = ( Δ u Δ z , Δ v Δ z ) ,
    therefore, its module is:
    s h = Δ u 2 + Δ v 2 Δ z ,
  • The dissipation rate of the turbulent kinetic energy, ε , was calculated from vertically pointing measurements using the method presented by [41]. This quantity was defined as the rate at which the turbulence energy is absorbed by breaking the eddies down into smaller eddies until they are ultimately converted into heat by viscous forces [71], following the Kolmogorov hypothesis [72]. The method applies Taylor’s frozen turbulence hypothesis that eddies travel with the mean wind while maintaining their characteristics [73]. This quantity is then used as an indicator of turbulent mixing, instead of the combination of vertical skewness and variance [14]. The method used also provides an uncertainty estimate for ε [41];
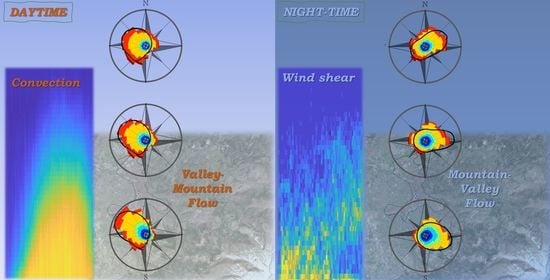
  • Finally, all the previously calculated quantities were combined following a decision tree to create a bitfield-based classification mask. This method was created by [64] following the profile-based Doppler lidar method introduced by [52] with the aim of objectively assigning a dominant source for turbulent mixing. The analyzed regions of the profiles were selected from calibrated β a t t to height ranges with sufficient atmospheric signal and no clouds (a threshold β a t t > 10 Mm−1 sr−1 was used based on the literature [14,52,74]). The presence of turbulence was obtained from ε with a threshold ε > 10−5 m2 s−3 or ε > 10−4 m2 s−3, depending whether the classified heights were below cloud or connected to the surface [64]. All range gates with surface-connected turbulent behavior during daytime were classified as dominated by convective mixing. During night-time, when ABL is assumed to be neutral or stably stratified [71], wind-shear derived turbulence is searched with a threshold s h > 0.03 s−1 [75]. Finally, range gates that are classified as turbulent but are unconnected to surface or clouds during daytime, and not related to wind shear during night-time, are labelled as ‘intermittent’ since turbulence is assumed to arise from other intermittent sources [76].

3.2. Data Processing

A 2-year database was gathered following the measurement procedure described in Section 2 with the Doppler lidar system from 3 May 2016 to 2 May 2018. To investigate seasonal changes in diurnal wind and turbulence cycle, the database was divided into meteorological seasons: winter (December to February, DJF), spring (March to May, MAM), summer (June to August, JJA) and autumn (September to November, SON). In order to ensure statistical representativeness of the study, an additional criterion on data availability was used. Wind vector retrieval was not available for certain range gates where the quality of the retrieval was not sufficient, where precipitation or fog was detected or if there were no measurements. With this in mind, we calculated the fractions of the data from the total analyzed period that were available for each hour of the day and range gate, and we selected those with more than 60% availability to perform the statistical analysis. The results of this calculation are shown in Figure 2 for each season. It can be observed that the highest altitudes with this criterion (red lines) were reached during summer and the lowest during winter. This fact was expected (if no technical issues are taken into account), because in Granada the ABL height, and consequently, the height with enough aerosol load to provide enough signal intensity, is higher in summer than in winter [19,20,22,77].
For each season, we averaged wind profiles within 1 h time intervals, but no range averaging (i.e., with the original range resolution of 30 m). The time interval of 1 h was selected following the averaging time used in most meteorological and air quality models [78]. With this approach, we aimed for a mean diurnal evolution of the horizontal wind speed and direction at different altitudes. The wind averaging was carefully tackled because of its vector nature. Depending on the application, the wind measurements may be vector- or scalar-averaged [79,80]. Scalar-averaging of wind direction may lead to incorrect results, due to the circular nature of this quantity. Meanwhile, vector-averaging may provide incorrect wind speeds when wind direction variance is large. Therefore, the wind averages we took in this study were scalar-averaged wind speed ( U H ¯ , hereinafter simply referred to as U H ) and vector-averaged wind direction ( d ¯ R V = tan 1 ( u ¯ v ¯ ) + k , hereinafter referred to as d , where k is a correction to keep d between 0° and 360° and depends on the signs of u ¯ and v ¯ ). However, they must not be interpreted as the polar components of any mean wind vector but have to be discussed as separated quantities.
Wind speeds were then handled as linear data, and means and standard deviations were calculated because they are the most used estimators in the literature, modelling, validation, etc. However, they are strictly only good estimators for normally distributed measurements. Indeed, wind speeds are experimentally observed to follow a Weibull distribution at any location [81]. This distribution is commonly used in the wind power industry to characterize wind regimes or to predict the production of a wind turbine, and was also chosen in this study to model the observed wind speeds at different heights. The probability density function described by the Weibull distribution with respect to wind speed depends on a scale parameter (β), proportional to mean wind speed, and a shape parameter (α) such that smaller values are given by the wider spread of winds around the mean wind speed.
f ( U H ) = α β ( U H β ) α 1 e ( U H / β ) α
Wind direction data cannot be analyzed used linear statistics, but circular statistics was applied starting with calculating only circular mean as central estimator. Circular variance can be computed as a dispersion estimator [82], but it is not a robust estimator. Firstly, because it is highly affected by possible outliers, which was avoided in this study by filtering out measurements with wind speed less than 1 m/s, to avoid high error propagation when calculating tan 1 ( u ¯ v ¯ ) . Secondly, because in a strongly multi-modal circular distribution, a variance value indicating high dispersion could be obtained for a distribution with well-defined modes (with low variance each) in opposite directions, and in that case the circular mean might point in a direction of low sample frequency. Therefore, wind direction data were fitted to monomodal or bimodal von Mises distributions, also called Circular Normal, a function of the mean direction μ and the dispersion parameter κ that measures the concentration of unimodal circular data around the mean. The density function for such distribution is generally defined for a mixture of n modes as
f ( d ) = i = 1 n p i e κ i cos ( d μ i ) 2 π I 0 ( κ i )
where μ i stands for the preferred direction of each mode, κ i represents the concentration parameter that indicates how directions cluster around μ i , and p i is the proportion of each component in the mixture. I 0 ( κ i ) is the Bessel function of the first kind and order 0. Wind direction data were fitted using Vector_Stats, a software tool calculating descriptive statistics and inference on circular variables [83].
In order to derive a statistical view of the complete wind vector, wind rose analysis of the database was also performed, without any seasonal division. To this end, we divided the hourly averaged profiles into three evenly spaced height ranges: 100–340 m a.g.l., 340–580 m a.g.l., and 580–820 m a.g.l. These ranges were selected so that there were at least 60% data available for the whole dataset. We also distinguished between two time intervals: ‘Daytime’, from 07:30 to 17:00 h UTC, and ‘Night-time’, from 21:30 to 03:00 h UTC. The reason for using these intervals is that they ensure that we are including only hours when it is daytime or night-time during the whole year, excluding twilight (defined when the sun has an elevation angle over −18° [84]) and transition times.
Finally, for the analysis of turbulent sources, the frequency of each source of mixing from the ABL-classification product was calculated for each time of the day (with 3 min resolution, as it was the maximum available by the software), for each season and range gate. This kind of analysis allows for characterizing the diurnal cycle of the ABL in terms of prevailing mixing sources.

4. Results

4.1. Horizontal Wind Field Characterization

We applied the seasonal analysis to the whole 2-year database, from 3 May 2016 to 2 May 2018. The results showed some seasonal differences during daytime, with calm winter and more windy spring and summer for all altitudes. During night-time, the winds were low (less than 1 m/s in average) for all seasons.
Figure 3a,d,f,i,k,n,p,s shows the time evolution of the mean hourly wind speed and direction profiles, from 100 m a.g.l. to the maximum available altitude gate (according to Figure 2). Two time intervals have been distinguished by directly identifying strong direction and/or speed gradients in the height–time average plots. The selected intervals are included in Table 2 and depicted with orange (night) and blue (day) boxes in Figure 3a,d,f,i,k,n,p,s. The calculated mean profiles within such intervals are shown in Figure 3b,e,g,j,l,o,q,t), and the averaged profiles of wind speed standard deviations within all available measurements, Δ U H , are shown in Figure 3c,h,m,r. Wind direction standard deviations have not been computed because of their lower statistical meaning, as described in Section 3.2.
From wind speed plots in Figure 3a–c,f–h,k–m,p–r, we can observe that average U H increased with height during night-time for all seasons (from 2–3 m/s up to 5–6 m/s in winter, summer, and autumn and up to 9 m/s in spring). Meanwhile, daytime average U H started from 3–4 m/s at the lowest analyzed heights, then presented a slight increase around 200 m a.g.l. (especially in spring and summer) and remained constant before a final increase at high altitudes, reaching 6 m/s in winter, summer, and autumn and 10 m/s in spring. Wind speeds at the highest analyzed altitudes did not present diurnal differences for any season. The altitudes where this constant pattern was reached were around 440 m a.g.l, 940 m a.g.l., 1230 m a.g.l., and 1080 m a.g.l. for winter, spring, summer, and autumn, respectively.
Standard deviations also increased, with height, from around 1.5 m/s up to 5 m/s in all seasons with the exception of spring, when Δ U H reached 7 m/s. This means that, during the analyzed period, wind speeds presented more diverse values at higher altitudes, especially in spring. However, no significant differences were observed between daytime and night-time standard deviations.
Direction plots in Figure 3d,e,i,j,n,o,s,t also show marked diurnal and seasonal differences, as well as contrast between the first 800 m and altitudes above. In winter, the mean daytime wind came from the NW, close to the surface, and from N at higher altitudes, whereas the mean nocturnal wind came from the SE, close to surface, and from the E at higher altitudes. In spring, most of the time there were winds coming from the W and NW, with the exception of the nocturnal wind close to the surface, which came from the S. Summer and autumn presented similar direction patterns, with mean daytime winds coming from the W and SW, and nocturnal winds coming from the E below 500 m a.g.l. and from the SW above this altitude.
After this analysis of mean and standard deviation profiles, the probability distributions described in Section 3.2 were fitted to the measured wind data. Wind speeds at each height were fitted to Weibull functions, obtaining the vertical profiles of scale ( β ) and shape ( α ) parameters plotted in Figure 4. The distributions were calculated for two intervals (‘Daytime’, 07:30–17:00 h UTC and ‘Night-time’, 21:30–03:00 h UTC), and also using the complete database (‘All data’). It is observed how β , which is proportional to mean speed, is increasing with height, with higher daytime than night-time values. The profiles for α , however, show a decrease with height in two different regimes: a faster decrease below a certain height (around 250 m a.g.l.) and then an almost constant behavior for higher altitudes. Moreover, higher daytime α values are observed at lower altitudes, whereas the behavior at upper altitudes is opposite. The study was also performed with a seasonal discrimination (see Appendix A). For all seasons, the scale parameter increased with height and was higher during daytime than during night-time up to a certain height, when there is no variability, or it is inverted. Moreover, this height increased in warmer seasons. Concerning the shape parameter, a decrease with height is observed for all seasons, with two differentiated height ranges in terms of decreasing rate.
As the next part of the study, Figure 5 includes all the wind roses from 1 h averaged wind data at three different height ranges and two common time intervals (‘Daytime’, 07:30–17:00 h UTC and ‘Night-time’, 21:30–03:00 h UTC), using the 2-year database. They were calculated with 22.5° angle intervals and the wind speed intervals: 0–0.5 m/s, 0.5–1 m/s, 1–1.5 m/s, 1.5–2 m/s, 2–5 m/s, 5–10 m/s, and ≥10 m/s. Wind directions at each height and time interval were fitted to von Mises distributions, finding that bimodal mixtures were able to model all wind roses with sufficient accuracy. The obtained distributions are plotted in Figure 5 as solid black lines, and the corresponding parameters are included in Table 3.
At the lowest height interval (Figure 5e,f), there is a clear prevalence of NW daytime winds (main mode at 299.1°) with speeds mostly >2 m/s and a strong change to ESE (main mode at 106.4°) and weaker nocturnal winds. Analyzing those wind directions in the context of the local orography (see Figure 1), it is noticeable that this pattern is consistent with the katabatic winds expected at that height range due to slope effects [59], although a deeper analysis would be needed to detect such winds.
This pattern was not exactly preserved at higher altitudes (Figure 5a–d), although there are similarities. The daytime wind was also dominated by the NW direction, although the frequency distributions spread and there was a higher contribution of W and SW winds. The peak of the nocturnal winds moves towards the E and NE at higher altitudes (main modes at 85.0° and 61.6°) and a slight SW contribution (mode at 233.3°) also appears in the highest interval.
Those results at different heights represent an addition to the historical records mentioned in Section 2, and also to surface winds measured with a collocated anemometer (not included here for brevity). Such surface measurements were consistent with Doppler lidar results at lower heights with the predominant winds from the west and northwest during day-time and prevailing nocturnal winds from the east and southeast.
Finally, as a common feature for all heights and interval times, strong winds (more than 10 m/s, represented with brown color) are not frequent, but they come mostly from the SW when present. This is parallel to the Sierra Nevada mountain range axis, meaning that the wind coming from this direction is more likely to have higher speeds without orographic limitation.

4.2. ABL Turbulent Sources Characterization

Figure 6 displays the relative frequency of three of the turbulent source types, namely ‘convective mixing’ (Figure 6a,d,g,j), ‘cloud driven’ (Figure 6b,e,h,k) and ‘wind shear’ (Figure 6c,f,i,l), with respect to time of the day and altitude. Subplots from the different rows correspond to the distinguished seasons.
The convective mixing frequency plots show a clear diurnal evolution of the range gates with the most frequency (red colored, meaning more than 70%). This high frequency of convective mechanism usually starts with sunrise in the lowest heights and reaches higher altitudes throughout the day up to a maximum around afternoon, when the altitudes with high convective frequency start decreasing until sunset. Therefore, this statistical behavior is directly related with the process of the ABL growth through convection, but also with the processes that could shift or weaken such growth, such as temperature inversions or cloud presence. In spring (Figure 6d) and summer (Figure 6g), this maximum height seems to remain constant at 775 m a.g.l. from 14:30 h to 15:30 h UTC (for spring) and at 955 m a.g.l. from 12:30 h UTC to 16:30 h UTC (for summer), but it is likely due to lack of data over a certain height. Despite the expected presence of cases when the convection was strong enough to make the convective ABL to rise over those heights, the system might not receive signal with enough SNR to perform the complete analysis for the ABL classification above a certain altitude. This effect did not occur in winter (Figure 6a) and autumn (Figure 6j), when the maximum height with more than 70% convection was registered at 475 m a.g.l. at 14:30 h UTC and at 685 m at 14:45 h UTC.
Wind shear plots (Figure 6c,f,i,l) only presented frequency values during the night-time, because the classification algorithm assumes that convective mixing always dominates the surface-driven turbulence when it is present. The season with highest frequency of wind shear-driven turbulence was found to be autumn (Figure 6l), when this mechanism was responsible for more than 20% of the detected turbulence below 500 m a.g.l. around 20 h UTC. For spring and summer (Figure 6f,i), wind shear was responsible for around 10–15% of the detected turbulence in the same time interval (around 20 h UTC) at low altitudes, and in a separated layer around 500 m a.g.l. after 00 h UTC. It is likely that those high and stable wind shear frequencies between midnight and early morning in a decoupled elevated layer are related to the presence of nocturnal low-level jets [36,85], although a deeper investigation of this phenomenon would be needed to confirm it.
Cloud driven turbulence was more significant in winter and spring, with frequencies always less than 10% during the whole day, and mainly concentrated between 500 and 1000 m a.gl. In spring, nocturnal cloud-driven turbulence was also significantly detected close to the surface. During summer, this turbulence source was essentially only detected during night-time or in connection with convective clouds formed during ABL growth in the early morning (5–10 h UTC in Figure 6h).
Figure 7 investigates the diurnal and seasonal behavior of the assigned mixing sources, but taking into account all the possible given labels. For this analysis, we have taken five different range intervals and calculated the accumulated frequency of each source type with a 3 min time resolution. The amount of missing data at different heights presents diurnal dependence was directly related to ABL height, as expected because the SNR is usually much higher inside the ABL.
Figure 7 clearly shows the strong diurnal variation in convective mixing as well as its seasonal dependence, typical features for ABL in the mid-latitudes [20,22,86]. The frequency of this turbulent mechanism is almost 100% in the central hours for altitudes up to 700 m a.g.l. in summer, and a bit lower (but still high) in spring. This feature was not present in the analysis shown by [64] for Germany and Finland, where the surface-connected convective mixing was dominant during the central hours, but there was no negligible contribution of non-turbulent and cloud-driven turbulence cases.
Clouds frequency is very low for almost all subplots in Figure 7, and almost absent in summer. However, it must be noticed that the full cloud cover is not necessarily captured with this analysis, because there might be ABL-associated clouds above the maximum selected range of 1600 m a.g.l. In-cloud and cloud-driven cases were more frequent during winter and spring for altitudes above 1000 m a.g.l., with constant frequencies of 5–10%, as shown in Figure 6.
Wind shear was detected for all seasons during night-time at the lowest height interval, with a mean frequency (±standard deviation) of 8 ± 3%. For all seasons, mean wind shear frequency decreased to 3.5 ± 1.4% in the second height interval, and this source was only found to be relevant in the third height interval (700–1000 m a.g.l.) before sunrise in spring and summer, with 3.4 ± 1.3% frequency.
The ‘intermittent’ category, given to range gates with turbulence that was not related to the rest of sources, was the most frequently detected during night-time. This feature was in contrast to the high latitude scenario analyzed by [64], where the contribution of intermittent sources was mainly during midday hours in spring and summer. In contrast, for the mid-latitude site (Germany) analyzed in that study, the results were similar to our analysis for Granada, although the frequency of intermittent sources was much less, in favor of non-turbulent cases. A possible reason of the high frequencies might be the remaining presence of turbulence forming the residual layer, but we do not discard the need for finding a dynamic threshold for the turbulence presence, which could be too low for certain atmospheric situations. This category cannot thoroughly be investigated with the methodology used here; therefore, we are not able to discuss the reasons of this in depth. However, we found it important to highlight its presence and the need for further research.

5. Conclusions

In this study, we applied Doppler lidar technique to characterize wind field and ABL turbulent properties with high temporal and vertical resolution over an urban area with complex topography. The analyzed ABL properties were obtained with the Halo lidar toolbox, a software package developed in the framework of ACTRIS-Cloudnet that allows for continuous, automatic and standardized retrievals. With this methodology, we were able to gather a 2-year database of wind field and turbulence measurements for the Granada urban environment.
The statistical analysis of the horizontal wind over Granada revealed diurnal and seasonal patterns of the mean profiles from 100 to around 1000 m a.g.l. From this study, an important conclusion to be highlighted is the variation in observed mean winds with height, especially for wind directions. This feature supports the relevance of wind profiling within the ABL, because these variations could not have been inferred from surface measurements and are not probably captured by satellite measurements or global models. Moreover, we found that mean and standard deviation (or variance) were not sufficient to describe wind data, but Weibull and von Mises distributions were needed to model wind speeds and directions, respectively. The patterns showed two different wind regimes at altitudes close to the surface versus higher altitudes, in terms of Weibull shape parameter. Direction analysis revealed mean and modal daytime winds from the NW close to surface, with highest velocities in spring and summer, and weaker nocturnal winds from the SE. This clear pattern in wind direction is consistent with the expected katabatic wind at the analyzed altitudes due to the interaction between the city of Granada and the close mountain range of Sierra Nevada. Moreover, the NW–SE pattern was found to rotate counterclockwise with increasing altitude, as revealed by the wind roses and von Mises models.
Statistical analysis of the turbulent sources was performed for the same database. We could characterize the seasonal and diurnal behavior of the convective mixing, rising up to maximum heights around 14:30 h UTC for winter and autumn, and in a longer interval centered at the same time for spring and summer. Wind shear was found to be of similar importance (around 8%) at heights below 400 m a.g.l. for all seasons, with a significant presence up to 1000 m a.g.l. only for hours before sunrise in spring and summer. Cloud-driven turbulence was present mostly in winter and spring, with frequencies less than 10%.
Some conclusions can be also drawn from the combined analysis of wind and turbulence. In particular, we can observe that, in Granada, the nocturnal wind profiles are more stratified in terms of wind direction, whereas the diurnal profiles are more homogeneous in correlation with the hours of maximum convective mixing frequency. Moreover, regions where wind shear is frequently detected coincide with high average winds with direction gradients.
Finally, we believe that there are clear potential applications of this kind of information in air quality and pollutant dispersion studies. Poor air quality events are closely related to the capability of the ABL to mix and disperse the emitted pollutants, a complex issue that Doppler lidar measurements can clearly help to understand. Therefore, this study represents a solid basis to start specific and deeper analyses of the different patterns and features observed, e.g., finding different patterns of horizontal winds that are responsible for the analyzed mean behavior, or investigating the causes of the high nocturnal turbulence measured in Granada.

Author Contributions

Conceptualization, P.O.-A., L.A.-A. and J.L.G.-R.; methodology and software, P.O.-A., A.M.-H., A.J.M., P.P.P. and E.J.O.; formal analysis, investigation, visualization, P.O.-A. and A.M.-H.; resources, L.A.-A.; data curation, P.O.-A.; writing—original draft preparation, P.O.-A.; writing—review and editing, all authors; funding acquisition, L.A.-A. and J.L.G.-R. All authors have read and agreed to the published version of the manuscript.

Funding

This research was funded by the Spanish ‘Ministerio de Educación, Cultura y Deporte’ (currently ‘Ministerio de Educación y Formación Profesional’), grant number FPU14/03684; by the Spanish ‘Ministerio de Economía y Competitividad’ (currently ‘Ministerio de Asusntos Económicos y Transformación Digital’), projects CGL2016-81092-R, CGL2017-83538-C3-1-R, CGL2017-90884-REDT, PID2020-120015RB-I00, and PID2020.117825GB.C21; by the Regional Government of Andalusia through projects A-RNM-430-UGR20, P18-RT-3820, and P20-00136; by the Horizon 2020 Framework Programme of the European Union, grant number 654109; by COST Actions TOPROF (ES1303) and PROBE (CA18235), supported by COST (European Cooperation in Science and Technology); by ‘Programa 7’ of ‘Plan Propio’ of the University of Granada; by the Erasmus + Programme of the European Union; by Fundación Ramón Areces through grant ‘Ampliación de estudios en el extranjero en Ciencias de la Vida y de la Materia, XXXII Convocatoria’; and by the Polish National Science Centre (NCN) through project 2021/40/C/ST10/00023 of program SONATINA 5. This research has been partially funded by the Excellence Units Program of the University of Granada.

Data Availability Statement

The Doppler lidar data are available upon request to the corresponding author.

Acknowledgments

The authors gratefully acknowledge the FEDER program for the instrumentation used in this study, which is part of the ‘Laboratorio Singular de Tecnologías Avanzadas Observatorio Global de la Atmósfera, ÁGORA, supported by the University of Granada.

Conflicts of Interest

The authors declare no conflict of interest.

Appendix A. Weibull Parameters by Season

Figure A1. Weibull scale (ad) and shape (eh) parameter profiles calculated for the different seasons for all data (yellow), only daytime data (blue) and only night-time data (orange).
Remotesensing 14 02321 g0a1

References

  1. IPCC. Summary for Policymakers. In Global Warming of 1.5 °C. An IPCC Special Report on the Impacts of Global Warming of 1.5 °C above Pre-Industrial Levels and Related Global Greenhouse Gas Emission Pathways, in the Context of Strengthening the Global Response to the Threat of Climate Change, Sustainable Development, and Efforts to Eradicate Poverty; Masson-Delmotte, V., Zhai, P., Pörtner, H.-O., Roberts, D., Skea, J., Shukla, P.R., Pirani, A., Moufouma-Okia, W., Péan, C., Pidcock, R., et al., Eds.; World Meteorological Organization: Geneva, Switzerland, 2018; 32p. [Google Scholar]
  2. Myhre, G.; Shindell, D.; Bréon, F.-M.; Collins, W.; Fuglestvedt, J.; Huang, J.; Koch, D.; Lamarque, J.-F.; Lee, D.; Mendoza, B.; et al. Anthropogenic and natural radiative forcing. In Climate Change 2013: The Physical Science Basis. Contribution of Working Group I to the Fifth Assessment Report of the Intergovernmental Panel on Climate Change; Stocker, T.F., Qin, D., Plattner, G.-K., Tignor, M., Allen, S.K., Boschung, J., Nauels, A., Xia, Y., Bex, V., Midgley, P.M., Eds.; Cambridge University Press: Cambridge, UK; New York, NY, USA, 2013. [Google Scholar]
  3. IPCC. IPCC Climate Change 2021: The Physical Science Basis. Contribution of Working Group I to the Sixth Assessment Report of the Intergovernmental Panel on Climate Change; Masson-Delmotte, V., Zhai, P., Pirani, A., Connors, S.L., Péan, C., Berger, S., Caud, N., Chen, Y., Goldfarb, L., Gomis, M.I., et al., Eds.; Cambridge University Press: Cambridge, UK; New York, NY, USA, 2021. [Google Scholar]
  4. Myhre, G.; Aas, W.; Cherian, R.; Collins, W.; Faluvegi, G.; Flanner, M.; Forster, P.; Hodnebrog, Ø.; Klimont, Z.; Lund, M.T.; et al. Multi-model simulations of aerosol and ozone radiative forcing due to anthropogenic emission changes during the period 1990–2015. Atmos. Chem. Phys. 2017, 17, 2709–2720. [Google Scholar] [CrossRef] [Green Version]
  5. Baklanov, A.; Grisogono, B.; Bornstein, R.; Mahrt, L.; Zilitinkevich, S.S.; Taylor, P.; Larsen, S.E.; Rotach, M.W.; Fernando, H.J.S. The nature, theory, and modeling of atmospheric planetary boundary layers. Bull. Am. Meteorol. Soc. 2011, 92, 123–128. [Google Scholar] [CrossRef] [Green Version]
  6. Li, H.; Yang, Y.; Hu, X.M.; Huang, Z.; Wang, G.; Zhang, B.; Zhang, T. Evaluation of retrieval methods of daytime convective boundary layer height based on lidar data. J. Geophys. Res. 2017, 122, 4578–4593. [Google Scholar] [CrossRef]
  7. Illingworth, A.J.; Cimini, D.; Haefele, A.; Haeffelin, M.; Hervo, M.; Kotthaus, S.; Löhnert, U.; Martinet, P.; Mattis, I.; O’Connor, E.J.; et al. How can existing ground-based profiling instruments improve european weather forecasts? Bull. Am. Meteorol. Soc. 2019, 100, 605–620. [Google Scholar] [CrossRef]
  8. World-Meteorological-Organization Statement of Guidance for High Resolution Numerical Weather Prediction (NWP). Technical Report. 2018. Available online: www.wmo.int/pages/prog/www/OSY/SOG/SoG-HighRes-NWP.pdf (accessed on 14 December 2020).
  9. Benavent-Oltra, J.A.; Román, R.; Andrés Casquero-Vera, J.; Pérez-Ramírez, D.; Lyamani, H.; Ortiz-Amezcua, P.; Bedoya-Velásquez, A.E.; De Arruda Moreira, G.; Barreto, Á.; Lopatin, A.; et al. Different strategies to retrieve aerosol properties at night-time with the GRASP algorithm. Atmos. Chem. Phys. 2019, 19, 14149–14171. [Google Scholar] [CrossRef] [Green Version]
  10. Bedoya-Velásquez, A.E.; Navas-Guzmán, F.; Granados-Muñoz, M.J.; Titos, G.; Román, R.; Andrés Casquero-Vera, J.; Ortiz-Amezcua, P.; Antonio Benavent-Oltra, J.; De Arruda Moreira, G.; Montilla-Rosero, E.; et al. Hygroscopic growth study in the framework of EARLINET during the SLOPE i campaign: Synergy of remote sensing and in situ instrumentation. Atmos. Chem. Phys. 2018, 18, 7001–7017. [Google Scholar] [CrossRef] [Green Version]
  11. Casquero-Vera, J.A.; Lyamani, H.; Dada, L.; Hakala, S.; Paasonen, P.; Román, R.; Fraile, R.; Petäjä, T.; Olmo-Reyes, F.J.; Alados-Arboledas, L. New particle formation at urban and high-altitude remote sites in the south-eastern Iberian Peninsula. Atmos. Chem. Phys. 2020, 20, 14253–14271. [Google Scholar] [CrossRef]
  12. Benavent-Oltra, J.A.; Casquero-Vera, J.A.; Román, R.; Lyamani, H.; Pérez-Ramírez, D.; Granados-Muñoz, M.J.; Cazorla, A.; Ortiz-Amezcua, P.; Bedoya-Velásquez, A.E.; de Arruda Moreira, G.; et al. Overview of SLOPE I and II campaigns: Aerosol properties retrieved with lidar and sun-sky photometer measurements. Atmos. Chem. Phys. 2020, 21, 9269–9287. [Google Scholar] [CrossRef]
  13. Oke, T.R. Boundary Layer Climates, 2nd ed.; Routledge: London, UK, 1992. [Google Scholar]
  14. Hogan, R.J.; Grant, A.L.M.; Illingworth, A.J.; Pearson, G.N.; O’Connor, E.J. Vertical velocity variance and skewness in clear and cloud-topped boundary layers as revealed by Doppler lidar. Q. J. R. Meteorol. Soc. 2009, 135, 635–643. [Google Scholar] [CrossRef]
  15. Wehner, B.; Siebert, H.; Ansmann, A.; Ditas, F.; Seifert, P.; Stratmann, F.; Wiedensohler, A.; Apituley, A.; Shaw, R.A.; Manninen, H.E.; et al. Observations of turbulence-induced new particle formation in the residual layer. Atmos. Chem. Phys. 2010, 10, 4319–4330. [Google Scholar] [CrossRef] [Green Version]
  16. Pinsky, M.; Khain, A.; Krugliak, H. Collisions of cloud droplets in a turbulent flow. Part V: Application of detailed tables of turbulent collision rate enhancement to simulation of droplet spectra evolution. J. Atmos. Sci. 2008, 65, 357–374. [Google Scholar] [CrossRef]
  17. Ning, G.; Yim, S.H.L.; Wang, S.; Duan, B.; Nie, C.; Yang, X.; Wang, J.; Shang, K. Synergistic effects of synoptic weather patterns and topography on air quality: A case of the Sichuan Basin of China. Clim. Dyn. 2019, 53, 6729–6744. [Google Scholar] [CrossRef]
  18. Bossioli, E.; Tombrou, M.; Dandou, A.; Athanasopoulou, E.; Varotsos, K.V. The role of planetary boundary-layer parameterizations in the air quality of an urban area with complex topography. Bound. Layer Meteorol. 2009, 131, 53–72. [Google Scholar] [CrossRef]
  19. Bedoya-Velásquez, A.E.; Navas-Guzmán, F.; de Arruda Moreira, G.; Román, R.; Cazorla, A.; Ortiz-Amezcua, P.; Benavent-Oltra, J.A.; Alados-Arboledas, L.; Olmo-Reyes, F.J.; Foyo-Moreno, I.; et al. Seasonal analysis of the atmosphere during five years by using microwave radiometry over a mid-latitude site. Atmos. Res. 2019, 218, 78–89. [Google Scholar] [CrossRef] [Green Version]
  20. de Arruda Moreira, G.; Guerrero-Rascado, J.L.; Bravo-Aranda, J.A.; Benavent-Oltra, J.A.; Ortiz-Amezcua, P.; Róman, R.; Bedoya-Velásquez, A.E.; Landulfo, E.; Alados-Arboledas, L. Study of the planetary boundary layer by microwave radiometer, elastic lidar and Doppler lidar estimations in southern Iberian Peninsula. Atmos. Res. 2018, 213, 185–195. [Google Scholar] [CrossRef] [Green Version]
  21. de Arruda Moreira, G.; Guerrero-Rascado, J.L.; Benavent-Oltra, J.A.; Ortiz-Amezcua, P.; Román, R.; Bedoya-Velásquez, A.E.; Bravo-Aranda, J.A.; Reyes, F.J.O.; Landulfo, E.; Alados-Arboledas, L. Analyzing the turbulent planetary boundary layer by remote sensing systems: The Doppler wind lidar, aerosol elastic lidar and microwave radiometer. Atmos. Chem. Phys. 2019, 19, 1263–1280. [Google Scholar] [CrossRef] [Green Version]
  22. de Arruda Moreira, G.; Guerrero-Rascado, J.L.; Bravo-Aranda, J.A.; Foyo-Moreno, I.; Cazorla, A.; Alados, I.; Lyamani, H.; Landulfo, E.; Alados-Arboledas, L. Study of the planetary boundary layer height in an urban environment using a combination of microwave radiometer and ceilometer. Atmos. Res. 2020, 240, 104932. [Google Scholar] [CrossRef]
  23. Lyamani, H.; Fernández-Gálvez, J.; Pérez-Ramírez, D.; Valenzuela, A.; Antón, M.; Alados, I.; Titos, G.; Olmo, F.J.; Alados-Arboledas, L. Aerosol properties over two urban sites in South Spain during an extended stagnation episode in winter season. Atmos. Environ. 2012, 62, 424–432. [Google Scholar] [CrossRef]
  24. Casquero-Vera, J.A.; Lyamani, H.; Titos, G.; Borrás, E.; Olmo, F.J.; Alados-Arboledas, L. Impact of primary NO2 emissions at different urban sites exceeding the European NO2 standard limit. Sci. Total Environ. 2019, 646, 1117–1125. [Google Scholar] [CrossRef]
  25. Frehlich, R.; Hannon, S.M.; Henderson, S.W. Performance of a 2-μm coherent Doppler lidar for wind measurements. J. Atmos. Ocean. Technol. 1994, 11, 1517–1528. [Google Scholar] [CrossRef]
  26. Frehlich, R. Estimation of velocity error for Doppler lidar measurements. J. Atmos. Ocean. Technol. 2001, 18, 1628–1639. [Google Scholar] [CrossRef]
  27. Pearson, G.; Davies, F.; Collier, C. An analysis of the performance of the UFAM pulsed Doppler lidar for observing the boundary layer. J. Atmos. Ocean. Technol. 2009, 26, 240–250. [Google Scholar] [CrossRef]
  28. Witschas, B.; Lemmerz, C.; Geiß, A.; Lux, O.; Marksteiner, U.; Rahm, S.; Reitebuch, O.; Weiler, F. First validation of Aeolus wind observations by airborne Doppler wind lidar measurements. Atmos. Meas. Tech. 2020, 13, 2381–2396. [Google Scholar] [CrossRef]
  29. Lux, O.; Lemmerz, C.; Weiler, F.; Marksteiner, U.; Witschas, B.; Rahm, S.; Geiß, A.; Reitebuch, O. Intercomparison of wind observations from the European Space Agency’s Aeolus satellite mission and the ALADIN Airborne Demonstrator. Atmos. Meas. Tech. 2020, 13, 2075–2097. [Google Scholar] [CrossRef] [Green Version]
  30. Baars, H.; Herzog, A.; Heese, B.; Ohneiser, K.; Hanbuch, K.; Hofer, J.; Yin, Z.; Engelmann, R.; Wandinger, U. Validation of Aeolus wind products above the Atlantic Ocean. Atmos. Meas. Tech. Discuss. 2020, 2020, 1–27. [Google Scholar] [CrossRef]
  31. Liu, Z.; Barlow, J.F.; Chan, P.W.; Fung, J.C.H.; Li, Y.; Ren, C.; Mak, H.W.L.; Ng, E. A review of progress and applications of pulsed Doppler wind LiDARs. Remote Sens. 2019, 11, 2522. [Google Scholar] [CrossRef] [Green Version]
  32. Shun, C.M.; Chan, P.W. Applications of an infrared Doppler lidar in detection of wind shear. J. Atmos. Ocean. Technol. 2008, 25, 637–655. [Google Scholar] [CrossRef]
  33. Nechaj, P.; Gaál, L.; Bartok, J.; Vorobyeva, O.; Gera, M.; Kelemen, M.; Polishchuk, V. Monitoring of low-level wind shear by ground-based 3D lidar for increased flight safety, protection of human lives and health. Int. J. Environ. Res. Public Health 2019, 16, 4584. [Google Scholar] [CrossRef] [Green Version]
  34. Banta, R.M.; Darby, L.S.; Fast, J.D.; Pinto, J.O.; Whiteman, C.D.; Shaw, W.J.; Orr, B.W. Nocturnal low-level jet in a mountain basin complex. Part I: Evolution and effects on local flows. J. Appl. Meteorol. 2004, 43, 1348–1365. [Google Scholar] [CrossRef]
  35. Marke, T.; Crewell, S.; Schemann, V.; Schween, J.H.; Tuononen, M. Long-term observations and high-resolution modeling of midlatitude nocturnal boundary layer processes connected to low-level jets. J. Appl. Meteorol. Climatol. 2018, 57, 1155–1170. [Google Scholar] [CrossRef]
  36. Tuononen, M.; O’Connor, E.J.; Sinclair, V.A.; Vakkari, V. Low-level jets over Utö, Finland, based on Doppler lidar observations. J. Appl. Meteorol. Climatol. 2017, 56, 2577–2594. [Google Scholar] [CrossRef]
  37. Suomi, I.; Gryning, S.E.; O’Connor, E.J.; Vihma, T. Methodology for obtaining wind gusts using Doppler lidar. Q. J. R. Meteorol. Soc. 2017, 143, 2061–2072. [Google Scholar] [CrossRef] [Green Version]
  38. Pantillon, F.; Adler, B.; Corsmeier, U.; Knippertz, P.; Wieser, A.; Hansen, A. Formation of wind gusts in an extratropical cyclone in light of Doppler lidar observations and large-eddy simulations. Mon. Weather Rev. 2019, 148, 353–375. [Google Scholar] [CrossRef]
  39. Sathe, A.; Mann, J.; Gottschall, J.; Courtney, M.S. Can wind lidars measure turbulence? J. Atmos. Ocean. Technol. 2011, 28, 853–868. [Google Scholar] [CrossRef] [Green Version]
  40. Banakh, V.A.; Smalikho, I.N.; Köpp, F.; Werner, C. Measurements of turbulent energy dissipation rate with a CW Doppler lidar in the atmospheric boundary layer. J. Atmos. Ocean. Technol. 1999, 16, 1044–1061. [Google Scholar] [CrossRef]
  41. O’Connor, E.J.; Illingworth, A.J.; Brooks, I.M.; Westbrook, C.D.; Hogan, R.J.; Davies, F.; Brooks, A.B.J. A method for estimating the turbulent kinetic energy dissipation rate from a vertically pointing Doppler lidar, and independent evaluation from balloon-borne in situ measurements. J. Atmos. Ocean. Technol. 2010, 27, 1652–1664. [Google Scholar] [CrossRef] [Green Version]
  42. Vakkari, V.; O’Connor, E.J.; Nisantzi, A.; Mamouri, R.E.; Hadjimitsis, D.G. Low-level mixing height detection in coastal locations with a scanning Doppler lidar. Atmos. Meas. Tech. 2015, 8, 1875–1885. [Google Scholar] [CrossRef] [Green Version]
  43. Tucker, S.C.; Brewer, W.A.; Banta, R.M.; Senff, C.J.; Sandberg, S.P.; Law, D.C.; Weickmann, A.M.; Hardesty, R.M. Doppler lidar estimation of mixing height using turbulence, shear, and aerosol profiles. J. Atmos. Ocean. Technol. 2009, 16, 673–688. [Google Scholar] [CrossRef]
  44. Schween, J.H.; Hirsikko, A.; Löhnert, U.; Crewell, S. Mixing-layer height retrieval with ceilometer and Doppler lidar: From case studies to long-term assessment. Atmos. Meas. Tech. 2014, 7, 3685–3704. [Google Scholar] [CrossRef] [Green Version]
  45. Engelmann, R.; Wandinger, U.; Ansmann, A.; Müller, D.; Žeromskis, E.; Althausen, D.; Wehner, B. Lidar observations of the vertical aerosol flux in the planetary boundary layer. J. Atmos. Ocean. Technol. 2008, 25, 1296–1306. [Google Scholar] [CrossRef]
  46. Lane, S.E.; Barlow, J.F.; Wood, C.R. An assessment of a three-beam Doppler lidar wind profiling method for use in urban areas. J. Wind Eng. Ind. Aerodyn. 2013, 119, 53–59. [Google Scholar] [CrossRef] [Green Version]
  47. van Dinther, D.; Wood, C.R.; Hartogensis, O.K.; Nordbo, A.; O’Connor, E.J. Observing crosswind over urban terrain using scintillometer and Doppler lidar. Atmos. Meas. Tech. 2015, 8, 1901–1911. [Google Scholar] [CrossRef] [Green Version]
  48. Drew, D.R.; Barlow, J.F.; Lane, S.E. Observations of wind speed profiles over Greater London, UK, using a Doppler lidar. J. Wind Eng. Ind. Aerodyn. 2013, 121, 98–105. [Google Scholar] [CrossRef] [Green Version]
  49. Kikumoto, H.; Ooka, R.; Sugawara, H.; Lim, J. Observational study of power-law approximation of wind profiles within an urban boundary layer for various wind conditions. J. Wind Eng. Ind. Aerodyn. 2017, 164, 13–21. [Google Scholar] [CrossRef]
  50. Wood, C.R.; Pauscher, L.; Ward, H.C.; Kotthaus, S.; Barlow, J.F.; Gouvea, M.; Lane, S.E.; Grimmond, C.S.B. Wind observations above an urban river using a new lidar technique, scintillometry and anemometry. Sci. Total Environ. 2013, 442, 527–533. [Google Scholar] [CrossRef] [Green Version]
  51. Kent, C.W.; Grimmond, C.S.B.; Gatey, D.; Barlow, J.F. Assessing methods to extrapolate the vertical wind-speed profile from surface observations in a city centre during strong winds. J. Wind Eng. Ind. Aerodyn. 2018, 173, 100–111. [Google Scholar] [CrossRef]
  52. Harvey, N.J.; Hogan, R.J.; Dacre, H.F. A method to diagnose boundary-layer type using Doppler lidar. Q. J. R. Meteorol. Soc. 2013, 139, 1681–1693. [Google Scholar] [CrossRef]
  53. Illingworth, A.J.; Hogan, R.J.; O’Connor, E.J.; Bouniol, D.; Brooks, M.E.; Delanoë, J.; Donovan, D.P.; Eastment, J.D.; Gaussiat, N.; Goddard, J.W.F.; et al. Cloudnet: Continuous evaluation of cloud profiles in seven operational models using ground-based observations. Bull. Am. Meteorol. Soc. 2007, 88, 883–898. [Google Scholar] [CrossRef] [Green Version]
  54. Illingworth, A.J.; Cimini, D.; Gaffard, C.; Haeffelin, M.; Lehmann, V.; Löhnert, U.; O’Connor, E.J.; Ruffieux, D. Exploiting existing ground-based remote sensing networks to improve high-resolution weather forecasts. Bull. Am. Meteorol. Soc. 2015, 96, 2107–2125. [Google Scholar] [CrossRef]
  55. Cimini, D.; Haeffelin, M.; Kotthaus, S.; Löhnert, U.; Martinet, P.; O’Connor, E.; Walden, C.; Coen, M.C.; Preissler, J. Towards the profiling of the atmospheric boundary layer at European scale—Introducing the COST Action PROBE. Bull. Atmos. Sci. Technol. 2020, 1, 23–42. [Google Scholar] [CrossRef] [Green Version]
  56. Manninen, A.J. Halo Lidar Toolbox. Available online: https://github.com/manninenaj/HALO_lidar_toolbox (accessed on 1 March 2019).
  57. Bosque Maurel, J. El clima de Granada. Estud. Geográficos 1959, 20, 145–147. [Google Scholar]
  58. Viedma Muñoz, M. Análisis de loas direcciones de los vientos en Andalucía. Nimbus 1998, 1, 153–168. [Google Scholar]
  59. Montávez, J.P.; Rodríguez, A.; Jiménez, J.I. A study of the urban heat island of Granada. Int. J. Climatol. 2000, 20, 899–911. [Google Scholar] [CrossRef]
  60. Pentikäinen, P.; James O’connor, E.; Manninen, A.J.; Ortiz-Amezcua, P. Methodology for deriving the telescope focus function and its uncertainty for a heterodyne pulsed Doppler lidar. Atmos. Meas. Tech. 2020, 13, 2849–2863. [Google Scholar] [CrossRef]
  61. ICAO. Manual on Low-level Wind Shear. Doc 9817 AN/449, 1st ed.; International Civil Aviation Organization: Montreal, QC, Canada, 2005; 222p. [Google Scholar]
  62. Manninen, A.J.; O’Connor, E.J.; Vakkari, V.; Petäjä, T. A generalised background correction algorithm for a Halo Doppler lidar and its application to data from Finland. Atmos. Meas. Tech. 2016, 9, 817–827. [Google Scholar] [CrossRef] [Green Version]
  63. Vakkari, V.; Manninen, A.J.; O’Connor, E.J.; Schween, J.H.; Van Zyl, P.G.; Marinou, E. A novel post-processing algorithm for Halo Doppler lidars. Atmos. Meas. Tech. 2019, 12, 839–852. [Google Scholar] [CrossRef] [Green Version]
  64. Manninen, A.J.; Marke, T.; Tuononen, M.; O’Connor, E.J. Atmospheric boundary layer classification with Doppler lidar. J. Geophys. Res. Atmos. 2018, 123, 8172–8189. [Google Scholar] [CrossRef]
  65. Päschke, E.; Leinweber, R.; Lehmann, V. An assessment of the performance of a 1.5 μm Doppler lidar for operational vertical wind profiling based on a 1-year trial. Atmos. Meas. Tech. 2015, 8, 22151–22266. [Google Scholar] [CrossRef] [Green Version]
  66. Newsom, R.K.; Alan Brewer, W.; Wilczak, J.M.; Wolfe, D.E.; Oncley, S.P.; Lundquist, J.K. Validating precision estimates in horizontal wind measurements from a Doppler lidar. Atmos. Meas. Tech. 2017, 10, 1229–1240. [Google Scholar] [CrossRef] [Green Version]
  67. Rimoldini, L. Weighted skewness and kurtosis unbiased by sample size and Gaussian uncertainties. Astron. Comput. 2014, 5, 1–8. [Google Scholar] [CrossRef] [Green Version]
  68. Kleiner, A.; Talwalkar, A.; Sarkar, P.; Jordan, M.I. A scalable bootstrap for massive data. J. R. Stat. Soc. Ser. B Stat. Methodol. 2014, 76, 795–816. [Google Scholar] [CrossRef] [Green Version]
  69. Baklanov, A.; Grisigono, B. Atmospheric Boundary Layers: Nature, Theory and Applications to Environmental Modelling and Security; Springer: New York, NY, USA, 2008; ISBN 9780387743189. [Google Scholar]
  70. Rye, B.J.; Hardesty, R.M. Estimate optimization parameters for incoherent backscatter heterodyne lidar. Appl. Opt. 1997, 36, 9425–9436. [Google Scholar] [CrossRef] [PubMed]
  71. Garrat, J.R. The Atmospheric Boundary Layer; Houghton, J.T., Rycroft, M.J., Dessler, A.J., Eds.; Cambridge University Press: Cambridge, UK; New York, NY, USA, 1992. [Google Scholar]
  72. Kolmogorov, A.N. The local structure of turbulence in incompressible viscous fluid for very large reynolds’ numbers. Dokl. Akad. Nauk SSSR 1941, 30, 301–305. [Google Scholar]
  73. Taylor, G.I. Statistical theory of turbulence. Proc. R. Soc. A Math. Phys. Eng. Sci. 1935, 151, 421–444. [Google Scholar] [CrossRef] [Green Version]
  74. Westbrook, C.D.; Illingworth, A.J.; O’Connor, E.J.; Hogan, R.J. Doppler lidar measurements of oriented planar ice crystals falling from supercooled and glaciated layer clouds. Q. J. R. Meteorol. Soc. 2010, 136, 260–276. [Google Scholar] [CrossRef] [Green Version]
  75. Manninen, A.J. Developing Methods for Doppler Lidar to Investigate Atmospheric Boundary Layer; University of Helsinki: Helsinki, Finland, 2019. [Google Scholar]
  76. Lothon, M.; Lohou, F.; Pino, D.; Couvreux, F.; Pardyjak, E.R.; Reuder, J.; Vilà-Guerau De Arellano, J.; Durand, P.; Hartogensis, O.; Legain, D.; et al. The BLLAST field experiment: Boundary-layer late afternoon and sunset turbulence. Atmos. Chem. Phys. 2014, 14, 931–960. [Google Scholar] [CrossRef] [Green Version]
  77. Granados-Muñoz, M.J.; Navas-Guzmán, F.; Bravo-Aranda, J.A.; Guerrero-Rascado, J.L.; Lyamani, H.; Fernández-Gálvez, J.; Alados-Arboledas, L. Automatic determination of the planetary boundary layer height using lidar: One-year analysis over southeastern Spain. J. Geophys. Res. Atmos. 2012, 117, D18208. [Google Scholar] [CrossRef] [Green Version]
  78. US-EPA (United States Environmental Protection Agency). Meteorological Monitoring Guidance for Regulatory Modeling Applications; Office of Air Quality Planning and Standards: Durham, NC, USA, 2000.
  79. Atmospheric Research and Technology LLC Vector vs. Scalar Averaging of Wind Data. Available online: http://www.sodar.com/FYI/vector_vs_scalar.html (accessed on 14 December 2020).
  80. Grange, S.K. Technical Note: Averaging Wind Speeds and Directions; University of Auckland: Auckland, New Zealand, 2014. [Google Scholar]
  81. Stull, R. Practical Meteorology: An Algebra-Based Survey of Atmospheric Science; University of British Columbia: Vancouver, BC, Canada, 2017; ISBN 978-0-88865-283-6. [Google Scholar]
  82. Jammalamadaka, S.R.; SenGupta, A. Topics in Circular Statistics; World Scientific: Singapore, 2001; ISBN 9789712779267. [Google Scholar]
  83. Jones, T.A. MATLAB functions to analyze directional (azimuthal) data-I: Single-sample inference. Comput. Geosci. 2006, 32, 166–175. [Google Scholar] [CrossRef]
  84. American Meteorological Society Glossary of Meteorology, 2nd ed.; American Meteorological Society: Boston, MA, USA, 2000.
  85. Blackadar, A.K. Boundary layer wind maxima and their significance for the growth of nocturnal inversions. Bull. Am. Meteorol. Soc. 1957, 38, 283–290. [Google Scholar] [CrossRef] [Green Version]
  86. Baars, H.; Ansmann, A.; Engelmann, R.; Althausen, D. Continuous monitoring of the boundary-layer top with lidar. Atmos. Chem. Phys. 2008, 8, 7281–7296. [Google Scholar] [CrossRef] [Green Version]
Figure 1. Topographic maps showing (a) the location of Granada in the Southern Iberian Peninsula, (b) the orography of the basin (black line) where the city is located and (c) the location of IISTA-CEAMA (red star) with respect to the urban and suburban area (black line). Images from topographic-map.com and from the Spanish National Geographic Institute (ign.es).
Remotesensing 14 02321 g001
Figure 2. Fraction of available data from 3 May 2016 to 2 May 2018, divided by hours and range gates. Red lines stand for the heights where data availability drops to 60%.
Remotesensing 14 02321 g002
Figure 3. (a,d,f,i,k,n,p,s) Hourly averages of horizontal wind speed and direction vertical profiles for all seasons; (b,g,l,q) daytime and night-time averaged wind speed profiles UH and (c,h,m,r) their respective standard deviations ΔUH; (e,j,o,t) daytime and night-time averaged wind direction profiles.
Remotesensing 14 02321 g003
Figure 4. Weibull parameter profiles calculated for all data (yellow), only daytime data (blue) and only night-time data (orange): (a) scale parameter; (b) shape parameter.
Remotesensing 14 02321 g004
Figure 5. Wind roses showing the prevailing wind speeds and directions in Granada at three different height ranges, distinguishing between daytime (a,c,e) and night-time (b,d,f). Black lines stand for the fitted von Mises distributions, parameterized by values in Table 3.
Remotesensing 14 02321 g005
Figure 6. Frequency of occurrence of the three main labelled turbulence sources, namely convective (a,d,g,j), cloud-driven (b,e,h,k) and wind shear (c,f,i,l) for each time and range gates, and for each season at Granada station from 3 May 2016 to 2 May 2018.
Remotesensing 14 02321 g006
Figure 7. Diurnal cycle of the observed frequency of occurrence of each labelled turbulent source, for each season and calculated for five different height ranges at Granada station from 3 May 2016 to 2 May 2018.
Remotesensing 14 02321 g007
Table 1. Technical details of the main optical elements of the Doppler lidar system.
Emission
Wavelength1500 nm
Pulse energy100 µJ
Pulse duration200 ns
Pulse repetition rate15 kHz
Reception optics
Telescopemonostatic optic-fiber coupled
Physical lens diameter75 mm
Effective beam diameter *(17.5 ± 1) mm
Lens divergence33 µrad
Focal length *(535 ± 35) m
Detection
Detection typeHeterodyne
Range resolution30 m
Points per range bin10
Sampling frequency50 MHz
Velocity resolution0.0382 m s−1
Nyquist velocity20 m s−1
* Retrieved with the method of Pentikäinen et al. (2020).
Table 2. Selected hours for ‘Day’ and ‘Night’ time intervals for the averaged profiles at each season.
DJFMAMJJASON
‘Day’ interval (h UTC)10–1810–2210–219–20
‘Night’ interval (h UTC)20–923–71–822–7
Table 3. Parameters corresponding to bimodal von Mises distributions fitted to daytime and night-time wind directions divided into three height ranges.
DaytimeNight-Time
Altitude a.g.l. (m)580–820
(Figure 5a)
340–580
(Figure 5c)
100–340
(Figure 5e)
580–820
(Figure 5b)
340–580
(Figure 5d)
100–340
(Figure 5f)
μ 1   ( ° ) 289.7293.4299.161.685.0106.4
κ 1 1.01.42.02.16.35.0
p 1 0.950.920.870.480.250.14
μ 2   ( ° ) 213.8205.8205.3233.30.091.5
κ 2 15.010.05.00.90.030.5
p 2 0.050.080.130.520.750.86
Publisher’s Note: MDPI stays neutral with regard to jurisdictional claims in published maps and institutional affiliations.

