
Snow Virga above the Swiss Plateau Observed by a Micro Rain Radar


1
Physik-Institut, University of Zurich, 8057 Zurich, Switzerland
2
Institute of Applied Physics, University of Bern, 3012 Bern, Switzerland
3
Oeschger Centre for Climate Change Research, University of Bern, 3012 Bern, Switzerland
*
Author to whom correspondence should be addressed.
Remote Sens. 2022, 14(4), 890; https://doi.org/10.3390/rs14040890
Submission received: 3 January 2022
/
Revised: 27 January 2022
/
Accepted: 9 February 2022
/
Published: 13 February 2022
(This article belongs to the Topic Advanced Research in Precipitation Measurements)
Abstract
:Studies of snow virga precipitation are rare. In this study, we investigated data from a vertically pointing Doppler Micro Rain Radar (MRR) in Bern, Switzerland, from 2008 to 2013 for snow virga precipitation events. The MRR data were reprocessed using the radar data processing algorithm of Garcia-Benardi et al., which allows the reliable determination of the snow virga precipitation rate. We focus on a long-lasting snow virga event from 17 March 2013, supported by atmospheric reanalysis data and atmospheric back trajectories. The snow virga was associated with a wind shear carrying moist air and snow precipitation in the upper air layers and dry air in the lower air layers. The lowest altitudes reached by the precipitation varied between 300 m and 1500 m above the ground over the course of the event. The duration of the snow virga was 22 h. In disagreement with the MRR observations, ERA5 reanalysis indicated drizzle at the ground over a time segment of 4 h during the snow virga event.

1. Introduction
Virga is rain, ice or snow falling within the troposphere and evaporating or sublimating at a level well above the ground. The glossary of meteorology of the American Meteorological Society gives a more narrow definition of virga as “wisps or streaks of water or ice particles falling out of a cloud but vaporizing before reaching the Earth’s surface as precipitation” [1]. Radar and ceilometer measurements show that virga is continued by precipitation inside the cloud layer (e.g., Figure 1 in [2]). For atmospheric research and aviation, it might be desirable to include the precipitation inside the cloud layer into the virga research topic. Further, precipitation inside a cloud layer without virga precipitation below the cloud base also has our interest.
Whether hydrometeors reach the ground or not has a large impact on weather forecasting, climate prediction, hydrology, civilization and vegetation. Though virga is a fascinating and important research object, scientific publications about virga are rare. Virga is often seen in deserts and semi-arid continental regions where the cloud bases may be as much as 4 km above the ground. It can be observed by eye that the falling rain is completely evaporated before reaching the ground [3]. A first quantitative study of virga was based on radar measurements in central South Africa during the summer. Rosenfeld and Mintz [3] found that 50% of the rain was evaporated by 1.6 km below the cloud base (for medium rain intensity). Airey et al. [4] investigated the droplet diameter as a function of altitude by using a ceilometer in the United Arab Emirates. They found that smaller droplets, higher cloud bases, reduced cloud depths, and colder cloud bases all act to prevent successful surface precipitation, instead yielding virga (28 out of 105 rain generating events). Airey et al. emphasized that understanding rainfall in arid and water-scarce regions is central to the efficient use of water resources in agriculture, irrigation and domestic food security. They mentioned the possibility of cloud seeding operations by aircrafts in order to enhance rainfall at the surface.
The ground observations of virga are in qualitative agreement with global observations of spaceborne radars. Wang et al. [5] found a maximum of virga occurrence above the Sahara. The sensitive CloudSat Cloud Profiling Radar observed a 60% occurrence of virga above arid regions, mostly associated with altostratus and cirrus clouds. The passive microwave imagers of the Tropical Rainfall Measuring Mission (TRMM) and the Global Precipitation Measurement (GPM) mission have 30–50% false alarms for surface precipitation in arid regions because of virga [5]. Sunilkumar et al. [6] analysed various multisatellite precipitation estimates (MPEs) over India. The MPEs overestimated the surface precipitation in arid regions, possibly due to a false interpretation of virga. Fraser and Bohren [7] performed analytical computations in order to find the dependence of the rain rate profile on the surface relative humidity. Generally, they assumed that the rain rate increases with height, having a maximum at the cloud base. They suggested that the sharp gradient in the optical brightness below a virga shaft might be due to the transition from snowflakes to raindrops. In addition, the greater fall velocity of raindrops leads to a decrease in the number density of raindrops, so that the optical transmission will increase.
Yang et al. [2] used ground-based cloud radar observations of marine stratocumulus clouds. They emphasized that drizzle is frequently observed in these clouds and below. Drizzle plays a crucial role for cloud lifetime and the radiation budget. The radar observed drizzle virga below the marine stratocumulus clouds where subcloud scavenging and evaporative cooling are important. The observed drizzle virga depths were in the range from 100 to 400 m, increasing with the cloud layer thickness. The results showed that 83% of the marine stratocumulus clouds were drizzling although only 31% generated surface precipitation. Virga can also be considered to be a prephase of surface precipitation. Virga can be associated with a dry downburst which may later change to a wet downburst. Wilson and Wakimoto [8] described how T. T. Fujita discovered the existence of downbursts (microbursts) in the lower troposphere. The cooling by evaporation and the melting of precipitation below a cloud induces an intense downward vertical wind, as numerical simulations by Srivastava [9] showed. The strong downdraft generates a small-scale diverging wind field at the surface. Downbursts can cause low-flying aircraft to crash, damage to buildings and more. A forecast of a downburst is only possible over a short time interval of several minutes and if a weather radar is operated.
There are some contrary opinions and observations about the vertical profile of the rain rate in the literature. Some researchers assume that the diameter of raindrops increases during their fall. Other researchers report that the raindrop diameter is maximal at the cloud base. Modellers often assume a constant rain rate with altitude. Kumar et al. [10] analysed observations of a weather radar in Peru and found a dependence of the rain rate profile on the rain intensity. In cases of strong precipitation (>20 mm/h) the rain rate was maximal at the surface while in case of light precipitation (<0.2 mm/h) the rain rate was maximal at the cloud base. Ojo et al. [11] analysed observations of a micro rain radar in Akure, Nigeria. They found that the liquid water content profile is linear proportional to the rain rate profile. The rain rate is often constant below 3 km height, and a clear maximum occurs at 4–5 km height. Virga also plays a role in atmospheric chemistry. The evaporation or sublimation of hydrometeors below a cloud has aerosols and chemical compounds as left-overs. Elperin et al. [12]) simulated the effect of rain scavenging on the altitudinal distribution of soluble gaseous pollutants in the atmosphere. Ground-based radar measurements can contribute to atmospheric chemistry by determining how much rain evaporates on its way down to the surface.
In the present study, we focus on snow virga which sometimes occurs at Bern (Switzerland). In fact, it is easier to detect snow virga in the dataset of our micro rain radar than to detect the short-term, small-scale virga streaks before or after heavy rainfall events. Since there exist no publication about snow virga at mid-latitudes yet, it is valuable to present, to analyse and to discuss a case study of a long-lasting snow virga event at Bern. Generally, knowledge about snow virga is of interest for weather forecasting (e.g., avoiding false alarm of snowy road condition, winter sport, aviation) and climate research (e.g., atmospheric radiative transfer).
Cheng and Yi [13] found falling mixed-phase ice virga outgoing from their liquid parent cloud layer using polarisation measurements of ground-based lidars in Wuhan, China. The liquid cloud layer occurred at about 5.5 km altitude for a period of 3 h. The ice virga was extended to about 500 m below the liquid cloud layer.
Grazioli et al. [14] found that snowfall sublimation in the atmosphere, caused by katabatic winds, is in the order of 35% in the margins of East Antarctica. They suggested that, as climate warming progresses, this process will be enhanced and will limit expected precipitation increases at the ground level. Jullien et al. [15] analysed lidar and micro rain radar data of snow virga at the coast of Antarctica. They found an occurrence of snow virga, which is about 36% of the hours with surface precipitation. Usually, snow virga occurred before and after periods of surface precipitation. A dry katabatic layer is responsible for the low-level sublimation of snowflakes in the coastal regions of Antarctica. Grazioli et al. [14] and Jullien et al. [15] seem to be the sole publications about snow virga so far. Interestingly, Jullien et al. found that ERA5 reanalysis largely overestimated the number of hours with light precipitation on the surface when they compared ERA5 to their coincident radar measurements. An overestimation of surface precipitation in ERA5 was also found by [16] for the number of hours with drizzle on the surface at Bern, when they intercompared ERA5 to coincident rain rate measurements of a microwave radiometer which is very sensitive to drizzle. The microphysics parameterization of the phase transitions of atmospheric water and the correct estimation of the growth or decrease of droplets, ice crystals, snowflakes and other hydrometeors are the largest challenge for atmospheric models. Here, observations of radiosondes, lidars, radars and radiometers are needed for model validation or data assimilation.
Jullien et al. [15] never used the terms “cloud base” or “cloud bottom height” in their article. Possibly, the lidar and the ceilometer cannot detect the cloud base which is hidden by the snow virga below. We also assume that the cloud base height which is provided by our ceilometer retrieval program is not reliable when snow virga is present. The retrieval result might be close to the lower boundary of snow virga where the ceilometer signal is possibly blocked.
The present study investigates a long-lasting snow virga event above the Swiss Plateau which belongs to the lowlands of Switzerland. It is one of the three major landscapes in Switzerland, lying between the Jura Mountains and the Swiss Alps. The Swiss Plateau is by far the most densely populated region of Switzerland, the center of the economy and important transportation [17]. Section 2 and Section 3 explain the micro rain radar and its data processing, the ceilometer, the meteorological reanalysis data and the backward trajectory analysis. Section 4 presents the results of the snow virga on 17 March 2013. A detailed discussion of the meteorological situation and a summary are given in Section 5. The conclusions are presented in Section 6.
2. Micro Rain Radar and Data Processing
2.1. Instrument
The vertically pointing Doppler Micro Rain Radar (MRR) is a frequency modulated continuous wave (FMCW) radar manufactured by Meteorologische Messtechnik (METEK) GmbH. A summary on the technical features for the MRR 2 used in this work can be found in Table 1. The MRR operates with electromagnetic radiation at a central frequency of 24.23 GHz and thus is a K-band radar. The modulation bandwidth can be varied from 0.5 to 15 MHz, which corresponds to a height resolution of 300–10 m. A detailed description of the MRR measurement technique is given by [18].
The radar emits radiation vertically into the atmosphere, of which a part is scattered back to the antenna by any kind of hydrometeors. Due to the fall velocity of the hydrometeors relative to the antenna, a frequency shift between the emitted and the received backscattered signal can be measured (Doppler frequency). This frequency shift is linked to the fall velocity of the hydrometeors, from which their diameter can be inferred thanks to the well established relationship between drop size and terminal fall velocity [18]. If the intensity of the backscattered signal and the diameters of the hydrometeors are known, their quantity can be calculated.
However, because precipitation consists of hydrometeors with different diameters and thus different terminal velocities, the backscattered signal is a distribution made of varying Doppler frequencies. The remedy is the spectral analysis of the backscattered signal which gives a power spectrum distributed over a range of frequency lines corresponding to the Doppler frequencies.
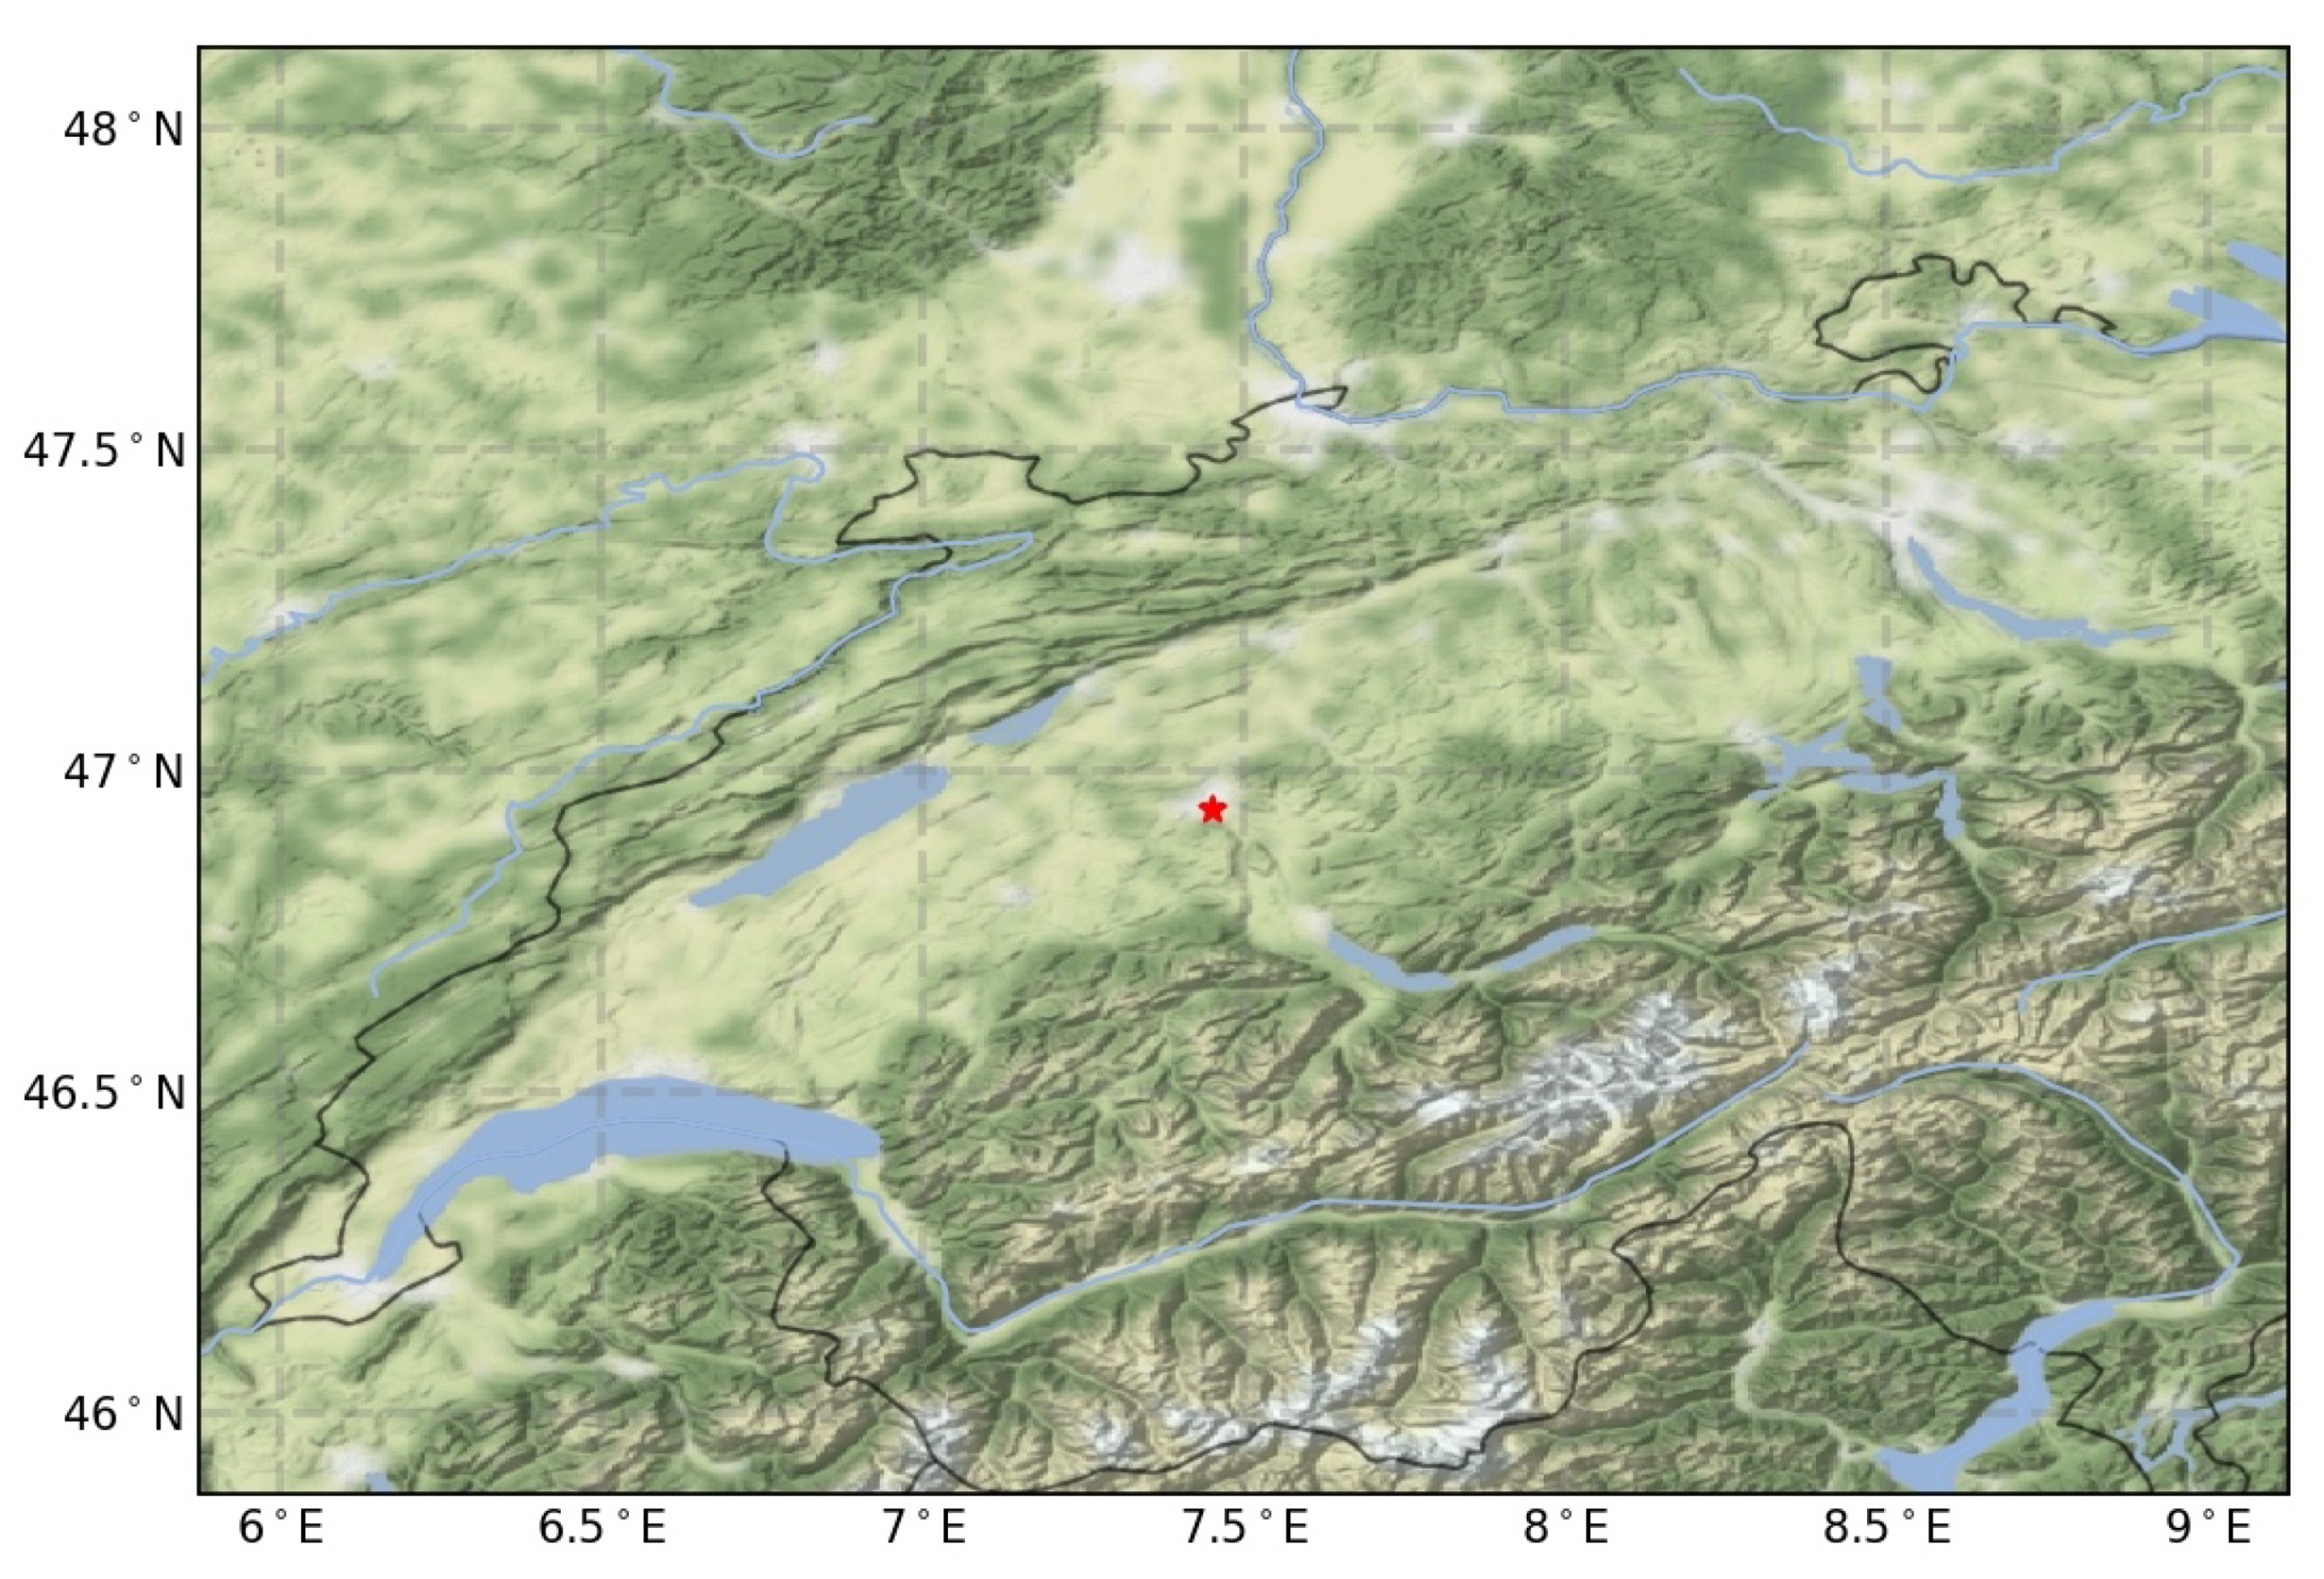
The MRR was deployed in March 2007 as part of Andreas Leuenberger’s master thesis [20]. It is located on the campus of the University of Bern (N46.95 E7.44) on the ExWi building at an altitude of 575 m above sea level (a.s.l.). Since then, it has been in continuous operation and collects data, albeit with some interruptions of varying duration for reasons that are partly explained (e.g., loss of network connection) and partly unexplained. Bern is on the Swiss Plateau, which covers about 30% of the Swiss surface area. The Swiss Plateau is in the lowlands between the Jura Mountains and the Swiss Alps. The Swiss Plateau is partly flat but mostly hilly. The average height is between 400 and 600 m a.s.l. [21]. The topography of Western Switzerland and the location of Bern are shown in Figure 1.
2.2. Data Processing and Retrieval
The raw dataset of the MRR contains the spectral powers for each measured altitude with a temporal resolution of 10 s. The processing of the raw data is carried out by the MRR itself. However, not only processed data is recorded but also the raw data. This creates the possibility for researchers to create their own data processing. In this way, the potential of the MRR can be better exploited. The data processing can be adapted to the latest state of research and supplemented for the derivation of other variables. The radar can thus also be used for purposes other than precipitation monitoring, for example, Voge and Hort [22] use the MRR to monitor a volcano.
Such alternative raw data processing has been developed, for example, by Maahn and Kollias [23], which is particularly suitable for monitoring snow precipitation. Their developed processing methodology improves sensitivity through enhanced noise reduction. Using a newly introduced Doppler dealiasing, it can detect upward movements of precipitation, which means precipitation moving away from the radar.
Another alternative raw data processing is made available by Garcia-Benadi et al. [24]. The methodology defines the derived variables more precisely by prior classification of precipitation type into snow, drizzle, rain, hail and mixed precipitation. It also includes improved noise level determination, peak signal detection and Doppler dealiasing, which allows the upward motion of precipitation particles to be taken into account.
For the data processing we decided to use the methodology of Garcia– Benadi et al. because of its wide range of applications, such as the extension of precipitation measurement for snow and its significant advantages over MRR’s own data processing provided by METEK [18,25]. Beynon [26] explained in detail the physical science basis of the two retrievals.
The retrieval of Garcia-Benadi et al. performs a precipitation type classification for each height bin. The processing methodology distinguishes between five possible precipitation types for each height bin, namely drizzle, rain, snow, mixed and hail. Whereby in the mixed category, it is either wet snow, snow and rain or sleet.
The classification is built on a decision tree that considers relationships between the fall velocity of the hydrometeors, the equivalent radar reflectivity, the higher order moments of the velocity distributions and the existence or absence of the bright band. A detailed description of the decision tree can be found in [24].
Once the precipitation type has been determined, an attenuation correction is carried out, analogous to MRR’s own processing methodology. In the case of rain and drizzle, the determination of the precipitation rate is analogous to MRR’s own processing methodology. In the case of snow or mixed, the snowfall rate is calculated using a so-called relation, see Equation (1).
The relation was found empirically by Matrosov and was published in 2007 [27]. Further precipitation parameters, namely the liquid water content and the drop size distribution N, are not determined in this case.
As shown, the processing methodology developed by Garcia-Benadi et al. has far-reaching advantages over the METEK MRR processing methodology. All MRR data presented in the following were reprocessed using the Garcia-Benadi et al. processing methodology.
3. Further Data Used
For the analysis of the virga events, we also used other data besides the MRR data. To get a broader picture of the atmospheric conditions, we added atmospheric reanalysis data from ERA5, as well as atmospheric back trajectories generated by HYSPLIT. In addition, we used data from a ceilometer, a device for determining cloud heights. The ceilometer is co-located with the MRR on the roof of the University of Bern’s ExWi building.
3.1. ERA5
ERA5 is a global atmospheric reanalysis developed by the Copernicus Climate Change Service (C3S) and produced at the European Centre for Medium-Range Weather Forecasts (ECMWF). An atmospheric reanalysis is a method of creating meteorological datasets using models of weather forecasting and assimilation of observational data (for detailed information on the assimilated observational data see [28]). The weather forecast model used for ERA5 is the Integrated Forecasting System (IFS) Cy41r2 developed by ECMWF.
Various datasets with different variables are then made available from the ERA5 reanalysis, the ones used for this work are the datasets “ERA5 hourly data on pressure levels from 1979 to present” [29] and “ERA5 hourly data on single levels from 1979 to present” [30]. They contain a variety of atmospheric variables, the ones included in this work being temperature, relative humidity, specific humidity, specific rain water content, specific snow water content, total precipitation and horizontal as well as vertical wind speeds. The datasets have a temporal resolution of one hour and a horizontal resolution of 0.25× 0.25. The vertical coverage of the first dataset ranges from 1000 hPa to 1 hPa, on 37 pressure levels (separated by 25 hPa in the lower troposphere, ca. 250 m vertical resolution), however in this work the data is expressed in meters above sea level or meters above ground level.
For the conversion to meters above sea level, the geopotential was used, which is the gravitational potential energy of a unit mass at a given location, relative to mean sea level, as given in the ERA5 data for each grid point. As Equation (2) illustrates, with the geopotential , the gravity acceleration g and the use of the earth’s radius Re, the height above sea level z can be determined.
Subsequently, the data had to be transferred to a new grid, for which the variables were interpolated along the vertical dimension. For the MRR in Bern, meters above sea level are converted into meters above ground level by subtraction of 575 m.
Kalnay et al. [31] classified the reanalysis gridded fields into four classes, depending on the relative influence of the observational data and the model on the gridded variable. An A indicates that the analysis variable is strongly influenced by observed data, and hence it is in the most reliable class (e.g., upper-air temperature and wind). The designation B indicates that, although there are observational data that directly affect the value of the variable, the model also has a very strong influence on the analysis value (e.g., humidity and surface temperature). The letter C indicates that there are no observations directly affecting the variable, so that it is derived solely from the model fields forced by the data assimilation to remain close to the atmosphere (e.g., clouds, precipitation, and surface fluxes). Finally, the letter D represents a field that is obtained from climatological values and does not depend on the model (e.g., plant resistance, land-sea mask). Kalnay et al. emphasize that the user should exercise caution in interpreting the results of the reanalysis, especially for variables classified in categories B and C.
In the discussion of the meteorological situation, we mainly rely on the A variables, temperature and wind, of ERA5. However, we also utilize the B variables absolute and relative humidity. We can argue that there is a dense radiosonde network in Europe providing vertical profiles of humidity. In addition, the selected snow virga event occurred over 22 h. It was not a small-scale, short-term event, which might be not resolved by the reanalysis grid. The C variable precipitation of ERA5 is only used for an intercomparison with the MRR measurements.
3.2. HYSPLIT
The Hybrid Single-Particle Lagrangian Integrated Trajectory Model (HYSPLIT) is a model published by the Air Resources Laboratory (ARL) of the National Oceanic and Atmospheric Administration (NOAA) for calculating trajectories of air parcels to determine worldwide the distance and direction in which an air parcel moves. A detailed description of the algorithm can be found in Rolph et al. [32] and a summary of the opportunities that HYSPLIT offers can be found in Stein et al. [33].
The HYSPLIT model can be used among other things to calculate forward and backward trajectories of air parcels. In a forward trajectory, a parcel of air is selected which is located at a certain place on the Earth at a certain time, after which the model can predict the vertical and horizontal movement of the parcel of air for a certain period of time. In a back trajectory, an air parcel is selected and the model calculates where the air parcel originates from, in other words, it determines the path of the air parcel backwards in time from the selected location for the selected time.
In addition to the path, the HYSPLIT model can also determine the time evolution of some meteorological variables of the air parcel, such as the relative humidity, the potential temperature or the precipitation of the air parcel. The meteorological data on the basis of which the trajectories are calculated have a coarse temporal resolution of 3 h, which is why rapidly changing conditions cannot be included in the calculations. Furthermore the horizontal resolution of 1 is somewhat coarse. The three back trajectories presented in this work were generated with the online READY web version of HYSPLIT application, which can be found here [34].
3.3. Ceilometer
A ceilometer is a device with which the height of a cloud base and the vertical visibility can be determined. The ceilometer sends short laser pulses in a vertical direction and measures the backscatter caused by haze, fog, precipitation and clouds. Since the speed of light (c) is known, the backscattered signals can be assigned to an atmospheric target at a height (h) above the ground with the help of the time difference (t) between sending and receiving a signal (Equation (3)).
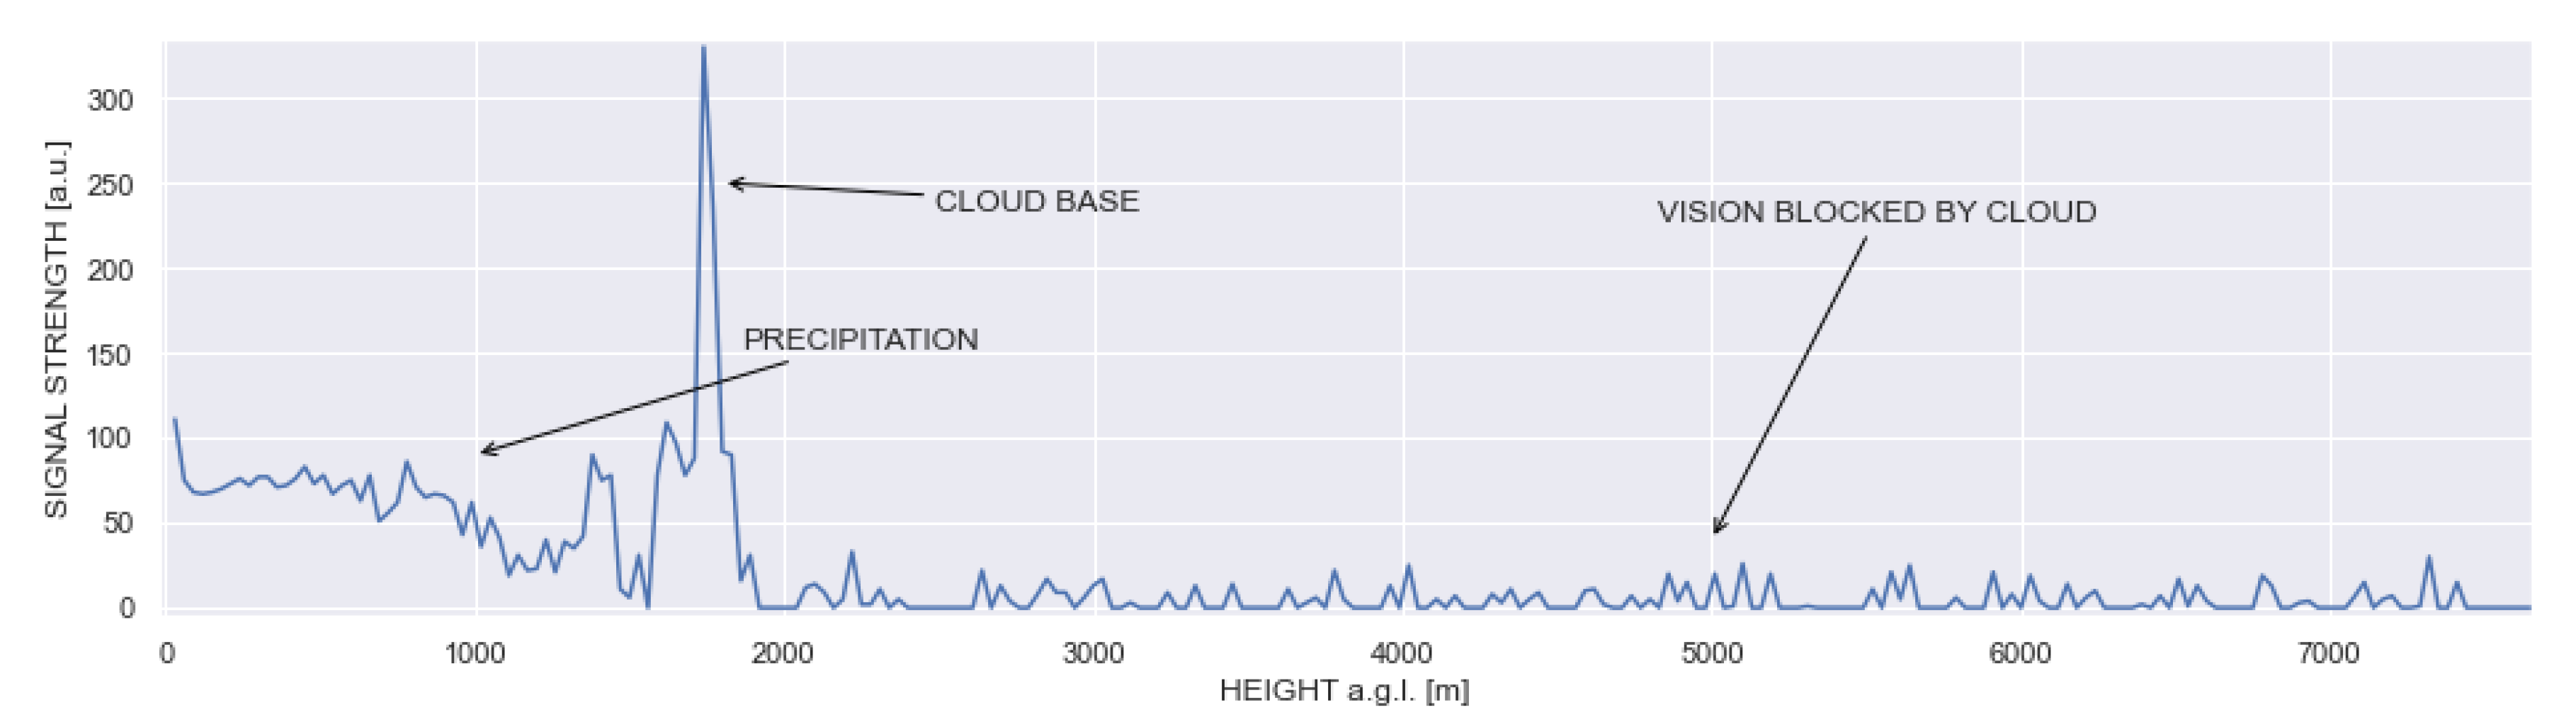
The ceilometer then creates a backscatter profile, that is the signal strength in relation to the height measured over a certain period of time. An example of a backscatter profile is shown in Figure 2. The laser power used in ceilometers is so low that the noise of the ambient light exceeds the backscattered signal. Therefore, the backscattered signals of several laser pulses are summed, and the noise, which is mostly white noise, partially cancels itself out.
The ceilometer data being used in this study originate from a CT25K by Vaisala. The cloud layer height data used in this paper is from an automatic algorithm of the CT25k. Detailed information on the algorithm’s functionality can be found in [35]. As already mentioned in the Introduction, it is likely that the retrieved cloud base height is not reliable when snow virga occurs since the ceilometer signal might be blocked at the lower boundary of the snow virga or a bit higher.
4. Results
4.1. Search for Virga Precipitation
To start, we had to look for virga events in the data to determine if any were captured at all. For this purpose, we decided to investigate the MRR data from Bern between 2008 and 2013, because in those data the data processing worked more reliably than in the following years.
As virga precipitation occurs in different forms, it is not simple to establish criteria for the search, and due to the few publications on virga events, there are also no uniform standards for doing so. Our method was to use all the available instant data (generated by MRR’s own processing methodology) from those years and search for events where the MRR measured precipitation rates but not in the lowest three height gates for at least 5 min, which means no measured precipitation rates between 0–300 m.
As one can imagine, this is not a very limiting criterion. It is also fulfilled by other processes like for example beginning or ending precipitation. This meant that all the events which met our criterion had to be plotted first and then categorized by eye to find suitable examples of virga precipitation. In this way, several virga or virga-like events were found in the MRR data between 2008 and 2013, of which two selected events of snow virga are presented in more detail in the thesis of Beynon [26]. The meteorological situtation and the reason of the occurrence of snow virga are quite similar in both cases.
4.2. Selection Criteria
We decided to present here only the snow virga event of 17 March 2013. In this case, we found some disagreement between the snow virga indicated by ERA5 reanalysis and observed by the MRR at Bern. This disagreement emphasizes the importance of atmosphere remote sensing by micro rain radars. We also have chosen the event because it lasts a long time—it extends over several hours—which allows us to combine it with the atmospheric reanalysis data from ERA5, which has a temporal resolution of one hour. It also allows us to rule out the possibility that the event is only precipitation that grazes the radar’s field of view and reaches the ground outside it.
Furthermore, emphasis was placed on having a temporal constant precipitation measurement during the events and to avoid breakthroughs in which precipitation reaches the ground. A long occurrence time of snow virga indicates that it is not only a local event, but one that is horizontally extended during a lasting atmospheric state, which makes it more suitable to link with the atmospheric reanalysis data, which has a somewhat coarse horizontal resolution of 0.25 and a time resolution of 1 h. Lastly, we considered it important to select a measured virga where the precipitation did not get close to the ground, and where the signal from the measured precipitation was not weak. The former was because we wanted to be sure that really no precipitation reached the ground and the latter because we have no knowledge about the uncertainty of the MRR measurements and we wanted to exclude the possibility that the events are only noise.
4.3. Cloud Visibility
One might wonder whether the signals we observe do not actually originate from clouds and consequently not be virga precipitation after all. However, the MRR and the processing algorithms are designed such that they exclude clouds. Firstly, the radar wavelength of about 1.2 cm is too large for cloud droplets with a typical diameter of about m. Secondly, the vertical velocity of clouds is usually zero, and the MRR data processing only considers the signals from vertically moving droplets. Therefore, the signals coming from clouds are not included in the determination of the precipitation parameters. By discarding the signals of at least the first and the last Doppler bin, the signals of targets with velocities in the range of and the signals with negative velocities in this range, contributing to the last bin by aliasing, are ignored. is the velocity resolution. Cloud droplets have vertical velocities less than if up or downdrafts are not present. Thus, only precipitation particles moving towards or away from the radar with at least the velocity will be included in the calculations.
4.4. Snow Virga Event of 17 March 2013
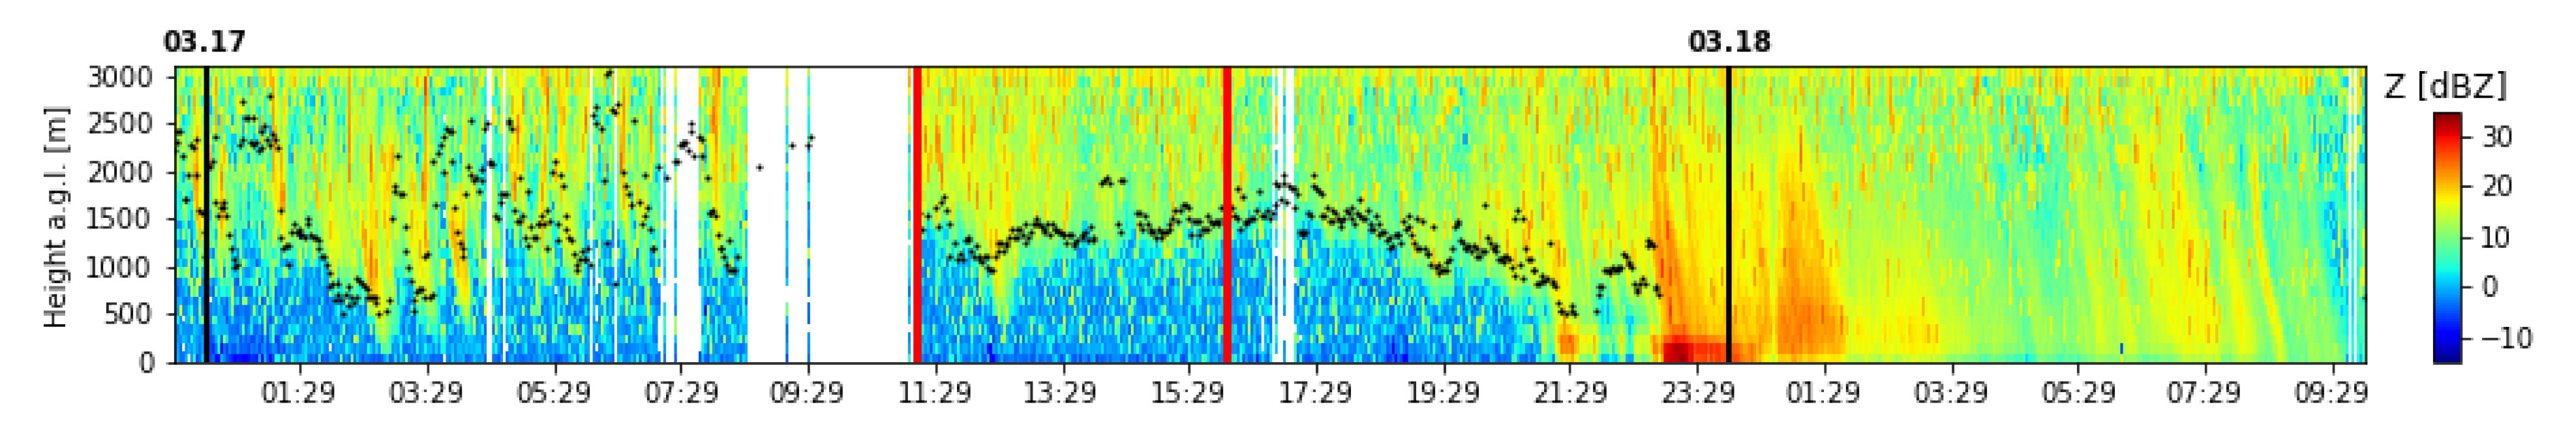
The snow virga event that we present in Figure 3 is from 17 March 2013. One can observe that the virga precipitation started at the end of the previous day and lasted for a rather long time, ending around 21:30 UTC with the onset of the ground precipitation. But virga precipitation has not been measured continuously, there exist one major and several minor gaps due to the lack of measurement activity of the MRR.
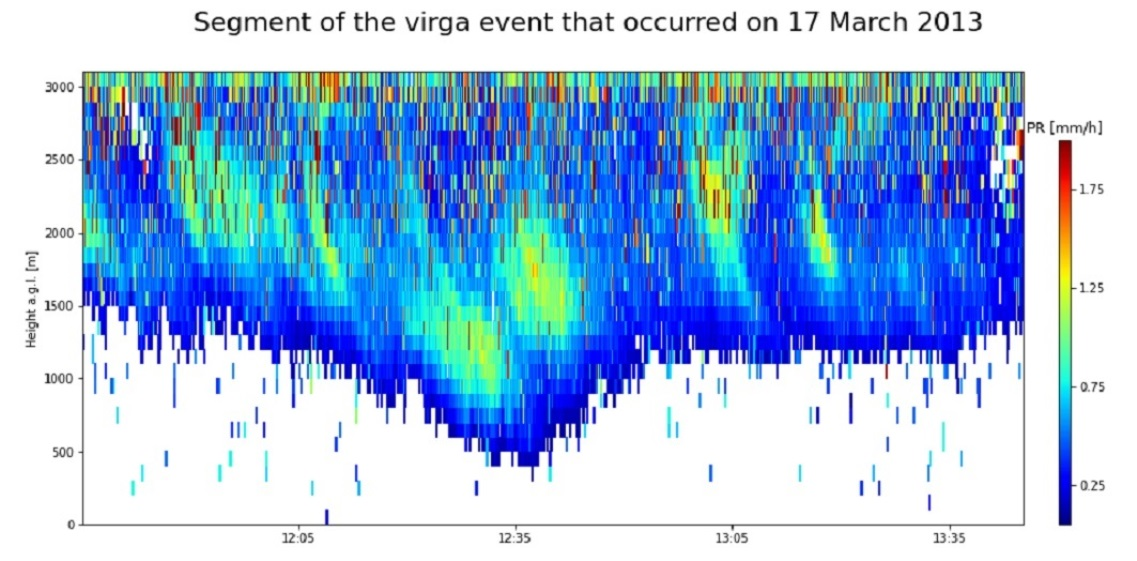
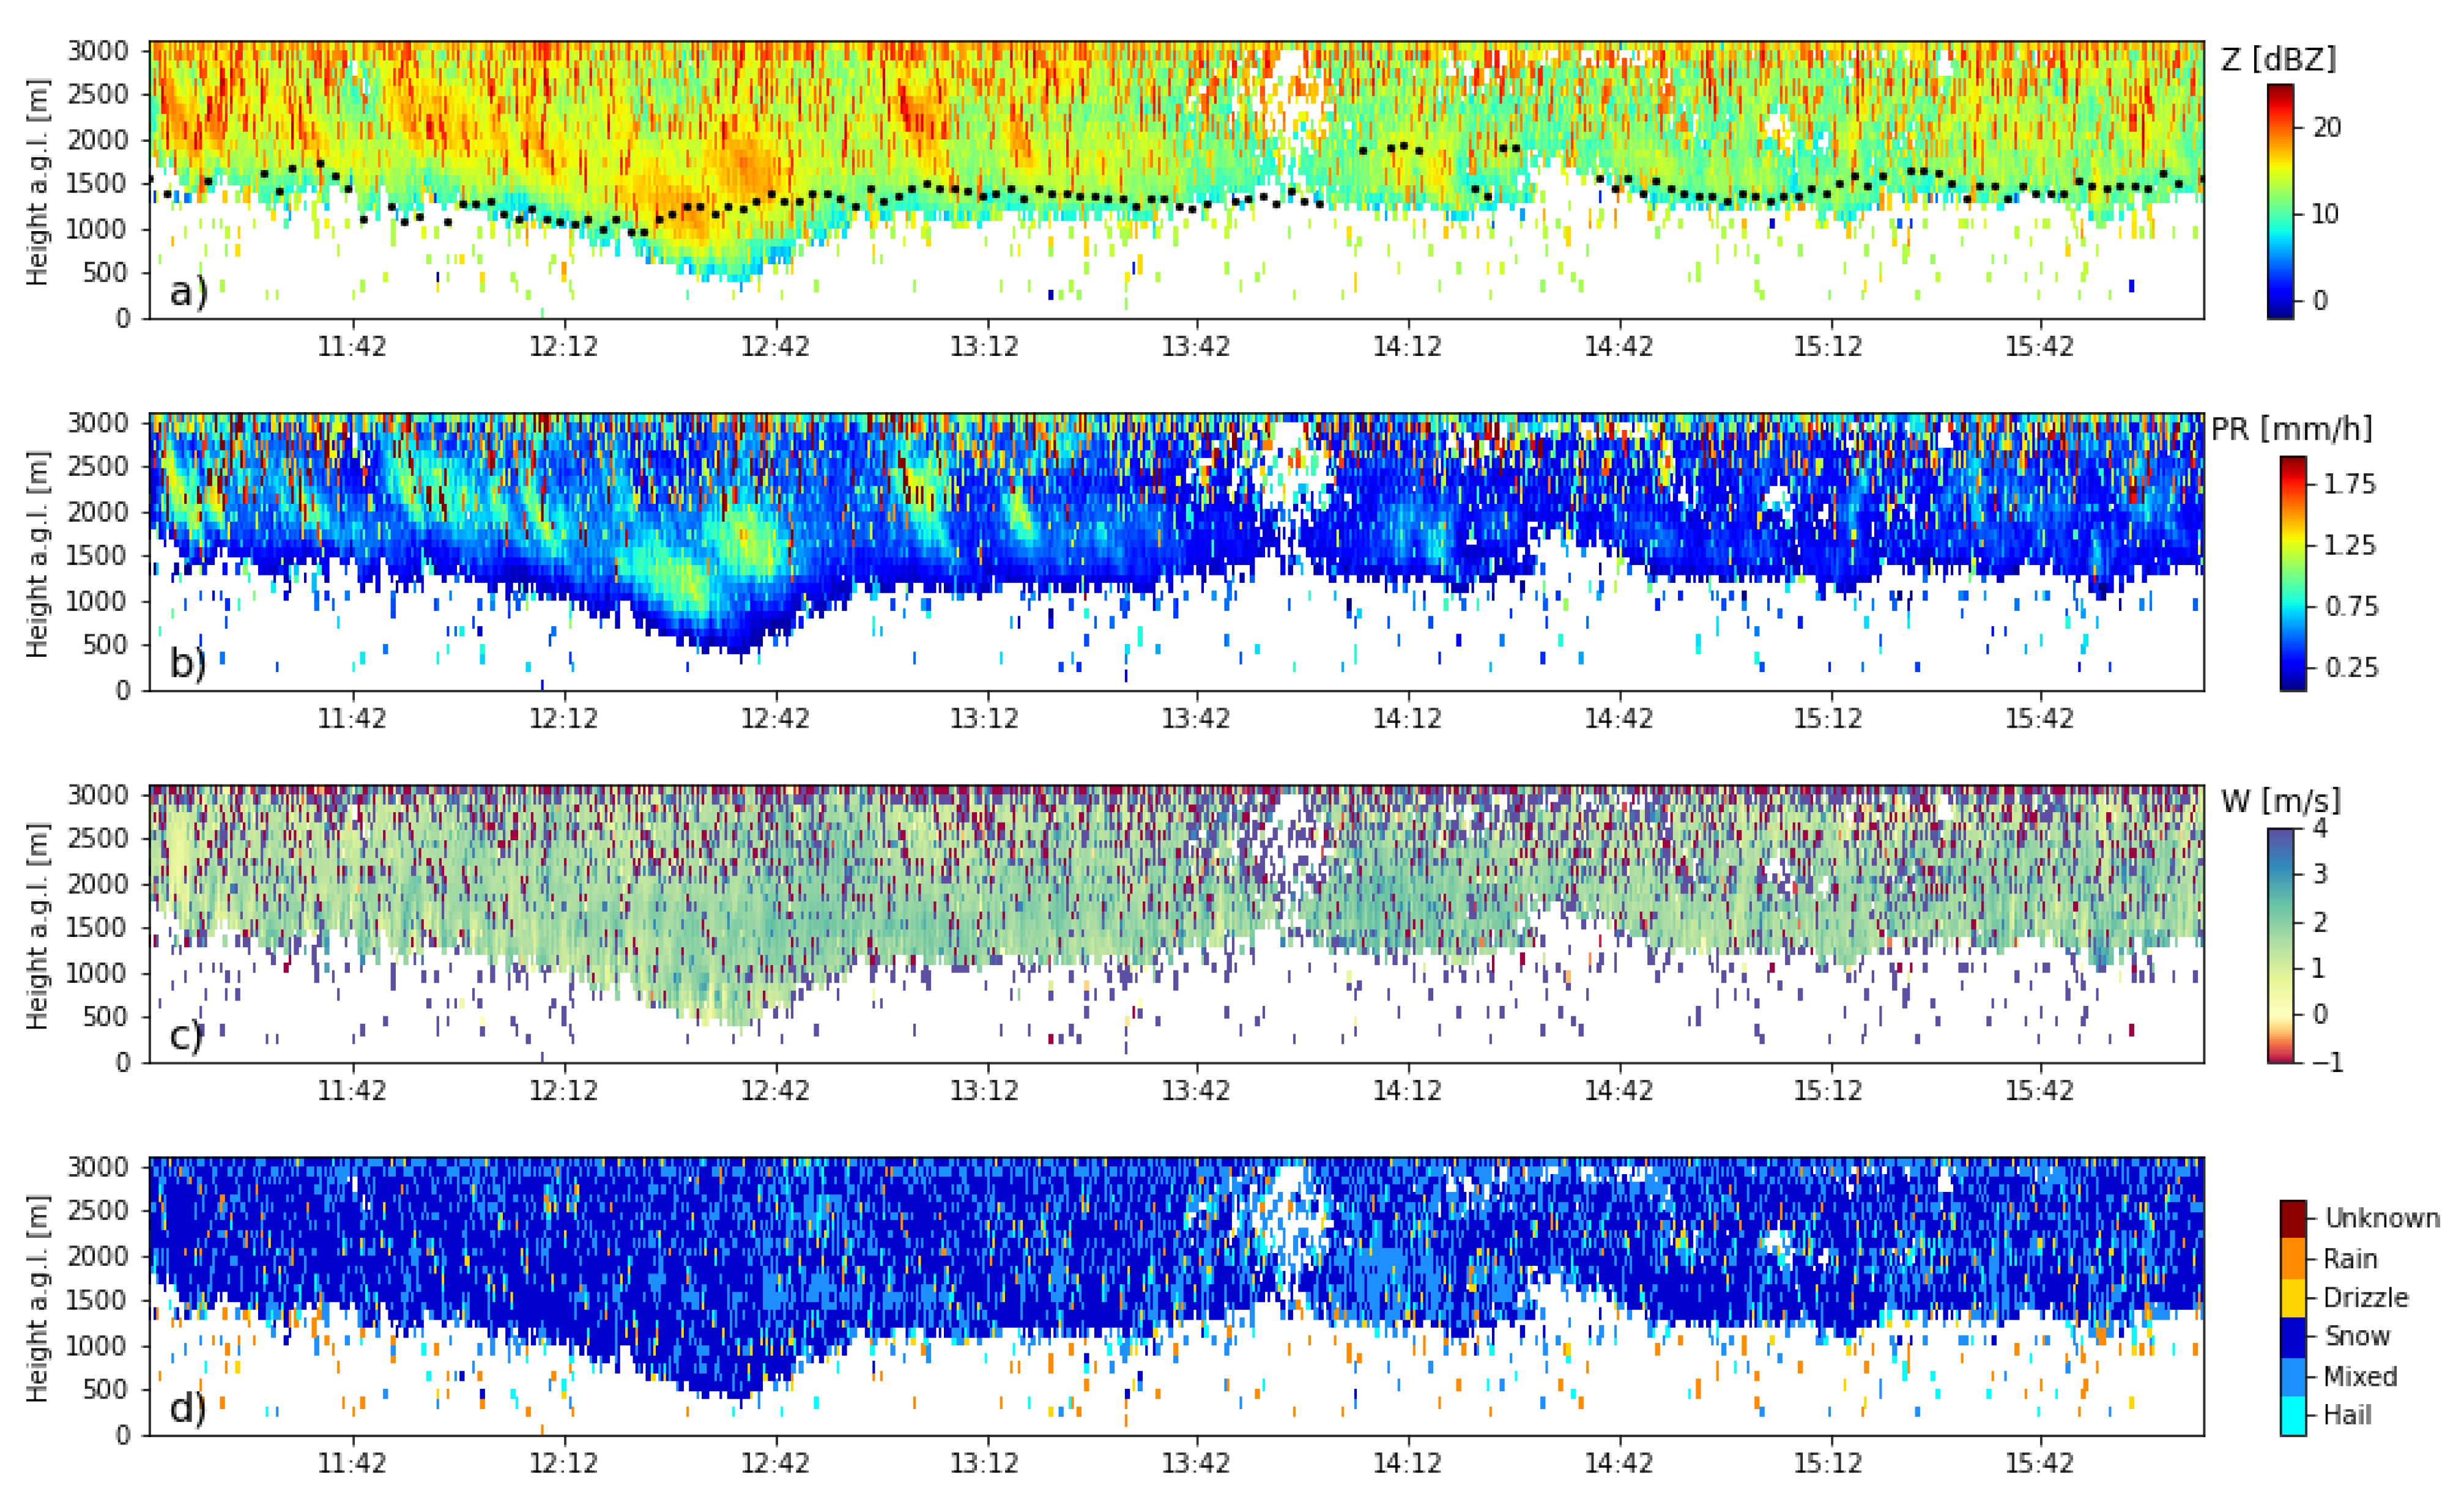
Due to the presentability, subsequent precipitation parameters measured by the MRR are presented for only a segment of the entire virga event in Figure 4b–d. A mask was applied to the parameters in this figure, namely to those measured values whose precipitation rate was zero and to those whose reflectivity factor was less than −2 dBZ, which is the minimal detectable reflectivity according to METEK [36]. The recording of the shown segment starts at 11:12 and ends at 16:05 UTC. The reflectivity exhibits varying characteristics: until about 13:30 UTC values above 15 dBz are frequently observed, afterwards the values range generally between 10 and 15 dBz. Over almost the entire period, the ceilometer measured a cloud layer whose lower limit ranged between 1 km and 2 km above the ground. However, we already mentioned that the cloud base measurement of the ceilometer is possibly not reliable during a snow virga event.
The category “mixed” in Figure 4d is either wet snow, snow and rain or sleet. Since temperatures are near the freezing point (Figure 5), we assume here that it is wet snow. The precipitation rates are quite low and rarely exceed 1 mm/h. The characteristic fall velocities are mostly close to 2 m/s and thus rather in the higher range for snow. As expected for this season and the altitude of the precipitation, it consists mostly of snow according to the classification, with the occasional occurrence of wet snow. As expected, a bright band signal is not present as precipitation only occurs in the form of snow above the 0-isotherm.
5. Discussion
5.1. Meteorological Situation
On 17 March 2013, the weather service reported stormy Föhn-wind (dry and warm down-slope wind) over the Alps and clouds at higher altitudes approaching from a southwesterly direction [37,38].
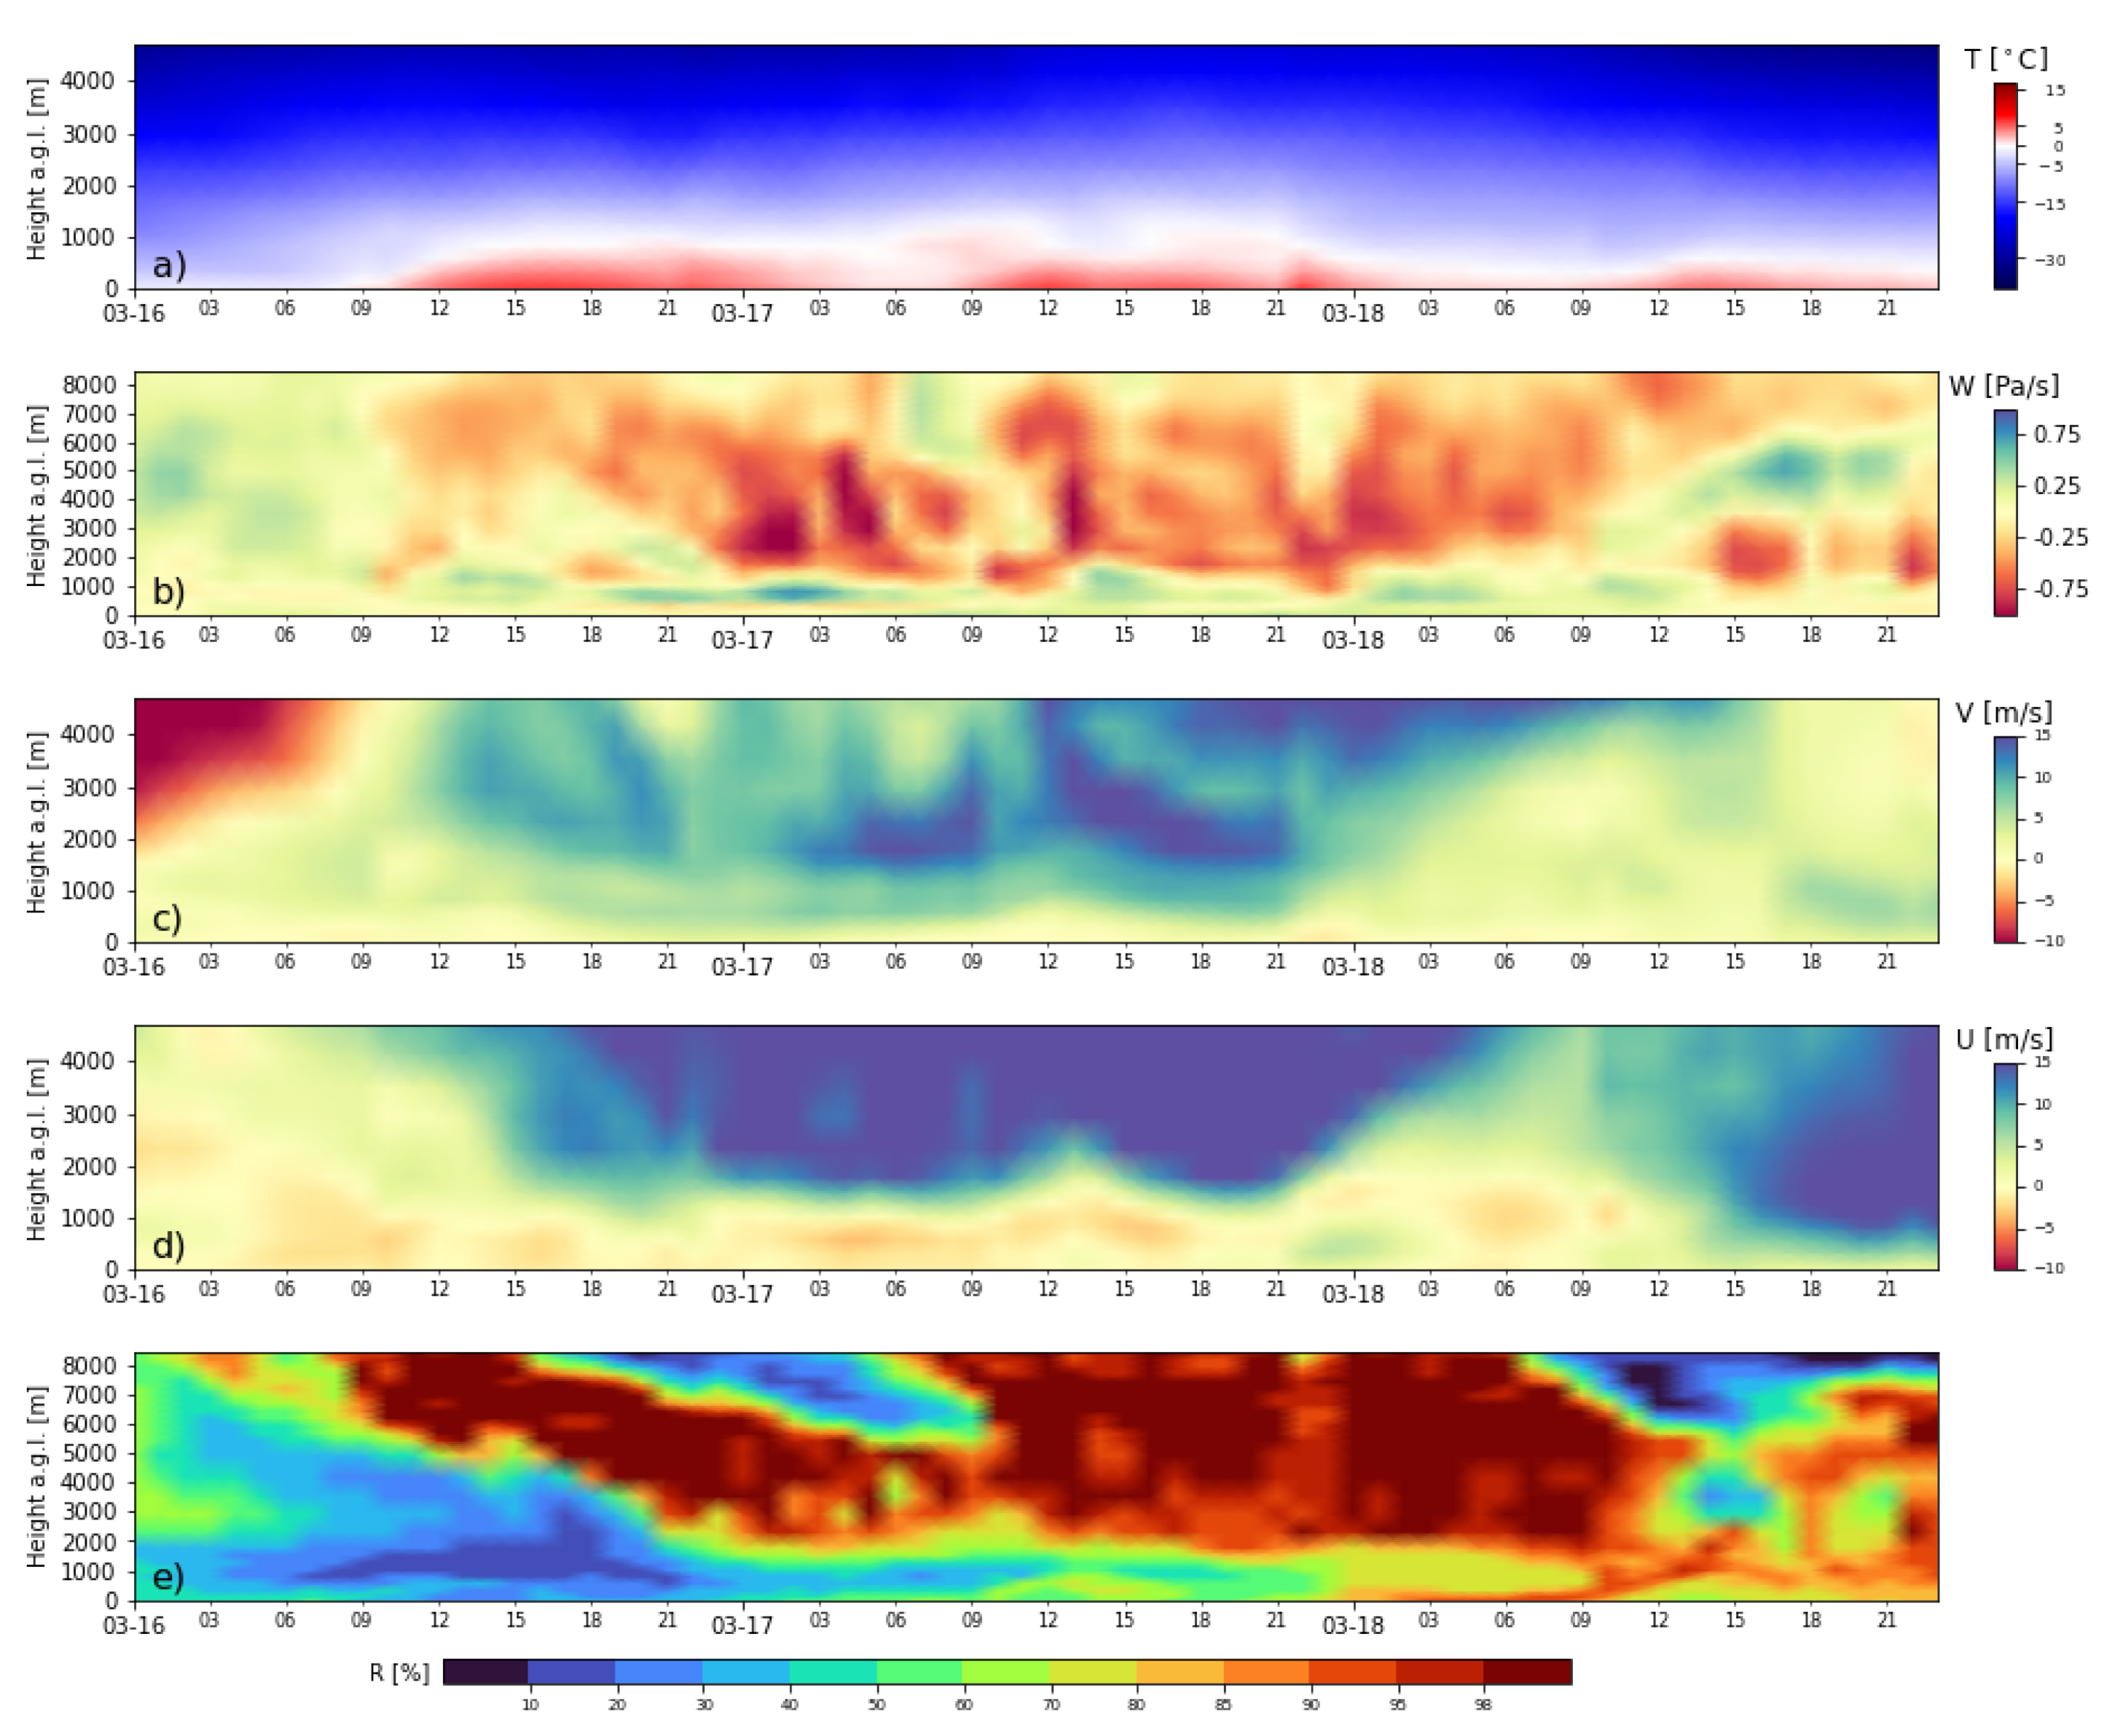
Figure 5 shows the time series of the ERA 5 data over Bern. The temperature profile shows at an altitude below 1 km an increased temperature during the virga phase, which is probably due to the Föhn-wind. The updrafts and downdrafts are not very pronounced during the virga phase. Postive values (green, blue) of W indicate a downward motion since the pressure increases towards the surface. Below an altitude of 1 km weak downdrafts can be observed, which probably originate from the precipitation. But near the ground there are then very weak updrafts and from an altitude of 1.5 km on, light updrafts can be found. In the horizontal wind profiles a wind shear is visible in the eastward component U during the virga phase, where the shear line is located at an altitude of around 1.5 km. The relative humidity profile shows that during the entire virga phase the air below an altitude of 1 km was quite dry, whereas the air above was very humid.
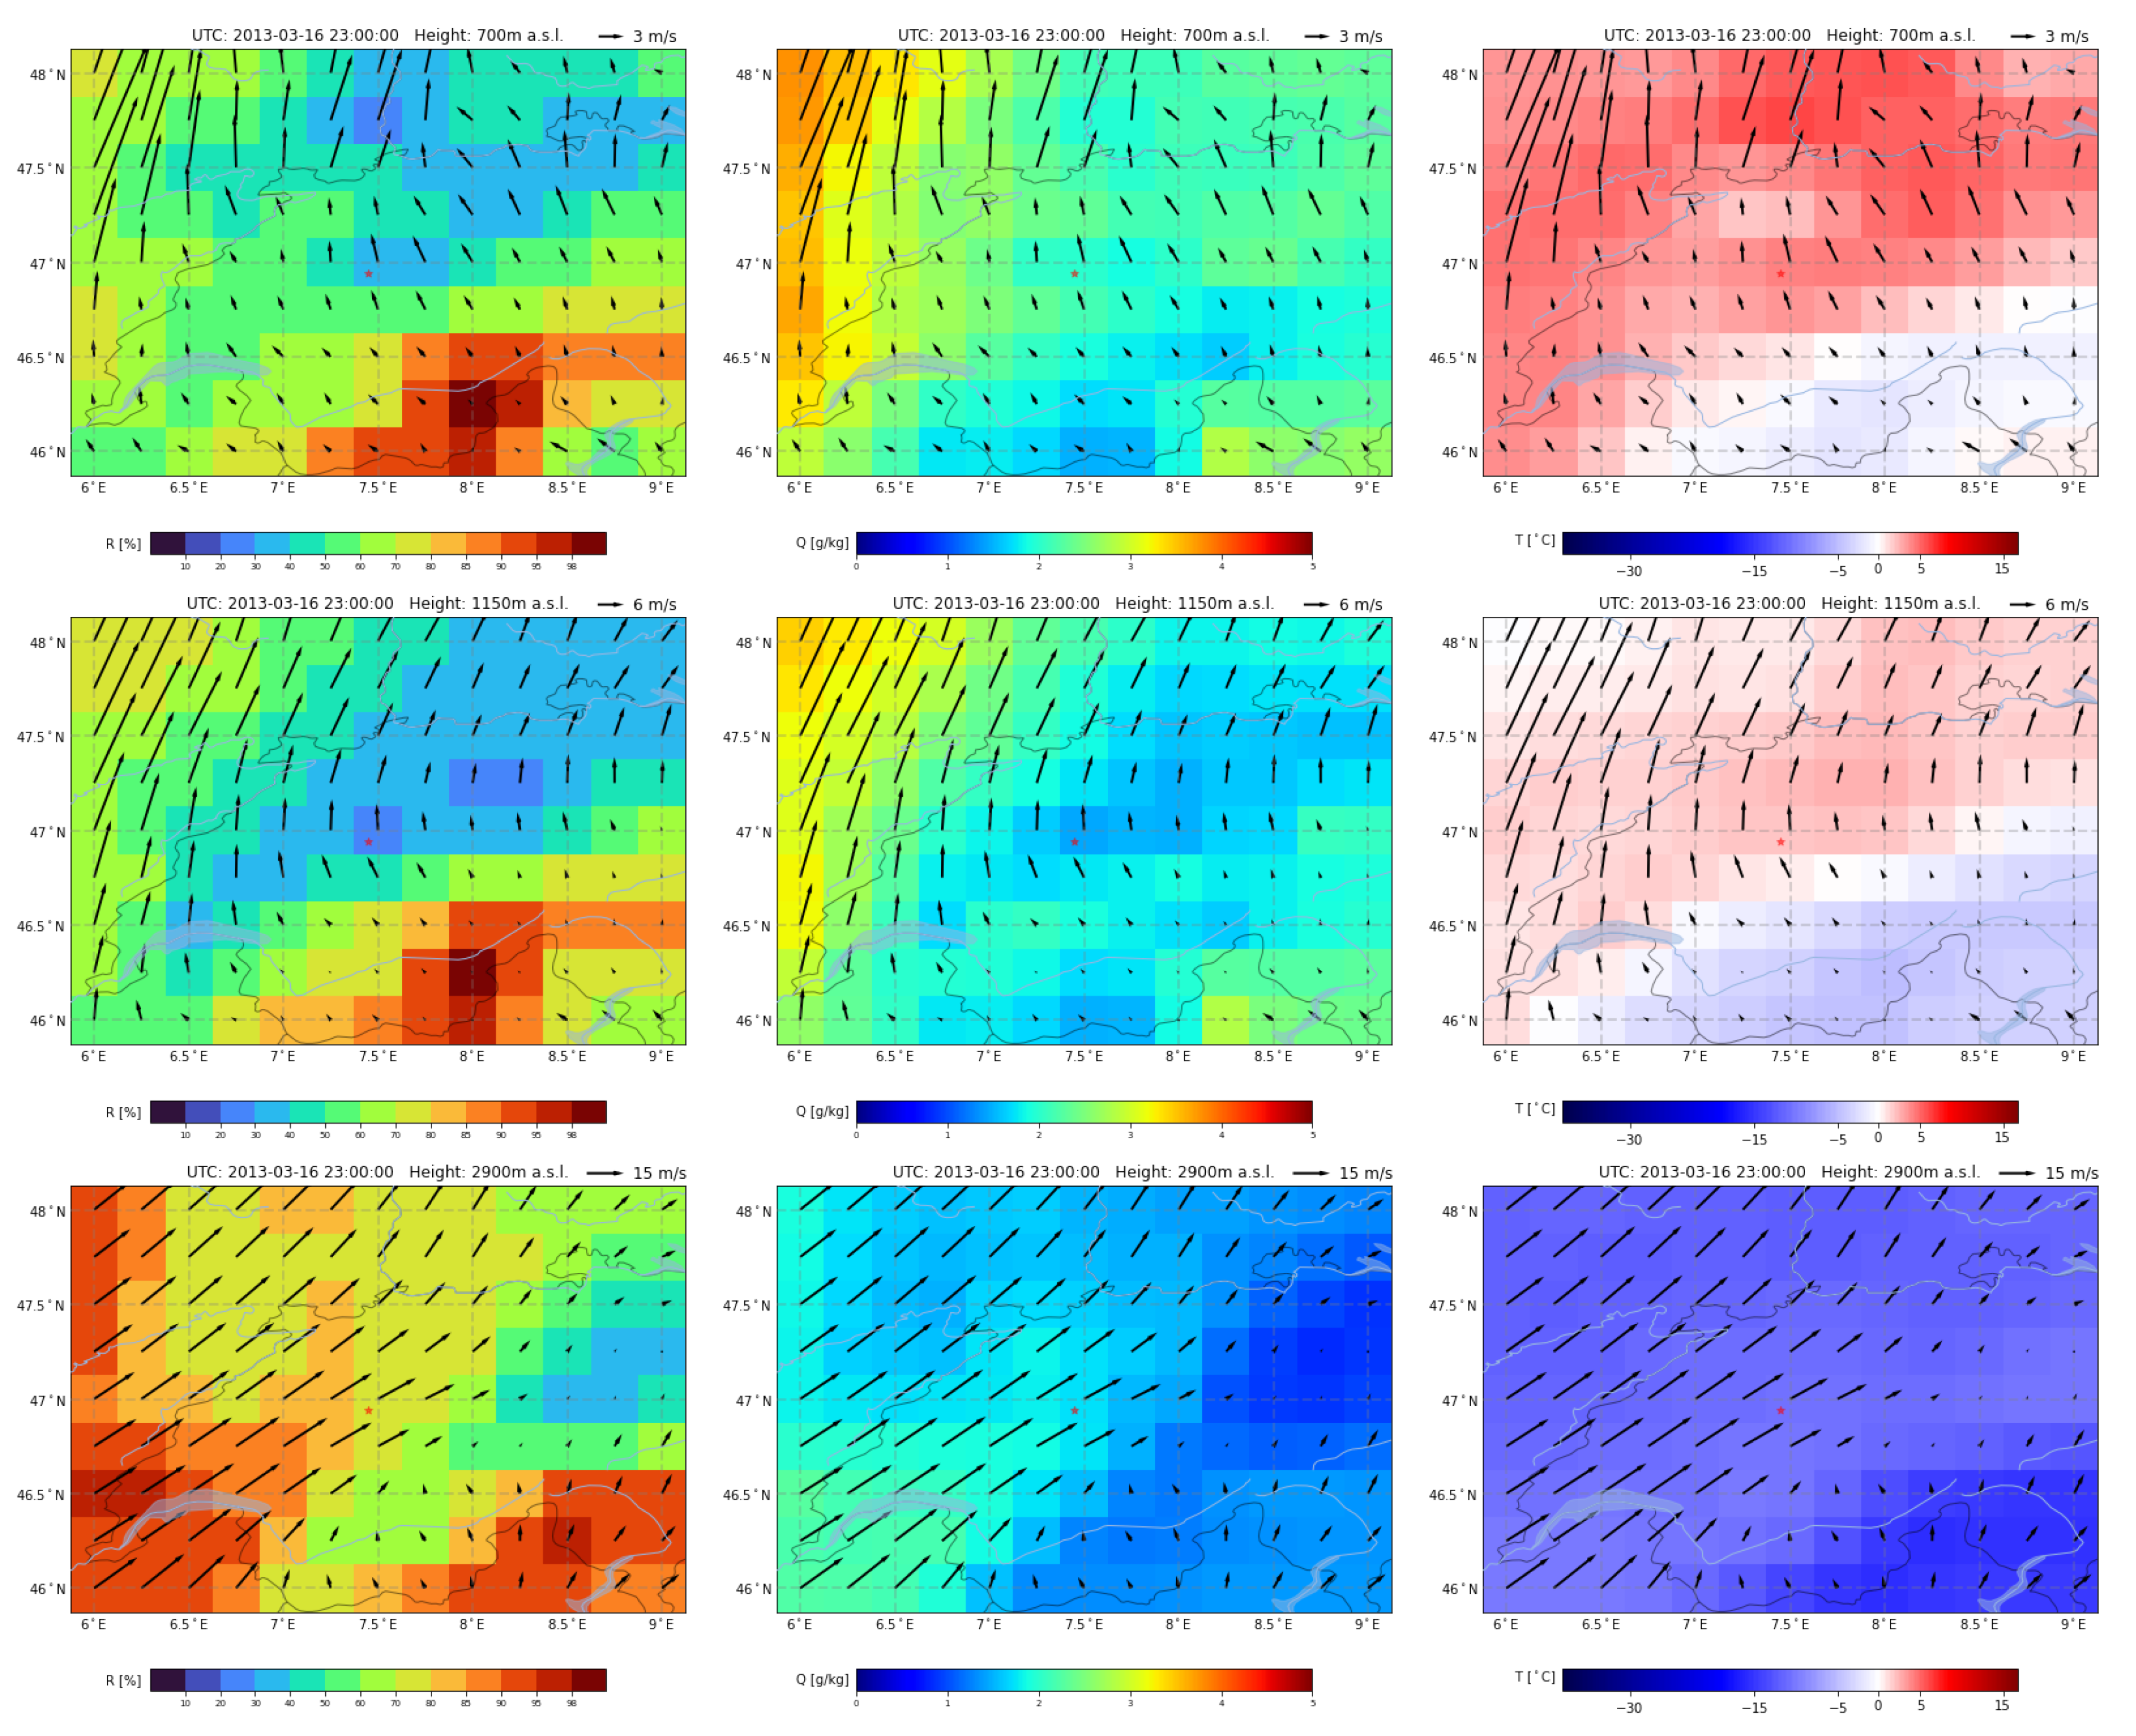
Figure 6 shows ERA5 data from the 16 March 2013 at 23 UTC on different altitudes, which is just before the MRR started registering virga precipitation. At an altitude of 700 m a.s.l., the Föhn-wind coming from the southeast is visible, which moves as a warm and dry air stream over the region of Bern. A little higher, at 1150 m a.s.l., the wind blows a little bit more from the south and at a faster speed, but it carries equally warm and dry air. At 2900 m a.s.l., a strong wind coming from the southwest is blowing over the region of Bern, bringing humid air with it.
At 12 UTC the next day (Figure 7), the Föhn wind is still blowing from a southern direction, but in the region of Bern it has come to a complete standstill at 700 m a.s.l. Above this at a height of 1150 m a.s.l. the wind has lost some of its strength, but it still keeps the relative humidity low at this altitude by bringing in dry air from the south. At 2900 m a.s.l., a southwesterly wind is still blowing, but the humid air tends to pass north of Bern. Nevertheless the air in this region is also already humid.
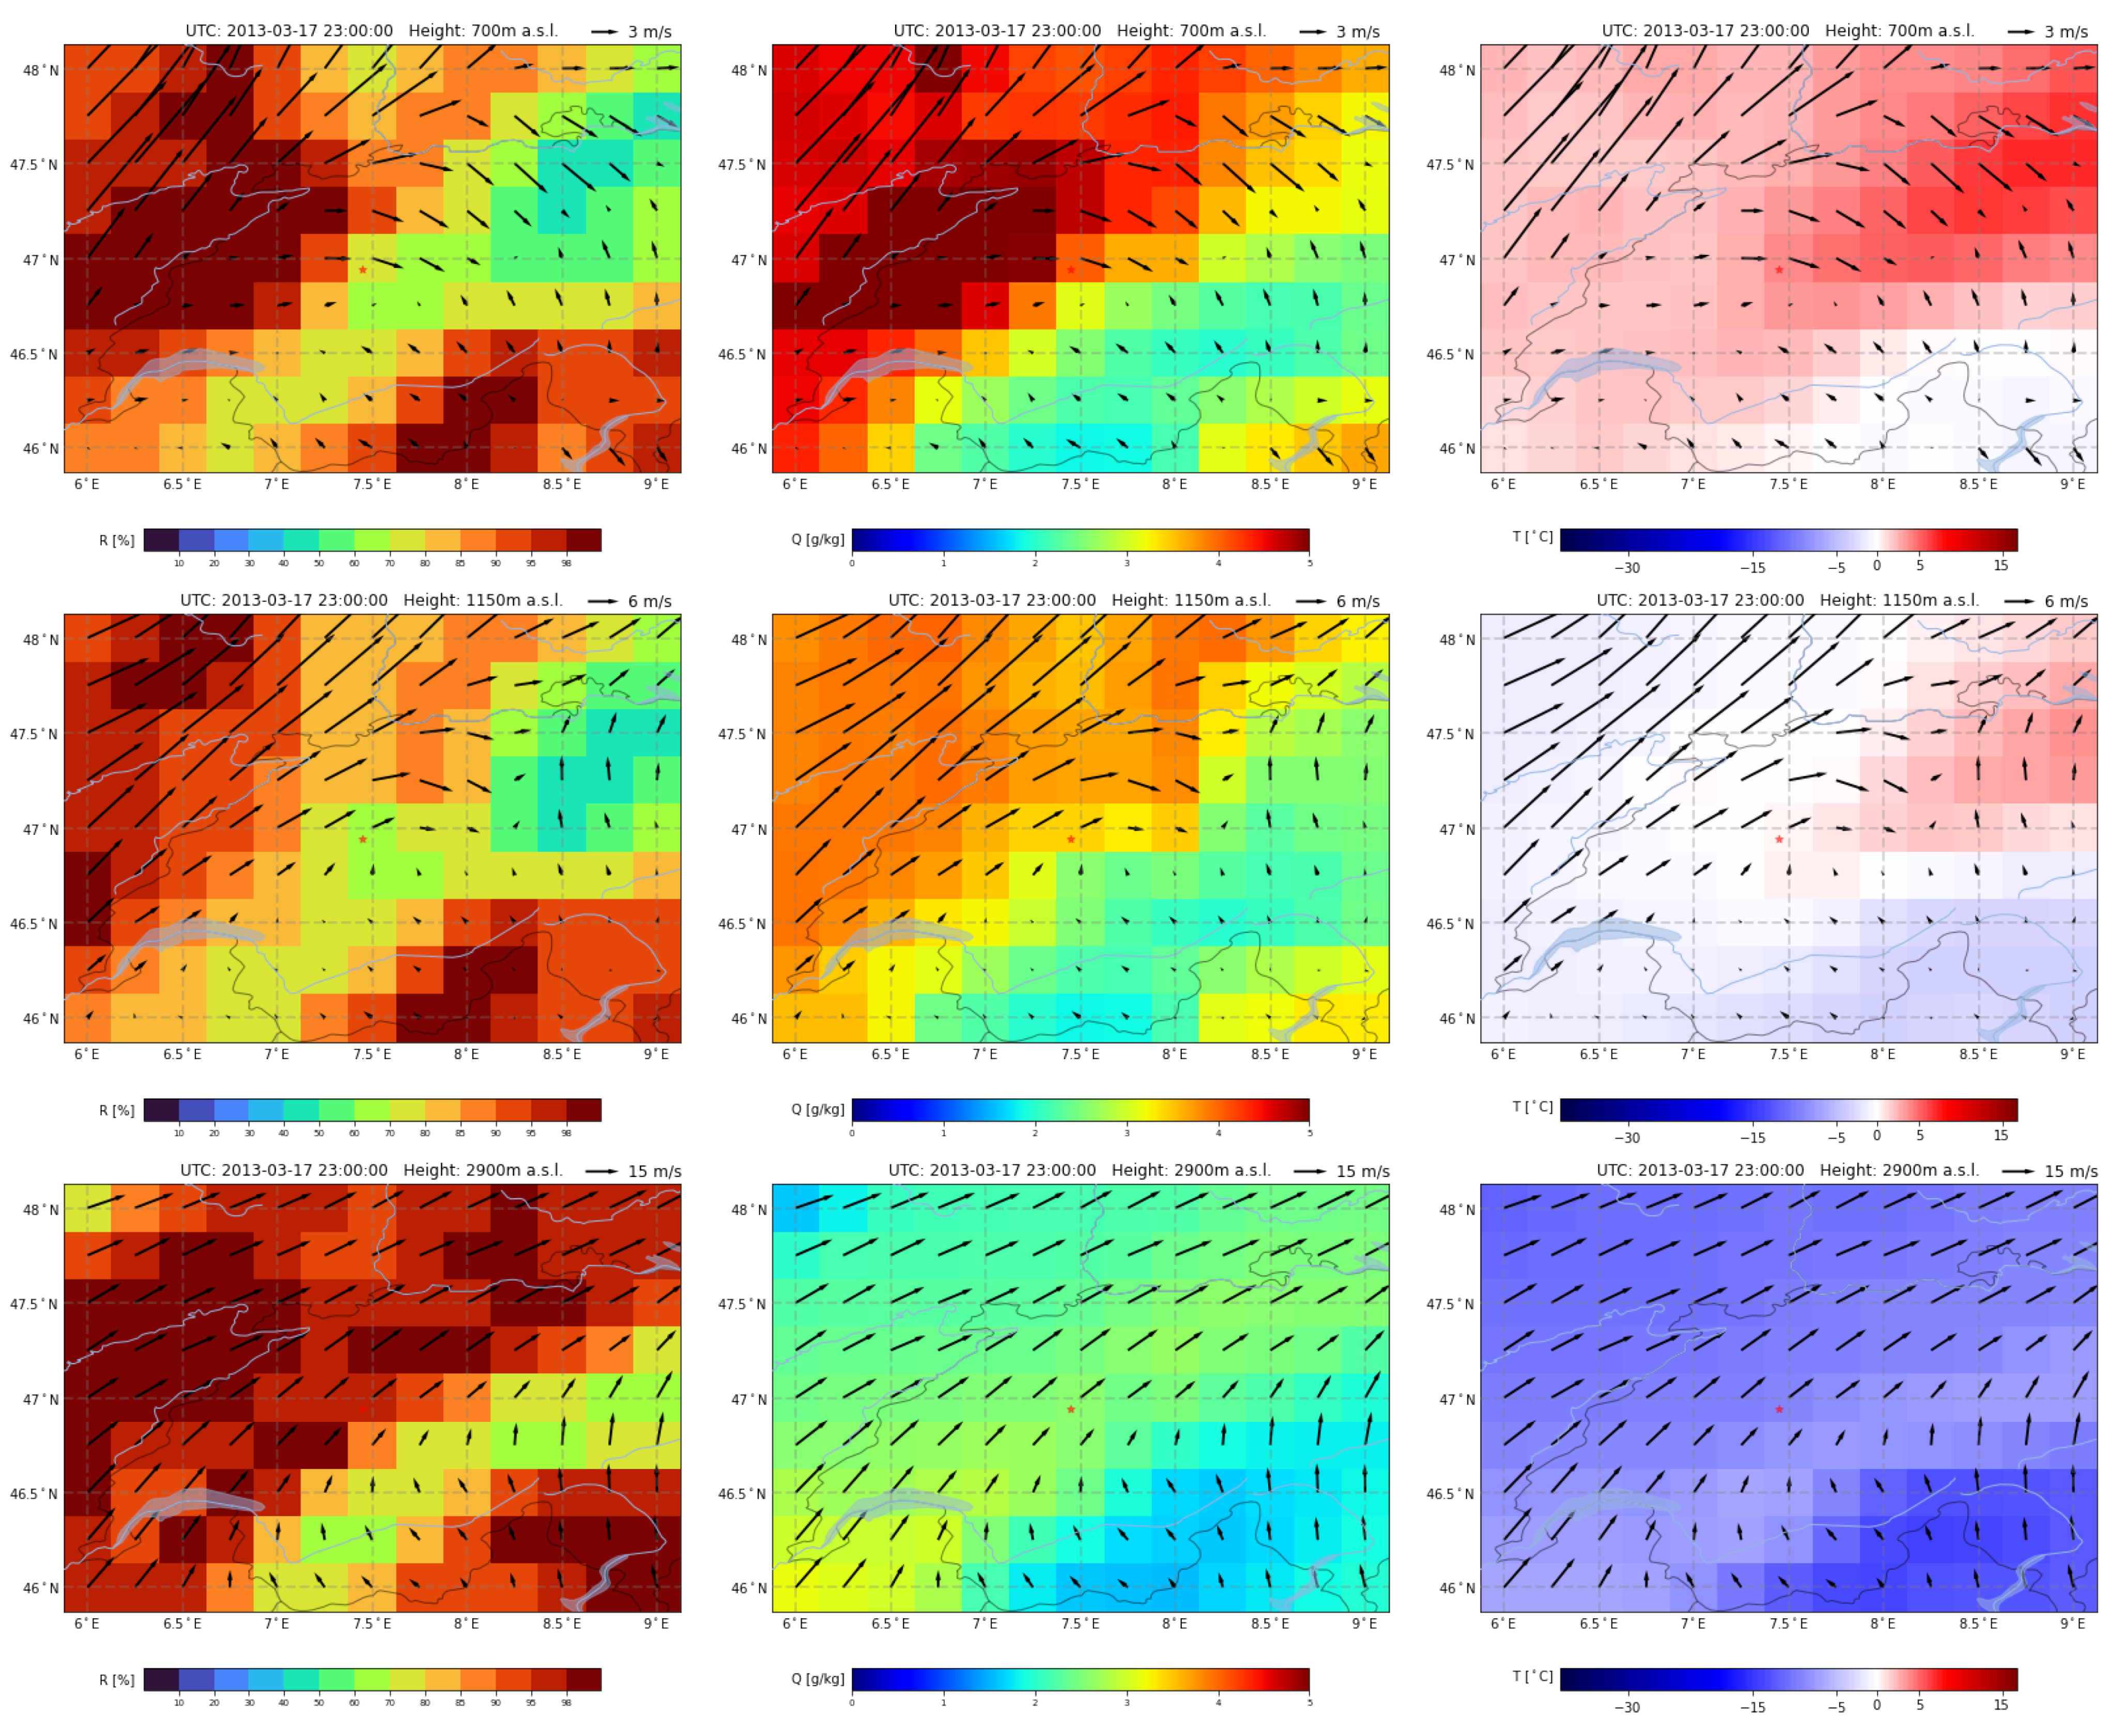
At 23 UTC on 17 March (Figure 8), shortly after the first precipitation reached the ground, at an altitude of 700 m a.s.l., it can be seen that the wind at this altitude has now also turned in a southwesterly direction, bringing moist air with it. At 1150 m a.s.l., the picture is similar, the southerly wind has almost completely broken down and a humid wind from the southwest is now blowing into the region of Bern. Aloft at 2900 m a.s.l., the wind has lost some of its strength, but it still blows quite strongly and continues to carry moisture with it.
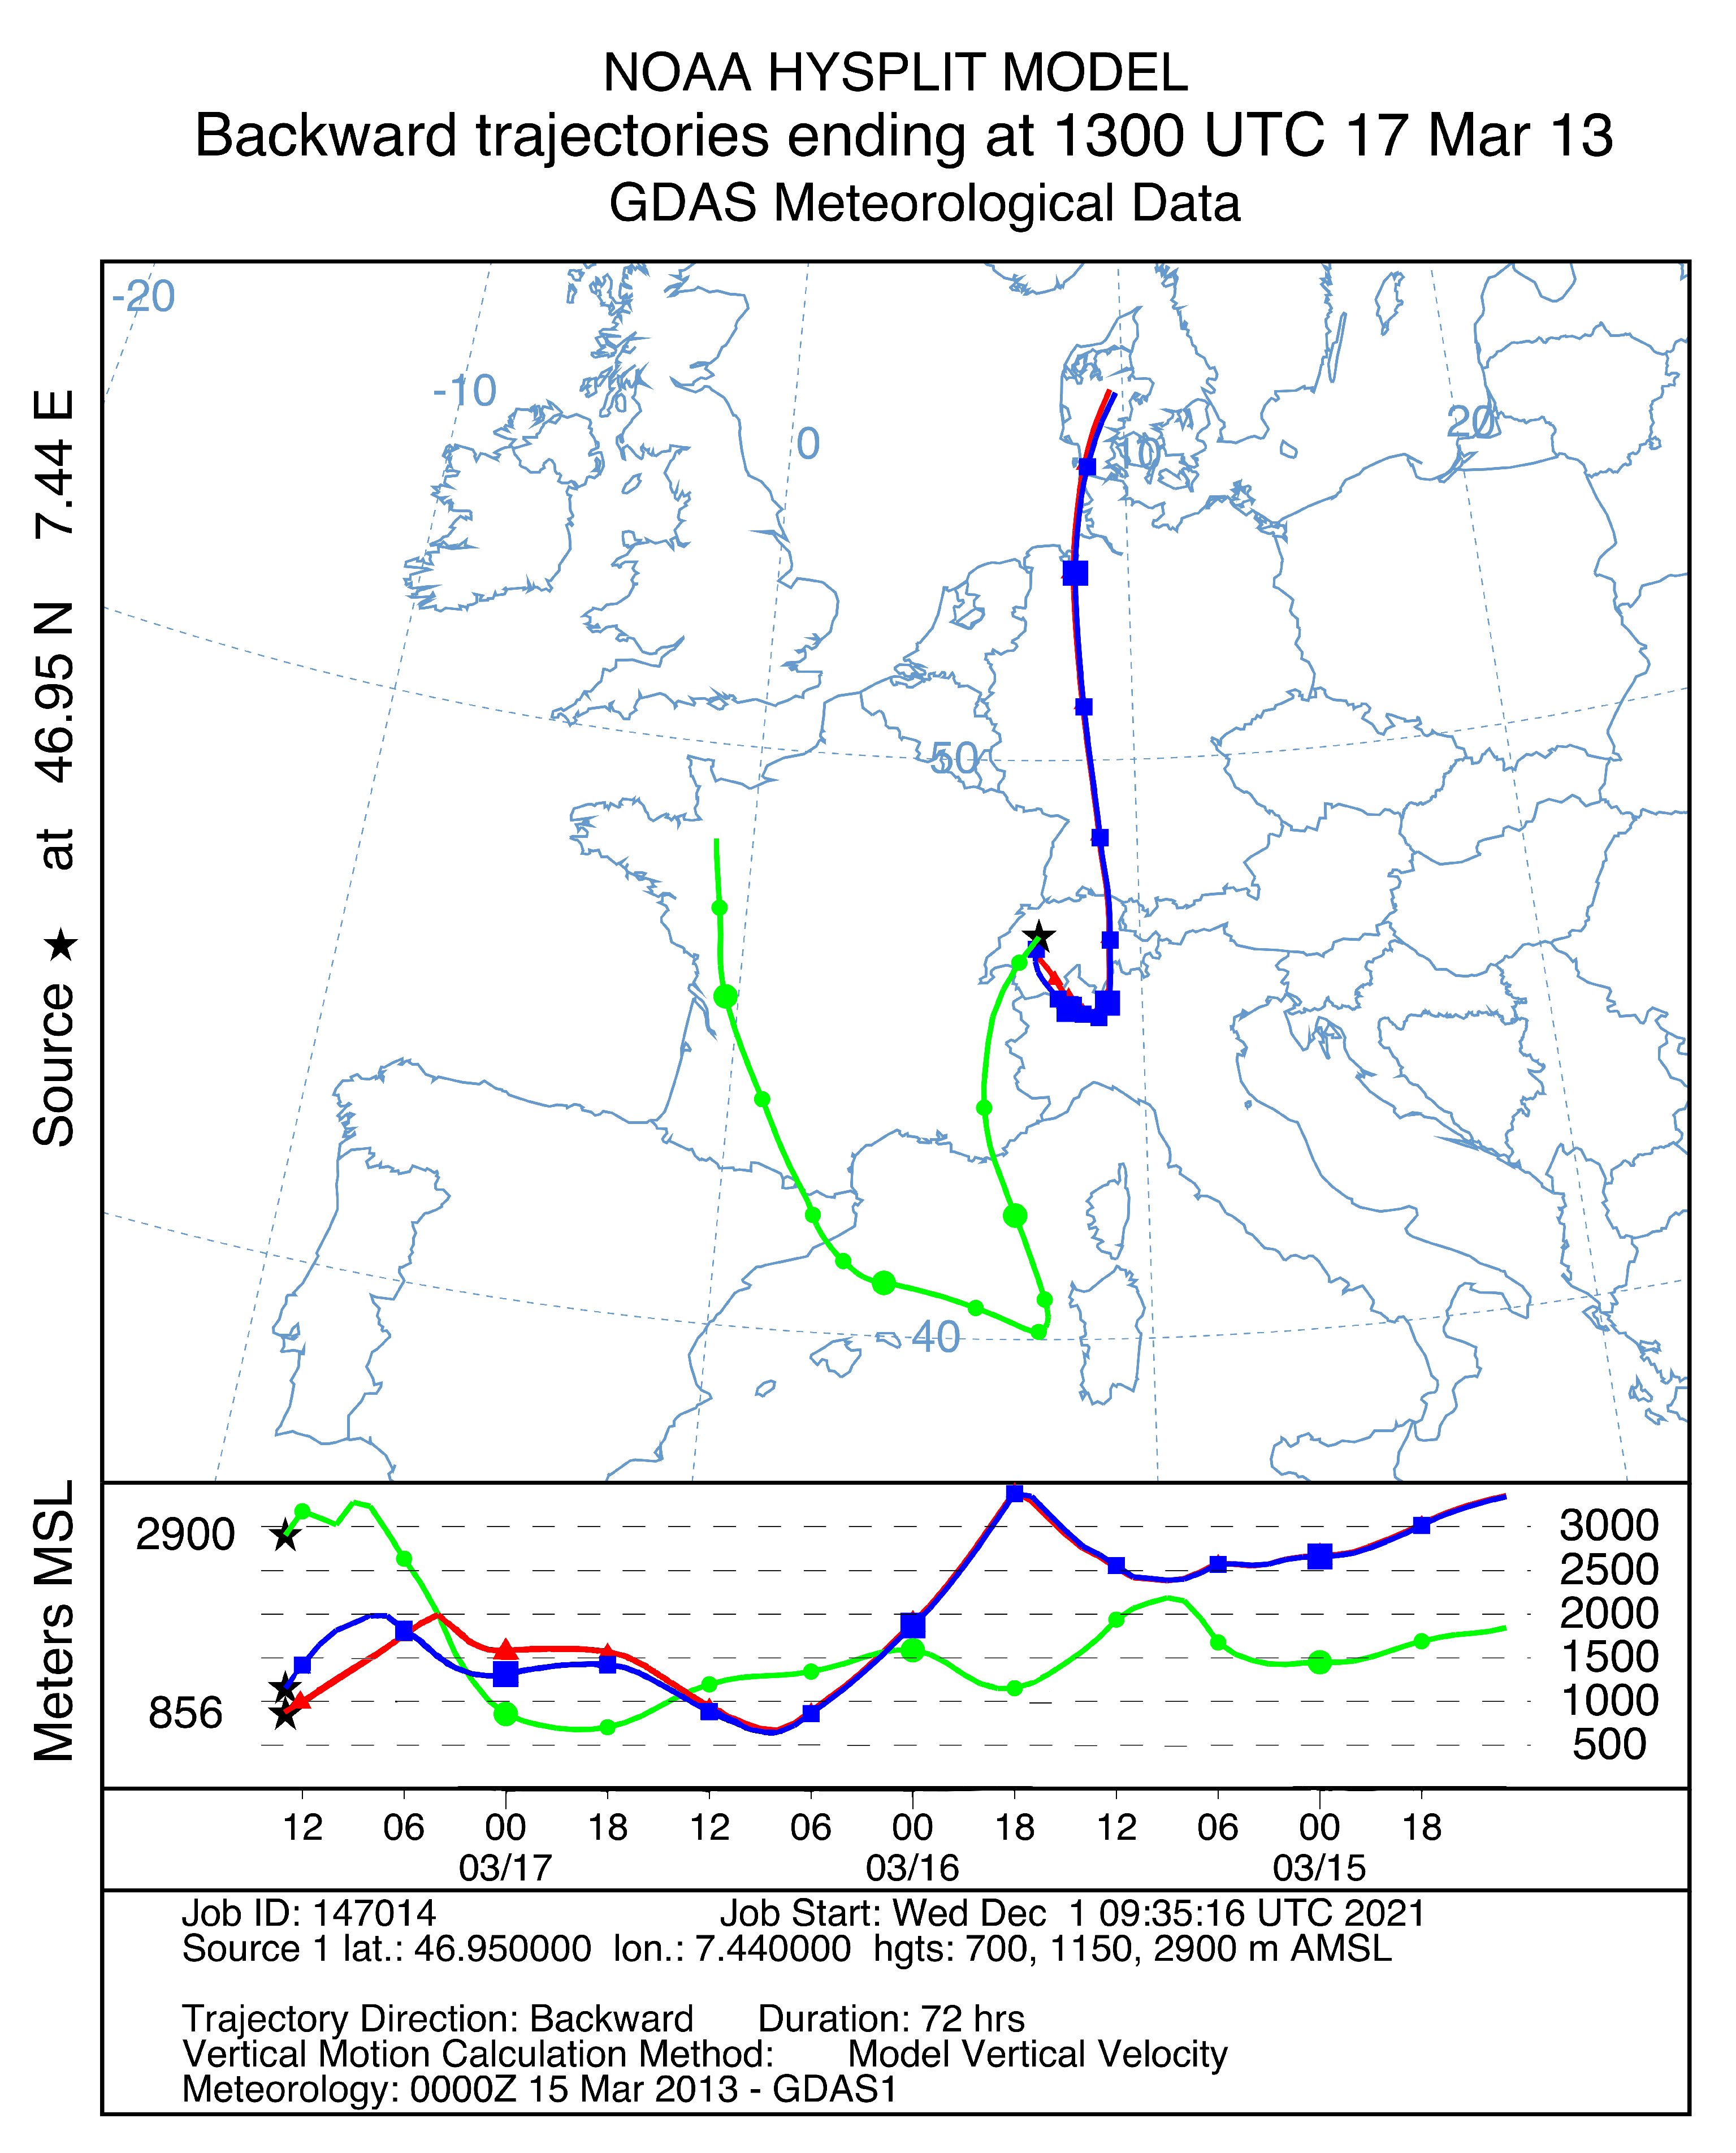
Figure 9 shows the back trajectories calculated with the HYSPLIT model on 17 March at 13 UTC. The back trajectories were calculated for air parcels over Bern at altitudes of 700 m, 1150 m and 2900 m a.s.l., which corresponds to altitudes of 125 m, 575 m and 2325 m above the measuring station (based at 575 m a.s.l.). It can be seen that the lower air layers of the atmospheric column above Bern originate from northern Europe. They first crossed the Alps in a southward direction at high altitude, before descending to ground level. They then crossed the Alps again in a northward direction, but at ground level, arriving in the region of Bern as a dry warm Föhn-wind. The upper air layer above Bern is humid air originating from the Mediterranean region that is in the process of rising. On its way to the region of Bern, it did not pass directly over the Alps but only over their extensions.
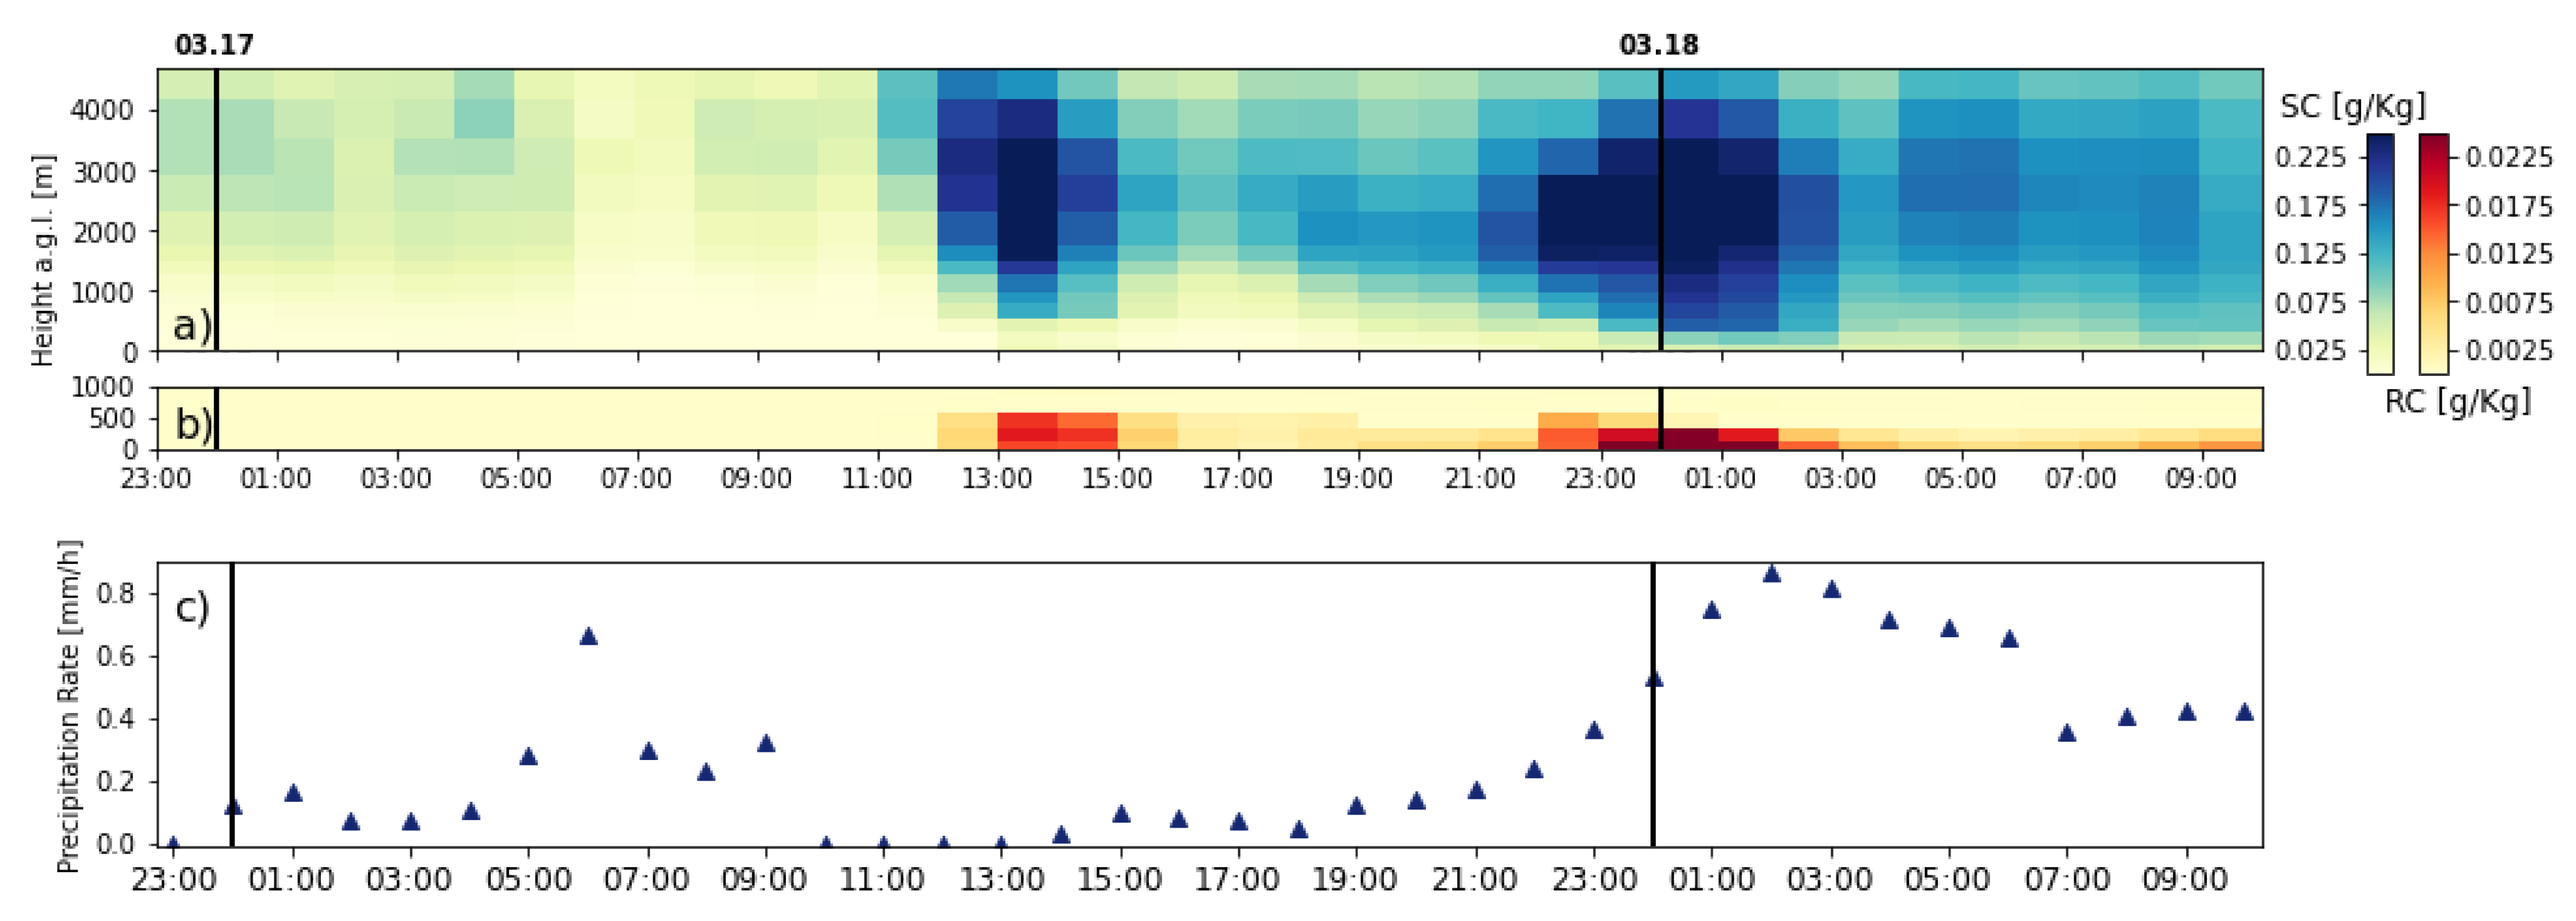
Figure 10 shows different precipitation parameters from the ERA5 datasets. These are only partially consistent with the MRR measurements. Panel (a) shows that there was virga precipitation in the form of snow, which reaches the ground at about 23 UTC. However, the MRR measurements showed that the precipitation reached the ground somewhat earlier at 21:30 UTC (compare with Figure 3). In panel (b) it can be seen that from 14 UTC onwards precipitation reached the ground in the form of rain. This is not consistent with the measurements of the MRR, which neither recorded ground precipitation at these times nor precipitation in the form of rain. Panel (c) displays the precipitation reaching the ground. Particularly striking are the precipitation rates at around 6 UTC, which neither match the values in panel (b) nor the MRR measurements.
5.2. Summary
The virga precipitation event shown lasted for about twenty-two hours, during which more or less continuous precipitation was measured by the MRR. The precipitation measured occurred mainly in the form of snow and partly as wet snow. The lowest altitudes reached by the precipitation varied between 300 m and 1500 m before it evaporated or sublimated completely. The measurements do not reveal the maximum height at which the precipitation set in, meaning that most of it started above the maximum height of 3 km which can be resolved by the radar. Most of the precipitation rates recorded were below 1 mm/h and therefore classified as light precipitation but when the precipitation became more intense at times, the precipitation rates were more around 1.5 mm/h, which can still be classified as moderate.
A look at the atmospheric reanalysis data from ERA5 reveals that a wind shear existed throughout the entire duration of the virga precipitation, with the shear line mostly at an altitude of approximately 1.5 km. Below the shear line, the prevailing Föhn-wind carried unsaturated air from a southeasterly direction into the region of Bern. Meanwhile, above the shear line, there was a pronounced wind coming from the southwest, bringing with it both moist and saturated air. The back trajectories show that the air masses in the higher layers above Bern have risen from ground level and have a high humidity. In contrast, the air in the lower layers originates from the north and has fallen from high altitudes and has a low humidity.
Similarly to the other long-lasting snow virga event of 8 April 2008 (only presented and discussed in [26]), we suspect that the snow virga of 17 March 2013 was caused by a wind shear. The wind shear leads to dry air in the lower layers above Bern, guaranteeing the continuous and complete evaporation or sublimation of precipitation from the upper layers above Bern. This is supported by the observation that the precipitation reaches the ground as soon as the southeasterly wind breaks off and thereby ends the wind shear. Also in this event, the updrafts are not pronounced enough for us to assume that they could have a sufficiently strong influence on the precipitation to prevent it from reaching the ground or to significantly extend its fall time.
6. Conclusions
This study employed vertically aligned K-band Doppler radar observations to investigate snow virga above Bern, Switzerland. The radar data processing algorithm of Garcia-Benardi et al. was implemented and augmented to allow the detection of snow virga precipitation. A long-lasting snow virga event was selected, presented and reviewed using atmospheric reanalysis data from ERA5 and atmospheric back trajectories generated by HYSPLIT.
Virga precipitation can occur in a variety of forms and circumstances, however the case studied here is similar to another long-lasting snow virga event which was presented in the thesis of Beynon [26]. During the event of 17 March 2013, the MRR was able to record virga precipitation with minor interruptions over 22 h, whereby this was composed of snow or wet snow. The snow virga event occurred during the meteorological spring, when snowfall is not uncommon [39]. Precipitation rates could always be classified as light or moderate at most. We assume that the virga precipitation was caused by a prevailing wind shear, whereby moisture-saturated air was carried in the upper air layers over the measuring station while a Föhn-wind blew in the lower air layers, which continuously carried unsaturated air with it.
Comparable virga precipitation events have been observed and studied by Grazioli et al. [14] and Jullien et al. [15] at Dumont d’Urville station, East Antarctica. The composite analysis of Jullien et al. revealed that virga precipitation occurs when precipitating clouds are coming from the sea and simultaneously a low-level katabatic wind (dry fall wind) is blowing from inland. This also leads to a wind shear, where air with low relative humidity is carried into the lower air layers.
Further evidence for our assumption that snow virga above Bern can be caused by low-level dry winds is the observation that the precipitation reached the ground as soon as the wind shear dissipated.
Unlike the MRR observations, ERA5 reanalysis indicated drizzle at the ground over a time segment of 4 h during the snow virga event of 17 March 2013. An assessment and validation of virga occurrences in weather and climate models would be important for climate change research [14,15].
During our studies we found additional virga precipitation events which are not presented in this study because they were only of short duration and therefore we could not compare them with the reanalysis data and the back trajectories, owing to the coarser spatial and temporal resolutions of these data. It would be exciting to investigate these cases further, but this would require better resolved reanalysis data, our own numerical atmospheric simulations or supporting equipment for future cases. Such a study would allow one to investigate a possible correlation between strong vertical winds and virga precipitation, which is often related to convective precipitation, but which occurs only for a short time in a small region. Furthermore, the relationship between virga precipitation and microbursts could be studied.
Other interesting studies would include the frequency and severity of virga precipitation, for which a complete time series of measurements would be required, or the microphysical characteristics, which would require the uncertainties of the measured parameters to be known. These further studies could provide deeper insights into the mechanisms and effects of virga precipitation on the radiative transfer and the hydrologic cycle. Moreover, the prediction of virga could become important for aviation, because the associated microbursts represent a not inconsiderable source of danger for it.
Author Contributions
Conceptualization, R.B. and K.H.; methodology, R.B and K.H.; software, R.B.; validation, R.B.; formal analysis, R.B.; investigation, R.B.; resources, R.B.; data curation, R.B.; writing—original draft preparation, R.B. and K.H. for introduction; writing—review and editing, R.B. and K.H.; visualization, R.B.; supervision, K.H.; project administration, K.H.; funding acquisition, K.H. All authors have read and agreed to the published version of the manuscript.
Funding
The MRR and the ceilometer at Bern are part of the ACTRIS-CH project.
Institutional Review Board Statement
Not applicable.
Informed Consent Statement
Not applicable.
Data Availability Statement
The radiometer and ceilometer data are available at the dataportal of IAP ( https://dataportal.mw.iap.unibe.ch/, last access: 8 February 2022). Internet links for the access to ERA5 data and HYSPLIT back trajectories are given in the acknowledgments and the references.
Acknowledgments
We are grateful to Andreas Leuenberger, Christian Mätzler, Andres Luder, Tobias Plüss, Eric Sauvageat and Axel Murk for the installation and operation of the MRR and the ceilometer at Bern. Peter Speirs is thanked for English editing of the major part of the manuscript. Francisco Navas Guzmán is thanked for ceilometer programs. We thank Michael Sprenger for advices about virga research. Gunter Stober and Peter Speirs are thanked for advices about radar remote sensing. R.B. thanks Christof Aegerter for the official supervision of his master thesis about virga. We thank the European Centre for Medium-Range Weather Forecasts (ECMWF) and the Copernicus Atmosphere Monitoring Service (CAMS) for providing ERA5 reanalysis data at the Climate Data Store (https://cds.climate.copernicus.eu/, last access: 8 February 2022). We also thank the Air Resources Laboratory (ARL) of the National Oceanic and Atmospheric Administration (NOAA) for providing HYSPLIT back trajectories at https://www.ready.noaa.gov/HYSPLIT_traj.php, last access: 8 February 2022. We are grateful to the three reviewers for many valuable improvements.
Conflicts of Interest
The authors declare no conflict of interest.
References
- American Meteorological Society. Glossary of Meteorology: Virga. Electronic Version. 2015. Available online: https://glossary.ametsoc.org/wiki/Virga (accessed on 2 January 2022).
- Yang, F.; Luke, E.P.; Kollias, P.; Kostinski, A.B.; Vogelmann, A.M. Scaling of Drizzle Virga Depth With Cloud Thickness for Marine Stratocumulus Clouds. Geophys. Res. Lett. 2018, 45, 3746–3753. [Google Scholar] [CrossRef] [Green Version]
- Rosenfeld, D.; Mintz, Y. Evaporation of Rain Falling from Convective Clouds as Derived from Radar Measurements. J. Appl. Meteorol. Climatol. 1988, 27, 209–215. [Google Scholar] [CrossRef] [Green Version]
- Airey, M.W.; Nicoll, K.A.; Harrison, R.G.; Marlton, G.J. Characteristics of Desert Precipitation in the UAE Derived from a Ceilometer Dataset. Atmosphere 2021, 12, 1245. [Google Scholar] [CrossRef]
- Wang, Y.; You, Y.; Kulie, M. Global Virga Precipitation Distribution Derived From Three Spaceborne Radars and Its Contribution to the False Radiometer Precipitation Detection. Geophys. Res. Lett. 2018, 45, 4446–4455. [Google Scholar] [CrossRef]
- Sunilkumar, K.; Narayana Rao, T.; Saikranthi, K.; Purnachandra Rao, M. Comprehensive evaluation of multisatellite precipitation estimates over India using gridded rainfall data. J. Geophys. Res. Atmos. 2015, 120, 8987–9005. [Google Scholar] [CrossRef] [Green Version]
- Fraser, A.B.; Bohren, C.F. Is Virga Rain That Evaporates before Reaching the Ground? Mon. Weather. Rev. 1992, 120, 1565–1571. [Google Scholar] [CrossRef] [Green Version]
- Wilson, J.W.; Wakimoto, R.M. The Discovery of the Downburst: T. T. Fujita’s Contribution. Bull. Am. Meteorol. Soc. 2001, 82, 49–62. [Google Scholar] [CrossRef]
- Srivastava, R.C. A Model of Intense Downdrafts Driven by the Melting and Evaporation of Precipitation. J. Atmos. Sci. 1987, 44, 1752–1774. [Google Scholar] [CrossRef] [Green Version]
- Kumar, S.; Castillo-Velarde, C.D.; Valdivia Prado, J.M.; Flores Rojas, J.L.; Callañaupa Gutierrez, S.M.; Moya Alvarez, A.S.; Martine-Castro, D.; Silva, Y. Rainfall Characteristics in the Mantaro Basin over Tropical Andes from a Vertically Pointed Profile Rain Radar and In-Situ Field Campaign. Atmosphere 2020, 11, 248. [Google Scholar] [CrossRef] [Green Version]
- Ojo, J.; Daodu, O.; Ojo, O. Analysis of Vertical Profiles of Precipitable Liquid Water Content in a Tropical Climate Using Micro Rain Radar. J. Geosci. Environ. Prot. 2019, 7, 140–155. [Google Scholar] [CrossRef] [Green Version]
- Elperin, T.; Fominykh, A.; Krasovitov, B.; Vikhansky, A. Effect of rain scavenging on altitudinal distribution of soluble gaseous pollutants in the atmosphere. Atmos. Environ. 2011, 45, 2427–2433. [Google Scholar] [CrossRef] [Green Version]
- Cheng, C.; Yi, F. Falling Mixed-Phase Ice Virga and their Liquid Parent Cloud Layers as Observed by Ground-Based Lidars. Remote Sens. 2020, 12, 2094. [Google Scholar] [CrossRef]
- Grazioli, J.; Madeleine, J.B.; Gallée, H.; Forbes, R.M.; Genthon, C.; Krinner, G.; Berne, A. Katabatic winds diminish precipitation contribution to the Antarctic ice mass balance. Proc. Natl. Acad. Sci. USA 2017, 114, 10858–10863. [Google Scholar] [CrossRef] [PubMed] [Green Version]
- Jullien, N.; Vignon, E.; Sprenger, M.; Aemisegger, F.; Berne, A. Synoptic conditions and atmospheric moisture pathways associated with virga and precipitation over coastal Adelie Land in Antarctica. Cryosphere 2020, 14, 1685–1702. [Google Scholar] [CrossRef]
- Wang, W.; Hocke, K.; Mätzler, C. Physical Retrieval of Rain Rate from Ground-Based Microwave Radiometry. Remote Sens. 2021, 13, 2217. [Google Scholar] [CrossRef]
- Wikipedia. Swiss Plateau. Web Encyclopedia. 2022. Available online: https://en.wikipedia.org/wiki/Swiss_Plateau (accessed on 2 January 2022).
- METEK. MRR Physical Basics. Technical Report. 2010. Available online: http://www.metek.de (accessed on 2 January 2022).
- METEK. Micro Rain Radar—User Manual. Technical Report. 2012. Available online: http://www.metek.de (accessed on 2 January 2022).
- Leuenberger, A. Precipitation Measurements with Microwave Sensors. Master’s Thesis, Institut Für Angewandte Physik, Universität Bern, Bern, Switzerland, 2009. [Google Scholar]
- Wikipedia. Schweizer Mittelland. Web Encyclopedia. 2022. Available online: https://de.wikipedia.org/wiki/Mittelland_(Schweiz) (accessed on 2 January 2022).
- Vöge, M.; Hort, M. Installation of a doppler radar monitoring system at Merapi Volcano, Indonesia. IEEE Trans. Geosci. Remote Sens. 2009, 47, 251–271. [Google Scholar] [CrossRef]
- Maahn, M.; Kollias, P. Improved Micro Rain Radar snow measurements using Doppler spectra post-processing. Atmos. Meas. Tech. 2012, 5, 2661–2673. [Google Scholar] [CrossRef] [Green Version]
- Garcia-Benadi, A.; Bech, J.; Gonzalez, S.; Udina, M.; Codina, B.; Georgis, J.F. Precipitation type classification of micro rain radar data using an improved doppler spectral processing methodology. Remote Sens. 2020, 12, 4113. [Google Scholar] [CrossRef]
- Peters, G.; Fischer, B.; Andersson, T. Rain observations with a vertically looking Micro Rain Radar (MRR). Boreal Environ. Res. 2002, 7, 353–362. [Google Scholar]
- Beynon, R. Observations of Virga Precipitation with a Micro Rain Radar. Master’s Thesis, Physik-Institut, Universität Zürich, Zürich, Switzerland, 2022. Available online: https://www.physik.uzh.ch/dam/jcr:62231f88-2dc6-4592-b3be-b397290cc9e7/Beynon%20Ruben_MA_2022.pdf (accessed on 2 January 2022).
- Matrosov, S.Y. Modeling Backscatter Properties of Snowfall at Millimeter Wavelengths. J. Atmos. Sci. 2007, 64, 1727–1736. [Google Scholar] [CrossRef]
- Hersbach, H.; Bell, B.; Berrisford, P.; Hirahara, S.; Horanyi, A.; Munoz-Sabater, J.; Nicolas, J.; Peubey, C.; Radu, R.; Schepers, D.; et al. The ERA5 global reanalysis. Q. J. R. Meteorol. Soc. 2020, 146, 1999–2049. [Google Scholar] [CrossRef]
- Hersbach, H.; Bell, B.; Berrisford, P.; Hirahara, S.; Horányi, A.; Muñoz-Sabater, J.; Nicolas, J.; Peubey, C.; Radu, R.; Schepers, D.; et al. ERA5 Hourly Data on Pressure Levels from 1979 to Present. 2021. Available online: https://cds.climate.copernicus.eu/cdsapp#!/dataset/10.24381/cds.bd0915c6?tab=overview (accessed on 2 January 2022).
- Hersbach, H.; Bell, B.; Berrisford, P.; Biavati, G.; Horanyi, A.; Sabater, J.M.; Nicolas, J.; Peubey, C.; Radu, R.; Rozum, I.; et al. ERA5 Hourly Data on Single Levels from 1979 to Present. 2021. Available online: https://cds.climate.copernicus.eu/cdsapp#!/dataset/reanalysis-era5-single-levels?tab=overview (accessed on 2 January 2022).
- Kalnay, E.; Kanamitsu, M.; Kistler, R.; Collins, W.; Deaven, D.; Gandin, L.; Iredell, M.; Saha, S.; White, G.; Woollen, J.; et al. The NCEP/NCAR 40-Year Reanalysis Project. Bull. Am. Meteorol. Soc. 1996, 77, 437–472. [Google Scholar] [CrossRef] [Green Version]
- Rolph, G.; Stein, A.; Stunder, B. Real-time Environmental Applications and Display sYstem: READY. Environ. Model. Softw. 2017, 95, 210–228. [Google Scholar] [CrossRef]
- Stein, A.F.; Draxler, R.R.; Rolph, G.D.; Stunder, B.J.B.; Cohen, M.D.; Ngan, F. NOAA HYSPLIT Atmospheric Transport and Dispersion Modeling System. Bull. Am. Meteorol. Soc. 2015, 96, 2059–2077. [Google Scholar] [CrossRef]
- NOAA Air Resources Laboratory. On-Line READY Web Version of HYSPLIT. Webpage. Available online: https://www.ready.noaa.gov/HYSPLIT_traj.php (accessed on 2 January 2022).
- Vaisala. CEILOMETER CT25K User Guide. Technical Report. 1999. Available online: https://www.vaisala.com (accessed on 2 January 2022).
- METEK. MRR Tutorial. Technical Report. 2017. Available online: http://www.metek.de (accessed on 2 January 2022).
- SRF Meteo. Wetterbericht Meteo SRF. Webpage. 2013. Available online: https://www.srf.ch/meteo/wetterbericht/2013-03-16 (accessed on 2 January 2022).
- SRF Meteo. Wetterbericht Meteo SRF. Webpage. 2013. Available online: https://www.srf.ch/meteo/wetterbericht/2013-03-17 (accessed on 2 January 2022).
- MeteoSchweiz. Schneefall im Frühling. Webpage. Available online: https://www.meteoschweiz.admin.ch/home/klima/klima-der-schweiz/altweibersommer-eisheilige-und-andere-spezialitaeten/schneefall-im-fruehling.html (accessed on 2 January 2022).
Figure 1.
Topography of Western Switzerland. The red star marks the location of the micro rain radar in Bern. The black line is the border.
Figure 1.
Topography of Western Switzerland. The red star marks the location of the micro rain radar in Bern. The black line is the border.

Figure 2.
Example of a backscatter profile from a ceilometer measurement at Bern (Vaisala CT25K, 17. May 2008 15:32:00 UTC). Above the cloud base, remote sensing of the ceilometer is severely impaired or blocked by the absorption of the cloud.
Figure 2.
Example of a backscatter profile from a ceilometer measurement at Bern (Vaisala CT25K, 17. May 2008 15:32:00 UTC). Above the cloud base, remote sensing of the ceilometer is severely impaired or blocked by the absorption of the cloud.

Figure 3.
Reflectivity obtained by the MRR from 23:29 UTC of 16 March 2013 until 10:00 UTC of 18 March 2013 using the data processing of Garcia-Benadi et al. [24]. The red lines mark the selected virga segment, see Figure 4. The empty spaces represent missing raw data presumably due to conditional recording. The black dots indicate the cloud base estimated by the ceilometer.

Figure 4.
Segment of the virga event that occurred on 17 March 2013. The plots are all derived from MRR measurements using the data processing of Garcia-Benadi et al. [24]. (a) time-height plot of the reflectivity. (b) time-height plot of the precipitation rate. (c) time-height plot of the characteristic fall velocity. (d) time-height plot of the precipitation type. The estimated cloud base from a ceilometer is highlighted by black dots in panel (a).

Figure 5.
ERA5 data at a grid point close to Bern from 16 March 2013 up to and including 18 March 2013 with a temporal resolution of one hour. (a) time-height plot of the temperature. (b) time-height plot of the vertical velocity. (c) time-height plot of northward component of the wind. (d) time-height plot of the eastward component of the wind. (e) time-height plot of the relative humidity.

Figure 6.
ERA5 weather maps (mainly Switzerland) from 16 March 2013 at 23:00 UTC. Displayed are the relative humidity R, the absolute humidity Q, the temperature T and the horizontal wind speeds at different heights (a.s.l.) with a horizontal resolution of 0.25× 0.25. The location of the MRR is marked with a red star in the center.

Figure 7.
ERA5 weather maps (mainly Switzerland) from 17 March 2013 at 12:00 UTC. Displayed are the relative humidity R, the absolute humidity Q, the temperature T and the horizontal wind speeds at different heights (a.s.l.) with a horizontal resolution of 0.25× 0.25. The location of the MRR is marked with a red star in the center.

Figure 8.
ERA5 weather maps (mainly Switzerland) from 17 March 2013 at 23:00 UTC. Displayed are the relative humidity R, the absolute humidity Q, the temperature T and the horizontal wind speeds at different heights (a.s.l.) with a horizontal resolution of 0.25× 0.25. The location of the MRR is marked with a red star in the center.

Figure 9.
Back trajectories from the 17 March 2013 at 13 UTC for the heights 700 m, 1150 m and 2900 m above sea level. Calculated with the HYSPLIT model (lower panel has a reversed time axis).
Figure 9.
Back trajectories from the 17 March 2013 at 13 UTC for the heights 700 m, 1150 m and 2900 m above sea level. Calculated with the HYSPLIT model (lower panel has a reversed time axis).

Figure 10.
ERA5 data at a grid point close to Bern from 16 March 2013 up to and including 18 March 2013. (a) specific snow water content (SC). (b) specific rain water content (RC). The specific contents are defined as mass of snow/rain per kilogram of the total mass of moist air. (c) total precipitation on the earth’s surface given as depth in mm of water equivalent.


Table 1.
Main technical features of the MRR 2. For further specifications see [19].
Table 1.
Main technical features of the MRR 2. For further specifications see [19].
| Operating mode | FMCW Doppler |
| Center frequency () | 24.23 GHz |
| Frequency modulation (B) | 0.5–15 MHz |
| Number of range gates (N) | 32 |
| Number of spectral bins (M) | 64 |
| Sampling Frequency | 125 kHz |
| Sweep duration T | 256 s |
Publisher’s Note: MDPI stays neutral with regard to jurisdictional claims in published maps and institutional affiliations. |
© 2022 by the authors. Licensee MDPI, Basel, Switzerland. This article is an open access article distributed under the terms and conditions of the Creative Commons Attribution (CC BY) license (https://creativecommons.org/licenses/by/4.0/).
Share and Cite
MDPI and ACS Style
Beynon, R.; Hocke, K. Snow Virga above the Swiss Plateau Observed by a Micro Rain Radar. Remote Sens. 2022, 14, 890. https://doi.org/10.3390/rs14040890
AMA Style
Beynon R, Hocke K. Snow Virga above the Swiss Plateau Observed by a Micro Rain Radar. Remote Sensing. 2022; 14(4):890. https://doi.org/10.3390/rs14040890
Chicago/Turabian StyleBeynon, Ruben, and Klemens Hocke. 2022. "Snow Virga above the Swiss Plateau Observed by a Micro Rain Radar" Remote Sensing 14, no. 4: 890. https://doi.org/10.3390/rs14040890
Note that from the first issue of 2016, this journal uses article numbers instead of page numbers. See further details here.