Article

Fusing Retrievals of High Resolution Aerosol Optical Depth from Landsat-8 and Sentinel-2 Observations over Urban Areas

1
School of Remote Sensing and Information Engineering, Wuhan University, Wuhan 430079, China
2
College of Geographic Science, Xinyang Normal University, Xinyang 464000, China
3
State Key Laboratory of Information Engineering in Surveying, Mapping and Remote Sensing, Wuhan University, Wuhan 430079, China
4
State Key Joint Laboratory of Environmental Simulation and Pollution Control, School of Environment, Tsinghua University, Beijing 100084, China
*
Author to whom correspondence should be addressed.
Remote Sens. 2021, 13(20), 4140; https://doi.org/10.3390/rs13204140
Submission received: 22 September 2021 / Revised: 12 October 2021 / Accepted: 14 October 2021 / Published: 15 October 2021

Abstract

:
Recent studies have shown that the high-resolution satellite Landsat-8 has the capability to retrieve aerosol optical depth (AOD) over urban areas at a 30 m spatial resolution. However, its long revisiting time and narrow swath limit the coverage and frequency of the high resolution AOD observations. With the increasing number of Earth observation satellites launched in recent years, combining the observations of multiple satellites can provide higher temporal-spatial coverage. In this study, a fusing retrieval algorithm is developed to retrieve high-resolution (30 m) aerosols over urban areas from Landsat-8 and Sentinel-2 A/B satellite measurements. The new fusing algorithm was tested and evaluated over Beijing city and its surrounding area in China. The validation results show that the retrieved AODs show a high level of agreement with the local urban ground-based Aerosol Robotic Network (AERONET) AOD measurements, with an overall high coefficient of determination (R2) of 0.905 and small root mean square error (RMSE) of 0.119. Compared with the operational AOD products processed by the Landsat-8 Surface Reflectance Code (LaSRC-AOD), Sentinel Radiative Transfer Atmospheric Correction code (SEN2COR-AOD), and MODIS Collection 6 AOD (MOD04) products, the AOD retrieved from the new fusing algorithm based on the Landsat-8 and Sentinel-2 A/B observations exhibits an overall higher accuracy and better performance in spatial continuity over the complex urban area. Moreover, the temporal resolution of the high spatial resolution AOD observations was greatly improved (from 16/10/10 days to about two to four days over globe land in theory under cloud-free conditions) and the daily spatial coverage was increased by two to three times compared to the coverage gained using a single sensor.

Graphical Abstract

1. Introduction

Atmospheric aerosols play an important role in global and regional climate change and radiation budget through their direct and indirect radiative effects [1,2] and can also seriously affect human health by spreading harmful substances, especially in urban areas [3]. Aerosol optical depth (AOD) is defined as the integrated extinction caused by aerosols through a vertical column of unit area in the atmosphere, which is often used to indirectly indicate the degree of air pollution [4,5]. Satellite remote sensing technology is an effective method for providing spatially continuous measurements of AOD with a higher accuracy from the local to global scales, and it is very important for monitoring dynamic changes in air pollution at large scales. High resolution AOD observations can provide indispensable information about the detailed pattern of aerosol loading, particularly in urban areas where aerosol distributions have a high spatial heterogeneity. However, it is difficult to retrieve AOD from satellite measurements with a high temporal-spatial resolution in urban areas.
Retrieving AOD using satellite remote sensing is an ill-posed problem because there is a great deal of unknown information and few available observations [6]. In the past 40 years [7], several advanced methods have been developed to improve the accuracy and spatial resolution of AOD retrieval with satellite measurement over certain types of land surface. For example, the Dark Target (DT) algorithm [8,9,10] was developed for dark surface areas (e.g., densely vegetated areas, wet soil areas, and ocean areas); the Deep Blue (DB) algorithm [11,12,13] and structure function algorithm [14] were designed for bright surface areas (e.g., urban areas, bare areas, and desert areas); the Multi-Angle Implementation of Atmospheric Correction (MAIAC) algorithm [6,15,16], Minimum Reflectance Technique (MRT) algorithm [17], and the Simplified Aerosol Retrieval Algorithm (SARA) [18,19,20] was developed in order to improve the spatial resolution of satellite remote sensing measurements. Based on the above method, the current satellite based AOD products are generally available at a kilometer-scale resolution. Examples of these include the Moderate Resolution Imaging Spectrometer (MODIS) AOD products with 10 km [11], 3 km [21,22], 1 km [6,23], and 500 m [18,24,25] resolutions; the Visible Infrared Imaging Radiometer Suite (VIIRS) at a 6 km resolution [26]; and the Advanced Himawari Imagers (AHI) [27,28] at a 5 km resolution.
Coarse resolution AOD products have been widely used for analyzing the air quality, radiative forcing, and climate effects at the global or country scales, but they are unsuitable for urban areas due to their large spatial heterogeneity. In a previous study on this topic, Lin et al. [29] developed a novel AOD retrieval algorithm from Landsat-8 observations with an extra fine spatial resolution of 30 m. The algorithm estimated the land surface reflectance (LSR) using three schemes in certain land types and assumed four aerosol types based on the seasonal change to improve the accuracy of the retrieval. Though the study was able to successfully retrieve the AOD from Landsat-8, the 16-day revisit cycles and narrow swaths used for the Landsat-8 satellite limited the temporal resolution and coverage of the high resolution AOD observations, meaning that this satellite was unsuitable for analyzing dynamic changes in air pollution. The recently launched Sentinel-2 A/B MSI sensors have similar spectral bands and spatial resolutions to those of the Landsat-8 OLI sensor, which was proven to have the ability to retrieve AOD at a fine resolution [30,31]. In addition, combining the Landsat-8 and Sentinel-2 satellites can provide more frequent cloudless observation data [32,33].
In this paper, we develop a new fusing AOD retrieval algorithm for use over urban areas combining observations from the Landsat-8 and Sentinel-2 A/B satellites. The uniformity and complementarity of the different sensors are considered and the cloud mask, aerosol type assumption, and surface reflectance determination are improved in the algorithm. The study area and data used in this research are described in Section 2. The method is presented in Section 3. The accuracy evaluation and analysis of the temporal spatial distribution of the fusing AOD retrieval algorithm are discussed in Section 4. Section 5 provides our conclusion.

2. Study Region and Data Description
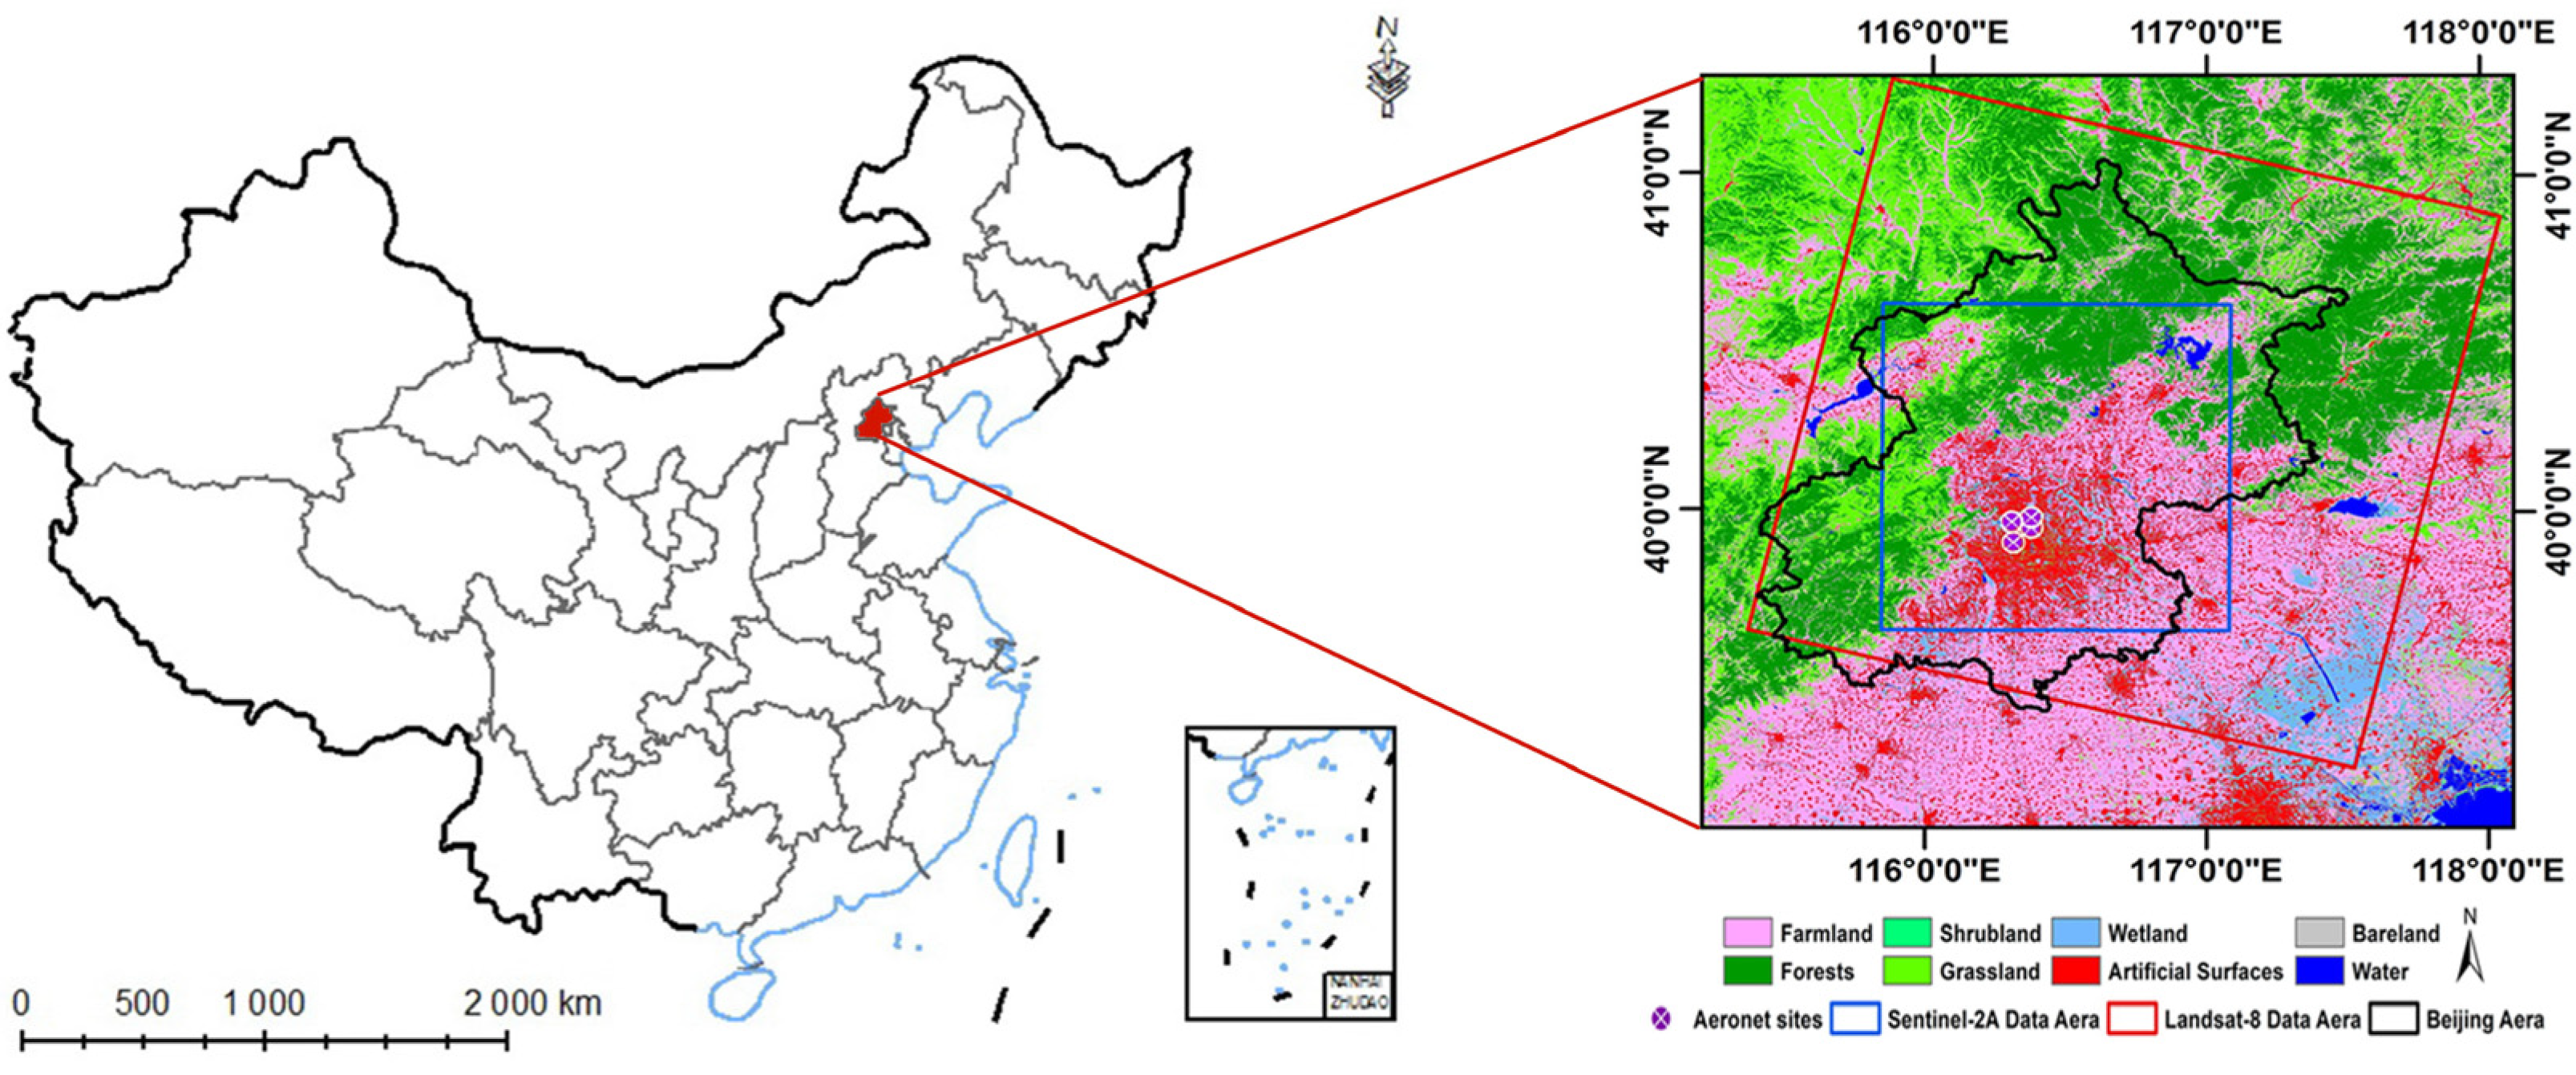
2.1. Study Region

Beijing was selected as the study region due to its relatively high AOD loading, complex land surface types, and variability of aerosol component sources. As the capital of China, Beijing is one of the most economically developed cities and is located in the northeast of the country (115.7–117.4° E, 39.4–41.6° N). It has a total area of 16,410 km2 and a resident population of more than 21 million. As a large and fast-developing city, Beijing and its surrounding research areas have been experiencing periods of severe air pollution in recent years. Its land-use types include large urban built-up areas, mountains with extensive vegetation coverage, inland waterbodies, and farmland, as shown in Figure 1. The dust from the northwest in the spring, coal burning in the winter, and daily emissions from local and surrounding areas contribute to the complex and varied aerosol types in the area [34]. In addition, there are four ground-based AOD monitoring stations that (Figure 1) have been carefully maintained for a long time, which is an important factor in our research.

2.2. Data Sources

2.2.1. Landsat-8 and Sentinel-2 Data

Since its first launch in 1972, the Landsat series satellites have provided nearly 50 years of high-resolution satellite imagery for the world. The Landsat-8 (L8) satellite that was launched in February 2013 carries the advanced multispectral Operational Land Imager (OLI) sensor with a small field of view angle of 15°, a swath cover of 185 × 185 km, a 16-day revisit cycle, and an equatorial crossing time of 10:00 a.m. ± 15 min [35].
The Sentinel-2 mission has two satellites named Sentinel-2A (S2A) and Sentinel-2B (S2B) that were launched in June 2015 and March 2017, respectively. Each of the satellites carried the same Multi-Spectral Instrument (MSI) with a field of view angle of 20.6°, a scene size of 290 × 290 km, a 10-day revisit cycle, and an equatorial crossing time of 10:30 a.m. ± 15 min. Combining the two MSI sensors will increase the revisit cycle to five-days under cloud-free conditions [36].
The Landsat-8 OLI sensor has nine spectral bands, including eight bands from deep blue to mid-infrared with a 30 m resolution and one pan band with a 15 m resolution. The MSI sensor has thirteen spectral bands, including three visible bands and one near-infrared (NIR) band with a 10 m spatial resolution, four red edge bands and two short wave infrared (SWIR) bands with a 20 m spatial resolution, and two short wave vapor bands and one deep blue band with a 60 m spatial resolution. The Landsat-8 OLI and Sentinel-2 MSI sensors have six similar bands in the visible, NIR, and SWIR ranges; a detailed comparison of those bands is provided in Table 1. In addition, both sensors are equipped with a 12-bit multispectral sensor, providing infrequent band saturation, a high signal to noise ratio, q high dynamic range, and a higher orbit radiometric calibration accuracy [37,38], which is beneficial for AOD retrieval over urban areas due to its higher surface reflectance.
Considering both retrieval accuracy and the number of valid observations, the Landsat-8 OLI L1TP images (path: 123, row: 32) (https://earthexplorer.usgs.gov/, accessed on 10 September 2021) and Sentinel-2A/B MSI L1C images (Tiles: 50TMK) (https://scihub.copernicus.eu/dhus, accessed on 10 September 2021) with a cloud cover lower than 50% during the period 2017–2020 were used for AOD retrieval. Finally, 83 Landsat-8 images and 122 Sentinel-2 images were selected for testing our new algorithm.

2.2.2. Globe Land Use Cover Change Dataset

Land Use Cover Change (LUCC) products are fundamental for environmental monitoring, land management, biomass estimation, and global change research. One of their most important applications is monitoring dynamic changes in land use cover type using several LUCC products obtained from different periods. Zhang et al. [39] used multi-temporal Landsat images, high-quality training data, and a machine learning algorithm to produce the LUCC products in the years 2015 and 2020 with a 30m resolution over the globe land. The LUCC datasets include 22 land cover types with a higher accuracy of 84.33%, such as impervious land, bare land, forest, grassland, shrub land, wetland, and water areas. Further detailed information is documented by Zhang et al. [39] and the LUCC datasets can be downloaded from https://zenodo.org/record/3986872 (accessed on 10 September 2021) for LUCC-2015 and https://zenodo.org/record/4280923 (accessed on 10 September 2021) for LUCC-2020.

2.2.3. AERONET Data

AERONET is a ground-based remote sensing aerosol monitoring network with more than 1500 sites around the world. It measures the direct solar and diffuse sky radiation brightness passively to calculate the microphysical, optical and radiation properties of atmospheric aerosols [40,41], as well as the characteristics of aerosol optical depth, turbidity, water vapor, ozone, and other components. The AERONET AOD measurements are considered to be accurate for comparisons against satellite-based AOD retrievals due to their high temporal resolution and accuracy (low uncertainty of ±0.02). In this study, observations from four ground-based AERONET sites (Figure 1) were used to estimate the aerosol type and validate the accuracy of satellite-based AOD retrievals. These sites are Beijing, Beijing_CAMS, Beijing_RADI, and Beijing_PKU (the name is the same as that of the AERONET sites).
Considering the data available at different processing levels, the dataset of AERONET Version 3.0 Level 1.5 (cloud-screened and quality controlled) was selected as the truth by which to validate the satellite-based AODs, while the INV_L1.5_Daily_V3 data were selected as assumptions of the aerosol types.

3. Methodology

The core idea of satellite-based aerosol retrieval is to distinguish the aerosol reflectance from satellite measured reflectance, which includes contributions from aerosols, the land surface, and molecules. Molecule reflectance has significant impacts on the visible band, which is a function of sun-view geometry and elevation and can be easily calculated [42]. The key factors influencing the accuracy of the retrieval of AOD from satellite measurements is the accuracy of the estimation of the surface reflectance and the assumption of aerosol types [29,43]. Moreover, considering the different spectral response functions and misalignment of the registration between the two satellites, data pre-processing is conducted to combine both products through pixel registration, re-projection, band adjustment, and cloud masking. The overall flowchart of the fusing aerosol retrieval algorithm used for the L8 and S2 images is illustrated in Figure 2; the green-filled boxes indicate the new or improved steps of the fusing algorithm compared with those used in the previous study [29], and we will mainly focus on the detail of these steps in the following.

3.1. Date Pre-Processing

3.1.1. Atmospheric Correction with LaSRC

Official atmospheric correction surface reflectance products exist for both sensors. The Sentinel-2 LSR products were processed by the Sentinel Radiative Transfer Atmospheric Correction (SEN2COR) code, while the Landsat-8 LSR products were processed by the Landsat-8 Surface Reflectance Code (LaSRC). The SEN2COR code designed for Sentinel-2 MSI images by the European Space Agency uses the DT algorithm to estimate the AOD on dark vegetation or soil pixels, while the use of a constant calculated according to a user-defined visibility on bright pixels would cause an unpredictable error in urban areas, where most surfaces are bright [44]. On the other hand, the LaSRC algorithm designed for the Landsat-8 OLI images by USGS assumes two ratios between the red to blue band and red to deep blue band, which are computed based on 10 years of MODIS and MISR observations, and uses the difference between the two ratios to retrieve the AOD [45]. This process is more suitable for urban areas and was recently extended for Sentinel-2/MSI images [31,33,46]. The comprehensive validation of the Landsat-8 and Sentinel-2 LSR products with different atmospheric correction codes was undertaken by the Atmospheric Correction Inter-Comparison Exercise [47]; the result shows that the Landsat-8 and Sentinel-2 LSR products processed using the LaSRC code have an overall higher accuracy than the SEN2COR code over urban areas. Therefore, for both the Landsat-8 OLI and Sentinel-2 MSI sensors, the recently released version 3.5.5 of the LaSRC was used to implement the atmospheric correction in this study.

3.1.2. Cloud and Related Mask

In the vicinity of clouds, satellite retrieved AOD may be unreliable since the three-dimensional radiation effect of clouds enhance the amount of light entering the satellite sensor, and also some small cloud droplets may mix with the aerosols near clouds. The Sentinel-2 L2A cloud mask product generated by the SEN2COR is not particularly reliable [48]. On the other hand, the Landsat-8 L1TP cloud mask product generated by the Fmask3.3 algorithm [49] has shown good performance but still has some issues. Compared with the Fmask3.3, the Fmask4.3 algorithm that was released recently (https://github.com/gersl/fmask, accessed on 10 September 2021) represents an improvement from Fmask3.3 and proved to be more effective and accurate in cloud detection for use with Landsat-8 images, as well as being supportable for Sentinel-2 images [50,51]. In this paper, the Fmask4.3 algorithm is used to detect clear sky, clouds, cloud shadows, inland water bodies, ice, and snow pixels for both sensors. The parameter of the dilated number of pixels for clouds is set to 35 (about 1050 m for a 30 m resolution) in order to reduce the influence of cloud adjacent pollution [52]. Only pixels that are marked as clear are used for AOD retrieval.

3.1.3. Pixel Registration and Re-Projection

Although the Landsat-8 (L1TP) and Sentinel-2A/B (L1C) images were both taken using Universal Transverse Mercator (UTM) projection, they are not well registered [53], since different ground control points schemes and digital elevation models are used. The misalignment relative to Landsat-8 and Sentinel-2 can be up to the tens of meters [54] in some extreme cases, which is unacceptable for using a combination of two data from two satellites to monitor surface changes. In this study, Sentinel-2 images for visible bands (band 2 and band 4) with a 10 m resolution were firstly resampled to 30 m using cubic convolution interpolation and the SWIR band (band 12) with a 20 m resolution was resampled to 30 m using bilinear interpolation. Then, the Automated Registration and Orth rectification Package (AROP, Gao, Masek, & Wolfe, 2009) was used to register all Landsat-8 and Sentinel-2 images to a common UTM projection with the same spatial extent as that used in the Sentinel-2 tiling system. The MSI image that was obtained on 31 August 2019 with the lowest cloud coverage of 1% was selected as the reference image. This processing reduces the error of registration among Sentinel-2 and Landsat-8 images within 0.3 pixels for a 30 m resolution, which is acceptable for the long-term series monitoring of the variation in the vegetation cover, artificial features, and other regions with complex cover types [33].

3.1.4. Spectral Bandpass Adjustment

The spectral response functions for MSI between Sentinel-2A and Sentinel-2B were considered to have an excellent heterogeneity and did not require bandpass adjustment. However, the equivalent spectral bands of the OLI and MSI sensors were not the same. In order to obtain uniform reflectance, the band adjustment transformation functions between OLI and MSI proposed by Zhang et al. [46] were adopted in this study. The MSI spectral bands for blue and red were used as a reference and the corresponding OLI spectral bands were adjusted based on the band transformation functions shown in Equations (1) and (2):
ρ b l u e O L I = 0.9570 × ρ b l u e M S I + 0.0003
ρ r e d O L I = 0.9533 × ρ r e d M S I + 0.0041
where ρ b l u e M S I and ρ r e d M S I are the LSR in the blue and red bands for the Sentinel-2 MSI sensor, ρ b l u e O L I and ρ r e d O L I are the adjusted LSR in the blue and red bands for the Landsat-8 OLI sensor.

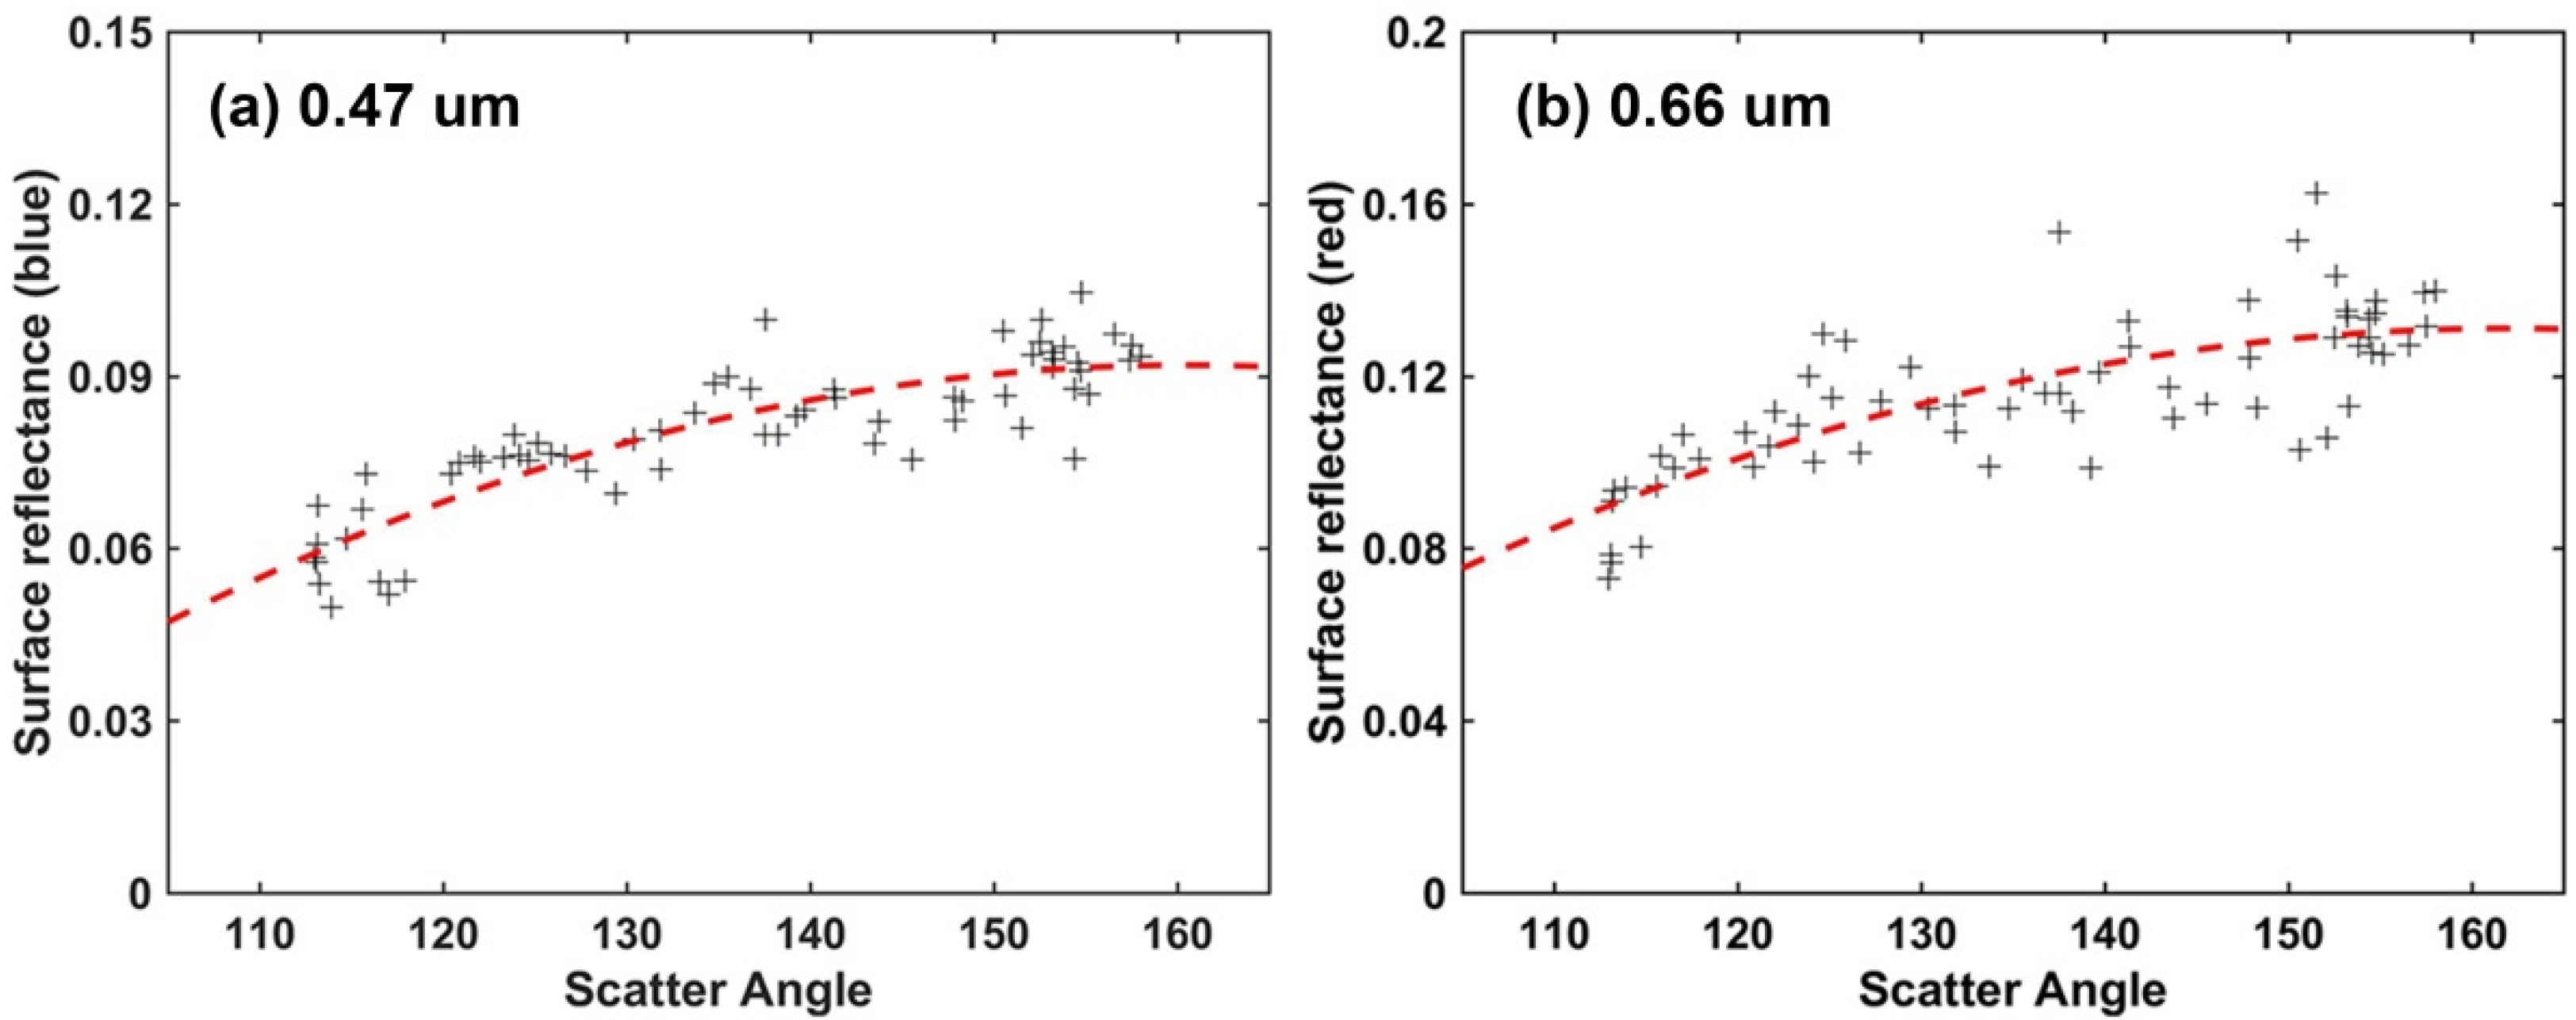
3.2. Surface Reflectance Estimation

High quality surface reflectance estimation is a key factor for aerosol retrieval over urban areas with complex structures and bright surfaces. Benefitting from the high spatial resolution of Landsat-8 and Sentinel-2, the complex urban surface can be divided into several reliable types based on the change in land cover characteristics. Similar to the previous study [29], we divided the urban surface into three specific types, and estimated the LSR in each type with different methods based on their surface characteristics, including densely vegetated areas (DVA), barely non-vegetated areas (BVA), and sparsely vegetated areas (SVA). Moreover, another kind of land type that changes rapidly and irreversibly in urban areas is also important; we named these land use cover change areas (LCA). Based on the increased number of effective observations gained through the fusion of the Landsat-8 and Sentinel-2 satellites, we further improved the LSR determination algorithms. Due to space constraints, we mainly focused on the fusing algorithm below. The details of the surface type selection are described in the previous study [29].
Considering that the Landsat-8 OLI and Sentinel-2 MSI have different spectral response functions, the empirical relationships derived by Wei et al. [55] and Müller et al. [30] for Landsat-8 OLI and Sentinel-2 MSI were used to estimate the LSR of the visible bands from the TOA reflectance of the SWIR band in DVA, respectively. The formulae are given as Equations (3) and (4):
ρ b l u e O L I = 0.260 × ρ s w i r O L I + 0.004 ,   ρ r e d O L I = 0.531 × ρ s w i r O L I 0.002
ρ b l u e M S I = 0.25 × ρ s w i r M S I ,   ρ r e d M S I = 0.50 × ρ s w i r M S I
where ρ s w i r O L I and ρ s w i r M S I correspond to the TOA reflectance at the SWIR band, the ρ b l u e O L I , ρ r e d O L I , ρ b l u e M S I , and ρ r e d M S I represent the estimated LSR at the blue and red bands for OLI and MSI, respectively.
Secondly, over the BVA, due to the similar solar and view geometry of Landsat-8 and Sentinel-2 (Figure A1), the fusing bandpass adjustment time series LSR and solar-view geometry for both sensors in the blue and red bands were substituted into the RossThick-LiSparse (RTLS) model to build a robust bi-directional reflectance distribution function (BRDF), which is similar to the MODIS BRDF algorithm [11,56]. One example of the use of the procedure for the spectral bandpass adjustment of the LSR generated from Landsat-8 and Sentinel-2 over AERONET Beijing sites is provided in Figure 3. It is apparent that the LSR in the red band (Figure 3b) is higher than that the blue band (Figure 3a) and the corresponding LSR anisotropy is much larger, which is consistent with the expected characteristics of the BVA surface. Note that the constructed BRDF parameters we retrieved only fitted the satellites with a small view angle.
Thirdly, over the SVA, the spectral bandpass adjustment LSR for Landsat-8 and Sentinel-2 in each month for the blue and red bands was used to construct the monthly-based LSR database. Due to the increase in the number of effective observations gained from fusing the Landsat-8 and Sentinel-2 satellites, the brightest 50% and darkest 20% for each common pixel in the monthly-based LSR database were discarded to reduce the influence of clouds, shadows, and surface contamination. Then, the remaining 30% of the LSR in each band was averaged to represent the LSR of the pixel for each month Equation (5).
M L S R i , j m = m e a n ( L S R a m ( i , j ) , L S R a + 1 m ( i , j ) , L S R a + 2 m ( i , j ) , , L S R b m ( i , j ) )
where M L S R represents the calculated LSR database; L S R a , L S R b represent the darkest 20% to 50% of the bandpass adjustment time series LSR in a certain month ( m ); and i , j correspond to the row and column in the image cube.
Note that the final LSR used for the OLI sensor in the blue and red band in these areas should be rectified based on Equations (1) and (2), as described in Section 3.1.4. Figure 4 shows an example of the trend of the LSR in the monthly scale from a mixed pixel with trees and buildings. This indicates that the LSR shows small changes in each month but varies greatly over different months. In addition, the LSR is significantly negatively correlated with NDVI. Figure A2 shows the surface reflectance constructed with our method for January, April, July and October over the study areas.
Finally, except for the above surface types, there is still one special surface type that needs to be considered. In recent years, China has experienced rapid urbanization, and the urban land space has rapidly expanded to the surrounding areas, leading to inevitable land-use change, especially in fast-growing cities. We named these pixels land use cover change type, which cannot be well estimated by the aforementioned three methods. Previous studies show that most of the land-use change is from other types of land to artificial land [57]. We assumed that this change is irreversible in the short term. Therefore, we used the global land-use cover data for 2015 and 2020 (detailed information is provided in Section 2.2.2) to monitor the spatial changes in this kind of land surface, as the dynamic changes in LCA can easily be realized with a high accuracy. In these areas, we did not perform the retrieval of AOD because of the lack of an effective LSR assessment algorithm, except for the pixels with NDVI > 0.55. Instead, the AODs in these areas were completed by spatial interpolation from the surrounding AOD.
In general, Figure A3 describes the spatial distribution of the above four types over the study area on 27 June 2017. The results show that the pixels of BVA are mainly scattered throughout the central urban areas, the DVA pixels are distributed throughout the mountainous areas, the SVA pixels are distributed over farmland, and the pixels of the LCA are sporadically distributed. The proportions of pixels for DVA, LCA, SVA, and LCA are 51.94%, 7.15%, 32.22%, and 6.58%, respectively.

3.3. Aerosol Retrieval

In this paper, the Second Simulation of a Satellite Signal in the Solar Spectrum vector code (6SV) Version 2.1 (https://salsa.umd.edu/6spage.html, accessed on 10 September 2021) was used to pre-construct the lookup tables (LUT) to improve the efficiency of the AOD retrieval on a seasonal basis for the blue and red bands of the Landsat-8 OLI, Sentinel-2A MSI, and Sentinel-2B MSI sensors according to their own spectral response functions and the modified aerosol types [29], respectively. Then, the estimated LSR, solar and view angels, and the relative azimuth angle were used as the pre-known inputs in the pre-constructed LUTs, and the AOD was retrieved by changing the AOD to obtain the closure between the simulated and observed TOA reflectance.

4. Results and Discussion

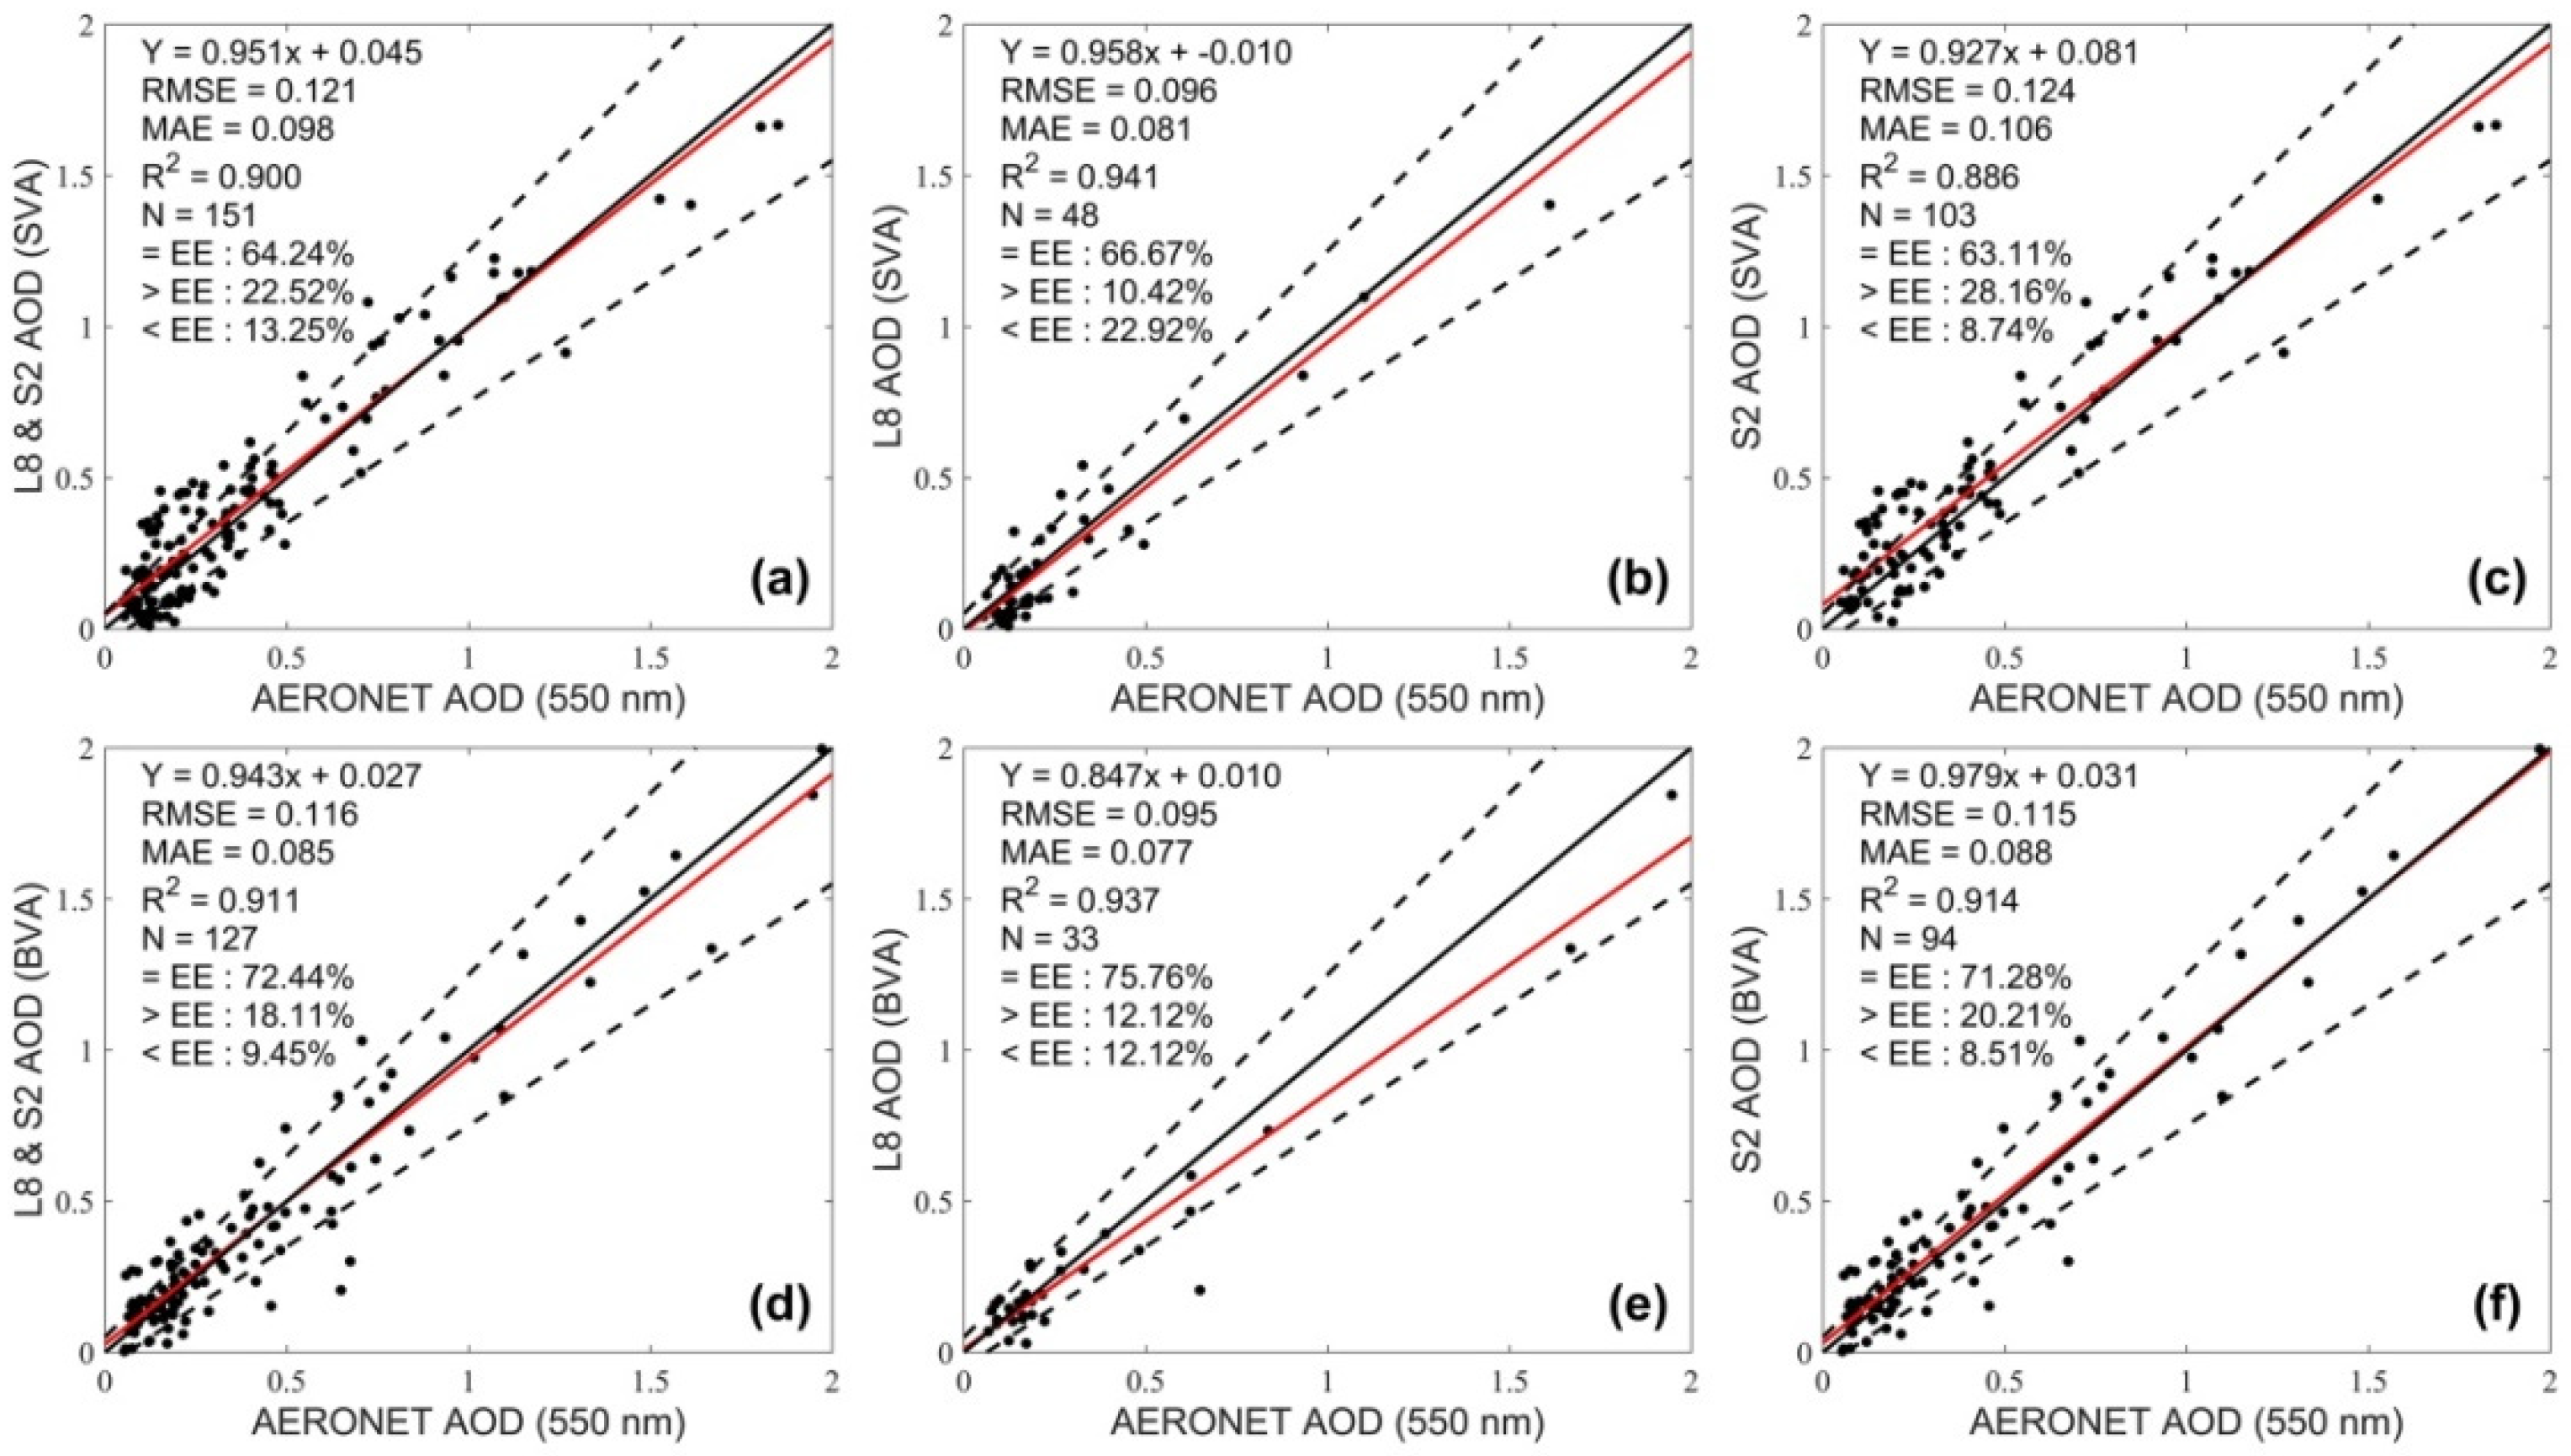
4.1. Accuracy Evaluation of Satellite-Based AOD Retrievals

4.1.1. Validation with AERONET AOD Measurements

The AERONET AOD measurements at 550 nm were calculated based on the Ångström exponent algorithm and used to validate the satellite AOD retrievals. The space and time for the AERONET AOD and satellite AOD retrievals were matched based on the principle of averaging AODs over a 5 × 5 window with at least 20% effective pixels around the AERONET site location for retrieved AOD; the averaged AERONET AODs within ±15 min of the satellite overpass times were compared [55]. Finally, 81 and 197 AOD pairs were matched for Landsat-8 and Sentinel-2A/B, respectively.
As displayed in Figure 5, the Landsat-8 and Sentinel-2 AOD retrievals (named as L8 AOD and S2 AOD) exhibited an overall high-level of agreement with the AERONET AOD, with an R2 of 0.905. The L8 AOD retrievals (Figure 5b) achieved a high agreement with the AERONET AODs with an R2 of 0.935, RMSE of 0.097, and MAE of 0.079. In addition, 70.37% of the retrieved AODs were within the expected error (EE) line and the results were higher than those found in a previous study [29] (R2 of 0.920 and RMSE of 0.111 for Landsat-8 only), probably due to the higher accuracy of LSR (we will have to determine this with more observations). The S2 AOD retrievals (Figure 5c) also show a high level of agreement with the AERONET AODs, with an R2 of 0.899 and RMSE of 0.121, accounting for 67.01% of the AODs within the EE line. The retrieval accuracy of the S2 AOD was lower than L8 AOD, probably due to the error of the cloud mask produced by the Fmask4.3 algorithm for S2, where some mistakes were reported over the bright area or during thick aerosol loading conditions due to the lack of thermal data.
To validate the efficiency and stability of our method for each surface type, the AERONET sites were divided into several types based on the strategy described in Section 3.2. Finally, the Beijing and Beijing-PKU sites were located in BVA, the Beijing-RADI and Beijing-CAMS sites were located in SVA, and no AERONET site was located in the other two types in the study area. Figure 6 shows that the overall AOD retrieval over BVA (Figure 6d) is higher than that over SVA (Figure 6a) for the combined S2 and L8 AOD retrievals, suggesting that consideration of the surface anisotropy will increase the AOD retrieval accuracy. Compared with the L8 AOD (Figure 6b,e), the retrieval accuracy of S2 AOD over BVA (Figure 6f) represents larger increase than that over SVA (Figure 6c); this is probably because the larger satellite view angle means that it will be more easily influenced by surface anisotropy.

4.1.2. Comparison with LaSRC AOD, SEN2COR AOD and MOD04_L2 AOD Products

The long time series of MODIS AOD products (M*D04) with a relatively coarse spatial resolution in 10 km (M*D04_L2) are often used as a benchmark to compare with other satellites AOD retrievals. In this study, the MOD04_L2 AOD products for MODIS C6.1 Terra (https://ladsweb.modaps.eosdis.nasa.gov, accessed on 10 September 2021) were used for comparison considering its similar overpass time with Landsat-8 and Sentinel-2. Only the quality assessment (QA) marked as three in the MOD04_L2 merged DT&DB products were used to ensure the data quality.
The LaSRC code operationally used to generate the Landsat surface reflectance products by the USGS has retrieved the AOD for each pixel as intermediate data in the process of atmosphere correction. The LaSRC code and auxiliary data used by USGS are available at https://edclpdsftp.cr.usgs.gov/downloads, accessed on 10 September 2021. In this study, the LaSRC V3.5.5 code was used [31] to output the Landsat-8 AOD values (named as LaSRC AOD) at a 30 m resolution.
Sentinel-2A has official AOD products produced by the SEN2COR code with the resolution of 60 m, 20 m, and 10 m; they can be downloaded from the website (https://scihub.copernicus.eu/dhus/, accessed on 10 September 2021) or produced offline using the SEN2COR code. The SEN2COR code was developed to produce the Sentinel-2 LIC data to L2A data, and the code is publicly available at http://step.esa.int/main/third-party-plugins-2/sen2cor/ (accessed on 10 September 2021). In this work, the SEN2COR V2.8 was used to achieve Sentinel-2A AOD (named as SEN2COR AOD) at a 10 m resolution, and the average of 15 × 15 cloudless pixels around the location of the AERONET sites were chosen for comparison.
Figure 7 shows that a total of 103 collections for L8 & S2 AODs (Figure 7a) and MOD04 DB&DT AODs (Figure 7d), 81 collections for L2 AODs (Figure 7b) and LaSRC AODs (Figure 7e), and 197 collections for S2 AODs (Figure 7c) and SEN2COR AODs (Figure 7f) were validated with AERONET AODs in the study period. The result shows that the MOD04 DB&DT AOD collections that are common with the retrieved L8 and S2 AODs show a high-level of consistency with the AERONET AODs with R2 of 0.705, yet 41.75% of the AODs were over the EE lines with a larger RMSE of 0.185, meaning that the MOD04 DB&DT AODs resulted in a large overestimation of the AOD loadings over urban areas. The LaSRC AODs showed a better performance with AERONET AODs (R2 = 0.915) and 69.14% of the AOD were within the EE line. The SEN2COR AODs show a significant underestimation, with an R2 of 0.614 and a slope of 0.207, meaning that the SEN2COR algorithm is unsuitable for AOD retrieval over urban areas with bright surfaces.
Compared with the MOD04 DB&DT AOD retrieval algorithm, fusing retrieved AODs has a higher correlation with AERONET AODs, with an overall higher R2 of 0.886, a smaller RMSE of 0.097, and 67.96% of the AOD retrievals falling within the EE line. Compared with SEN2COR AODs, the S2 AODs showed significant improvement with a higher R2 of 0.899, a smaller MAE of 0.097, a stronger slope of 0.954, and 67.01% of the AOD retrievals falling within the EE. These comparison results indicate that the fusing AOD retrieval algorithm we developed has the best performance compared with the current operation AOD products over the study area.

4.1.3. Comparison between Landsat-8 and Sentinel-2 AOD Retrievals

Landsat-8 and Sentinel-2 have a similar overpass time (approximately 02:53 for Landsat-8 and 03:08 for Sentinel-2A/B in UTC over study areas). Due to the different repeat cycle time for each satellite, it will cross the same area at approximately the same time every 80 days; in other words, there are about 4.5 times in one year where the satellites will overpass the same area on the same day. In this study, the day of 4 December 2018 (Landsat-8 and Sentinel-2B have the same overpass time) was selected to validate the consistency of the AOD retrievals for the two satellites. As shown in Figure 8, the L8 AOD and S2 AOD were in great agreement, with an R2 of 0.82 and small RMSE of 0.06, proving that the AOD retrievals of the two sensors had a good consistency.

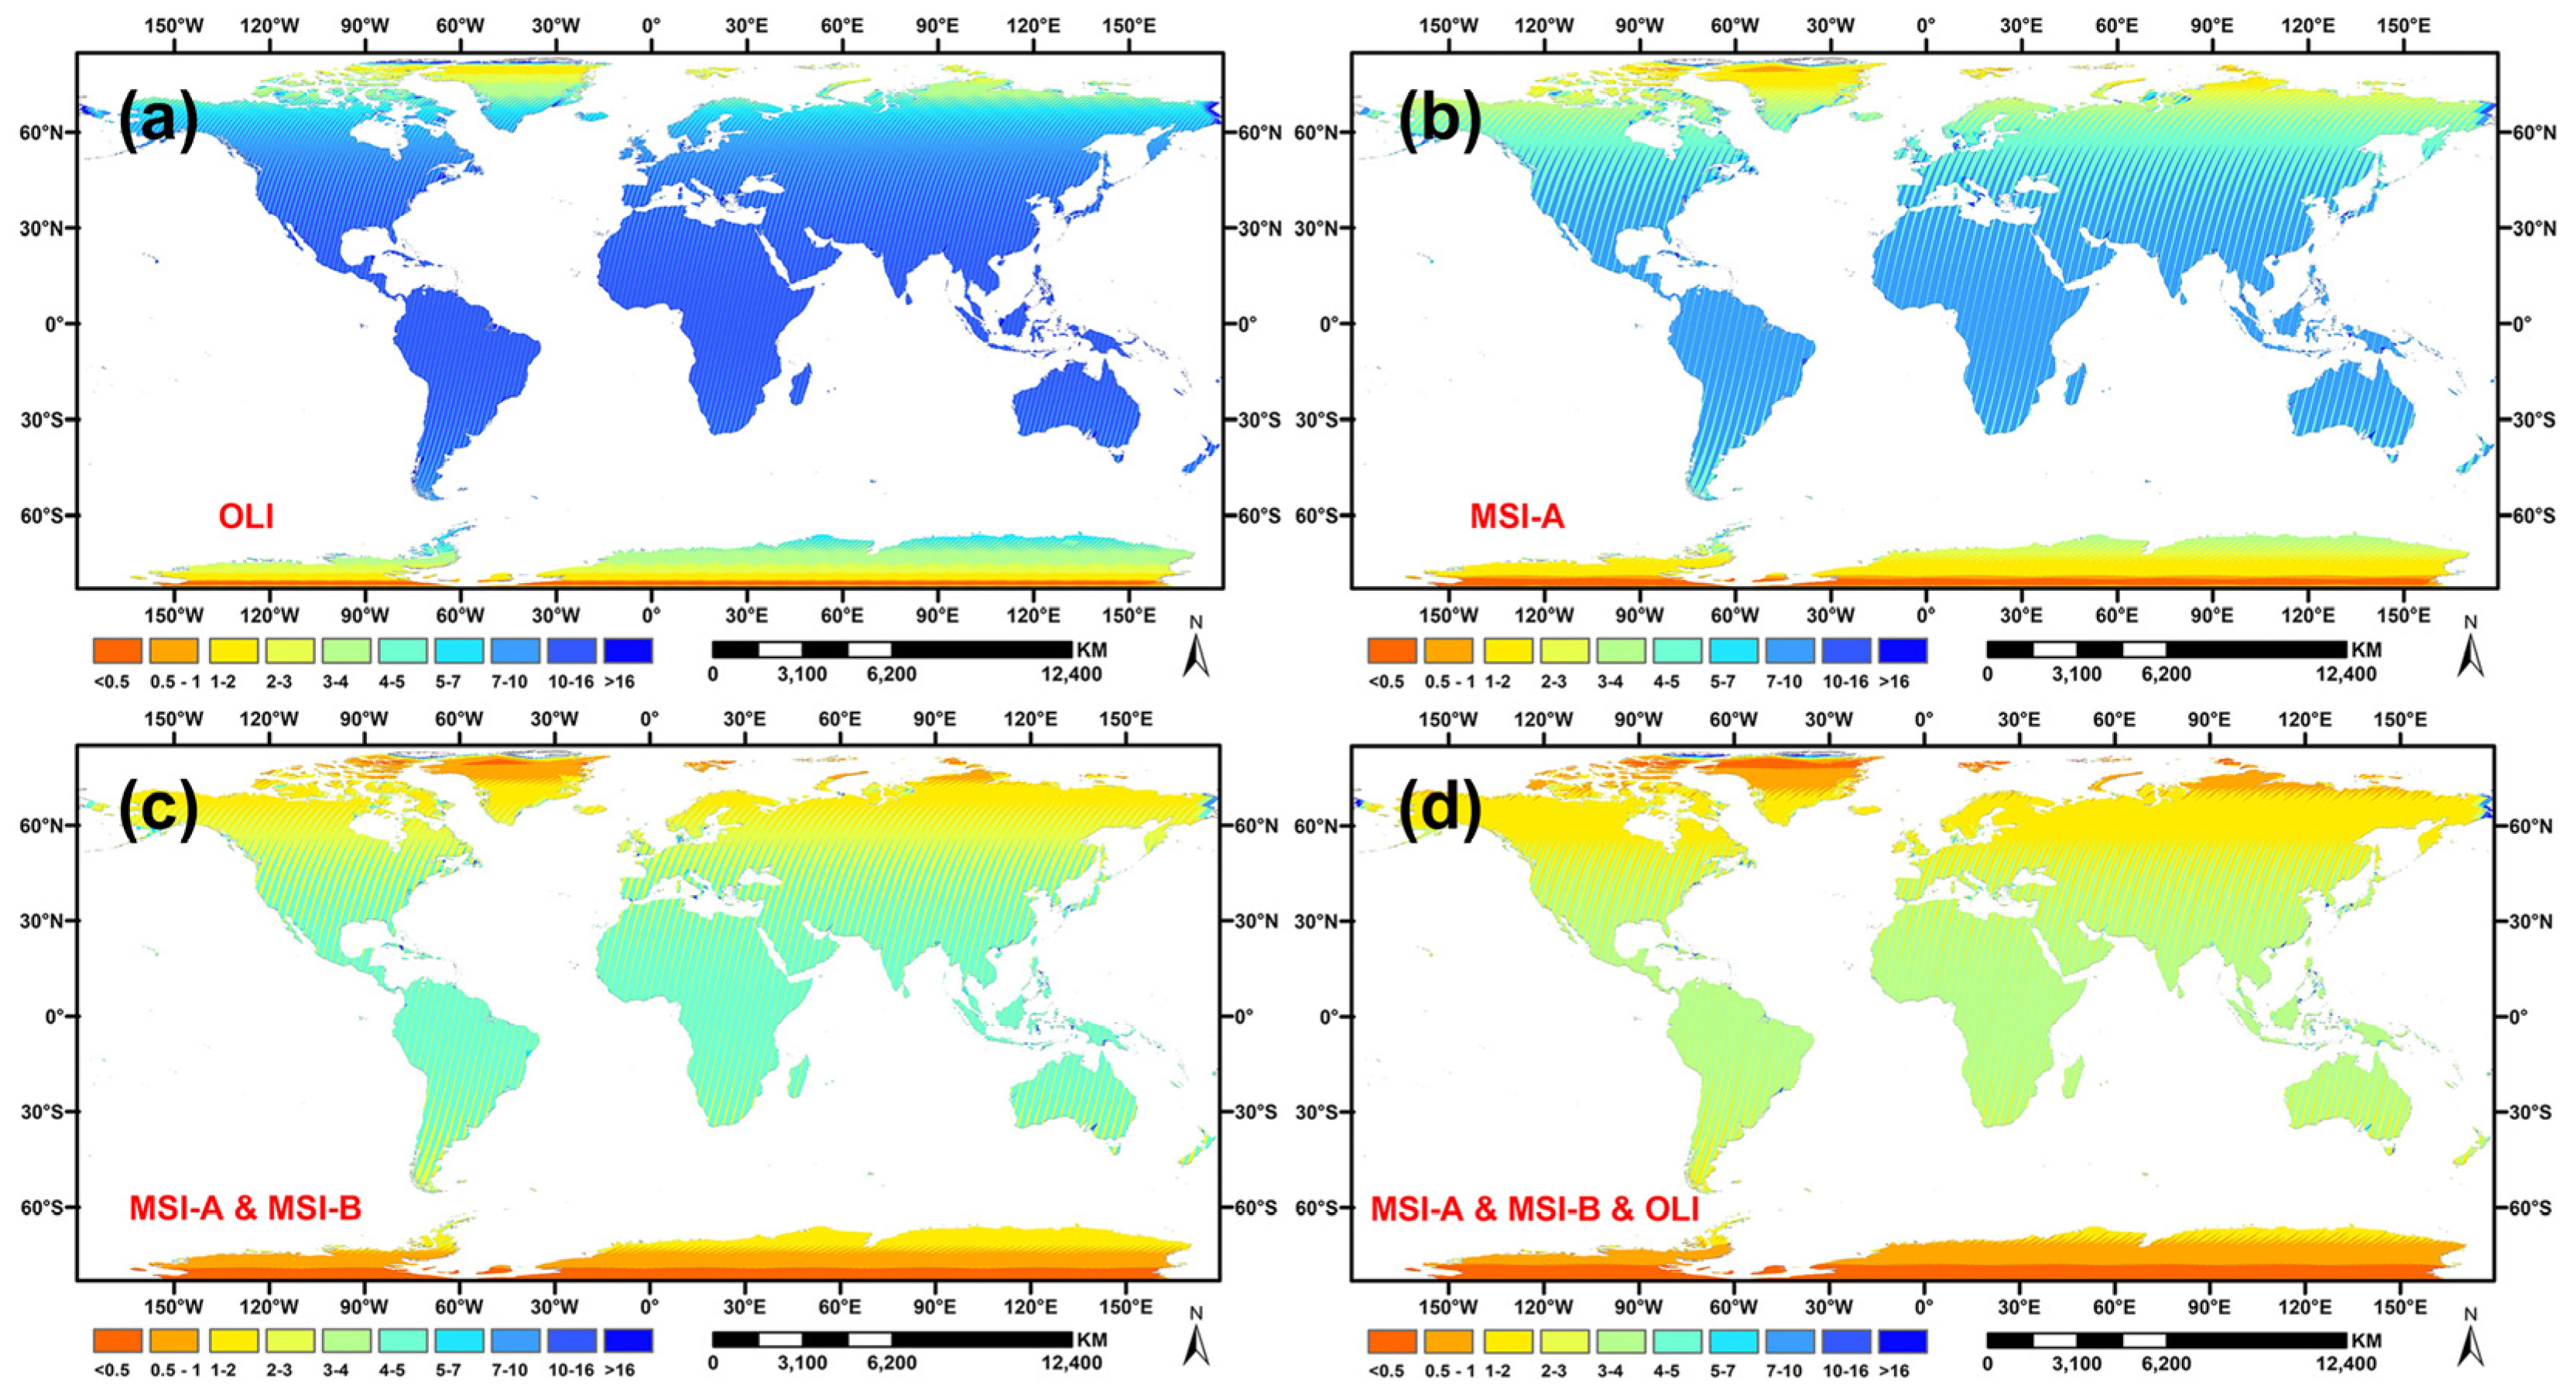
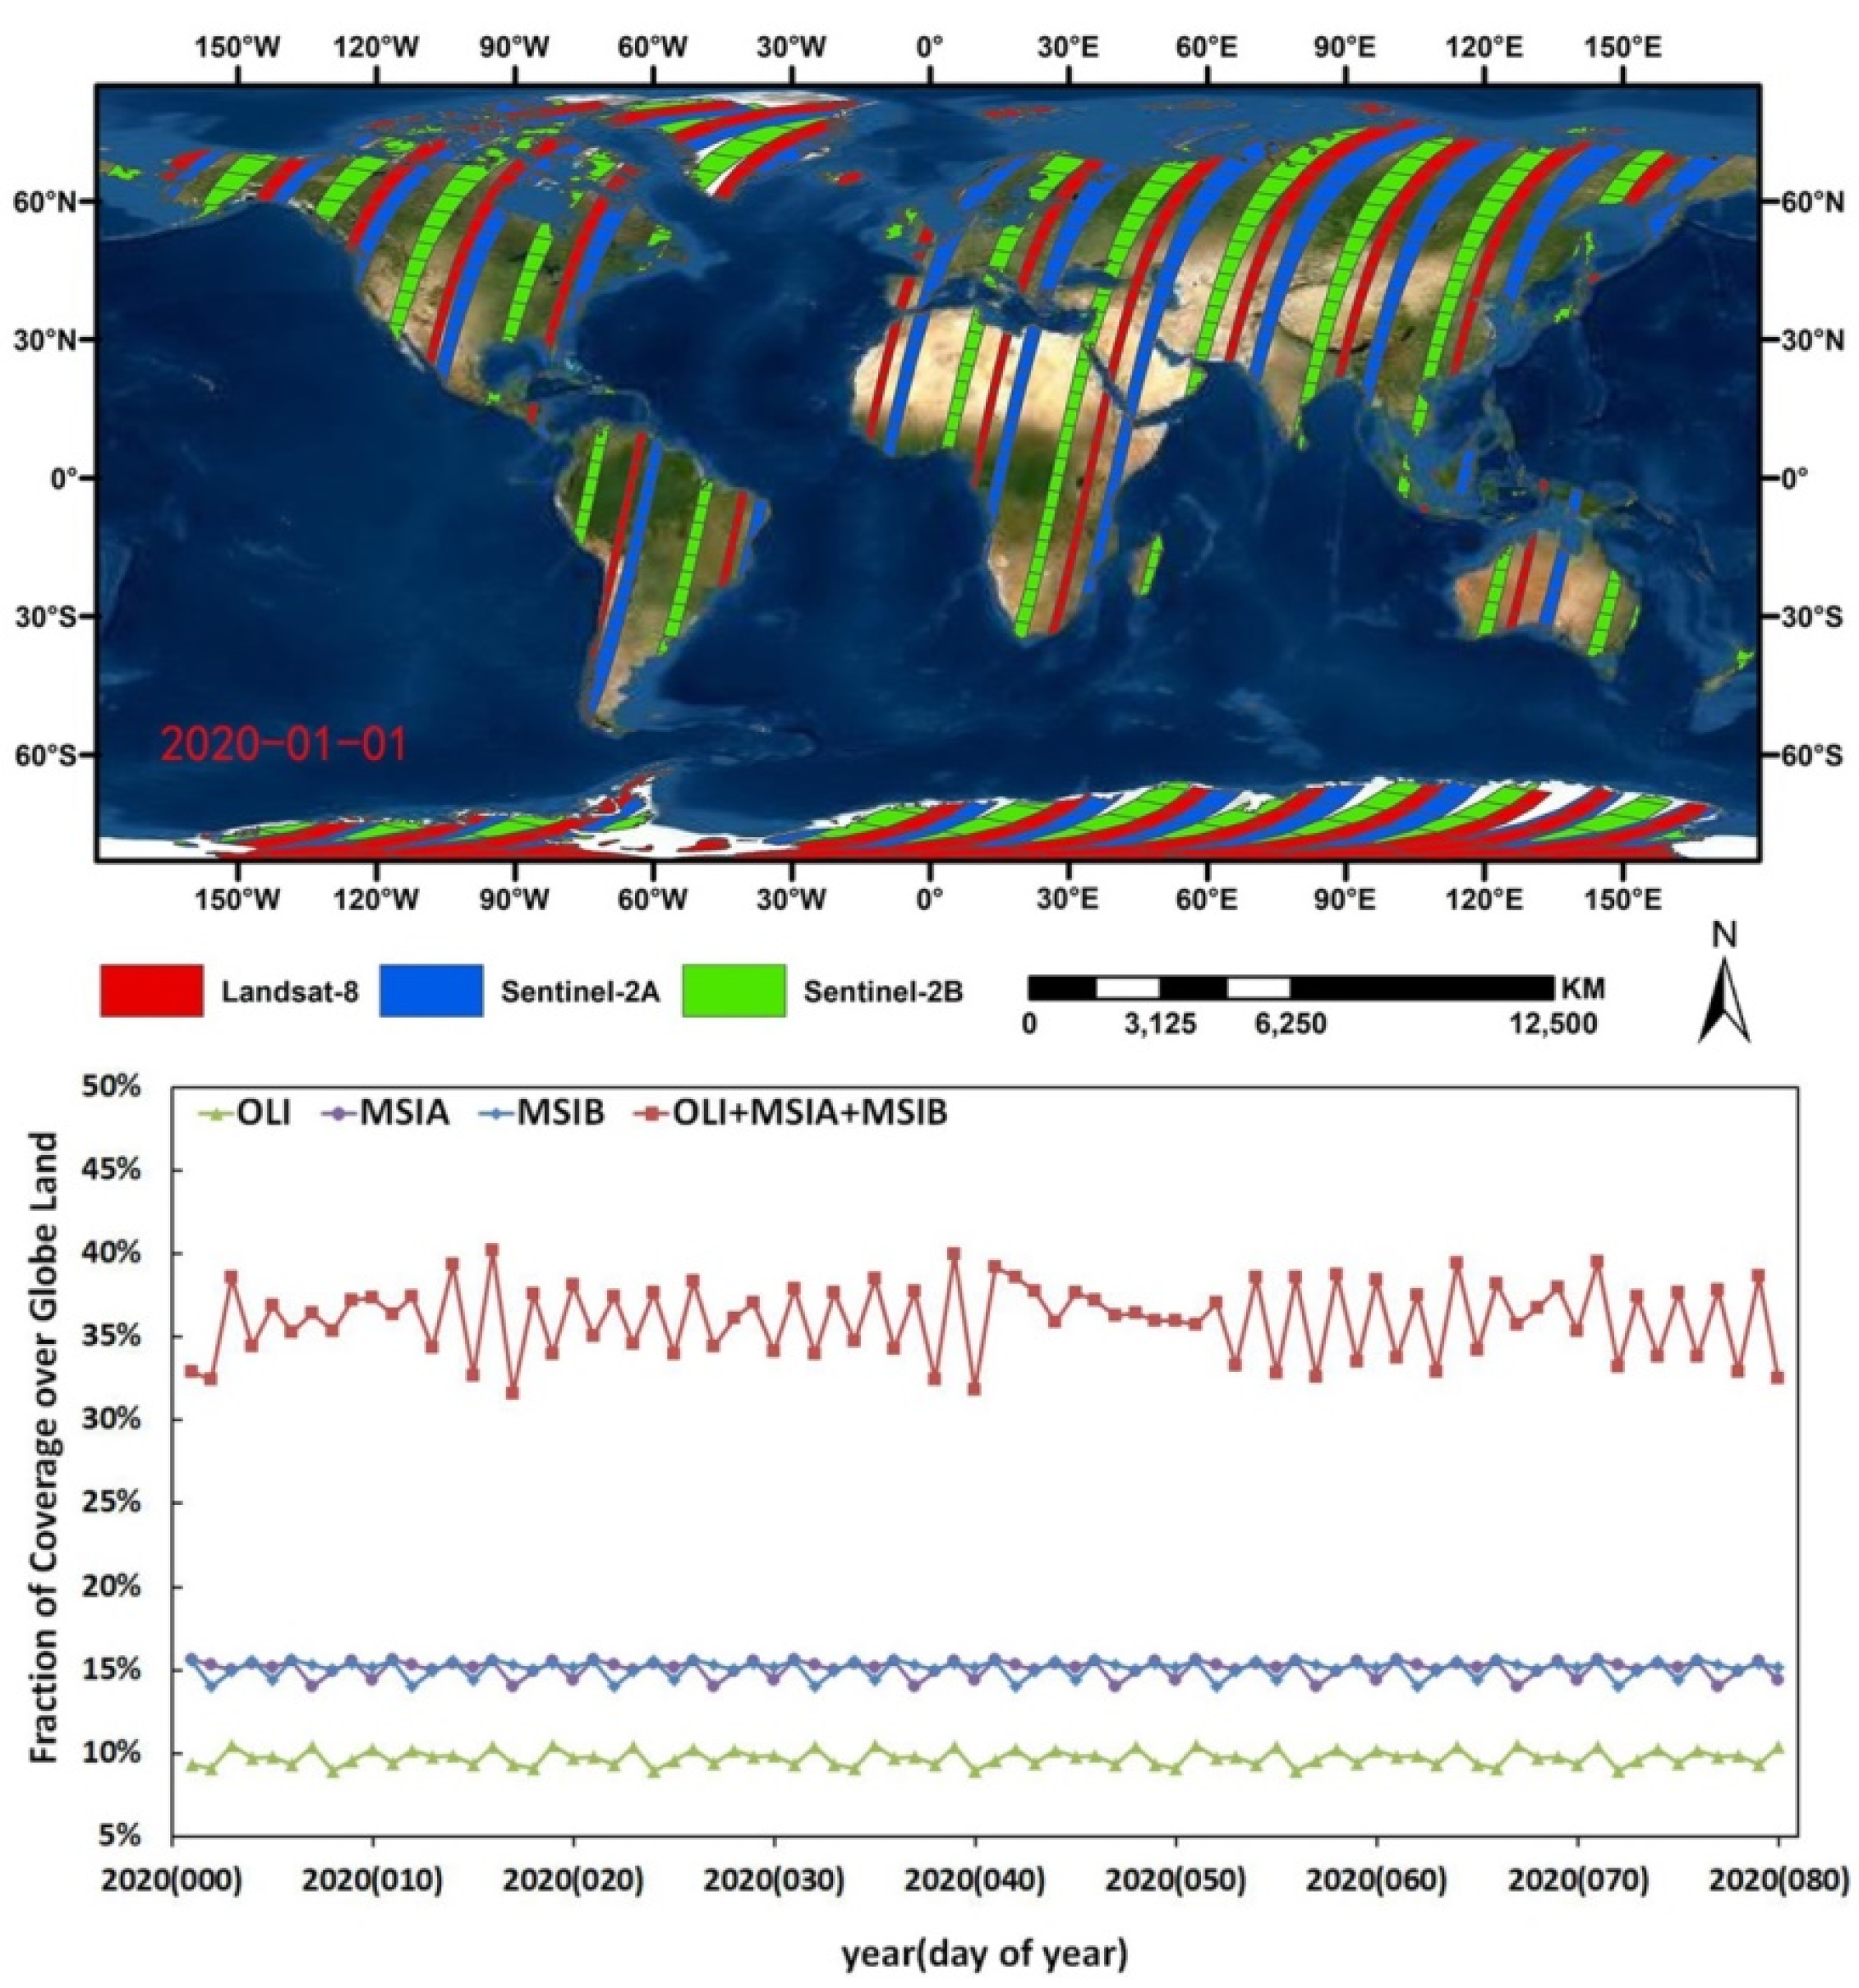
4.2. Temporal-Spatial Resolution of Combined Landsat-8 and Sentinel-2 Observation

AOD retrievals with a high temporal and spatial resolution have important practical significance for dynamic monitoring and for analyzing the air pollution in urban areas. A single satellite with a higher spatial resolution means a lower revisit cycle and smaller land coverage. In this paper, the orbit swath data for Landsat-8 and Sentinel-2 over 80 days (the lowest common multiple of 16, 10, and 10) are used to determine the percentage of mean potential revisit cycle and globe land coverage for Landsat-8, Sentinel-2A, Sentinel-2B and their configurations.
Figure 9 shows the revisit cycle for Landsat-8 (Figure 9a), Sentinel-2A (Figure 9b), Sentinel-2A and Sentinel-2B (Figure 9c), and all three sensors (Figure 9d). Overall, the larger the latitude, the shorter the revisit cycle for each sensor; Sentinel-2 has a shorter revisit cycle than Landsat-8. Combining all three sensors can increase the mean revisit cycle to 3.7 days at the equator, to as little as 2.2 days at 55° latitude, and to 2.3 days over the globe land.
Due to the similar swath overpass times used, combining the three sensors can significantly improve the spatial coverage over the land. The top of Figure 10 shows the swath coverage of globe land for each sensor on 1 January 2020, while the bottom of the figure illustrates the percentage of potential for each sensor and its configurations. The result shows the swath coverage of Landsat-8 is 9.07–10.49% (mean 9.74%) and 14.05–15.65 (mean 15.1% for each sensor) for Sentinel-2 each day. The combination of all three sensors has a theoretical coverage of 31.56–40.21% (mean 36.06%), which is three times as much as Landsat-8 and twice as much as a single Sentinel-2 sensor.
In fact, approximately 67% of the globe surface is covered with cloud [58] and the number of real cloudless observations in terms of frequency and coverage is far lower than the theoretical value. Figure A4 shows the AOD retrievals from the Landsat-8 and Sentinel-2 images achieved using our method from four AERONET sites in the study period. It appears that the mean percentage of Sentinel-2 cloudless observations is ~137% higher than that of Landsat-8 for each year, benefitting from the shorter revisit cycle and larger swath coverage, which is consistent with our theoretical analysis. Moreover, Sentinel-2 satellites have observed more air pollution events with an AOD higher than 1.0, proving that combining the three sensors has the potential to allow the monitoring of dynamic changes in air pollution.

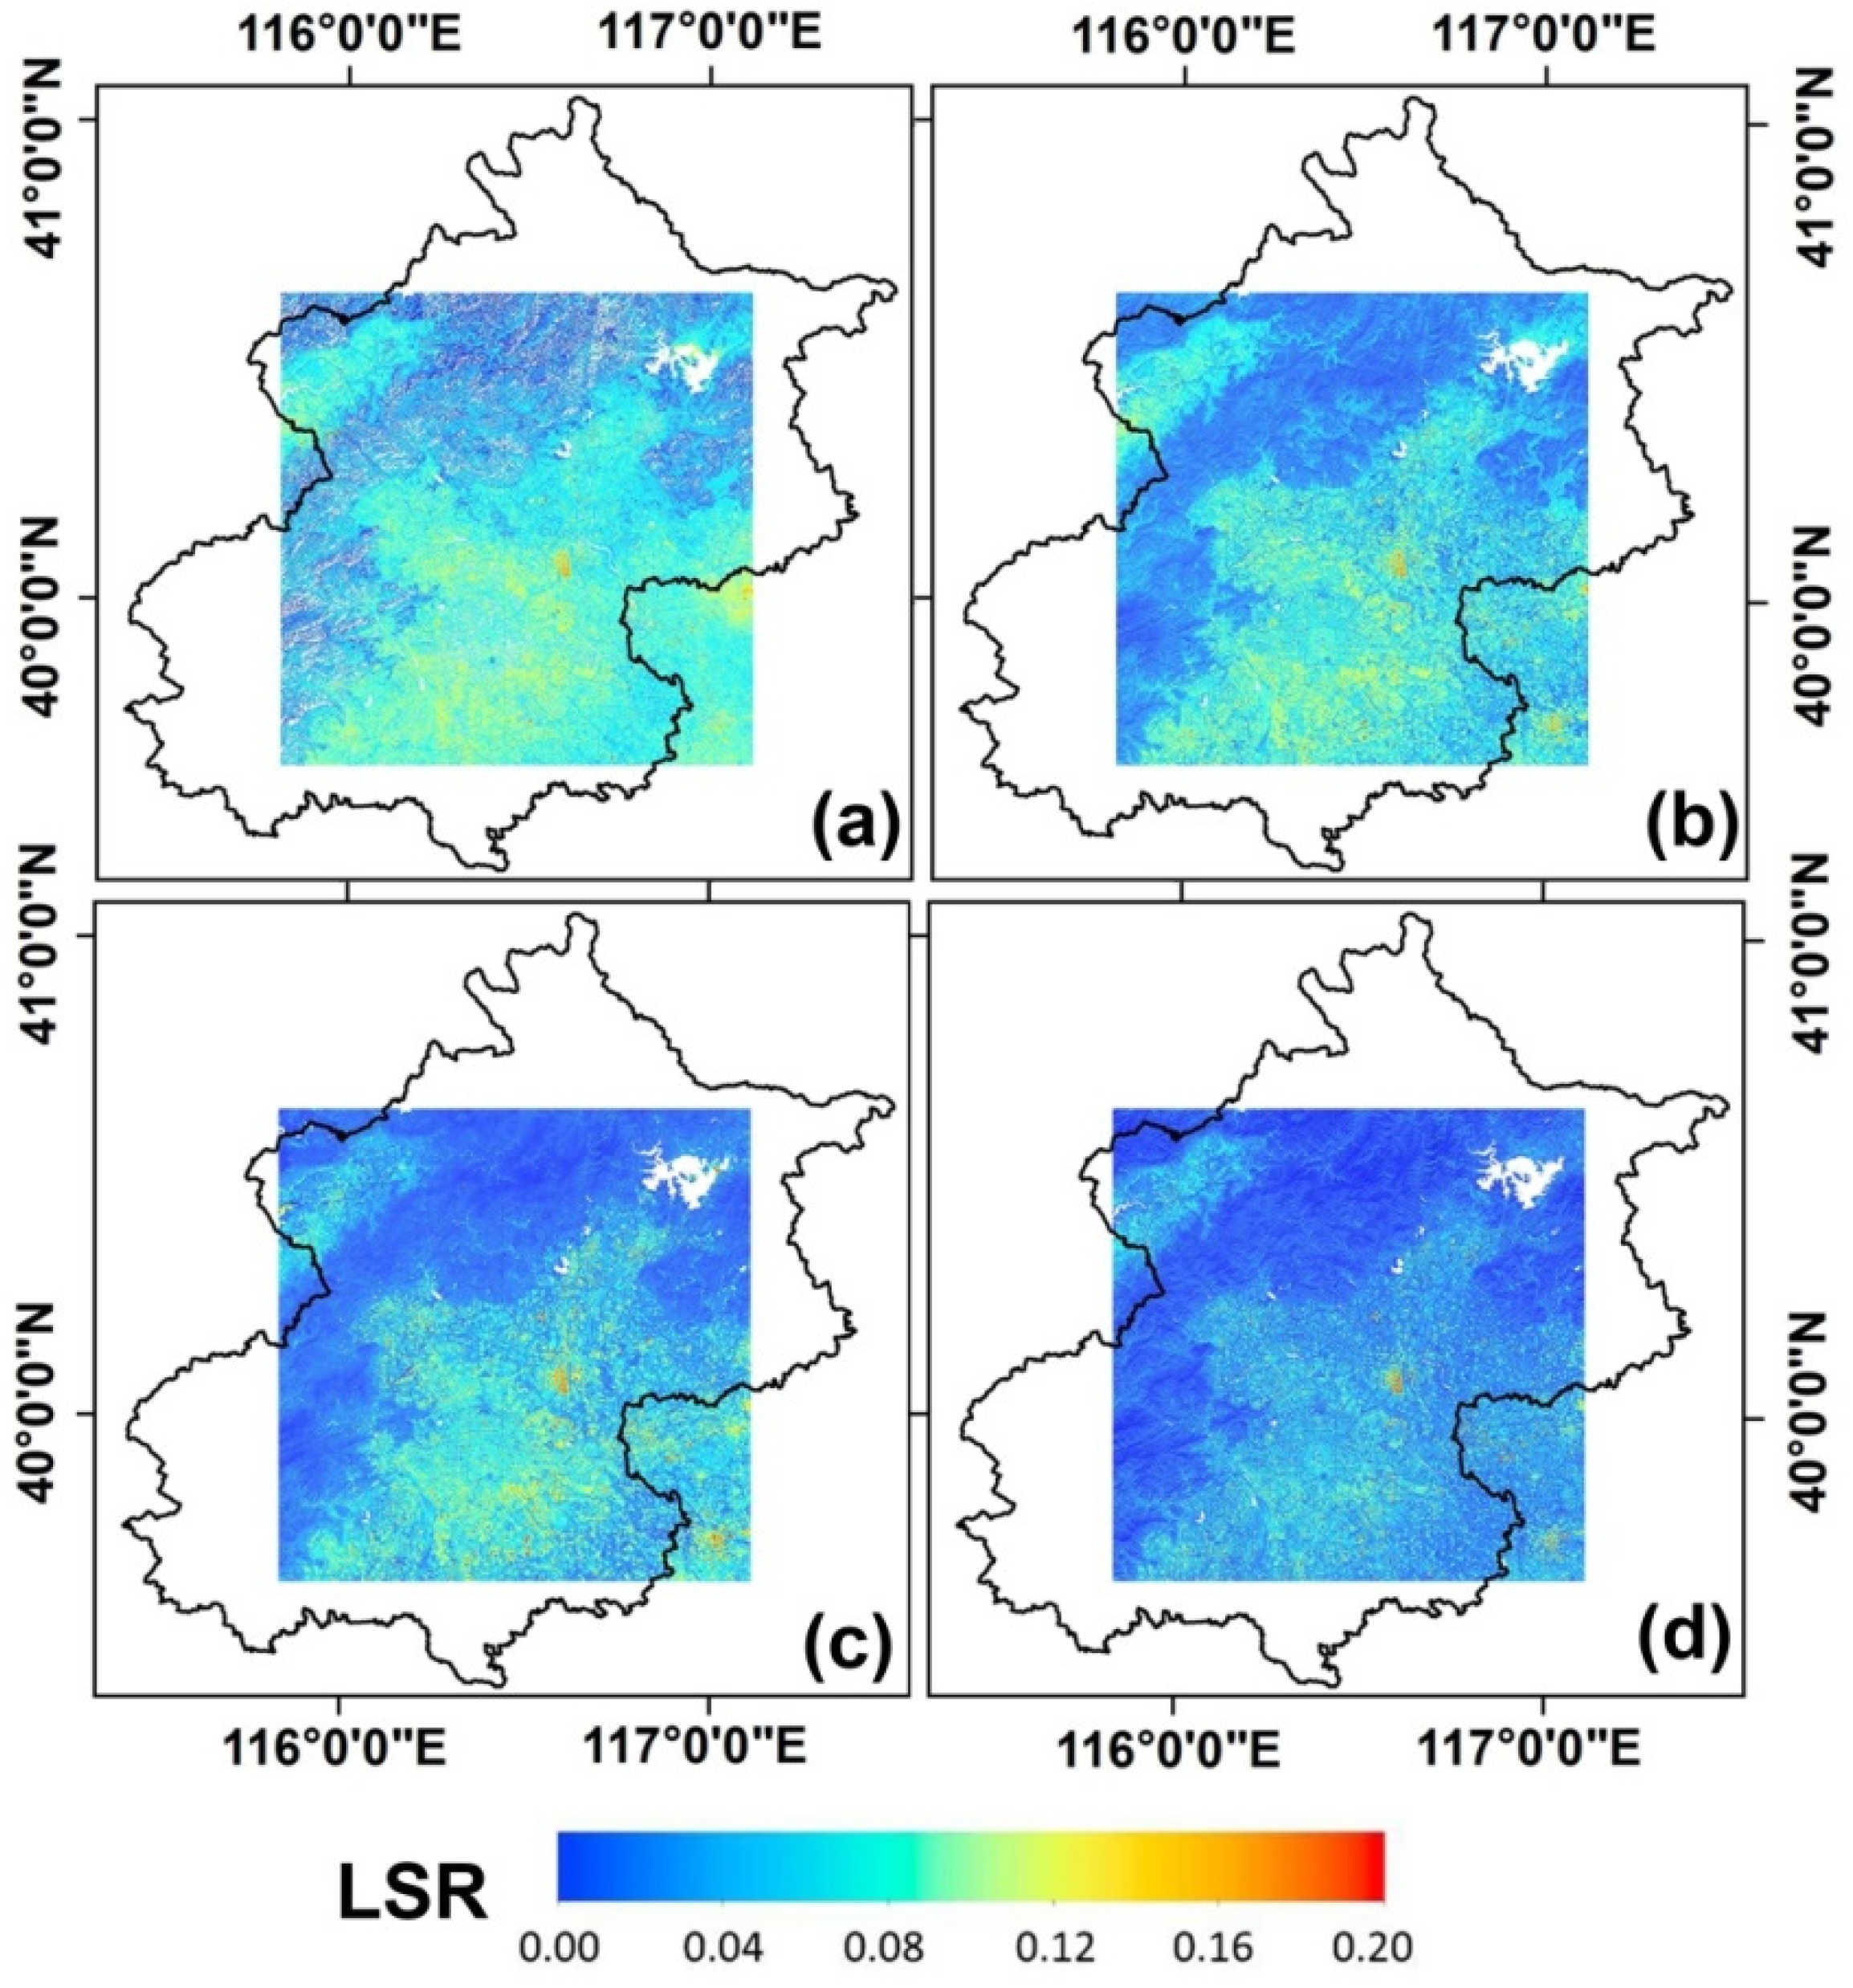
4.3. Spatial Distribution of AOD Retrievals

High spatial resolution is another advantage of the new retrieval algorithm. Here, we selected two typical days (i.e., 4 March 2017 for Landsat-8 OLI and 27 June 2017 for Sentinel-2A MSI, respectively) with a higher AOD loading and less cloud coverage as examples to compare the spatial distribution of the 30 m spatial resolution AOD retrieved by the new algorithm with the current operation AOD products from MODIS observations. These include MCD19A2 AOD at a 1 km resolution and MOD04_L2 DB & DT AOD at a 10 km resolution.
Figure 11 shows the spatial distribution of the AOD retrievals with different resolutions. Figure 11a,e show the degree of air pollution over color composite images. The retrieved AOD at a 30 m resolution for Landsat-8 and Sentinel-2 (Figure 11b,f) shows obviously higher values in the urban center in the southeast and lower values in the mountainous areas located in the northwest of the study area and far from the urban center. The AOD has a very large spatial heterogeneity in urban areas that can hardly be observed from the 10 km resolution AOD (Figure 11d,h). The AOD with a 1 km resolution (Figure 11c,g, MCD19A2 AOD) shows a better performance in the study areas than the MOD04_L2 AOD, but it was still hardly able to capture the spatial heterogeneity in a small region of less than one square kilometer. The results indicate that the fusing AOD retrieval algorithm is able to achieve continuous and high spatial resolution AOD over the study areas, especially in the centers of urban areas, which have bright surfaces. More importantly, according to the above comparison of the AOD products, with the increase in spatial resolution, the spatial heterogeneity of the AOD in the central urban areas also gradually increase, indicating that obtaining high spatial resolution AOD has great significance for the study of air pollution at a fine scale over urban areas.

5. Conclusions

The Landsat-8 and Sentinel-2 satellites are able to retrieve AOD with a high accuracy at a fine spatial resolution of 30 m, but with a lower temporal resolution and swath coverage. There are averages of 22 Landsat-8 overpasses and 73 Sentinel-2 (Sentinel-2A and Sentinel-2B) overpasses over the study areas each year, respectively. However, combining Landsat-8 and Sentinel-2 allows a mean theoretical revisit period of about 2.3 days and increases the mean coverage to 36% in each day over the globe land, which is of great significance for monitoring and analyzing the air pollutants in urban areas.
In this paper, a fusing aerosol retrieval algorithm was proposed from Landsat-8 and Sentinel-2 remote sensing observations over urban areas. The Landsat-8 and Sentinel-2 AOD retrievals were validated and compared against AERONET AOD, LaSRC AOD and MOD04 DB&DT AOD. The experimental results indicate that the combined high-resolution AOD retrievals with a 30 m spatial resolution could provide spatial continuity, a high temporal resolution, and detailed AOD distribution information over the study area. The fusing AOD retrieval algorithm for Landsat-8 and Sentinel-2 images all show a high level of agreement with AERONET AOD (R2 of 0.935 and 0.899), a small RMSE of 0.097 and 0.121, and a higher accuracy of 70.37% and 67.01% for the AODs falling within the EE line. The AOD retrievals had the highest accuracy compared with the operational AOD products. The results indicated that the fusing AOD retrieval algorithm performs well and is robust over urban areas with complex surface types and a higher AOD loading.
However, although the fusing AOD retrieval algorithm achieved an overall good accuracy, there are still have some uncertainties that need to be researched further. First, the cloud mask algorithm we used for the Sentinel-2 images still has some known mistakes that may cause significant errors, especially in urban areas with bright surfaces and on days with thick AOD loading. Secondly, additional extensive validation needs to be performed to ensure the reliability of the fusing algorithm. Therefore, we will focus on validating our algorithm on a global scale and discuss its applicability in our future work.

Author Contributions

Conceptualization, H.L. and S.L.; methodology, H.L. and Q.W.; software, J.Y. and X.Z.; validation, H.L., Q.W. and L.D.; data curation, X.Z.; writing—original draft preparation, H.L., S.L., J.X. and J.Y.; writing—review and editing, S.L. and H.L. All authors have read and agreed to the published version of the manuscript.

Funding

This research was funded by National Natural Science Foundation of China, grant number 41975022 and the Foundation for Innovative Research Groups of the Hubei Natural Science Foundation, grant number 2020CFA003.

Institutional Review Board Statement

Not applicable.

Informed Consent Statement

Not applicable.

Data Availability Statement

Not applicable.

Acknowledgments

The authors thank USGS and ESA for their free provision of the Landsat-8 and Sentinel-2 images. Thanks are due to AERONET for their data maintenance. We also would like to thank for the Chinese academy of sciences provide the GLC_FCS30-2015 and GLC_FCS30-2020 data. We express our sincere gratitude to the anonymous reviewers and the editor for their constructive comments.

Conflicts of Interest

The authors declare no conflict of interest.

Appendix A

Figure A1. Polar plot illustrating the solar and view geometry of Landsat-8 (red) and Sentinel-2 (blue) data in the study period. The radial straight lines show azimuth spaced every 30° and the circles show zenith spaced every 20°.
Remotesensing 13 04140 g0a1
Figure A2. Monthly LSR determination in (a) January, (b) April, (b) July, and (d) October over study areas.
Remotesensing 13 04140 g0a2
Figure A3. True color image (a) and the spatial distribution of different surface types (b) over Beijing and surrounding areas (Sentinel-2A MSI image in 27 June 2017).
Remotesensing 13 04140 g0a3
Figure A4. AOD retrievals from Landsat-8 (black dot) and Sentinel-2 (red dot) images on AERONET sites in the study period.
Remotesensing 13 04140 g0a4

References

  1. Kaufman, Y.J.; Tanré, D.; Boucher, O. A satellite view of aerosols in the climate system. Nature 2002, 419, 215–223. [Google Scholar] [CrossRef]
  2. Kocifaj, M.; Horvath, H.; Jovanović, O.; Gangl, M. Optical properties of urban aerosols in the region Bratislava–Vienna I. Methods and tests. Atmos. Environ. 2006, 40, 1922–1934. [Google Scholar] [CrossRef]
  3. Huang, D.; Xu, J.; Zhang, S. Valuing the health risks of particulate air pollution in the Pearl River Delta, China. Environ. Sci. Policy 2012, 15, 38–47. [Google Scholar] [CrossRef]
  4. Che, H.; Xia, X.; Zhao, H.; Dubovik, O.; Holben, B.N.; Goloub, P.; Cuevas-Agulló, E.; Estelles, V.; Wang, Y.; Zhu, J.; et al. Spatial distribution of aerosol microphysical and optical properties and direct radiative effect from the China Aerosol Remote Sensing Network. Atmos. Chem. Phys. 2019, 19, 11843–11864. [Google Scholar] [CrossRef] [Green Version]
  5. Che, H.; Zhang, X.-Y.; Xia, X.; Goloub, P.; Holben, B.; Zhao, H.; Wang, Y.; Zhang, X.-C.; Wang, H.; Blarel, L.; et al. Ground-based aerosol climatology of China: Aerosol optical depths from the China Aerosol Remote Sensing Network (CARSNET) 2002–2013. Atmos. Chem. Phys. 2015, 15, 7619–7652. [Google Scholar] [CrossRef] [Green Version]
  6. Lyapustin, A.; Wang, Y.; Laszlo, I.; Kahn, R.; Korkin, S.; Remer, L.; Levy, R.; Reid, J.S. Multiangle implementation of atmospheric correction (MAIAC): 2. Aerosol algorithm. J. Geophys. Res. Atmos. 2011, 116. [Google Scholar] [CrossRef]
  7. Fraser, R.S. Satellite measurement of mass of Sahara dust in the atmosphere. Appl. Opt. 1976, 15, 2471–2479. [Google Scholar] [CrossRef]
  8. Kaufman, Y.J.; Tanré, D.; Remer, L.A.; Vermote, E.F.; Chu, A.; Holben, B.N. Operational remote sensing of tropospheric aerosol over land from EOS moderate resolution imaging spectroradiometer. J. Geophys. Res. Atmos. 1997, 102, 17051–17067. [Google Scholar] [CrossRef]
  9. Levy, R.C.; Remer, L.A.; Kleidman, R.G.; Mattoo, S.; Ichoku, C.; Kahn, R.; Eck, T.F. Eck, Global evaluation of the Collection 5 MODIS dark-target aerosol products over land. Atmos. Chem. Phys. 2010, 10, 10399–10420. [Google Scholar] [CrossRef] [Green Version]
  10. Remer, L.A.; Kaufman, Y.J.; Tanré, D.; Mattoo, S.; Chu, D.A.; Martins, J.V.; Li, R.-R.; Ichoku, C.; Levy, R.C.; Kleidman, R.G.; et al. The MODIS aerosol algorithm, products, and validation. J. Atmos. Sci. 2005, 62, 947–973. [Google Scholar] [CrossRef] [Green Version]
  11. Hsu, N.C.; Jeong, M.J.; Bettenhausen, C.; Sayer, A.M.; Hansell, R.; Seftor, C.S.; Huang, J.; Tsay, S.C. Enhanced Deep Blue aerosol retrieval algorithm: The second generation. J. Geophys. Res. Atmos. 2013, 118, 9296–9315. [Google Scholar] [CrossRef]
  12. Hsu, N.C.; Tsay, S.C.; King, M.D.; Herman, J.R. Deep Blue retrievals of Asian aerosol properties during ACE-Asia. IEEE Trans. Geosci. Remote Sens. 2006, 44, 3180–3195. [Google Scholar] [CrossRef]
  13. Levy, R.C.; Mattoo, S.; Munchak, L.A.; Remer, L.A.; Sayer, A.M.; Patadia, F.; Hsu, N.C. The Collection 6 MODIS aerosol products over land and ocean. Atmos. Meas. Tech. 2013, 6, 2989–3034. [Google Scholar] [CrossRef] [Green Version]
  14. Tanre, D.; Deschamps, P.Y.; Devaux, C.; Herman, M. Estimation of Saharan aerosol optical thickness from blurring effects in thematic mapper data. J. Geophys. Res. Atmos. 1988, 93, 15955–15964. [Google Scholar] [CrossRef]
  15. Martins, V.S.; Lyapustin, A.; de Carvalho, L.A.S.; Barbosa, C.C.F.; Novo, E.M.L.M. Validation of high-resolution MAIAC aerosol product over South America. J. Geophys. Res. Atmos. 2017, 122, 7537–7559. [Google Scholar] [CrossRef]
  16. Lyapustin, A.; Wang, Y.; Korkin, S.; Huang, D. MODIS Collection 6 MAIAC algorithm. Atmos. Meas. Tech. 2018, 11, 5741–5765. [Google Scholar] [CrossRef] [Green Version]
  17. Sun, L.; Wei, J.; Bilal, M.; Tian, X.; Jia, C.; Guo, Y.; Mi, X. Aerosol Optical Depth Retrieval over Bright Areas Using Landsat 8 OLI Images. Remote Sens. 2015, 8, 23. [Google Scholar] [CrossRef] [Green Version]
  18. Bilal, M.; Nichol, J.E.; Bleiweiss, M.P.; Dubois, D. A Simplified high resolution MODIS Aerosol Retrieval Algorithm (SARA) for use over mixed surfaces. Remote Sens. Environ. 2013, 136, 135–145. [Google Scholar] [CrossRef]
  19. Bilal, M.; Nichol, J.E.; Chan, P.W. Validation and accuracy assessment of a Simplified Aerosol Retrieval Algorithm (SARA) over Beijing under low and high aerosol loadings and dust storms. Remote Sens. Environ. 2014, 153, 50–60. [Google Scholar] [CrossRef]
  20. She, L.; Zhang, H.; Wang, W.; Wang, Y.; Shi, Y. Evaluation of the multi-angle implementation of atmospheric correction (MAIAC) aerosol algorithm for Himawari-8 data. Remote Sens. 2019, 11, 2771. [Google Scholar] [CrossRef] [Green Version]
  21. Gupta, P.; Remer, L.A.; Levy, R.C.; Mattoo, S. Validation of MODIS 3 km Land Aerosol Optical Depth from NASA’s EOS Terra and Aqua Missions. Atmos. Meas. Tech. 2018, 11, 3145–3159. [Google Scholar] [CrossRef] [Green Version]
  22. Gupta, P.; Levy, R.C.; Mattoo, S.; Remer, L.A.; Munchak, L.A. A surface reflectance scheme for retrieving aerosol optical depth over urban surfaces in MODIS Dark Target retrieval algorithm. Atmos. Meas. Tech. 2016, 9, 3293–3308. [Google Scholar] [CrossRef] [Green Version]
  23. Wei, J.; Sun, L.; Peng, Y.; Wang, L.; Zhang, Z.; Bilal, M.; Ma, Y. An Improved High-Spatial-Resolution Aerosol Retrieval Algorithm for MODIS Images Over Land. J. Geophys. Res. Atmos. 2018, 123, 12291–12307. [Google Scholar] [CrossRef]
  24. Hsu, N.C.; Tsay, S.C.; King, M.D.; Herman, J.R. Aerosol properties over bright-reflecting source regions. IEEE Trans. Geosci. Remote Sens. 2004, 42, 557–569. [Google Scholar] [CrossRef]
  25. Li, L.L.; Yang, J.X.; Wang, Y.P. An improved dark object method to retrieve 500m-resolution AOT (Aerosol Optical Thickness) image from MODIS data: A case study in the Pearl River Delta area, China. ISPRS J. Photogramm. Remote Sens. 2014, 89, 1–12. [Google Scholar] [CrossRef]
  26. Jackson, J.M.; Liu, H.; Laszlo, I.; Kondragunta, S.; Remer, L.A.; Huang, J.; Huang, H.-C. Suomi-NPP VIIRS aerosol algorithms and data products. J. Geophys. Res. Atmos. 2013, 118, 12673–12689. [Google Scholar] [CrossRef]
  27. Kikuchi, M.; Murakami, H.; Suzuki, K.; Nagao, T.M.; Higurashi, A. Improved Hourly Estimates of Aerosol Optical Thickness Using Spatiotemporal Variability Derived from Himawari-8 Geostationary Satellite. IEEE Trans. Geosci. Remote Sens. 2018, 56, 3442–3455. [Google Scholar] [CrossRef]
  28. Zhang, Z.; Fan, M.; Wu, W.; Wang, Z.; Tao, M.; Wei, J.; Wang, Q. A simplified aerosol retrieval algorithm for Himawari-8 Advanced Himawari Imager over Beijing. Atmos. Environ. 2019, 199, 127–135. [Google Scholar] [CrossRef]
  29. Lin, H.; Li, S.; Xing, J.; He, T.; Yang, J.; Wang, Q. High resolution aerosol optical depth retrieval over urban areas from Landsat-8 OLI images. Atmos. Environ. 2021, 261, 118591. [Google Scholar] [CrossRef]
  30. Müller-Wilm, U. Sen2Cor Configuration and User Manual; Ref. S2-PDGS-MPC-L2A-SUM-V2.3; Telespazio VEGA Deutschland GmbH: Darmstadt, Germany, 2016. [Google Scholar]
  31. Li, Z.; Roy, D.P.; Zhang, H.K.; Vermote, E.F.; Huang, H. Evaluation of Landsat-8 and Sentinel-2A aerosol optical depth retrievals across Chinese cities and implications for medium spatial resolution urban aerosol monitoring. Remote Sens. 2019, 11, 122. [Google Scholar] [CrossRef] [PubMed] [Green Version]
  32. Li, J.; Roy, D.P. A Global Analysis of Sentinel-2A, Sentinel-2B and Landsat-8 Data Revisit Intervals and Implications for Terrestrial Monitoring. Remote Sens. 2017, 9, 902. [Google Scholar] [CrossRef] [Green Version]
  33. Claverie, M.; Ju, J.; Masek, J.G.; Dungan, J.L.; Vermote, E.F.; Roger, J.C.; Skakun, S.V.; Justice, C. The Harmonized Landsat and Sentinel-2 surface reflectance data set. Remote Sens. Environ. 2018, 219, 145–161. [Google Scholar] [CrossRef]
  34. Yang, O.; Wenji, Z.; Xiaoxia, Z.; Qiulin, X.; Chunyuan, S.J.E. Effect of vehicles on the temporal and spatial distribution of PM2.5. Ecol. Environ. Sci. 2015, 24, 2009–2016. [Google Scholar]
  35. Irons, J.R.; Dwyer, J.L.; Barsi, J.A. The next Landsat satellite: The Landsat Data Continuity Mission. Remote Sens. Environ. 2012, 122, 11–21. [Google Scholar] [CrossRef] [Green Version]
  36. Drusch, M.; del Bello, U.; Carlier, S.; Colin, O.; Fernandez, V.; Gascon, F.; Hoersch, B.; Isola, C.; Laberinti, P.; Martimort, P.; et al. Sentinel-2: ESA’s Optical High-Resolution Mission for GMES Operational Services. Remote Sens. Environ. 2012, 120, 25–36. [Google Scholar] [CrossRef]
  37. Gascon, F.; Bouzinac, C.; Thepaut, O.; Jung, M.; Francesconi, B.; Louis, J.; Lonjou, V.; Lafrance, B.; Massera, S.; Gaudel-Vacaresse, A.; et al. Copernicus Sentinel-2A Calibration and Products Validation Status. Remote Sens. 2017, 9, 584. [Google Scholar] [CrossRef] [Green Version]
  38. Storey, J.; Choate, M.; Lee, K. Landsat 8 operational land imager on-orbit geometric calibration and performance. Remote Sens. 2014, 6, 11127–11152. [Google Scholar] [CrossRef] [Green Version]
  39. Zhang, X.; Liu, L.Y.; Chen, X.D.; Xie, S.; Jun, M. GLC_FCS30: Global land-cover product with fine classification system at 30 m using time-series Landsat imagery. Earth Syst. Sci. Data 2021, 13, 2753–2776. [Google Scholar] [CrossRef]
  40. Li, J.; Carlson, B.E.; Dubovik, O.; Lacis, A.A. Recent trends in aerosol optical properties derived from AERONET measurements. Atmos. Chem. Phys. 2014, 14, 12271–12289. [Google Scholar] [CrossRef] [Green Version]
  41. Perez-Ramirez, D.; Veselovskii, I.; Whiteman, D.N.; Suvorina, A.; Korenskiy, M.; Kolgotin, A.; Holben, B.; Dubovik, O.; Siniuk, A.; Alados-Arboledas, L. High temporal resolution estimates of columnar aerosol microphysical parameters from spectrum of aerosol optical depth by linear estimation: Application to long-term AERONET and star-photometry measurements. Atmos. Meas. Tech. 2015, 8, 3117–3133. [Google Scholar] [CrossRef] [Green Version]
  42. Patadia, F.; Levy, R.C.; Mattoo, S. Correcting for trace gas absorption when retrieving aerosol optical depth from satellite observations of reflected shortwave radiation. Atmos. Meas. Tech. 2018, 11, 3205–3219. [Google Scholar] [CrossRef] [Green Version]
  43. Bilal, M.; Qiu, Z. Aerosol retrievals over bright urban surfaces using Landsat 8 images. In Proceedings of the International Geoscience and Remote Sensing Symposium (IGARSS), Valencia, Spain, 22–27 July 2018. [Google Scholar]
  44. Obregón, M.Á.; Rodrigues, G.; Costa, M.J.; Potes, M.; Silva, A.M. Validation of ESA Sentinel-2 L2A Aerosol Optical Thickness and Columnar Water Vapour during 2017–2018. Remote Sens. 2019, 11, 1649. [Google Scholar] [CrossRef] [Green Version]
  45. Vermote, E.; Justice, C.; Claverie, M. Franch, Preliminary analysis of the performance of the Landsat 8/OLI land surface reflectance product. Remote Sens. Environ. 2016, 185, 46–56. [Google Scholar] [CrossRef]
  46. Zhang, H.K.K.; Roy, D.P.; Yan, L.; Li, Z.B.; Huang, H.Y.; Vermote, E.; Skakun, S.; Roger, J.C. Characterization of Sentinel-2A and Landsat-8 top of atmosphere, surface, and nadir BRDF adjusted reflectance and NDVI differences. Remote Sens. Environ. 2018, 215, 482–494. [Google Scholar] [CrossRef]
  47. Doxani, G.; Vermote, E.; Roger, J.C.; Gascon, F.; Adriaensen, S.; Frantz, D.; Hagolle, O.; Hollstein, A.; Kirches, G.; Li, F.; et al. Atmospheric correction inter-comparison exercise. Remote Sens. 2018, 10, 352. [Google Scholar] [CrossRef] [Green Version]
  48. Baetens, L.; Desjardins, C.; Hagolle, O. Validation of Copernicus Sentinel-2 Cloud Masks Obtained from MAJA, Sen2Cor, and FMask Processors Using Reference Cloud Masks Generated with a Supervised Active Learning Procedure. Remote Sens. 2019, 11, 433. [Google Scholar] [CrossRef] [Green Version]
  49. Foga, S.; Scaramuzza, P.L.; Guo, S.; Zhu, Z.; Dilley, R.D.; Beckmann, T.; Schmidt, G.L.; Dwyer, J.L.; Hughes, M.J.; Laue, B. Cloud detection algorithm comparison and validation for operational Landsat data products. Remote Sens. Environ. 2017, 194, 379–390. [Google Scholar] [CrossRef] [Green Version]
  50. Qiu, S.; Zhu, Z.; He, B.B. Fmask 4.0: Improved cloud and cloud shadow detection in Landsats 4-8 and Sentinel-2 imagery. Remote Sens. Environ. 2019, 231, 111205. [Google Scholar] [CrossRef]
  51. Zhu, Z.; Wang, S.X.; Woodcock, C.E. Improvement and expansion of the Fmask algorithm: Cloud, cloud shadow, and snow detection for Landsats 4-7, 8, and Sentinel 2 images. Remote Sens. Environ. 2015, 159, 269–277. [Google Scholar] [CrossRef]
  52. Bar-Or, R.Z.; Koren, I.; Altaratz, O.; Fredj, E. Radiative properties of humidified aerosols in cloudy environment. Atmos. Res. 2012, 118, 280–294. [Google Scholar] [CrossRef]
  53. Skakun, S.; Roger, J.C.; Vermote, E.F.; Masek, J.G.; Justice, C.O. Automatic sub-pixel co-registration of Landsat-8 Operational Land Imager and Sentinel-2A Multi-Spectral Instrument images using phase correlation and machine learning based mapping. Int. J. Digit. Earth 2017, 10, 1253–1269. [Google Scholar] [CrossRef] [PubMed]
  54. Storey, J.; Roy, D.P.; Masek, J.; Gascon, F.; Dwyer, J.; Choate, M. A note on the temporary misregistration of Landsat-8 Operational Land Imager (OLI) and Sentinel-2 Multi Spectral Instrument (MSI) imagery. Remote Sens. Environ. 2016, 186, 121–122. [Google Scholar] [CrossRef] [Green Version]
  55. Wei, J.; Huang, B.; Sun, L.; Zhang, Z.Y.; Wang, L.C.; Bilal, M. A Simple and Universal Aerosol Retrieval Algorithm for Landsat Series Images Over Complex Surfaces. J. Geophys. Res. Atmos. 2017, 122, 13338–13355. [Google Scholar] [CrossRef]
  56. Lucht, W.; Schaaf, C.B.; Strahler, A.H. An algorithm for the retrieval of albedo from space using semiempirical BRDF models. IEEE Trans. Geosci. Remote Sens. 2000, 38, 977–998. [Google Scholar] [CrossRef] [Green Version]
  57. Song, W.; Deng, X. Land-use/land-cover change and ecosystem service provision in China. Sci. Total. Environ. 2017, 576, 705–719. [Google Scholar] [CrossRef] [PubMed]
  58. King, M.D.; Platnick, S.; Menzel, W.P.; Ackerman, S.A.; Hubanks, P.A. Spatial and Temporal Distribution of Clouds Observed by MODIS Onboard the Terra and Aqua Satellites. IEEE Trans. Geosci. Remote Sens. 2013, 51, 3826–3852. [Google Scholar] [CrossRef]
Figure 1. The location of the study area, coverage of satellite data, ground-based AERONET sites and the spatial distribution of land use cover types (the map of China is based on drawing review No. GS (2016) 1603 supervised by the Ministry of Natural Resources of the People’s Republic of China).
Remotesensing 13 04140 g001
Figure 2. Overview of the fusing AOD retrieval algorithm for the Landsat-8 and Sentinel-2 images.
Remotesensing 13 04140 g002
Figure 3. Example of constructing LSR from a BVA pixel over AERONET Beijing site as a function of solar and view geometry using LaSRC surface reflectance at (a) 0.47 and (b) 0.66 μm. The red curve is the polynomial fit through the black symbols.
Remotesensing 13 04140 g003
Figure 4. Variation in the surface reflectance in each month for blue (a) and red (b) bands corresponding to NDVI; the black circle and black line represent the average minimum 20% to 50% of LSR in each month and the trend for each month over the mixed pixels.
Remotesensing 13 04140 g004
Figure 5. The validation of the AOD retrievals for (a) all three sensors, (b) Landsat-8, and (c) Sentinel-2 A/B. The solid black lines are a 1:1 line, the solid red lines are regression lines, and the dotted black lines are expected error (EE) lines, defined as ±(0.05 + 0.2 × AODsunphotometer).
Remotesensing 13 04140 g005
Figure 6. Comparison of the AODs over (ac) sparsely vegetated areas (SVA) and (df) barely non-vegetated areas (BVA) for Landsat-8 and Sentinel-2 against AERONET AOD measurements.
Remotesensing 13 04140 g006
Figure 7. Comparison of the (ac) retrieved AOD with (d) MOD04 DB&DT AOD, (e) LaSRC AOD and (f) SEN2COR AOD products.
Remotesensing 13 04140 g007
Figure 8. Comparison of the AOD retrievals for Landsat-8 and Sentinel-2B on 4 December 2018.
Remotesensing 13 04140 g008
Figure 9. Percentage of mean potential revisit cycles over globe land for (a) Landsat-8, (b) Sentinel-2A, (c) Sentinel-2A/B and (d) their configurations.
Remotesensing 13 04140 g009
Figure 10. Percentage of potential swath coverage over globe land for Landsat-8, Sentinel-2A, Sentinel-2B and their configurations.
Remotesensing 13 04140 g010
Figure 11. Color composite image (red-green-blue) of Landsat-8 and Sentinel-2, and corresponding spatial distribution of (a,e) retrieved AOD in 30 m (b,f), MCD19A2 AOD in 1 km (c,g) MOD04_L2 DB & DT AOD in 10 km (d,h).
Remotesensing 13 04140 g011
Table 1. Detailed parameter comparison of the OLI and MSI spatial bands.
Sentinel-2A/B MSILandsat-8 OLI
BandResolution (m)WaveLength Range (nm)BandResolution (m)Wavelength Range (nm)
B2(Blue)10458–523B230452–512
B3(Green)10543–578B330533–590
B4(Red)10650–680B430636–673
B8A(NIR)10855–875B530851–879
B11(SWIR1)201565–1655B6301566–1651
B12(SWIR2)202100–2280B7302107–2294
Publisher’s Note: MDPI stays neutral with regard to jurisdictional claims in published maps and institutional affiliations.

