
Ambiguous Agricultural Drought: Characterising Soil Moisture and Vegetation Droughts in Europe from Earth Observation


Abstract
:1. Introduction
2. Data and Methods
2.1. Data
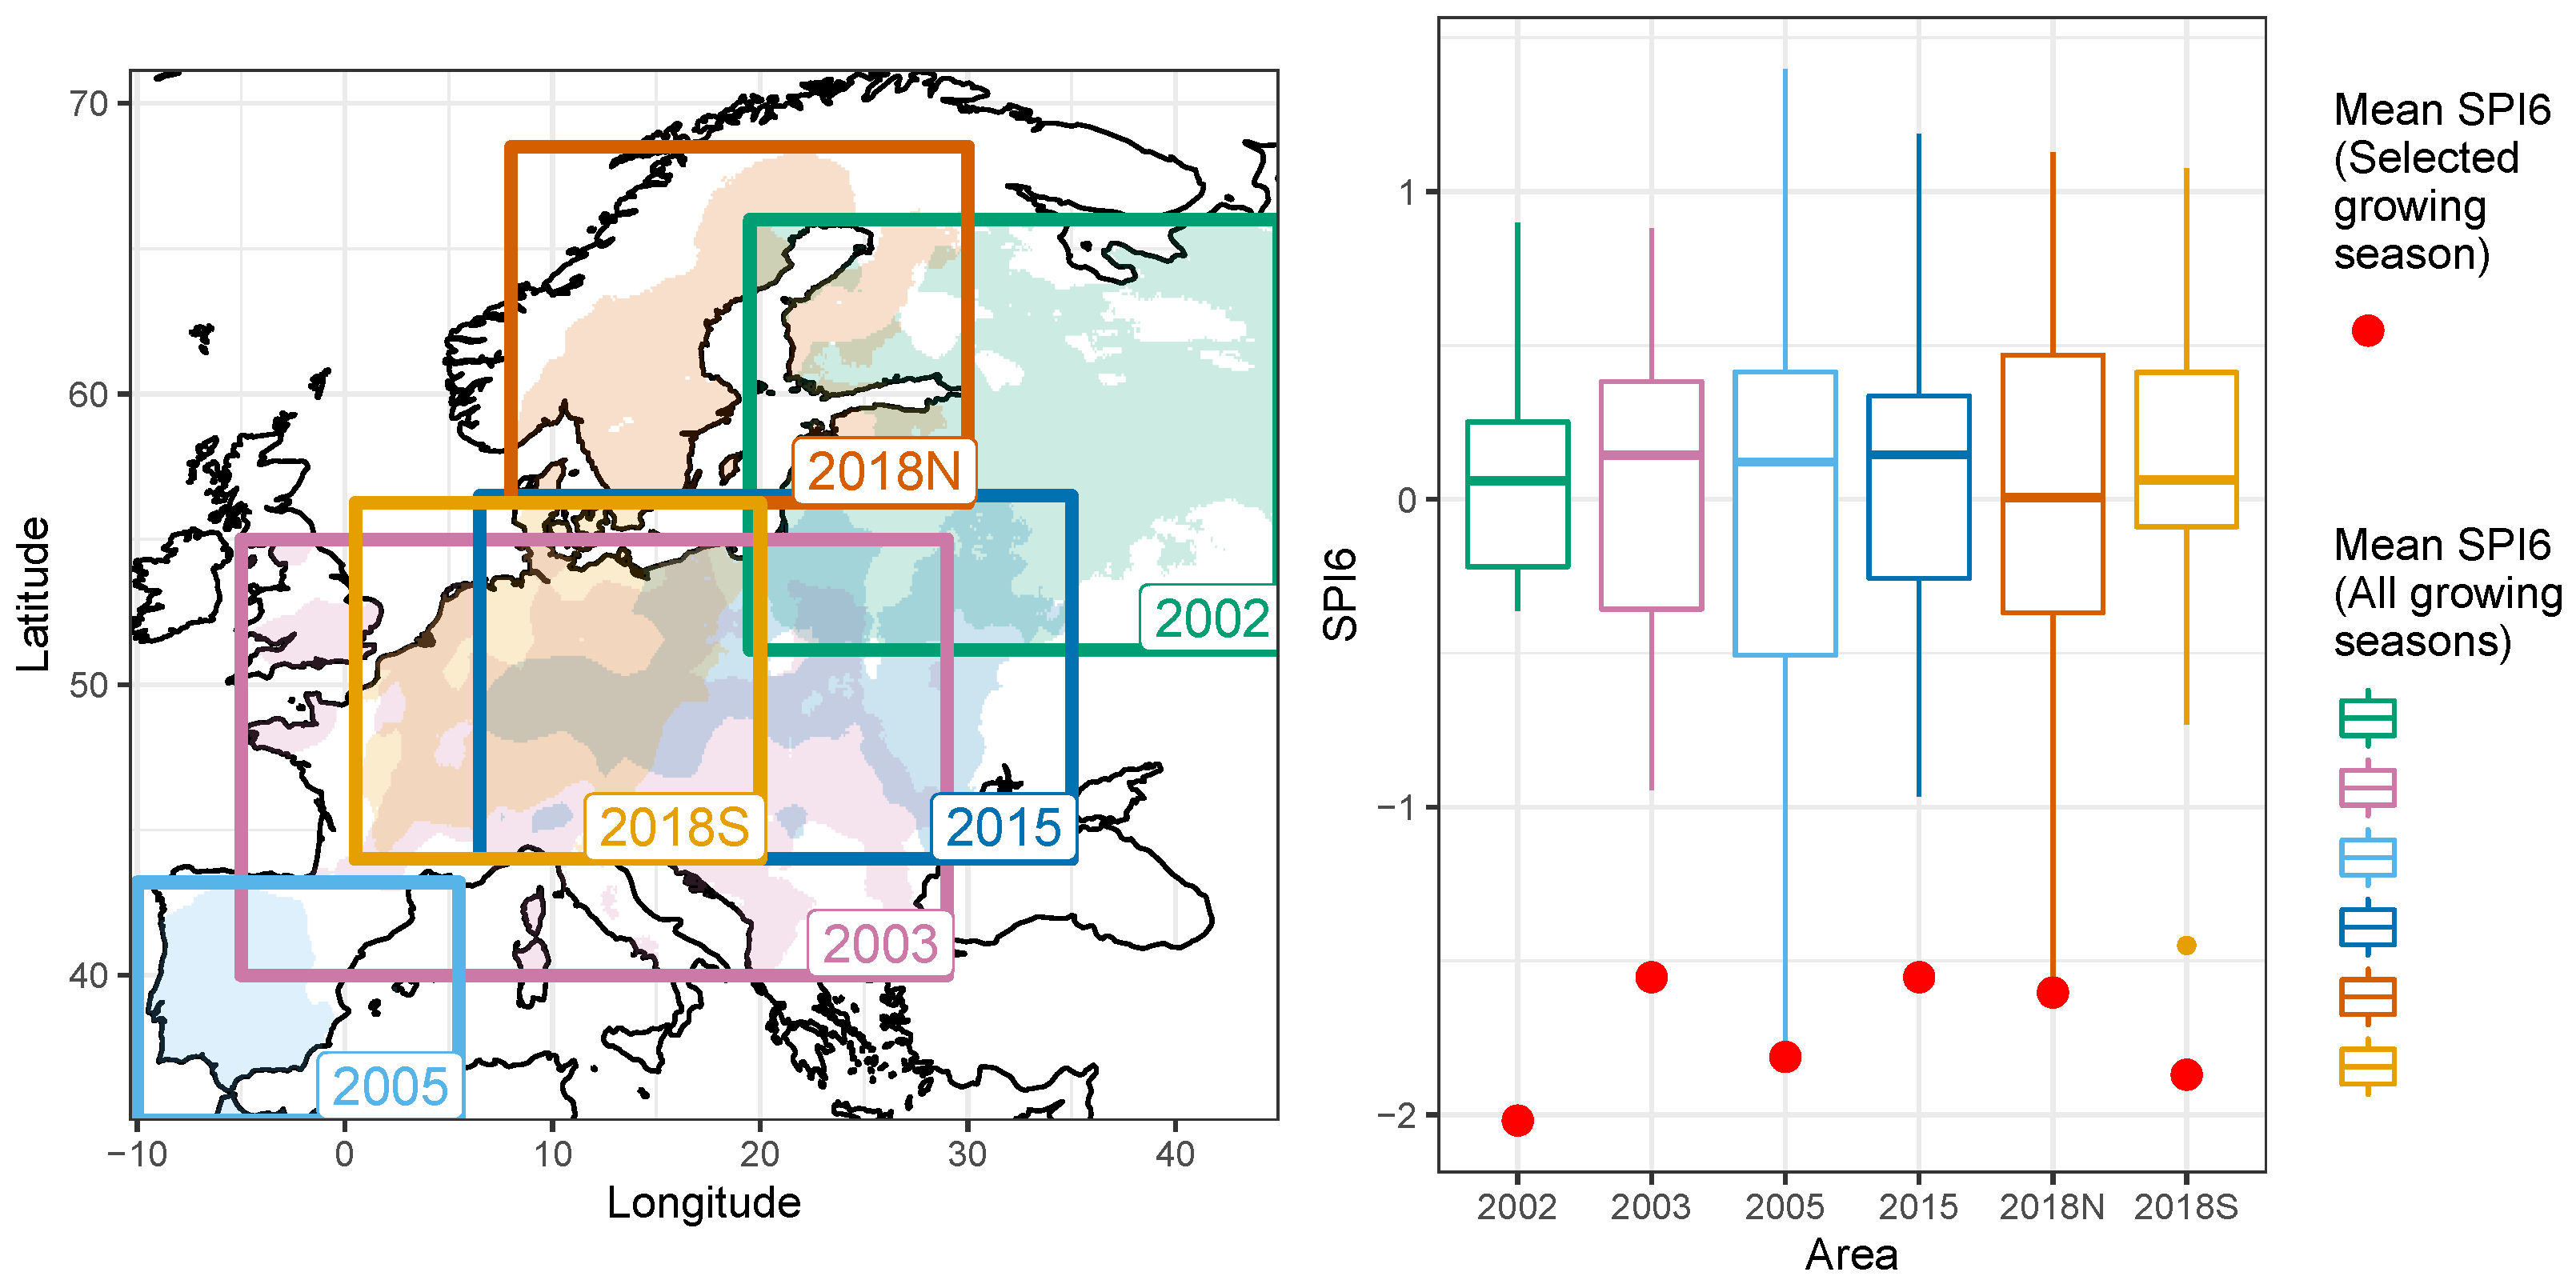
2.2. Drought Event Selection
2.3. Analysis
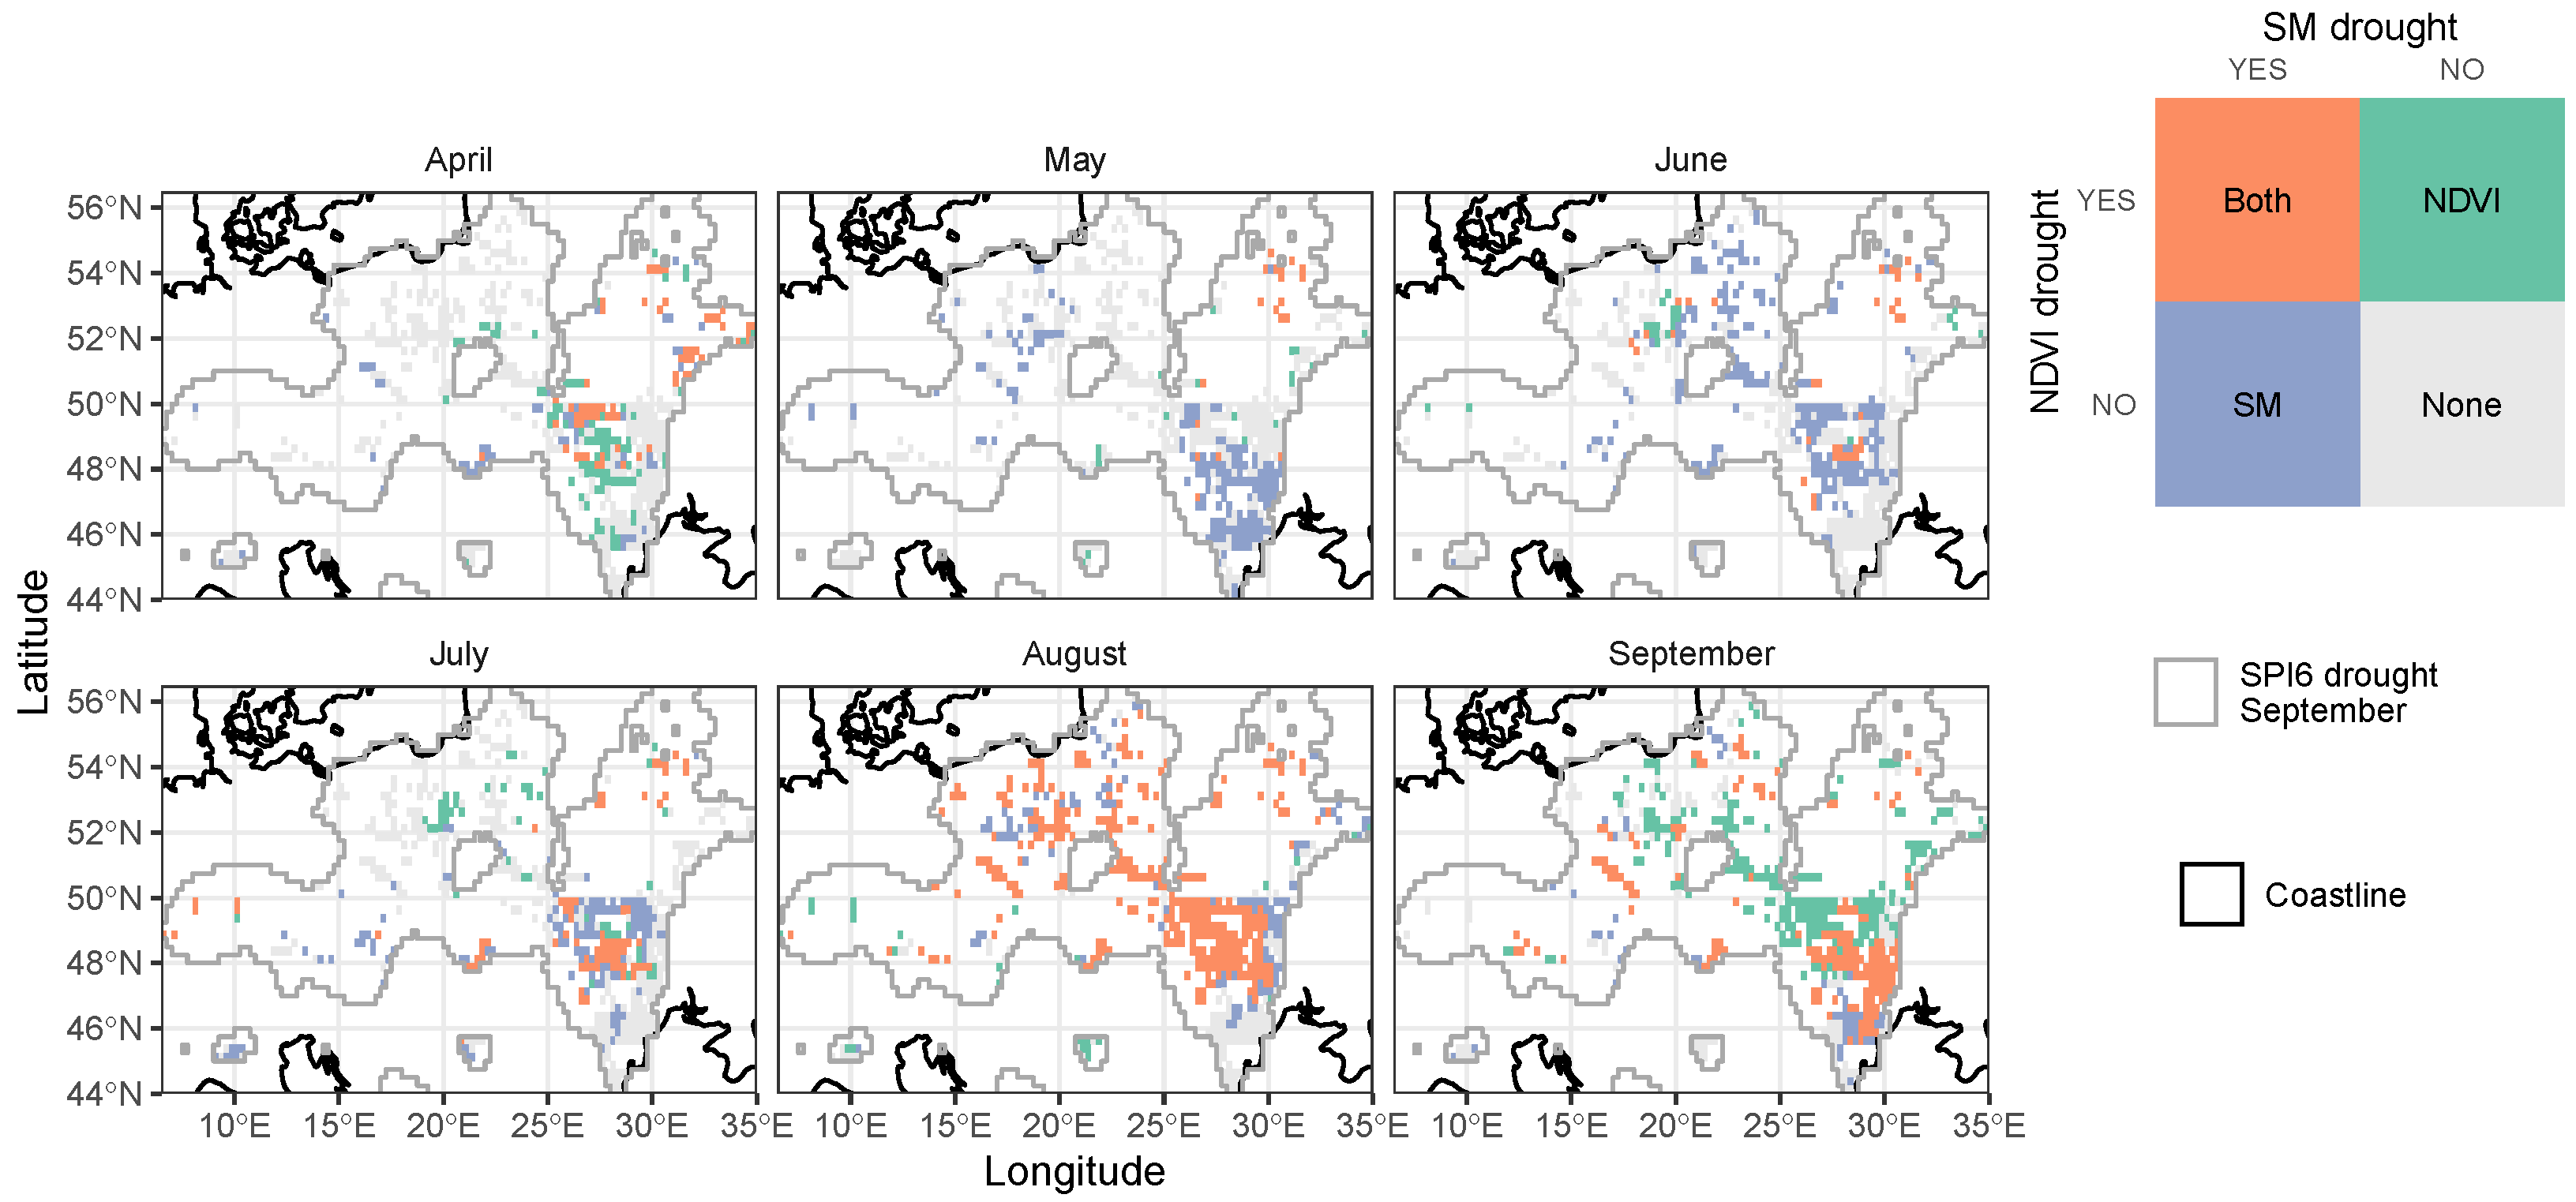
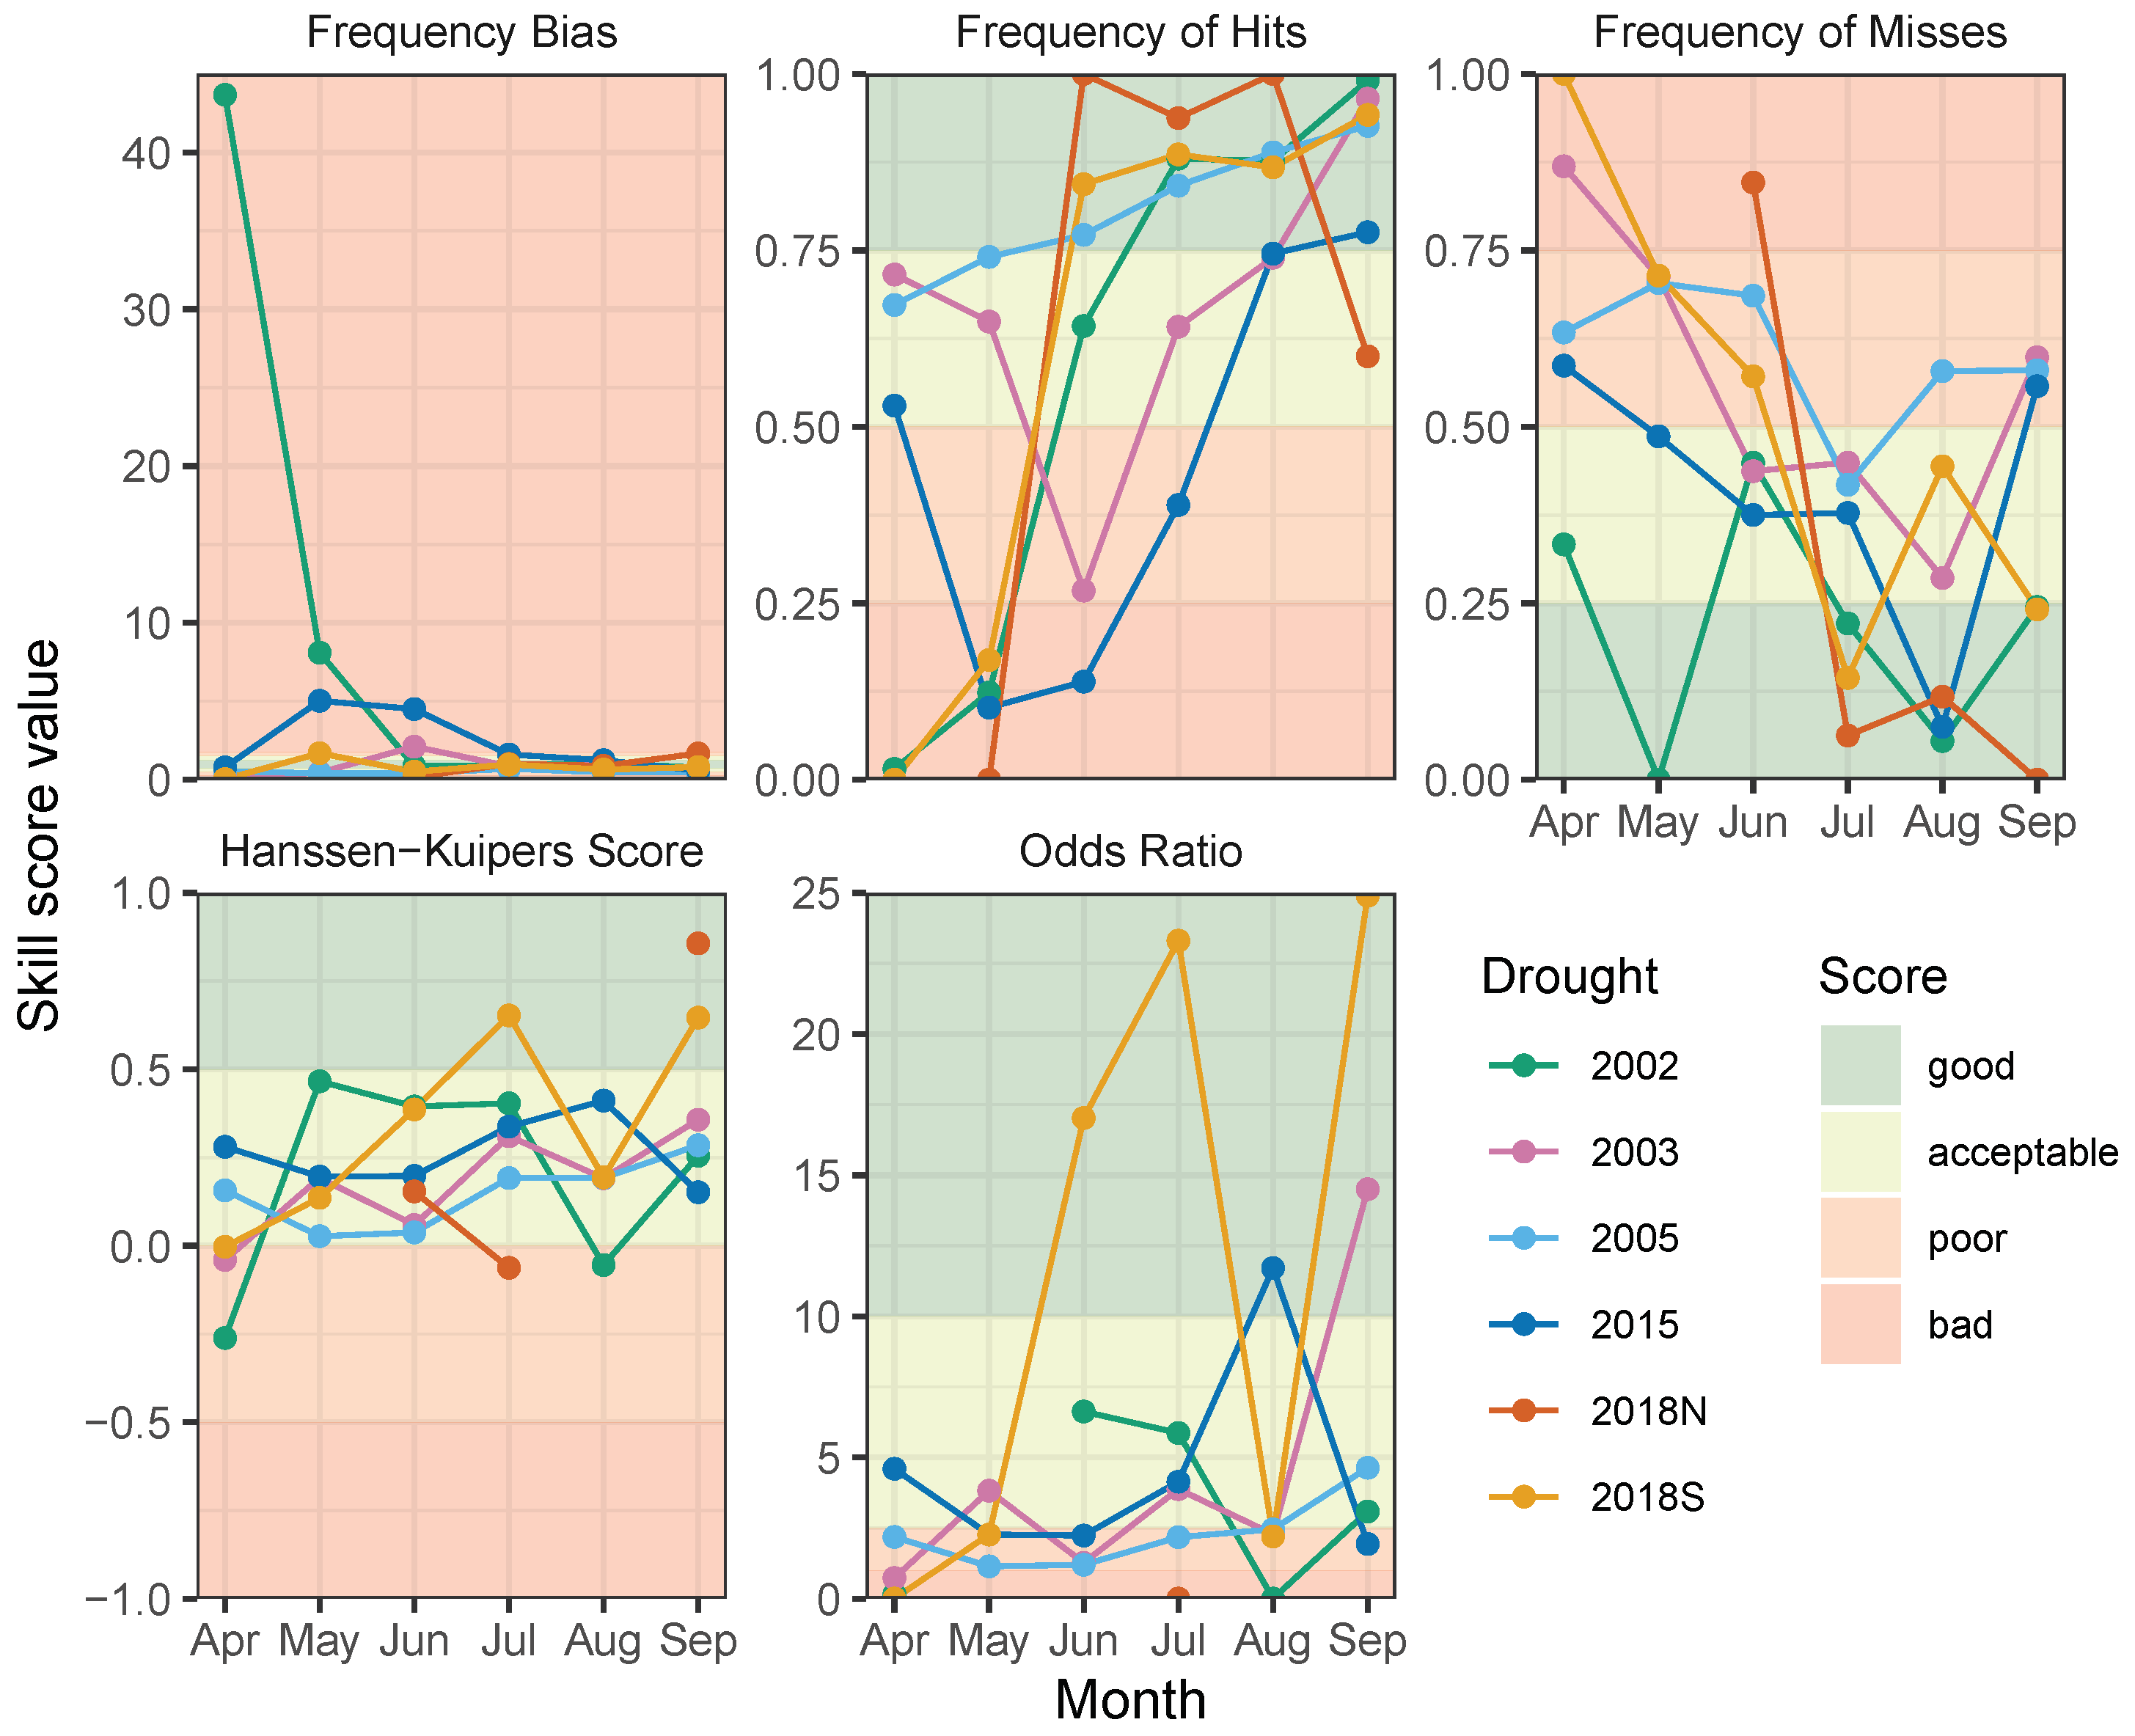
3. Results
4. Discussion
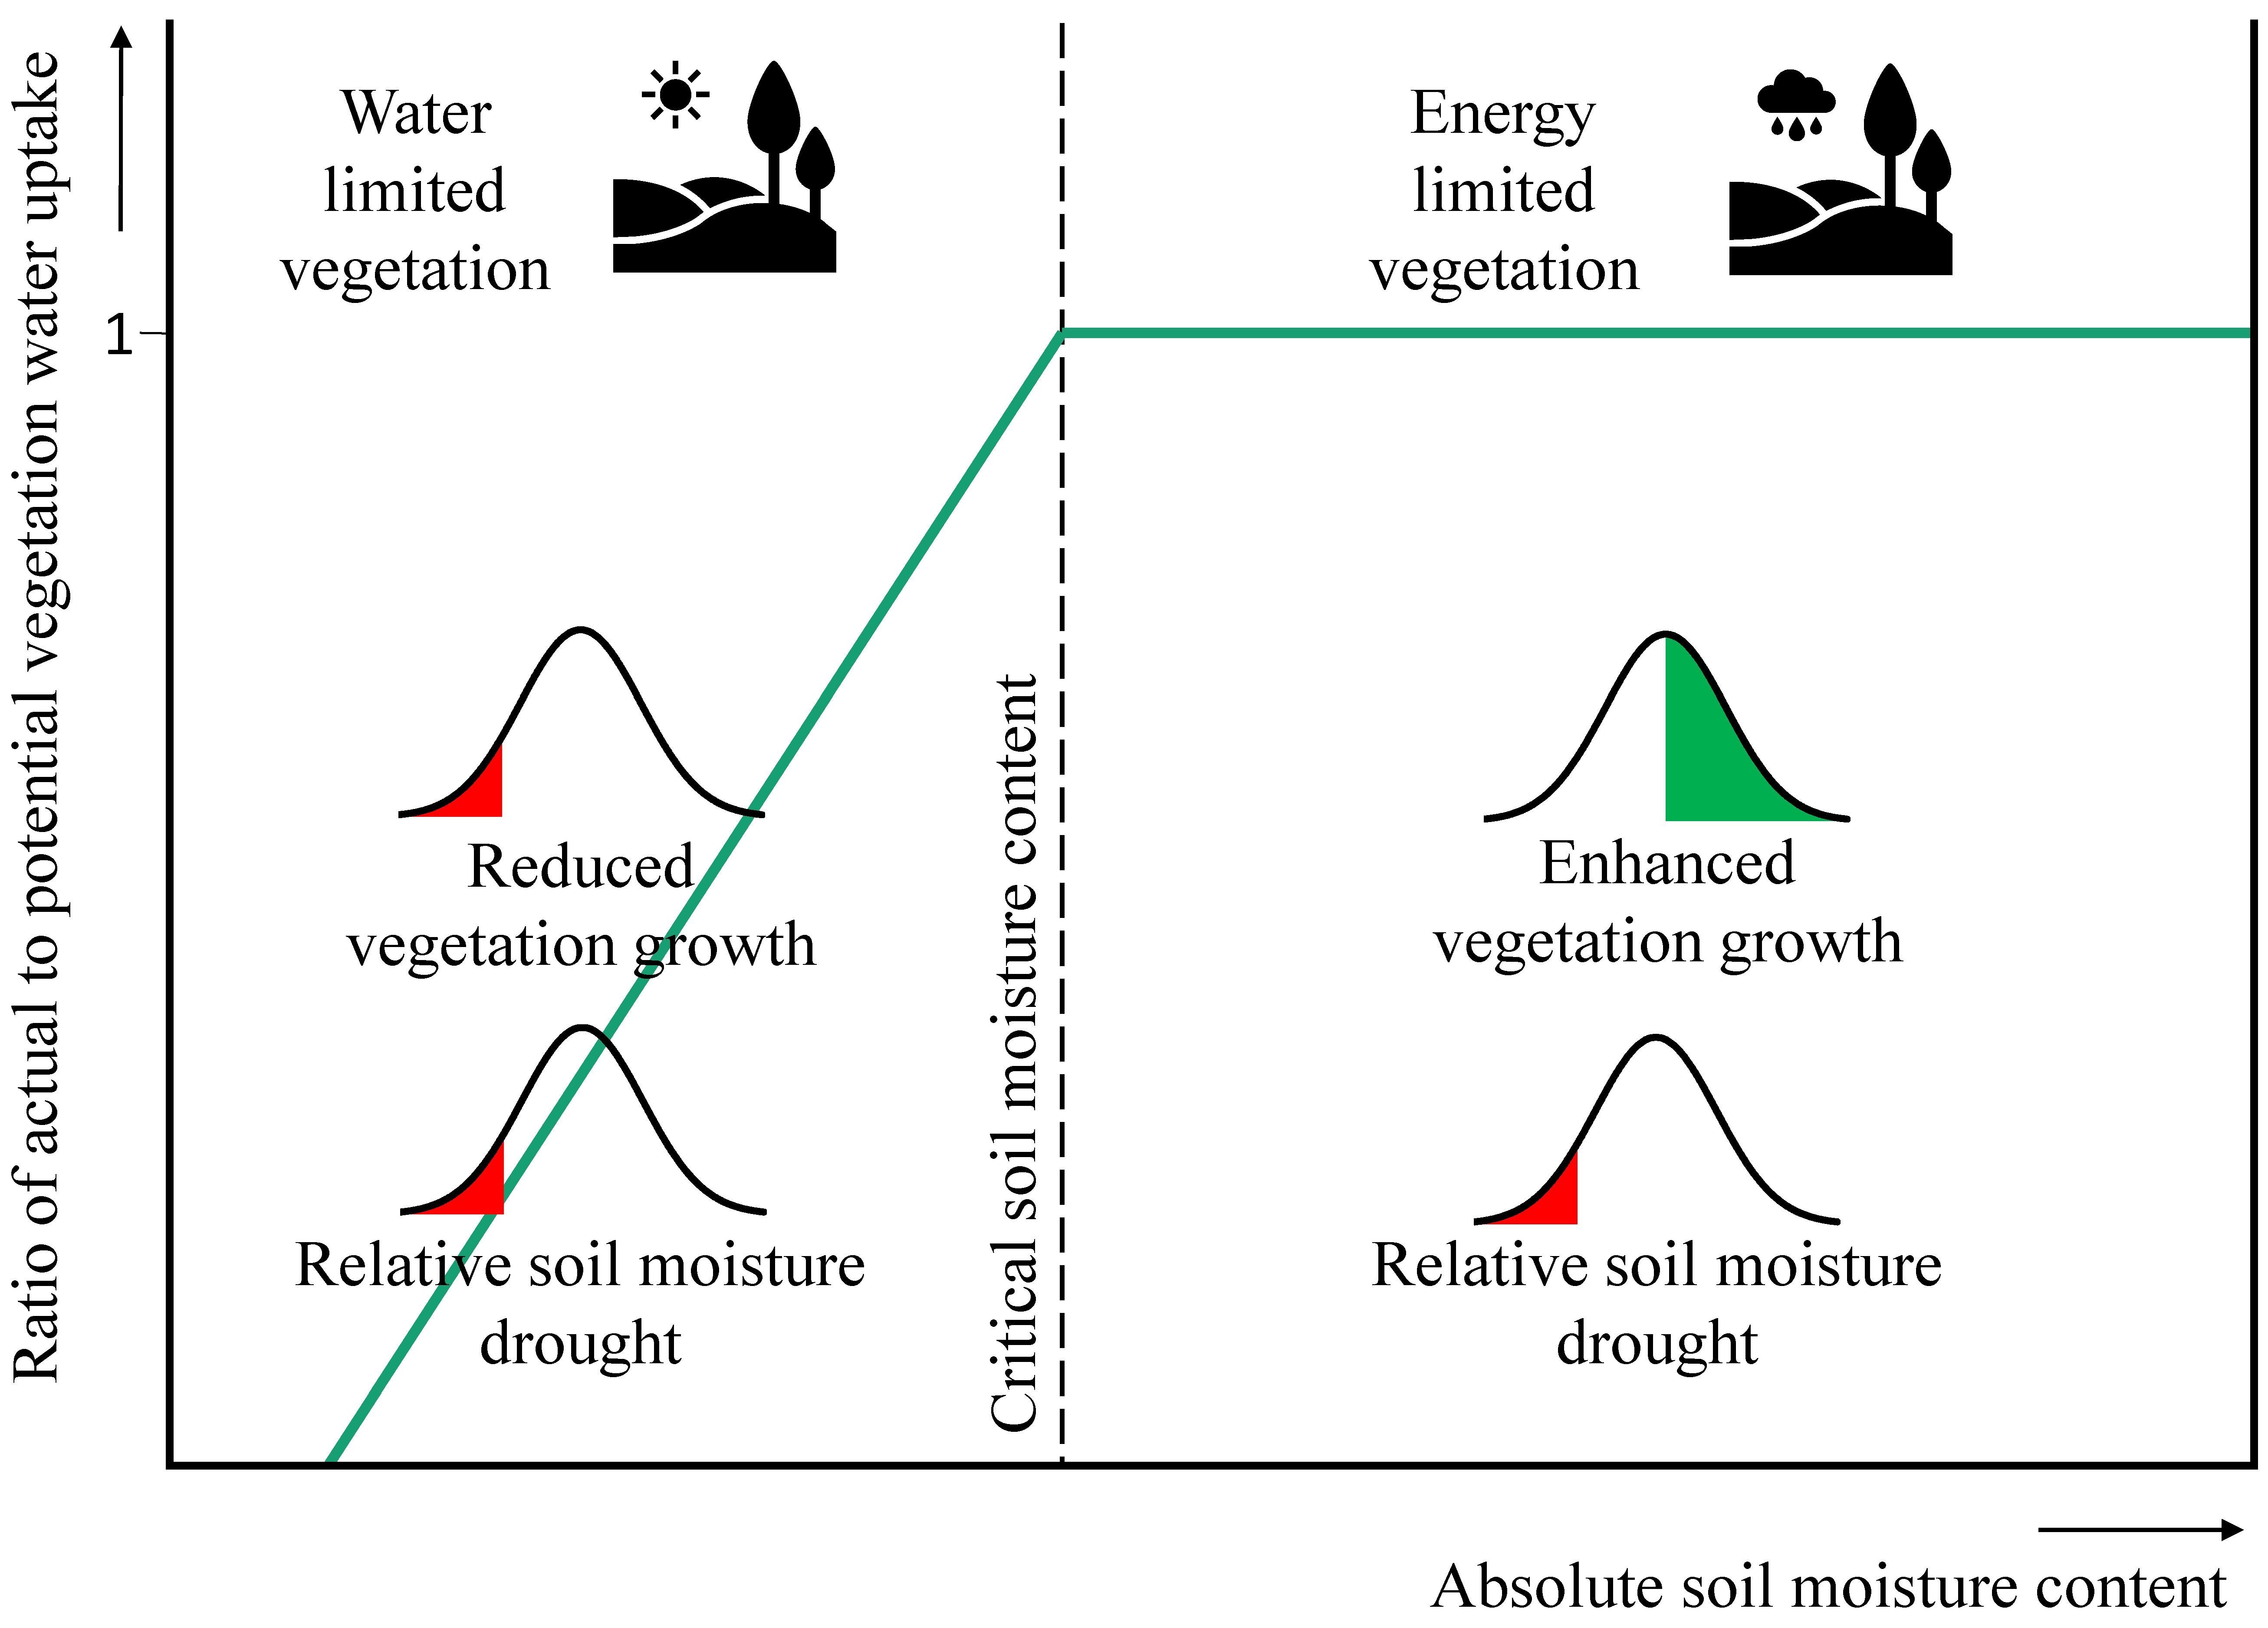
4.1. Soil Moisture Regimes
4.2. Data Sets
4.3. Separating Soil Moisture and Vegetation Droughts
5. Conclusions and Outlook
Supplementary Materials
Author Contributions
Funding
Data Availability Statement
Conflicts of Interest
Abbreviations
| AD | Agricultural Drought |
| CR | Correct Rejections |
| FA | False Alarms |
| FB | Frequency Bias |
| FOH | Frequency of Hits |
| FOM | Frequency of Misses |
| H | Hits |
| HK | Hanssen–Kuipers score |
| M | Misses |
| NDVI (A) | Normalized Difference Vegetation Index (Anomaly) |
| OR | Odds Ratio |
| SM (A) | Soil Moisture (Anomaly) |
| SPI | Standardized Precipitation Index |
References
- Rasmijn, L.M.; van der Schrier, G.; Bintanja, R.; Barkmeijer, J.; Sterl, A.; Hazeleger, W. Future equivalent of 2010 Russian heatwave intensified by weakening soil moisture constraints. Nat. Clim. Chang. 2018, 8, 381–385. [Google Scholar] [CrossRef]
- Samaniego, L.; Thober, S.; Kumar, R.; Wanders, N.; Rakovec, O.; Pan, M.; Zink, M.; Sheffield, J.; Wood, E.F.; Marx, A. Anthropogenic warming exacerbates European soil moisture droughts. Nat. Clim. Chang. 2018, 8, 421–426. [Google Scholar] [CrossRef]
- Teuling, A.J. A hot future for European droughts. Nat. Clim. Chang. 2018, 8, 364–365. [Google Scholar] [CrossRef]
- Hayes, M.; Svoboda, M.; Wall, N.; Widhalm, M. The Lincoln Declaration on Drought Indices: Universal Meteorological Drought Index Recommended. Bull. Am. Meteorol. Soc. 2011, 92, 485–488. [Google Scholar] [CrossRef] [Green Version]
- Tallaksen, L.M.; van Lanen, H.A.J. (Eds.) Hydrological Drought, 1st ed.; Developments in Water Science; Elsevier: Amsterdam, The Netherlands, 2004; Volume 84. [Google Scholar]
- McKee, T.B.; Doesken, N.J.; Kleist, J. The relationship of drought frequency and duration to time scales. In Proceedings of the Eighth Conference on Applied Climatology, Anaheim, CA, USA, 17–22 January 1993. [Google Scholar]
- Kumar, R.; Musuuza, J.L.; Van Loon, A.F.; Teuling, A.J.; Barthel, R.; Ten Broek, J.; Mai, J.; Samaniego, L.; Attinger, S. Multiscale evaluation of the Standardized Precipitation Index as a groundwater drought indicator. Hydrol. Earth Syst. Sci. 2016, 20, 1117–1131. [Google Scholar] [CrossRef] [Green Version]
- Seneviratne, S.I.; Nicholls, N.; Easterling, D.; Goodess, C.M.; Kanae, S.; Kossin, J.; Luo, Y.; Marengo, J.; McInnes, K.; Rahimi, M.; et al. Changes in Climate Extremes and their Impacts on the Natural Physical Environment. In Managing the Risks of Extreme Events and Disasters to Advance Climate Change Adaptation; Field, C.B., Barros, V., Stocker, T.F., Dahe, Q., Eds.; Cambridge University Press: Cambridge, UK, 2012; pp. 109–230. [Google Scholar] [CrossRef] [Green Version]
- Shukla, S.; Wood, A.W. Use of a standardized runoff index for characterizing hydrologic drought. Geophys. Res. Lett. 2008, 35. [Google Scholar] [CrossRef] [Green Version]
- Wilhite, D.A.; Glantz, M.H. Understanding the Drought Phenomenon: The Role of Definitions. Water Int. 1985, 10, 111–120. [Google Scholar] [CrossRef] [Green Version]
- Panu, U.S.; Sharma, T.C. Challenges in drought research: Some perspectives and future directions. Hydrol. Sci. J. 2002, 47, S19–S30. [Google Scholar] [CrossRef] [Green Version]
- IPCC. Glossary of terms. In Managing the Risks of Extreme Events and Disasters to Advance Climate Change Adaptation: A Special Report of Working Groups I and II of the Intergovernmental Panel on Climate Change (IPCC); Field, C.B., Barros, V., Stocker, T.F., Qin, D., Dokken, D.J., Ebi, K.L., Mastrandrea, M.D., Mach, K.J., Plattner, G.K., Allen, S., et al., Eds.; Cambridge University Press: Cambridge, UK; New York, NY, USA, 2012; pp. 555–564. [Google Scholar]
- Sridhar, V.; Hubbard, K.G.; You, J.; Hunt, E.D. Development of the Soil Moisture Index to Quantify Agricultural Drought and Its “User Friendliness” in Severity-Area-Duration Assessment. J. Hydrometeorol. 2008, 9, 660–676. [Google Scholar] [CrossRef] [Green Version]
- Bolten, J.D.; Crow, W.T.; Zhan, X.; Jackson, T.J.; Reynolds, C.A. Evaluating the Utility of Remotely Sensed Soil Moisture Retrievals for Operational Agricultural Drought Monitoring. IEEE J. Sel. Top. Appl. Earth Obs. Remote Sens. 2010, 3, 57–66. [Google Scholar] [CrossRef] [Green Version]
- Carrão, H.; Russo, S.; Sepulcre-Canto, G.; Barbosa, P. An empirical standardized soil moisture index for agricultural drought assessment from remotely sensed data. Int. J. Appl. Earth Obs. Geoinf. 2016, 48, 74–84. [Google Scholar] [CrossRef]
- Martínez-Fernández, J.; González-Zamora, A.; Sánchez, N.; Gumuzzio, A.; Herrero-Jiménez, C.M. Satellite soil moisture for agricultural drought monitoring: Assessment of the SMOS derived Soil Water Deficit Index. Remote Sens. Environ. 2016, 177, 277–286. [Google Scholar] [CrossRef]
- Briffa, K.R.; Jones, P.D.; Hulme, M. Summer moisture variability across Europe, 1892–1991: An analysis based on the palmer drought severity index. Int. J. Climatol. 1994, 14, 475–506. [Google Scholar] [CrossRef]
- Raible, C.C.; Bärenbold, O.; Gómez-navarro, J.J. Drought indices revisited—Improving and testing of drought indices in a simulation of the last two millennia for Europe. Tellus A Dyn. Meteorol. Oceanogr. 2017, 69, 1287492. [Google Scholar] [CrossRef] [Green Version]
- Palmer, W.C. Meteorological Drought; U.S. Department of Commerce, Weather Bureau: Washington, DC, USA, 1965.
- Peled, E.; Dutra, E.; Viterbo, P.; Angert, A. Technical Note: Comparing and ranking soil drought indices performance over Europe, through remote-sensing of vegetation. Hydrol. Earth Syst. Sci. 2010, 14, 271–277. [Google Scholar] [CrossRef] [Green Version]
- Mozny, M.; Trnka, M.; Zalud, Z.; Hlavinka, P.; Nekovar, J.; Potop, V.; Virag, M. Use of a soil moisture network for drought monitoring in the Czech Republic. Theor. Appl. Climatol. 2012, 107, 99–111. [Google Scholar] [CrossRef]
- Crow, W.T.; Kumar, S.V.; Bolten, J.D. On the utility of land surface models for agricultural drought monitoring. Hydrol. Earth Syst. Sci. 2012, 16, 3451–3460. [Google Scholar] [CrossRef] [Green Version]
- Anyamba, A.; Tucker, C.J. Historical Perspectives on AVHRR NDVI and Vegetation Drought Monitoring. In Remote Sensing of Drought: Innovative Monitoring Approaches; Wardlow, B.D., Anderson, M.C., Verdin, J.P., Eds.; CRC Press: Boca Raton, FL, USA, 2012; pp. 23–49. [Google Scholar]
- Hu, X.; Ren, H.; Tansey, K.; Zheng, Y.; Ghent, D.; Liu, X.; Yan, L. Agricultural drought monitoring using European Space Agency Sentinel 3A land surface temperature and normalized difference vegetation index imageries. Agric. For. Meteorol. 2019, 279, 107707. [Google Scholar] [CrossRef]
- Buitink, J.; Swank, A.M.; van der Ploeg, M.; Smith, N.E.; Benninga, H.J.F.; van der Bolt, F.; Carranza, C.D.U.; Koren, G.; van der Velde, R.; Teuling, A.J. Anatomy of the 2018 agricultural drought in the Netherlands using in situ soil moisture and satellite vegetation indices. Hydrol. Earth Syst. Sci. 2020, 24, 6021–6031. [Google Scholar] [CrossRef]
- Narasimhan, B.; Srinivasan, R. Development and evaluation of Soil Moisture Deficit Index (SMDI) and Evapotranspiration Deficit Index (ETDI) for agricultural drought monitoring. Agric. For. Meteorol. 2005, 133, 69–88. [Google Scholar] [CrossRef]
- Cao, Y.; Chen, S.; Wang, L.; Zhu, B.; Lu, T.; Yu, Y. An Agricultural Drought Index for Assessing Droughts Using a Water Balance Method: A Case Study in Jilin Province, Northeast China. Remote Sens. 2019, 11, 1066. [Google Scholar] [CrossRef] [Green Version]
- Abbe, C. Drought. Mon. Weather Rev. 1894, 22, 323–324. [Google Scholar]
- Heim, R.R., Jr. A Review of Twentieth- Century Drought Indices Used in the United States. Bull. Am. Meteorol. Soc. 2002, 83, 1149–1166. [Google Scholar] [CrossRef] [Green Version]
- Yurekli, K.; Kurunc, A. Simulating agricultural drought periods based on daily rainfall and crop water consumption. J. Arid. Environ. 2006, 67, 629–640. [Google Scholar] [CrossRef]
- Sivakumar, M.V.K.; Stone, R.; Cesar Sentelhas, P.; Svoboda, M.; Omondi, P.; Sarkar, J.; Wardlow, B. Agricultural drought indices: Summary and Recommendations. In Agricultural Drought Indices, Proceedings of the an Expert Meeting, Murcia, Spain, 2–4 June 2010; Sivakumar, M.V.K., Motha, R.P., Wilhite, D.A., Wood, D.A., Eds.; WMO: Murcia, Spain, 2010; pp. 172–197. [Google Scholar]
- Sepulcre-Canto, G.; Horion, S.; Singleton, A.; Carrao, H.; Vogt, J. Development of a Combined Drought Indicator to detect agricultural drought in Europe. Nat. Hazards Earth Syst. Sci. 2012, 12, 3519–3531. [Google Scholar] [CrossRef] [Green Version]
- Denissen, J.M.C.; Teuling, A.J.; Reichstein, M.; Orth, R. Critical Soil Moisture Derived From Satellite Observations Over Europe. J. Geophys. Res. Atmos. 2020, 125. [Google Scholar] [CrossRef] [Green Version]
- Seneviratne, S.I.; Corti, T.; Davin, E.L.; Hirschi, M.; Jaeger, E.B.; Lehner, I.; Orlowsky, B.; Teuling, A.J. Investigating soil moisture–climate interactions in a changing climate: A review. Earth Sci. Rev. 2010, 99, 125–161. [Google Scholar] [CrossRef]
- Teuling, A.J.; Loon, A.F.V.; Seneviratne, S.I.; Lehner, I.; Aubinet, M.; Heinesch, B.; Bernhofer, C.; Grünwald, T.; Prasse, H.; Spank, U. Evapotranspiration amplifies European summer drought. Geophys. Res. Lett. 2013, 40, 2071–2075. [Google Scholar] [CrossRef]
- Jolly, W.M.; Dobbertin, M.; Zimmermann, N.E.; Reichstein, M. Divergent vegetation growth responses to the 2003 heat wave in the Swiss Alps. Geophys. Res. Lett. 2005, 32. [Google Scholar] [CrossRef] [Green Version]
- Teuling, A.J.; Uijlenhoet, R.; Hupet, F.; Troch, P.A. Impact of plant water uptake strategy on soil moisture and evapotranspiration dynamics during drydown. Geophys. Res. Lett. 2006, 33. [Google Scholar] [CrossRef] [Green Version]
- Mastrotheodoros, T.; Pappas, C.; Molnar, P.; Burlando, P.; Manoli, G.; Parajka, J.; Rigon, R.; Szeles, B.; Bottazzi, M.; Hadjidoukas, P.; et al. More green and less blue water in the Alps during warmer summers. Nat. Clim. Chang. 2020, 10, 155–161. [Google Scholar] [CrossRef]
- Kowalska, N.; Šigut, L.; Stojanović, M.; Fischer, M.; Kyselova, I.; Pavelka, M. Analysis of floodplain forest sensitivity to drought. Philos. Trans. R. Soc. B Biol. Sci. 2020, 375, 20190518. [Google Scholar] [CrossRef]
- Zscheischler, J.; Orth, R.; Seneviratne, S.I. A submonthly database for detecting changes in vegetation-atmosphere coupling. Geophys. Res. Lett. 2015, 42, 9816–9824. [Google Scholar] [CrossRef] [Green Version]
- Chen, T.; de Jeu, R.; Liu, Y.; van der Werf, G.; Dolman, A. Using satellite based soil moisture to quantify the water driven variability in NDVI: A case study over mainland Australia. Remote Sens. Environ. 2014, 140, 330–338. [Google Scholar] [CrossRef]
- Nicolai-Shaw, N.; Zscheischler, J.; Hirschi, M.; Gudmundsson, L.; Seneviratne, S.I. A drought event composite analysis using satellite remote-sensing based soil moisture. Remote Sens. Environ. 2017, 203, 216–225. [Google Scholar] [CrossRef]
- Papagiannopoulou, C.; Miralles, D.G.; Dorigo, W.A.; Verhoest, N.E.C.; Depoorter, M.; Waegeman, W. Vegetation anomalies caused by antecedent precipitation in most of the world. Environ. Res. Lett. 2017, 12, 074016. [Google Scholar] [CrossRef]
- Szczypta, C.; Calvet, J.C.; Maignan, F.; Dorigo, W.; Baret, F.; Ciais, P. Suitability of modelled and remotely sensed essential climate variables for monitoring Euro-Mediterranean droughts. Geosci. Model Devt. 2014, 7, 931–946. [Google Scholar] [CrossRef] [Green Version]
- van Loon, A.F. Hydrological drought explained. WIREs Water 2015, 2, 359–392. [Google Scholar] [CrossRef]
- Hao, Z.; AghaKouchak, A. Multivariate Standardized Drought Index: A parametric multi-index model. Adv. Water Resour. 2013, 57, 12–18. [Google Scholar] [CrossRef] [Green Version]
- Chakrabarti, S.; Bongiovanni, T.; Judge, J.; Zotarelli, L.; Bayer, C. Assimilation of SMOS Soil Moisture for Quantifying Drought Impacts on Crop Yield in Agricultural Regions. IEEE J. Sel. Top. Appl. Earth Obs. Remote Sens. 2014, 7, 3867–3879. [Google Scholar] [CrossRef]
- Martínez-Fernández, J.; González-Zamora, A.; Sánchez, N.; Gumuzzio, A. A soil water based index as a suitable agricultural drought indicator. J. Hydrol. 2015, 522, 265–273. [Google Scholar] [CrossRef]
- Gruber, A.; Dorigo, W.A.; Crow, W.; Wagner, W. Triple Collocation-Based Merging of Satellite Soil Moisture Retrievals. IEEE Trans. Geosci. Remote Sens. 2017, 55, 6780–6792. [Google Scholar] [CrossRef]
- Dorigo, W.; Wagner, W.; Albergel, C.; Albrecht, F.; Balsamo, G.; Brocca, L.; Chung, D.; Ertl, M.; Forkel, M.; Gruber, A.; et al. ESA CCI Soil Moisture for improved Earth system understanding: State-of-the art and future directions. Remote Sens. Environ. 2017, 203, 185–215. [Google Scholar] [CrossRef]
- Gruber, A.; Scanlon, T.; Schalie, R.v.d.; Wagner, W.; Dorigo, W. Evolution of the ESA CCI Soil Moisture climate data records and their underlying merging methodology. Earth Syst. Sci. Data 2019, 11, 717–739. [Google Scholar] [CrossRef] [Green Version]
- Scanlon, T.; Pasik, A.; Dorigo, W.; De Jeu, R.A.M.; Hahn, S.; van der Schalie, R.; Wagner, W.; Kidd, R.; Gruber, A.; Moesinger, L.; et al. ESA Climate Change Initiative Plus-Soil Moisture: Algorithm Theoretical Baseline Document (ATBD); Technical Report D2.1 Version 04.7; Earth Observation Data Centre for Water Resources Monitoring (EODC) GmbH: Vienna, Austria, 2020. [Google Scholar]
- van der Vliet, M.; van der Schalie, R.; Rodriguez-Fernandez, N.; Colliander, A.; de Jeu, R.; Preimesberger, W.; Scanlon, T.; Dorigo, W. Reconciling Flagging Strategies for Multi-Sensor Satellite Soil Moisture Climate Data Records. Remote Sens. 2020, 12, 3439. [Google Scholar] [CrossRef]
- Crow, W.; Tobin, K. GES DISC Dataset: Smerge-Noah-CCI Root Zone Soil Moisture 0–40 cm L4 Daily 0.125 × 0.125 Degree V2.0 (SMERGE_RZSM0_40CM 2.0). 2018. Available online: https://disc.gsfc.nasa.gov/datasets/SMERGE_RZSM0_40CM_2.0/summary (accessed on 29 September 2020).
- Beaudoing, H.; Rodell, M.; Getirana, A.; Li, B. Groundwater and Soil Moisture Conditions from GRACE Data Assimilation L4 7-Days 0.125 × 0.125 Degree V2.0. 2017. Available online: https://disc.sci.gsfc.nasa.gov/datasets/GRACEDADM_CLSM0125US_7D_2.0/summary (accessed on 29 September 2020). [CrossRef]
- Houborg, R.; Rodell, M.; Li, B.; Reichle, R.; Zaitchik, B. Drought indicators based on model assimilated GRACE terrestrial water storage observations. Water Resour. Res. 2012, 48. [Google Scholar] [CrossRef] [Green Version]
- Owe, M.; De Jeu, R.A.M.; Holmes, T. Multisensor historical climatology of satellite-derived global land surface moisture. J. Geophys. Res. 2008, F01002. [Google Scholar] [CrossRef]
- Crow, W. AMSR-E/Aqua Root Zone Soil Moisture (LPRM) L3 1 Day 25 km × 25 km Descending and 2-Layer Palmer Water Balance Model V001. 2012. Available online: https://disc.gsfc.nasa.gov/datacollection/LPRM_AMSRE_D_RZSM3_001.html (accessed on 29 September 2020).
- Bauer-Marschallinger, B.; Paulik, C.; Hochstöger, S.; Mistelbauer, T.; Modanesi, S.; Ciabatta, L.; Massari, C.; Brocca, L.; Wagner, W. Soil Moisture from Fusion of Scatterometer and SAR: Closing the Scale Gap with Temporal Filtering. Remote Sens. 2018, 10, 1030. [Google Scholar] [CrossRef] [Green Version]
- Beck, H.E.; Pan, M.; Miralles, D.G.; Reichle, R.H.; Dorigo, W.A.; Hahn, S.; Sheffield, J.; Karthikeyan, L.; Balsamo, G.; Parinussa, R.M.; et al. Evaluation of 18 satellite- and model-based soil moisture products using in situ measurements from 826 sensors. Hydrol. Earth Syst. Sci. 2021, 25, 17–40. [Google Scholar] [CrossRef]
- Huffman, G.J.; Stocker, E.F.; Bolvin, D.T.; Nelkin, E.J.; Tan, J. GES DISC Dataset: GPM IMERG Final Precipitation L3 1 month 0.1 Degree × 0.1 Degree V06 (GPM_3IMERGM 06). 2019. Available online: https://disc.gsfc.nasa.gov/datasets/GPM_3IMERGM_06/summary (accessed on 18 March 2021). [CrossRef]
- Huffman, G.J.; Bolvin, D.T.; Braithwaite, D.; Hsu, K.; Joyce, R.; Kidd, C.; Nelkin, E.J.; Sorooshian, S.; Tan, J.; Xie, P. Algorithm Theoretical Basis Document (ATBD) Version 06 NASA Global Precipitation Measurement (GPM) Integrated Multi-satellitE Retrievals for GPM (IMERG); Technical Report; National Aeronautics and Space Administration (NASA): Greenbelt, MD, USA, 2020. [Google Scholar]
- Tucker, C.J. Red and photographic infrared linear combinations for monitoring vegetation. Remote Sens. Environ. 1979, 8, 127–150. [Google Scholar] [CrossRef] [Green Version]
- Didan, K. MOD13C2 MODIS/Terra Vegetation Indices Monthly L3 Global 0.05Deg CMG V006 [Data Set]. 2015. Available online: https://lpdaac.usgs.gov/products/mod13c2v006/ (accessed on 16 July 2020). [CrossRef]
- Ji, L.; Peters, A.J. Assessing vegetation response to drought in the northern Great Plains using vegetation and drought indices. Remote Sens. Environ. 2003, 87, 85–98. [Google Scholar] [CrossRef]
- ESA. Land Cover CCI Product User Guide Version 2; Technical Report; European Space Agency: Paris, France, 2017. [Google Scholar]
- Lahoz, W.; Blyverket, J.; Hamer, P. ESA Climate Change Initiative Phase II Soil Moisture—Product Validation and Intercomparison Report (PVIR) Revision 3; Technical Report 2.6; Earth Observation Data Centre for Water Resources Monitoring (EODC) GmbH: Vienna, Austria, 2018. [Google Scholar]
- Navarro, A.; García-Ortega, E.; Merino, A.; Sánchez, J.L.; Kummerow, C.; Tapiador, F.J. Assessment of IMERG Precipitation Estimates over Europe. Remote Sens. 2019, 11, 2470. [Google Scholar] [CrossRef] [Green Version]
- Lange, M.; Dechant, B.; Rebmann, C.; Vohland, M.; Cuntz, M.; Doktor, D. Validating MODIS and Sentinel-2 NDVI Products at a Temperate Deciduous Forest Site Using Two Independent Ground-Based Sensors. Sensors 2017, 17, 1855. [Google Scholar] [CrossRef] [PubMed] [Green Version]
- Reinhart, V.; Fonte, C.C.; Hoffmann, P.; Bechtel, B.; Rechid, D.; Boehner, J. Comparison of ESA climate change initiative land cover to CORINE land cover over Eastern Europe and the Baltic States from a regional climate modeling perspective. Int. J. Appl. Earth Obs. Geoinf. 2021, 94, 102221. [Google Scholar] [CrossRef]
- Lloyd-Hughes, B.; Saunders, M.A. A drought climatology for Europe. Int. J. Climatol. 2002, 22, 1571–1592. [Google Scholar] [CrossRef]
- Rimkus, E.; Stonevicius, E.; Kilpys, J.; Maciulyte, V.; Valiukas, D. Drought identification in the eastern Baltic region using NDVI. Earth Syst. Dyn. 2017, 8, 627–637. [Google Scholar] [CrossRef] [Green Version]
- Ionita, M.; Tallaksen, L.; Kingston, D.; Stagge, J.; Laaha, G.; Van Lanen, H.; Scholz, P.; Chelcea, S.; Haslinger, K. The European 2015 drought from a climatological perspective. Hydrol. Earth Syst. Sci. 2017, 21, 1397–1419. [Google Scholar] [CrossRef] [Green Version]
- Hanel, M.; Rakovec, O.; Markonis, Y.; Máca, P.; Samaniego, L.; Kyselý, J.; Kumar, R. Revisiting the recent European droughts from a long-term perspective. Sci. Rep. 2018, 8, 9499. [Google Scholar] [CrossRef]
- Buras, A.; Rammig, A.; Zang, C.S. Quantifying impacts of the 2018 drought on European ecosystems in comparison to 2003. Biogeosciences 2020, 17, 1655–1672. [Google Scholar] [CrossRef] [Green Version]
- Kogan, F.N. Remote sensing of weather impacts on vegetation in non-homogeneous areas. Int. J. Remote Sens. 1990, 11, 1405–1419. [Google Scholar] [CrossRef]
- Brier, G.W.; Allen, R.A. Verification of Weather Forecasts. In Compendium of Meteorology: Prepared under the Direction of the Committee on the Compendium of Meteorology; Byers, H.R., Landsberg, H.E., Wexler, H., Haurwitz, B., Spilhaus, A.F., Willett, H.C., Houghton, H.G., Malone, T.F., Eds.; American Meteorological Society: Boston, MA, USA, 1951; pp. 841–848. [Google Scholar] [CrossRef]
- Murphy, A.H.; Epstein, E.S. Skill Scores and Correlation Coefficients in Model Verification. Mon. Weather Rev. 1989, 117, 572–582. [Google Scholar] [CrossRef] [Green Version]
- Hanssen, A.W.; Kuipers, W.J.A. On the Relationship between the Frequency of Rain and Various Meteorological Parameters; Technical Report 81; Koninklijk Nederlands Meteorologisch Instituut: De Bilt, The Netherlands, 1965. [Google Scholar]
- Stephenson, D.B. Use of the “Odds Ratio” for Diagnosing Forecast Skill. Weather Forecast. 2000, 15, 221–232. [Google Scholar] [CrossRef]
- Hogan, R.J.; Mason, I.B. Deterministic forecasts of binary events. In Forecast Verification: A Practitioner’s Guide in Atmospheric Science, 2nd ed.; Joliffe, I.T., Stephenson, D.B., Eds.; John Wiley & Sons, Ltd.: Hoboken, NJ, USA, 2011. [Google Scholar]
- Buitink, J.; Uijlenhoet, R.; Teuling, A.J. Evaluating seasonal hydrological extremes in mesoscale (pre-)Alpine basins at coarse 0.5∘ and fine hyperresolution. Hydrol. Earth Syst. Sci. 2019, 23, 1593–1609. [Google Scholar] [CrossRef] [Green Version]
- Teuling, A.J.; Uijlenhoet, R.; Troch, P.A. On bimodality in warm season soil moisture observations. Geophys. Res. Lett. 2005, 32. [Google Scholar] [CrossRef]
- Vilasa, L.; Miralles, D.G.; Jeu, R.A.M.d.; Dolman, A.J. Global soil moisture bimodality in satellite observations and climate models. J. Geophys. Res. Atmos. 2017, 122, 4299–4311. [Google Scholar] [CrossRef] [Green Version]
- WMO. WMO Guidelines on the Calculation of Climate Normals; Technical Report WMO-No. 1203; World Meteorological Organization: Geneva, Switzerland, 2017. [Google Scholar]
- Mittelbach, H.; Casini, F.; Lehner, I.; Teuling, A.J.; Seneviratne, S.I. Soil moisture monitoring for climate research: Evaluation of a low-cost sensor in the framework of the Swiss Soil Moisture Experiment (SwissSMEX) campaign. J. Geophys. Res. Atmos. 2011, 116. [Google Scholar] [CrossRef] [Green Version]


Publisher’s Note: MDPI stays neutral with regard to jurisdictional claims in published maps and institutional affiliations. |
© 2021 by the authors. Licensee MDPI, Basel, Switzerland. This article is an open access article distributed under the terms and conditions of the Creative Commons Attribution (CC BY) license (https://creativecommons.org/licenses/by/4.0/).
Share and Cite
van Hateren, T.C.; Chini, M.; Matgen, P.; Teuling, A.J. Ambiguous Agricultural Drought: Characterising Soil Moisture and Vegetation Droughts in Europe from Earth Observation. Remote Sens. 2021, 13, 1990. https://doi.org/10.3390/rs13101990
van Hateren TC, Chini M, Matgen P, Teuling AJ. Ambiguous Agricultural Drought: Characterising Soil Moisture and Vegetation Droughts in Europe from Earth Observation. Remote Sensing. 2021; 13(10):1990. https://doi.org/10.3390/rs13101990
Chicago/Turabian Stylevan Hateren, Theresa C., Marco Chini, Patrick Matgen, and Adriaan J. Teuling. 2021. "Ambiguous Agricultural Drought: Characterising Soil Moisture and Vegetation Droughts in Europe from Earth Observation" Remote Sensing 13, no. 10: 1990. https://doi.org/10.3390/rs13101990