
Effects of Drought on Vegetation Productivity of Farmland Ecosystems in the Drylands of Northern China


1
State Key Laboratory of Remote Sensing Science, Beijing Normal University and Institute of Remote Sensing and Digital Earth of Chinese Academy of Sciences, Beijing 100875, China
2
Key Laboratory of Environmental Change and Natural Disaster, Ministry of Education, Beijing Normal University, Beijing 100875, China
3
Faculty of Geographical Science, Institute of Remote Sensing Science and Engineering, Beijing Normal University, Beijing 100875, China
4
School of Geographical Sciences, Qinghai Normal University, Xining 810016, China
*
Author to whom correspondence should be addressed.
Remote Sens. 2021, 13(6), 1179; https://doi.org/10.3390/rs13061179
Submission received: 2 February 2021
/
Revised: 25 February 2021
/
Accepted: 17 March 2021
/
Published: 19 March 2021
Abstract
:Previous research on the effects of drought on vegetation productivity seldom distinguished the different responses of vegetation ecosystems to drought under different management practices and different land use systems. Studies investigating whether irrigation can buffer the negative impacts of drought on vegetation usually used discontinuous yield data in distribution. In this study, the trends in drought and vegetation productivity in farmlands in the drylands of northern China (DNC) from 2000 to 2018 were studied using the self-calibrated Palmer drought severity index (scPDSI) and enhanced vegetation index (EVI). The differences in the impact of drought on vegetation productivity in irrigated farmland, rainfed farmland, and natural vegetation areas were quantified. The results showed that the growing season scPDSI and EVI showed an increasing trend from 2000 to 2018. Significant correlations between drought anomalies and EVI anomalies were found in both arid drylands and semi-arid drylands. In addition, irrigation mitigated 59.66% of the negative impact caused by drought on irrigated farmland EVI in the growing season. The impact of drought on irrigated farmland EVI in the growing season was 19.98% lower than that on natural vegetation EVI. The impact of drought on natural vegetation EVI was 49.59% lower than that on rainfed farmland EVI. The results of this study refine the vegetation response to drought under different land management practices and land use patterns.
1. Introduction
As a climatic phenomenon, drought can directly affect the productivity of terrestrial ecosystems by affecting photosynthesis [1,2,3], and can also indirectly affect the productivity of terrestrial ecosystems by changing the frequency and intensity of other disturbance factors [4,5,6]. The farmland ecosystem, a main subsystem of the agricultural ecosystem [7], is an important part of terrestrial ecosystems. It is a semi-natural ecosystem in which human beings use natural resources and artificial inputs to produce agricultural products. Global farmland area accounts for 38% of the total land area, providing 66% of the world’s food supply [8]. It not only has productive value to satisfy agricultural productivity and ensure food security, but it also has ecological value in that it regulates the carbon cycle of ecosystems [9,10] and affects global climate change [11]. Statistically, drought and extreme heat caused a 9–10% reduction of national cereal productivity, and the cereal crop productivity losses caused by droughts reached 1820 million Mg, which is equivalent to the global productivity of maize and wheat in 2013 [12].
Numerous studies have pointed out that drought has a negative effect on vegetation productivity [13,14,15,16]. However, among these studies, only Pei et al. compared the effects of drought on the productivity of natural vegetation and artificial vegetation (such as crops) [14]. Farmland ecosystems are different from natural ecosystems (such as a forest or a meadow ecosystem) because humans control many of the interactions among things on the farm. Irrigation is a beneficial regulation mechanism used by humans for dealing with extreme weather events, such as drought [17], and approximately 40% of cereal crops are produced under irrigated conditions all over the world [18]. Studies have shown that irrigation can reduce the negative impacts of climate extremes by shifting the threshold beyond which crop yields decline, and can also decouple crop yields from climate to maintain crop productivity stability under climate change conditions [17,19,20,21,22].
The studies which investigated the mitigation of irrigation on the negative impact of drought on crops usually used yield data at the county or farm scale, and these discontinuous yield data in distribution can lead to spatial constraints on relevant research [17,19,20,22,23]. Furthermore, crop yield data at the administrative division level of most countries, including China, do not distinguish between irrigated and rainfed crops. Some remote sensing indicators can also characterize vegetation productivity and have more flexible spatial and temporal scales, such as the normalized difference vegetation index (NDVI) and the enhanced vegetation index (EVI) [24,25,26]. Compared to the NDVI, the EVI is more sensitive to dense vegetation [27] and has a better correlation with gross primary productivity than the NDVI [26]. Using the EVI to analyze the effects of drought and irrigation on the productivity of farmland ecosystems is a viable option.
The arid region of China is an important energy, industrial, mining, and livestock region, has a defense and aerospace base, is a transportation hub, and contains a concentrated distribution of cultural heritage, ethnic minorities, and poverty; therefore, this area has a high ranking in the national development strategy. Meanwhile, it is also one of the most fragile ecological zones in China. Due to human activity and climate change in recent decades, ecological problems such as oasis degradation and land desertification have intensified in this region. China has implemented a series of ecological restoration and reconstruction projects in this area. The main focus of these projects is the relationship between vegetation and water. Studies have been done on the relationship between irrigation and vegetation, providing a theoretical basis for ecological restoration in this region. In addition, water is the lifeblood of arid areas. Although irrigation can be used as a mitigation measure when crops are suffering from drought, it is important to take reasonable irrigation measures to protect the groundwater resources in arid regions [20,28]. Quantitatively analyzing the differences in crop productivity affected by drought between irrigated and rainfed farmland can provide guidance for judging the rationality of irrigation measures and balancing the conflict between water sources and food.
Based on the above considerations, this study aims to quantify the differences in the impact of drought on vegetation productivity under different management practices (irrigation and rainfed) and land use patterns (farmland and natural vegetation) using continuous EVI data in the drylands of northern China (DNC). The specific objectives of this study are to: (1) analyze the trends of drought and EVI of farmland ecosystems in the DNC from 2000 to 2018; (2) analyze the time-lag effects of vegetation responses to drought and the effects of drought on farmland ecosystems in different regions; and (3) quantify the differences in the effects of drought on EVI in irrigated farmland, rainfed farmland, and natural vegetation areas. This work refines the vegetation response to drought and demonstrates the feasibility of using EVI data to study crop response to drought.
2. Materials and Methods
2.1. Study Area
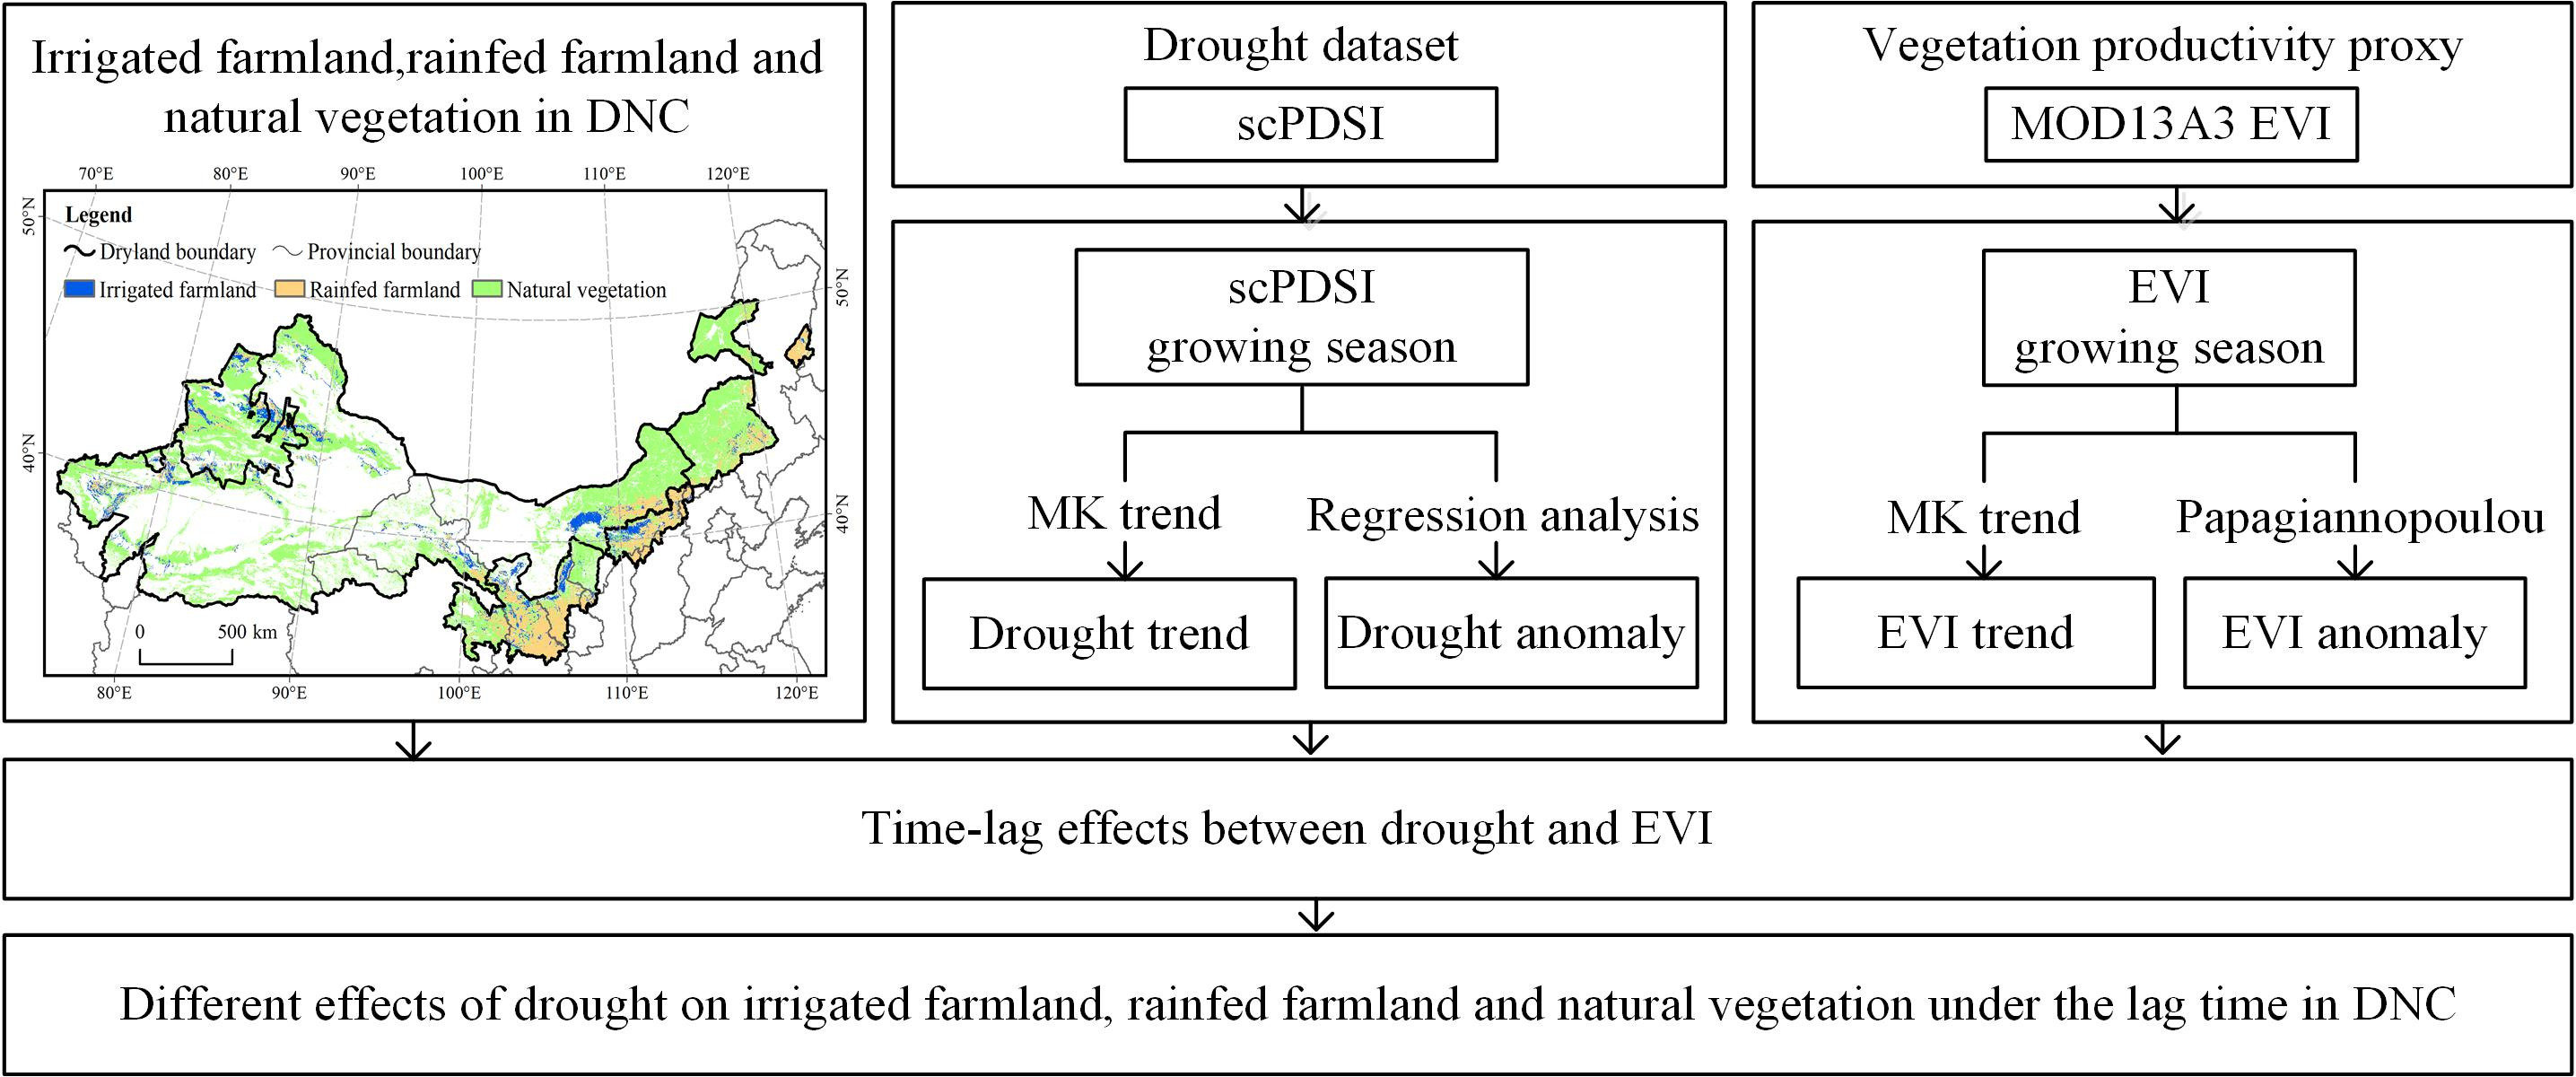
The DNC were determined according to the definition of “dryland systems” in the Millennium Ecosystem Assessment [29] (regions with annual precipitation below two-thirds of annual potential evaporation) with the premise of ensuring the integrity of county-level administrative units; the whole DNC can be divided into four dryland subtypes: hyper-arid dryland, arid dryland, semi-arid dryland, and dry sub-humid dryland [29,30]. In this study, only the hyper-arid dryland, arid dryland and semi-arid dryland were selected. In addition, due to the low proportion of farmland in the hyper-arid dryland, which accounts for only 0.46% of the total area of this region, the hyper-arid dryland was merged with the arid dryland. The adjusted DNC includes two subtypes: arid dryland and semi-arid dryland (Figure 1). This region spans the following provinces: Xinjiang Uygur Autonomous Region, Qinghai Province, Inner Mongolia Autonomous Region, Gansu Province, Ningxia Hui Autonomous Region, Shaanxi Province, Shanxi Province, Hebei Province, and Heilongjiang Province. The study area is located in the mid-latitude (34°N–51°N, 73°E–125°E), and it has a vast territory and high terrain. Plateaus and mountains make up the main landforms in this region. The climatic conditions in this area are very harsh, and the climate type is mainly a continental monsoon climate characterized by long and cold winters, short and hot summers, and rapid temperature changes in autumn and winter. The annual mean temperature of the main area is lower than 10 °C, the average annual precipitation ranges from 400 mm to 10 mm from east to west, and in most areas, the annual summer precipitation accounts for more than 80% of the total annual precipitation [31].
The drought frequency in the DNC is higher than that in most other areas of China [32,33], and this area is prone to continuous drought for many years. The average proportion of area affected by drought to cultivated land area from 1978 to 2008 in North China and Northwest China ranked first and third, respectively, among the six regions of China (North China, Northeast China, Northwest China, Southwest China, East China and South Central China), according to the report in the Statistics of New China’s Agriculture in 60 Years [34]. Obviously, the northern region is relatively more vulnerable to the severe effects of drought. Due to the limitations of the climatic conditions, irrigated agriculture accounts for a large proportion of the DNC, especially in arid dryland (Table 1).
2.2. Data Sources
The self-calibrated Palmer drought severity index (scPDSI) data used in this study was derived from the global 0.5° resolution self-calibrated version of the PDSI dataset: scPDSI provided by the CRU (Climate Research Unit) (https://crudata.uea.ac.uk/cru/data/drought/, (accessed on 2 February 2021)); this dataset provides scPDSI monthly data from 1901 to 2018 [36]. In order to maintain the same resolution as other data, the bilinear interpolation method is used to resample scPDSI from 0.5° resolution to 1 km resolution. The EVI data was derived from the MODIS (Moderate Resolution Imaging Spectroradiometer) monthly EVI product: MOD13A3 with a 1 km spatial resolution provided by the USGS (United States Geological Survey) (https://lpdaac.usgs.gov/products/mod13a3v006/, (accessed on 2 February 2021)). In addition, this study also used the DNC vector boundary data provided by Zhifeng Liu [30]; the Chinese land use and land cover data at a 1 km resolution provided by the Resource and Environmental Science Data Center of the Chinese Academy of Sciences (http://www.resdc.cn, (accessed on 2 February 2021)); and a distribution map of irrigated and rainfed farmland in China at a 1 km resolution in 2000 [35].
2.3. Methodology
2.3.1. Self-Calibrated Palmer Drought Severity Index
The PDSI, proposed by Palmer in 1965 [37], is the most widely used drought index in drought monitoring around the world and defines “drought” as a period that lasts for months or years, during which the actual water supply in a region continues to be lower than the statistical water supply compatible for the climate. The calculation method first calculates the CAFEC (climatically appropriate precipitation for existing conditions, i.e., the minimum amount of precipitation needed to maintain a normal soil moisture level for a certain region) [38,39] at each stage, uses the actual precipitation to determine the difference with this figure to obtain the water deficit, and then climatically modifies the water deficit and uses the duration factor to obtain the PDSI value under the influence of the previous water condition. The scPDSI is corrected based on the historical observation data from each station to give different weight coefficients and persistence factors [39]. The drought grade standards of the scPDSI are shown in Table 2.
2.3.2. Enhanced Vegetation Index
The EVI can remain sensitive to vegetation signals in high biomass regions where the NDVI becomes saturated [27]. In addition, it can also decouple the soil, non-photosynthetically active vegetation (i.e., litter and woody tissues), and atmospheric influences from vegetation signal [27,40]. The EVI formula is as follows:
where NIR, Red, and Blue are the full or partially atmospheric-corrected (for Rayleigh scattering and ozone absorption) surface reflectance of near-infrared, red, and blue bands; L is the canopy background adjustment for correcting the nonlinear, differential NIR, and red radiant transfer through a canopy; C1 and C2 are the coefficients of the aerosol resistance term, which uses the blue band to correct aerosol influences in the red band; and G is a gain or scaling factor. The coefficients adopted for the MODIS EVI algorithm are L = 1, C1 = 6, C2 = 7.5, and G = 2.5.
2.3.3. EVI and scPDSI Anomalies
EVI anomalies were calculated according to Papagiannopoulou’s method [41]. This method can remove the influence of factors that change steadily over time, only considering the fluctuations caused by unstable factors such as climatic factors. This method can reduce the interference from other factors on the research. The scPDSI anomalies were calculated by removing the linear trend of the annual changes.
2.3.4. Statistical Analysis
The growing season (April to September) scPDSI and EVI were first calculated based on monthly scPDSI and EVI. M–K trend analysis [42] was then used to analyze their trends at the pixel scale. Pearson correlation coefficient was used to analyze the time-lag effects and the influence of drought on EVI. Linear fitting between scPDSI anomalies and EVI anomalies was carried out and the slope of linear fitting was used to represent the extent of drought influence on EVI [22].
2.3.5. Time-Lag Effect Analyses
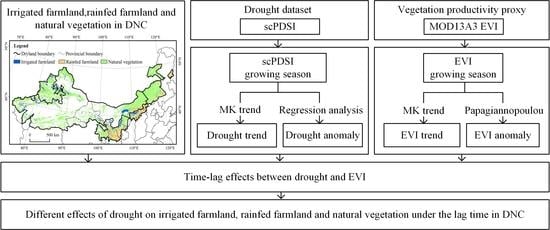
Firstly, the lag effects were examined pixel-by-pixel by calculation of correlations between monthly scPDSI anomalies and monthly EVI anomalies during the previous 6 months (R0, R1, …, R6). Then, for each pixel, for the EVI anomalies in a given month of the growing season, we found out the best lag month (, 0 ≤ ≤ 6) that had the highest correlation coefficient () between EVI anomalies and scPDSI anomalies. After that, for a given month (April to September), we calculated the proportion () of the number of pixels with the best lag month as () to the total number of pixels in that month (), that is, , in each region of interest (irrigated farmland, rainfed farmland, and natural vegetation). In this process, only pixels with significant correlation coefficients were considered. Finally, in each region of interest, for each lag month , we further calculated the arithmetic mean of , and the lag month with the largest arithmetic mean was regarded as the best time lag of that region. The details of the data processing are shown in Figure 2.
3. Results
3.1. Drought and EVI Trends in Farmland Ecosystems in the DNC
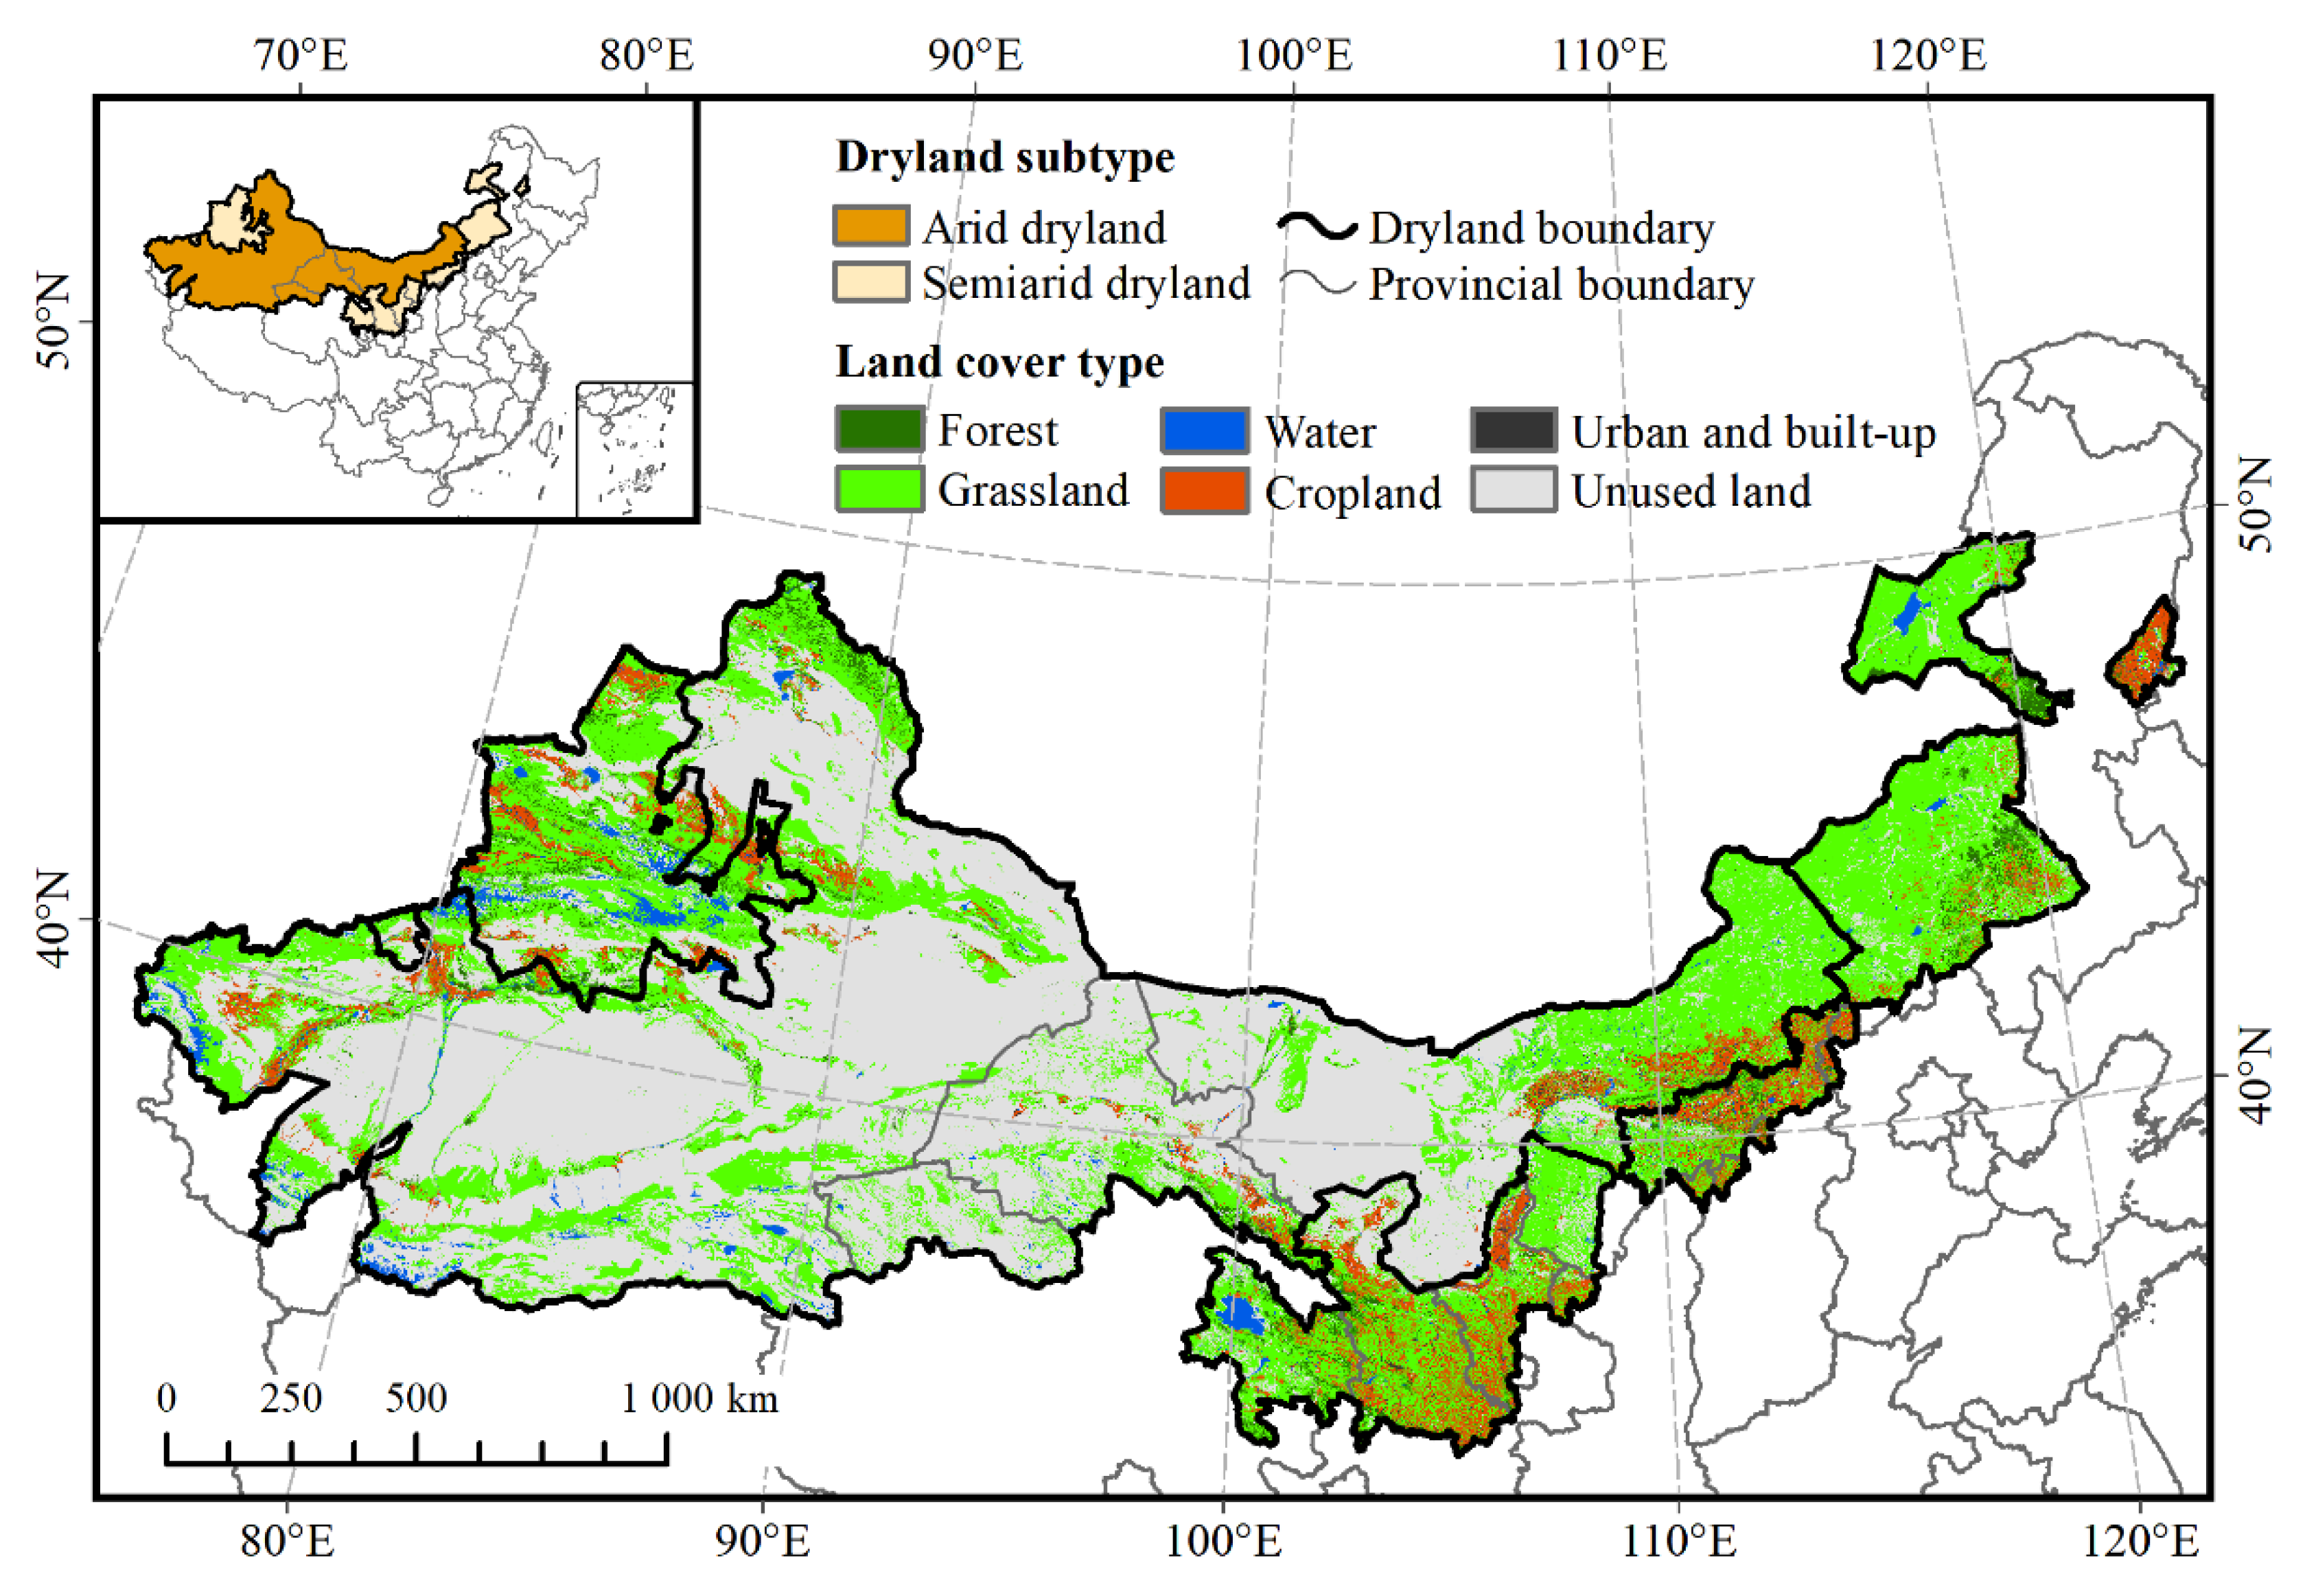
The spatial distribution of trends in drought and EVI during the growing season in farmland ecosystems in the DNC from 2000 to 2018 is shown in Figure 3. On the whole, most of the farmland area in the DNC showed a trend of drought alleviation and increased EVI during the growing season, which accounted for 88.39% and 90.68% of the total farmland area, respectively. Spatially, the regions showing trends in drought mitigation and aggravation were located in the central, eastern, and northwestern regions of farmland in the DNC, respectively; the regions with reduced EVI were mainly located in a small part of the western and northeastern farmland in the DNC, and the other parts all showed an increasing trend. In addition, there was a strong similarity between regions with a trend in drought mitigation and an increasing trend in EVI. Statistics showed that 87.38% of the regions showing an increasing trend in EVI were accompanied by drought mitigation, and 14.57% of the regions showing significant increasing trends in EVI were accompanied by significantly reduced drought. However, the regions showing a trend in aggravated drought were less spatially correlated with the regions showing a trend in reduced EVI. Only 16.07% of the regions exhibiting a reduced EVI trend accompanied drought aggravation, and none of the regions showing a significant trend in reduced EVI were accompanied by a significant drought aggravation. Accordingly, it can be preliminarily believed that there is corresponding relationship between the increase of EVI and the reduction of drought.
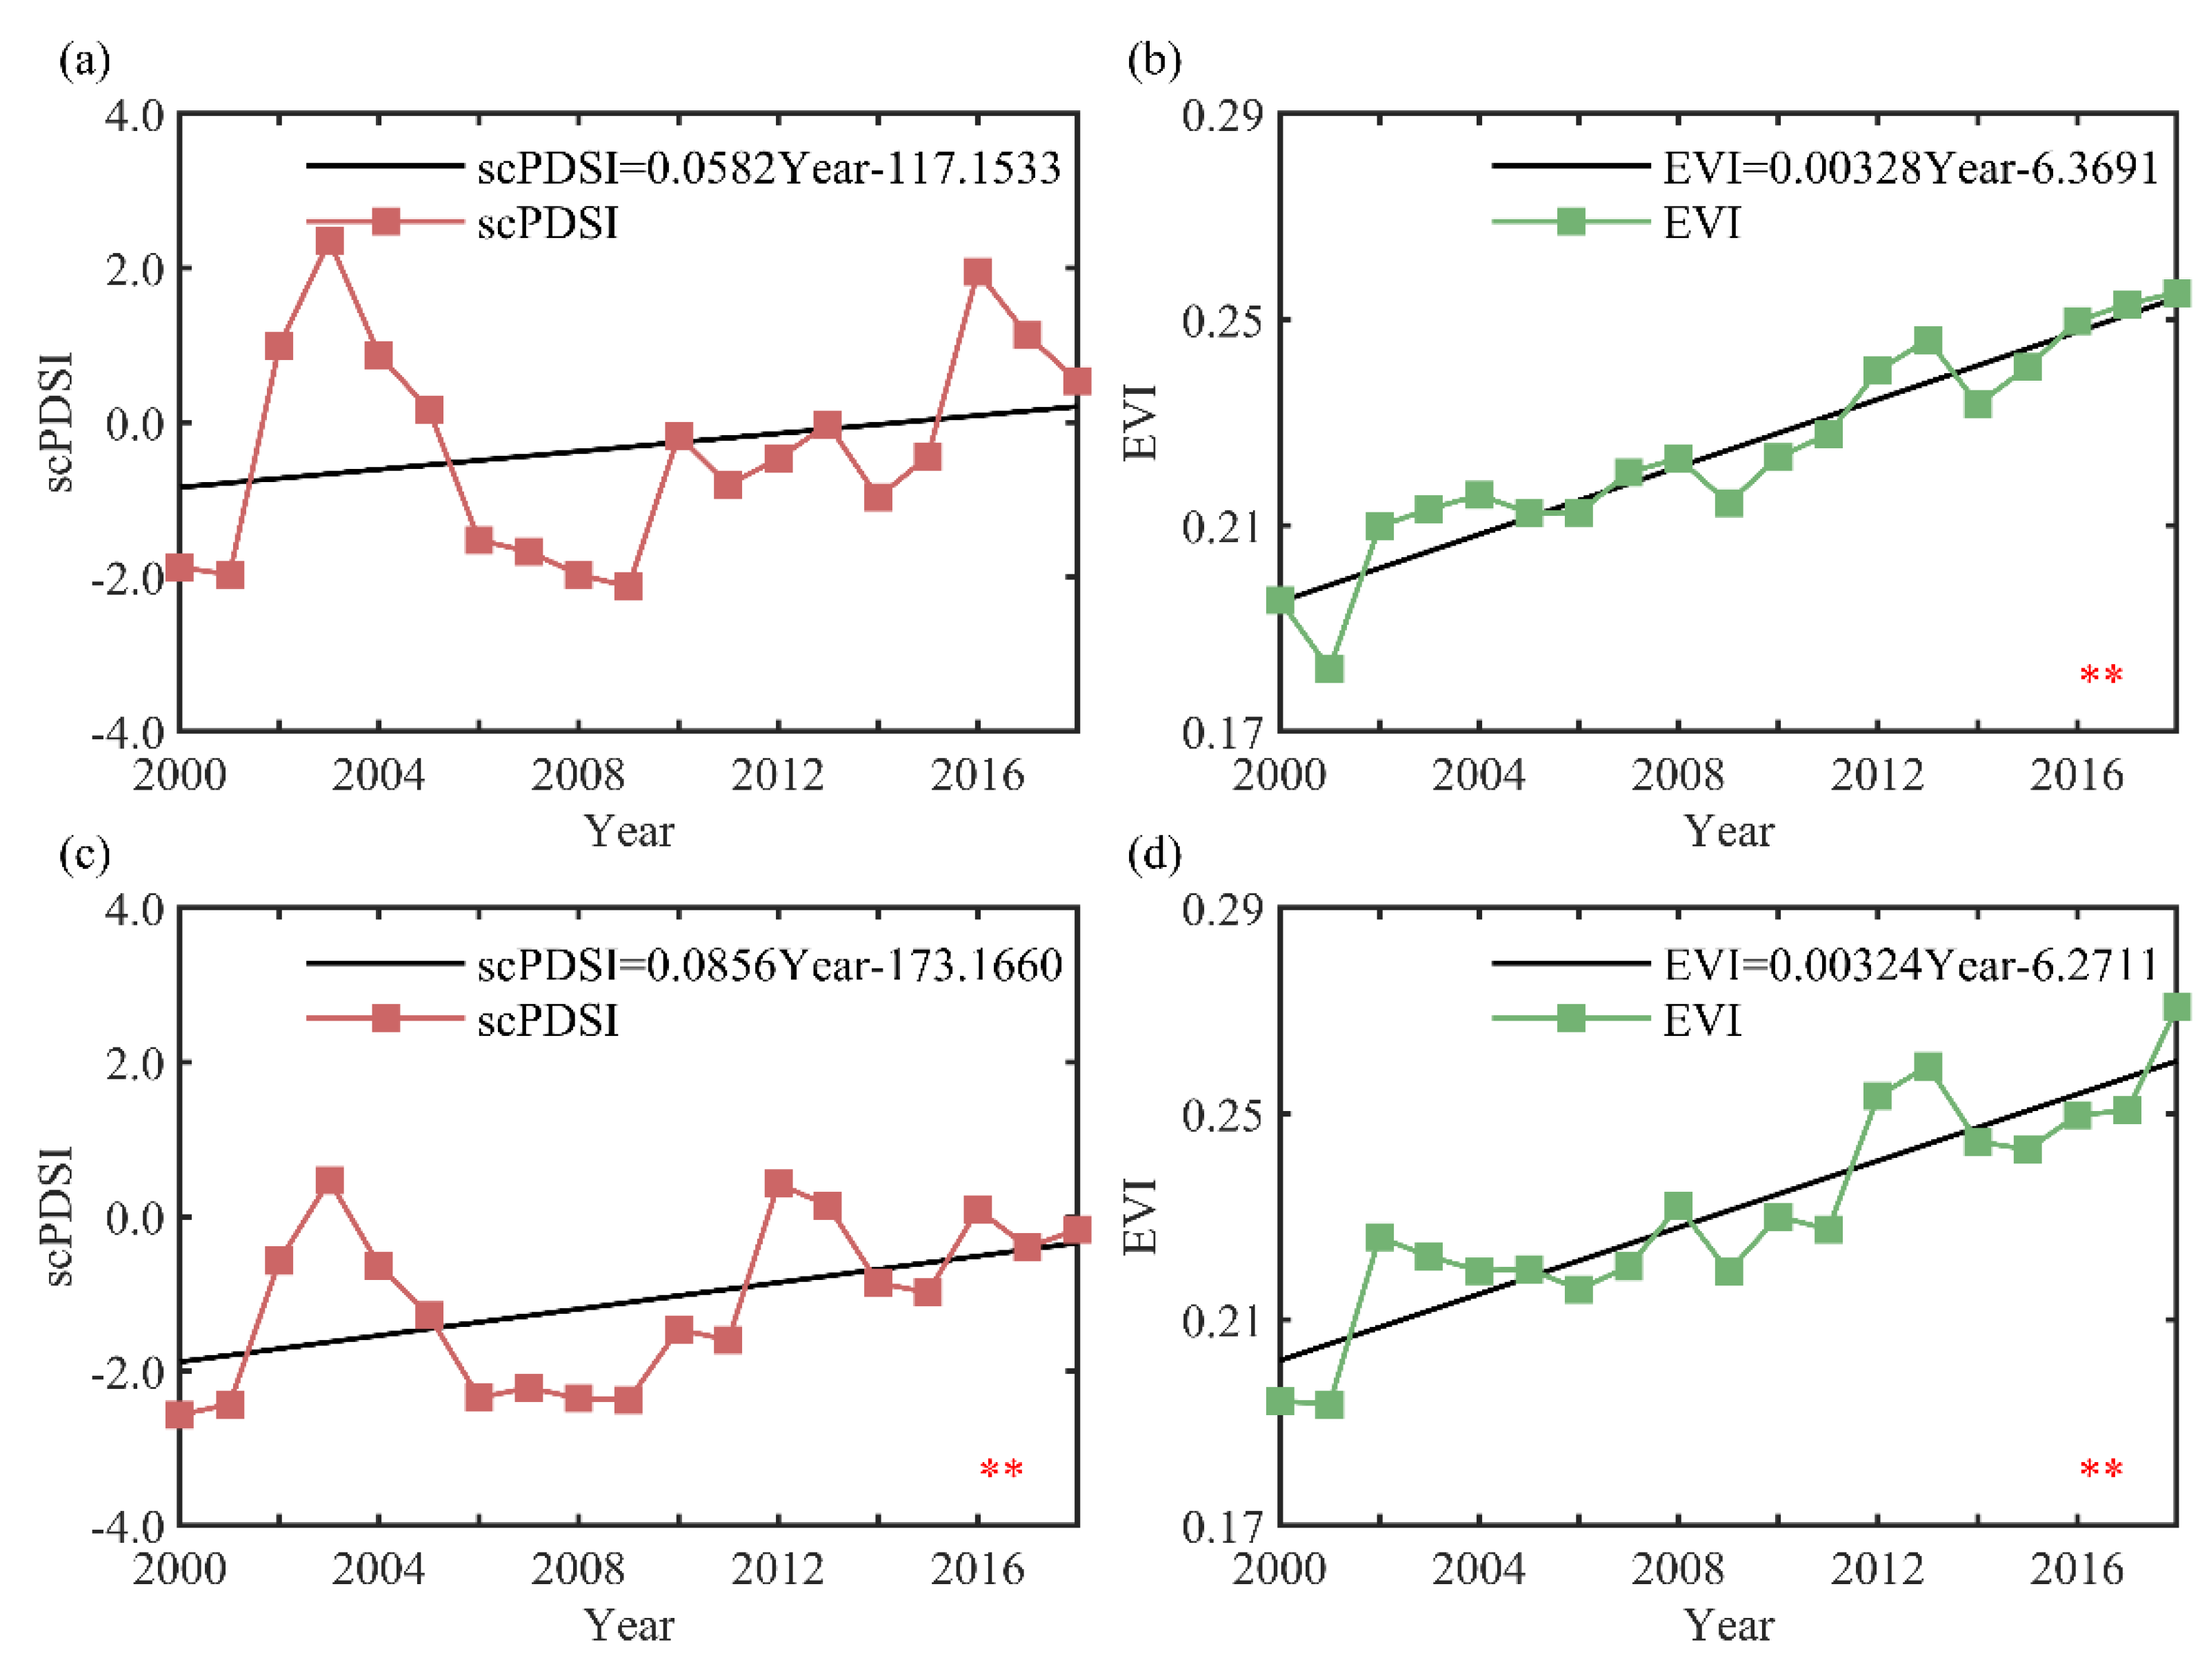
The trends in drought and EVI during the growing season in farmland ecosystems in the DNC from 2000 to 2018 is shown in Figure 4. During this period, the growing season trends in the drought index and EVI of farmland were consistent in both drylands and semi-arid drylands. The drought index and EVI during the growing season all showed an upward trend, that is, the drought was alleviated and the EVI increased. Furthermore, there was a regional difference in the degree of drought reduction and EVI increase. The change trends of drought index were more obvious in semi-arid drylands than in arid drylands. The increasing rates of EVI in arid and semi-arid drylands were approximately the same.
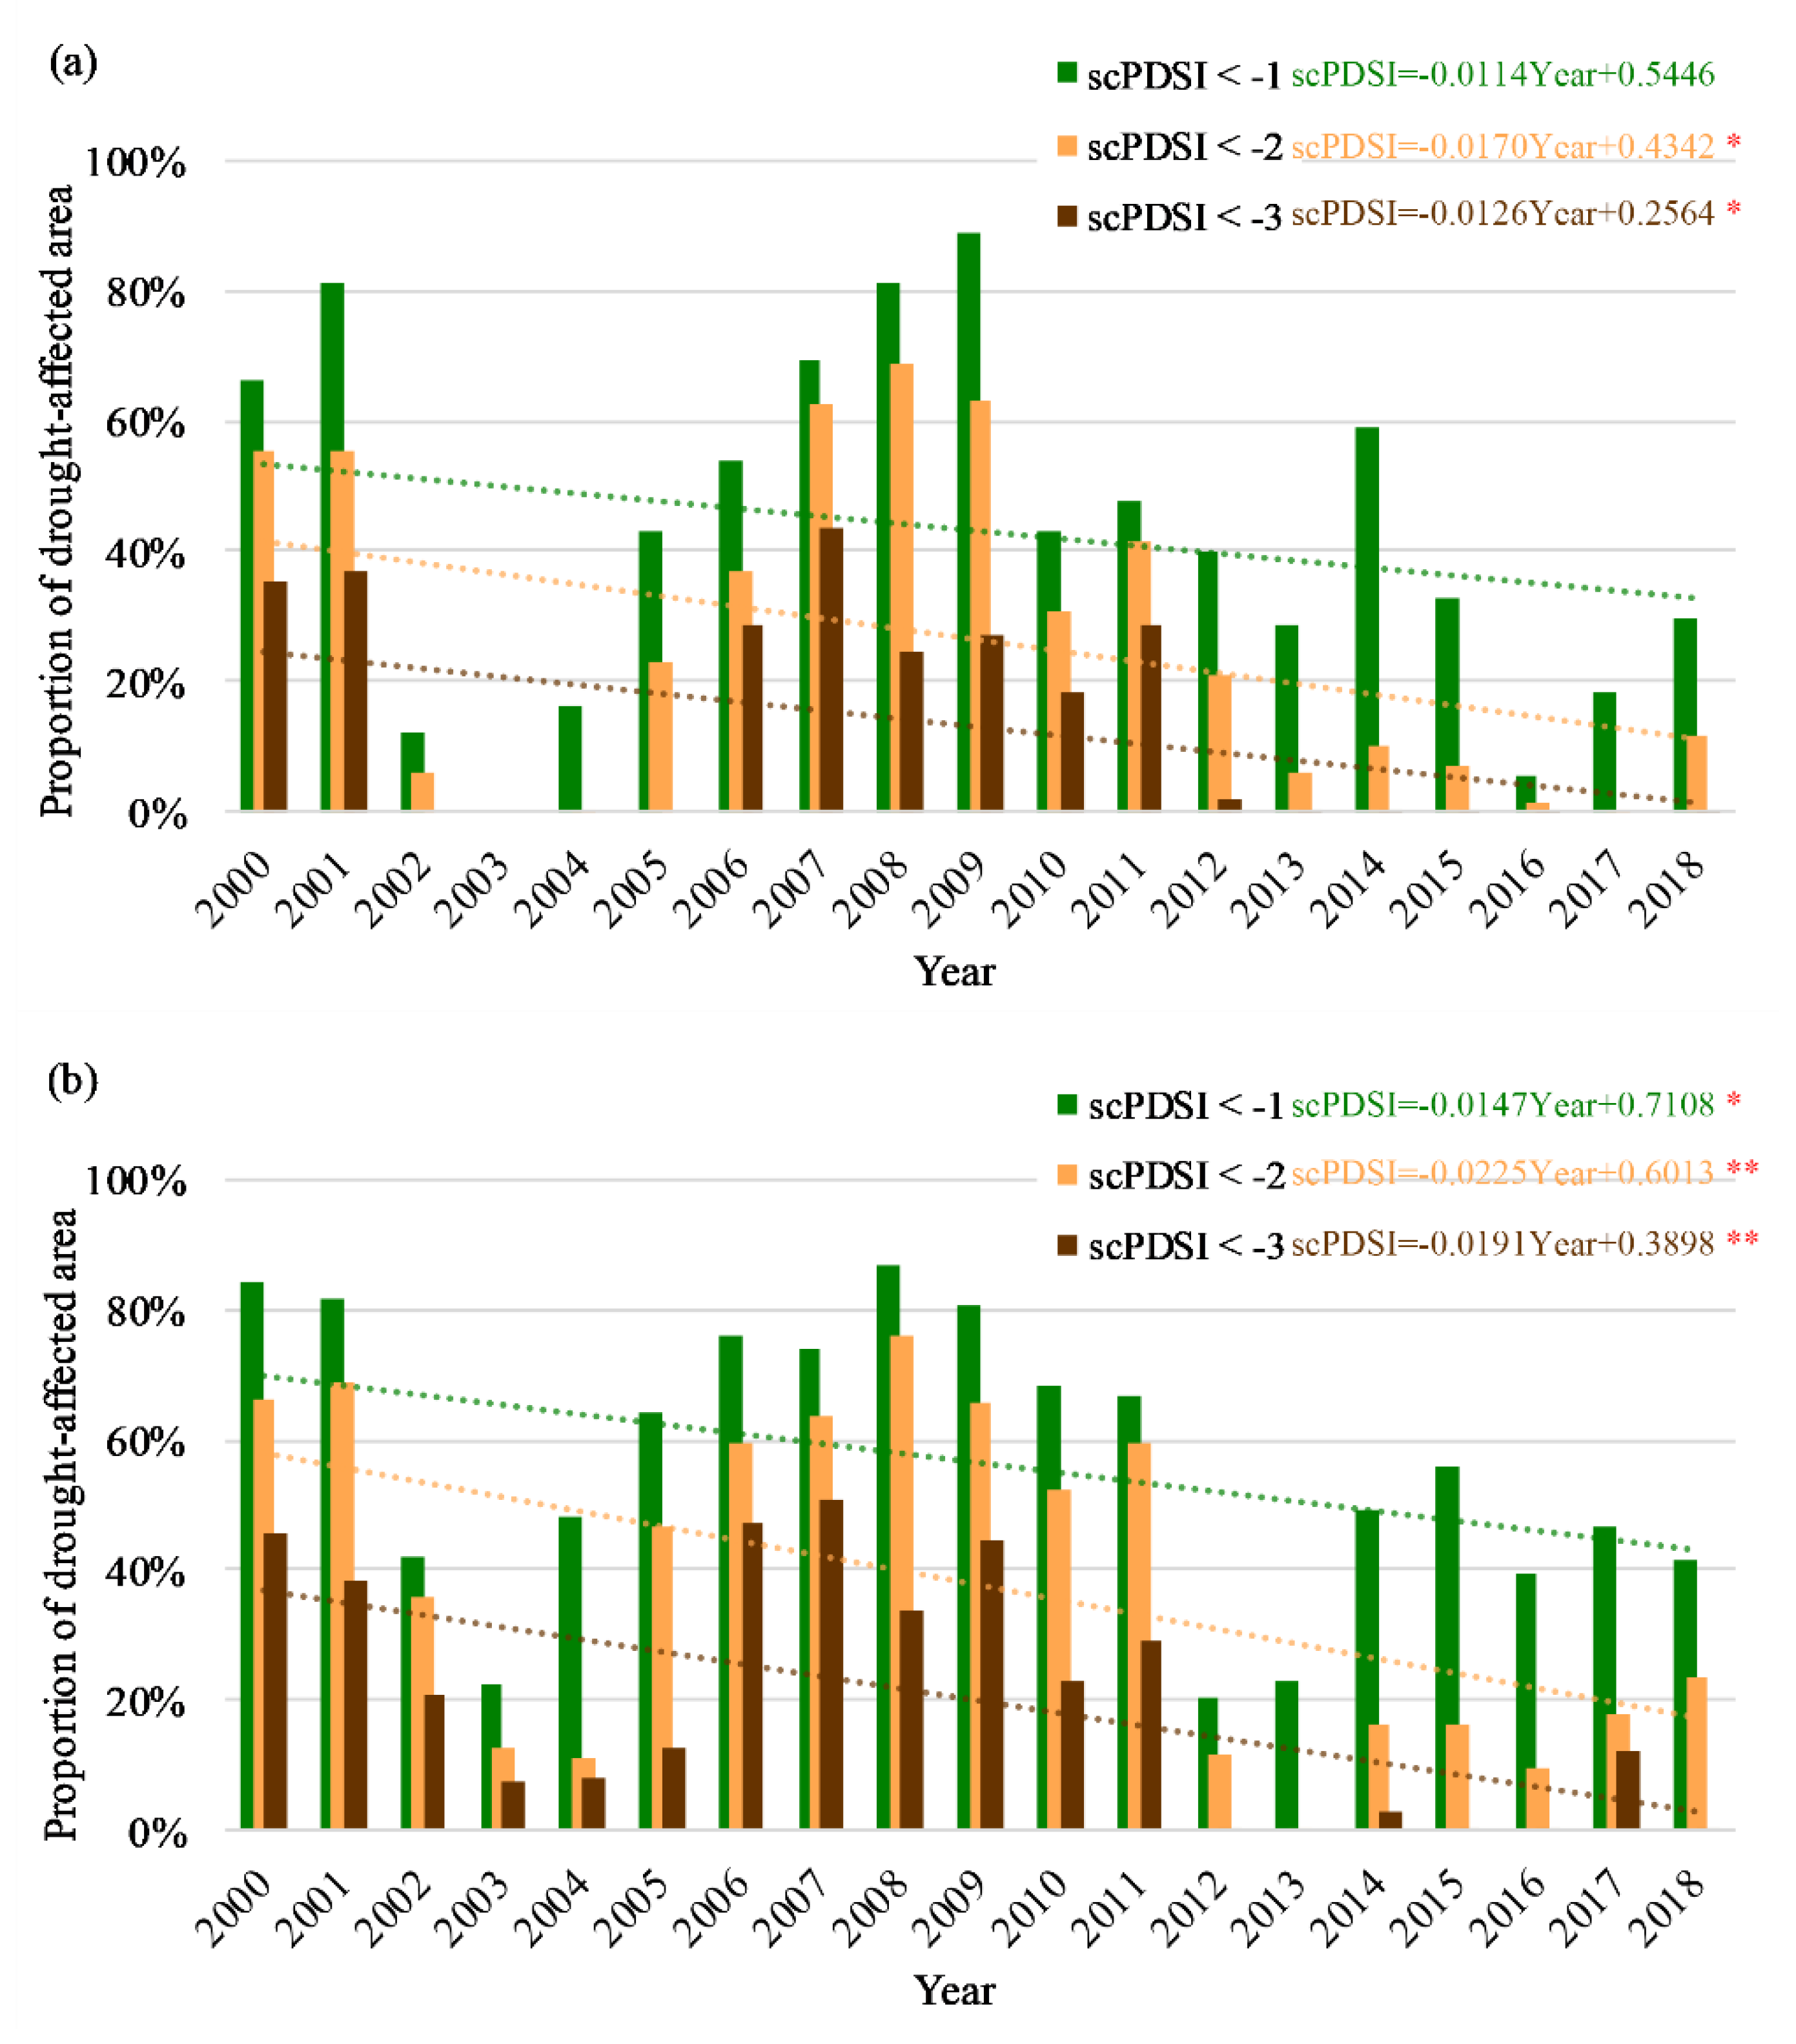
The proportion of farmland affected by drought of different intensity to total farmland area during the growing season was calculated in both arid drylands and semi-arid drylands in the DNC from 2000 to 2018 and shown in Figure 5. During this period, the proportion of drought-affected area showed a trend of fluctuating downward, which corresponded to the trend in drought reduction characterized by the growing season drought index. Overall, the proportion of drought-affected area was higher in semi-arid drylands than that in arid drylands. The peak years of the proportion of drought-affected area in arid drylands and semi-arid drylands were concentrated in 2001, 2009, 2011, and 2014, and 2000, 2006, 2008, 2009, 2011, and 2015, respectively. They were also consistent with the time at which the scPDSI negative peaks appeared.
3.2. Response to Drought in EVI of Farmland Ecosystems in the DNC
3.2.1. Time-Lag Effects Between EVI and Drought
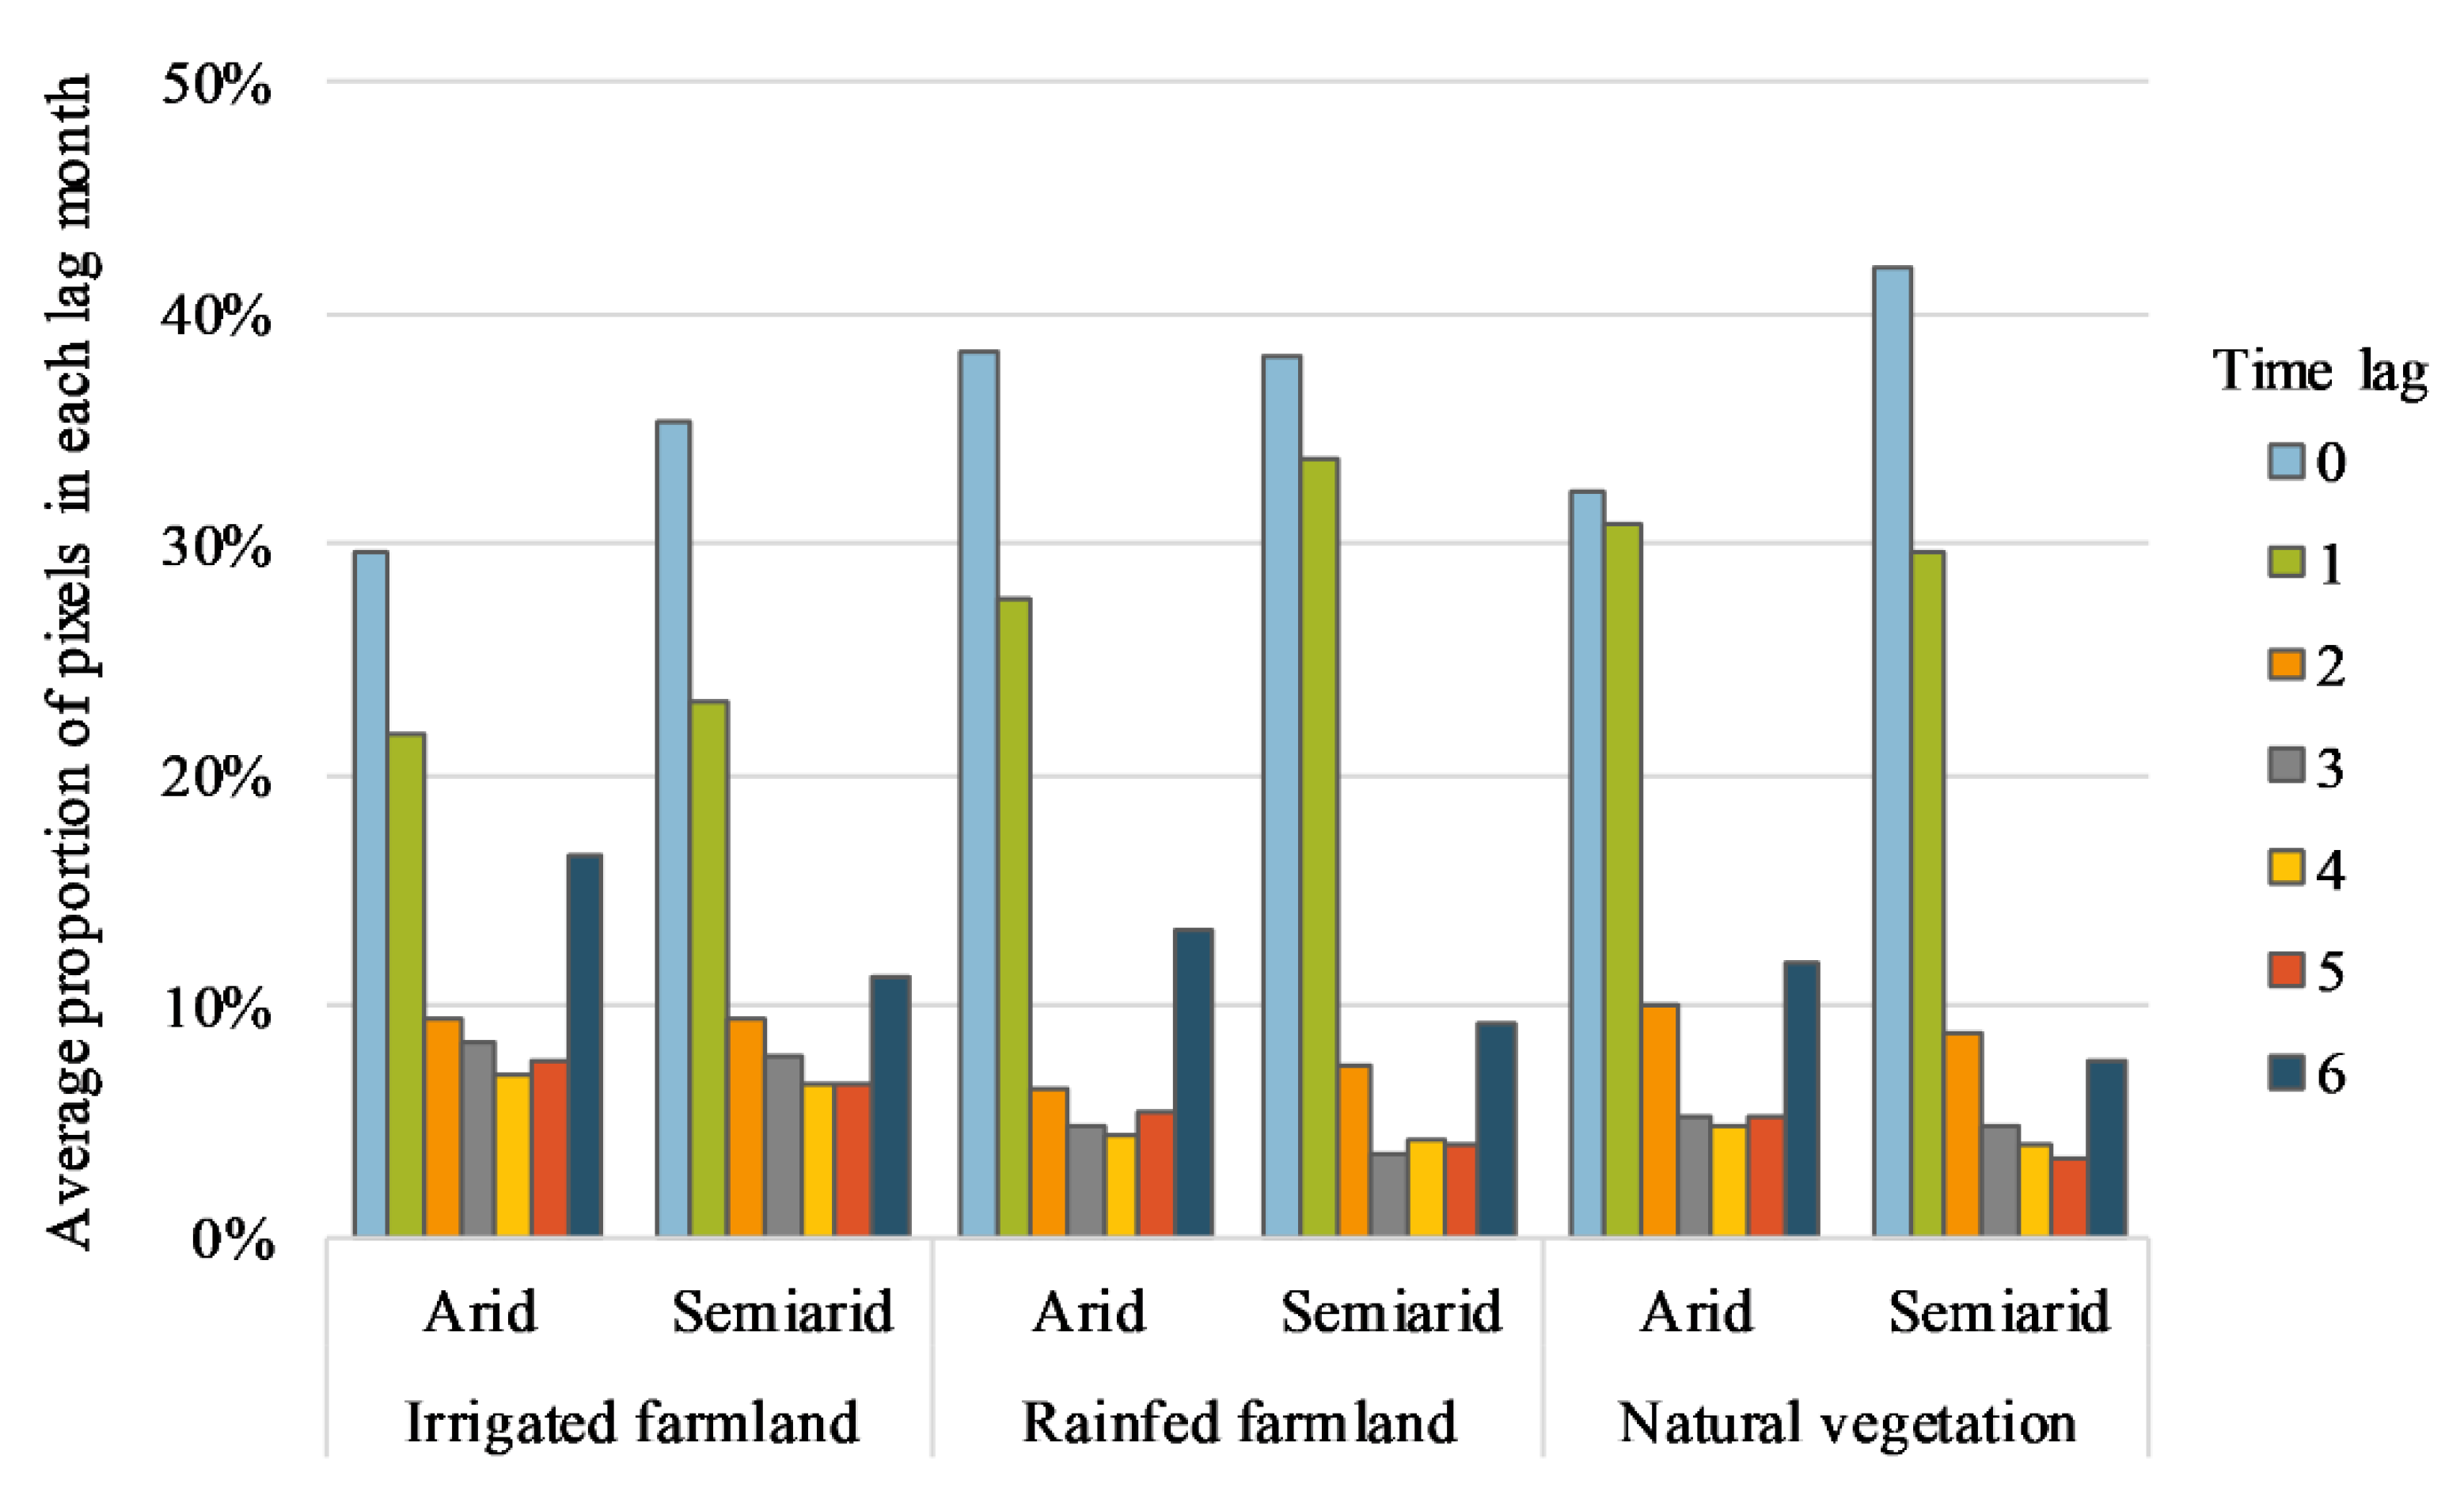
To determine the best lag time for each region of interest, the average proportion of pixels in each time lag in different regions (arid and semi-arid drylands) and vegetation ecosystems (irrigated farmland, rainfed farmland, and natural vegetation) were calculated (Figure 6). It can be seen from Figure 6 that pixels with a lag time of 0 month accounted for the largest proportion in farmland ecosystems and natural vegetation ecosystems in both arid drylands and semi-arid drylands. Therefore, the analyses in this study were conducted with a 0-month lag.
3.2.2. Response to Drought in EVI of Farmland Ecosystems in the DNC
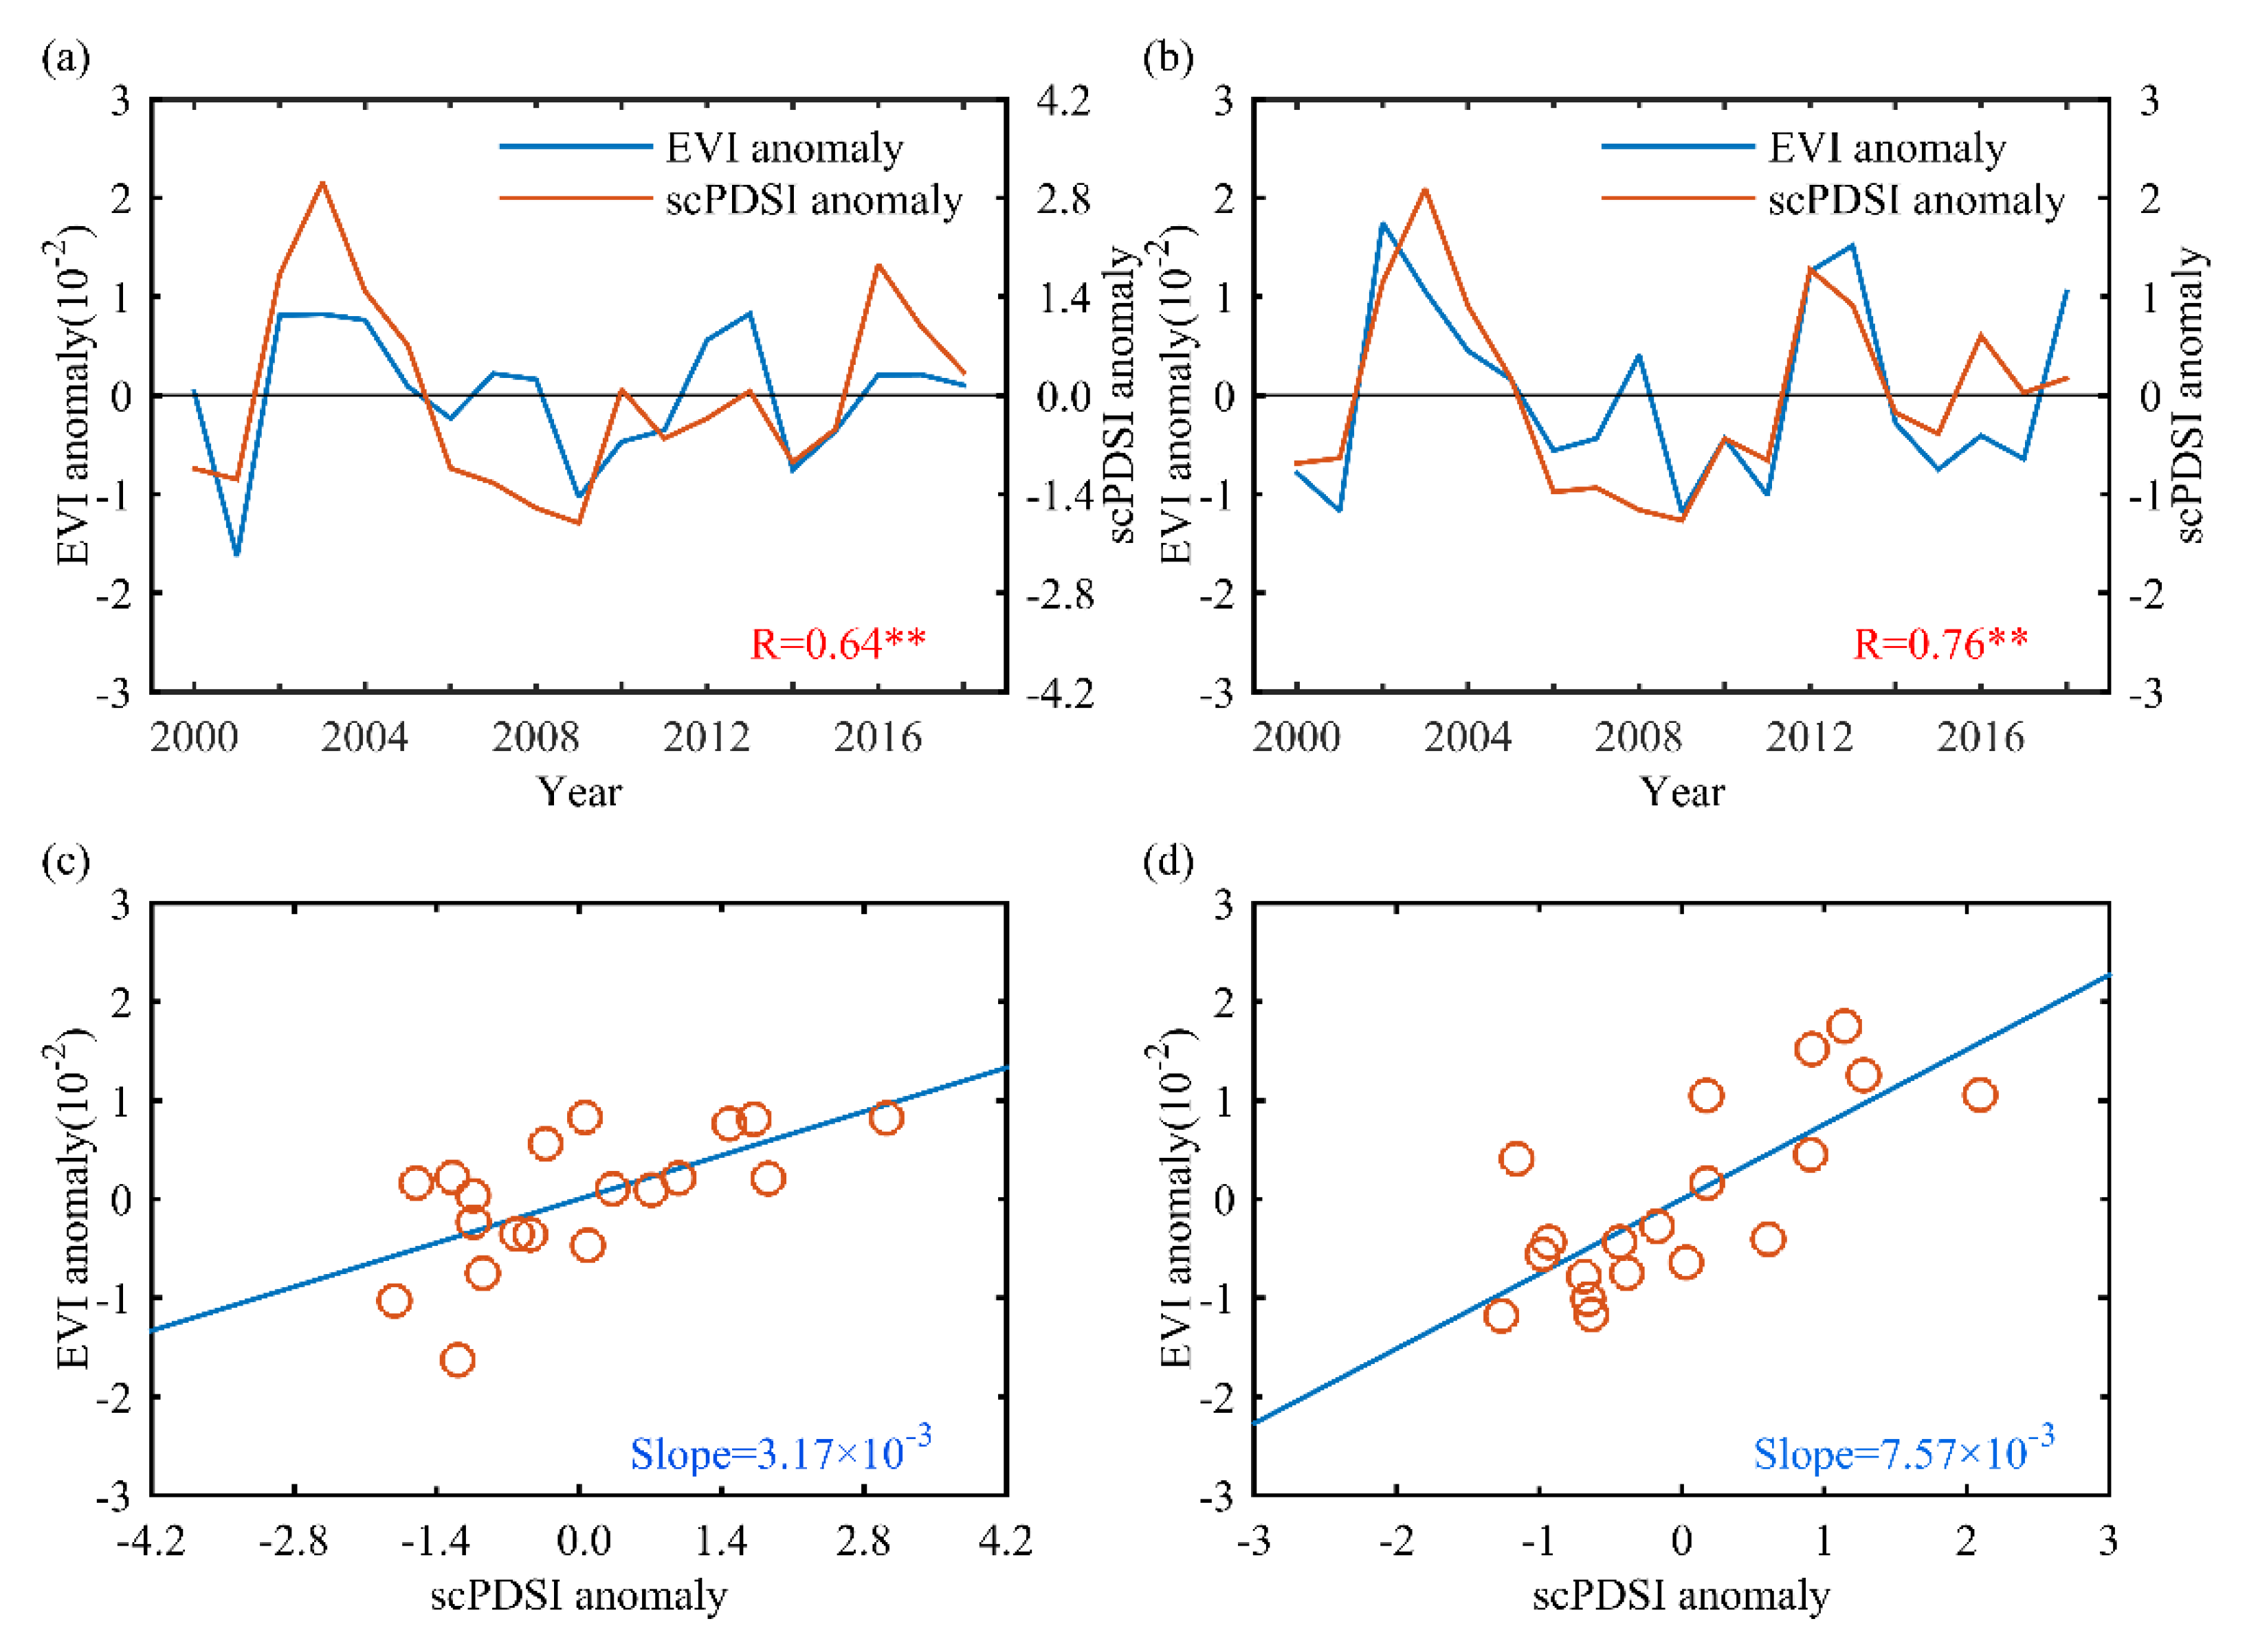
The correlation coefficients and linear fitting slopes between scPDSI anomalies and EVI anomalies of farmland during the growing season in the DNC from 2000 to 2018 are shown in Figure 7. In the arid and semi-arid drylands, scPDSI anomalies and farmland EVI anomalies showed significant positive correlations. The larger the positive (negative) anomaly value of EVI, the bigger the positive (negative) value of the drought index, indicating that drought has a great impact on the EVI of farmland ecosystems in the DNC. In addition, the typical drought years are also the years of negative peaks in EVI.
To explore the extent of the impact of drought on farmland EVI, the drought anomalies in the growing season were linearly fitted to the farmland EVI anomalies. The fitting slopes can indicate the magnitude of the change in farmland EVI under the same conditions of drought change. The positive fitting slopes means that farmland EVI anomalies will increase as scPDSI anomalies increase, and vice versa. Furthermore, the fitting slope in semi-arid drylands was higher than that in arid drylands, which means that, under the condition of the same change intensity of drought, the change of farmland EVI in semi-arid areas was greater than that in arid areas. In other words, the impact of drought on farmland EVI in semi-arid drylands was greater than that in arid drylands.
3.3. The Differences in the Impact of Drought on EVI Among Irrigated Farmland, Rainfed Farmland and Natural Vegetation
The correlations and linear fitting slopes between scPDSI anomalies and EVI anomalies of irrigated farmland, rainfed farmland, and natural vegetation were calculated (Table 3). It can be found that there were significant positive correlations between drought and EVI anomalies in irrigated farmland, rainfed farmland, and natural vegetation ecosystems, indicating that drought affected EVI in both farmland and natural vegetation ecosystems. In both arid drylands and semi-arid drylands, the linear fitting slope of each area was ranked from high to low as rainfed farmland, natural vegetation areas, and irrigated farmland, indicating that under the same drought variation, the EVI of rainfed farmland had the greatest reduction, followed by natural vegetation EVI, and finally irrigated farmland EVI. Regionally, the impact of drought on EVI in semi-arid drylands was higher than that in arid drylands.
In addition, the degree of mitigation of the negative effects caused by drought alleviated by irrigation was also calculated, recorded as (Rs-Is)/Rs in Table 3. Compared with rainfed farmland, irrigation alleviated the negative effects of drought on irrigated farmland in DNC by 59.66%, and the degree of drought alleviation from irrigation in the arid drylands was higher than that in the semi-arid drylands. The impact of drought on irrigated farmland EVI in the growing season was 19.98% lower than that on natural vegetation EVI. The effects of drought on natural vegetation EVI was 49.59% lower than that on rainfed farmland EVI.
4. Discussion
4.1. The Causes of Differences in the Impact of Drought on Vegetation Productivity
Our results showed that drought had the greatest impact on vegetation productivity in rainfed farmland, followed by natural vegetation, and irrigated farmland had the least impact. For different management practices (irrigated farmland and rainfed farmland), it is obvious that the differences were caused by the mitigation effect of irrigation on the negative impact of drought. In addition to the influence factors of direct water replenishment like irrigation, some other factors can also cause different effects under the same drought conditions. Firstly, woody plants with deep roots that can access water from a deeper soil profile have a stronger resistance to drought [43]. Secondly, richer vegetation diversity has a beneficial effect on improving ecosystem resistance to drought [44]. Given this, natural vegetation areas with more deep-rooted woody plants and richer vegetation diversity are more resistant to drought and therefore less negatively affected by drought than rainfed farmland. Furthermore, no matter what the management practices and land use patterns were, vegetation productivity in semi-arid drylands was more negatively affected by drought than that in arid drylands. This is probably because vegetation in arid drylands has already adapted to the dry climate and has a greater tolerance to drought, and vegetation productivity in arid regions has a relatively low sensitivity to drought than that in semi-arid regions [45,46,47].
4.2. Study Implications
This work refines the vegetation response to extreme weather, especially drought under different land management practices, different land use systems, and different ecosystems by quantitatively exploring how severely irrigated crops, rainfed crops, and natural vegetation are affected by drought. Previous studies on the effects of irrigation and climate change on crop productivity [17,19,20,22,23] mostly used yield as a characterization factor for crop productivity. However, crop yield statistics are usually available at a given administrative unit level (such as province, municipality, etc.), which makes it difficult to obtain crop yields for areas below the given administrative unit. Crop yields mostly relied on self-reporting, which is more subjective and has greater uncertainty in its reliability. Furthermore, the crop yield data at an administrative unit level in most countries like in China do not distinguish the output of irrigated crops from that of non-irrigated crops. EVI data is a good indicator of crop productivity [26]. As spatially continuous data obtained by remote sensing, EVI can objectively reflect vegetation productivity in smaller regions. This study demonstrates the feasibility of using EVI data in the response of crops to drought, breaking the limits of crop yield data on a spatial scale and providing more data choices for related studies.
4.3. Study Limitations
There are also some limitations in this research. First, the datasets used in this study introduce some uncertainties. Irrigation data brings uncertainties to this study. First, due to the limitation of the accuracy of the irrigation distribution map, the irrigated conditions cannot be exactly the same as the actual conditions. Second, the irrigation map used in our study was produced in 2000, that is, it only represents the irrigated conditions in 2000, and the actual range of irrigated farmland may have increased since 2000. The irrigated farmland in this study was extracted according to this map, which may underestimate the difference between the negative impact of drought on irrigated farmland and on rainfed farmland. In addition, the irrigation map is only focused on crops and does not reflect the irrigated conditions of other vegetation types [35]. However, grassland, ecological green land, etc. may also be artificially managed by irrigation, which would reduce the difference between the negative impacts of drought on irrigated farmland and on natural vegetation. The uncertainties caused by the irrigation and rainfed farmland map can be reduced by applying long time series distribution maps of irrigated and rainfed farmland in the future.
Previous studies pointed out that the responses of vegetation in different areas to drought or other climate variables had different time scales [48,49,50,51]. For example, De Keersmaecker et al. [48] indicated that vegetation in semi-arid regions has low resilience and strong memory effects to drought. Liu et al. [49] also proposed that vegetation has a longer memory time for water in some arid and semi-arid regions. Vicente-Serrano et al. [51] pointed out that vegetation is more sensitive to drought on short time scales in arid and humid areas, while on long time scales in semi-arid and sub-humid areas. In this study, the lag time of vegetation to drought on most pixels was 0–1 month in both arid dryland and semi-arid dryland, which is different from the long memory effect reported in previous studies. This may because we used scPDSI to monitor droughts while the above previous studies used SPI or SPEI to depict droughts. PDSI is usually used to monitor droughts on a long time scale [52], and it may underestimate the lag time of vegetation response to drought. Moreover, this study did not consider the effects of actual time length of the drought events, drought frequency, intensity, and drought-affected areas on the response of vegetation growth, but this does not affect the main conclusions of the study.
Vegetation productivity can be directly or indirectly affected by drought. In addition to drought-related temperature and precipitation factors, other natural or man-made factors, such as solar radiation, freezing damage, pests, and land-use changes can also cause changes in vegetation productivity or crop yields [14,53,54]. The calculation method for EVI anomalies in this study can exclude the influence of some factors that change EVI stability, but it is still impossible to exclude the random fluctuation of EVI caused by other unstable factors besides drought. In addition, there are inconsistencies in the response of different crop types to drought [23]. This study did not analyze the effect of different crop types because of the lack of a detailed spatial distribution map of crop types, which may also lead to uncertainty in the results of this study.
5. Conclusions
Understanding the response of crops to climate change or extreme climate events such as drought and the effects of drought on crops under different land management practices and land use patterns is important for guiding society in coping with climate change, ensuring food productivity and food security, and understanding the carbon cycle of ecosystems. This study analyzed the trends in drought and EVI of farmland ecosystems in the DNC from 2000 to 2018, analyzed the response of farmland EVI to drought, and quantified the differences in the effects of drought on vegetation productivity in irrigated farmland, rainfed farmland, and natural vegetation region. The main conclusions are as follows:
(1) During the study period, most of the farmland in the DNC showed a trend of drought mitigation and EVI increase, and drought mitigation and EVI increase had a high spatial correspondence. The change trend of drought index was more obvious in semi-arid drylands than that in arid drylands.
(2) Drought anomalies and EVI anomalies were significantly correlated in the growing season. Whether in irrigated farmland, rainfed farmland, or natural vegetation areas, EVI was more affected by drought in semi-arid farmland than in arid farmland.
(3) Irrigation alleviated the negative impact of drought in the DNC in the growing season. The degree of drought alleviation from irrigation in the arid drylands was higher than that in the semi-arid drylands.
(4) The order of the impact of drought on the three vegetation ecosystems is: rainfed farmland > natural vegetation > irrigated farmland.
Author Contributions
Conceptualization and methodology, X.Z.; resources, data curation, writing—original draft preparation, Y.L.; writing—review and editing, K.X.; supervision, Y.P. All authors have read and agreed to the published version of the manuscript.
Funding
This work was supported by the National Key R&D Program of China (Grant No. 2019YFA0606900) and the National Natural Science Foundation of China (Grant No. 42077436).
Data Availability Statement
Data is available upon request.
Conflicts of Interest
The authors declare no conflict of interest.
References
- Flexas, J. Drought-inhibition of Photosynthesis in C3 Plants: Stomatal and Non-stomatal Limitations Revisited. Ann. Bot. 2002, 89, 183–189. [Google Scholar] [CrossRef] [Green Version]
- Zhang, Y.; Peng, C.; Li, W.; Fang, X.; Zhang, T.; Zhu, Q.; Chen, H.; Zhao, P. Monitoring and estimating drought-induced impacts on forest structure, growth, function, and ecosystem services using remote-sensing data: Recent progress and future challenges. Environ. Rev. 2013, 21, 103–115. [Google Scholar] [CrossRef]
- Zhang, Y.; Xiao, X.; Zhou, S.; Ciais, P.; McCarthy, H.; Luo, Y. Canopy and physiological controls of GPP during drought and heat wave. Geophys. Res. Lett. 2016, 43, 3325–3333. [Google Scholar] [CrossRef] [Green Version]
- Anderegg, W.R.; Berry, J.A.; Field, C.B. Linking definitions, mechanisms, and modeling of drought-induced tree death. Trends Plant Sci. 2012, 17, 693–700. [Google Scholar] [CrossRef]
- Nepstad, D.; Lefebvre, P.; Da Silva, U.L.; Tomasella, J.; Schlesinger, P.; Solorzano, L.; Moutinho, P.; Ray, D.; Benito, J.G. Amazon drought and its implications for forest flammability and tree growth: A basin-wide analysis. Glob. Chang. Biol. 2004, 10, 704–717. [Google Scholar] [CrossRef]
- Sangüesa-Barreda, G.; Camarero, J.J.; Oliva, J.; Montes, F.; Gazol, A. Past logging, drought and pathogens interact and contribute to forest dieback. Agric. For. Meteorol. 2015, 208, 85–94. [Google Scholar] [CrossRef] [Green Version]
- Tilman, D.; Cassman, K.G.; Matson, P.A.; Naylor, R.L.; Polasky, S. Agricultural sustainability and intensive production practices. Nat. Cell Biol. 2002, 418, 671–677. [Google Scholar] [CrossRef] [PubMed]
- Yin, F.; Mao, F.; Fu, B.; Liu, G. Farmland ecosystem service and its formation mechanism. Ying Yong Sheng Tai Xue Bao J. Appl. Ecol. 2006, 17, 929–934. [Google Scholar]
- Garbach, K.; Milder, J.; Montenegro, M.; Karp, D.; DeClerck, F. Biodiversity and Ecosystem Services in Agroecosystems. In Encyclopedia of Agriculture and Food Systems; Elsevier: Amsterdam, The NetherLands, 2014; pp. 21–40. [Google Scholar]
- Paustian, K.; Andren, O.; Janzen, H.H.; Lal, R.; Smith, P.; Tian, G.; Tiessen, H.; Van Noordwijk, M.; Woomer, P.L. Agricultural soils as a sink to mitigate CO2 emissions. Soil Use Manag. 1997, 13, 230–244. [Google Scholar] [CrossRef]
- IPCC. Climate Change 2014 Mitigation of Climate Change; Cambridge University Press: Cambridge, UK, 2014; ISBN 9781107415416. [Google Scholar]
- Lesk, C.; Rowhani, P.; Ramankutty, N. Influence of extreme weather disasters on global crop production. Nat. Cell Biol. 2016, 529, 84–87. [Google Scholar] [CrossRef] [PubMed]
- Ciais, P.; Reichstein, M.; Viovy, N.; Granier, A.; Ogee, J.; Allard, V.; Aubinet, M.; Buchmann, N.; Bernhofer, C.; Carrara, A.; et al. Europe-wide reduction in primary productivity caused by the heat and drought in 2003. Nat. Cell Biol. 2005, 437, 529–533. [Google Scholar] [CrossRef]
- Pei, F.; Li, X.; Liu, X.; Lao, C. Assessing the impacts of droughts on net primary productivity in China. J. Environ. Manag. 2013, 114, 362–371. [Google Scholar] [CrossRef]
- Wang, H.; He, B.; Zhang, Y.; Huang, L.; Chen, Z.; Liu, J. Response of ecosystem productivity to dry/wet conditions indicated by different drought indices. Sci. Total Environ. 2018, 612, 347–357. [Google Scholar] [CrossRef]
- Zhao, M.; Running, S.W. Drought-Induced Reduction in Global Terrestrial Net Primary Production from 2000 through 2009. Science 2010, 329, 940–943. [Google Scholar] [CrossRef] [Green Version]
- Troy, T.J.; Kipgen, C.; Pal, I. The impact of climate extremes and irrigation on US crop yields. Environ. Res. Lett. 2015, 10. [Google Scholar] [CrossRef] [Green Version]
- Food and Agriculture Organization of the United Nations. FAO Statistical Year Book—World Food and Agriculture; Food and Agriculture Organization of the United Nations: Rome, Italy, 2013; ISBN 2225-7373. [Google Scholar]
- Araujo, J.A.; Abiodun, B.J.; Crespo, O. Impacts of drought on grape yields in Western Cape, South Africa. Theor. Appl. Clim. 2016, 123, 117–130. [Google Scholar] [CrossRef]
- Li, X.; Troy, T.J. Changes in rainfed and irrigated crop yield response to climate in the western US. Environ. Res. Lett. 2018, 13, 064031. [Google Scholar] [CrossRef]
- Schauberger, B.; Archontoulis, S.; Arneth, A.; Balkovic, J.; Ciais, P.; Deryng, D.; Elliott, J.; Folberth, C.; Khabarov, N.; Müller, C.; et al. Consistent negative response of US crops to high temperatures in observations and crop models. Nat. Commun. 2017, 8, 13931. [Google Scholar] [CrossRef] [PubMed] [Green Version]
- Zipper, S.C.; Qiu, J.; Kucharik, C.J. Drought effects on US maize and soybean production: Spatiotemporal patterns and historical changes. Environ. Res. Lett. 2016, 11, 094021. [Google Scholar] [CrossRef]
- Zhang, T.; Lin, X.; Sassenrath, G.F. Current irrigation practices in the central United States reduce drought and extreme heat impacts for maize and soybean, but not for wheat. Sci. Total Environ. 2015, 508, 331–342. [Google Scholar] [CrossRef] [PubMed]
- Aragón, P.; Sánchez-Fernández, D.; Hernando, C. Use of satellite images to characterize the spatio-temporal dynamics of primary productivity in hotspots of endemic Iberian butterflies. Ecol. Indic. 2019, 106, 105449. [Google Scholar] [CrossRef]
- Kath, J.; Le Brocque, A.F.; Reardon-Smith, K.; Apan, A. Remotely sensed agricultural grassland productivity responses to land use and hydro-climatic drivers under extreme drought and rainfall. Agric. For. Meteorol. 2019, 268, 11–22. [Google Scholar] [CrossRef]
- Rahman, A.F.; Sims, D.A.; Cordova, V.D.; El-Masri, B.Z. Potential of MODIS EVI and surface temperature for directly estimating per-pixel ecosystem C fluxes. Geophys. Res. Lett. 2005, 32, 1–4. [Google Scholar] [CrossRef] [Green Version]
- Huete, A.; Didan, K.; Miura, T.; Rodriguez, E.; Gao, X.; Ferreira, L. Overview of the radiometric and biophysical performance of the MODIS vegetation indices. Remote Sens. Environ. 2002, 83, 195–213. [Google Scholar] [CrossRef]
- Liu, X.; Shen, Y.; Guo, Y.; Li, S.; Guo, B. Modeling demand/supply of water resources in the arid region of northwestern China during the late 1980s to 2010. J. Geogr. Sci. 2015, 25, 573–591. [Google Scholar] [CrossRef]
- Millenium Ecosystem Assessment. Ecosystems & Human Well-Being: Synthesis; Island Press: Washington, DC, USA, 2005; ISBN 1-59726-040-1. [Google Scholar]
- Li, J.; Liu, Z.; He, C.; Tu, W.; Sun, Z. Are the drylands in northern China sustainable? A perspective from ecological footprint dynamics from 1990 to 2010. Sci. Total Environ. 2016, 553, 223–231. [Google Scholar] [CrossRef] [PubMed]
- Yang, X.; Ci, L.; Zhang, X. Dryland characteristics and its optimized eco-productive paradigms for sustainable development in China. Nat. Resour. Forum 2008, 32, 215–227. [Google Scholar] [CrossRef]
- Chen, H.; Sun, J. Changes in Drought Characteristics over China Using the Standardized Precipitation Evapotranspiration Index. J. Clim. 2015, 28, 5430–5447. [Google Scholar] [CrossRef]
- Zhao, S.; Cong, D.; He, K.; Yang, H.; Qin, Z. Spatial-Temporal Variation of Drought in China from 1982 to 2010 Based on a modified Temperature Vegetation Drought Index (mTVDI). Sci. Rep. 2017, 7, 17473. [Google Scholar] [CrossRef] [PubMed]
- Ministry of Agriculture of the People’s Republic of China. Statistics of New China’s Agriculture in 60 Years; China Agriculture Press: Beijing, China, 2009.
- Zhu, X.; Zhu, W.; Zhang, J.; Pan, Y. Mapping Irrigated Areas in China From Remote Sensing and Statistical Data. IEEE J. Sel. Top. Appl. Earth Obs. Remote Sens. 2014, 7, 4490–4504. [Google Scholar] [CrossRef]
- Van Der Schrier, G.; Barichivich, J.; Briffa, K.R.; Jones, P. A scPDSI-based global data set of dry and wet spells for 1901-2009. J. Geophys. Res. Atmos. 2013, 118, 4025–4048. [Google Scholar] [CrossRef]
- Palmer, W.C. Meteorological Drought; U.S. Department of Commerce Weather Bureau Research Paper No. 45; US Weather Bureau: Washington, DC, USA, 1965.
- Ayantobo, O.O.; Wei, J. Appraising regional multi-category and multi-scalar drought monitoring using standardized moisture anomaly index (SZI): A water-energy balance approach. J. Hydrol. 2019, 579, 124139. [Google Scholar] [CrossRef]
- Wells, N.; Goddard, S.; Hayes, M.J. A self-calibrating Palmer Drought Severity Index. J. Clim. 2004, 17, 2335–2351. [Google Scholar] [CrossRef]
- Zhang, X.; Tan, B.; Yu, Y. Interannual variations and trends in global land surface phenology derived from enhanced vegetation index during 1982–2010. Int. J. Biometeorol. 2014, 58, 547–564. [Google Scholar] [CrossRef] [PubMed] [Green Version]
- Papagiannopoulou, C.; Miralles, D.G.; Decubber, S.; Demuzere, M.; Verhoest, N.E.C.; Dorigo, W.A.; Waegeman, W. A non-linear Granger-causality framework to investigate climate–vegetation dynamics. Geosci. Model Dev. 2017, 10, 1945–1960. [Google Scholar] [CrossRef] [Green Version]
- Lanzante, J.R. Resistant, robust and non-parametric techniques for the analysis of climate data: Theory and examples, including applications to historical radiosonde station data. Int. J. Climatol. 1996, 16, 1197–1226. [Google Scholar] [CrossRef]
- Hoof, C.V.D.; Lambert, F. Mitigation of drought negative effect on ecosystem productivity by vegetation mixing. J. Geophys. Res. Biogeosci. 2016, 121, 2667–2683. [Google Scholar] [CrossRef]
- Jiang, P.; Ding, W.; Yuan, Y.; Ye, W. Diverse response of vegetation growth to multi-time-scale drought under different soil textures in China’s pastoral areas. J. Environ. Manag. 2020, 274, 110992. [Google Scholar] [CrossRef]
- Chaves, M.M.; Maroco, J.P.; Pereira, J.S. Understanding plant responses to drought—From genes to the whole plant. Funct. Plant Biol. 2003, 30, 239–264. [Google Scholar] [CrossRef] [PubMed]
- Fischer, R.A.; Turner, N.C. Plant Productivity in the Arid and Semiarid Zones. Annu. Rev. Plant Physiol. 1978, 29, 277–317. [Google Scholar] [CrossRef]
- Yang, Y.; Guan, H.; Batelaan, O.; McVicar, T.R.; Long, D.; Piao, S.; Liang, W.; Liu, B.; Jin, Z.; Simmons, C.T. Contrasting responses of water use efficiency to drought across global terrestrial ecosystems. Sci. Rep. 2016, 6, 23284. [Google Scholar] [CrossRef] [Green Version]
- De Keersmaecker, W.; Lhermitte, S.; Tits, L.; Honnay, O.; Somers, B.; Coppin, P. A model quantifying global vegetation resistance and resilience to short-term climate anomalies and their relationship with vegetation cover. Glob. Ecol. Biogeogr. 2015, 24, 539–548. [Google Scholar] [CrossRef]
- Liu, L.; Zhang, Y.; Wu, S.; Li, S.; Qin, D. Water memory effects and their impacts on global vegetation productivity and resilience. Sci. Rep. 2018, 8, 1–9. [Google Scholar] [CrossRef]
- Papagiannopoulou, C.; Miralles, D.G.; Demuzere, M.; Verhoest, N.E.C.; Waegeman, W. Global hydro-climatic biomes identified via multitask learning. Geosci. Model Dev. 2018, 11, 4139–4153. [Google Scholar] [CrossRef] [Green Version]
- Vicente-Serrano, S.M.; Gouveia, C.; Camarero, J.J.; Beguería, S.; Trigo, R.M.; López-Moreno, J.I.; Azorín-Molina, C.; Pasho, E.; Lorenzo-Lacruz, J.; Revuelto, J.; et al. Response of vegetation to drought time-scales across global land biomes. Proc. Natl. Acad. Sci. USA 2013, 110, 52–57. [Google Scholar] [CrossRef] [PubMed] [Green Version]
- Zhao, H.; Gao, G.; An, W.; Zou, X.; Li, H.; Hou, M. Timescale differences between SC-PDSI and SPEI for drought monitoring in China. Phys. Chem. Earth Parts A/B/C 2017, 102, 48–58. [Google Scholar] [CrossRef]
- Muller, K.; O’Connor, T.G.; Henschel, J.R. Impact of a severe frost event in 2014 on woody vegetation within the Nama-Karoo and semi-arid savanna biomes of South Africa. J. Arid. Environ. 2016, 133, 112–121. [Google Scholar] [CrossRef]
- Wolf, A.; Kozlov, M.V.; Callaghan, T.V. Impact of non-outbreak insect damage on vegetation in northern Europe will be greater than expected during a changing climate. Clim. Chang. 2007, 87, 91–106. [Google Scholar] [CrossRef]
Figure 1.
The location and land cover type of the drylands in northern China (land cover type is from LUCC 2000).
Figure 1.
The location and land cover type of the drylands in northern China (land cover type is from LUCC 2000).

Figure 2.
Methodology flowchart.

Figure 3.
The spatial distribution of trends in drought (a) and enhanced vegetation index (EVI) (b) during growing season in farmland ecosystems in the drylands of northern China (DNC) from 2000 to 2018. ** means significance of trends were assessed at p < 0.05.
Figure 3.
The spatial distribution of trends in drought (a) and enhanced vegetation index (EVI) (b) during growing season in farmland ecosystems in the drylands of northern China (DNC) from 2000 to 2018. ** means significance of trends were assessed at p < 0.05.

Figure 4.
Trends in drought and EVI during the growing season in farmland ecosystems in the DNC from 2000 to 2018. (a) scPDSI in arid drylands, (b) EVI in arid drylands, (c) scPDSI in semi-arid drylands, and (d) EVI in semi-arid drylands. ** means significance of trends were assessed at p < 0.05. (The lines marked with square blocks represent the true values; black solid lines represent the linear fitting values.).

Figure 5.
The proportion of drought-affected area in arid drylands (a) and semi-arid drylands (b) from 2000 to 2018. * indicates statistical significance at 0.1 level. ** indicates statistical significance at 0.05 level.
Figure 5.
The proportion of drought-affected area in arid drylands (a) and semi-arid drylands (b) from 2000 to 2018. * indicates statistical significance at 0.1 level. ** indicates statistical significance at 0.05 level.

Figure 6.
The average proportion of pixels in each lag month. (Only pixels with statistically significant correlation coefficients were considered.).
Figure 6.
The average proportion of pixels in each lag month. (Only pixels with statistically significant correlation coefficients were considered.).

Figure 7.
Correlation coefficients and linear fitting slopes between scPDSI anomalies and EVI anomalies of farmland ecosystems during the growing season in the DNC from 2000 to 2018: (a) correlation in arid drylands, (b) correlation in semi-arid drylands, (c) linear fitting slopes in arid drylands, and (d) linear fitting slopes in semi-arid drylands. (** indicates statistical significance at 0.05 level.).


Table 1.
The proportion of irrigated farmland and rainfed farmland.
| Region | Area of Irrigated Farmland (km2) | Area of Rainfed Farmland (km2) | Proportion of Irrigated Farmland | Proportion of Rainfed Farmland |
|---|---|---|---|---|
| Arid drylands | 66,036.25 | 77,754.96 | 45.93% | 54.07% |
| Semi-arid drylands | 72,462.00 | 268,030.08 | 21.28% | 78.72% |
| DNC | 138,498.25 | 345,785.04 | 28.60% | 71.40% |
Note: The data in Table 1 were calculated according to the distribution map of irrigated and rainfed farmland in China at 1 km resolution in 2000 [35]. The proportion of irrigated/rainfed farmland in a given region was calculated by dividing the area of irrigated/rainfed farmland by the total farmland area in that region.
Table 2.
Drought classification by self-calibrated Palmer drought severity index (scPDSI) value [36].
Table 2.
Drought classification by self-calibrated Palmer drought severity index (scPDSI) value [36].
| Drought Category | scPDSI Value |
|---|---|
| Extremely wet | >4 |
| Severely wet | 3~4 |
| Moderately wet | 2~3 |
| Slightly wet | 1~2 |
| Incipient wet spell | 0.5~1 |
| Near normal | −0.5~0.5 |
| Incipient dry spell | −1~−0.5 |
| Slightly dry | −2~−1 |
| Moderately dry | −3~−2 |
| Severely dry | −4~−3 |
| Extremely dry | <−4 |
Table 3.
Coefficients and linear fitting slopes between scPDSI anomalies and EVI anomalies of irrigated farmland, rainfed farmland, and natural vegetation.
Table 3.
Coefficients and linear fitting slopes between scPDSI anomalies and EVI anomalies of irrigated farmland, rainfed farmland, and natural vegetation.
| Region | DNC | Arid Drylands | Semi-Arid Drylands | |
|---|---|---|---|---|
| Correlation | Irrigated farmland (Ic) | 0.628 | 0.534 | 0.669 |
| Rainfed farmland (Rc) | 0.761 | 0.661 | 0.781 | |
| Natural vegetation (Vc) | 0.659 | 0.740 | 0.542 | |
| Linear fitting slope (/10−3) | Irrigated farmland (Is) | 2.991 | 1.970 | 4.165 |
| Rainfed farmland (Rs) | 7.414 | 4.219 | 8.657 | |
| Natural vegetation (Vs) | 3.738 | 2.809 | 4.780 | |
| (Rs-Is)/Rs | 59.66% | 53.29% | 51.89% | |
| (Vs-Is)/Vs | 19.98% | 29.85% | 12.87% | |
| (Rs-Vs)/Rs | 49.59% | 33.41% | 44.78% | |
Note: all correlations are statistically significant at 0.05 level.
Publisher’s Note: MDPI stays neutral with regard to jurisdictional claims in published maps and institutional affiliations. |
© 2021 by the authors. Licensee MDPI, Basel, Switzerland. This article is an open access article distributed under the terms and conditions of the Creative Commons Attribution (CC BY) license (http://creativecommons.org/licenses/by/4.0/).
Share and Cite
MDPI and ACS Style
Zhu, X.; Liu, Y.; Xu, K.; Pan, Y. Effects of Drought on Vegetation Productivity of Farmland Ecosystems in the Drylands of Northern China. Remote Sens. 2021, 13, 1179. https://doi.org/10.3390/rs13061179
AMA Style
Zhu X, Liu Y, Xu K, Pan Y. Effects of Drought on Vegetation Productivity of Farmland Ecosystems in the Drylands of Northern China. Remote Sensing. 2021; 13(6):1179. https://doi.org/10.3390/rs13061179
Chicago/Turabian StyleZhu, Xiufang, Ying Liu, Kun Xu, and Yaozhong Pan. 2021. "Effects of Drought on Vegetation Productivity of Farmland Ecosystems in the Drylands of Northern China" Remote Sensing 13, no. 6: 1179. https://doi.org/10.3390/rs13061179
Note that from the first issue of 2016, this journal uses article numbers instead of page numbers. See further details here.