Article

Passive Forward-Scattering Radar Using Digital Video Broadcasting Satellite Signal for Drone Detection

by
Raja Syamsul Azmir Raja Abdullah
1,*,
Surajo Alhaji Musa
1,2,
Nur Emileen Abdul Rashid
3,
Aduwati Sali
1,
Asem Ahmad Salah
4 and
Alyani Ismail
1
1
Wireless and Photonics Networks (WIPNET), Department of Computer and Communication System Engineering, University Putra Malaysia (UPM), Serdang 43400, Malaysia
2
Computer Engineering Department, Institute of Information Technology, Kazaure 3002, Jigawa, Nigeria
3
Microwave Research Institute, University Teknologi MARA, Shah Alam 40450, Selangor, Malaysia
4
Department of Computer System Engineering, Faculty of Engineering and Information Technology, Arab American University, Jenin 44862, West Bank, Palestine
*
Author to whom correspondence should be addressed.
Remote Sens. 2020, 12(18), 3075; https://doi.org/10.3390/rs12183075
Submission received: 4 July 2020 / Revised: 20 August 2020 / Accepted: 23 August 2020 / Published: 19 September 2020

Abstract

:
This paper presents a passive radar system using a signal of opportunity from Digital Video Broadcasting Satellite (DVB-S). The ultimate purpose of the system is to be used as an air traffic monitoring and surveillance system. However, the work focuses on drone detection as a proof of the concept. Detecting a drone by using satellite-based passive radar possess inherent challenges, such as the small radar cross section and low speed. Therefore, this paper proposes a unique method by leveraging the advantage of forward-scattering radar (FSR) topology and characteristics to detect a drone; in other words, the system is known as a passive FSR (p-FSR) system. In the signal-processing algorithm, the empirical mode decomposition (EMD) is applied to the received signal to extract the unique feature vector of the micro-Doppler frequency from the drone’s rotating blades. The paper highlights the p-FSR experimental setup and experiment campaign to detect drones. The experimental results show the feasibility of the p-FSR using a signal transmitted from a satellite to detect flying drone crossing the forward-scatter baseline between the satellite and ground station.

Graphical Abstract

1. Introduction

A quadcopter drone has provided a significant impact on many applications, including aerial imaging, monitoring, search and rescue, security surveillance, entrepreneurial hobbies, and precision agriculture. However, drone usage has gone out of controlled and abused by some users for nefarious activities such as drug smuggling, conveyance of contraband materials such as weapons [1] and other significant vulnerabilities [2], privacy violations, antisocial activities and other unsafe acts [3]. For example, the few havoc incidents caused by sighted drones in airports and drone misuse became vulnerable and causing global concern.
The threat has cultivated lots of research into systems to detect flying drones for necessary action. One of the early methods was based on an acoustic signal to locate the sound source of a drone [4]. However, background noise and sound from other sources like vehicles, birds, and others create some difficulty. An attempt to detect a drone based on video imaging involved the object’s appearance and motion cues, as published in [5]. An object-centric motion was developed to compensate for the changes in the object and the background appearance. This approach can potentially be used for collision avoidance in addition to detection and can, therefore, improve a vision-guided tracking algorithm. However, the system based on image and optical will face difficulty during weather conditions such as rain and snow.
Other works including detecting a drone by listening to the reflected echo of transmitted continuous wireless signals and tracking the radio frequency (RF) transmission between the drone and its controlled point [6]. Cost-effective off the shelves (COTS) technologies involving wireless fidelity (WIFI) and software-defined radios (SDR) were implemented in the work. The author adopted three stages, i.e., detection, location, and mitigation of the RF communication link. The received signature was matched with the bank of signatures stored, using banded search software. The result seems to be successful, yet some challenges due to the new emerging drones may be faced. The problems may include some complications while operating with the 2.4-GHz industrial, scientific and medical (ISM) band, and some drones do not emit RF signals while operating.
In contrast, the radar system is considered suitable due to its robustness in a day or night, noisy and blurred or misty environments [7,8]. However, a drone has peculiar characteristics that makes radar based detection difficult, for example:
  • A drone has a low radar cross-section (RCS) due to its small size, shape, and construction material;
  • A drone flying at low speed and erratic flight path is difficult for conventional short-range radar to detect and measure;
  • A drone flying at low altitude difficult for conventional short/long-range radar, usually 122 m (400ft);
  • A drone has similar behavior to a bird, making it difficult for classification and recognition.
In an attempt to overcome these disadvantages, this paper proposes a passive FSR by utilizing a signal of opportunity from Digital Video Broadcasting Satellite (DVB-S) to detect a drone, which was briefly introduced in the conference paper [9]. This paper provides a comprehensive study on digital video broadcasting satellite (DVB-S) based passive FSR (p-FSR), and a numerical analysis on drone blade’s radar cross section, full-scale experiment and result analysis, as well as new signal processing technique to detect a drone, was presented in the previous paper [10].
The key features to detect the drone in the DVB-S p-FSR rely on the received signal’s Doppler frequency and its micro-Doppler scattered by the drones’ blade. The proposed system will enjoy the advantages of:
  • High RCS in the main lobe of forward-scatter region. Unlike normal radar, target RCS in FSR is practically independent of the radar absorbing material (RAM) coating, which means it can detect drone with stealth capability;
  • Long coherent intervals due to a low drone speed providing a high resolution (∆fFS = 1/∆TFS). This makes it capable of using inverse shadow synthetic aperture for automatic classification/recognition;
  • The integration of FSR into passive mode will make the proposed system covert and possibly low cost as there is no need to develop a dedicated transmitter;
  • The leakage/direct signal, which is ‘unwanted’ in conventional passive bistatic radar, is good for FSR for target detection due to direct signal perturbation;
  • DVB-S is known to have 24 h signal availability and a large coverage footprint. Thus, the system will have good coverage.
Micro-Doppler is a vital feature that resulted from an additional frequency modulation generated from the rotation of the drone’s blade. Detecting micro-Doppler is quite challenging due to its non-constant nature, mainly that the drone is engaged in multiple modes while flying. Because of the non-stationary and non-linear nature of the drone motion, the micro-Doppler became a time-varying component, thus traditional time frequency-processing techniques are non-optimal to extract micro-Doppler. For this reason, an improved signal processing technique is proposed based on empirical mode decomposition (EMD), to extract the unique feature vector from the received signal.
The paper is organized as follows: Section 2 is comprised of the materials and methods, which present the trend of implementation level and the achievement made in drone detection. It also describes the RCS characteristics of a drone’s blade, especially at the forward-scattering radar. Then, the section presents the proposed DVB-S passive FSR system setup, experimental campaign and signal-processing techniques. Section 3 presents the experimental result including vector extraction by EMD and drone detection. A discussion on the results and the performance of the system proceeds after each results presentation. Section 4 concludes the paper and provides a summary of the work, hence, highlights an area of further study.

2. Materials and Methods

Several illuminators explored for passive bistatic radar (only one example of a published paper is cited for each technology) such as the global navigation satellite system (GNSS) [11], Long-Term Evolution (LTE) signal [12], WIFI [13], WIFI (DVB-T) [14], Digital Audio Broadcast (DAB) [15], FM broadcast [16], drone RF signal [17], video surveillance [18]. These illuminators became a boosting tool for passive radar, thereby becoming an important technology for both military and civil applications. Table 1 highlights some of the issues for the abovementioned potential signals.
Many passive FSR approaches, other than DVB-S-based, addressed issues on airborne targets such as RCS verification of different aircraft in [19], detection and classification of helicopters in [20], a feasibility for PFSR implementation in [21,22,23]. Signal characterization and optimization was also presented in [24,25] to improve the detectability of airborne targets. A GNSS signal was further used in [26] to present a signal model and experimental validation of a SISAR image of detected aircraft.
Signal from DVB-S was also explored as an illuminator of opportunity for both ground and airborne target detection. For example, Tsao et al. [27] and Griffiths et al. [28] performed an analysis of the DVB-S signal waveform for radar application. Griffiths et al. [28] used a flat plate reflector within a close range to establish some detection using the system. Another feasibility study involving a simulated signal model and some experimental results was presented in [29,30]. Nevertheless, some unresolved challenges identified envisaged the derailing factor of DVB-S implementation for high-altitude targets, and the difficulty experienced while maintaining the effective detection range for small RCS targets is an issue of concern [31,32]. Consequently, it derails the use of DVB-S-based systems for airborne target detection including the drone.
Some works integrating FSR into a satellite-based system could be found in [33,34]. A shuttle orbiter surveillance was one of the achievements recorded using a geostationary satellite [33]. Additionally, paper [34] describes an optimized system performance by implementing the DVB-S signal into FSR geometry to estimate aircraft velocity. These two (2) papers mark early work on satellite-based passive FSR system for air surveillance. To summarize, Table 2 presented the pros and cons of the DVB-S-based radars so far reported.
Based on our awareness and, referencing Table 2, it is worth noting that the reported literature addressing quadcopter drone detection and its micro-Doppler features extraction by using the DVB-S-based passive FSR system was not yet explored or reported. To complement the knowledge, this paper implemented a passive FSR for drone detection and micro-Doppler feature extraction. It utilizes a signal of opportunity transmitted from a DVB-S (Malaysian satellite Measat3) with the satellite specification presented in 
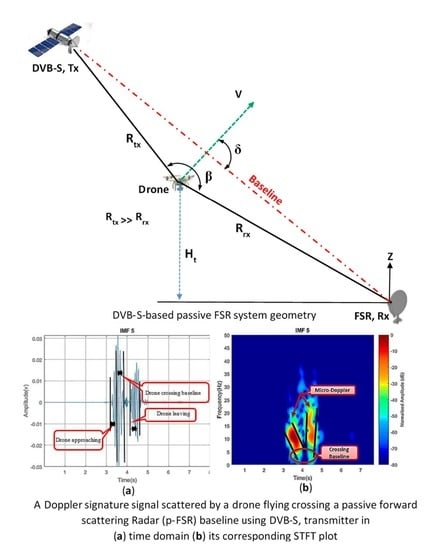
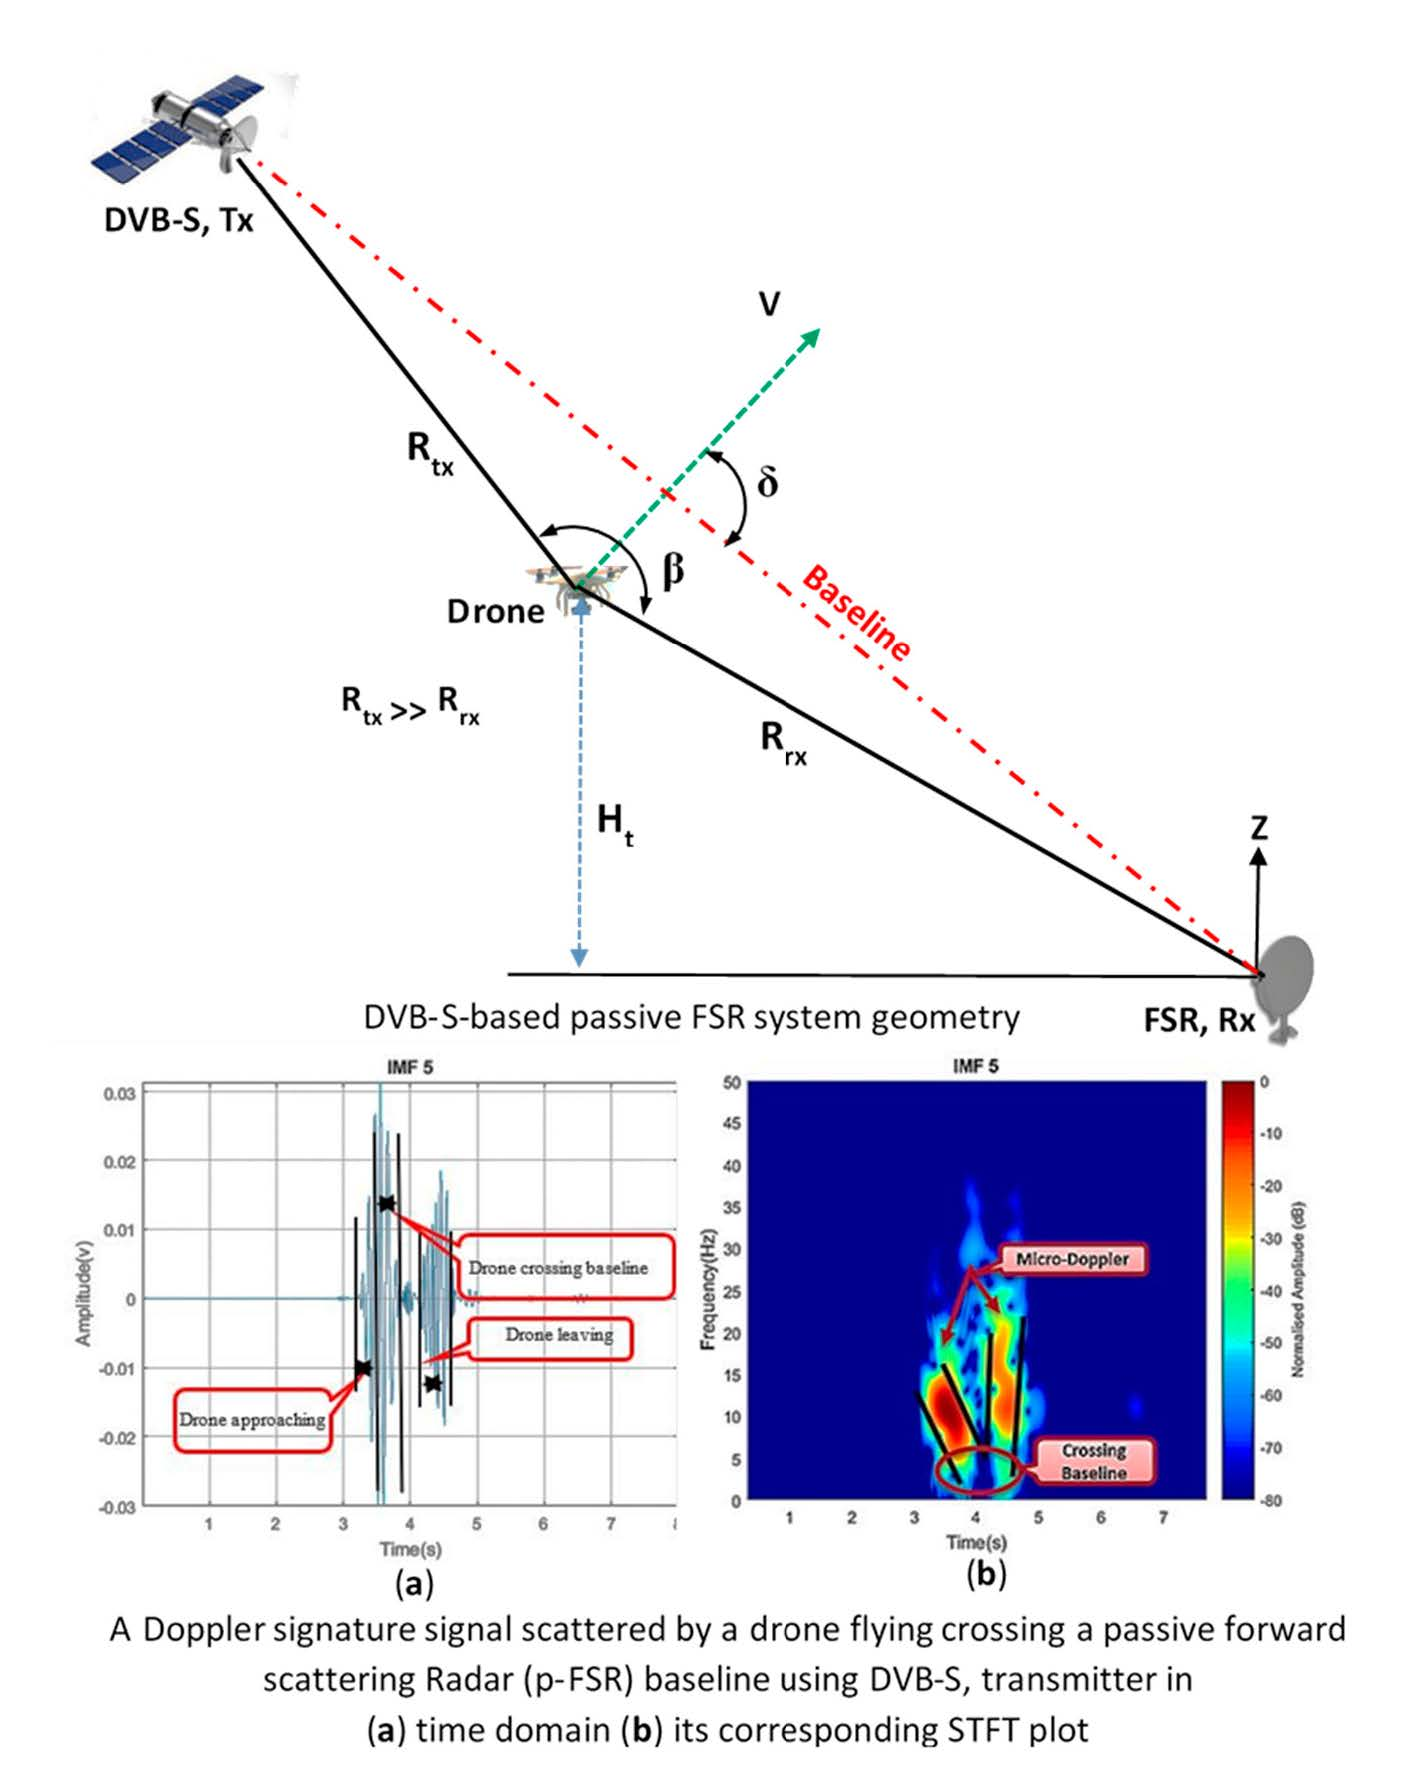
Table 3. The proposed DVB-S-based passive FSR system geometry is illustrated in Figure 1. This paper only focuses on the detection of the drone by utilizing the extracted micro-Doppler feature as the stronghold for the detection based on the established signature of the drone from our findings, as published in [10].

2.1. Radar Cross Section (RCS) of the Drone’s Blade

This section investigates the forward-scattering radar cross section (FS RCS) for the different materials that are used to fabricate the drone’s blade at various plane wave incident angles, φ. The paper assumes the drone could fly in three different directions while crossing the satellite–ground station FS baseline, which are cruising horizontally, flying vertically and flying sideways. All the positions will affect the electromagnetic signal illuminating the drone and, thus, its FS RCS. The EM simulation of the drone blade was conducted by using a computer simulation technology (CST) on a commercial DJI Phantom drone’s blade.
The two different blade materials considered were i. perfect electrical conductor (PEC) and ii. plastic, where most of the drone’s blade was made by these materials. The size of the blade follows the typical size of the commercial Phantom drone’s blade model. Theoretically, parameters influencing the RCS performance include the target physical geometry, material, target external features, radar transmitting frequency, plane wave incident angle, φ and the bistatic angle (β) [36].
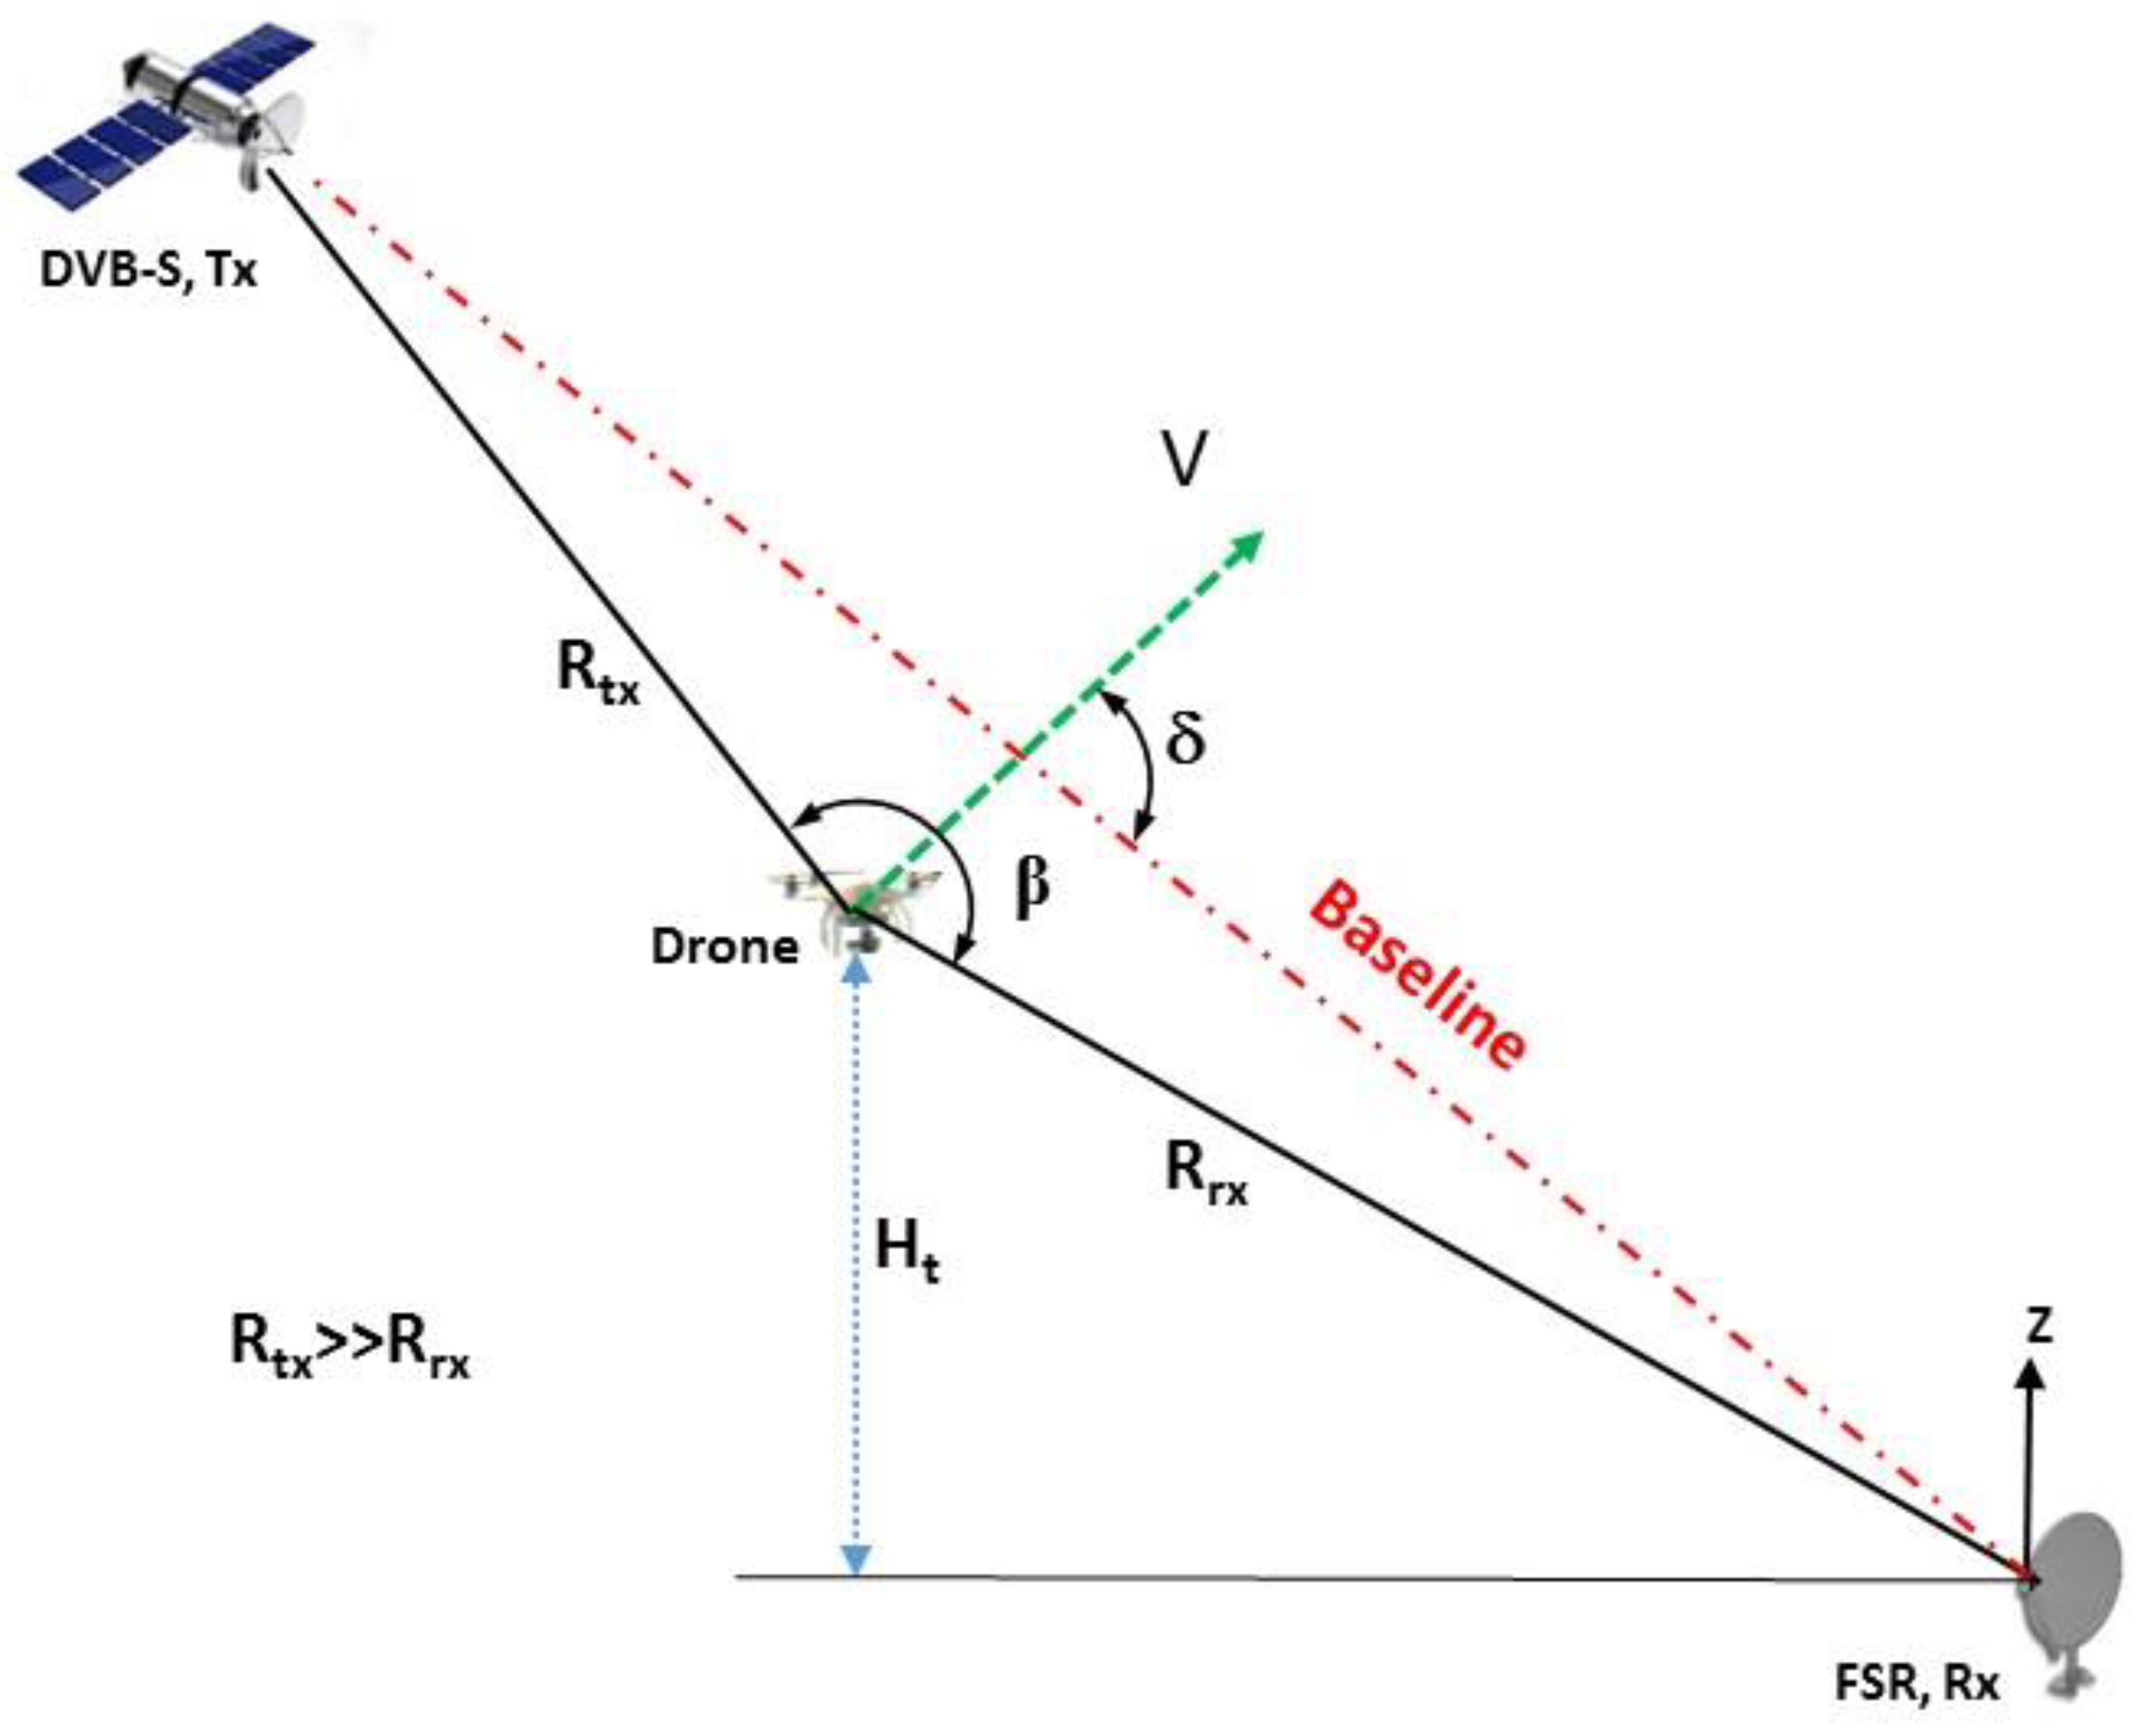
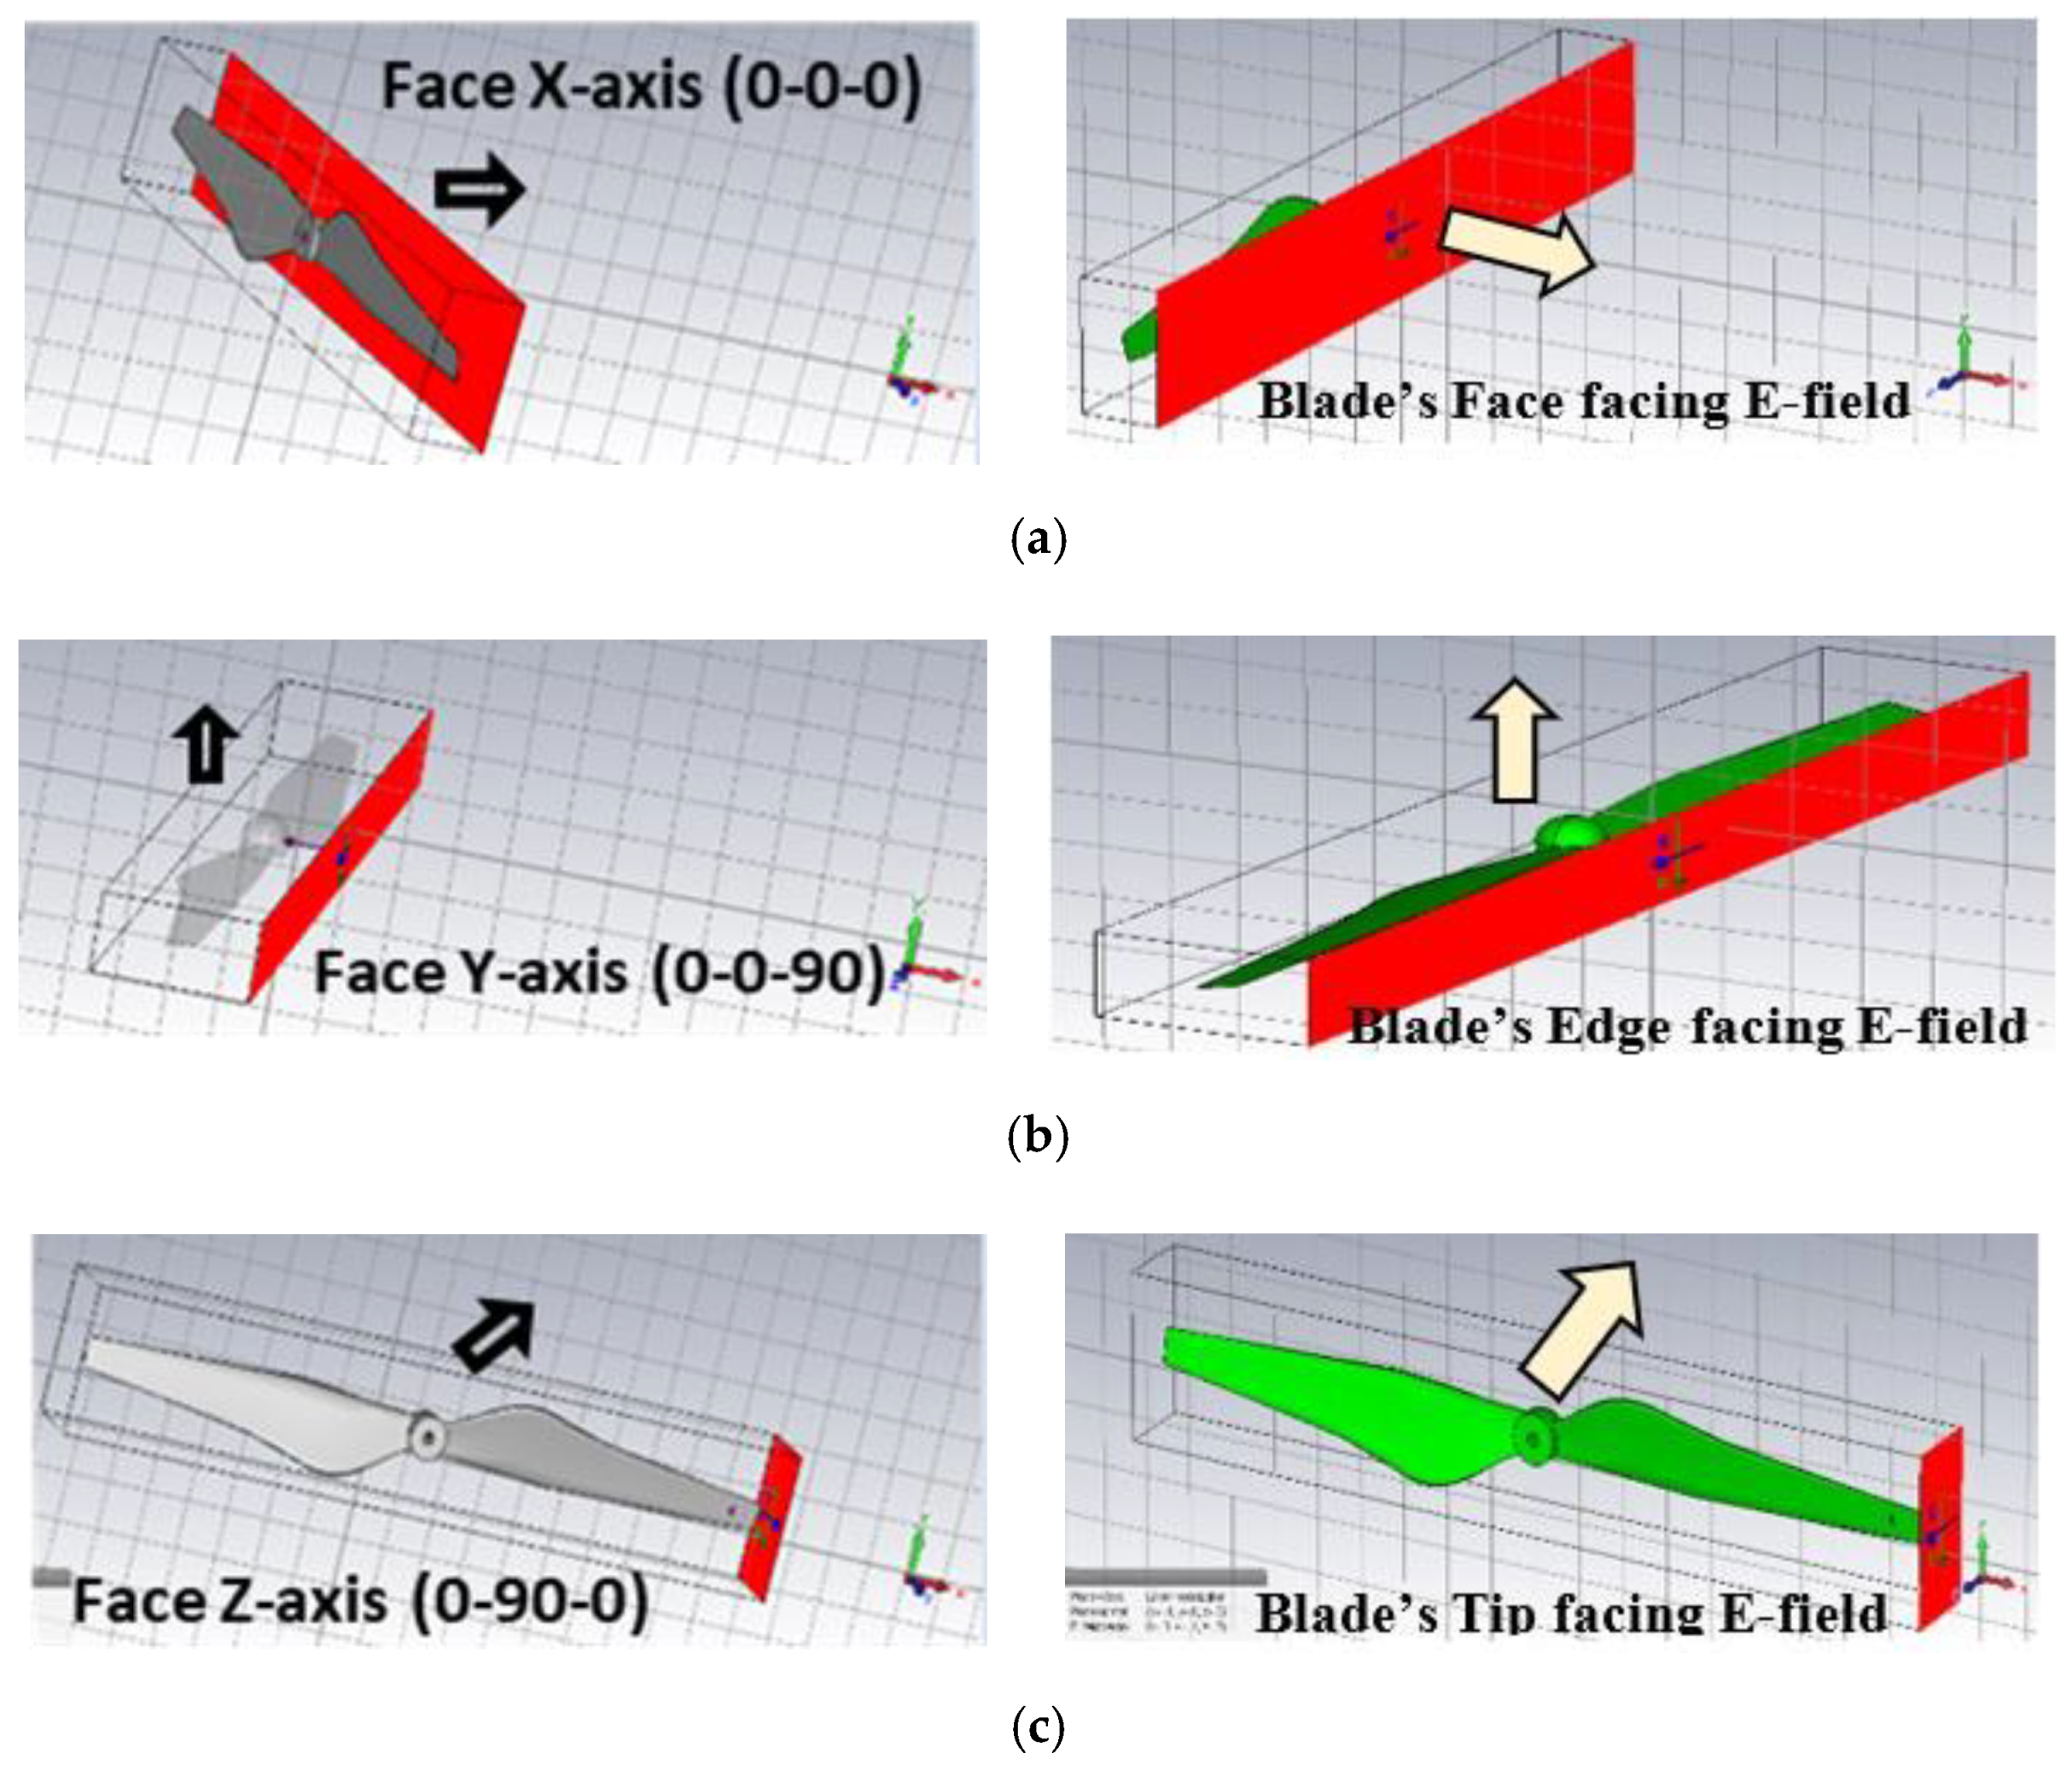
Figure 2 illustrates the blade orientations towards the E-field direction. The blade orientation was defined by their positions in XYZ coordinates. For this case, a linear polarization plane wave with plane normal (x = −1, y = 0, z = 0) and electrical field vector (x = 0, y = −1, z = 0) was used to transform the blade orientation. The blade was positioned along the x-axis for the E-field to be in the direction of the “blade-face”, as in Figure 2a.
The blade was then rotated 90° along the z-axis for the blade to face-up for the “blade-edge” faced the E-field direction, as in Figure 2b, and also rotated another 90° along the y-axis for the “blade-tip” to face the direction of E-field, as in 
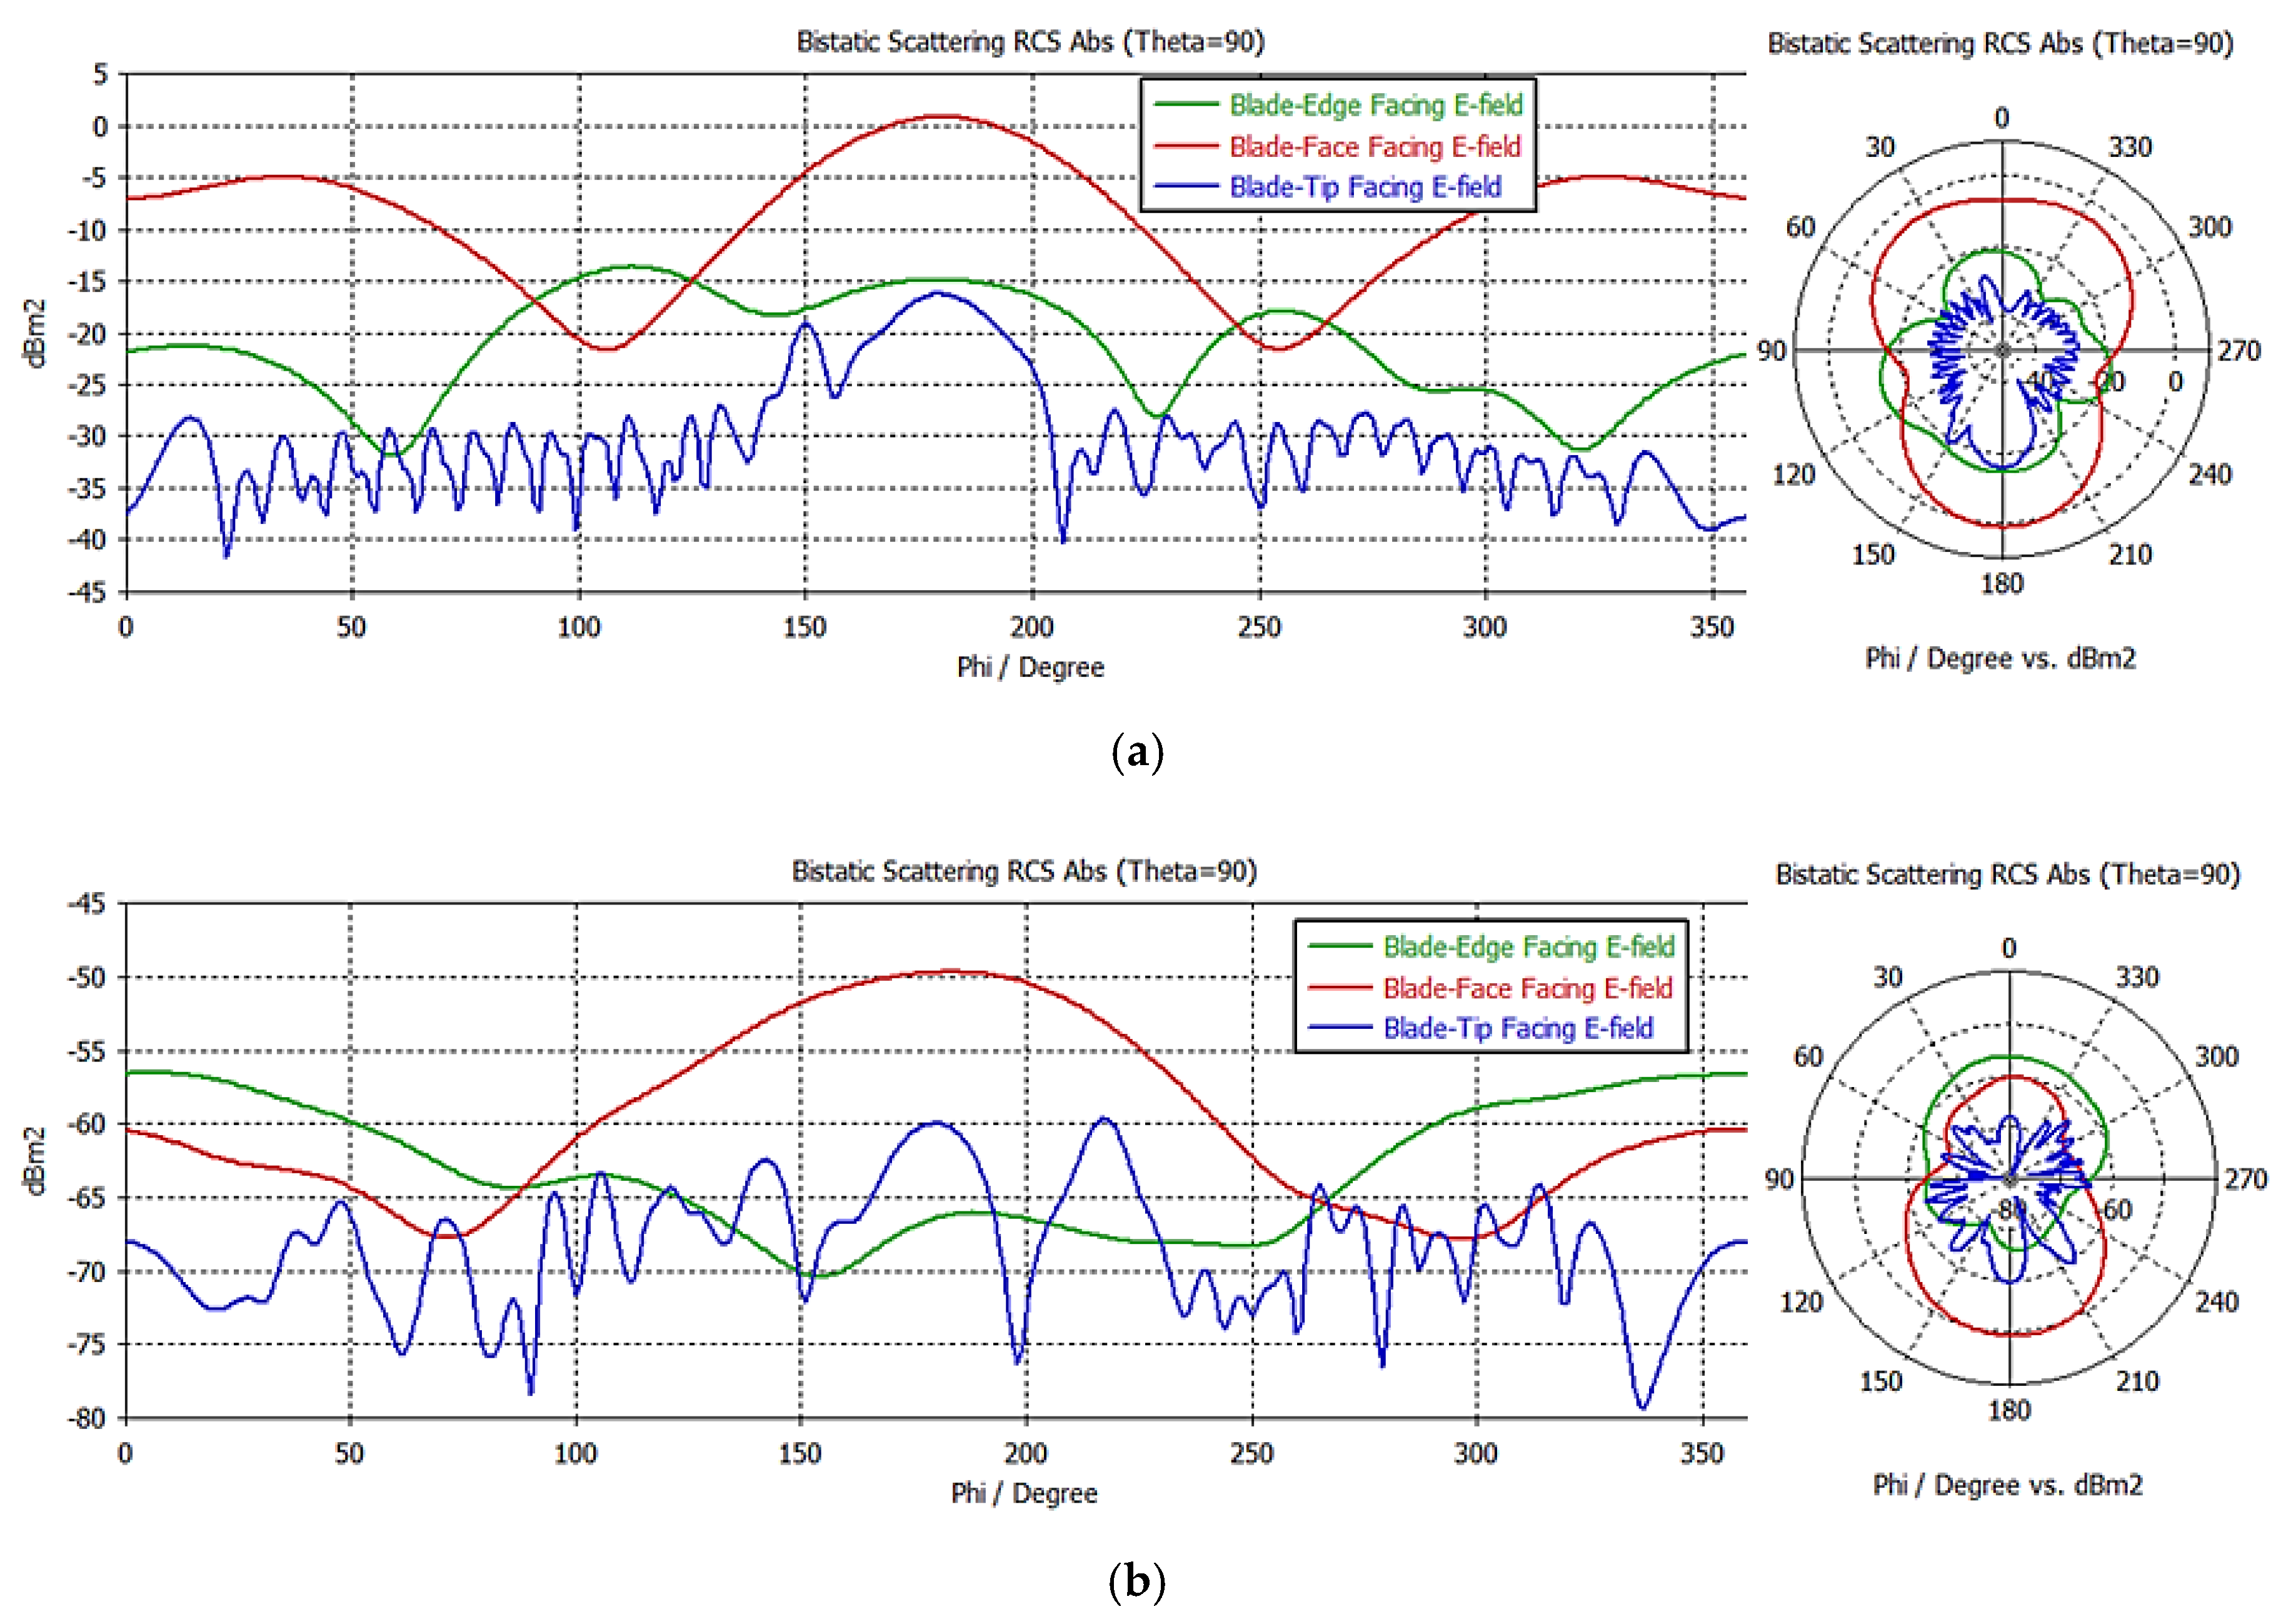
Figure 2c. The RCS representation on the Cartesian and Polar coordinates for both materials and the three different blade orientations are illustrated in Figure 3.
From Figure 3, the bistatic RCS was appreciable at the FS mode (φ = 180°) irrespective of the material and the orientation of the blades. This further revealed the RCS enhancement capability of the FSR geometry, which, in turn, may improve the performance of the system. In summary, Table 4 presents the magnitude and direction of the RCS main lobe and other essential parameters achieved.
It describes that the PEC material, with the blade face facing the E-field direction at a Centre frequency of 11.725 GHz, yields the highest bistatic RCS of 0.877 dBm2. Similarly, for the plastic materials, the highest RCS value is −49.7 dBm2 at 183° of the main lobe’s direction. A similar effect will be expected to be achieved during the detection due to the direction of illumination of the DVB-S signal to the normal flying drone. The look angle is expected to be in the direction of the blade face.

2.2. DVB-S Passive FSR Experimental Campaign for Drone Detection

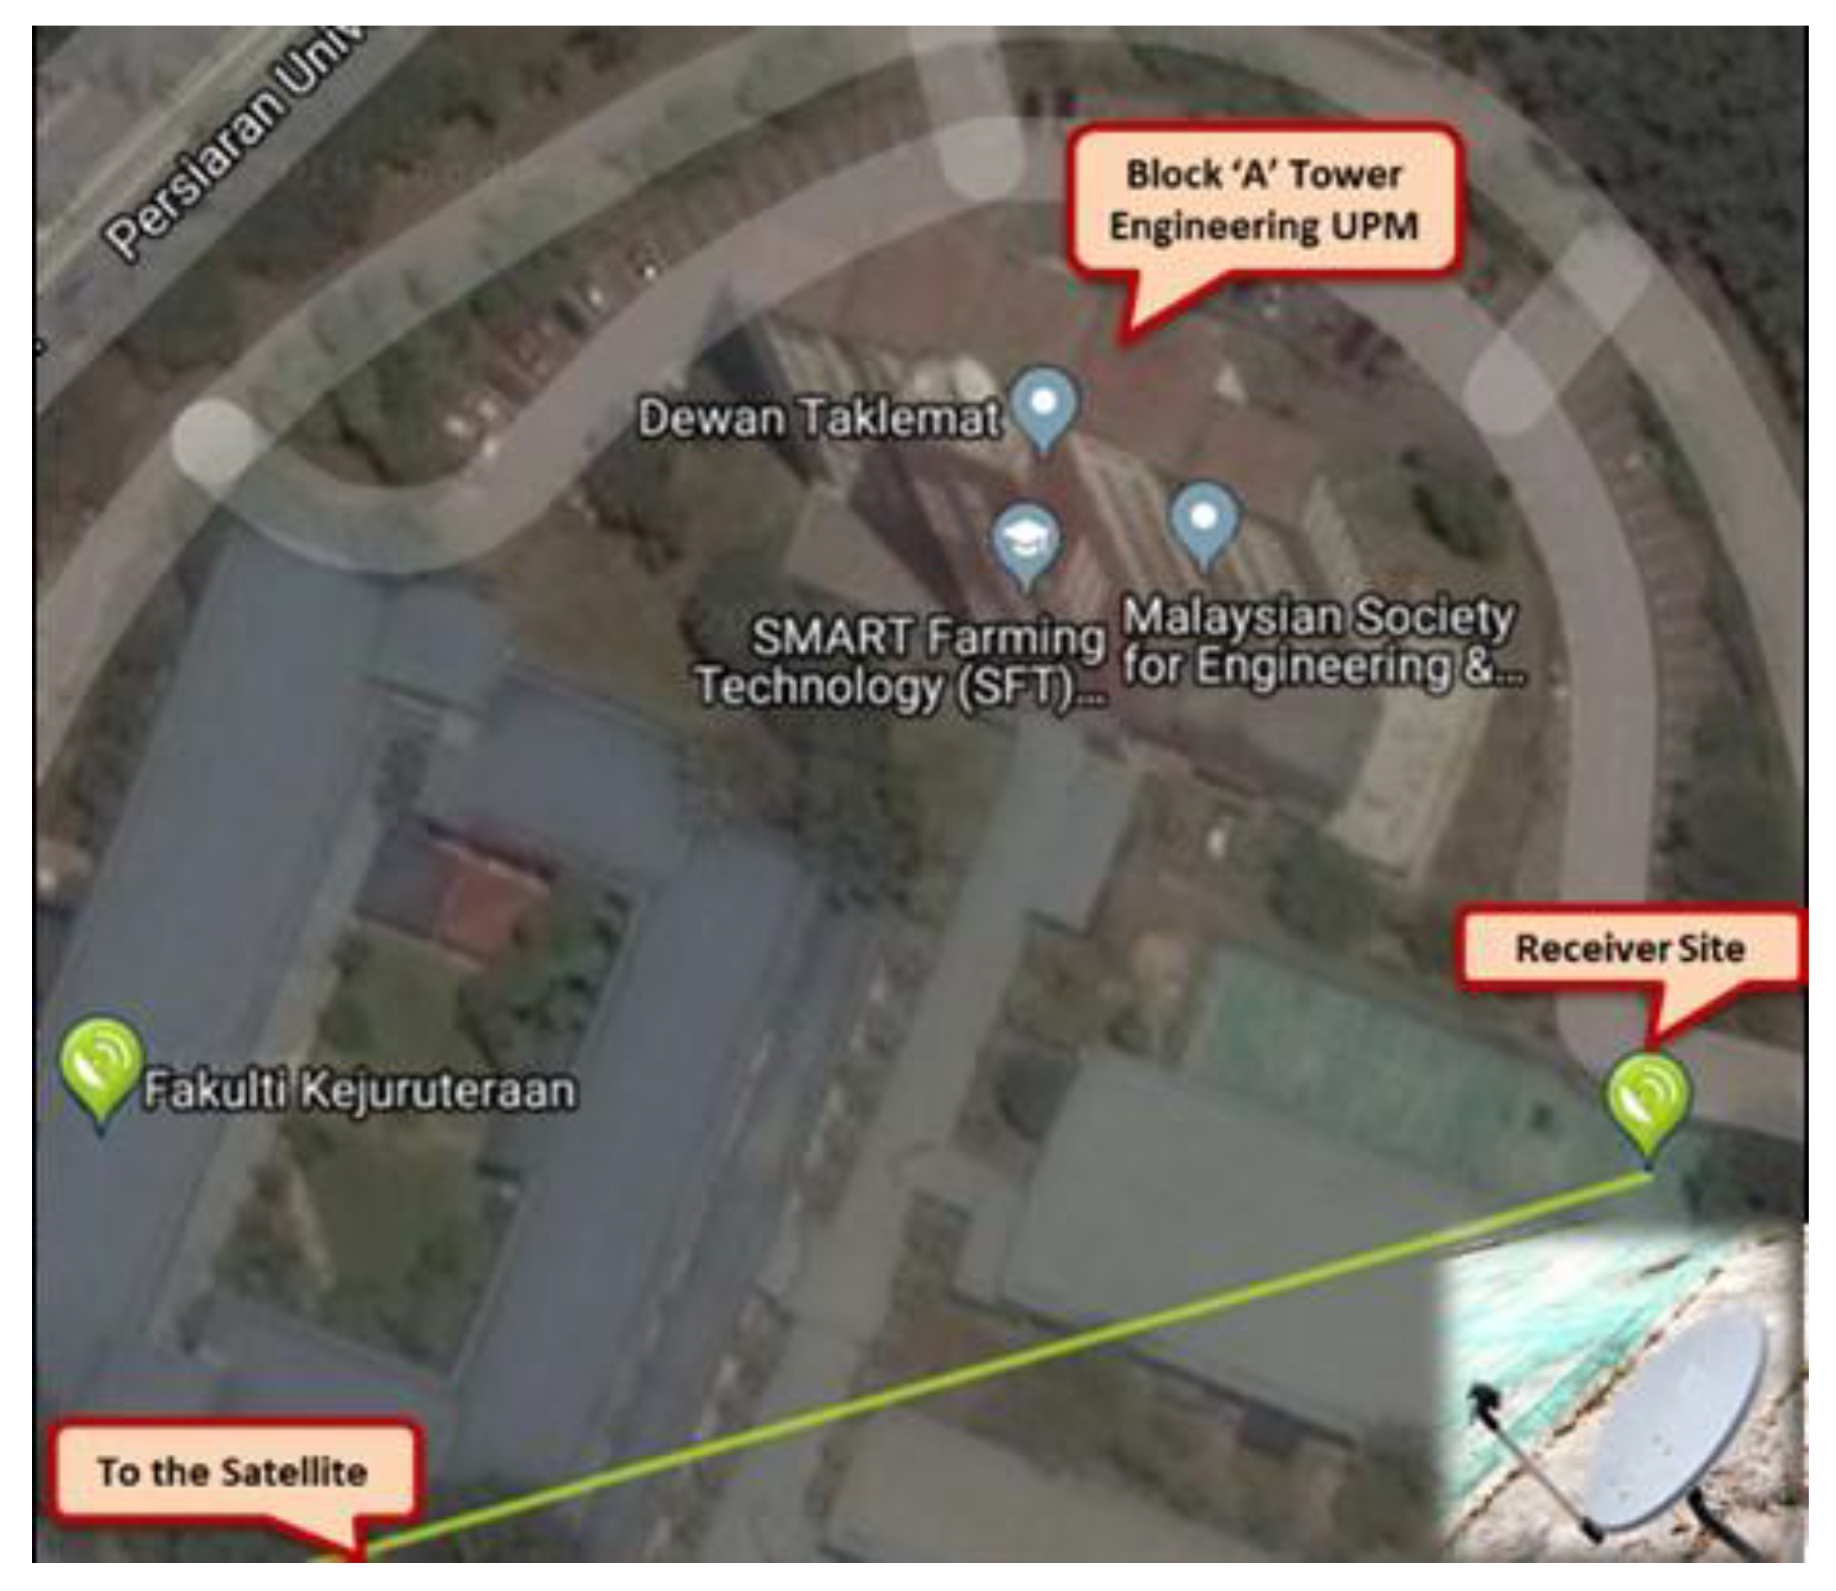
The experiment was conducted in an open area (futsal court), at the Faculty of Engineering, University Putra Malaysia (UPM). A geostationary earth orbit (GEO), DVB-S satellite located at 91.5E, 35,921 km above the sea level was used as the illuminator of opportunity and served as the transmitter. Figure 4 illustrates the aerial view of the experimental site. The FSR topology enables the receiver to receive a signal component of both scattered and the direct signal from the transmitter (signal source), and maintained the general bistatic Doppler frequency equation, as shown in (1) [36]
f d   =   2 v   λ c o s ( β 2 ) c o s ( δ )
where v = moving target velocity, [ c o s ( β 2 ) c o s ( δ ) ] is the coefficient factors due to bistatic geometry, δ is the angle between the velocity direction FS baseline, and λ is the wavelength. For simplicity, the baseline formation between the satellite and the receiver is assumed to have their main lobe be in the same direction.
The FSR receiver circuit is considered simple and comprises of a customized low noise block (LNB) installed attached to the dish antenna. The feed horn is located at the dish’s focal point to receive the focused reflected energy by the dish. The down conversion process begins from the output of the waveguide probe passing through a Ku-band pass filter to remove the unwanted frequencies. Due to the low power signal received, an LNA was made to amplify the signal power to meet the sensitivity level of the amplitude detector and then passes through a low-pass filter. The LPF output is converted to digital form by an analogue to digital converter (ADC) and saved for signal processing. The block diagram of the DVB-S p-FSR receiver is illustrated in Figure 5.
The signal under consideration had an approximate calculated power received of −110 dBm. This signal power was considered low, but sufficient to be utilized by the FSR system; nevertheless, the system further amplified the signal before the non-linear device process. An LNA with a 20-dB gain and a noise figure of 2 dB, with an output capability of up to +25 dBm, was used within Ku-band frequencies. The LNA improved the signal power to the required level for a successful down-conversion process and ensured that the signal power was higher than the diode sensitivity level.
The complete passive FSR system was set up to capture the Measat3 signal waveform. The high gain of the LNA amplified the signal power, and the Measat3 signal waveform was acquired by using a high-definition ADC. In total, 22 transponders by the Measat3 satellite were received. Although multiple transponders can be received at the same time, the transponder having the highest power received was assumed to be utilized in the detection of the target, with little or no Doppler contribution from other channels. The multiple-frequency channels received can also be used to improve the SNR of the received signal, as suggested by [33].
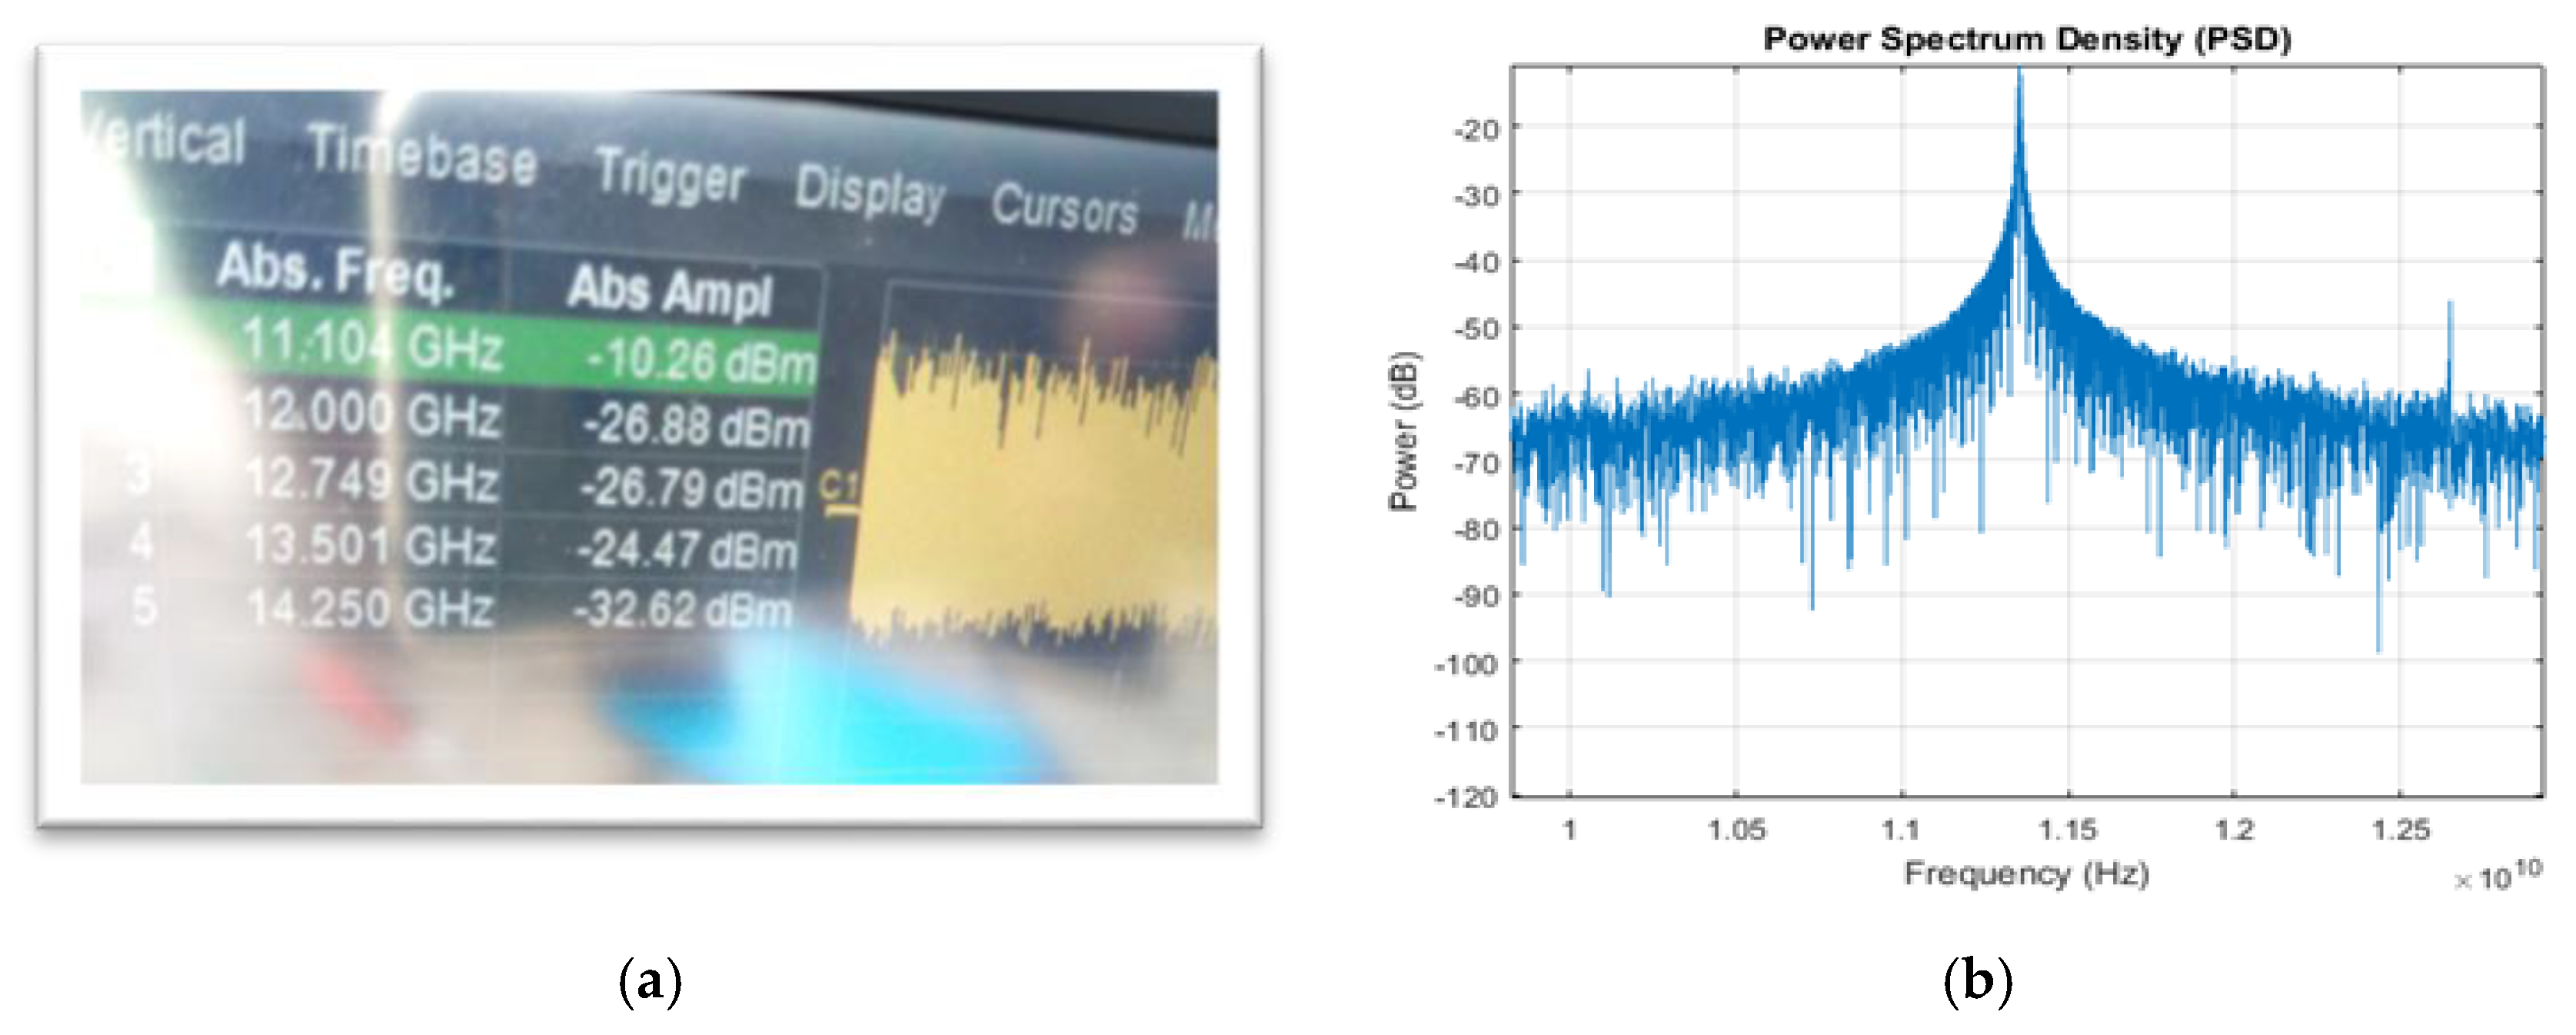
The actual Measat3 signal spectrum of the transponder with the highest power was illustrated in Figure 6. One of the channels received 11.104 GHz and it was the highest power received with −10.26 dBm. Table 5 illustrates all signals received in the order of their power. As indicated in Table 4, the other two channels, 12 and 12.749 GHz, are still within our operating frequencies with −26.88 and −26.79 dBm, respectively.
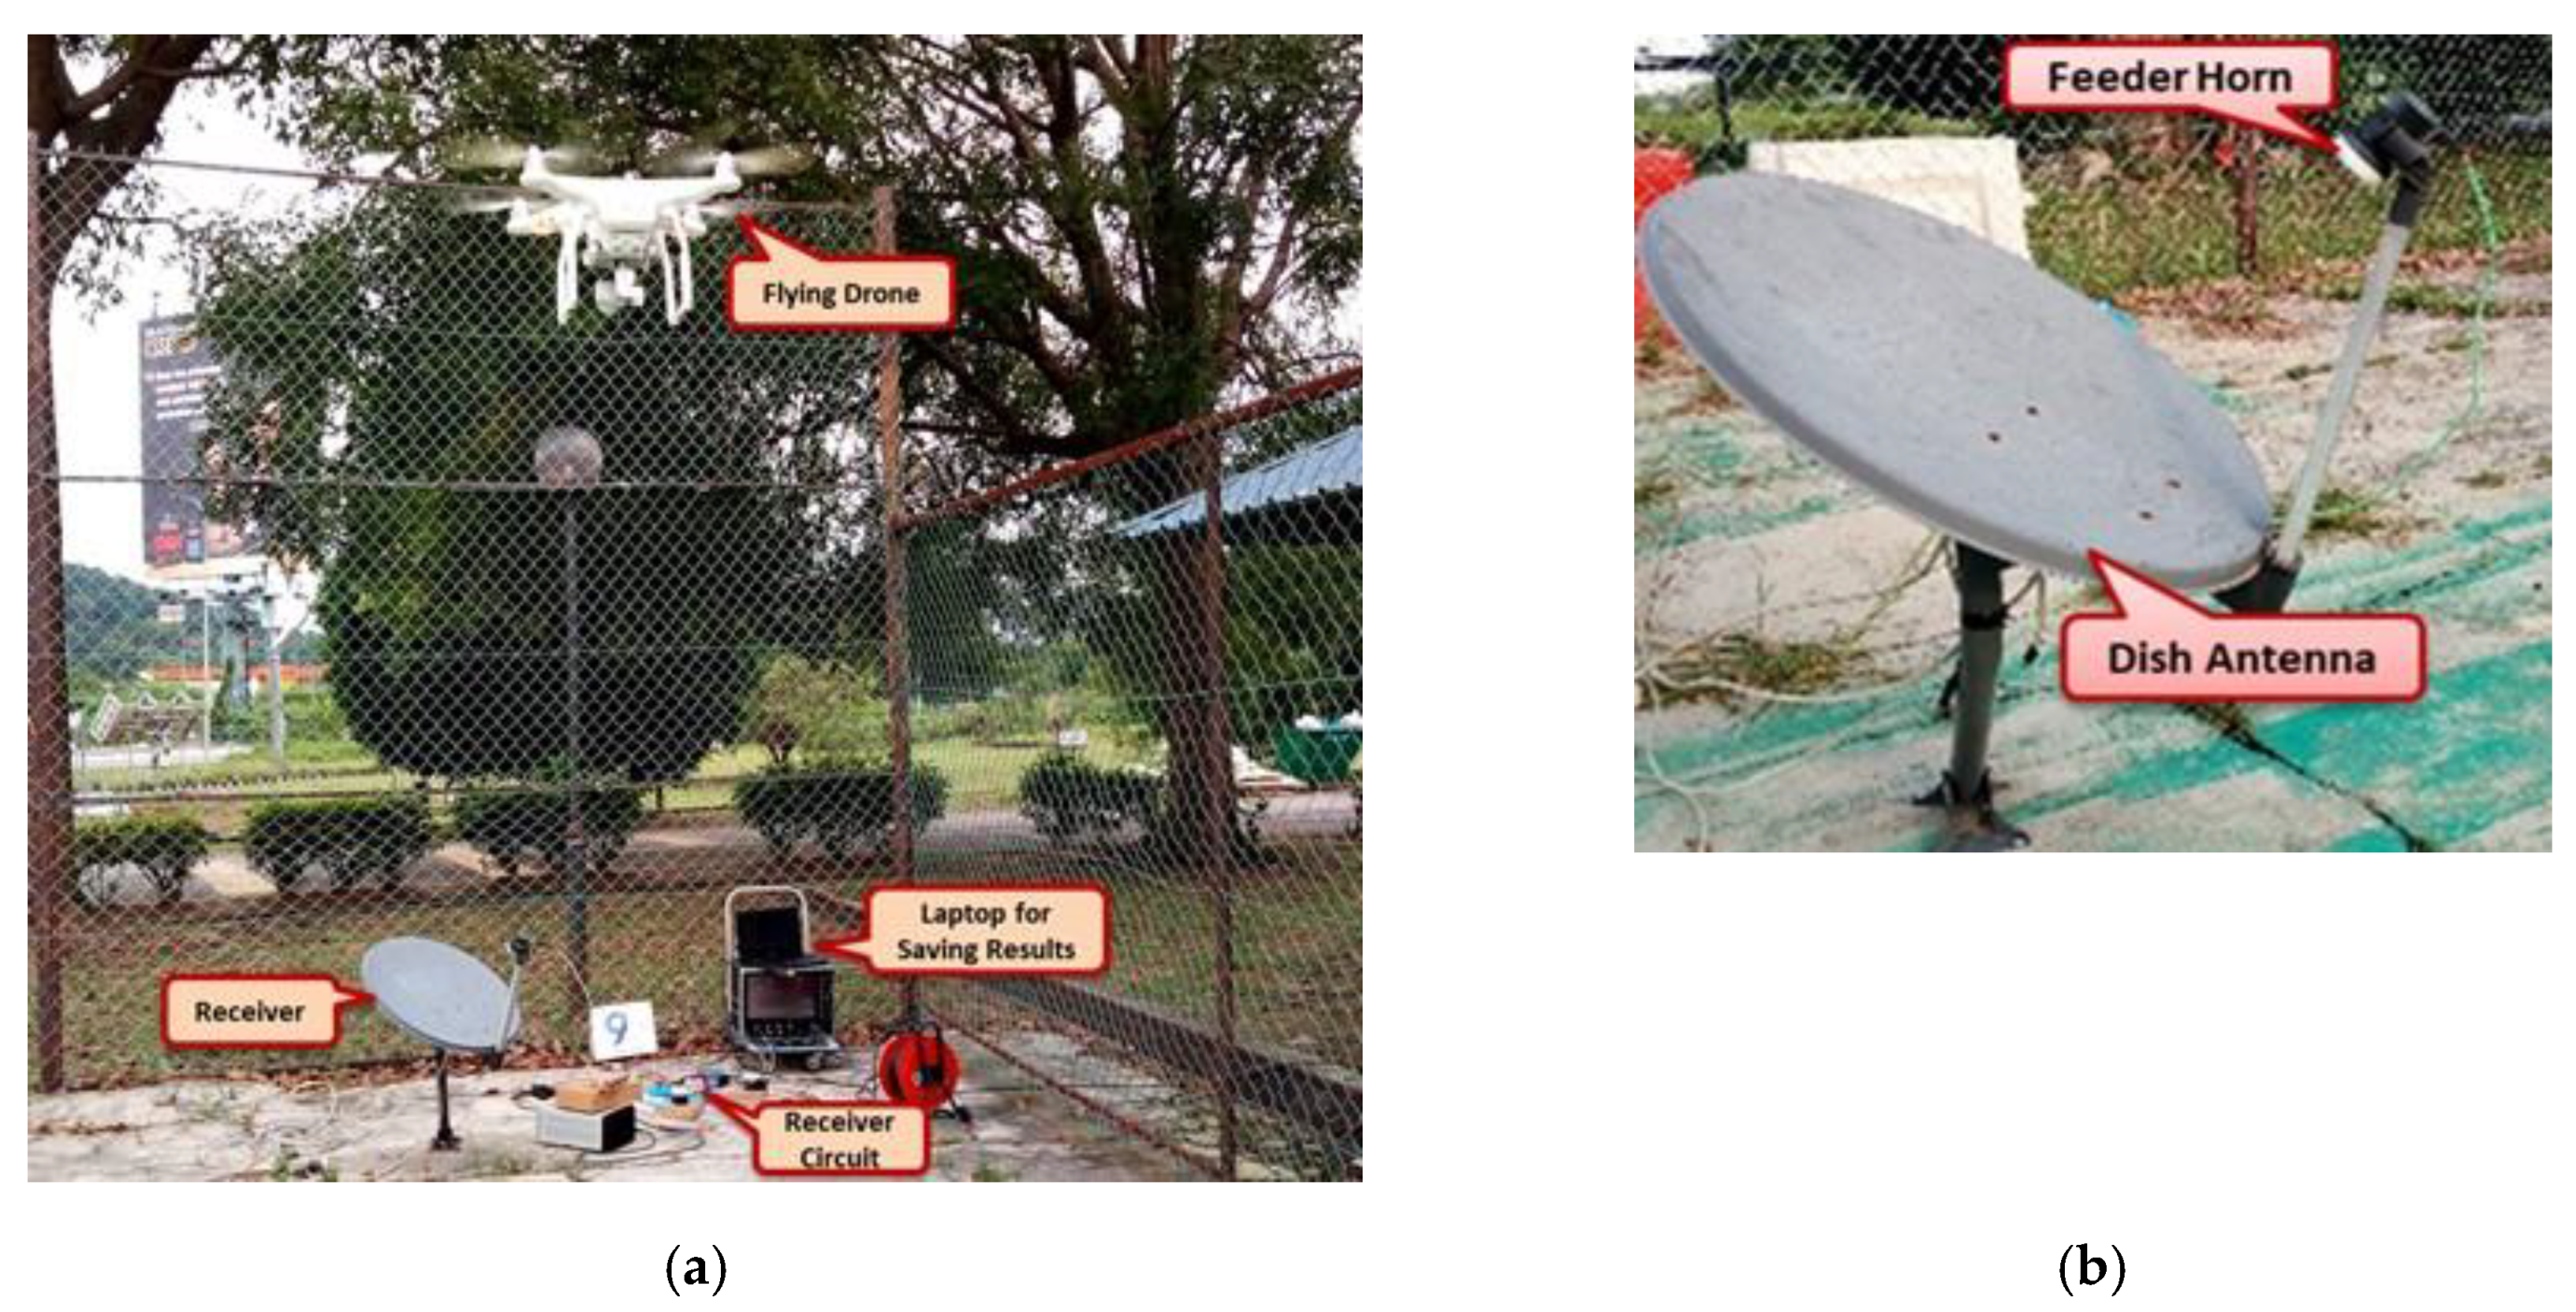
Figure 7 shows the experimental setup of the receiver including the parabolic dish antenna. A parabolic dish antenna was placed to point towards the satellite direction and was located at the end of the futsal court to enable the drone to have enough flying space. Our best efforts were made to decide the baseline between the satellite and the parabolic dish antenna, despite the transmission nature of the DVB-S signal which is circularly polarized. The receiving system parameters are depicted in Table 6. A commercial quadcopter drone was used during the experiment as a target of interest.
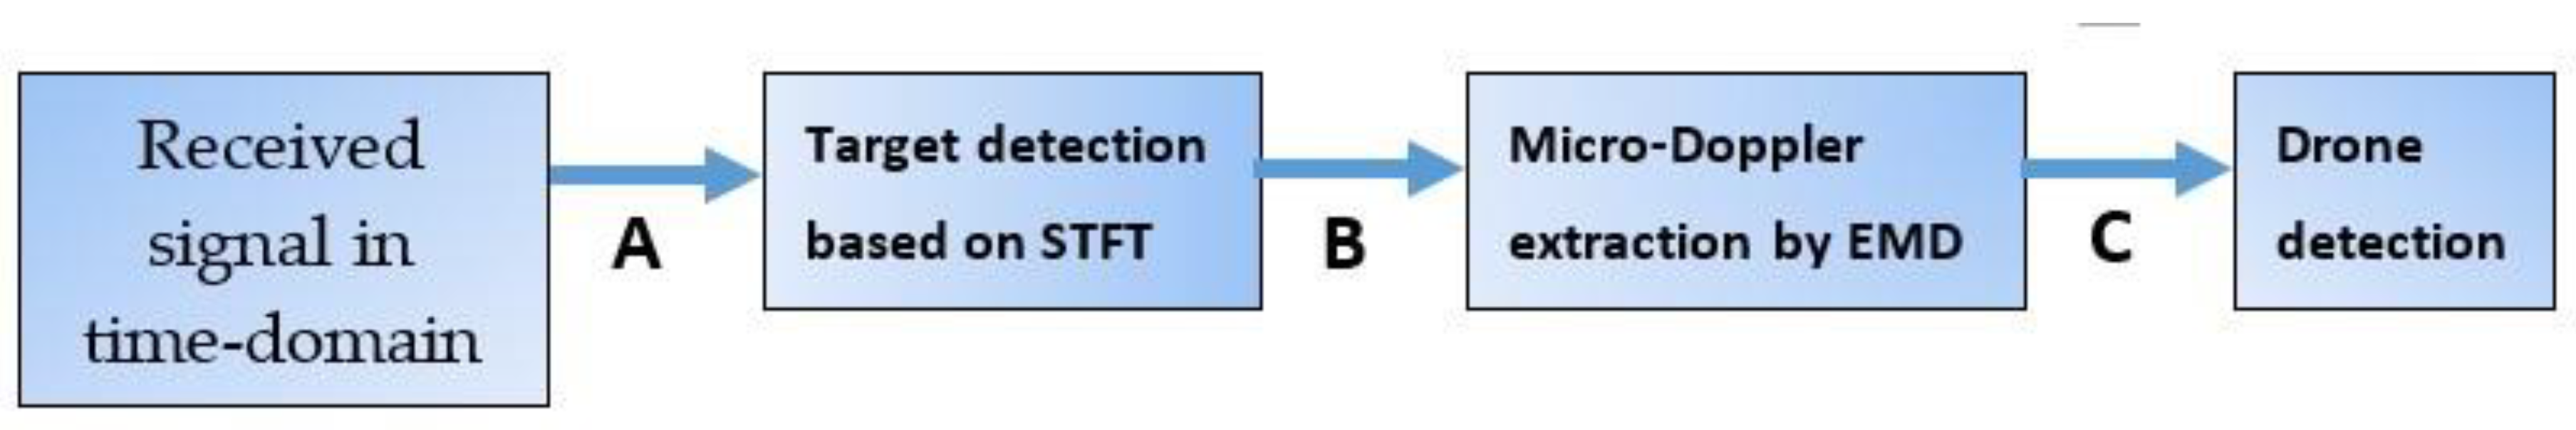
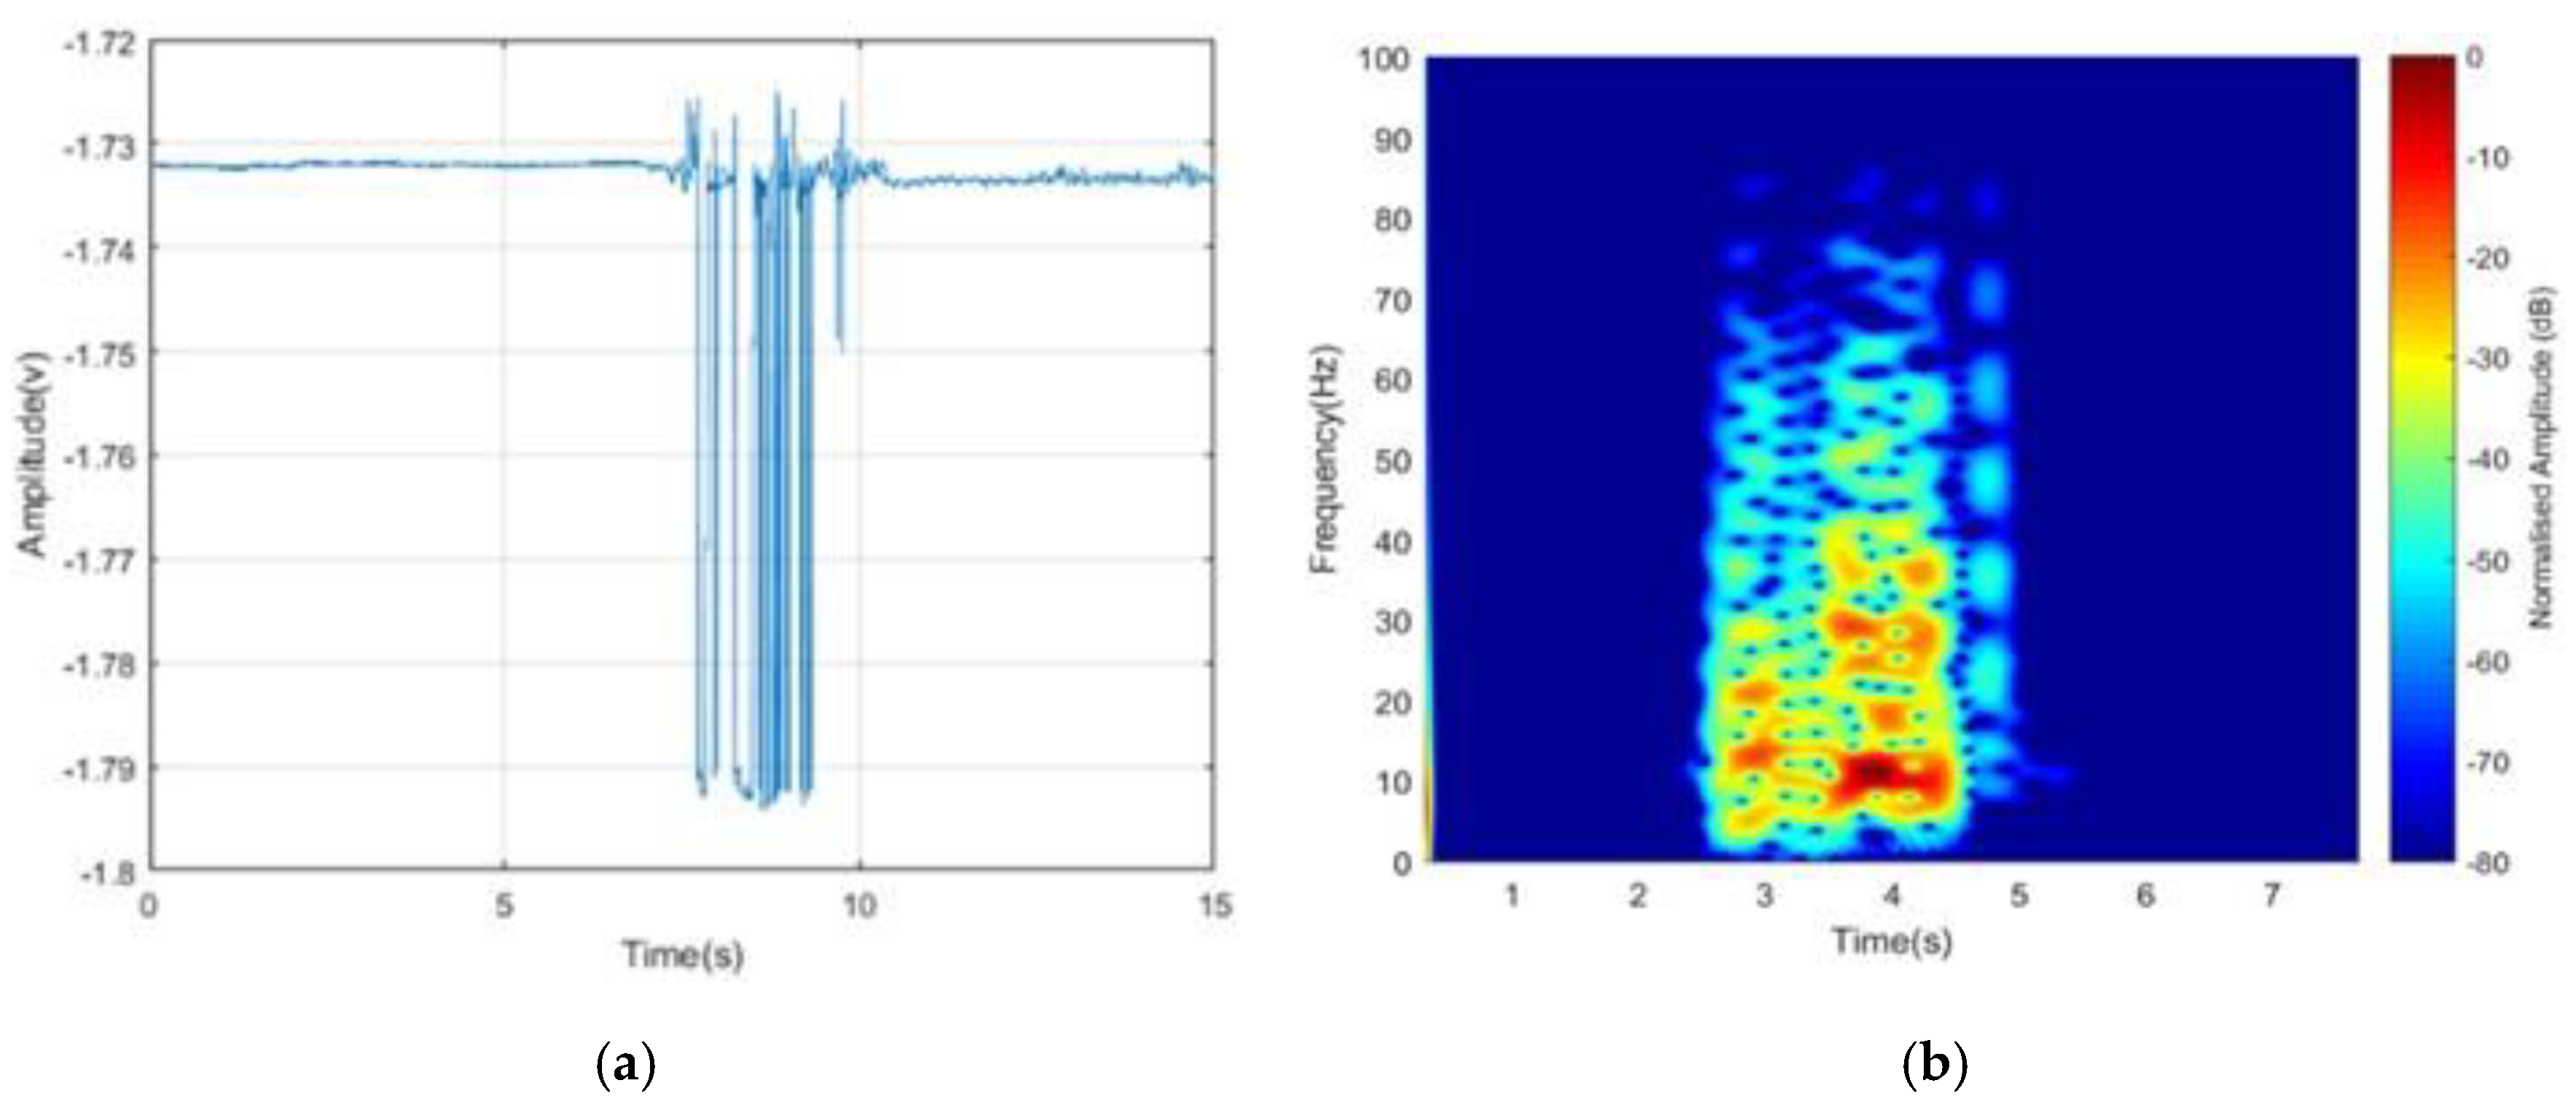
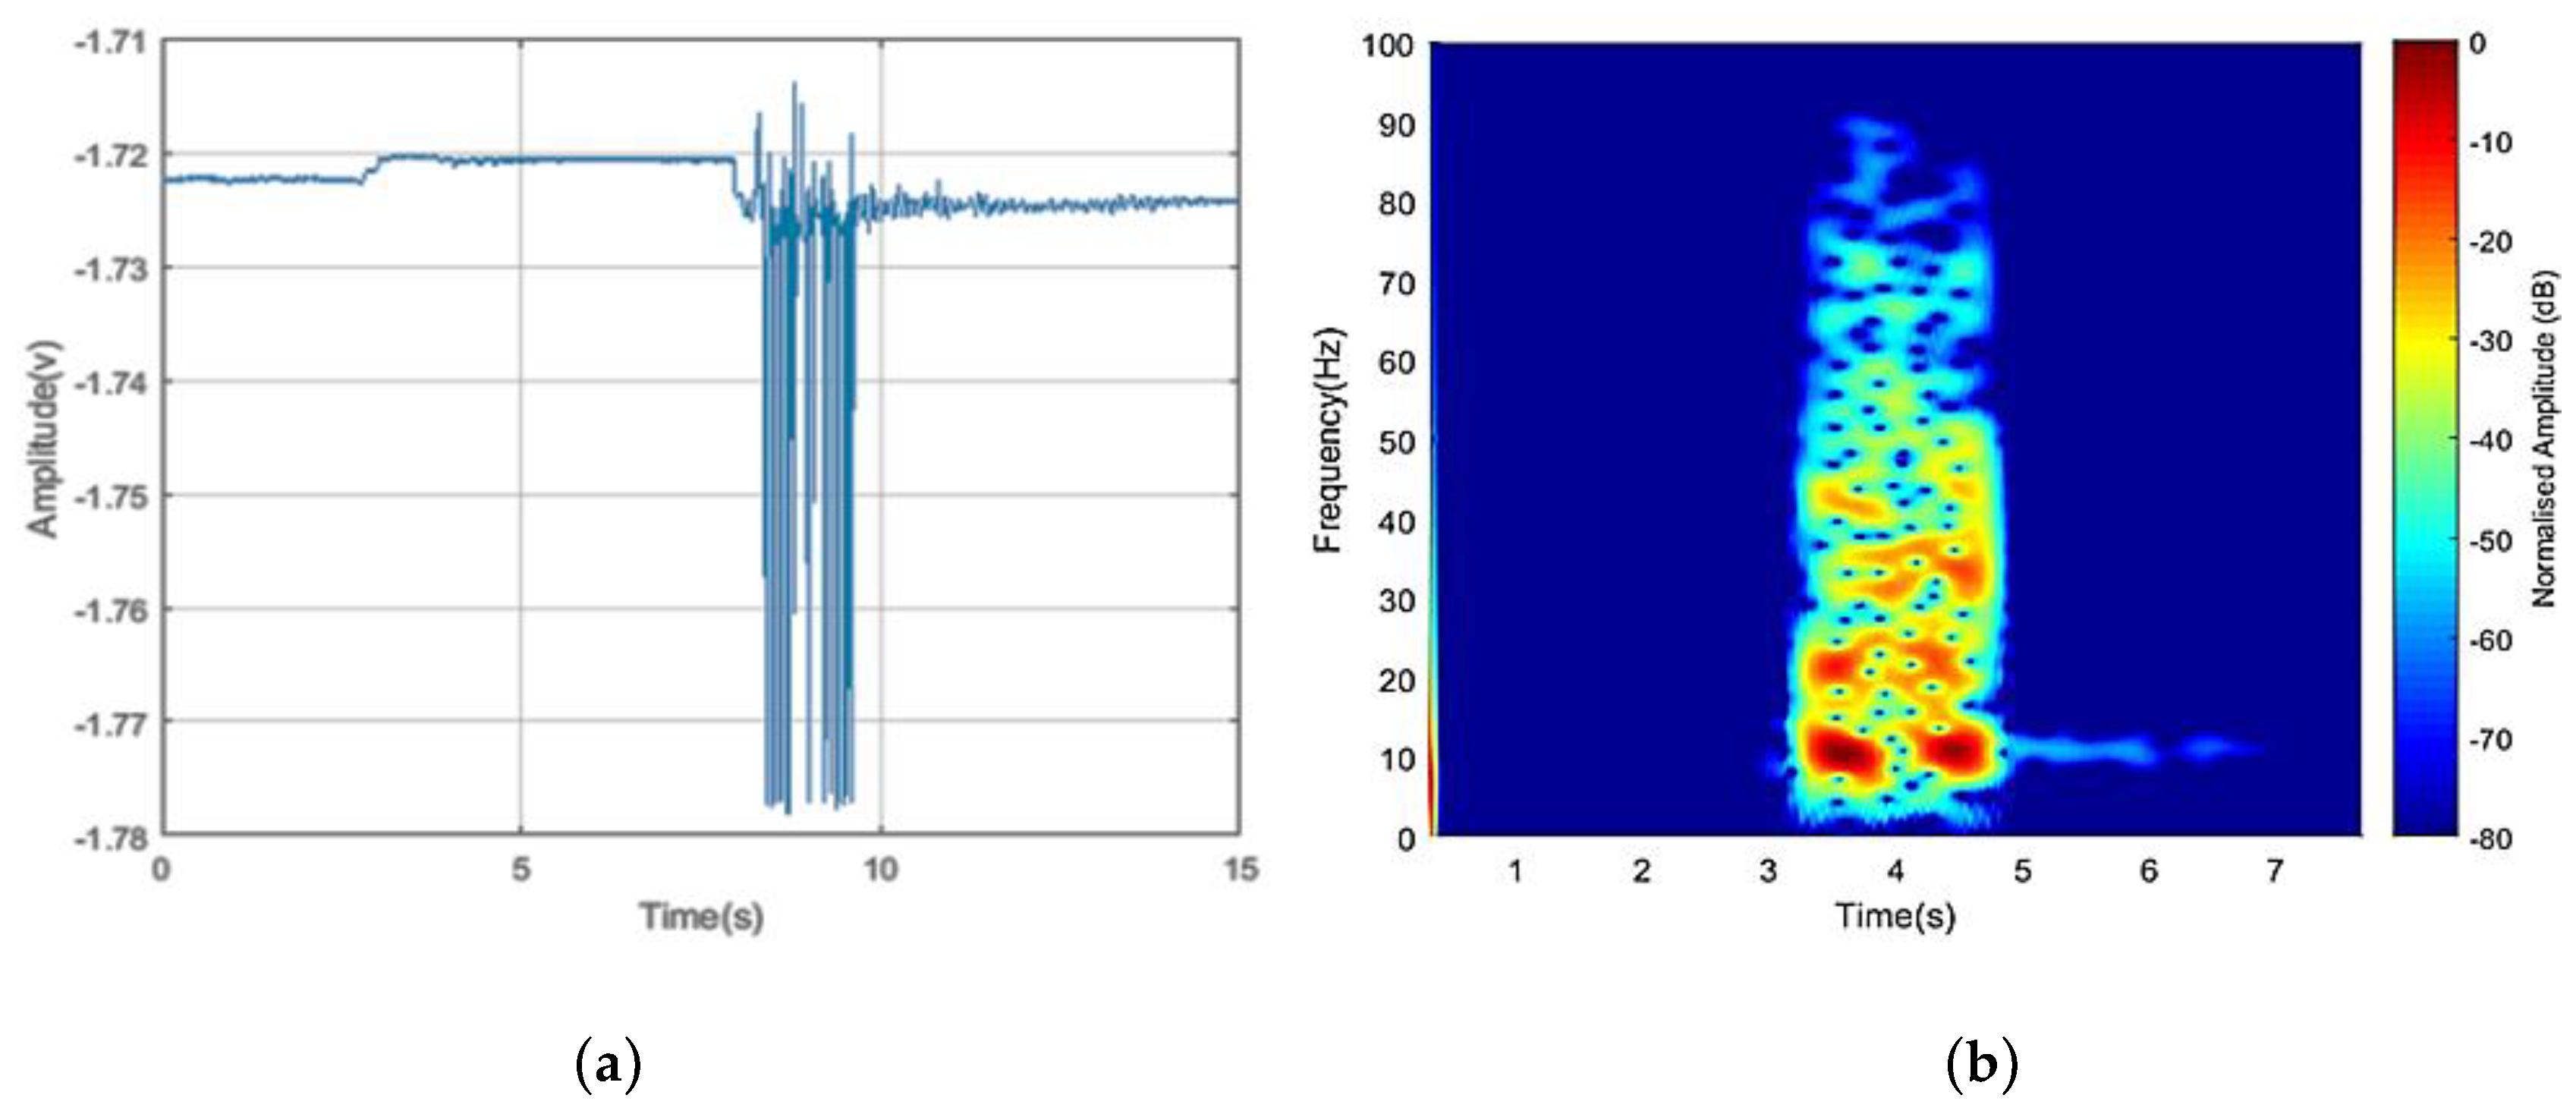
The detection procedure is described in Figure 8, which includes target detection from a disrupted continuous time domain signal; then, the micro-Doppler will be extracted from the signal before drone detection. The sampling frequency of ADC was set to 50 kHz and is sufficient for the expected maximum Doppler value of the rotating blades. Additionally, the FS receiver just needs to capture the modulation caused by the moving target and does not need to reconstruct the signal from the satellite. The received signal is represented in the joint time-frequency domain by STFT with a hamming window. The drone was set to fly horizontally crossing the FS satellite receiver ground station. To analyze the effectiveness of the system, two signals acquired at a different time (namely Signals 1 and 2) are analyzed in detail.

2.3. Empirical Mode Decomposition (EMD)

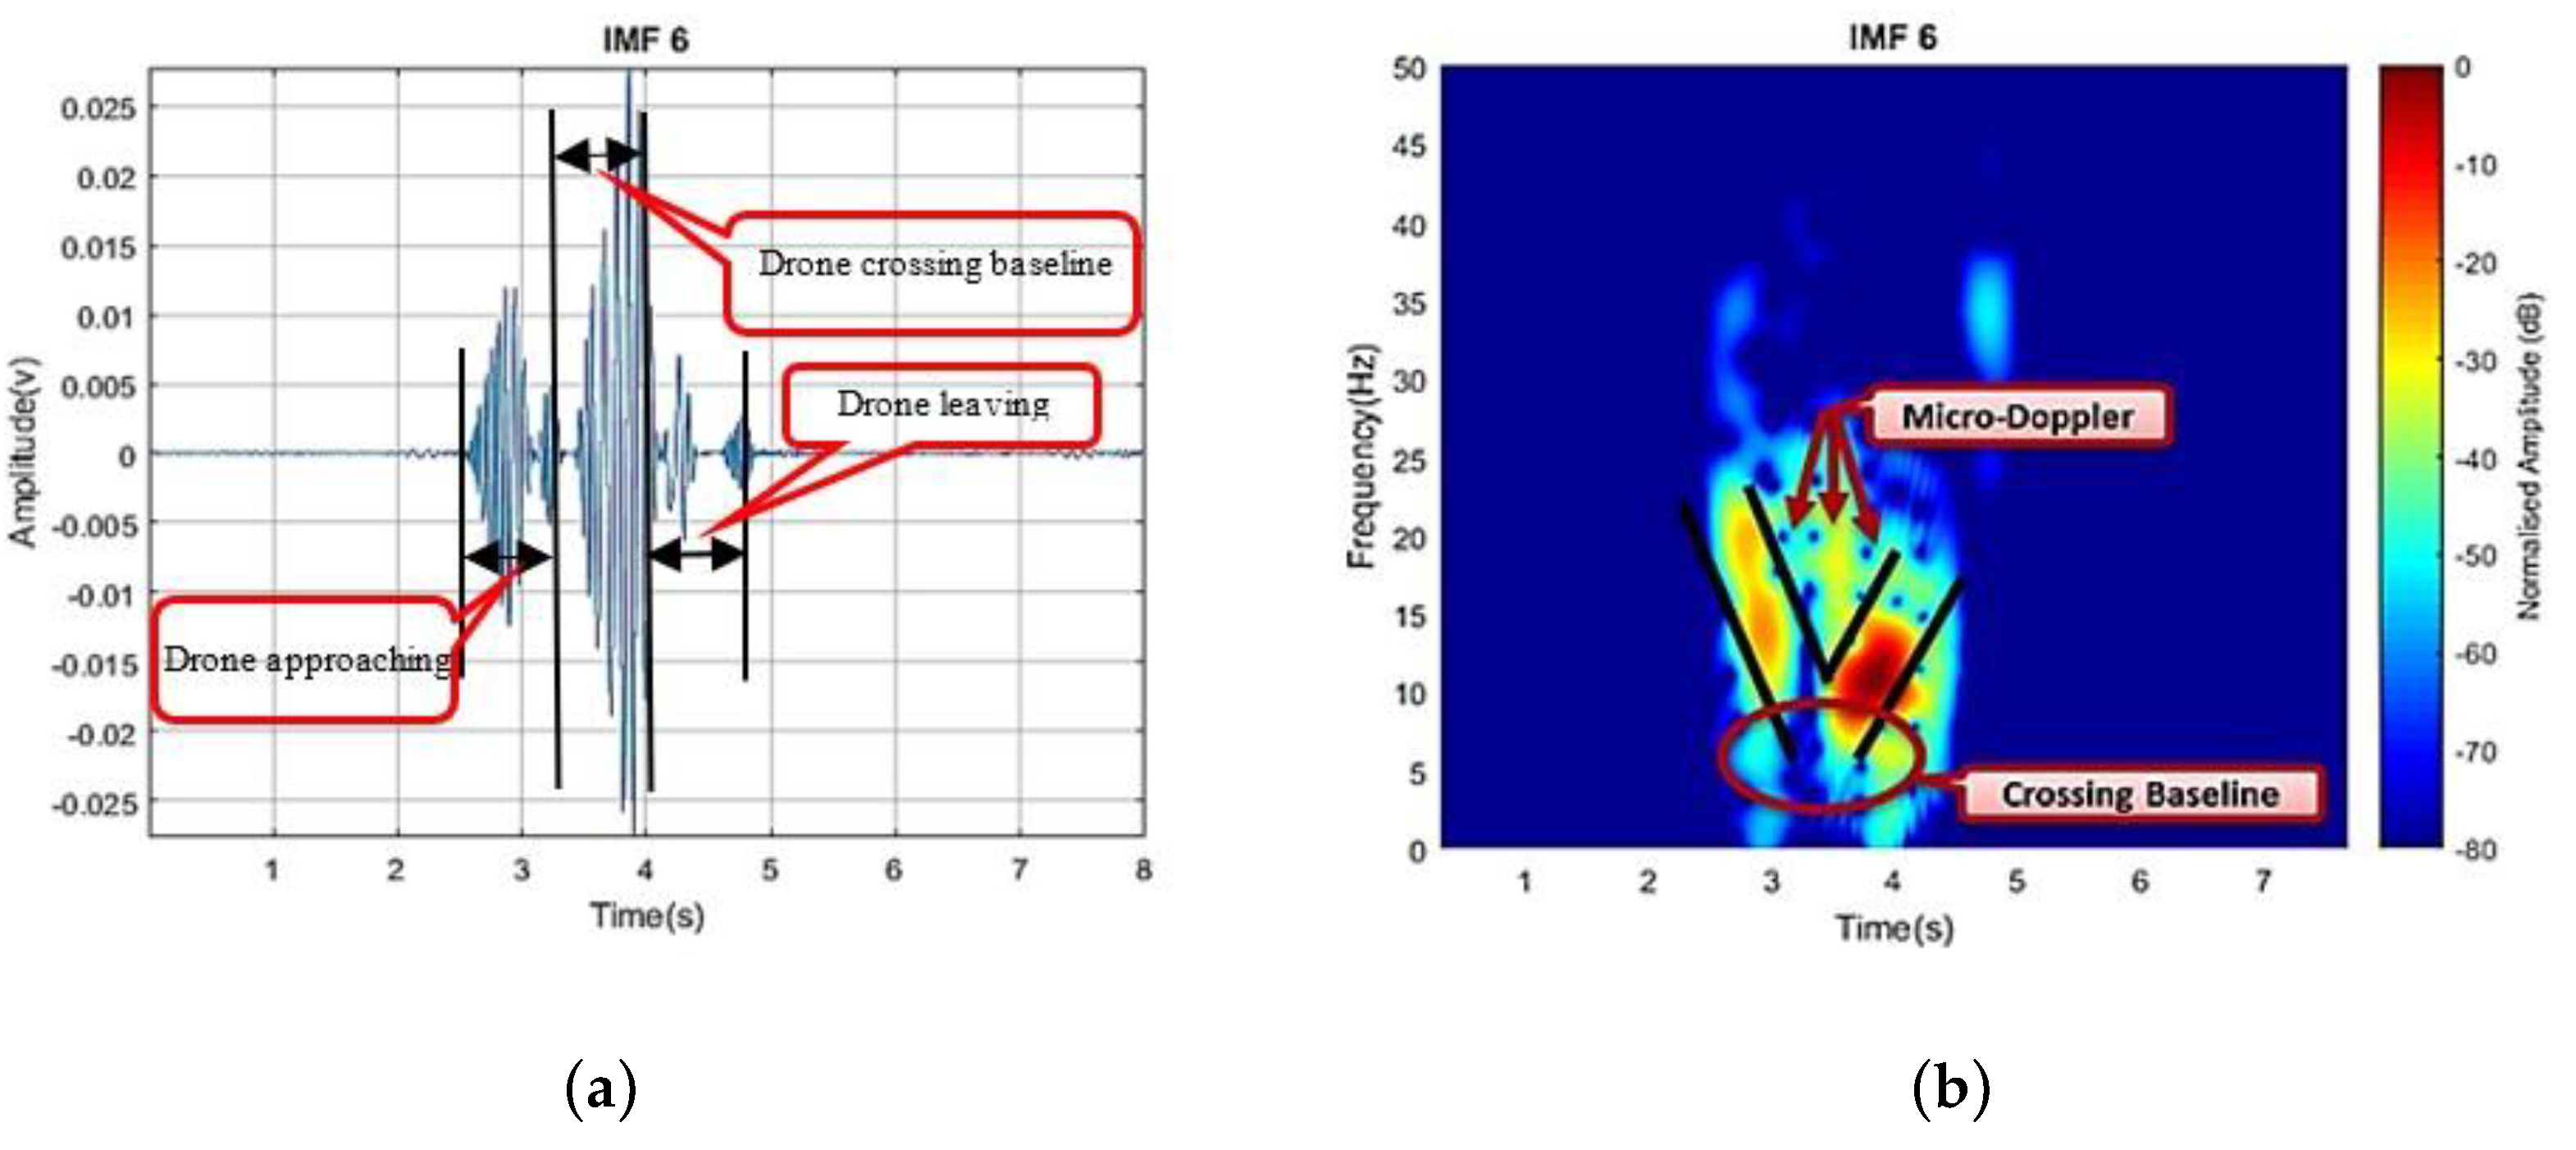
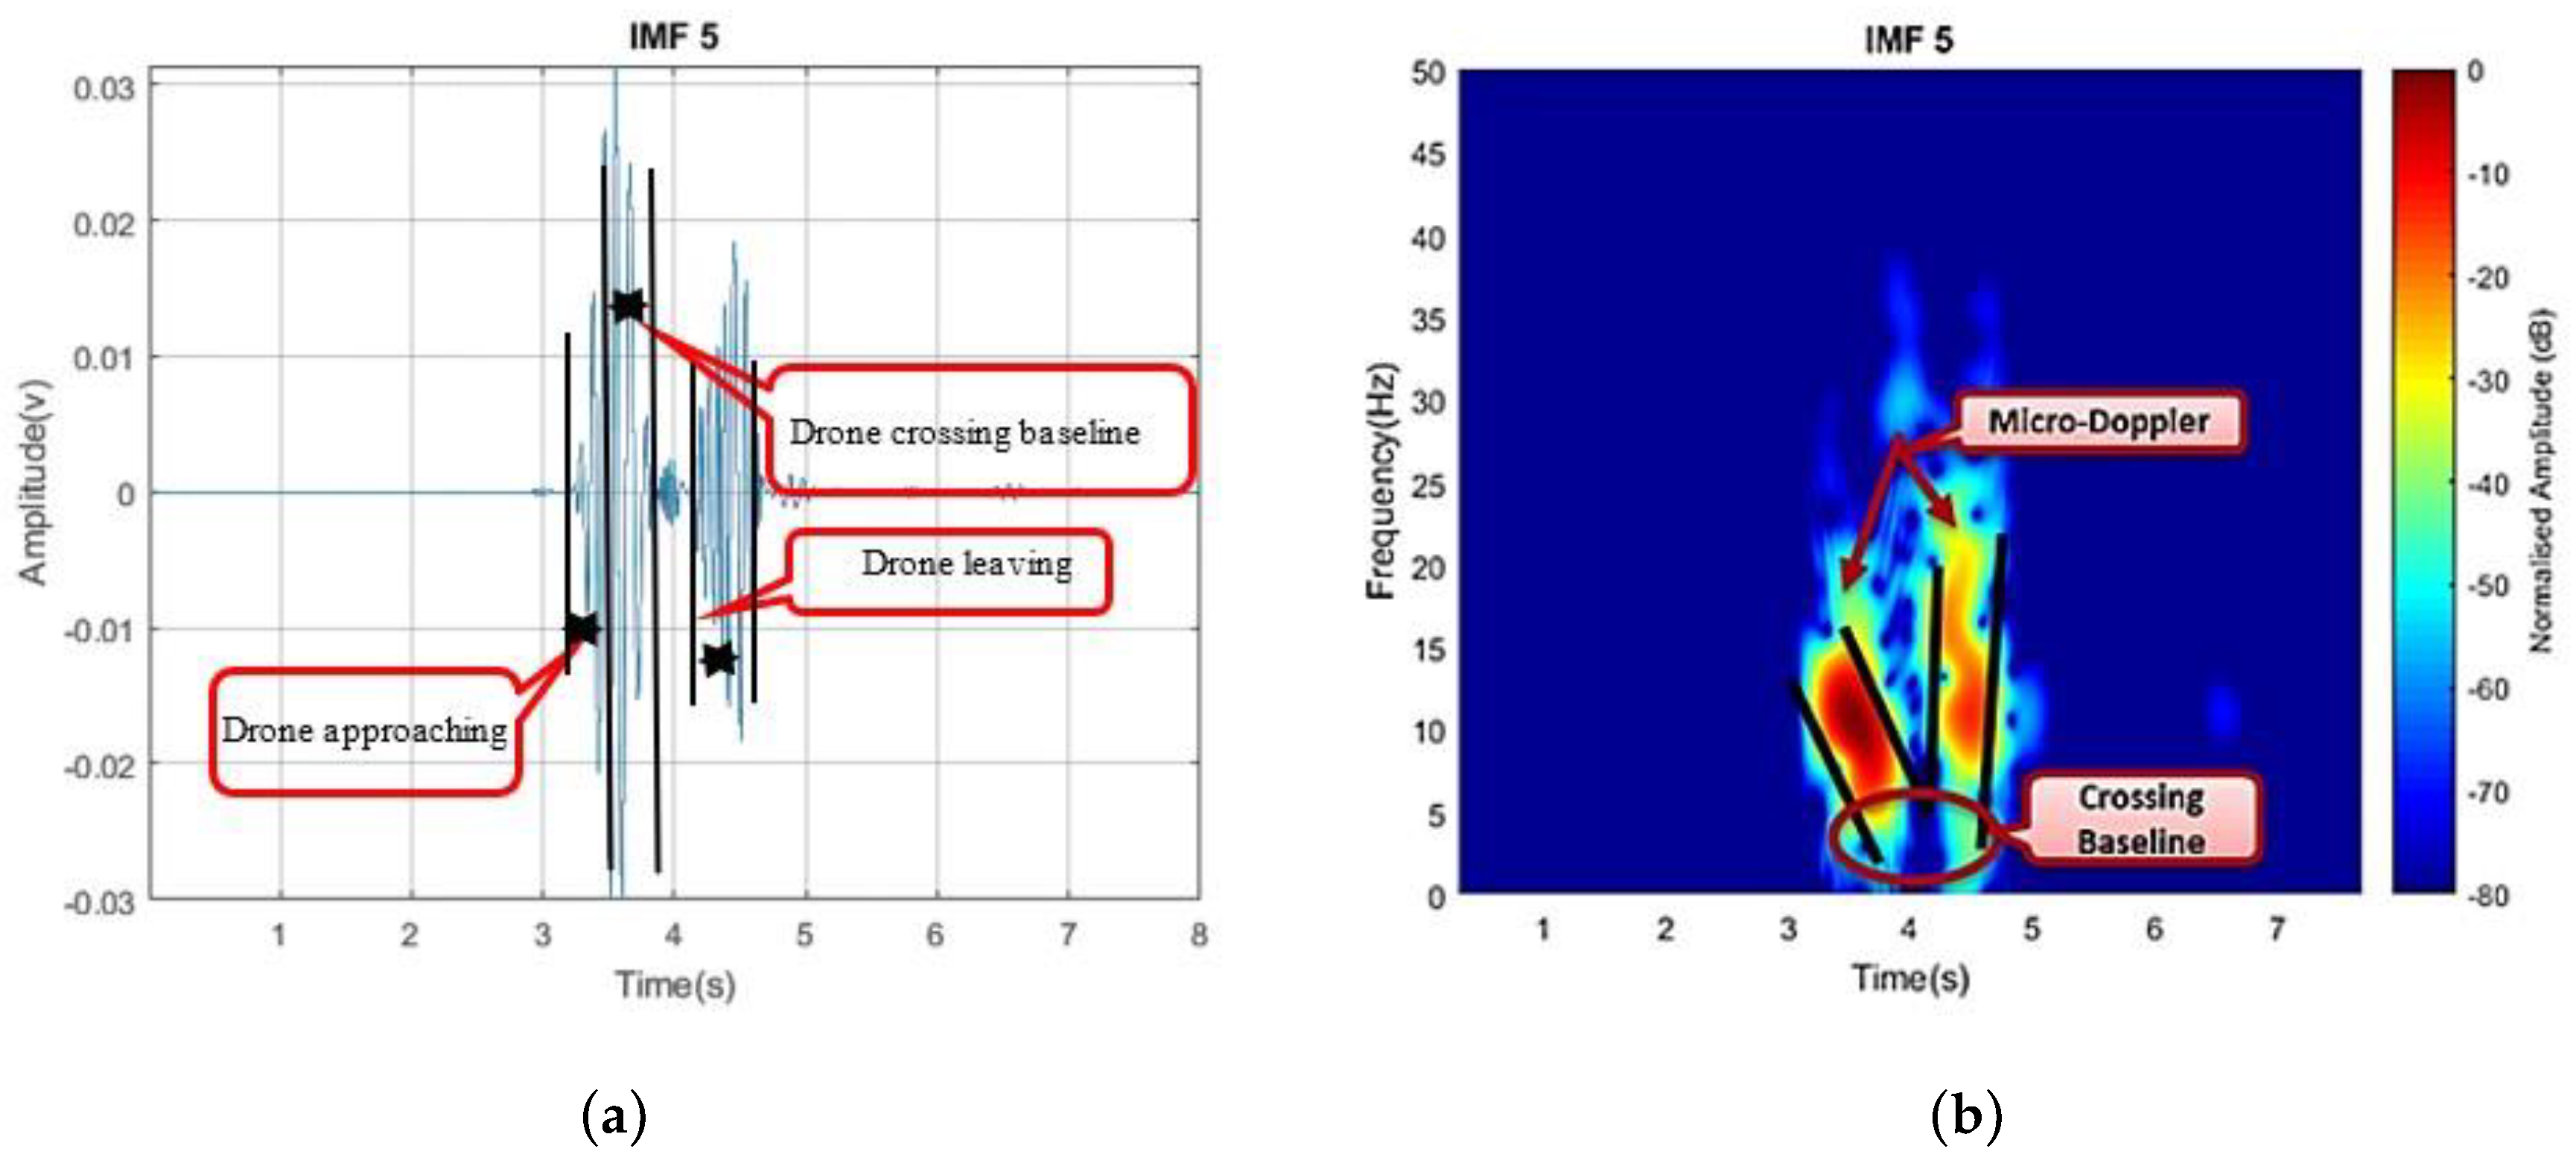
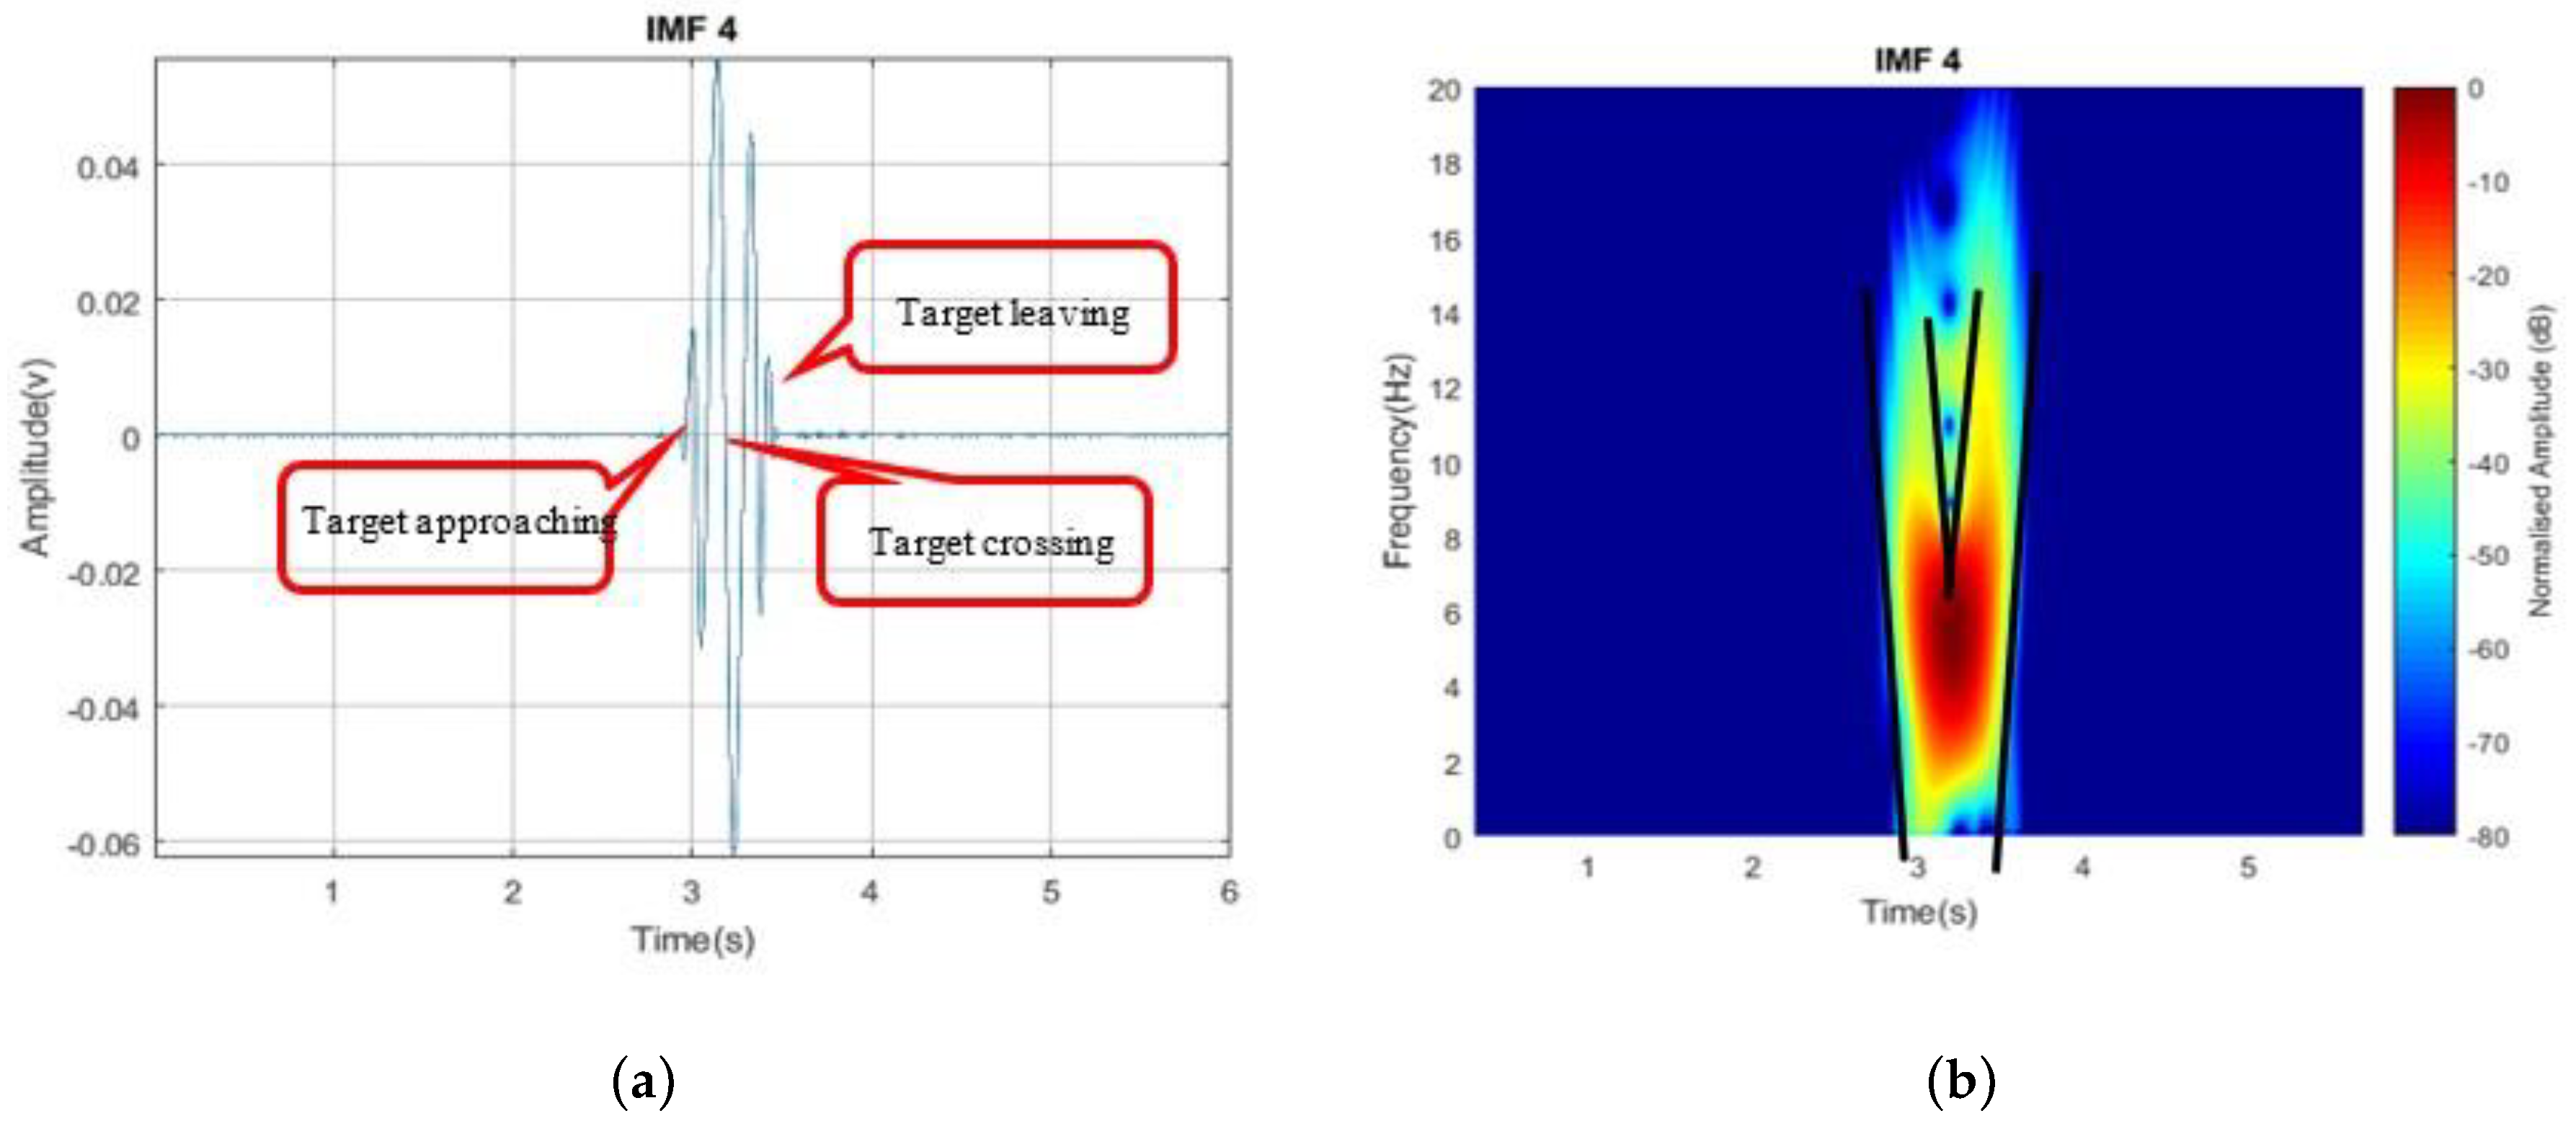
In this section, we considered the extraction of some feature vectors from the original signature of the detected target by using the Empirical Mode Decomposition (EMD) technique. We aimed to use the extracted vectors as a stronghold for identifying the detected drone in FS-mode, based on the peculiar signature of a Doppler pattern with V-shape characteristics (towards zero Doppler on the center of baseline) and micro-Doppler surrounding the main Doppler, as proved in [10], thus confirming the possibility of using the DVB-S-based passive FSR system for low-profile target detection. These features may further be used in the identification of this target among other targets in the same bandwidth or surveillance volume, like flying birds (as this constituted our future works). The most robust feature of concern is the micro-motion based on the four-rotor rotating blades which, of course, differs from the micro motions due to flapping birds. This may further classify the target from other similar copter drones or a fixed-wing drone, in addition to a reduction of dimensionality in classification problems [37]. Several methods can be used in extracting the feature of a target; the most common and reliable methods include using STFT, singular value decomposition (SVM) [38,39], and empirical mode decomposition (EMD) [40], among others.
For a target with constant speed, it is assumed that the resultant Doppler frequency shift will also be constant [35]. In reality, a target like a drone does not maintain constant velocity while moving, and neither does the rotating blade. This makes the micro-Doppler analysis become challenging due to the non-linear and non-stationary characteristics of the signal. This non-linear and non-stationary signal make other signal processing techniques like STFT (which assumed linearity and stationary nature) non-optimal; hence, making the empirical mode decomposition (EMD) a good candidate for this analysis of the time-varying Doppler frequency shift. An advantage of EMD was that it does not require pre-defined kernel functions or prior knowledge of the signal behavior.
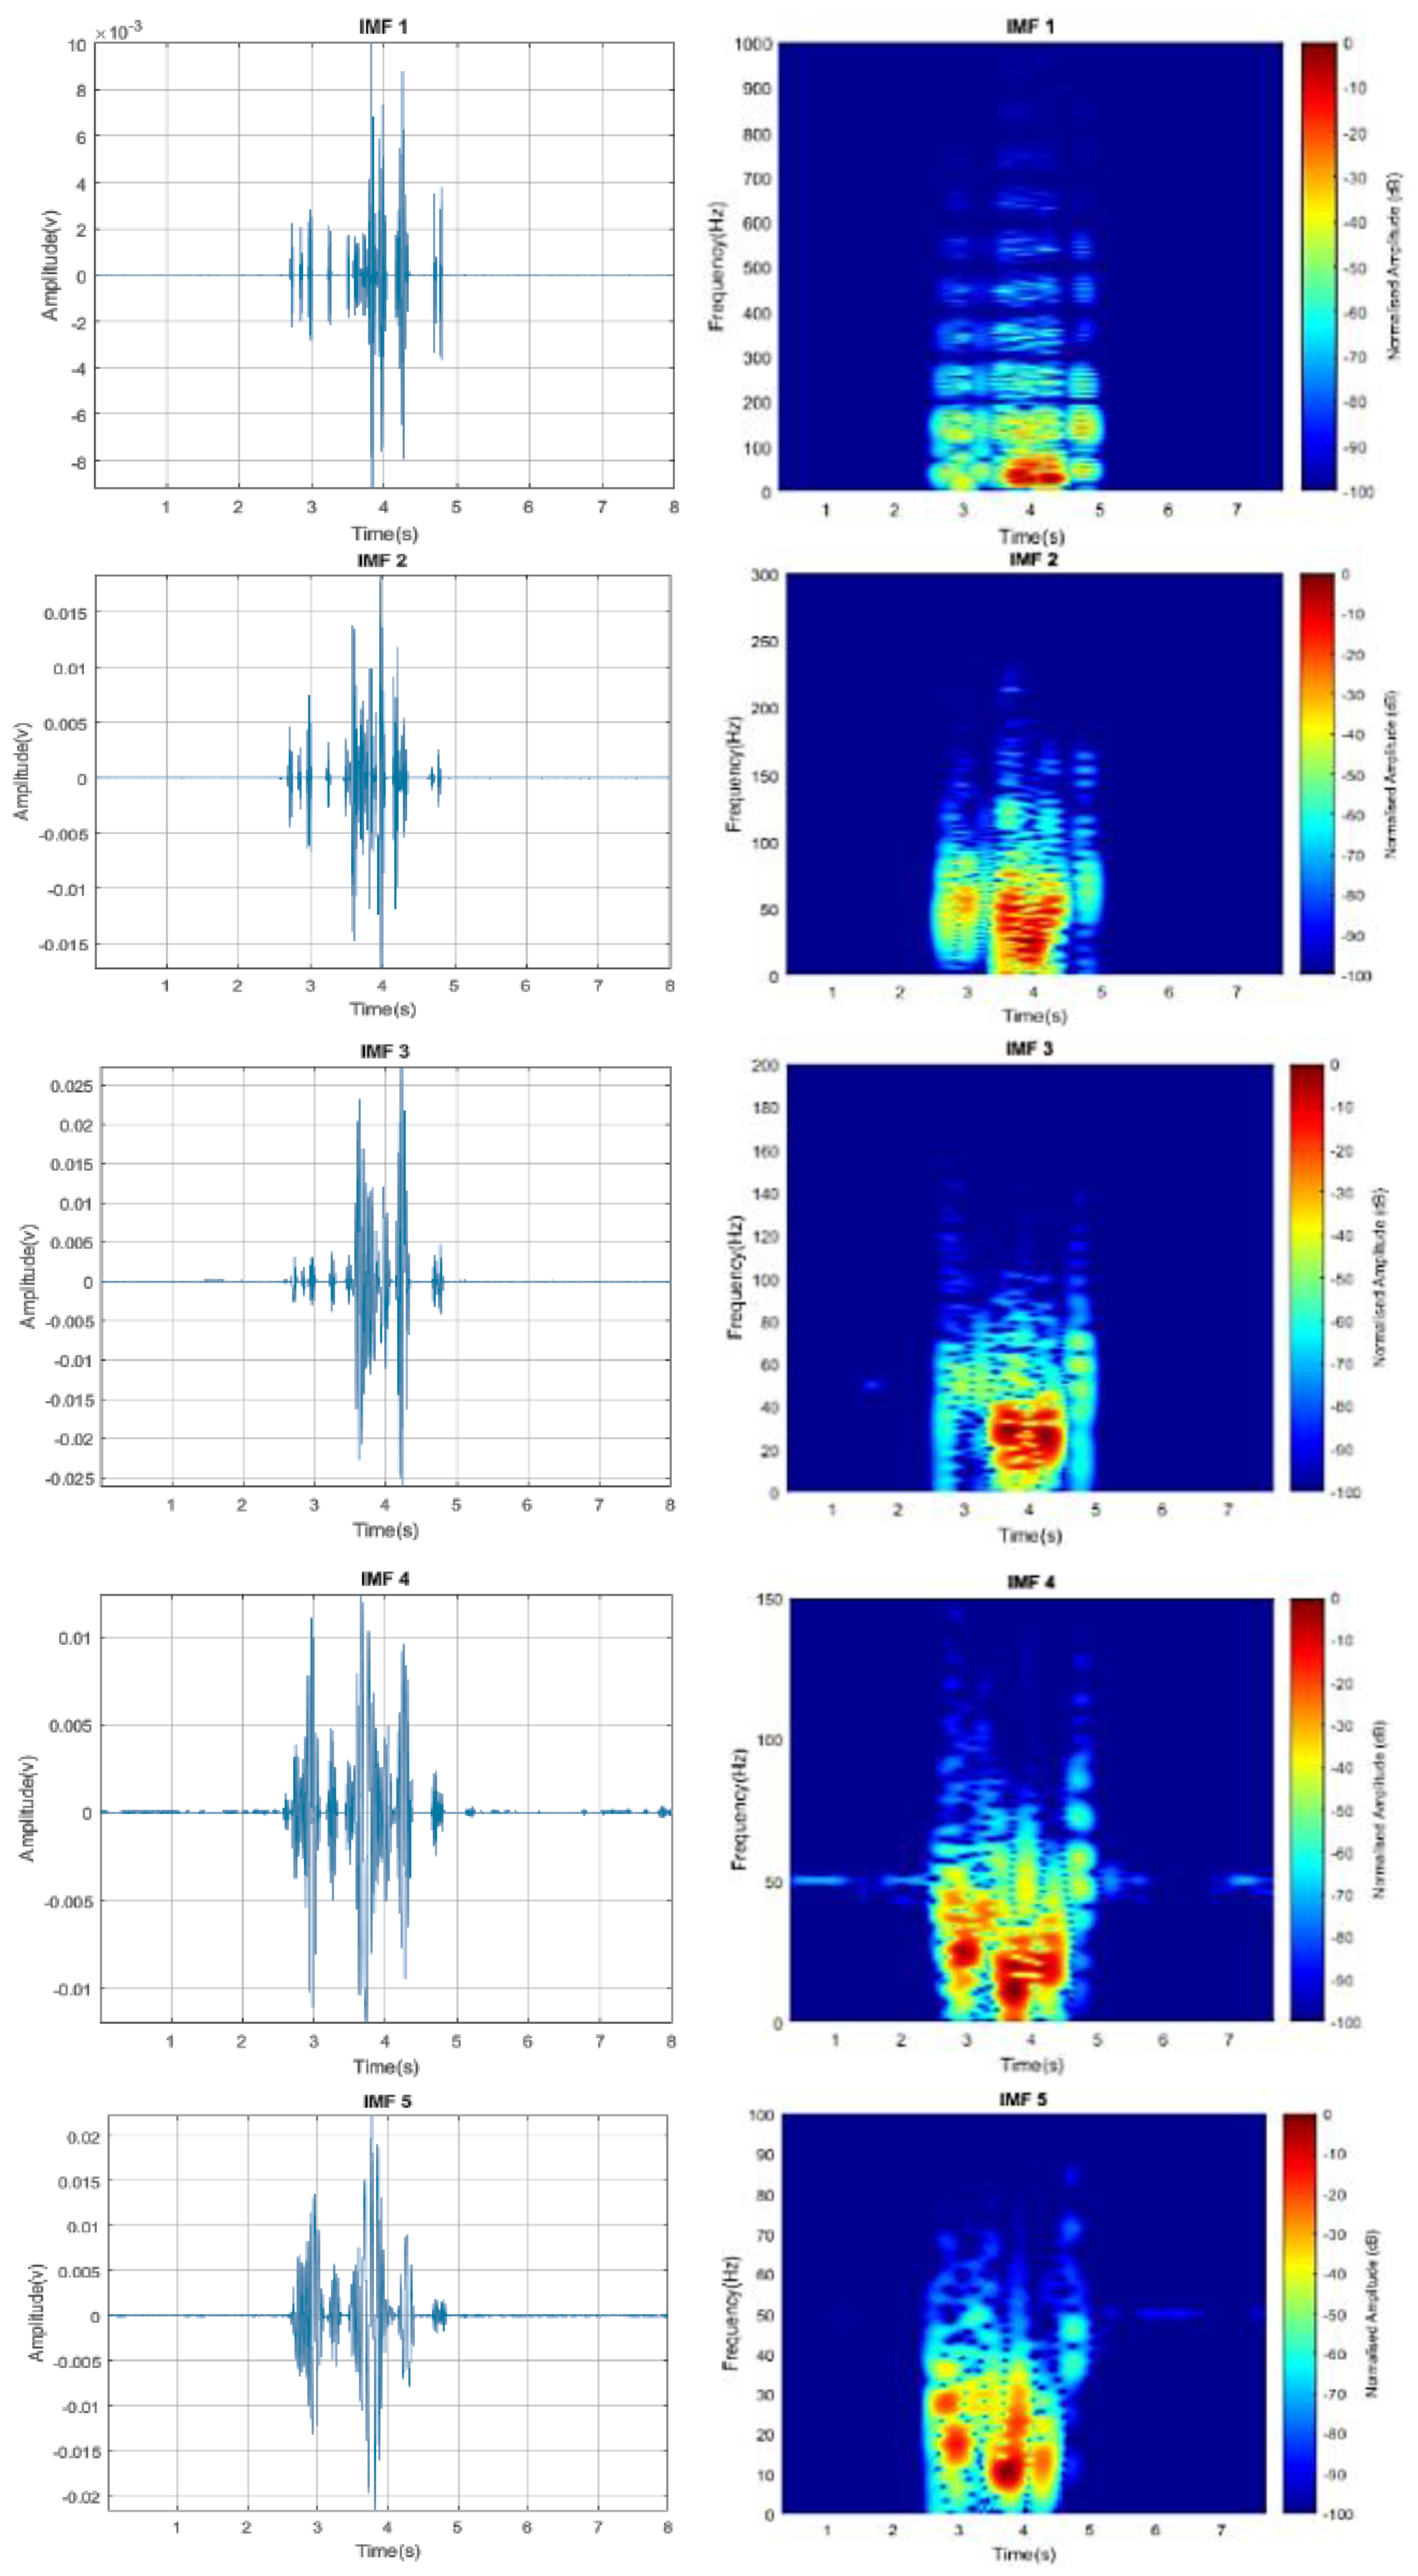
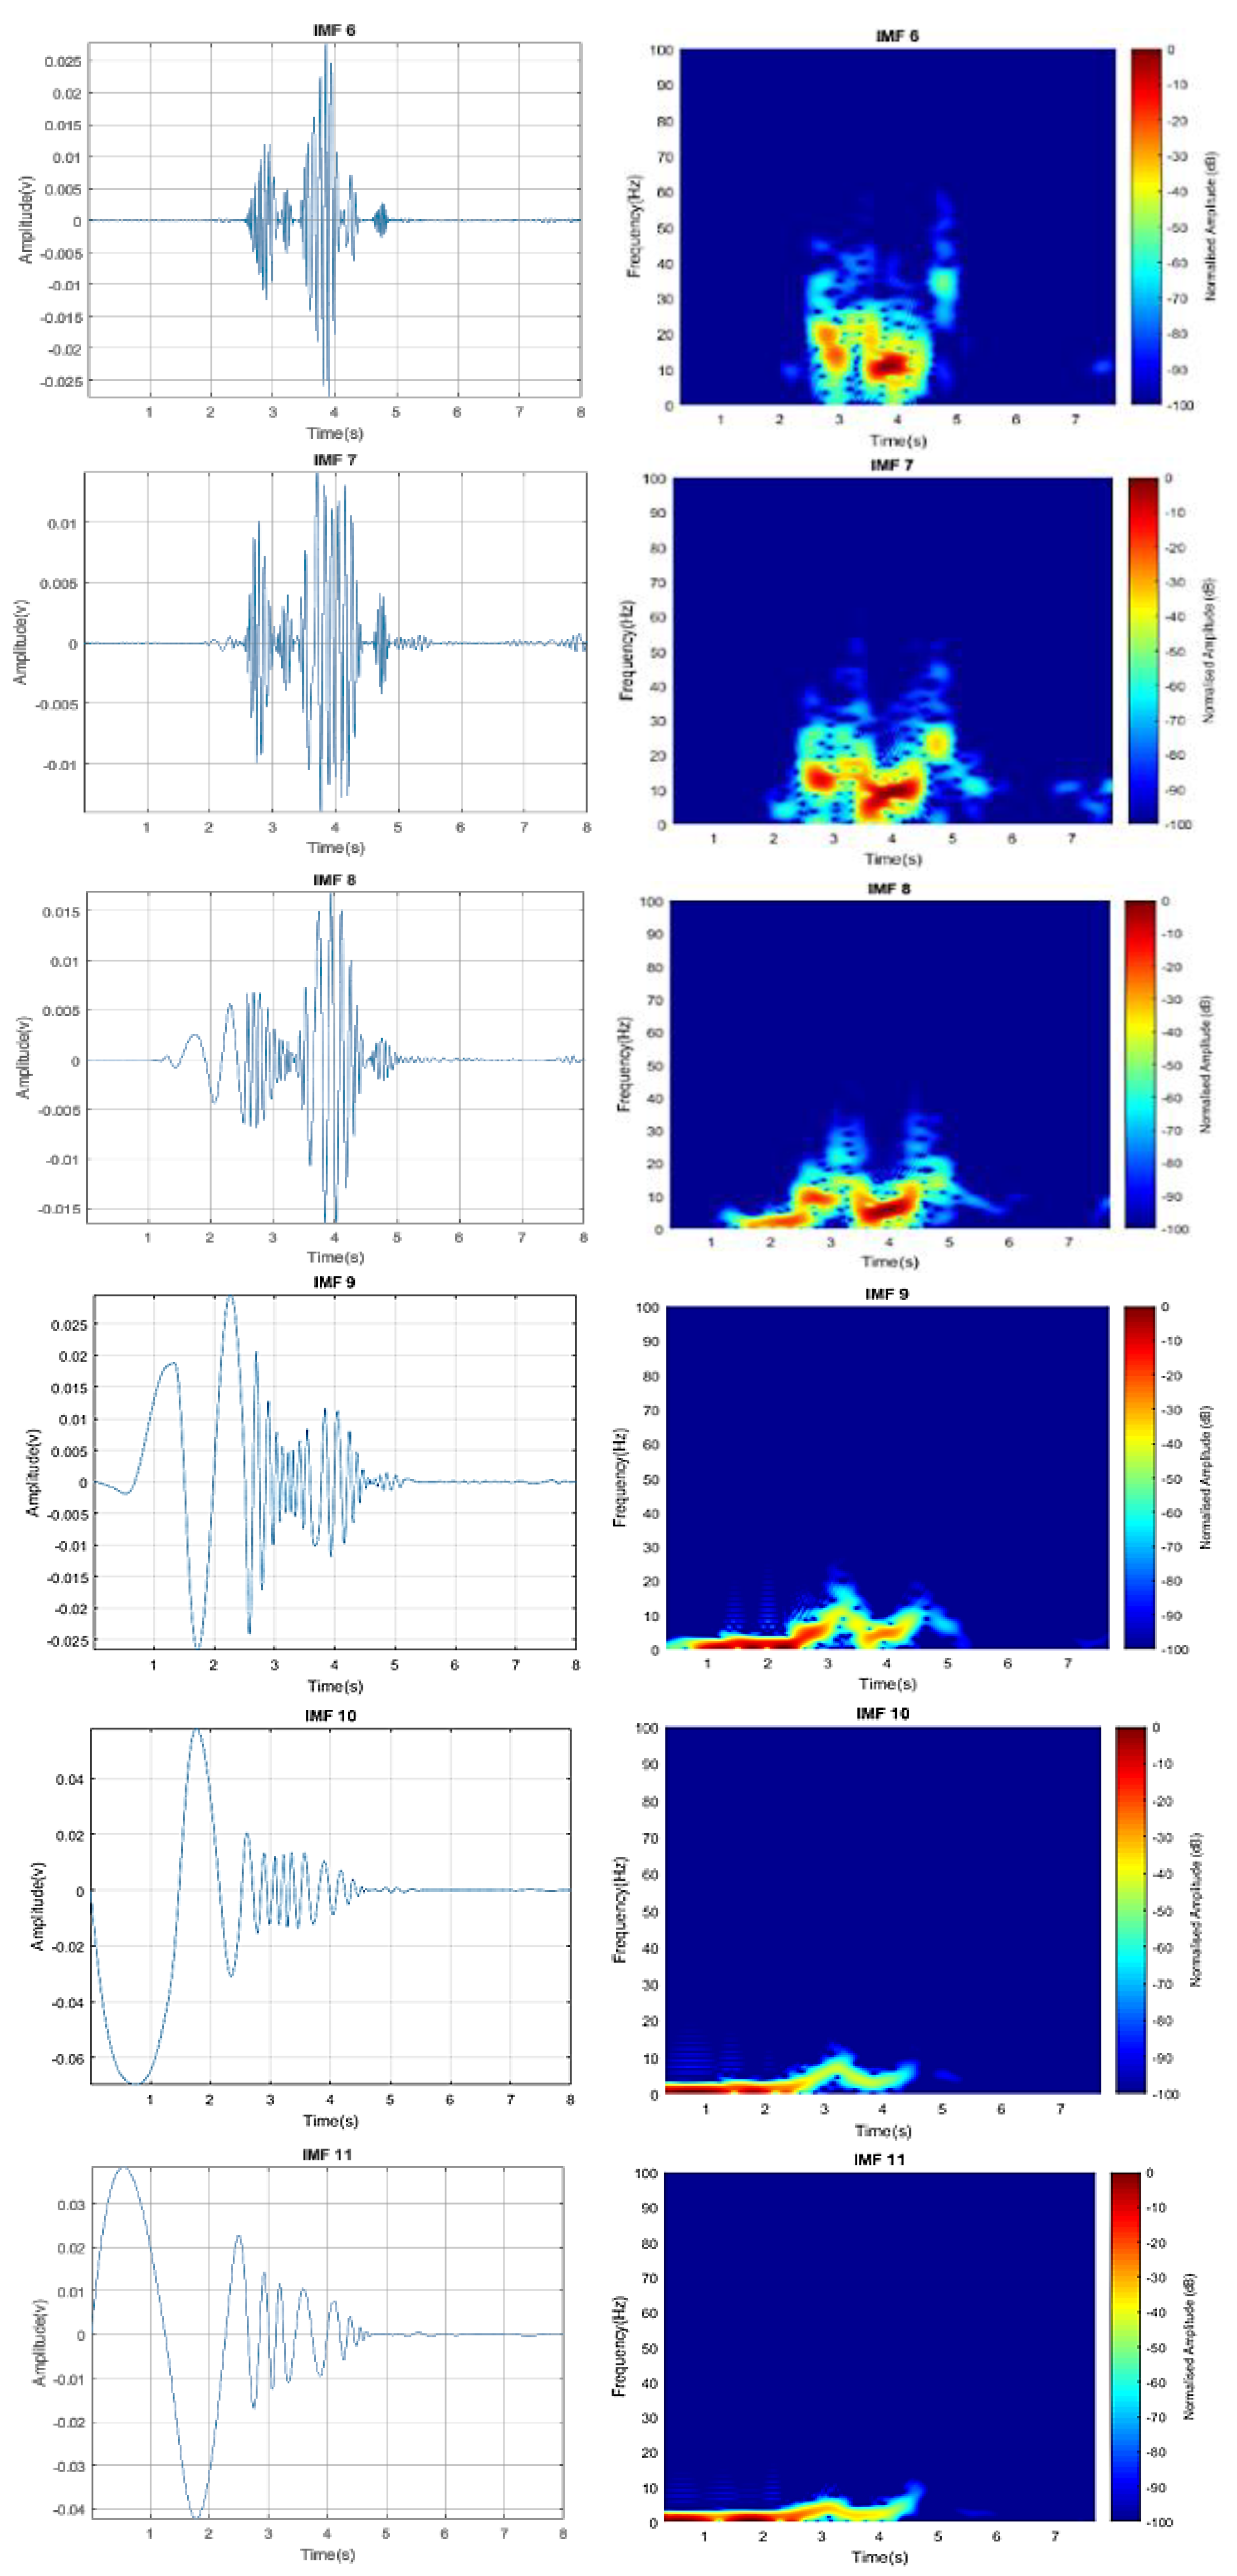
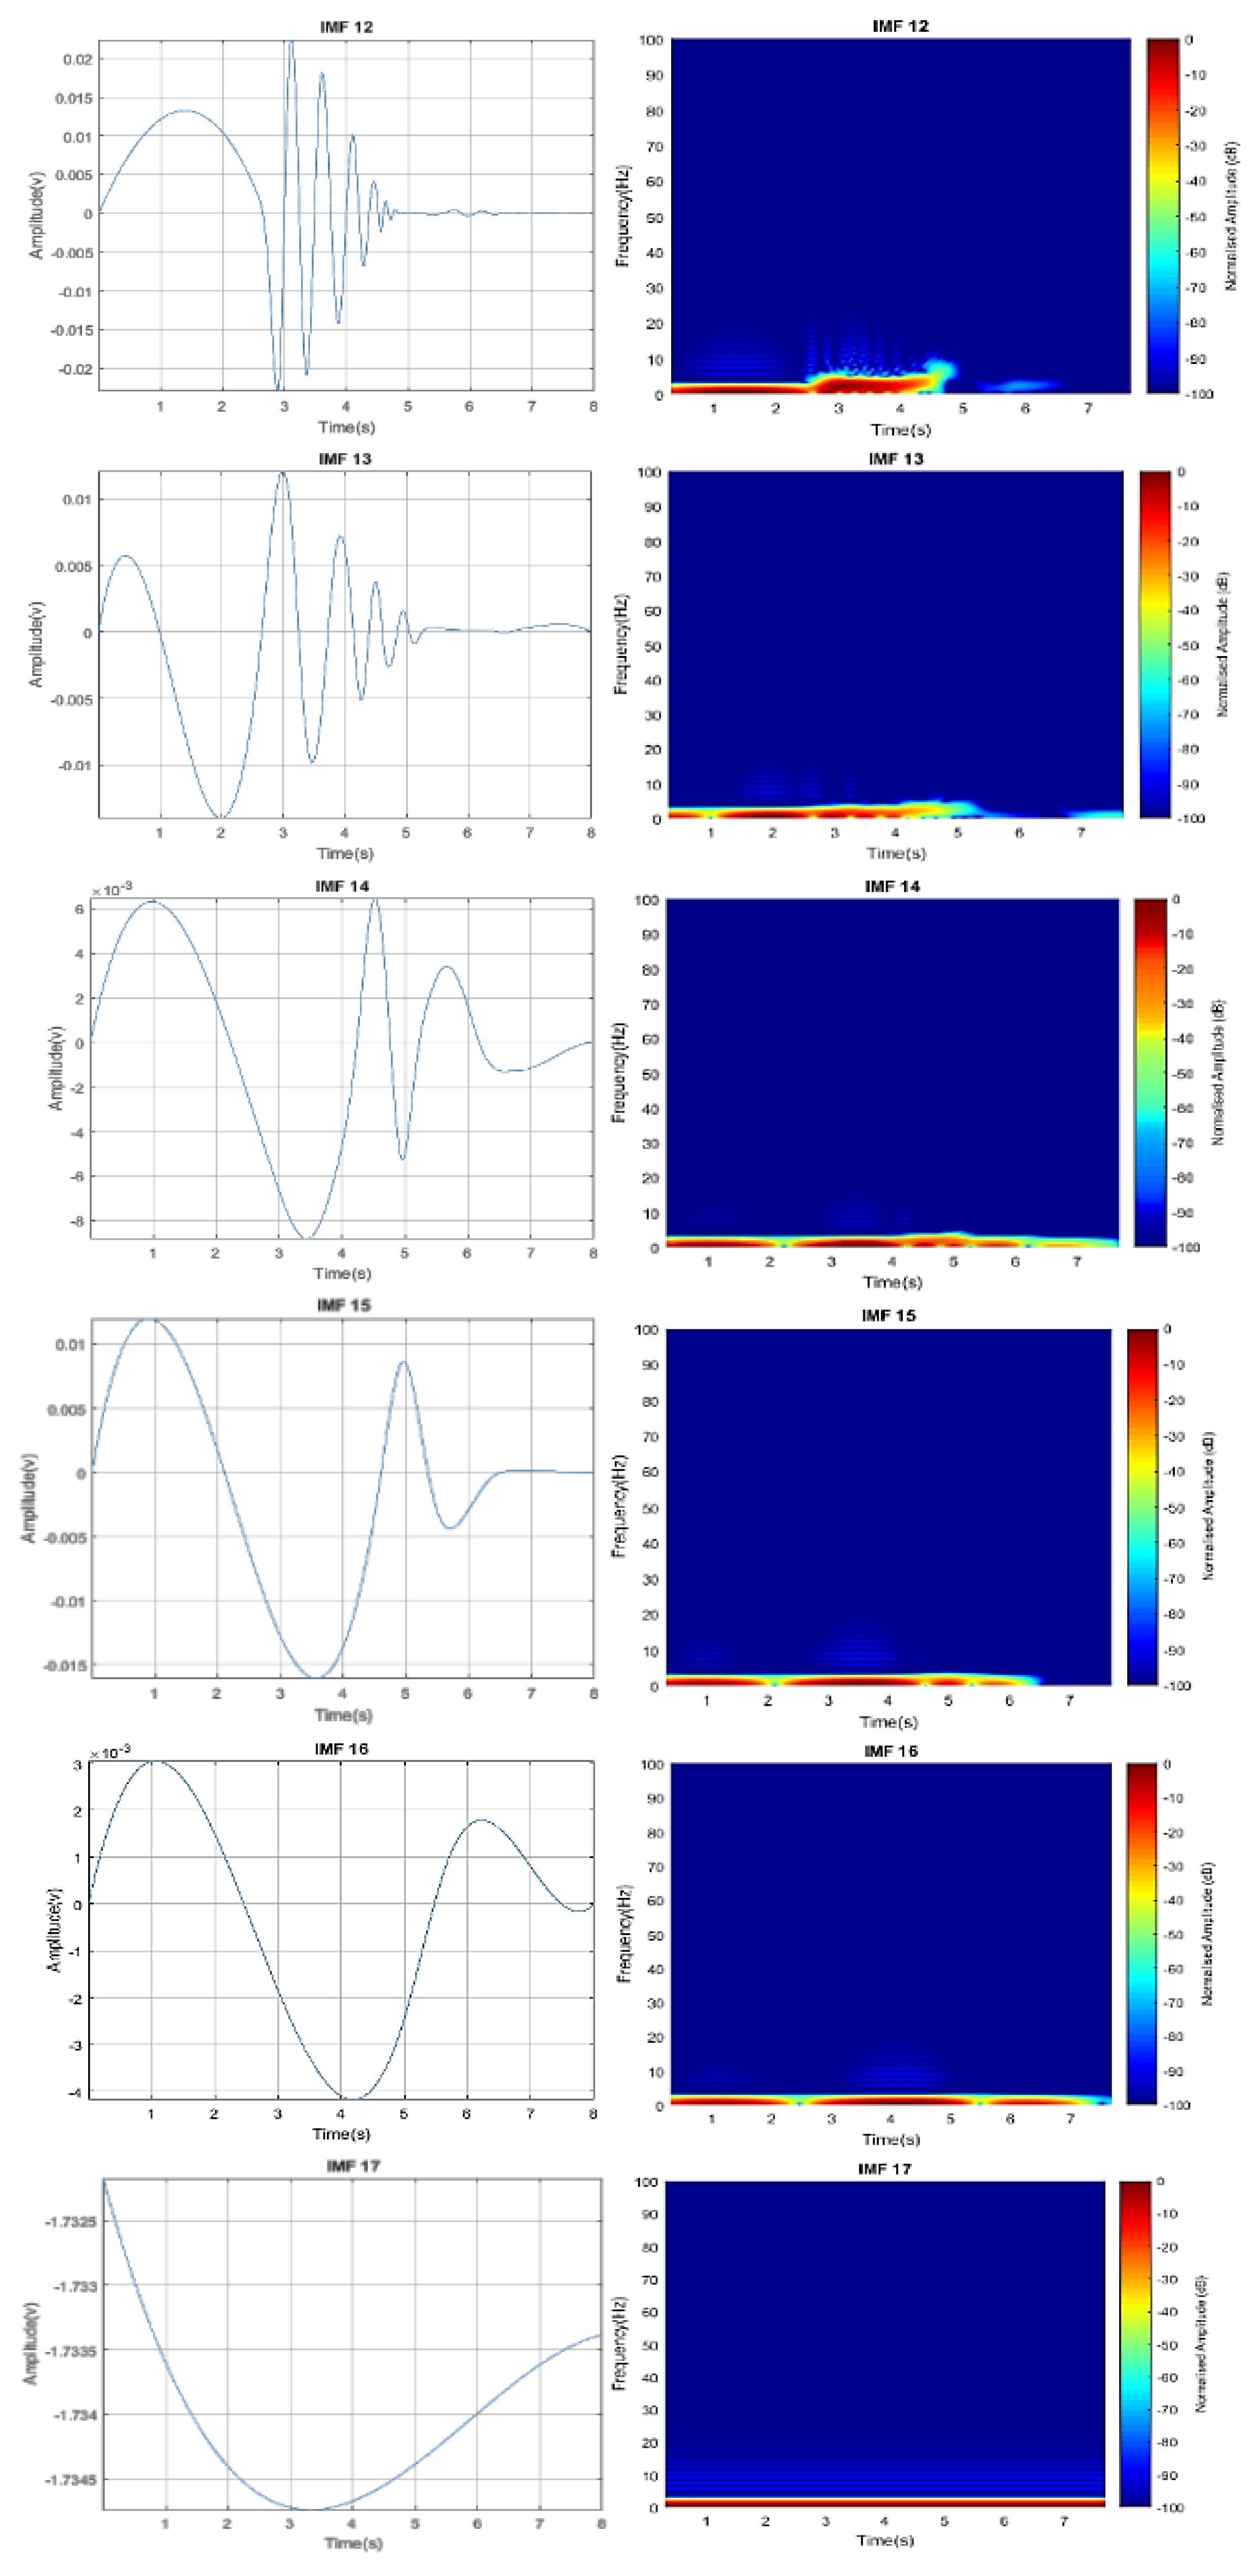
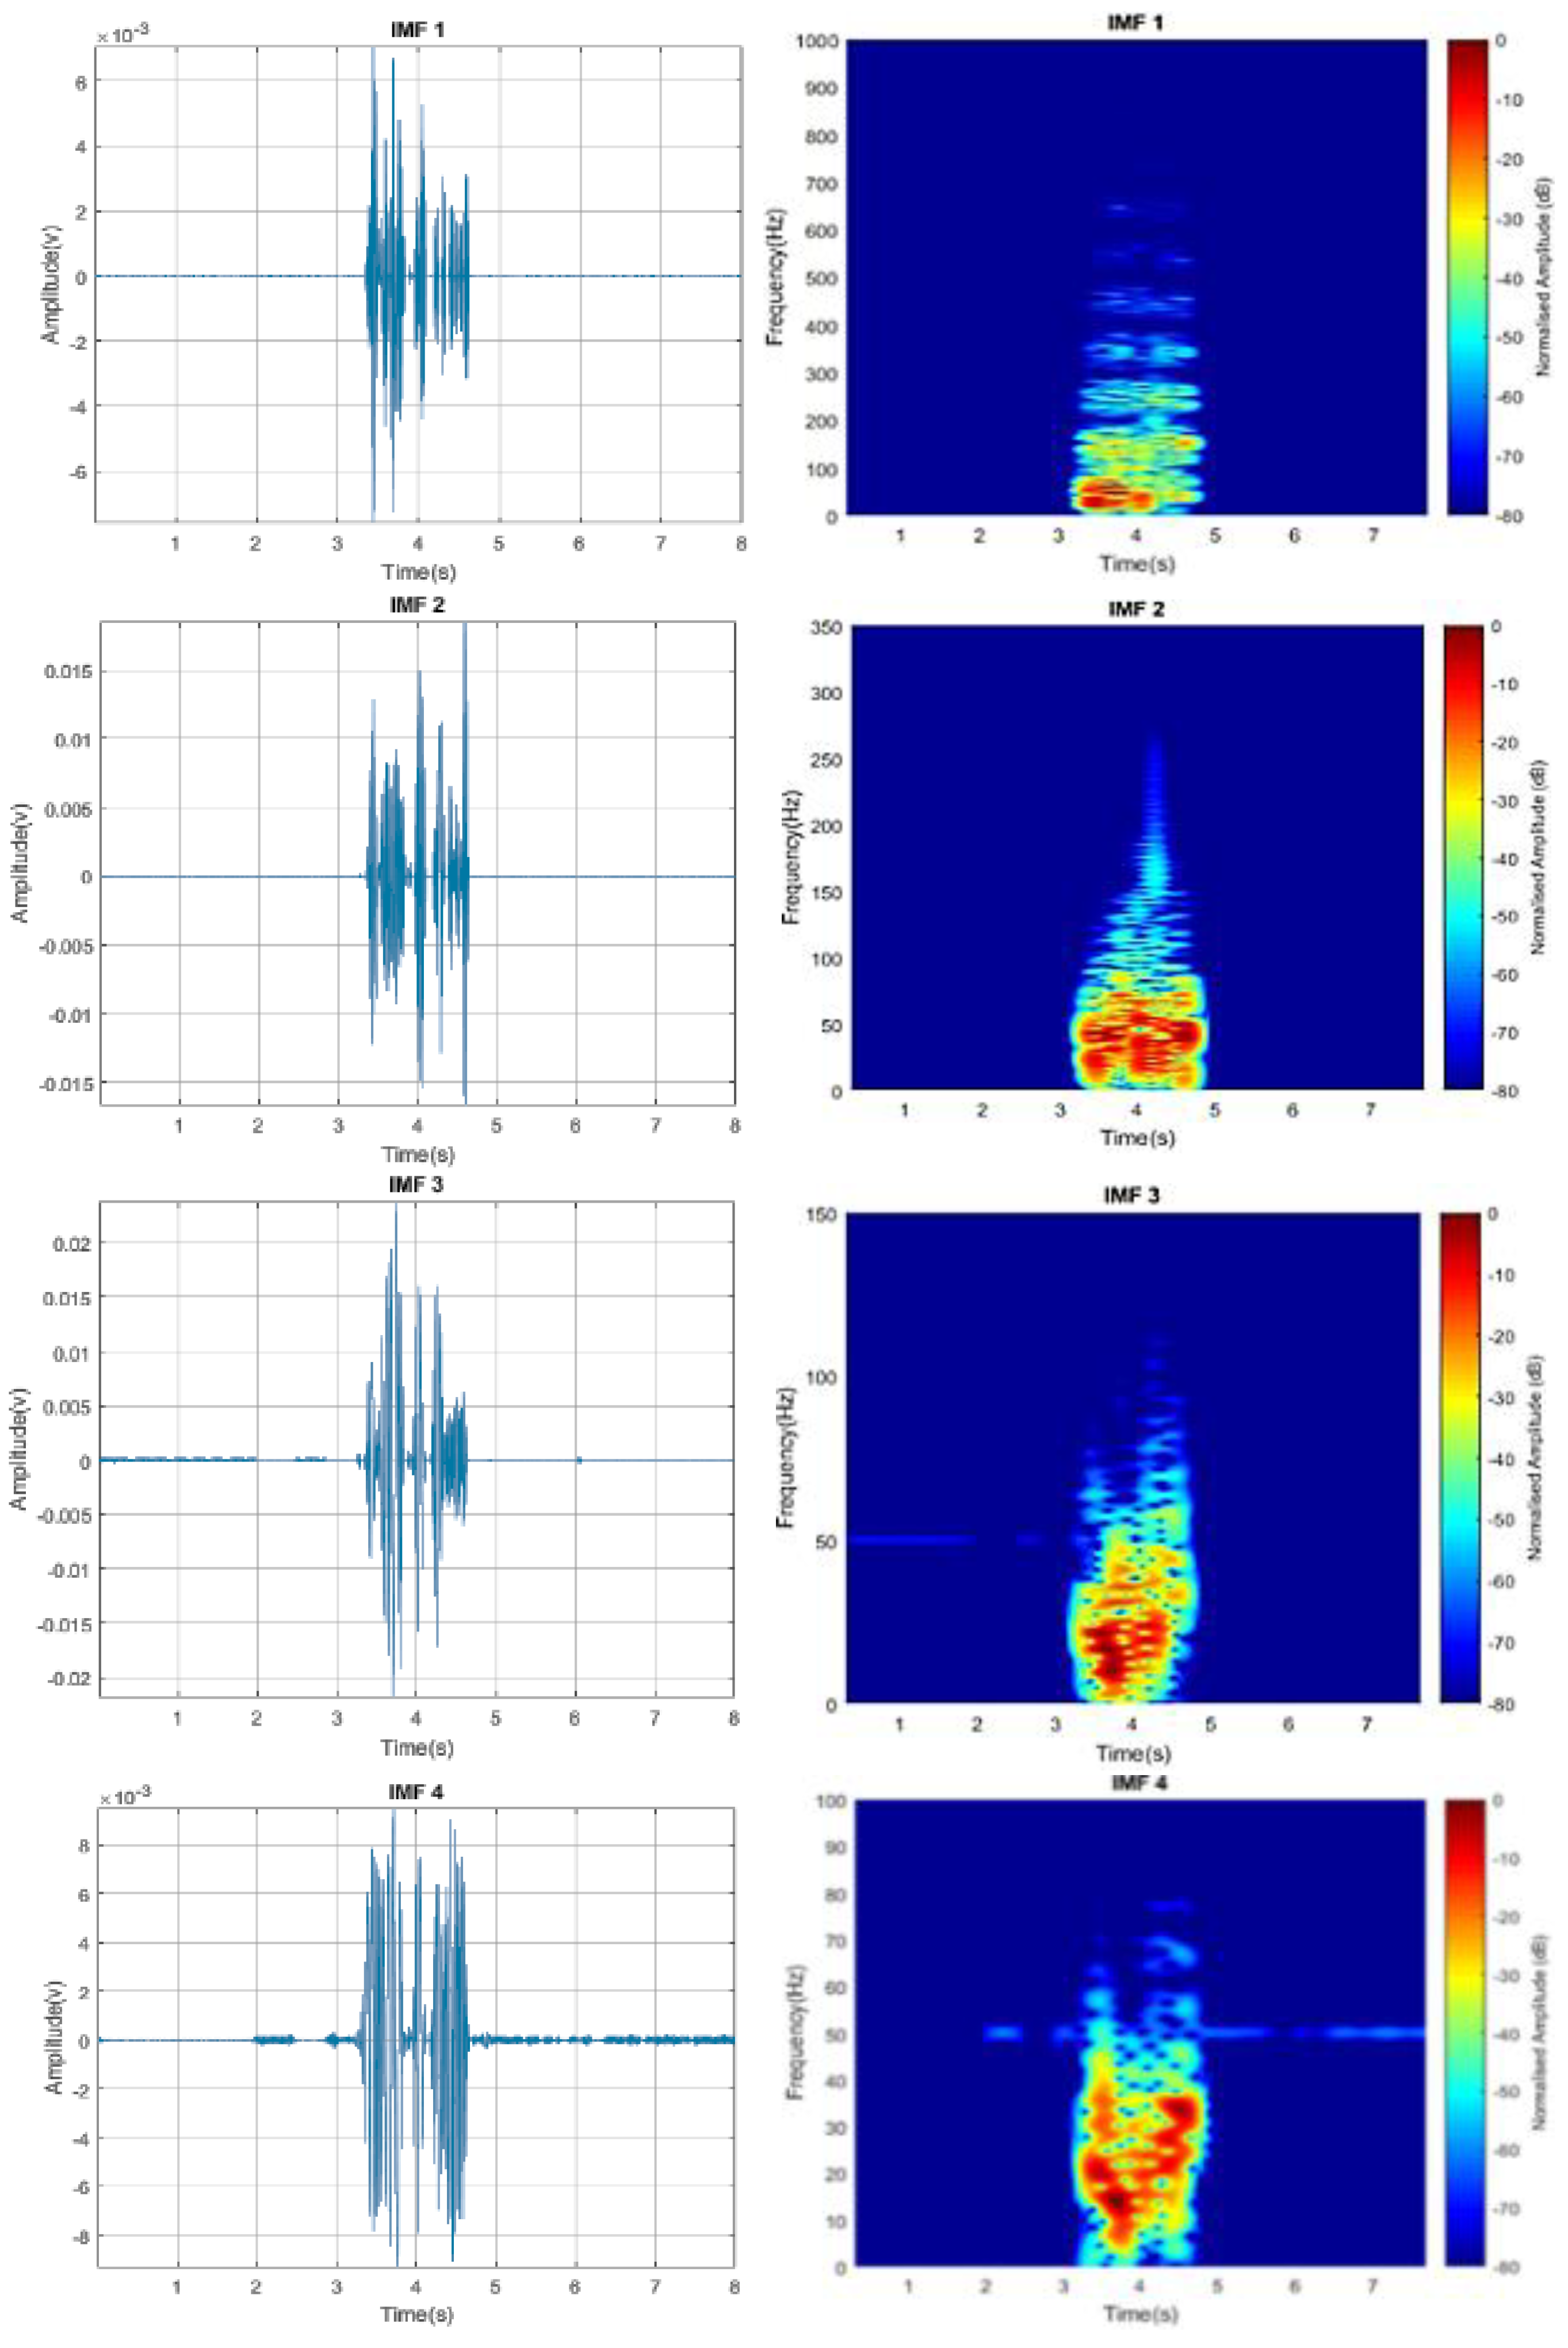
The empirical mode decomposition (EMD) involved a sifting process capability to decompose any given signal into an intrinsic component and derived non-linear functions called Intrinsic Mode Functions (IMF) [41]. This technique was introduced by N.E Huang et al. to analyze a non-linear and non-stationary signal [42]. It is a successive algorithm that enables the primary function, of which can be non-linearly derived from the original signal in an adaptive basis called the IMF. These IMFs are the corresponding frequency components available in the original data, efficiently helping to separate between the Doppler due to radial velocity and the micro-Doppler due to the rotating blade.
To achieve an instantaneous frequency component at a time, these conditions must be achieved [40,41]: i. the differences between the numbers of extremes to that of zero crossing must always be one or equal to zero and ii. the signal envelop’s mean value must, at all times, be equal to zero. This mean value is identified by the local minima and maxima of the signal envelope, hence, making the algorithm recursive in nature. To decompose the original signal into intrinsic functions, let y(n) be the original signal received during the detection. A residue can be initialized as ro = y(n) for i = 1. The signal y(n) is used to form an upper and lower envelope through interpolation between the minimum and maximum extremes. The envelope mean value, Yμ, is given by Equation (2).
Y µ ( i ) = Y m a x + Y m i n 2
where Y m a x is upper signal envelope and Y m i n is the lower envelope; a new signal, H i ( n ) , is obtained by subtracting the mean value from the original signal as
Y(n) − Y_µ (i) = Hi(n)
If the IMF criteria were met by H i ( n ) ,   then H i ( n ) = IMF(i); otherwise, the sifting process returned to the beginning until all minimum extremes became negative and all maximum extremes returned to positive. A residue was defined by
r ( i )   = r ( i 1 )   I M F ( i )
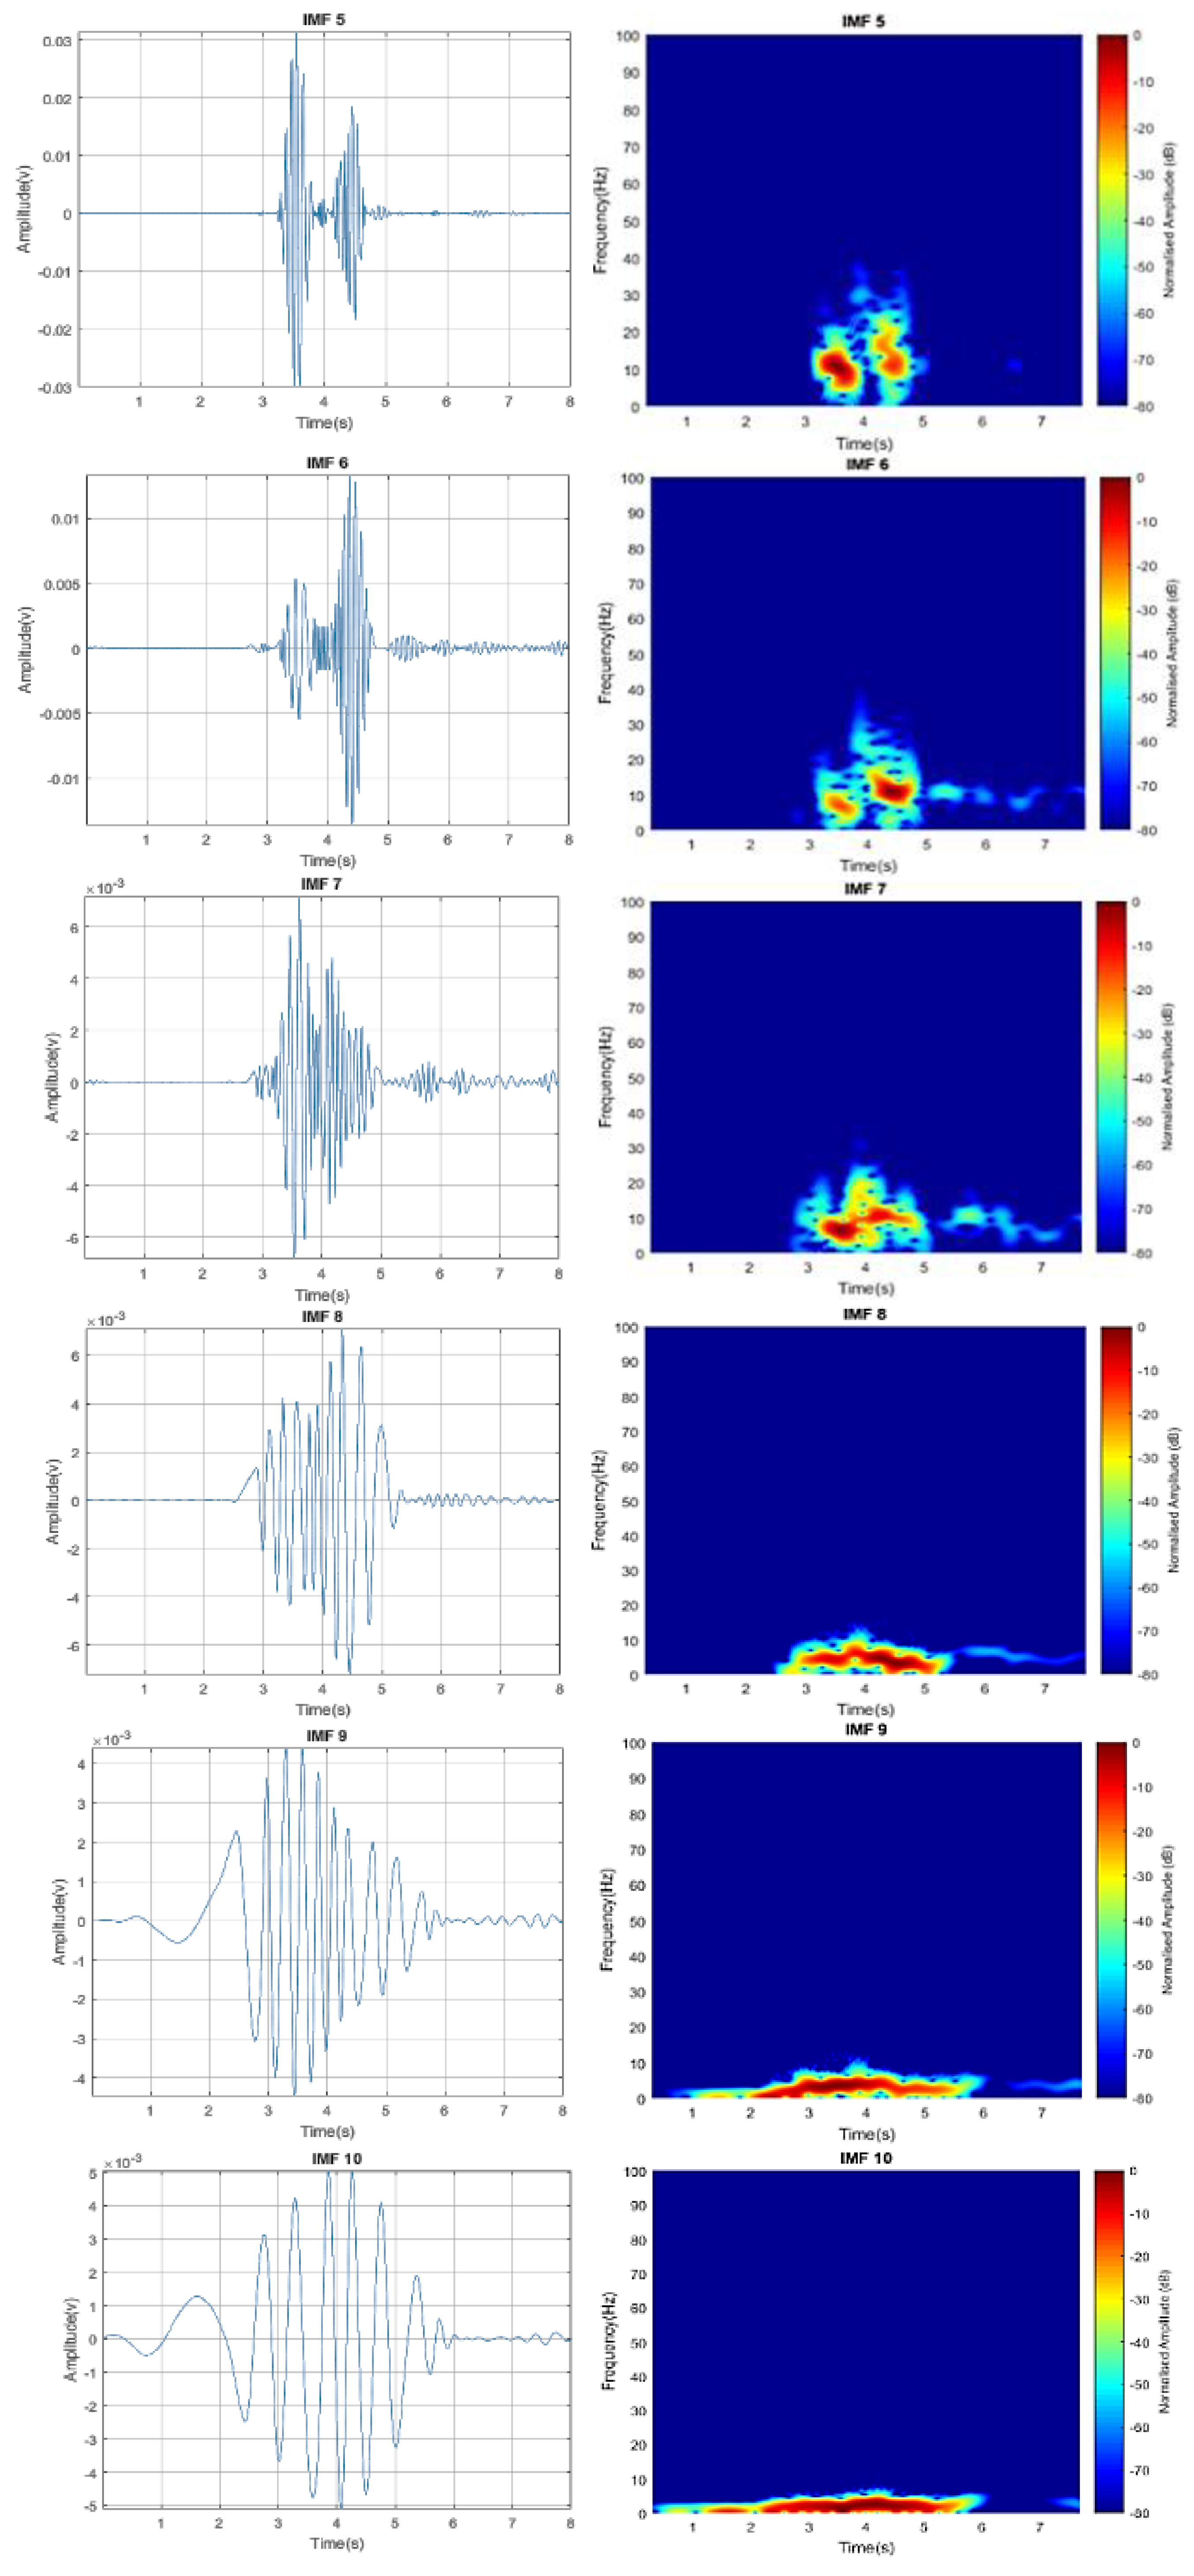
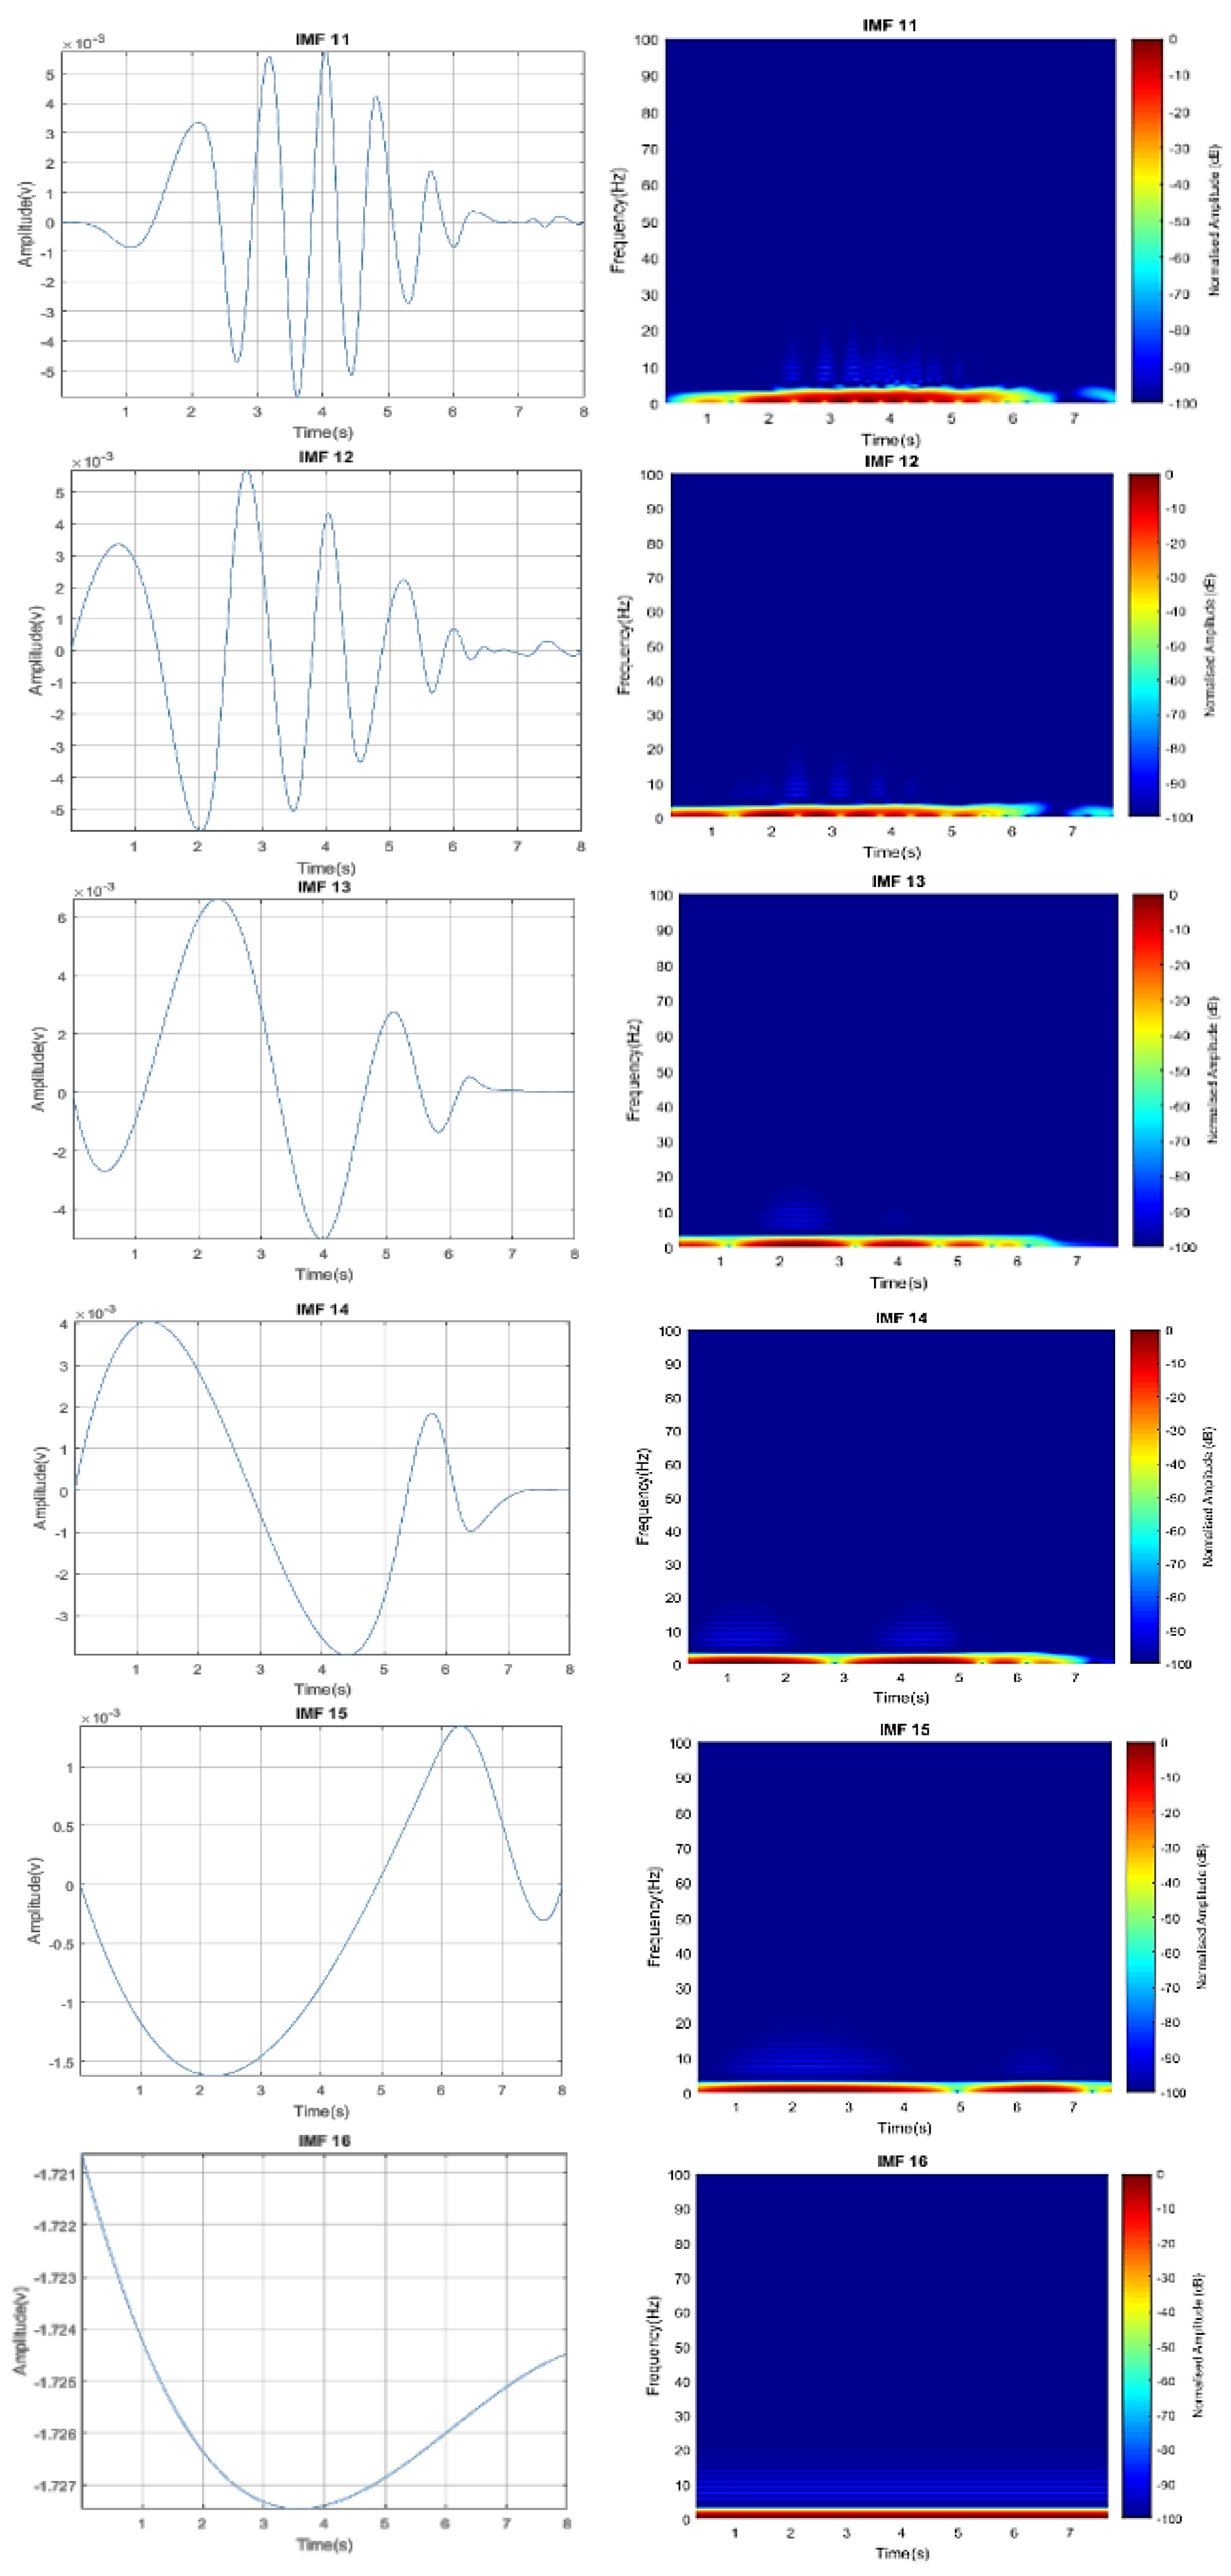
such that, once the condition is fulfilled, the sifting process stops; otherwise, the algorithm starts over again. Once the EMD provided the feature vector and calculated the energy of each corresponding IMF component, the time domain presentation of the IMFs can be plotted.

3. Results and Discussion

3.1. Drone Detection

3.1.1. Signal 1 (Test 1)

Figure 9 illustrates the time domain of the received signal output of ADC and its corresponding STFT representation at points A and B in Figure 8, respectively. In this scenario, a 15 s observation time was considered; hence, the recording signal can show the moment that the drone crosses the baseline. The drone flies and crosses the baseline approximately at time 7.5 s, which can be seen in Figure 9a. The direct signal disrupted spans for an almost 2 s duration (7.5–9.5 s). Hence, the captured signal was sampled between 5–13 s for STFT to minimize the processing time, as shown in Figure 9b, and defined as a target signature. The signature comprises both the main Doppler, due to the linear motion of the body, and the micro-Doppler, due to the rotating blades, which also indicates the highest Doppler frequency value reaches to 88 Hz. It can be assumed that the micro-Doppler occupied the higher frequency region. This result proved the p-FSR DVB-S system can detect a flying target crossing the FS baseline.
Next, the detected signal is decomposed using EMD to extract all frequency components present in the signal. These IMFs are not meant to classify the target among other low-profile targets like birds, but rather confirmed that the detected target is a drone-based on the unique signature is from the STFT figure where an expected V-shape signature made by the crossing drone is surrounded by the micro-Doppler due to the rotating blade, as proved in [10] for the FSR system. In total, 17 corresponding frequency components were extracted from the main signal and illustrated in Figure 10 (point C in Figure 8); a few points can be depicted:
  • The time domain envelope of the extracted vectors for IMF1–IMF7 are approximately similar;
  • IMF1–IMF3 have higher frequencies. Besides, IMF2 and IMF3 visibly show the higher-frequency component to the original signal frequency value. The IMFs’ component value is by far greater than the 88 Hz, hence considered to represent the noise component in the signal;
  • Similarly, IMF4 and IMF5 represent the micro-Doppler components with the main Doppler underneath the lower frequency level;
  • IMF6–IMF8 follow suit, despite the low-frequency components, yet it maintained the signal behavior. The observed signature corresponds to the main Doppler component generated by the target/drone body. Although the main Doppler components can still be surrounded by the micro-Doppler spikes, IMF6 provides a clear signature of the target crossing baseline—this will further be analyzed in the subsequent section;
  • Doppler frequency in IMF9–IMF17 is linearly spread over the lower boundary of the frequency value, making the vector components approaches a residue condition;
  • The sifting process continues until the residual condition was achieved, i.e., the minimum extreme returned negative and the maximum extreme returned positive; these makes the signal mean Y(µ) value equal to zero, then Hi(n) = Y(n);
In summary, the extracted vector signatures by EMD are more refined and confirmed the detection of a flying drone based on the Doppler and micro-Doppler components present. Both Doppler due to the drone linear motion and the micro-Doppler due to the rotating blades can be distinguished as further analysis on IMF6, as presented below in Figure 11.

3.1.2. Signal 2 (Test 2)

Figure 12 illustrates the graph at point A and B in Figure 8, respectively, for the next run of a drone flying and crossed the FS baseline. In this run, the drone starts to enter the FS main lobe after approximately 8.3 s. The direct signal disrupted spans for an almost 1.5 s duration (8.3–9.8 s); this indicates that the drone has a slightly higher speed compared to the previous signal 1. Consequently, the Doppler frequency value is slightly higher (approximately reach 91 Hz) than signal 1. Nevertheless, the sample duration was taken from 6–14 s for STFT processing. The captured signal, once again, proved that the passive FSR DVB-S system can detect a target flying crossing the FS baseline.
Correspondingly, the next processing is to decompose the detected signal by using EMD to extract frequency components contained in the received signal. In contrast, the resultant sifting process terminated at 16 IMFs as presented vectors in Figure 13, and a few points can be depicted:
  • The time domain envelope of the extracted vectors for IMF1–IMF4 are approximately similar;
  • IMF1–IMF2 visibly show the higher frequency component to the original signal frequency value, with far greater than the 91 Hz; hence, it is considered to represent the noise component in the signal;
  • IMF3 and IMF4 represent the micro-Doppler components with the main Doppler underneath the lower frequency level;
  • IMF5–IMF7 follow suit despite the low-frequency components, yet it maintained the signal behavior. The observed signature corresponds to the main Doppler component generated by the target/drone body. Although the main Doppler components can still be surrounded by the micro-Doppler spikes, IMF5 provides a clear signature of the target crossing baseline— this will be further analyzed in the subsequent section;
  • The Doppler frequencies in IMF8–IMF16 are linearly spread over the lower boundary of the frequency value, making the vector components approaches a residue condition;
  • The sifting process continues until the residual condition was achieved.
Once again, the extracted vector signatures by EMD are more refined and confirmed by the detection of a flying drone based on the Doppler and micro-Doppler components present. Both the Doppler, due to the drone linear motion, and the micro-Doppler, due to the rotating blades, can be distinguished as further analysis on IMF5, as presented below in Figure 14 for Signal 2.
A complete passive FSR system based on DVB-S of Measat3 has successfully developed and implemented. The system can detect a commercial drone fly and crossed the FS baseline between the satellite and ground station. It also revealed that the bistatic RCS at FS mode is the highest irrespective of the blade orientation and its material. The SNR of the direct path was considered reasonable to make detection possible with 1 dB above the detection threshold of 13 dB for passive bistatic application. By using Equation (5), the Pdir arriving the antenna front end is −82.13dBm, which is within the practical value range, hence required a processing gain of 55–75 dB to achieve the minimum SNR for detection—the detail of the analysis can be seen in [9].
P r x _ b s = ( E I R P . G r . λ 2 . σ b ( 4 π ) 3 R t x 2 R r x 2   )
With the enhanced performance of the FSR receiving system, the minimum processing gain of 10–20 dB is enough to meet the sensitivity level of the receiver amplitude detector, hence the manifestation of the improved FSR capability. The maximum detection range depends on a few factors; in the FSR system, the factors that influence the maximum range are the drone FS RCS, the sensitivity of the FS receiver and satellite transmit power. Based on the theoretical calculations of the direct power received (Pdir) earlier stated, the maximum practical detection range is 100 m, as depicted in Table 1.
A target was detected based on the amplitude modulation of the perturbed direct signal from the satellite. However, the detected signal does not reveal the type of a target. Hence, the signal is further processed by EMD to extract the micro-Doppler scattered by the drone’s blade. By analyzing the IMF, the micro-Doppler and Doppler pattern can be seen, which resemble the Doppler scattered by the drone’s blade and body, respectively. The Doppler from the drone body follow a V-shape-like pattern, indicating a target approaching the FS baseline, and then fly away from the baseline; the latter action shows the increases in Doppler frequency. The Doppler frequency is at the lowest value when the target is on the baseline. The micro-Doppler pattern with higher frequency can be seen from IMF4 to IMF6 for both signals.

3.2. Non-Drone Target Detection

Here, we presented a non-drone target crossing the baseline of the DVB-S-based passive FSR system to establish that a non-rotating target can be differentiated from a target with micro-Doppler component. This provides further evidence of a key feature to distinguish the drone from other targets. A fixed object without any micro movement was made to cross the baseline, and the corresponding signature is presented in Figure 15.
Our aim here is view the Doppler signature without the micro-Doppler component; we therefore considered that only the IMF seems to be representing the Doppler component. The signal of Figure 15 was further decomposed via similar procedures discussed earlier to obtain the corresponding IMF components present. Figure 16 depicted only IMF4 out of the 16 vector components present in the original sampled signal after the sifting process.
Based on the IMF4 representation depicted in Figure 16, both the time domain and the time–frequency, STFT representation do not contain any micro-Doppler components surrounding the main Doppler, as in the earlier-presented drone signature. For a clearer classification between targets (bird inclusive), other processing techniques may be employed. This served as a future area for further studies.
Although the DVB-S-based FSR system is limited to the narrow coverage area, it can easily be integrated into a conventional passive bistatic DVB-S system and enjoys the benefit of FSR. FSR will leverage its high Doppler resolution for target recognition. This study may open a basis for comprehensive aerial monitoring that could be utilized in, but not limited to, applications such as air traffic surveillance, border monitoring and perimeter protection. Figure 17 illustrates some potential applications of the DVB-S FSR system, with the possibility of integrating with passive bistatic radar, among which may include air traffic surveillance and control.

4. Conclusions

The paper highlighted the potential threats suffered as a result of drone misuse by civil society and why drone detection became essential. In an attempt to implement the DVB-S-based passive FSR system, this paper described the challenges derailing the use of a DVB-S satellite as an illuminator of opportunity for passive application, especially for an airborne target. Based on the FSR capability of detecting a very small signal variation, the passive FSR system was used and detected the quadcopter drone. After a pervasive summary of some implemented DVB-S-based radars, the Measat3 signal waveform was captured and be used for this work. Based on the two scenarios considered, we may be able to conclude that the drone was successfully detected. To further extract other features that help in identifying the drone, we employed EMD and decomposed the detected signal into an IMF for further feature extractions. Based on the extracted feature vectors, we may conclude that the DVB-S-based passive FSR system was successfully implemented and used to detect a low-profile, airborne target, i.e., a quadcopter drone. For now, the system achieved a detection altitude of up to 80 m above sea level, but can be improved by increasing the height of the receiving station. Future studies may include how these extracted vectors will be used for the classification of quadcopter drones from other types of drones and natural targets like birds.

Author Contributions

R.S.A.R.A. created the main ideas, analyzed the results, and served as an advisor, S.A.M. performed the simulation and experimental work. N.E.A.R. and A.A.S. analyzed and validated the idea, concept, and results. A.S. and A.I. provide feedback on the content of the papers and supervision. All authors have read and agreed to the published version of the manuscript.

Funding

This research was funded by Universiti Putra Malaysia Impactful Grant, grant number (UPM/700-2/1/GPB/2018/9598800). The APC was funded by Universiti Putra Malaysia.

Conflicts of Interest

The authors declare no conflict of interest.

References

  1. Osamu, T. RF Techniques for Detecting and Classifying UAV. In Proceedings of the 5th Smartcity (SMC) Workshop, UPM Sri-Serdang, Malaysia, 15–17 March 2017; pp. 1–15. [Google Scholar]
  2. Sturdivant, R.L.; Chong, E.K.P. Systems Engineering Baseline Concept of a MultiSpectral Drone Detection Solution for Airports. IEEE Access 2017, 5, 1. [Google Scholar] [CrossRef]
  3. De Wit, J.J.; Harmanny, R.I.A.; Premel-Cabic, G. Micro-Doppler Analysis of Small UAVs. In Proceedings of the 9th European Radar Conference (EuRAD), Amsterdam, The Netherlands, 31 October–2 November 2012; pp. 210–213. [Google Scholar]
  4. Case, E.E.; Zelnio, A.M.; Rigling, B.D. Low-Cost Acoustic Array for Small UAV Detection and Tracking. In Proceedings of the 2008 IEEE National Aerospace and Electronics Conference, Dayton, OH, USA, 16–18 July 2008; pp. 110–113. [Google Scholar]
  5. Rozantsev, A.; Lepetit, V.; Fua, P. Flying objects detection from a single moving camera. In Proceedings of the 2015 IEEE Conference on Computer Vision and Pattern Recognition (CVPR), Boston, MA, USA, 7–12 June 2015; pp. 4128–4136. [Google Scholar]
  6. Nguyen, P.; Ravindranatha, M.; Nguyen, A.; Han, R.; Vu, T. Investigating Cost-effective RF-based Detection of Drones. In Proceedings of the 2nd Workshop on Deep Learning for Recommender Systems—DLRS 2017, Como, Italy, 27 August 2017; Association for Computing Machinery (ACM): New York, NY, USA, 2017; pp. 17–22. [Google Scholar]
  7. Nuss, B.; Sit, L.; Fennel, M.; Mayer, J.; Mahler, T.; Zwick, T. MIMO OFDM radar system for drone detection. In Proceedings of the 2017 18th International Radar Symposium (IRS), Prague, Czech Republic, 28–30 June 2017; pp. 1–9. [Google Scholar]
  8. BBC. How Countries Counter the Drone Threat. 2018. Available online: www.bbc.com/news/technology-46639099 (accessed on 25 December 2018).
  9. Musa, S.A.; RSA, R.A.; Sali, A.; Isma’il, A.; Rashid, N.E.A. A DVBS based Forward Scattering Radar for Drone Detection. In Proceedings of the 2019 20th International Radar Symposium (IRS), Ulm, Germany, 26–28 June 2019; pp. 1–8. [Google Scholar]
  10. Musa, S.A.; RAS, R.A.; Sali, A.; Isma’il, A.; Rashid, N.E.A. Low-Slow-Small (LSS) target Detection based on Micro Doppler Analysis in Forward Scattering Radar Geometry. Sensors 2019, 19, 3332. [Google Scholar] [CrossRef] [PubMed] [Green Version]
  11. Golabi, M.; Sheikhi, A.; Biguesh, M.; Sheikhi, A. A new approach for sea target detection in satellite based passive radar. In Proceedings of the 2013 21st Iranian Conference on Electrical Engineering (ICEE), Mashhad, Iran, 14–16 May 2013; pp. 1–5. [Google Scholar]
  12. Salah, A.; Abdullah, R.R.; Aziz, N.A.; Ismail, A.; Hashim, F. Experimental study of LTE signals as illuminators of opportunity for passive bistatic radar applications. Electron. Lett. 2014, 50, 545–547. [Google Scholar] [CrossRef]
  13. Mazhar, H.; Hassan, S.A. Analysis of target multipaths in WiFi-based passive radars. IET Radar Sonar Navig. 2016, 10, 140–145. [Google Scholar] [CrossRef]
  14. Peto, T.; Seller, R. Quad channel DVB-T based passive radar. In Proceedings of the 2016 17th International Radar Symposium (IRS), Krakow, Poland, 10–12 May 2016; pp. 1–4. [Google Scholar]
  15. Weiss, M. Compressive sensing for passive surveillance radar using DAB signals. In Proceedings of the 2014 International Radar Conference, Lille, France, 13–17 October 2014; pp. 1–6. [Google Scholar]
  16. Venu, D.; Rao, N.K. A cross-correlation approach to determine target range in passive radar using FM Broadcast Signals. In Proceedings of the 2016 International Conference on Wireless Communications, Signal Processing and Networking (WiSPNET), Chennai, India, 23–25 March 2016; pp. 524–529. [Google Scholar]
  17. Sciancalepore, S.; Ibrahim, O.A.; Oligeri, G.; Di Pietro, R. PiNcH: An effective, efficient, and robust solution to drone detection via network traffic analysis. Comput. Netw. 2020, 168, 107044. [Google Scholar] [CrossRef] [Green Version]
  18. Coluccia, A.; Ghenescu, M.; Piatrik, T.; De Cubber, G.; Schumann, A.; Sommer, L.; Klatte, J.; Schuchert, T.; Beyerer, J.; Farhadi, M.; et al. Drone-vs-Bird detection challenge at IEEE AVSS2017. In Proceedings of the 2017 14th IEEE International Conference on Advanced Video and Signal Based Surveillance (AVSS), Lecce, Italy, 29 August–1 September 2017; pp. 1–6. [Google Scholar]
  19. Suberviola, I.; Mayordomo, I.; Mendizabal, J. Experimental Results of Air Target Detection with a GPS Forward-Scattering Radar. IEEE Geosci. Remote. Sens. Lett. 2011, 9, 47–51. [Google Scholar] [CrossRef]
  20. Clemente, C.; Parry, T.; Galston, G.; Hammond, P.; Berry, C.; Ilioudis, C.; Gaglione, D.; Soraghan, J.J. GNSS based passive bistatic radar for micro-Doppler based classification of helicopters: Experimental validation. In Proceedings of the 2015 IEEE Radar Conference (RadarCon), Arlington, VA, USA, 10–15 May 2015; pp. 1104–1108. [Google Scholar]
  21. Garvanov, I.; Kabakchiev, C.; Behar, V.; Daskalov, P. Air target detection with a GPS forward-scattering radar. In Proceedings of the 2016 19th International Symposium on Electrical Apparatus and Technologies (SIELA), Bourgas, Bulgaria, 29 May–1 June 2016. [Google Scholar]
  22. Contu, M.; De Luca, A.; Hristov, S.; Daniel, L.; Stove, A.; Gashinova, M.; Cherniakov, M.; Pastina, D.; Lombardo, P.; Baruzzi, A.; et al. Passive Multifrequency Forward-Scatter Radar Measurements of Airborne Targets Using Broadcasting Signals. IEEE Trans. Aerosp. Electron. Syst. 2017, 53, 1067–1087. [Google Scholar] [CrossRef]
  23. Kabakchiev, C.; Behar, V.; Garvanov, I.; Kabakchieva, D.; Rohling, H.; Bentum, M.; Fernandes, J.; Kabakchiev, A. Air target detection using pulsar FSR. In Proceedings of the 2017 18th International Radar Symposium (IRS), Prague, Czech Republic, 28–30 June 2017; pp. 3–9. [Google Scholar]
  24. Gashinova, M.; Daniel, L.; Hoare, E.; Kabakchiev, K.; Cherniakov, M.; Sizov, V. Forward scatter radar mode for passive coherent location systems. In Proceedings of the 2013 International Conference on Radar, Adelaide, Australia, 9–12 September 2013; pp. 235–239. [Google Scholar]
  25. Kulpa, K.; Malanowski, M.; Bączyk, M.; Krysik, P.; Krzysztof, K. Passive radar detection range enhancement using forward scatter geometry. In Proceedings of the 2015 16th International Radar Symposium (IRS), Dresden, Germany, 24–26 June 2015; pp. 54–59. [Google Scholar] [CrossRef]
  26. Hu, C.; Liu, C.; Wang, R.; Chen, L.; Wang, L. Detection and SISAR Imaging of Aircrafts Using GNSS Forward Scatter Radar: Signal Modeling and Experimental Validation. IEEE Trans. Aerosp. Electron. Syst. 2017, 53, 2077–2093. [Google Scholar] [CrossRef]
  27. Tsao, T.; Weiner, D.; Varshney, P.; Schwarzlander, H.; Slamani, M.; Borek, S. Ambiguity function for a bistatic radar. IEEE Trans. Aerosp. Electron. Syst. 1997, 33, 1041–1051. [Google Scholar] [CrossRef]
  28. Griffiths, H.D.; Garnett, A.J.; Baker, C.J.; Keaveney, S.; Malvern, D.R.A. Bistatic Radar Using Satellite-Borne Illuminators of Opportunity. In Proceedings of the 92 International Conference on Radar, Brighton, UK, 12–13 October 1992; Volume 6, pp. 276–279. [Google Scholar]
  29. Sun, Z.; Wang, T.; Jiang, T.; Chen, C.; Chen, W. Analysis of the properties of DVB-S signal for passive radar application. In Proceedings of the 2013 International Conference on Wireless Communications and Signal Processing, Hangzhou, China, 24–26 October 2013; pp. 1–5. [Google Scholar]
  30. Yu, Q.; Peng, H. Target Detection Technology in Passive Radar Based on Broadcasting Satellite Signals. In Proceedings of the 2015 International Conference on Computer Science and Mechanical Automation (CSMA), Hangzhou, China, 23–25 October 2015; pp. 191–195. [Google Scholar]
  31. Palmer, J.; Palumbo, S.; Summers, A.; Merrett, D.; Howard, S. DSTO’s Experimental Geosynchronous Satellite based PBR. In Proceedings of the 2009 International Radar Conference “Surveillance for a Safer World” (RADAR 2009), Bordeaux, France, 12–16 October 2009; pp. 1–6. [Google Scholar]
  32. Xu, S.; Chen, Z. Feasibility Surveillance Air/Space Surveilance; IEEE Conference Publication: Piscataway, NJ, USA, 2006; pp. 6–9. [Google Scholar]
  33. Radmard, M.; Bayat, S.; Farina, A.; Hajsadeghian, S.; Nayebi, M.M. Satellite-based forward scatter passive radar. In Proceedings of the 2016 17th International Radar Symposium (IRS), Krakow, Poland, 10–12 May 2016; pp. 1–4. [Google Scholar] [CrossRef]
  34. Arcangeli, A.; Bongioanni, C.; Ustalli, N.; Pastina, D.; Lombardo, P. Passive forward scatter radar based on satellite TV broadcast for air target detection: Preliminary experimental results. In Proceedings of the 2017 IEEE Radar Conference (RadarConf), Seattle, WA, USA, 8–12 May 2017; pp. 1592–1596. [Google Scholar]
  35. Brisken, S.; Moscadelli, M.; Seidel, V.; Schwark, C. Passive radar imaging using DVB-S2. In Proceedings of the 2017 IEEE Radar Conference (RadarConf), Seattle, WA, USA, 8–12 May 2017; pp. 0552–0556. [Google Scholar]
  36. Abdullah, R.S.A.R.; Aziz, N.H.A.; Rashid, N.E.A.; Salah, A.A.; Hashim, F. Analysis on Target Detection and Classification in LTE Based Passive Forward Scattering Radar. Sensors 2016, 16, 1607. [Google Scholar] [CrossRef] [PubMed] [Green Version]
  37. Fairchild, D.P.; Narayanan, R.M. Classification of human motions using empirical mode decomposition of human micro-Doppler signatures. IET Radar Sonar Navig. 2014, 8, 425–434. [Google Scholar] [CrossRef]
  38. De Wit, J.J.M.; Harmanny, R.I.A.; Molchanov, P. Radar micro-Doppler feature extraction using the Singular Value Decomposition. In Proceedings of the 2014 International Radar Conference, Lille, France, 13–17 October 2014; pp. 1–6. [Google Scholar] [CrossRef]
  39. Fioranelli, F.; Ritchie, M.; Griffiths, H. Classification of Unarmed/Armed Personnel Using the NetRAD Multistatic Radar for Micro-Doppler and Singular Value Decomposition Features. IEEE Geosci. Remote Sens. Lett. 2015, 12, 1933–1937. [Google Scholar] [CrossRef] [Green Version]
  40. Brewster, A.; Balleri, A. Extraction and analysis of micro-Doppler signatures by the Empirical Mode Decomposition. In Proceedings of the 2015 IEEE Radar Conference (RadarCon), Arlington, VA, USA, 10–15 May 2015; pp. 947–951. [Google Scholar]
  41. Cai, C.; Liu, W.; Fu, J.S.; Lu, L. Empirical mode decomposition of micro-doppler signature. In Proceedings of the IEEE International Radar Conference, Arlington, VA, USA, 9–12 May 2005. [Google Scholar]
  42. Huang, N.E.; Shen, Z.; Long, S.R.; Wu, M.C.; Shih, H.H.; Zheng, Q.; Yen, N.-C.; Tung, C.C.; Liu, H.H. The empirical mode decomposition and the Hilbert spectrum for nonlinear and non-stationary time series analysis. Proc. R. Soc. A 1998, 454, 903–995. [Google Scholar] [CrossRef]
Figure 1. DVB-S-based passive FSR geometry.
Remotesensing 12 03075 g001
Figure 2. E-field facing the direction of the blade’s (a) Face (b) Edge (c) Tip.
Remotesensing 12 03075 g002
Figure 3. Drone blade’s RCS in Cartesian and Polar coordinates at three different blade orientations for (a) PEC and (b) Plastic.
Remotesensing 12 03075 g003
Figure 4. Aerial view of the experimental site, the ground station located in a futsal court with a clear canopy.
Remotesensing 12 03075 g004
Figure 5. FSR receiver block diagram to receive direct DVB-S signal and signal scattered by the drone.
Remotesensing 12 03075 g005
Figure 6. Snapshot of actual Measat3 signal (a) measured on Digital Satellite meter and (b) signal spectrum.
Remotesensing 12 03075 g006
Figure 7. Experimental site (a) receiving systems experimental setup (b) parabolic dish antenna.
Remotesensing 12 03075 g007
Figure 8. Signal processing for drone detection in passive FSR.
Remotesensing 12 03075 g008
Figure 9. (a) Received signal (Signal 1) in time domain at the output of ADC, and (b) its joint time–frequency representation of the sampled signal (5–13 s) denoted as target signature.
Remotesensing 12 03075 g009
Figure 10. Time domain and STFT plot of IMF1-IMF17.
Remotesensing 12 03075 g010aRemotesensing 12 03075 g010bRemotesensing 12 03075 g010c
Figure 11. Extracted Doppler Component IMF6 (a) time domain and (b) its corresponding STFT plot.
Remotesensing 12 03075 g011
Figure 12. (a) Received signal (Signal 2) in time domain at the output of ADC, and (b) its joint time–frequency representation of the sampled signal (6–14 s) denoted as target signature.
Remotesensing 12 03075 g012
Figure 13. Time domain and STFT plot of IMF1-IMF16.
Remotesensing 12 03075 g013aRemotesensing 12 03075 g013bRemotesensing 12 03075 g013c
Figure 14. Extracted Doppler Component IMF5 (a) time domain and (b) its corresponding STFT plot.
Remotesensing 12 03075 g014
Figure 15. (a) Received signal in time domain at the output of ADC, and (b) its time–frequency representation of the sampled signal (1–6 s) denoted as target signature.
Remotesensing 12 03075 g015
Figure 16. Extracted Doppler Component IMF4 (a) time domain and (b) its corresponding STFT plot.
Remotesensing 12 03075 g016
Figure 17. Satellite-based forward-scattering radar potential applications.
Remotesensing 12 03075 g017
Table 1. Potential signal as passive radar and its fundamental suitability features.
Potential Passive SignalProsCons
Global navigation satellite system (GNSS)Global coverage (even in open sea) and in the availability of multiple sources (different satellites and constellations).No continuous signal from a single satellite on a specific location to be used for continues monitoring.
Frequency modulation (FM) broadcastingHigh power levels provided and wide coverage.Low resolution as FM transmission use lower frequency as carrier signal; thus, the low-RCS target such as Drone is difficult to detect.
Long-Term Evolution (LTE)/Mobile telecommunicationExcellent ambiguity function (Range and Doppler resolution). Multiple drone detection.Limited to only low-altitude target because depending on height of the tower and antenna tilting, which normally pointing to the ground.
Ground-based RadarConstant and controlled coverage. Drone tracking. Multiple drone detection.All materials do not reflect a conventional radar signal, especially low-RCS-like Drone. Besides the conventional ground-based radar system cannot see behind obstacles.
WIFI/RF signalLow cost, possible for drone and pilot localization, as well as drone make and model identification. Multiple drone detection.Extensive traffic on 2.4, 5 and 5.8 GHz bands which could implicate difficulties in finding drones in the background noise. Directed antennas on commercial drones make it virtually undetectable from the wrong direction.
Optical sensors (camera)Recorded visuals and images can be retained and used for forensic evidence of drone intrusions. Advanced infrared cameras can “see” in the dark.Poor performance in poor weather conditions, slow detection in a concept as it takes many pixels to cover a wide angle. High maintenance for lens likely must stay clean to maintain functionality.
Table 2. DVB-S-based radars for airborne targets detection.
Ref.Aim and FeaturesAccomplishmentLimitations
[27]Bistatic Signal AFVerified the effect of geometry on the AF using three rectangular pulsesDoes not involve experimental validation
[28]Bistatic Signal AFDescribed effect of speed on processing gain of DVBS waveform ambiguities.Lack range migration for small and fast-moving objects
[32]Survey and analysis for airplane detectionEvaluated actual signal AF and analysis of the budgeted power for better SNRRelative low power yield due to long distance
[31]System performance analysisPower budget analysis and real detection of a truck, train and an airplane.Experimental results do not validate theoretical estimates
[29]APStar-5 Satellite for radar applicationSignal waveform analysisAddressed metal object with very high RCS
[30]Verification of max. detection rangeSignal analysis and proposed fast algorithmNo experimental detection
[35]DVB-S2 signal analysis and its implication to SAR/ISARVerified multiple illumination effect on system performance.The SAR/ISAR does not involve micro-Doppler Analysis
[34]DVB-S PFSR systemExperimental result for aircraft detection and Velocity estimationDoes not involved micro-Doppler Analysis of a low-profile target
Table 3. The DVB-S Measat3 parameters.
ParameterValue
Centre frequency (fc)11 GHz
Effective isotropic radiated power (EIRP) PTGT57 dBW
Transmitter range (Rtx)35,921 km
Receiver range (Rrx)1–100 m
Receiver bandwidth (Brx)24 MHz
Signal bandwidth (Bs)36 MHz
Min. antenna gain (Ga)36 dBi
Low noise block (LNB) gain GL for Ku-band55–65 dB
Noise temp. of Rx sys (Ts)300 K
Boltzmann constant (K)1.38 × 10⁻²³ J/K
Ku-band prop. loss (Lp)0.2 dB
Table 4. Cartesian and Polar summary of values for plastic and PEC materials.
Material TypePlasticPEC
Blade face facing E-field direction
Main lobe magnitude (dBm2)−49.70.877
Main lobe direction183°180°
Angular width (3dB)71.9°44.6°
Side lobe level (dB)−10.7−5.8
Blade edge facing E-field direction
Main lobe magnitude (dBm2)−56.5−13.6
Main lobe direction6.0°112.0°
Angular width (3dB)113.6°41.2°
Side lobe level (dB)−7.0−1.2
Blade tip facing E-field direction
Main lobe magnitude (dBm2)−59.7−16.3
Main lobe direction217.0°179.0°
Angular width (3dB)11.4°23.7°
Side lobe level (dB)−2.8−2.8
Table 5. Receiver transponders and their power level.
Absolute Frequency (GHz)Absolute Amplitude (dBm)
11.104−10.26
12.000−26.88
12.749−26.79
13.501−24.47
14.250−32.62
Table 6. Receiver system parameters.
Receiver Location
Latitude3.0083°
Longitude101.7219°
Satellite Data
Name91.5°E Measat3a/3/3b
Distance35,921 km
Dish Setup Data
Elevation angle77.5°
Azimuth (true)253.8°
Azimuth (magnitude)254.3°
LNB skew73.5°
Dish Parameters
Dish size65 cm
Minimum gain36 dBi
Beam width at 3dB2.6°

