1. Introduction
The Norwegian Cultural Heritage Act of 1978 states that all remains of human activity predating the Reformation in Norway (1537) are protected [
1]. In connection with planning schemes or similar activities that may come into conflict with archaeological remains, exemptions from the heritage act can be made through an application to the appropriate authorities. This triggers a standardised process of evaluation and excavation, the responsibility of which lies with three administrative bodies; the local county council, the regional museum and the Norwegian Directorate for Cultural Heritage (NO: Riksantikvaren).
Each county council employs archaeologists responsible for the day-to-day administration of cultural heritage matters within the geographical limits of the county. In connection with planning applications, this includes assessments that may include historical background studies, place-name studies, map regression and GIS-analyses, as well as visual reconnaissance and evaluation trenching. On conclusion of the evaluation process, the county archaeologists will determine whether the application conflicts with any heritage assets. If it does not, the area will be exempted from the cultural heritage act, and the planning scheme can proceed. However, if it is found to conflict with cultural heritage assets, an application of exemption from the act must be made to the relevant county council, which decides whether to stop the scheme or let it proceed pending further investigations. The Directorate for Cultural Heritage has the overarching responsibility. When an exemption is made, the regional museums will estimate the total extent of the site, calculate the excavation costs and, finally, carry out further, potentially large-scale, excavations which will release the heritage assets from the heritage act [
1,
2,
3].
Under this system, the archaeological evaluations follow well-established and standard routines that are applied nationwide. Fields in arable land are typically investigated archaeologically by trial trenching, where trenches up to four metres wide are excavated systematically across the planning area. To cover a representative area, whilst keeping the costs at a reasonable level, the trenches are typically established in parallel 5–20 m apart, ensuring coverage up to and exceeding 20% of the fields (
Figure 1). If archaeological features are encountered, their spatial location is located in plan and described at the archaeological horizon, and preliminary C14 samples may be extracted. Otherwise, the features are left unexcavated. Subsequent large-scale excavations are carried out through topsoil stripping, where the soil is removed down to the archaeological horizon by mechanical excavation. Features of archaeological interest are then recorded in the plans, before being excavated, recorded and sampled in section. The extent of the excavations depends on the limits of the planning application, but this is not to say that the entire area will always be subject to full-scale excavation. Within the budgetary constraints of the project, it is up to the project manager to ensure that a representative portion of the archaeology is excavated and recorded, often resulting in parts of the archaeological site being left unexplored.
Evaluation by machine trenching followed by excavation by topsoil stripping is a relatively recent phenomenon in Norwegian archaeology. Although the 1970s and -80s saw sporadic experimentation, the approach did not become fully integrated as a method until the early 1990s [
4]. Its introduction must be regarded as nothing short of a revolution in Norwegian archaeology. It has brought to light countless sites that would otherwise have gone unnoticed and in this respect, it has transformed our understanding of past settlement patterns, burial customs, industry and land use [
5,
6].
Despite its benefits, however, this approach is also fraught with problems. These are seldom addressed, and its shortcomings are simply accepted as inherent in the method. There is, for instance, no doubt that the removal of topsoil during trial trenching affects the preservation of the underlying archaeological features, particularly if the trenches are left open for some time before being backfilled. It has the effect of destabilising the local soil conditions by altering established water and drainage levels which, in turn, leads to aeration of the soils, oxidisation and the breakdown of organic components within the archaeological features [
7]. This is of particular concern if the planning process is halted or changed, and the area reverted to cultivation whilst leaving the archaeological features unexcavated. Furthermore, trial trenching only provides a keyhole view to the subsurface archaeology, and an accurate assessment of the character and extent of a site is therefore difficult [
8]. Based on approximation, this often leads to inaccuracies in budgets and time estimates, which invariably affect subsequent excavation strategies and the progress of planned developments (
Figure 2).
In the past two decades, motorised geophysical survey arrays designed specifically for archaeological purposes have been developed. This has enabled a shift from small, site-specific surveys to surveys quickly covering large landscape swaths, and as such offer the potential to alleviate some, if not all, of the shortcomings of the conventional methods [
9]. The development and application of motorized large-scale ground-penetrating radar and magnetometer surveys have within the last couple of decades shown the potential and ability of such non-intrusive methods to investigate, characterize and understand not only archaeological sites and features but also entire archaeological landscapes [
10,
11,
12,
13,
14,
15]. In Norway, large-scale prospection methods have been implemented by a minority of the county council archaeologists, mainly in connection with major infrastructure developments such as road and rail schemes. These schemes may cover several square kilometres of arable land and will therefore inevitably conflict with archaeological interests. Here, conventional methods such as systematic trial trenching have been deemed impractical and costly, and non-intrusive methods can, at least in theory, lessen the impact on budgets whilst simultaneously providing enough information for the planning process to proceed. Despite these advances, the implementation of geophysical methods to Norwegian archaeology has been slow, although a growing acceptance in the archaeological community has been noted. This is particularly evident in the heritage management sector, where time-constraints and cost-factors are often at play [
16,
17]. However, there is still uncertainty as to how suitable these methods are compared to conventional methods presently in use, such as trial-trenching. Critical voices both nationally and internationally dismiss the applicability of geophysical methods, claiming they are not fully developed, and that factors such as detection rates and the type of archaeology detected are unknown. Conversely, their proponents tend to focus on the methods’ potential while often downplaying their weaknesses. This rather unfruitful discussion is unfortunate, particularly as neither stand is supported by quantifiable data.
A growing concern in the wider archaeological community is that the geophysical methods are used indiscriminately, and questions have been raised as to whether they are suitable tools for the planning of further archaeological investigations. This is naturally problematic, as the bodies charged with upholding Norway’s cultural heritage act (i.e., the regional museums, the county councils and the Directorate for Cultural Heritage) are increasingly forced to consider whether the results from the geophysical surveys can be used as a basis for decision making.
Ground-based observation to compare the geophysical response of archaeological structures provides direct feedback and increases the confidence in future interpretations of similar data and gives additional information on how best to integrate such datasets in future archaeological work. A typical assessment of ground-based observations focuses on defining the source of individual anomalies and characterising their geophysical response [
18]. Some work has been done elsewhere in Europe to compare large-scale geophysical datasets and legacy data to excavation results, but much of this work has focused on magnetometer-data and resistivity surveying by electromagnetic induction [
11,
19], or compared excavation results with close-interval shovel test pits [
20]. Verhagen and Borsboom [
21] published an evaluation of test trenching strategies but nothing similar has ever been done in Scandinavian archaeology. Although there is no question as to the effectiveness of motorised prospection, studies concerning success rate, in terms of detection capability, precision and cost-efficiency of large-scale high-resolution ground-penetrating radar (GPR) surveys are, then, all but non-existent. To the best of our knowledge, this is the first time a direct comparison of the results from large-scale GPR surveys have been compared with both large-scale soil stripping excavation and test-trenching.
To investigate issues relating to applicability and performance of large-scale GPR surveys and test trenching, and to provide a quantitative framework, the project “Delineating Archaeological Sites in Arable Land” was established in early 2017, supported through funding from the Norwegian Directorate for Cultural Heritage [
22]. Headed by researchers from NTNU and NIKU, the project was undertaken in close cooperation with county archaeologists and the respective regional museums. The project aimed at gathering and analysing geophysical data to quantify and evaluate the applicability of one specific geophysical method in relation to archaeological sites in arable land and compare this to the applicability of standard trial trenching evaluation schemes. The aims of the project were manifold, but can be summed up thus:
To collect geophysical data from two separate archaeological sites, known from previous trial trenching but before full-scale excavations;
To compare the geophysical results with results from the trial trenching and the excavations, and to extract descriptive and spatial statistics on detection rates and precision for both evaluation methods.
While focusing on the results from two test sites comprised mainly of typical Norwegian iron-age settlement, the results are relevant to a wider, international audience. Norwegian archaeology is characterised by small or shallow features or features otherwise ill-defined in geophysical datasets due to their composition. This is an advantage as these features, under other circumstances, may be overlooked in the presence of solid and more easily recognisable archaeology such as that encountered elsewhere.
The analytical results from the project and its implication is the main focus of this paper, as well as highlighting the methods used in collecting, processing and interpreting the data. The aim of the paper is thus to present the main results of this project, and to discuss their relevance to current heritage management practices in Norway, with a view of assessing the advantages and disadvantages of both conventional, intrusive methods and large-scale geophysical methods.
2. Materials and Methods
To collect suitable data for analysis, GPR surveys were carried out on two sites with similar characteristics in terms of size and archaeology, but in different geographical and landscape settings. The sites chosen are located in the counties of Trøndelag and Østfold, in the central and south-eastern parts of Norway, respectively (
Figure 3). At both sites, previous trial trenching had revealed settlement traces from the Nordic Iron Age (500 BC–1030 AD), and both geophysical surveys were undertaken immediately preceding full-scale excavations.
Data were collected using two different GPR systems capable of large-scale, high-resolution surveys (
Table 1 and
Figure 4). The choice of GPR over other geophysical methods was based on previous experience and experimentation with a variety of geophysical methods. Previous work has demonstrated that GPR, more than any other current method, has consistently produced the data needed to detect the small and often subtle features so typical of Norwegian archaeology. Because of this, it has become the most used method for large-scale geophysical surveys, whilst magnetic methods are considered useful as a complementary tool for enhancing the interpretation of features already mapped by way of GPR.
2.1. Case Study Area 1—Øya
Øya is located in the Gauldal valley in Melhus Municipality in Trøndelag County, some 23 km south of Trondheim city centre. It sits on a river terrace on the eastern banks of the river Gaula, in a valley base dominated by marine and river deposits [
23]. These deposits vary considerably in texture, from silty sands and silts to light and medium clays, some deposited due to several land-slide events in the past. Within the site boundaries, the soils are classified as Albeluvisols to the east through Cambisols and Fluvisols in the central part, to Stagnosols in its western parts [
24].
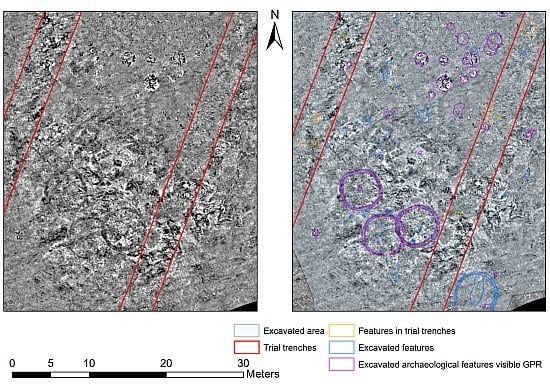
The archaeological site was discovered in 2014/2015 through trial trenching in connection with a major road improvement scheme through the valley. The trenches, which were placed according to the local terrain, revealed a settlement area consisting of cooking-pits, postholes and buried cultivation layers. Eighty-two features were found, primarily dated to the Nordic Iron Age [
25]. Based on the results from these initial investigations, the county archaeologists estimated that the total extent of the settlement area amounted to 3.47 hectares (ha) (see
Section 3.1 and
Figure 5).
GPR surveys of the site were undertaken between the 23 and 24 May 2017, following a period of some precipitation. Data from six national weather stations located within 25 km of the site indicate that a total of 22 mm of rain fell in the area over the seven days preceding the survey. The northern part of the survey area was used for growing grass for animal fodder, which was low and relatively dry at the time of the survey. The southern part of the survey area had been ploughed, and the farmer harrowed it before our survey, but both parts had even ground and were easy to survey.
Subsequent excavations by topsoil stripping were undertaken in 2017 by the regional museum, immediately following the geophysical surveys. The total area excavated covered 2.15 ha, its extent guided in part by the location of features detected by way of trial trenching, but also by the results from the GPR survey. The subsequent excavations uncovered numerous additional cooking-pits to those found during trial trenching, as well as several pits and other, sundry features. Additional postholes were also found, belonging to at least one longhouse and four smaller buildings. Three circular ditches detected by way of GPR were excavated. These are thought to stem from either ploughed-out burial mounds or, most probably, structures for drying hay [
26]. The ditches and the longhouse fell between the trenches excavated by the county archaeologists and were therefore not known before the GPR survey (
Figure 5 and
Figure 6). The excavations also revealed that the eastern part of the site consisted of clay-rich, heterogeneous layers from a mudslide before the settlement, while another landslide must have affected the Iron Age settlement in the northern part of the site.
2.2. Case Study Area 2—Dilling
Dilling is located in Rygge Municipality in Østfold County, approximately 55 km south of the capital Oslo, and 2.5 km east of the eastern shores of the Oslo Fjord. It lies in a fertile landscape rich in archaeological remains and is surrounded by scheduled monuments and archaeological sites from all periods. In geological terms, the area is dominated by marine and beach deposits. These are capped by the Østfold Ra Moraine which runs from the city of Moss to the Swedish border in the south-east [
23]. Located immediately to the south of this moraine, the site at Dilling lies within a south-facing, gently sloping, and annually cultivated field. Detailed mapping reveals that the present soils vary from Haplic Gleysol in the western part, through Endogleyic Arenosol in the central part and Luvic Stagnosol (Ruptic) in the east [
24].
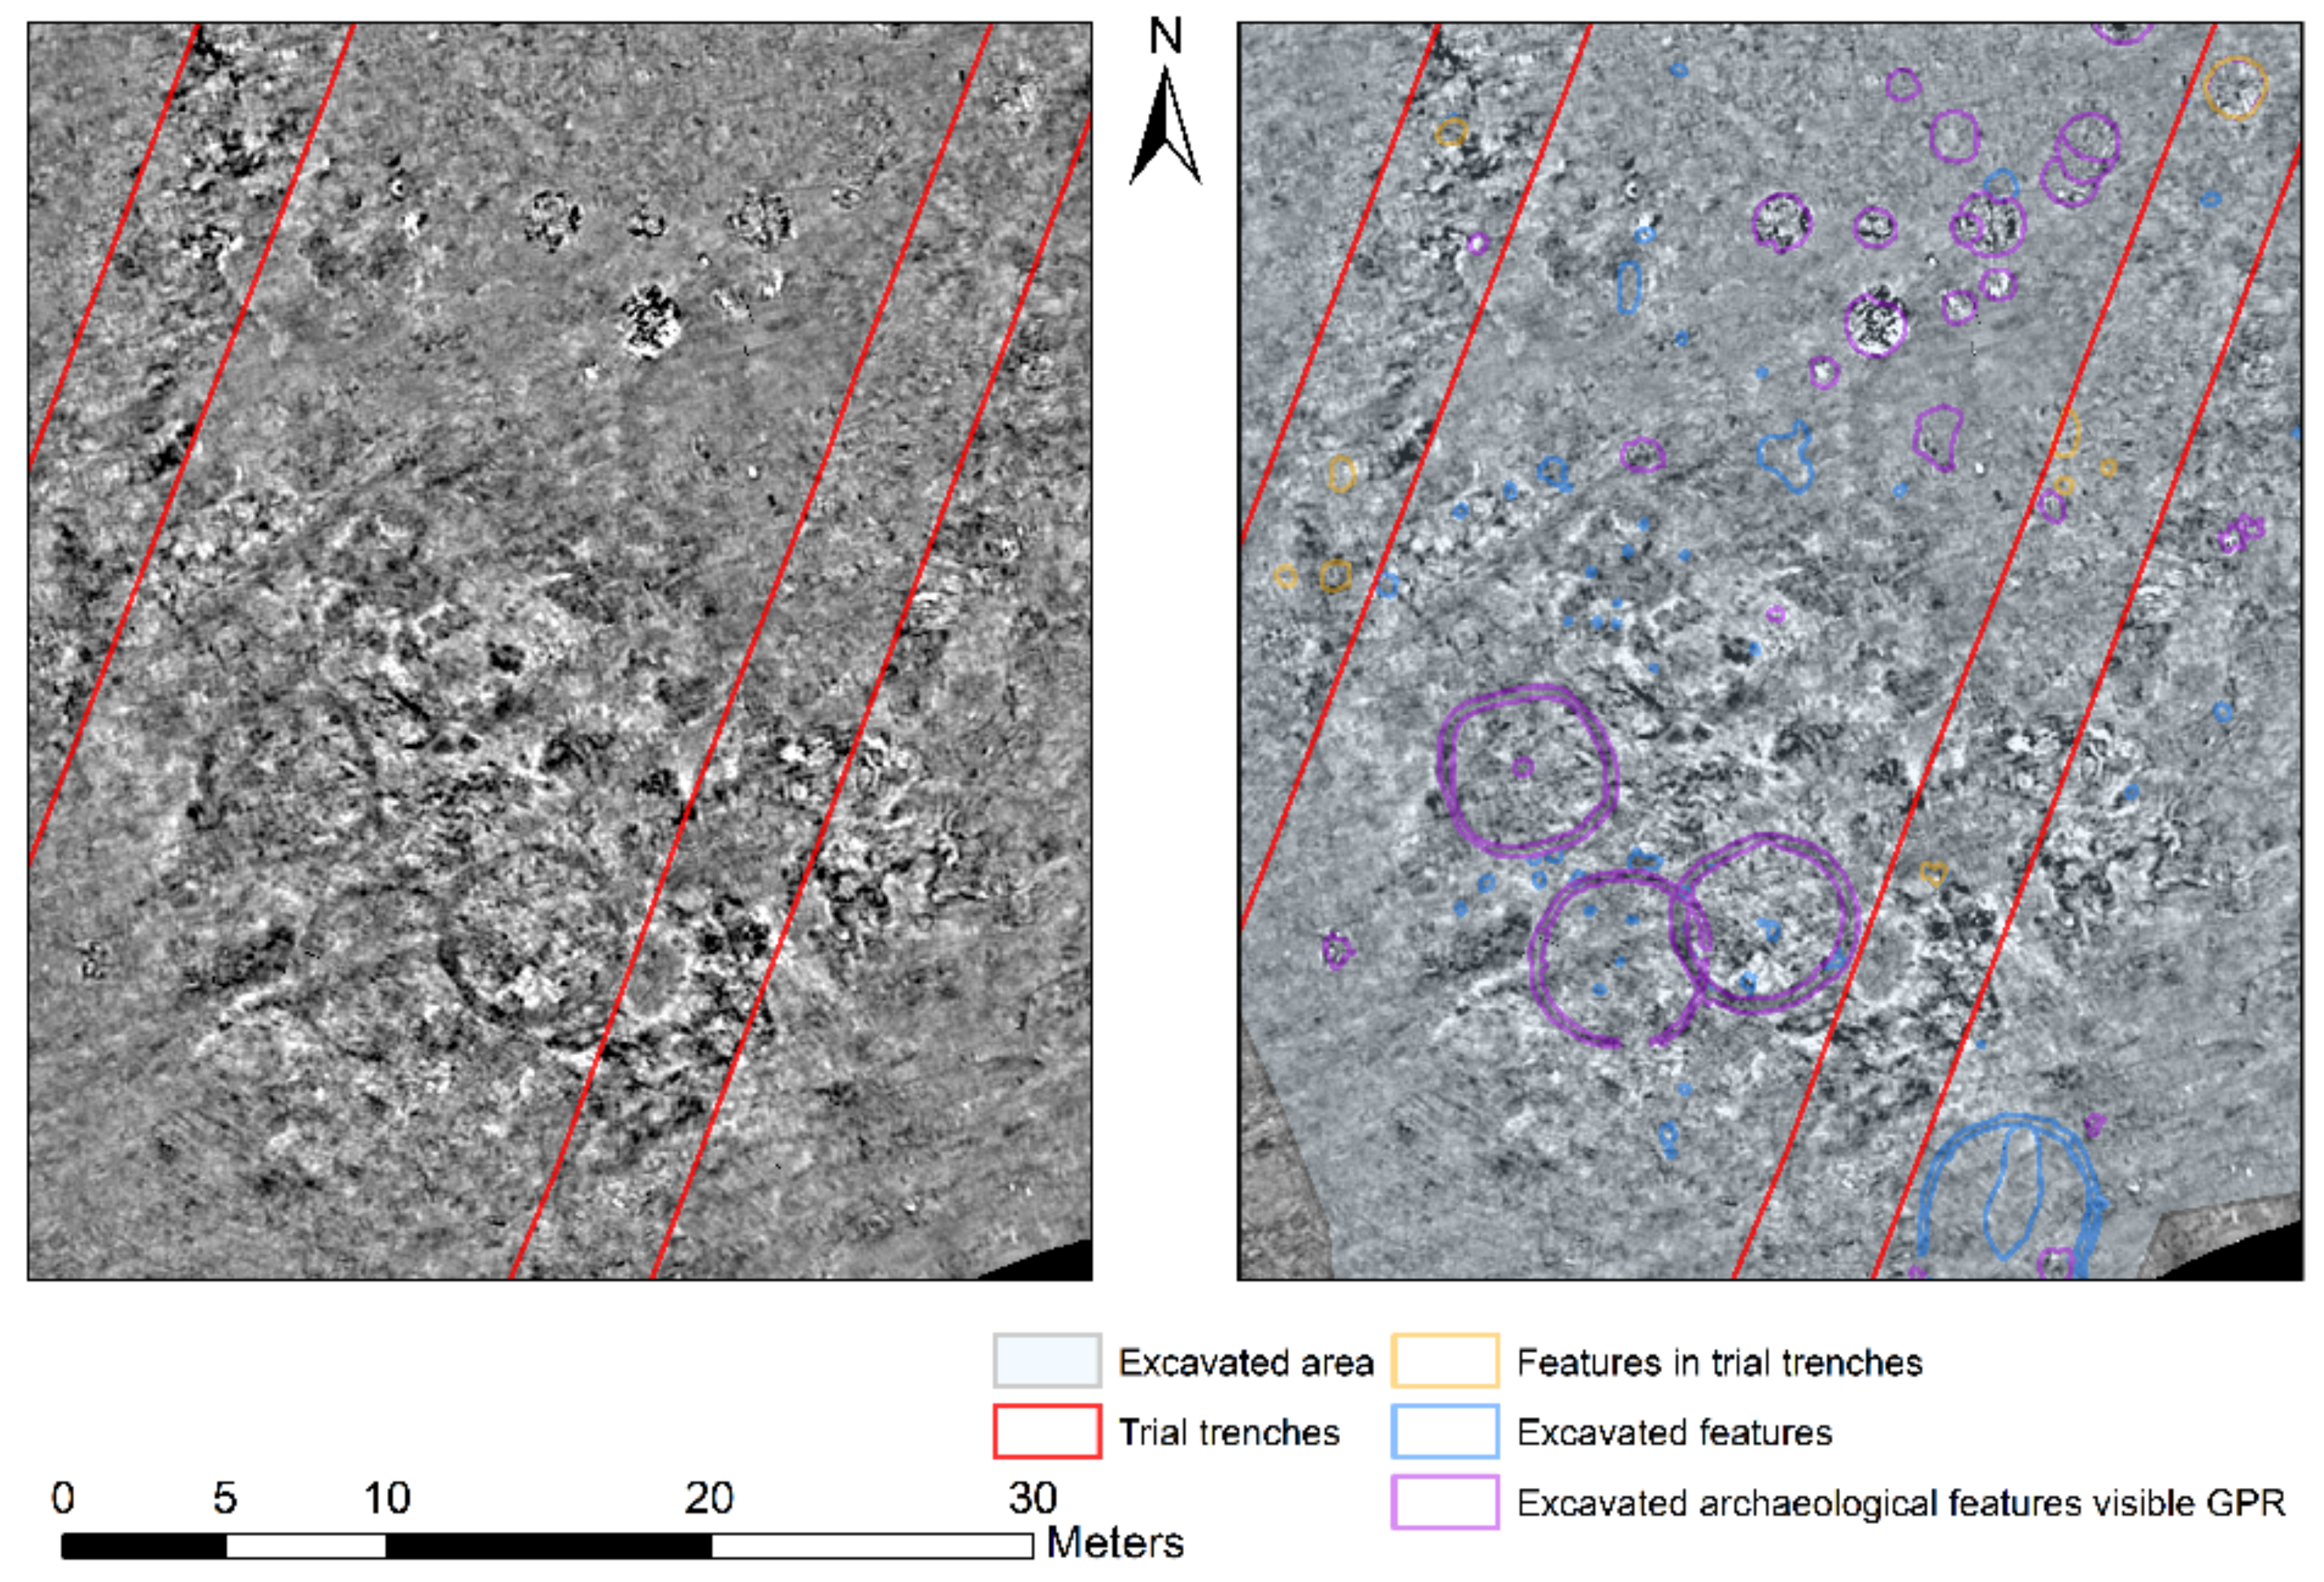
The archaeological site was discovered through trial trenching in December 2015, in connection with a planning application for a planned InterCity line through the municipality [
27]. Evaluation trenches closely following the boundary of the planning application was established systematically over the field and revealed nearly 280 archaeological features including postholes, cooking-pits, hearths, gullies and trenches as well as pits with no identified function (see
Section 3.2 and
Figure 7).
GPR surveys were then carried out in early May 2017, following an unseasonal dry spell. According to precipitation data collected from four national weather stations located within a 20 km radius of the site, a total of 2.5 mm of rain fell in the area in the seven days preceding the survey. At the time of the GPR survey, semi-sprouted wheat sown the previous autumn covered the field, creating an overall smooth surface. The combination of relatively dry weather, well-draining soils and the fact that the fields had lain undisturbed by agricultural activity over the previous six months created optimal survey conditions, both in practical and geophysical terms.
Full-scale excavations of the site took place immediately following our GPR surveys. These investigations revealed an extensive settlement site from the Nordic Bronze Age and Early Nordic Iron Age. Spread over four activity zones, the remnants of at least 46 post-built structures were identified, as were settlement traces such as those found during the evaluation stage. Furthermore, the investigations uncovered a small cemetery consisting of 18 cremation pits [
28].
2.3. Analyses
Following data collection, the datasets were processed according to standard routines, in software specific to each GPR system. Because of the different systems, soil conditions and expected archaeology, the processing parameters differed somewhat, but essentially generated comparable datasets. For data collected with the MALÅ MIRA system at Dilling, the processing steps used included trace interpolation, time-zero corrections, band-pass frequency filtering, spike removal, de-wow filters, average-trace-removal, amplitude-gain corrections, amplitude balancing, 2D migration and Hilbert transformation. The raw data was processed through some 50 iterations with varying parameters to find the optimal settings for this specific site, before sets of georeferenced amplitude slices 5–50 cm thick were generated. The 3D-radar Examiner software for processing 3D radar data collected at Øya included time-zero correction, interference suppression, Inverse Selective Discrete Fourier Transform (ISDFT) filtering of step-frequency data, autoscale, high-pass background removal and migration. The Examiner software also allows for toggling easily between magnitude (equal to Hilbert transform) and real-value viewing, and between viewing migrated and un-migrated data, as well as having the possibility of selecting any point in plan for immediate profile visualisation. Both software solutions produce three-dimensional data volumes and raster images for further analysis, and interpretation of the datasets was undertaken within the framework of a geographical information system (GIS) based on both plan and profile data analysis. Here, anomalies deemed to have an archaeological origin were outlined using either polygons or polylines in a geodatabase and given a subjective interpretation. Metadata and information on their properties, such as depth range, geophysical response and interpretation were also added to the attribute tables. It should be noted that the interpretation process was carried out unaided by information from the trial trenching and the topsoil stripping. This served not only to assess the potential detection rates for GPR but also our interpretation capabilities had this information not been available, thereby simulating a likely scenario encountered using geophysical methods as part of the evaluation process.
Once the interpretation of the GPR datasets was concluded, GIS data from the trial trenching and full-scale excavations were provided by the county archaeologists and the regional museums respectively. To compare the various datasets and to extract statistical information on detection rates, a point was generated for each polygon in the GIS data from the full-scale excavations, thus forming a template for comparison with the other two methods. The first stage of this comparison was relatively straightforward. Each point representing an excavated feature was compared to the results from the trial trenching and the interpretations of the GPR data. Information on whether the feature had been detected during trenching and/or through interpretation in the GPR data was then entered into its attribute table, and so provided a direct and comparable result between the three methods. The second stage was more complex and time-consuming. Here, each point from the excavation data was analysed based on the depth slices themselves to assess the overall, potential detection rate of the method. In other words: was it possible to see anomalies in the GPR datasets where the excavations had uncovered archaeological features?
As a final exercise, kernel density raster maps were produced to evaluate the correlation between the distribution of features detected by all three methods. A single map was generated for the results from each method, and a 2 × 2 m grid was then established across the site extent to extract the spatial kernel density values from each raster. These values were subsequently imported to a spreadsheet where analyses were performed to find the Pearson correlation coefficient for each grid value [
29].
4. Discussion
Based on the results from this study it is possible to draw some preliminary conclusions on the possibilities and limitations of intrusive and non-intrusive methods of archaeological evaluation in cultivable land.
The ubiquitous acceptance of trial trenching as a method for evaluation is probably linked to the fact that it is a relatively simple method, requiring little in terms of technological know-how and training, and that it is possible for the county archaeologists to perform themselves. Furthermore, it produces tangible and relatively easily interpreted evidence of the subsurface archaeology and has the advantage of easy access to samples for radiocarbon dating. The inclusion of more specialised services by archaeological-geophysical experts requires involving other institutions, additional costs, and a thorough understanding of the possibilities and limitations of any additional methods to be involved. However, as this study has demonstrated, trial trenching is far from a flawless method. It is based on sampling, and you do not get concrete information on the areas between the sampled trial trenches and must rely on the results being representable for the additional areas. At Øya an area of 19% of the total area of the site was trial trenched, and at Dilling this number was 23%. This is higher than the recommendation of trial trenching up to 10% of the area to be investigated [
24]. Still, there was a relatively pronounced underestimation of the total amount of features to be expected within the site (see
Figure 2). At these two sites, trial trenching identified 30%–40% of the archaeological features later identified upon excavation within the areas covered by trial trenching, and whilst this is somewhat higher than the GPR detection rates for the entire site at Dilling, it is comparable to the GPR detection rates at Øya. The fact that excavations reveal additional archaeological features during a complete excavation is most probably due to better control over the depth of the agricultural soil to be removed and that the archaeologists had more time to clean and investigate observations and relationships between exposed features. Therefore, a higher total number of features within areas previously trial trenched is to be expected when a full excavation is performed. Furthermore, the analyses of the spatial correlation between the different methods indicate that GPR is equally, or in the case of Øya, better at delineating the archaeological sites than trial trenching (see
Table 4).
At both sites, the GPR detection rate, feature-by-feature, is low (
Table 5). At Øya, 22.6% of the archaeological features were detected by GPR, whereas 17.5% of all the features were detected at Dilling. In comparison, trial trenching had a detection rate of 28.2% at Øya and 39.3% at Dilling. The low detection rates observed are closely connected with the characteristics of the sites, their geological and geomorphological settings, as well as the types and condition of the archaeological features encountered (see
Figure 9). The spatial accuracy of the trial trenching was low at Øya and high at Dilling. A possible explanation for the low spatial correlation at Øya could be the difficult weather and soil conditions, as the trial trenching was performed late in the year with low light, heavy rain and with more complicated stratigraphic conditions involving cultivation layers and landslides overlaying the archaeological features.
In regard to the possible influence on detectability on GPR-results when an area has previously been trial trenched, the results from these two case studies give some new information. At Øya the percentage of detectable features by GPR was 12% within the area previously trial trenched, while the overall detectability was 23%. At Dilling this percentage was 18% within the trial trenched areas, which is similar to the overall detectability. The results from Dilling indicate that previous trenching did not influence the detectability with GPR, while it a negative influence on the detectability at Øya. Mechanical wear, weathering, variation in subsoil and potential changes in conductivity caused by the removal of the topsoil can be possible explanations for the lower detectability rate with GPR over previously trial trenched areas.
The subsoil at Øya comprised fluvial and marine deposits in the form of silty clays and sands which in parts were overlain by a clayey, mixed deposit from a landslide. The variations in the subsoil are echoed in the resulting GPR amplitude maps, where the reflection properties of the subsoil vary considerably across the site. The local variation could potentially obscure the archaeological features but gives additional knowledge on the palaeolandscape by revealing past paleochannels and variations in the subsoil. Thus, it provides context and information on the relationship between the location of the archaeological features and their natural surroundings. Conversely, at Dilling, the marine sourced subsoils were more homogenous throughout the site, consisting largely of silty sand, but also containing large quantities of erratic boulders. This resulted in fewer fluctuations in reflection properties across the datasets, although the presence of the large boulders increased the potential for erroneously identifying natural phenomena as archaeology. These unfavourable soil conditions might also have affected the detection of lesser features during trial trenching of the sites and would have been compounded by adverse light conditions and the limited extent of the trenches. At this stage of the evaluations, the archaeologists were afforded limited time to identify features such as postholes, which require careful cleaning and proper contextualisation through topsoil stripping of larger areas to be successful.
The low detection rates observed in this study can also be attributed to the physical nature of the archaeological features themselves. Features encountered in the Norwegian archaeological record in cultivated land often take the form of insubstantial or heavily decimated features with backfills that may be visually different from the surrounding soil matrix, but whose texture and composition will not generate the required geophysical contrast to enable their detection by geophysical techniques. This is particularly evident for postholes. Postholes encountered on excavations in Norway normally comprise small features with homogenous backfills, often without further internal elements such as stone packings. As such, they are generally considered difficult to detect by any means of geophysical prospection. At Dilling, the majority (76%) of the features identified during excavation consisted of postholes, a fact that has affected the overall detection rates for both GPR and trial trenching. Here, only 10% of all the postholes could be detected in the GPR data, whilst 39% could be detected through trenching, closely reflecting the detection rate for all features through both methods (see
Figure 12). This highlights the obvious advantage of trial trenching, in that the visual appearance of archaeological features is almost always more pronounced than their geophysical characteristics. However, this is not to say that it is impossible to detect postholes by way of geophysical methods. Indeed, at Øya, the detection rate for postholes was 26% for both trial trenching and GPR (see
Figure 10). Also, at Øya, a post-built longhouse was detected within a limited area where the subsoil was geophysically uniform, creating advantageous conditions for its detection. Different practices between the two excavations in how the features category “undefined” was used, does in practice mean that a direct statistical comparison of the detection rate of postholes between the two sites should be done with caution. Other examples from Norway under different conditions also show how post-built structures can be successfully detected, characterised and studied using GPR [
31,
32,
33].
In contrast to the postholes, features such as cooking-pits, hearths and furnaces have a far higher detection rate, at both sites and for both evaluation methods. Such features comprise backfills that are charcoal-rich and often densely packed with fire-cracked rocks. This combination of components generates high-reflection responses in the GPR datasets, and the features tend to be easily identifiable, regardless of the subsoil [
34]. This is reflected in our analyses which indicate a detection rate around 70% of the total number of features identified during excavation, close to and sometimes exceeding the detection rates of these features through trial trenching.
The fact that features with a high concentration of charcoal are readily detected in the GPR data is interesting and extends to other features not usually associated with heat. At Dilling, for instance, we noted that ditches and gullies surrounding the post-built houses could only be partially detected and, in some cases, only parts of the ditches were detectable in the GPR data. Upon visual ground testing, it became apparent that this phenomenon was related to the presence and absence of burnt matter such as charcoal and burnt daub. Although the exact mechanics behind the increased detectability of features with charcoal-rich backfills is not understood, we may hypothesise that charcoal increases the moisture content of the backfills relative to the background material, thus creating high amplitude reflections that contrast sharply against the surrounding soil matrix.
The quality of the interpretations of the excavated features will naturally vary with the excavators’ proficiency and experience, and with the overall sampling strategy employed. A strict sampling strategy, for instance, will result in increased interpretative accuracy, although fewer features will be identified as archaeological. Conversely, a more liberal strategy will result in a greater number of features being identified but also lead to a greater number of features with an insecure interpretation. In this context, Dilling can serve as a good example of a project where a liberal approach has been taken. Here, near 6000 features were initially identified as archaeological upon topsoil stripping. Upon further investigation, near 2400 were written off, and of the remaining features, 2531 were identified as postholes. However, only a smaller number of postholes can be associated with house structures, leaving the remainders with no apparent connection to overarching structures. At Øya, a different liberal strategy was used, by surveying in features as possible archaeology, but not defining them as possible pits, postholes or another category (see
Figure 9). The question, then, is whether these “residual” postholes or “undefined” features represent archaeological features. This is not to deny the fact that postholes represent a feature type that does not readily lend itself to detection by GPR. Nor is it to deny the fact that we, in the case of Dilling, are unable to identify the postholes that do belong to houses. However, the presence in the interpretation database of singular features with an unclear archaeological interpretation will naturally affect our statistical analyses, skewing the GPR detection rates negatively. This is not to say that a liberal approach is inappropriate. Indeed, it can be argued that it is the better of the two approaches, as it allows for a greater range of interpretations in the post-excavation stage.
The inclusion of additional field methods during archaeological evaluations would lead to higher total costs in an early stage of the site evaluation, and as most evaluation schemes performed in Norway have a relatively limited size and budgets, it could be argued that it is unreasonable to include geophysical methods as a standard strategy. At the same time, this way of thinking could be argued to ignore the cultural-historical value of an archaeological site at the expense of budget size [
16]. A French study compared the use of magnetometer surveys and earth resistance surveys for large scale archaeological evaluations and compared the results to the results from trial trenching. They concluded that the use of these was of limited interest for archaeological feature detection in preventive archaeology on the types of soils met in northern France, and especially luvisols. They do notice that there is a huge potential in EMI and GPR-surveys. Also, it is argued that their use, without any clearly defined aims other than to “see if there is something there” without asking any specific archaeological questions, is of limited value. Still, they consider geophysical methods as something that can play an important role as a complementary tool if used by a well-reasoned approach [
11]. For Norwegian conditions, it has been argued that integrating geophysical methods as part of site evaluations of areas larger than one hectare can be financially viable to reduce the number of trial trenches and gain a better evaluation of the area by utilizing a more targeted strategy [
35].
Whilst the analyses show that there is a relatively low correlation between what has been detected in the GPR datasets and what has been observed upon topsoil stripping, the relative spatial correlation analysis revealed that the trial trenching results had somewhat better spatial correlation at Dilling than the GPR results, although nearly comparable. At Øya, the results were opposite, where the GPR results had a far better spatial correlation to the excavation results than the trial trenching. This demonstrates that whilst it is unrealistic to expect a full match between the GPR data and the excavation results, the geophysical surveys have the potential to serve as a better alternative to trial trenching. This would be particularly evident in larger evaluation schemes, where geophysical surveys are used to cover large landscape swaths. Here, the relative density of detected and interpreted anomalies could serve as a proxy for the presence of archaeological features and sites, and the geophysical surveys could act as a tool for an initial characterisation of areas of lower or higher archaeological potential. As GPR has a high detection rate for features including burnt material, i.e., cooking pits, the method is particularly suited for sites and periods where these are well represented. GPR, therefore, can be an asset to the non-destructive preservation of archaeological sites and monuments and serve as a useful supplement to traditional site evaluation methods.
5. Conclusions
The introduction of geophysical methods and technology to Norwegian archaeology has been slow, and their use has only been considered a viable supplement to conventional evaluation trenching in the last decade. This has been achieved chiefly through the development of multi-channel, high-resolution sensor arrays, as well as national and international collaborative efforts paired with targeted investments in technology and expertise.
The viability of the methods has been demonstrated through several research projects, which in turn has led to a considerable increase in the numbers of research and heritage management projects involving geophysical methods [
17]. Despite good results and renewed interest, critical voices argue that the methods cannot be trusted as they do not find everything, and cannot be seen as a replacement to traditional methods used for site evaluation [
16]. As the results presented here, a counterargument can be made that neither does trial trenching. It is, however, important to bear in mind that geophysical prospection has never been intended as a direct replacement for conventional methods, but rather as a supplement. Also, the results presented in this project show that although GPR, in the case studies of Dilling and Øya, identified a smaller percentage of archaeological features than test trenching, still had a comparable spatial correlation. This, can in turn, be used as an argument in advance of integrating full-coverage GPR-results into a site evaluation scheme, preferably in combination with other methods. Trial trenching before GPR-surveying influenced detectability in a negative manner at Øya, while at Dilling the detectability rates were the same.
Generally, archaeological features containing burnt materials, fire-cracked rocks or stones, in general, were detected with a high percentage for both trial trenching and by GPR at both the case study sites. The detection rate of hearths, furnaces, cooking pits and stone packings were comparable at both sites, and for both trial trenching and GPR. When it comes to the most abundant archaeological feature, postholes, trial trenching were more successful than GPR at Dilling, and the percentage was the same at Øya. There was also a difference in the amount of interpreted versus detected features by GPR, indicating that there is a room for improvement in the archaeological interpretation of GPR data. Although there was a relatively low detection rate on a feature-to-feature basis in total, the calculation of the spatial correlation of the density of features gave some interesting observations. While the trial trenching at Dilling had the highest correlation of the two methods, it was also high both for the interpreted and the detected features in the GPR data. For Øya, it was low for the trial trenching results, medium for the interpreted anomalies and high for the detected features. These differences can be attributed to differences in subsoil conditions, post-depositional processes such as landslides and landscape changes, as well as differences in documentation strategies. Also, it is important to treat these results as what they are, the results of two case studies. Care must be taken to avoid over-generalization of the methods’ capabilities without considering the archaeological and palaeoenvironmental contexts.
An archaeological site evaluation aims to answer whether there is a conflict between the planned development and any archaeological features. Also, it should be detailed enough to allow for planning and budgeting excavations based on its results. The question then arises if the results derived from these two methods, trial trenching and GPR, are sufficient. It is hard to provide a definite answer but the project has demonstrated drawbacks and possibilities with both methods that are important contributions in understanding how to use them and integrate them in future site evaluations.

 ,
, 


