Case Report

The Convective Rainfall Rate from Cloud Physical Properties Algorithm for Meteosat Second-Generation Satellites: Microphysical Basis and Intercomparisons using an Object-Based Method

by
Francisco J. Tapiador
1,*,
Cecilia Marcos
2 and
Juan Manuel Sancho
2
1
Earth and Space Science Research Group, Department of Environmental Sciences, Faculty of Environmental Sciences and Biochemistry, Institute of Environmental Sciences (ICAM), University of Castilla-La Mancha (UCLM), Avda. Carlos III s/n, 45071 Toledo, Spain
2
Agencia Estatal de Meteorología (AEMET), Headquarters. C/ Leonardo Prieto, 28071 Madrid, Spain
*
Author to whom correspondence should be addressed.
Remote Sens. 2019, 11(5), 527; https://doi.org/10.3390/rs11050527
Submission received: 5 January 2019 / Revised: 12 February 2019 / Accepted: 27 February 2019 / Published: 5 March 2019
(This article belongs to the Section Atmospheric Remote Sensing)

Abstract

:
The convective rainfall rate from cloud physical properties (CRPh) algorithm for Meteosat second-generation satellites is a day-only precipitation algorithm developed at the Spanish Meteorological Agency (AEMET) for EUMETSAT’ Satellite Application Facility in support of nowcasting and very short-range forecasting (NWC SAF). It is therefore mainly intended to provide input for monitoring and near-real-time forecasts for a few hours. This letter critically discusses the theoretical basis of the algorithm with special emphasis on the empirical values and assumptions in the microphysics of precipitation, and compares the qualitative performances of the CRPh with its antecessor, the convective rainfall rate algorithm (CRR), using an object-based method applied to a case-study. The analyses show that AEMET’s CRPh is physically consistent and outperforms the CRR. The applicability of the algorithm for nowcasting and the challenges of improving the product to an all-day algorithm are also presented.

Graphical Abstract

1. Introduction

Nowcasting is very important for practical meteorological applications such as flash flood alerting [1], human health advice [2], aviation safety [3], renewable energy operations [4] and infrastructure management [5]. Therefore, the European Organization for the Exploitation of Meteorological Satellites (EUMETSAT) supports one Satellite Application Facility (SAF) on nowcasting (NWC). Its aims are providing an advanced, robust and reliable software system to support both operational and research activities in nowcasting and very short-range forecasting, as well as providing support services to final users. The NWC SAF is being developed by a consortium of National Meteorological Services composed by the Spanish Agencia Estatal de Meteorología (AEMET), Météo France, the Swedish Meteorological and Hydrological Institute (SMHI), the Central Institution for Meteorology and Geodynamics of Austria (ZAMG), and Meteo Romania.
The Spanish Meteorological Agency (AEMET) has developed an algorithm which is intended to improve the nowcasting of precipitation in convective events—the convective rainfall rate from cloud physical properties (CRPh) algorithm. The CRPh is integrated in the NWC SAF software application.
The CRPh algorithm relies heavily on the microphysical properties of the clouds. The rationale is that information about cloud-top microphysics provides critical additional information to discriminate rainfall location and intensities for convective clouds, which are the major intended outputs. While the cloud-top temperature is a primary proxy of rain rates because the coldest tops indicate large vertical development and hence deep convection and precipitation, the inclusion of microphysics helps to resolve the ambiguities in the retrieval and to locate the rainy area on the ground more precisely. Indeed, the position of the coldest section of the cloud aloft is only indirectly related to the maximum precipitation at the surface.
This paper evaluates the assumptions and the theoretical basis of the algorithm with special emphasis on the empirical values and assumptions in the microphysics of precipitation, and compares the performances of the CRPh with its antecessor, the convective rainfall rate algorithm (CRR), using an object-based method. Such a verification procedure is standard for the nowcasting of precipitation due to the large spatial and temporal variability of precipitation [6]. The comparison of the selected cases is not intended to be exhaustive but rather to illustrate, with some key examples, the evolution of the new product from the original CRR, which was also developed by AEMET. One case in which the CRPh fails is also discussed.

2. Data

The empirical bases of this study are the satellite data and numerical model information used to derive the CRPh, and ground radar reflectivities from the Spanish radar network.

2.1. Satellite Data

The CRPh uses a 10.8 µm brightness temperature at full spatial resolution from the Spinning Enhanced Visible and Infrared Imager (SEVIRI) instrument onboard Meteosat second-generation (MSG) satellites. The full spatial resolution is a required input to compute a parallax correction, whereas the choice of the wavelength aims to compute the height of the cloud systems more precisely.
In addition to that primary input, the CRPh employs three cloud-top microphysical properties (CTMP) derived from MSG sensors: cloud phase (CP), cloud optical thickness (COT) and effective radius (Reff) [7]. These are derived from both the SEVIRI visible VIS0.6 (0.56–0.71 μm) and the near-infrared NIR1.6 (1.50–1.78 μm) bands; therefore, they are affected by solar radiances and albedo. The NIR 1.6 band is sensitive to the phase of the cloud top (liquid water reflects the radiation at that wavelength more effectively than ice crystals) and also allows for snow discrimination. Reff is also useful to discriminate low stratus and fog [8].

2.2. Numerical Model Inputs

The CRPh also uses outputs from a numerical weather prediction model (NWP). The ECMWF’s model at an equivalent 0.5° × 0.5° grid space every 6 h is used to derive temperature fields at 1000, 925, 850, 700, 500, 400, 300, 250 and 200 hPa and the geopotential height at 1000, 925, 850, 700, 500, 400, 300, 250 and 200 hPa. These are used to estimate the cloud height, which is a value necessary for the off-nadir parallax correction. The method uses the IR10.8 temperature. A linear interpolation between the temperatures and geopotential in the numerical model gives the cloud height for each pixel in the IR10.8 field. In the absence of NWP data, cloud height is calculated through bi-lineal interpolation between the brightness temperature and the nearest four climatological temperature and geopotential locations [9].
Ancillary data sets in the form of climatological profiles are also necessary as a backup for parallax correction in case NWP is not available, as it should not be forgotten that CRPh is not a research work but an operational product that requires full availability (cf. [2] for an example in the case of temperature). The effect of the parallax correction is not negligible.
No precipitation or humidity model estimates are used for the algorithm, so the CRPh is independent from the model microphysics and from any model-diagnosed or prognosed water quantity.

2.3. Radar Data

Satellite precipitation estimates such as those from satellites are routinely compared with radar data [10]. The radar data used for validation in this work consist of the calibrated and filtered reflectivities from the Spanish Radar Network. The data are independent from the CRPh product and are collected on a routine basis by AEMET. The actual product used for this paper is the National 1-km composite calculated through the optimum composite criterion method [11]. This product is considered more suitable than the rain gauge network for rainfall estimation given the lower spatial resolution of the gauges, especially in the mountain areas. It contains the data of the 13 C-band radars from the Spanish radar network and has a temporal sampling of 10 min. Radar reflectivities are transformed into rain rates using a standard Z = 200 R1.6 relationship. The nature of the radars and the use of a fixed Z-R relationship introduce known limitations in the product, but the radar composite is the only reference data point available for the area that can be judiciously compared with satellite estimates. The radar data are upscaled to the SEVIRI footprint to ease comparisons with the satellite product.

3. Methods

3.1. The CRR Algorithm

The convective rain rate (CRR) algorithm used as for comparison in this work was built on the assumption that the higher the cloud tops and the higher the optical depth of clouds, the higher the likelihood of producing more intense precipitation is.
Figure 1 illustrates some of the corrections made for the CRR product from the first estimate. CRR used as the main input the radiances of three SEVIRI channels, IR10.8 and IR10.8-WV6.2, which were used to screen the cold tops of convective clouds. VIS0.6 provides information on the optical depth of the clouds, but just during the daytime. A simple radar-based regression was then used for the first estimate of the rain rates.
Corrections were then applied. The first one is the moisture correction; it uses the NWP-derived moisture available to produce rain at the lower layer of the atmosphere to adjust the rain rates. The result of this correction in CRR was a better adjustment of the precipitation field.
The evolution correction compared two consecutive IR images with the objective of distinguishing those cloud tops that grow in a dissipation phase, in order to reduce rain rates for the later ones. When two consecutive IR images were not available, a gradient correction was run. Gradient correction located the local temperature maximum in one IR image in order to reduce rain rates there.
Clouds growing at a significant distance from the equator, where the sensor is located, suffer from parallax errors. The parallax correction tries to find the exact cloud position with respect to the ground below by the use of the cloud height. Once the actual position of cloud tops is computed, an orographic correction is also run to take into account the effect of the local topography on the distribution and intensity of precipitation. This correction factor used the interaction between the wind vector at low levels and the local terrain height gradient in the wind direction to adjust the rain rates as appropriate. Figure 1 illustrates the process while Figure 2 shows a simplified operational diagram of the process.

3.2. The CRPh Algorithm

There are important differences between the CRPh and the CRR algorithms. CRPh relies mostly on microphysical information. In contrast and as described above, the CRR was based on the indirect relation between cloud top height and rainfall at the ground with a series of corrections.
The NWC SAF software package includes a set of two precipitation products derived from cloud microphysical properties. The first one is the PC-Ph, whose major aim is to provide an estimate of the probability of precipitation (PoP) occurrence for forecasters. PoP is defined as the instantaneous probability that a rain rate greater than or equal to 0.2 mm h−1 occurs at the pixel level.
The other product is the CRPh, which provides information on instantaneous rain rates and hourly accumulation for convective and stratiform precipitation associated with convection. The minimum rain rate that this algorithm is able to detect is 0.2 mm h−1. Despite the quantitative values provided by the algorithm, the CRPh is intended to be used to provide qualitative information for the forecasters, as location and evolution is more useful than intensity for the nowcasting of severe convection. The temporal resolution of the product is 15 min in normal mode and 5 min in the rapid-scan mode. The spatial resolution is 3 km at the sub satellite point.
Figure 2 shows the diagram of the calculations made in real time for the SAF. Cloud phase (CP), cloud optical thickness (COT) and effective radius (Reff) are used as the first inputs for the algorithm. COT is strongly related to the reflectance of clouds in SEVIRI’s VIS0.6, while reflectance in the NIR1.6 is related to both the cloud phase (CP) and the Reff at cloud top.
Full details on how the CRPh is calculated can be found in Marcos et al. [9]. In short, Derrien’s method [12] is used to compute the three cloud-top microphysical parameters required by the CRPh algorithm. In short, the method first computes Reff using a look-up table from the radiative transfer model developed by EUMETSAT (RTMOM). The physical assumptions are that (1) the reflectance in the VIS0.6 channel is directly related with the COT, while (2) the variations in the NIR1.6 reflectance can be used to estimate both the CP and the Reff. The NWC SAF cloud type output (which uses the 3D radiative transfer model RTTOV (Radiative Transfer for TOVS) to simulate radiances) is also used.
The next step is using COT and Reff to estimate the cloud water path (CWP), following the procedure in [13]. Further information about the CRPh algorithm can be found in [9].
The final step, the connection between the cloud-top physical properties and rain occurrence at the ground, draws from the approaches used by Nauss and Kokhanovsky [14] and Roebeling and Holleman [15] following research by Lensky and Rosenfeld [16,17]. A regression over selected cases is applied, resulting in a best fit for the rain rates (RR):
RR = 50.0 ∗ {1 − exp [−0.5 ((CWP − 155)/1700)2]
with CWP in g m−2.
Corrections for parallax error and lighting enhancement are applied to the CRPh. The parallax correction uses the NWP model to estimate cloud height. Lighting correction increases rain rates depending on the spatial and temporal density of lightning within 15 min. The rationale is that lightning is indicative of strong moist convection and therefore to more intense rainfall.
An illumination conditions parameter (ICP) is calculated as ICP = cos[a]·cos[b], with a being the ray zenithal angle and b the Sun’s zenithal angle. ICP is used to inform the forecasters about whether to trust the quantitative outputs or to only rely on the estimated areal extent of rainfall.

3.3. Empirical Choices and Assumptions in the CRPh Algorithm

Regarding the assumptions embedded into the algorithm, the main hypothesis is that the size of the larger droplets is highly correlated with the rain rates [18]. Indeed, several studies have used cloud-top microphysical information to estimate surface rain for convective clouds [15,19,20] demonstrating that they outperform the algorithms that directly use IR radiances, such as the CRR. Since it has been reported that a cloud-top effective radius higher than 14 µm is required to produce rain [21], and considering that such a large value favors large droplets, that is the threshold used by the algorithm.
Also, it is hypothesized that the properties of the airmass have a high impact on precipitation formation in convective clouds [21]. Also, [22] found a quantitative link between cloud ice water path and surface rain for deep clouds with iced tops in mid-latitudes.
The CRPh inherits several empirical choices of its inputs. These include the use of a fixed rain-radar reflectivity relationship, namely Z = 200 R1.6, to calibrate the detection thresholds. The choice is a compromise for several types of rainfall across the globe, but it is well-suited for convective rainfall. Also, the drop size distribution is assumed to be lognormal instead of gamma-distributed, at variance with most measurements [18,23]. Cloud tops are also assumed to be homogeneous for the calculation of the Reff, as infinite optical thickness is assumed at 3.7 µm. Another assumption inherited from Rosenfeld et al. [21] is neglecting the effects of the atmosphere above the cloud top.
Yet another assumption is that the maximum rainfall rate measurable by the algorithm is 50 mm h−1. The value is a reasonable choice for the mid-latitudes even though it can hide extreme events [1,24]. Nonetheless, the CRPh is aimed at nowcasting and the subsequent, human-driven process can identify such instances after being first directed by the SAF product.
In fact, all the assumptions give plausible results, are geographically consistent (with no known regional biases due to surface or regime) and do not oversimplify the problem. The only limitation is that the information from the SEVIRI instrument is restricted to gathering information from cloud tops, but the ability to derive estimates about the microphysics on appropriate illumination conditions and the high temporal and spatial resolution somehow compensate for the issue and makes CRPh a valuable complement in the endeavor of the multisource estimation of precipitation from space [25,26].

3.4. Object-Based Technique for Intercomparison

In order to compare the CRPh with the CRR and with the radar data, the object-based, spatial technique of Davis [27] was used. The method is named MODE (method for object-based diagnostic evaluation). The reason for selecting this metric is two-fold: firstly, the object-based methodology complements the spatially collocated comparisons already reported in Marcos et al. [28]; and secondly, MODE is considered a ‘fairer’ metric for the comparison of instantaneous precipitation [27]. Indeed, the ability to pinpoint the exact location and timing of precipitation is the ultimate test of quantitative performance [29], but such a test is too stringent for nowcasting, where a qualitative estimate is sought. Expert-based comparisons also show that spatial verification methods such as MODE are closer to the actual human evaluation than pixel-based methods [30,31,32,33].
The main output of the MODE method in our case is the “total interest” score T(α) which evaluates the likeliness of two precipitation fields in a [0,1] scale. The score integrates how well the clusters of precipitation αi are identified, giving a weight ωi to their relative importance in terms of size.
The final score is calculated by assigning to each attribute a confidence value Cii), and a value of interest Iii), which are based on several parameters: the distance between centroids, differences in the angle of axis, area mismatch, differences in the topology of the features, and differences in intensity. Further information on the rationale and more details about this spatial verification method can be found in Davis et al. [27].
T(α) > 0.7 is indicative of a significant similarity between precipitation blobs. An overall estimate of the performances of the algorithm across all the clusters in the scene is given by the MMI (median maximum Interest value), which can be used as the integrated measurement of skill. The use of the median instead of the mean is preferred as the median is statistically more robust.

4. Results and Discussion

4.1. Intercomparison with CRR and Ground Radar

Figure 3 shows a comparison of the radar-derived precipitation estimate, the output of the CRR algorithm and the new CRPh estimate for 12 July 2008 1300 Z. This case illustrates the improved ability of the new algorithm to discriminate the rain rates inside the precipitating systems, and the more precise location of the actual rain. The small raining system in the northwest of the country is missed by the CRR, whereas the CRPh correctly identifies both the location and the intensity of the rain. The higher rainfall rates are also correctly estimated.
Figure 4 shows another case in which the CRPh outperforms the CRR in terms of identifying the actual rainfall rates. The precipitation structure of the CRPh is closer to the radar, and the algorithm detects both small precipitation clusters and precipitation maxima. These features are not well estimated by the CRR. Note the large field in Southern France does not feature in the radar because of the coverage of the Spanish radar network.
Figure 5 gathers another two cases illustrating the performances of the CRPh for different situations. In the 11 August 2012 case, it is shown that the CRPh improves the detection of precipitation from relatively warm cloud tops compared to the CRR algorithm. The 9 September 2008 case illustrates the skill of the CRPh algorithm at detecting precipitation from small convective cells, as well as its ability to avoid misinterpreting the cold rings in large convective cells as the CRR does.
CRR inherits several sources of errors from both the nature of its inputs and the processing of its corrections. The physical basis of the algorithm (that is, that the clouds with coldest tops and high optical depth produce more intense rainfall at the ground) depends on the atmospheric situation. In fact, there are a number of situations when these conditions are not fulfilled, and intense convective precipitation is produced. That would be the case for a very unstable atmosphere at low levels with a high amount of moisture and a thermal inversion at mid-high levels. Under these conditions, “warm” top clouds can grow (cf. Figure 5) and produce precipitation, but the CRR is not effective in detecting those sorts of situations.
Another source of errors is that the CRR is meant to estimate precipitation distribution and intensities at ground, but such a variable is only indirectly related to cold cloud tops. Figure 5 shows that the CRR precipitation distribution mirrors cloud tops shapes instead of the precipitation patterns in the radar. To address this problem, the CRR applies a number of ad-hoc corrections (Figure 2). Some of them, such as moisture, parallax and orographic corrections, improve the estimates of intensity, but do not resolve the indirectness issue and result in location mismatches.

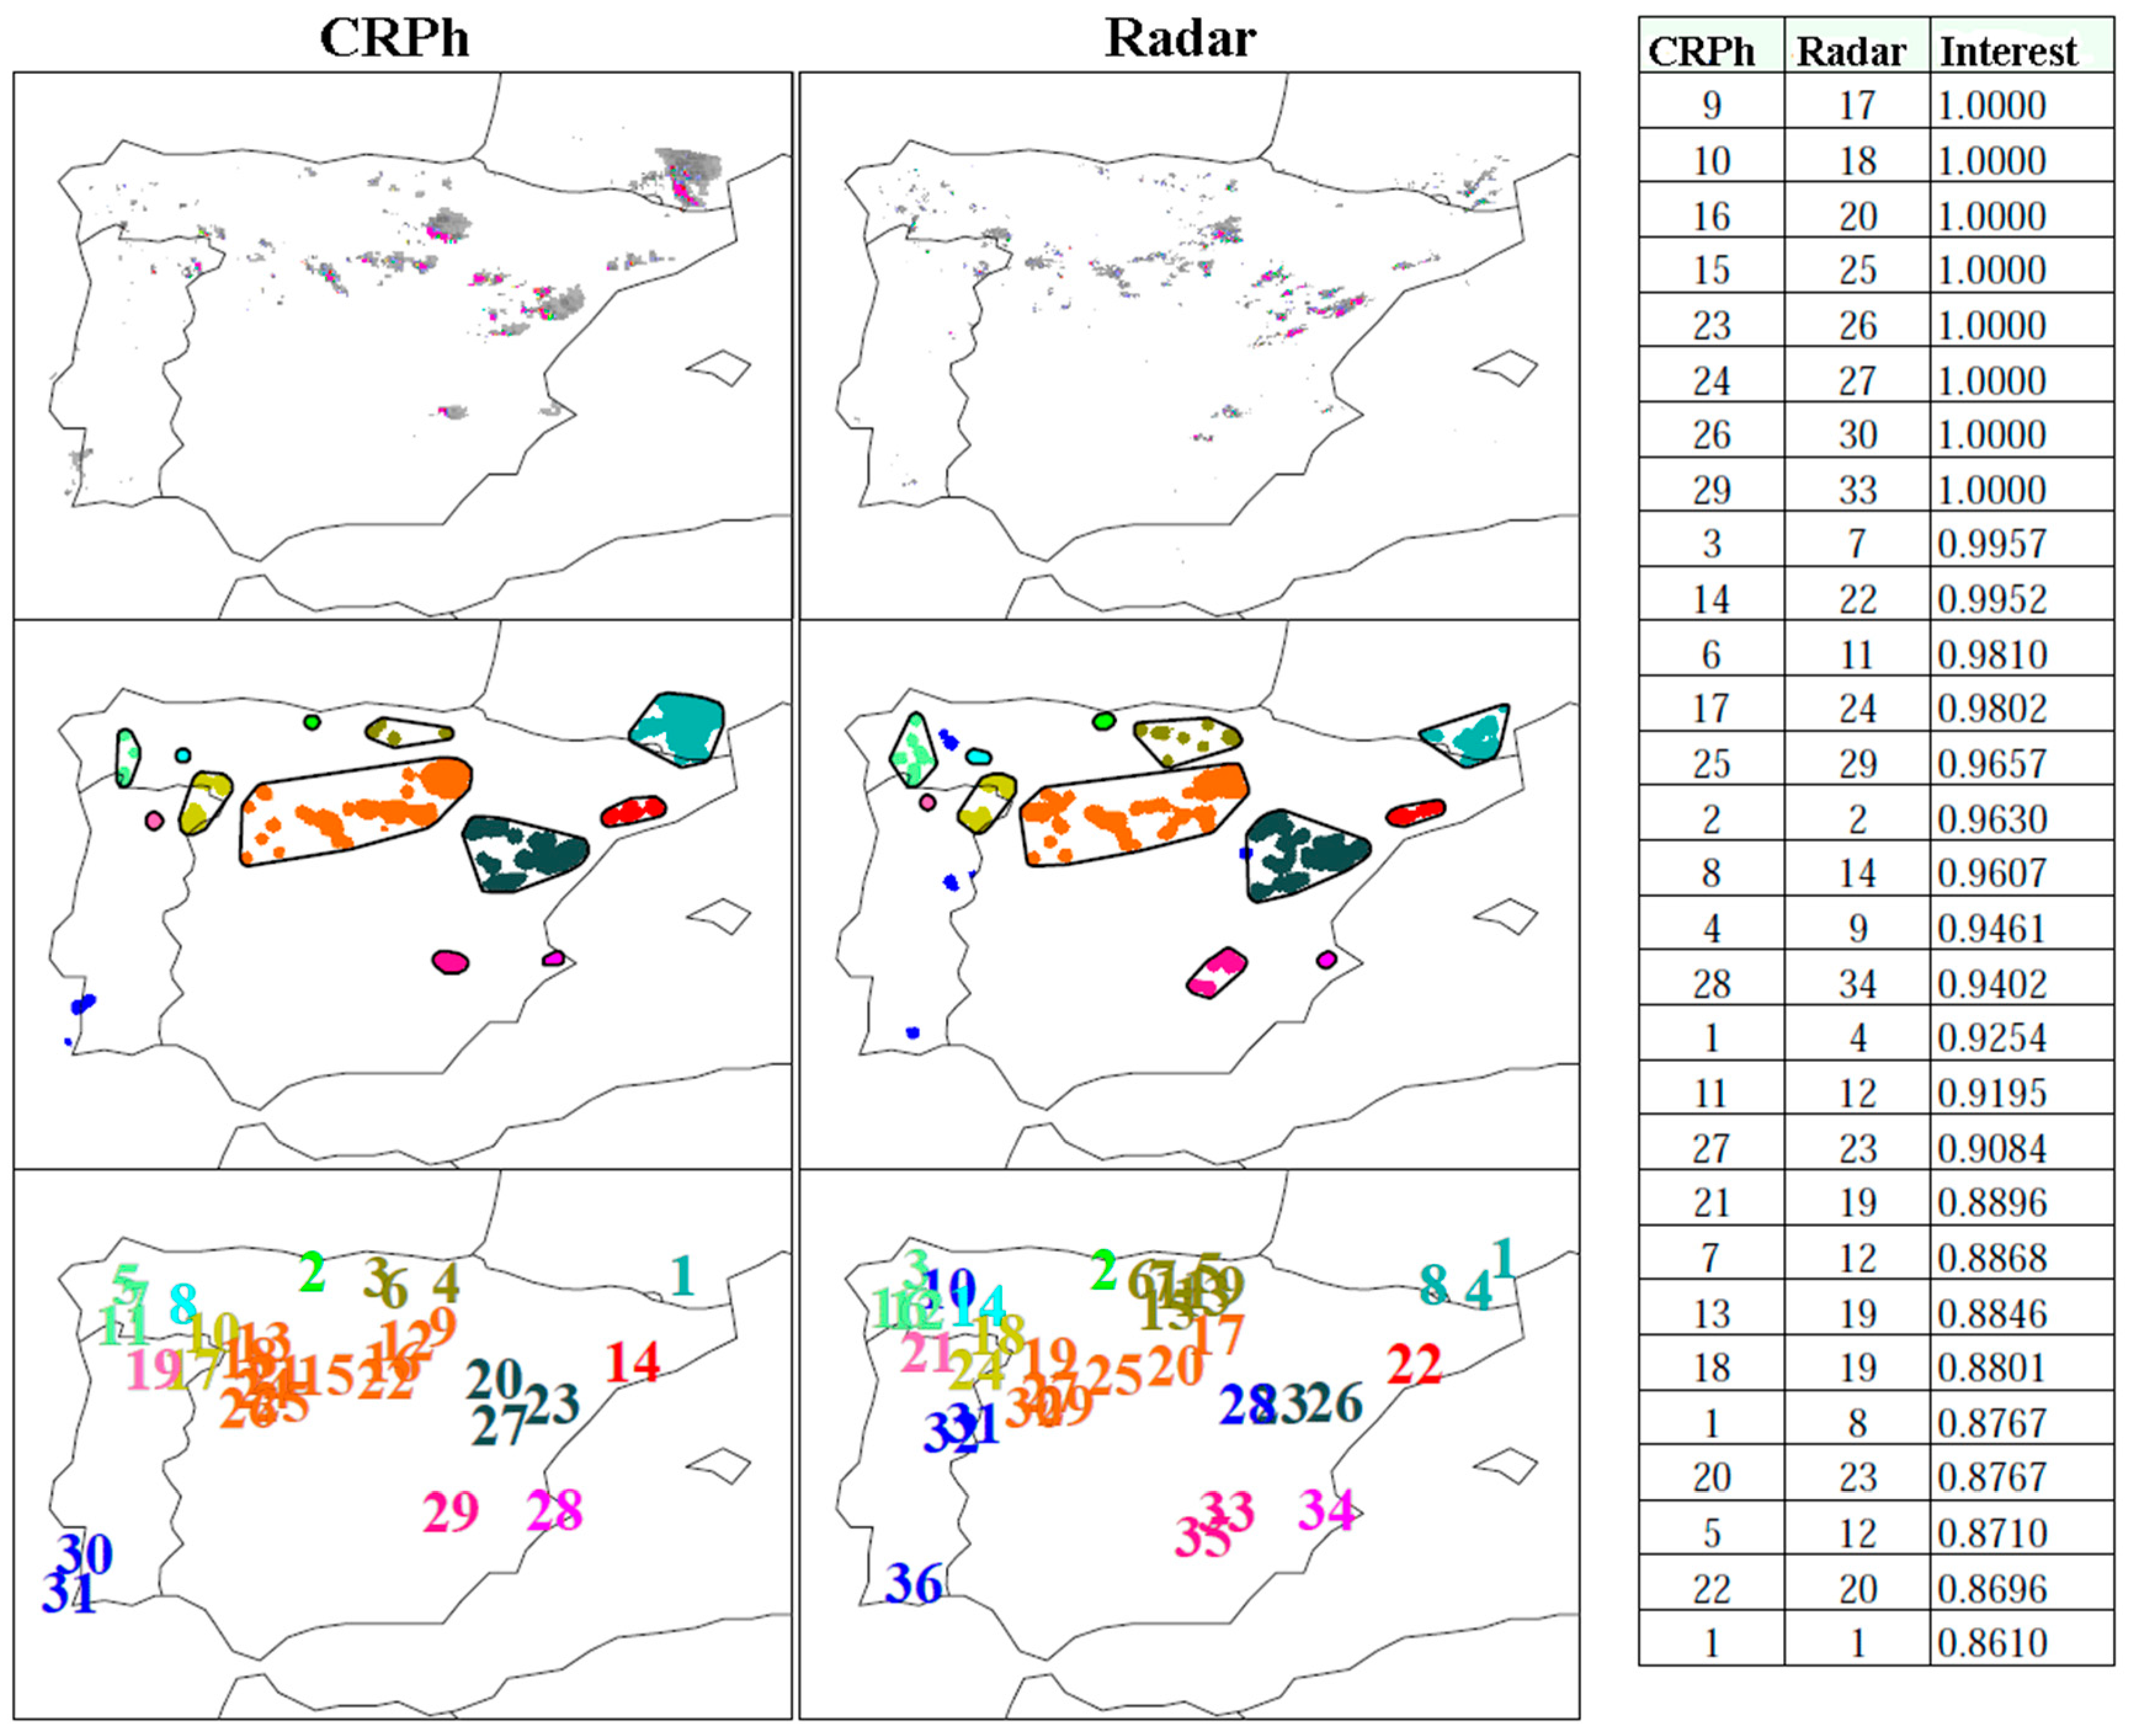
4.2. Object-Based Evaluation

The evaluation of the CRPh using the MODE metric provides a complementary appraisal of the suitability of the algorithm for nowcasting. Quantitative validation using 78 days with convective events in 2008 already confirmed the good performance of the CRPh [34], with false alarm ratios (FAR) below 27.4, a probability of detection (POD) above 84.2, and critical success indexes (CSI) above 63.9.
MODE has two free parameters that depend on the scene: a threshold value T and a convolution radius R. While T can be conventionally fixed to the minimum discernible rainfall rate such as 0.2 mm/h or to any other rate of interest, R accounts for the size of the precipitation clusters so different choices of R produce different number of clusters to evaluate (Figure 6).
The value of R for this case study was selected with local knowledge in mind; i.e., taking into account the differences in the geography so the different clusters represent markedly different regions.
Figure 7 shows the MODE verification results of the CRPh compared with the radar for a convolution radius of 4 and a threshold of 0.2 (8 September 2014 case). The CRPh misses some isolated convective spots over Portugal but does a good job at locating the larger cells. The differences in the actual location (cf. clusters 10 or 12) would result in poor quantitative scores, but the feature-based method accommodates such errors. Reference [35] found that even an imprecise determination of intensity or location of convective cells is useful information for nowcasting as long as their existence is identified. Indeed, given the other uncertainties involved in the short-term prediction that would follow, such minor differences in the location or intensity of the cells are unimportant.
Figure 8 shows one case where the CRR outperforms the CRPh. The reason is the poor illumination conditions, which impedes the CRPh exploiting the microphysical information. The illumination quality flag (IQF) is below the 60% threshold, thus informing the forecaster to ignore the CRPh rain intensities (but not the areal extent of the rainfall, which in fact is better captured by the CRPh than by the CRR).
The optimum convolution radius for each threshold can be calculated by evaluating each choice to identify which combination represents a balance between excessive smoothing and suitable intensity. Minimal smoothing and a very low threshold will result in a large number of objects, many of them small. Heavy smoothing and a high threshold will result in very few intense rain areas [27]. The convolution and thresholding operations effectively select the portion of the field that is of greatest interest to the user of the method, and therefore there is not necessarily a universally optimal choice for these parameters [27]. The analysis of the possible alternatives for our cases (Figure 5) shows that an R of 10 is appropriate for the desired 1 mm/h threshold as it captures the individual convective systems.
Figure 9 shows the effect of such a choice in the verification.

5. Conclusions

EUMETSAT’s CRPh algorithm seems to outperform the CRR product for nowcasting applications and to provide better estimates of precipitation, likely thanks to the inclusion into the modeling of information about cloud microphysics. The empirical choices and the rationale for calculating these are well founded and provide a reasonable balance between the available bands in the SEVIRI instrument and the hydrometeorological variables to be measured.
Both a visual comparison of the CRPh with radar data and the results of an object-based verification metric for a selected case show the potential of the product for nowcasting. The main limitation of the CRPh is that it is a day-only algorithm, so it is of moderate usefulness in winter. Daylight per se is not a major limitation, as convective precipitation mainly occurs then. In addition, and based also on our operational experience, convection in the area of interest is more intense precisely in summer, where the operating time of the algorithm is longer.
Another limitation of the algorithm is that the RR can only be calculated on pixels for which the water phase is adequately estimated; a condition that is contingent upon suitable illumination geometry. Solar glint and highly slanted cloud/sun/satellite combinations preclude or limit the calculation of the microphysical variables required by the algorithm, but that is a shared shortcoming of those precipitation algorithms based on VIS or NIR frequencies. Quality flags are provided with the CRPh to evaluate the potential effects of illumination on the nominal estimates of the rain rates [9,36,37].
The evolution of the CRPh includes the investigation of frequencies that can be used 24/7 to derive the microphysical information of the cloud. The integration of more direct microwave information from orbital radiometers [38,39], radars [40,41,42,43,44] or by using attenuation techniques [45,46,47,48] is another possible avenue for the improvement of the product, although the coarse spatial and temporal resolutions may preclude the operational use for nowcasting. The latency of the microwave products is another concern. The use of sub-pixel methods [49] may, however, help to increase the spatial resolution of the fused product further.

Author Contributions

Conceptualization, F.J.T.; methodology, F.J.T., C.M., J.M.S.; software, J.M.S.; validation, C.M., J.M.S.; formal analysis, C.M., J.M.S.; investigation, F.J.T., C.M., J.M.S.; writing—original draft preparation, F.J.T.; writing—review and editing, F.J.T., C.M.; visualization, C.M., J.M.S.

Funding

This research was funded by the Ministerio de Economía y Competitividad (MINECO), grant numbers CGL2013-48367-P and CGL2016-80609-R.

Acknowledgments

F.J.T. also acknowledges the Joint Research Proposal for Precipitation Research in Spain within NASA’s Precipitation Measurement Missions (PMM) Research Program. This work was part of the EUMETSAT’ Satellite Application Facility on Support to Nowcasting and Very Short-Range Forecasting project.

Conflicts of Interest

The authors declare no conflict of interest.

References

  1. de Coning, E. Optimizing Satellite-Based Precipitation Estimation for Nowcasting of Rainfall and Flash Flood Events over the South African Domain. Remote Sens. 2013, 5, 5702–5724. [Google Scholar] [CrossRef]
  2. Keramitsoglou, I.; Kiranoudis, C.; Sismanidis, P.; Zakšek, K. An Online System for Nowcasting Satellite Derived Temperatures for Urban Areas. Remote Sens. 2016, 8, 306. [Google Scholar] [CrossRef]
  3. Bolgiani, P.; Fernandez-Gonzalez, S.; Martin, M.L.; Valero, F.; Merino, A.; García-Ortega, E.; Sanchez, J.L. Analysis and numerical simulation of an aircraft icing episode near Adolfo Suarez Madrid-Barajas International Airport. Atmos. Res. 2017, 60–69. [Google Scholar] [CrossRef]
  4. Gallucci, D.; Romano, F.; Cersosimo, A.; Cimini, D.; Di Paola, F.; Gentile, S.; Geraldi, E.; Larosa, S.; Nilo, S.T.; Ricciardelli, E.; et al. Nowcasting Surface Solar Irradiance with AMESIS via Motion Vector Fields of MSG-SEVIRI Data. Remote Sens. 2018, 10, 845. [Google Scholar] [CrossRef]
  5. Bhetuwal, C.; Nepal, B.; Karki, R. Use of satellite brightness temperature and ground lightning data for nowcasting of pre-monsoon season thunderstorms in Nepal. In Proceedings of the 2018 WMO/CIMO Technical Conference on Meteorological and Environmental Instruments and Methods of Observation (CIMO TECO-2018), Amsterdam, The Netherlands, 11–12 October 2018. [Google Scholar]
  6. Arab Amiri, M.; Mesgari, M. Modeling the Spatial and Temporal Variability of Precipitation in Northwest Iran. Atmosphere 2017, 8, 254. [Google Scholar] [CrossRef]
  7. Nakajima, T.; King, M. Determination of the optical thickness and effective particle radius of clouds from reflected solar radiation measurements. Part I: Theory. J. Atmos. Sci. 1990, 42, 1878–1893. [Google Scholar] [CrossRef]
  8. Yi, L.; Thies, B.; Zhang, S.; Shi, X.; Bendix, J. Optical Thickness and Effective Radius Retrievals of Low Stratus and Fog from MTSAT Daytime Data as a Prerequisite for Yellow Sea Fog Detection. Remote Sens. 2016, 8, 8. [Google Scholar] [CrossRef]
  9. Marcos, C.; Rodríguez, A. Algorithm Theoretical Basis Document for “Precipitation Products from Cloud Physical Properties” (PPh-PGE14: PCPh v1.0 & CRPh v1.0). 2013. Available online: www.nwcsaf.org (accessed on 28 February 2019).
  10. Biswas, S.; Chandrasekar, V. Cross-Validation of Observations between the GPM Dual-Frequency Precipitation Radar and Ground Based Dual-Polarization Radars. Remote Sens. 2018, 10, 1773. [Google Scholar] [CrossRef]
  11. Gutiérrez, J.M.; Aguado, F. Quality image for the Spanish National Radar Composition. In Proceedings of the 4th European Conference on Radar in Meteorology and Hydrology, Barcelona, Spain, 18–22 September 2006. [Google Scholar]
  12. Derrien, M. Algorithm Theoretical Basis Document for “Cloud Products” (CMa-PGE01 v3.2, CT-PGE02 v2.2 & CTTHPGE03 v2.2). 2013. Available online: www.nwcsaf.org (accessed on 28 February 2019).
  13. Roebeling, R.; Feijt, A.J.; Stammes, P. Cloud property retrievals for climate monitoring: Implications of differences between Spinning Enhanced Visible and Infrared Imager (SEVIRI) on METEOSAT-8 and Advanced Very High Resolution Radiometer (AVHRR) on NOAA-17. J. Geophys Res. 2006, 111, D20. [Google Scholar] [CrossRef]
  14. Nauss, T.; Kokhanovsky, A.A. Discriminating raining from non-raining clouds at mid-latitudes using multispectral satellite data. Atmos. Chem. Phys. 2006, 6, 5031–5036. [Google Scholar] [CrossRef] [Green Version]
  15. Roebeling, R.; Holleman, I. SEVIRI rainfall retrieval and validation using weather radar observations. J. Geophys. Res. 2009, 114, D2102. [Google Scholar] [CrossRef]
  16. Lensky, I.; Rosenfeld, D. Estimation of precipitation area and rain intensity based on the microphysical properties retrieved from NOAA AVHRR data. J. Appl. Meteorol. 1997, 36, 234–242. [Google Scholar] [CrossRef]
  17. Lensky, I.; Rosenfeld, D. The time-space exchangeability of satellite retrieved relations between cloud top temperature and particle effective radius. Atmos. Chem. Phys. 2006, 6, 2887–2894. [Google Scholar] [CrossRef] [Green Version]
  18. Adirosi, E.; Roberto, N.; Montopoli, M.; Gorgucci, E.; Baldini, L. Influence of Disdrometer Type on Weather Radar Algorithms from Measured DSD: Application to Italian Climatology. Atmosphere 2018, 9, 360. [Google Scholar] [CrossRef]
  19. Kühnlein, M.; Thies, B.; Nauß, T.; Bendix, J. Rainfall-Rate Assignment Using MSG SEVIRI Data—A Promising Approach to Spaceborne Rainfall-Rate Retrieval for Midlatitudes. J. Appl. Meteor. Climatol. 2010, 49, 1477–1495. [Google Scholar] [CrossRef]
  20. Liu, X.T.; Liu, Q.; Fu, Y.F.; Li, R. Daytime precipitation identification scheme based on multiple cloud parameters retrieved from visible and infrared measurements. Sci. China Earth Sci. 2014, 57, 2112–2124. [Google Scholar] [CrossRef]
  21. Rosenfeld, D.; Gutman, G. Retrieving microphysical properties near the tops of potential rain clouds by multispectral analysis of AVHRR data. Atmos. Res. 1994, 34, 259–283. [Google Scholar] [CrossRef]
  22. Tubul, Y.; Koren, I.; Altaratz, O.; Heiblum, R.H. On the link between precipitation and the ice water path over tropical and mid-latitude regimes as derived from satellite observations. Atmos. Meas. Tech. Discuss. 2017. [Google Scholar] [CrossRef]
  23. Gatlin, P.; Petersen, W.; Knupp, K.; Carey, L. Observed Response of the Raindrop Size Distribution to Changes in the Melting Layer. Atmosphere 2018, 9, 319. [Google Scholar] [CrossRef]
  24. Morbidelli, R.; Saltalippi, C.; Flammini, A.; Picciafuoco, T.; Dari, J.; Corradini, C. Characteristics of the Underestimation Error of Annual Maximum Rainfall Depth Due to Coarse Temporal Aggregation. Atmosphere 2018, 9, 303. [Google Scholar] [CrossRef]
  25. Bai, P.; Liu, X. Evaluation of Five Satellite-Based Precipitation Products in Two Gauge-Scarce Basins on the Tibetan Plateau. Remote Sens. 2018, 10, 1316. [Google Scholar] [CrossRef]
  26. Beusch, L.; Foresti, L.; Gabella, M.; Hamann, U. Satellite-Based Rainfall Retrieval: From Generalized Linear Models to Artificial Neural Networks. Remote Sens. 2018, 10, 939. [Google Scholar] [CrossRef]
  27. Davis, C.A.; Brown, B.G.; Bullock, R.; Halley-Gotway, J. The Method for Object-Based Diagnostic Evaluation (MODE) Applied to Numerical Forecasts from the 2005 NSSL/SPC Spring Program. Weather Forecast. 2009, 24, 1252–1267. [Google Scholar] [CrossRef]
  28. Marcos, C.; Sancho, J.M.; Tapiador, F.J. NWC SAF convective precipitation product from MSG: A new day-time method based on cloud top physical properties. Thethys J. Mediterr. Meteorol. Climatol. 2015, 12, 3–11. [Google Scholar] [CrossRef]
  29. Tapiador, F.J.; Roca, R.; Genio, A.D.; Dewitte, B.; Petersen, W.; Zhang, F. Is precipitation a good metric for model performance? Bull. Am. Meteorol. Soc. 2019, in press. [Google Scholar] [CrossRef]
  30. Gilleland, E.; Ahijevych, D.; Brown, B.G.; Casati, B.; Ebert, E.E. Intercomparison of Spatial Forecast Verification Methods. Weather Forecast. 2009, 24, 1416–1430. [Google Scholar] [CrossRef] [Green Version]
  31. Jolliffe, I.T.; Stephenson, D.B. Forecast Verification. A Practitioner’s Guide in Atmospheric Science; John Wiley and Sons: Hoboken, NJ, USA, 2011. [Google Scholar]
  32. Wolff, J.K.; Harrold, M.; Fowler, T.; Gotway, J.H.; Nance, L.; Brown, B.G. Beyond the Basics: Evaluating Model-Based Precipitation Forecasts Using Traditional, Spatial, and Object-Based Methods. Weather Forecast. 2014, 29, 1451–1472. [Google Scholar] [CrossRef]
  33. Xu, H.; Wu, Z.; Luo, L.; He, H. Verification of High-Resolution Medium-Range Precipitation Forecasts from Global Environmental Multiscale Model over China during 2009–2013. Atmosphere 2018, 9, 104. [Google Scholar] [CrossRef]
  34. Marcos, C.; Rodríguez, A. Validation Report for “Convective Rainfall Rate” (CRR-PGE05 v4.0). 2013. Available online: www.nwcsaf.org (accessed on 28 February 2019).
  35. Ricciardelli, E.; Di Paola, F.; Gentile, S.; Cersosimo, A.; Cimini, D.; Gallucci, D.; Geraldi, E.; Larosa, S.; Nilo, S.; Ripepi, E.; et al. Analysis of Livorno Heavy Rainfall Event: Examples of Satellite-Based Observation Techniques in Support of Numerical Weather Prediction. Remote Sens. 2018, 10, 1549. [Google Scholar] [CrossRef]
  36. Marcos, C.; Rodríguez, A. Product User Manual for “Precipitation Products from Cloud Physical Properties” (PPh-PGE14: PCPh v1.0 & CRPh v1.0). 2014. Available online: www.nwcsaf.org (accessed on 28 February 2019).
  37. Marcos, C.; Rodríguez, A. Validation Report for “Precipitation products from Cloud Physical Properties” (PPh-PGE14: PCPh v1.0 & CRPh v1.0). 2013. Available online: www.nwcsaf.org (accessed on 28 February 2019).
  38. Ferraro, R.; Nelson, B.; Smith, T.; Prat, O. The AMSU-Based Hydrological Bundle Climate Data Record—Description and Comparison with Other Data Sets. Remote Sens. 2018, 10, 1640. [Google Scholar] [CrossRef]
  39. Zhang, C.; Chen, X.; Shao, H.; Chen, S.; Liu, T.; Chen, C.; Ding, Q.; Du, H. Evaluation and Intercomparison of High-Resolution Satellite Precipitation Estimates—GPM, TRMM, and CMORPH in the Tianshan Mountain Area. Remote Sens. 2018, 10, 1543. [Google Scholar] [CrossRef]
  40. Le, H.; Sutton, J.; Bui, D.; Bolten, J.; Lakshmi, V. Comparison and Bias Correction of TMPA Precipitation Products over the Lower Part of Red–Thai Binh River Basin of Vietnam. Remote Sens. 2018, 10, 1582. [Google Scholar] [CrossRef]
  41. Retalis, A.; Katsanos, D.; Tymvios, F.; Michaelides, S. Validation of the First Years of GPM Operation over Cyprus. Remote Sens. 2018, 10, 1520. [Google Scholar] [CrossRef]
  42. Satgé, F.; Hussain, Y.; Bonnet, M.; Hussain, B.; Martinez-Carvajal, H.; Akhter, G.; Uagoda, R. Benefits of the Successive GPM Based Satellite Precipitation Estimates IMERG–V03, –V04, –V05 and GSMaP–V06, –V07 Over Diverse Geomorphic and Meteorological Regions of Pakistan. Remote Sens. 2018, 10, 1373. [Google Scholar] [CrossRef]
  43. Su, J.; Lü, H.; Zhu, Y.; Wang, X.; Wei, G. Component Analysis of Errors in Four GPM-Based Precipitation Estimations over Mainland China. Remote Sens. 2018, 10, 1420. [Google Scholar] [CrossRef]
  44. Zhang, R.; Wang, Z.; Hilburn, K. Tropical Cyclone Rainfall Estimates from FY-3B MWRI Brightness Temperatures Using the WS Algorithm. Remote Sens. 2018, 10, 1770. [Google Scholar] [CrossRef]
  45. Hordyniec, P.; Kapłon, J.; Rohm, W.; Kryza, M. Residuals of Tropospheric Delays from GNSS Data and Ray-Tracing as a Potential Indicator of Rain and Clouds. Remote Sens. 2018, 10, 1917. [Google Scholar] [CrossRef]
  46. Kim, M.; Kwon, B. Rainfall Detection and Rainfall Rate Estimation Using Microwave Attenuation. Atmosphere 2018, 9, 287. [Google Scholar] [CrossRef]
  47. Jiang, P.; Ye, S.; Chen, D.; Liu, Y.; Xia, P. Retrieving Precipitable Water Vapor Data Using GPS Zenith Delays and Global Reanalysis Data in China. Remote Sens. 2016, 8, 389. [Google Scholar] [CrossRef]
  48. Lu, C.; Chen, X.; Liu, G.; Dick, G.; Wickert, J.; Jiang, X.; Zheng, K.; Schuh, H. Real-Time Tropospheric Delays Retrieved from Multi-GNSS Observations and IGS Real-Time Product Streams. Remote Sens. 2017, 9, 1317. [Google Scholar] [CrossRef]
  49. Li, L.; He, Z.; Chen, S.; Mai, X.; Zhang, A.; Hu, B.; Li, Z.; Tong, X. Subpixel-Based Precipitation Nowcasting with the Pyramid Lucas–Kanade Optical Flow Technique. Atmosphere 2018, 9, 260. [Google Scholar] [CrossRef]
Figure 1. Effects of individual corrections in the convective rainfall rate (CRR) algorithm, and the radar estimate.
Remotesensing 11 00527 g001
Figure 2. Simplified flow diagram of the real time calculation of the CRR (top) and the convective rainfall rate from cloud physical properties (CRPh) (bottom) products at EUMETSAT’s nowcasting and very short-range forecasting (NWC SAF).
Remotesensing 11 00527 g002
Figure 3. A comparison of the radar-derived precipitation estimate (top), the output of the CRR algorithm (middle) and the new CRPh estimate (bottom). The date is 12 July 2008 1300 Z. The case illustrates the better abilities of the new algorithm to discriminate the rain rates inside the precipitating systems and the location of the actual rain.
Remotesensing 11 00527 g003
Figure 4. As Figure 3 for 9 September 2008, 1300 Z case. In this case, the CRPh also clearly outperforms the CRR both in the identification of precipitation and in the actual rainfall rates.
Remotesensing 11 00527 g004
Figure 5. SEVIRI/Radar/CRR/CRPh comparisons for two cases illustrating (left) the improvement in the detection of precipitation from relatively warm cloud tops in the CRPh algorithm compared to the CRR algorithm; and (right) the ability of the CRPh algorithm to detect precipitation from small convective cells, as well as its ability to avoid misinterpreting the cold rings in large convective cells.
Remotesensing 11 00527 g005
Figure 6. Effects of different convolution radius R (2, 10 and 15) on the model for object-based diagnostic evaluation (MODE) metric, for the same threshold value T (1 mm/h). The case is on 8 September 2014 1400 Z.
Remotesensing 11 00527 g006
Figure 7. Verification results of the CRPh compared with radar using MODE (convolution radius = 4.0, threshold = 0.2) for the 8 September 2014 1400 Z case. The table reports the main statistics of the clusters in the maps. TOT INTR stands for the total interest score. CLUS PAIR: number of clusters being compared; CEN DIST: distance between centroids (in grid squares); ANG DIFF: difference between the axis angles of two clusters [degrees]; CRPh(RADAR) AREA and CRPh(RADAR) cluster area [grid unit squared]; INTER AREA: intersection area of two clusters [grid unit squared]; UNION AREA: union area of two clusters [grid unit squared]; SYMM DIFF: symmetric difference of two clusters [grid unit squared]; CRPh/RADAR INT50: 50th percentile of intensity of the filtered field within the cluster [mm]; CRPh/RADAR INT90: 90th percentile of intensity of the filtered field within the cluster [mm]; TOT INTR: total value of interest T(α) computed for a pair of clusters [unitless].
Remotesensing 11 00527 g007
Figure 8. An example of one instance where the CRR outperforms the CRPh (13 June 2014). The reason is the poor illumination conditions, which impedes the CRPh exploiting the microphysical information. The illumination quality flag (IQF) is below the 60% threshold, thus informing the forecaster to ignore the CRPh rain intensities (but not the areal extent of the rainfall, which in fact is better captured by the CRPh than by the CRR).
Remotesensing 11 00527 g008
Figure 9. Verification results of the CRPh compared with radar using MODE (convolution radius = 10.0, threshold = 0.2). Interest refers to the total interest score T(α).
Remotesensing 11 00527 g009

