Proceeding Paper

In-Home Behavioral Observation Method Employing Internet of Things Sensors for Barrier Investigation of Energy Saving Activities †

1
Central Research Institute of Electric Power Industry, 2-6-1 Nagasaka, Yokosuka-shi, Kanagawa 240-0196, Japan
2
IdeaLab Co., Ltd., 3-29-1 Ebisu, Shibuya-ku, Tokyo 150-0013, Japan
*
Author to whom correspondence should be addressed.
Presented at the 13th International Conference on Ubiquitous Computing and Ambient Intelligence UCAmI 2019, Toledo, Spain, 2–5 December 2019.
Proceedings 2019, 31(1), 31; https://doi.org/10.3390/proceedings2019031031
Published: 20 November 2019

Abstract

:
This paper proposes an in-home behavioral observation method employing Internet of Things (IoT) sensors. Behavioral change programs based on information provision approaches have begun to be employed in the reduction of carbon dioxide emissions in the residential sector. To improve efforts to save energy, a behavioral observation method that aims to understand the reality of users’ daily activities could be an effective approach. However, problems with existing methods include observations costs, privacy implications and the other complications regarding the specific behaviors of the person being observed. An in-home behavioral observation method employing IoT sensors is therefore proposed to both reduce costs and alleviate the privacy impact on user’s in-home activities. The use of sensor-based observation presents several relevant advantages. For example, the cost of sensor-based observation is relatively cheap compared to human-based approaches. In addition, it employs a minimum number of necessary sensors and has a relatively small impact on privacy and personal activities. These advantages imply that the proposed method could allow long-term observations targeting a number of households, thus enabling exhaustive investigations. Sensory-based observation approaches are applied to investigations of the barriers to in-home energy-saving activities with a goal of improving relevant behavioral change programs. The results showed that the in-home activities of the twenty target households were successfully observed for six weeks with various barriers having been extracted and organized.

1. Introduction

The reduction of carbon dioxide emissions is required around the world in order to avoid climate change. The Japanese Cabinet has approved the Plan for Global Warming Countermeasures, which mandates a 26% reduction in greenhouse gas emissions by 2030 and 80% by 2050, compared to 2013 emissions respectively. (https://www.env.go.jp/en/headline/2238.html (Accessed 5 November 2019)) The plan also mandates a residential sector reduction of approximately 40%.
Behavioral change programs employing information provision approaches, such as the Home Energy Report (HER) [1,2], are consequently focused in achieving this reduction in households. While these approaches have achieved certain results, there still exists room for improvement in terms of personalized and real-time information provision [3,4].
In order to realize detailed information provision, personalization that reflects the barriers caused by unique in-home circumstances and constraints is an essential factor; this is due to the fact that barriers against energy saving activities differ from person to person, resulting in situations in which people cannot or do not take actions. Relevant surveys using methods such as questionnaires or interviews [5,6,7,8] exist with the aim of investigating these barriers. However, it is difficult for questionnaire-based surveys to find potential indicating factors that cannot be necessarily listed in a questionnaire. Interview-based surveys are also a major approach and while these might be able to elicit new potential factors, the information obtained about these is limited to the interviewee’s memory at the time of the interview.
In order to investigate the potential factors for behavioral change programs, it is considered that behavioral observation [9,10], a qualitative research method for understanding the users’ reality of daily activities, could be an effective approach. This method has been mainly utilized in public spaces, such as schools and commercial facilities, to improve the creative process in providing education or services. This method however, is not without its challenges. Behavioral observation has two main problems when targeting users’ activities in a number of households: First, the cost of observation is expensive because it requires human observers who have expertise in the specific, targeted energy saving activities. Second, the impact of human-based observation on personal privacy while observing a person’s behavior raises significant issues; these problems make it difficult to conduct long-term observation targeting a number of households.
An in-home behavioral observation method employing Internet of Things (IoT) sensors is therefore proposed to solve these problems. The proposed method consists of three components: in-home sensing with IoT sensors, visualization of sensor data and in-depth interviews. The observation by the minimum required sensors enables the alleviation of the impact on the privacy of user’s in-home activities. In addition, the cost for sensor-based observations is relatively low compared to existing human-based approaches. Furthermore, since visualized sensor data includes the characteristics of both in-home activities and habitual behaviors, an in-depth interview can be effectively conducted with prepared questions based on this data. These advantages imply that the proposed method enables long-term observations targeting a number of households, in this manner realizing an exhaustive investigation of applicable barriers.
Previous related research about information provision with respect to energy saving, behavioral observations and in-home sensing with IoT sensors and smart meters is reviewed in Section 2. Section 3 details the proposed method combining in-home sensing employing IoT sensors, visualization of sensor data and in-depth interview. Observations targeting actual households were conducted and their results are discussed in Section 4. Section 5 concludes the paper and discusses the implications of the observed results on future studies.

2. Related Work

2.1. Information Provision for Energy Saving

HER is one of several information provision methods that provide electricity usage data in a household as well as personalized tips and ideas to save money on electricity bills. It is focused on the promotion of energy saving and the reduction of carbon dioxide emissions in the residential sector [1,2]. While information provision methods using HER have achieved some important results, the potential for improvement is both present and necessary. As such the following two approaches can be effective in improving the effects of energy saving [3,4].
  • Detailed feedback (personalized or appliance level feedback)
  • Direct feedback (provided in real-time)
This study focuses on the detailed feedback approach shown above. In order to provide detailed feedback, personalization that reflects the careful study of barriers, caused by unique circumstances and constraints, is required. The barriers against energy saving activities differ from person to person and result in situations in which people cannot take actions. Understanding these barriers is therefore a crucial topic to realize effective information provision methods aimed at energy saving.
It is important to note that there exist related surveys using questionnaire or interview [5,6,7,8]. While questionnaire-based surveys are indeed quantitative studies that have advantages both in terms of cost and data treatment ease, they tend to encounter difficulties in finding potential factors not listed in the questionnaire. Interview-based surveys are also a major approach in obtaining data from users and participants, being able to elicit potential factors from these; despite this the gained factors tend to be limited to interviewee’s memory at the time of the interview.

2.2. Behavioral Observation

Behavioral observation is a qualitative research method used to understand the users’ reality of daily activities and the usage of services or products [9,10]. The method is based on the concept of user-centered design [11], which focuses on users’ needs, involving them during the design process. In user-centered design, understanding users’ needs is regarded as one of the principal ideas in the generation of hypotheses to meet these needs and improve the users’ quality of life. Additionally some observation methods have been integrated with an in-depth interview [12,13,14]. Katz-Buonincontro et al. called it triangulation [12]. This integration is one of several key factors in realizing thick description [15] that provides detailed analysis in qualitative research fields.
This method has been mainly utilized in public spaces such as schools and commercial facilities to develop the creative processes present in education or services [10,12,13]. In contrast, this method is difficult to utilize at a household level because human-based observation could be considered an invasion of privacy; as such, while this observation method enables detailed investigation, it also adds significant impact to the observed person, possibly affecting the activities the person is involved in.
Unmanned observation that employs some kind of activity log could be a solution to this challenge. As part of an indirect observation case study, Singler et al. conducted an ethnographic survey on online tax returns [16]. Despite the French Government’s provision of multiple channels for tax returns, the penetration rate of online returns remained low; researchers therefore, collected and analyzed the log data derived from the website as well as other offline services. As a result of this analyses, the nudge [17] and behavioral economics implications resulting from the study, contributed to the improvement of the respective website usability as well as the increase in the penetration rate of its use.
The results of this study suggest that the implementation of indirect observation, reducing the direct impact on the observed person as well as the costs of investigation, could be a solution against the aforementioned problems. Despite this, it should be noted that these results lack detail with respect to users’ activities when compared to human-based observation methods.

2.3. In-home Sensing with IoT Sensors and Smart Meters

Research regarding residential monitoring has seen an increase in popularity thanks to economical IoT sensors. In-home sensing is mainly utilized for healthcare monitoring systems such as fall detection, which is collectively called ambient assisted living [18,19,20].
The installation of smart meters has also contributed to the popularization of residential monitoring. A smart meter is a network-connected, remote-controlled digital meter that monitors electricity consumption online. These meters have been installed in some regions of Europe and the United States. In Japan, smart meters will be installed in all households by 2024 [21]. While the main purpose of this installation is automated meter reading for billing information, smart meters also enable the attainment of time series data regarding electricity consumption for each household in Japan [22]. As studies regarding occupancy detection [23,24,25] and disaggregation [4,26,27,28] have shown, electricity consumption data can reflect the characteristics of daily life in households, providing information with respect to occupancy states and the usage of home appliances.
In-home observation by humans could be replaced by the collection and visualization of sensor data. Although this unmanned approach is indirect and presents its own difficulties in grasping detailed activities, triangulation combining in-home sensing, data visualization and in-depth interviews can fill in the perceptual information gaps of a human observer. Furthermore, this combination is also expected to alleviate the impact on the observed person while realizing cost effective observations; as a result these advantages can serve to cover larger numbers of households for a longer period of time.

3. In-Home Behavioral Observation Method Employing IoT Sensors

The proposed method consists of three components: in-home sensing with IoT sensors, the visualization of sensor data and in-depth interviews. Each component is described in Section 3.1Section 3.3, respectively.

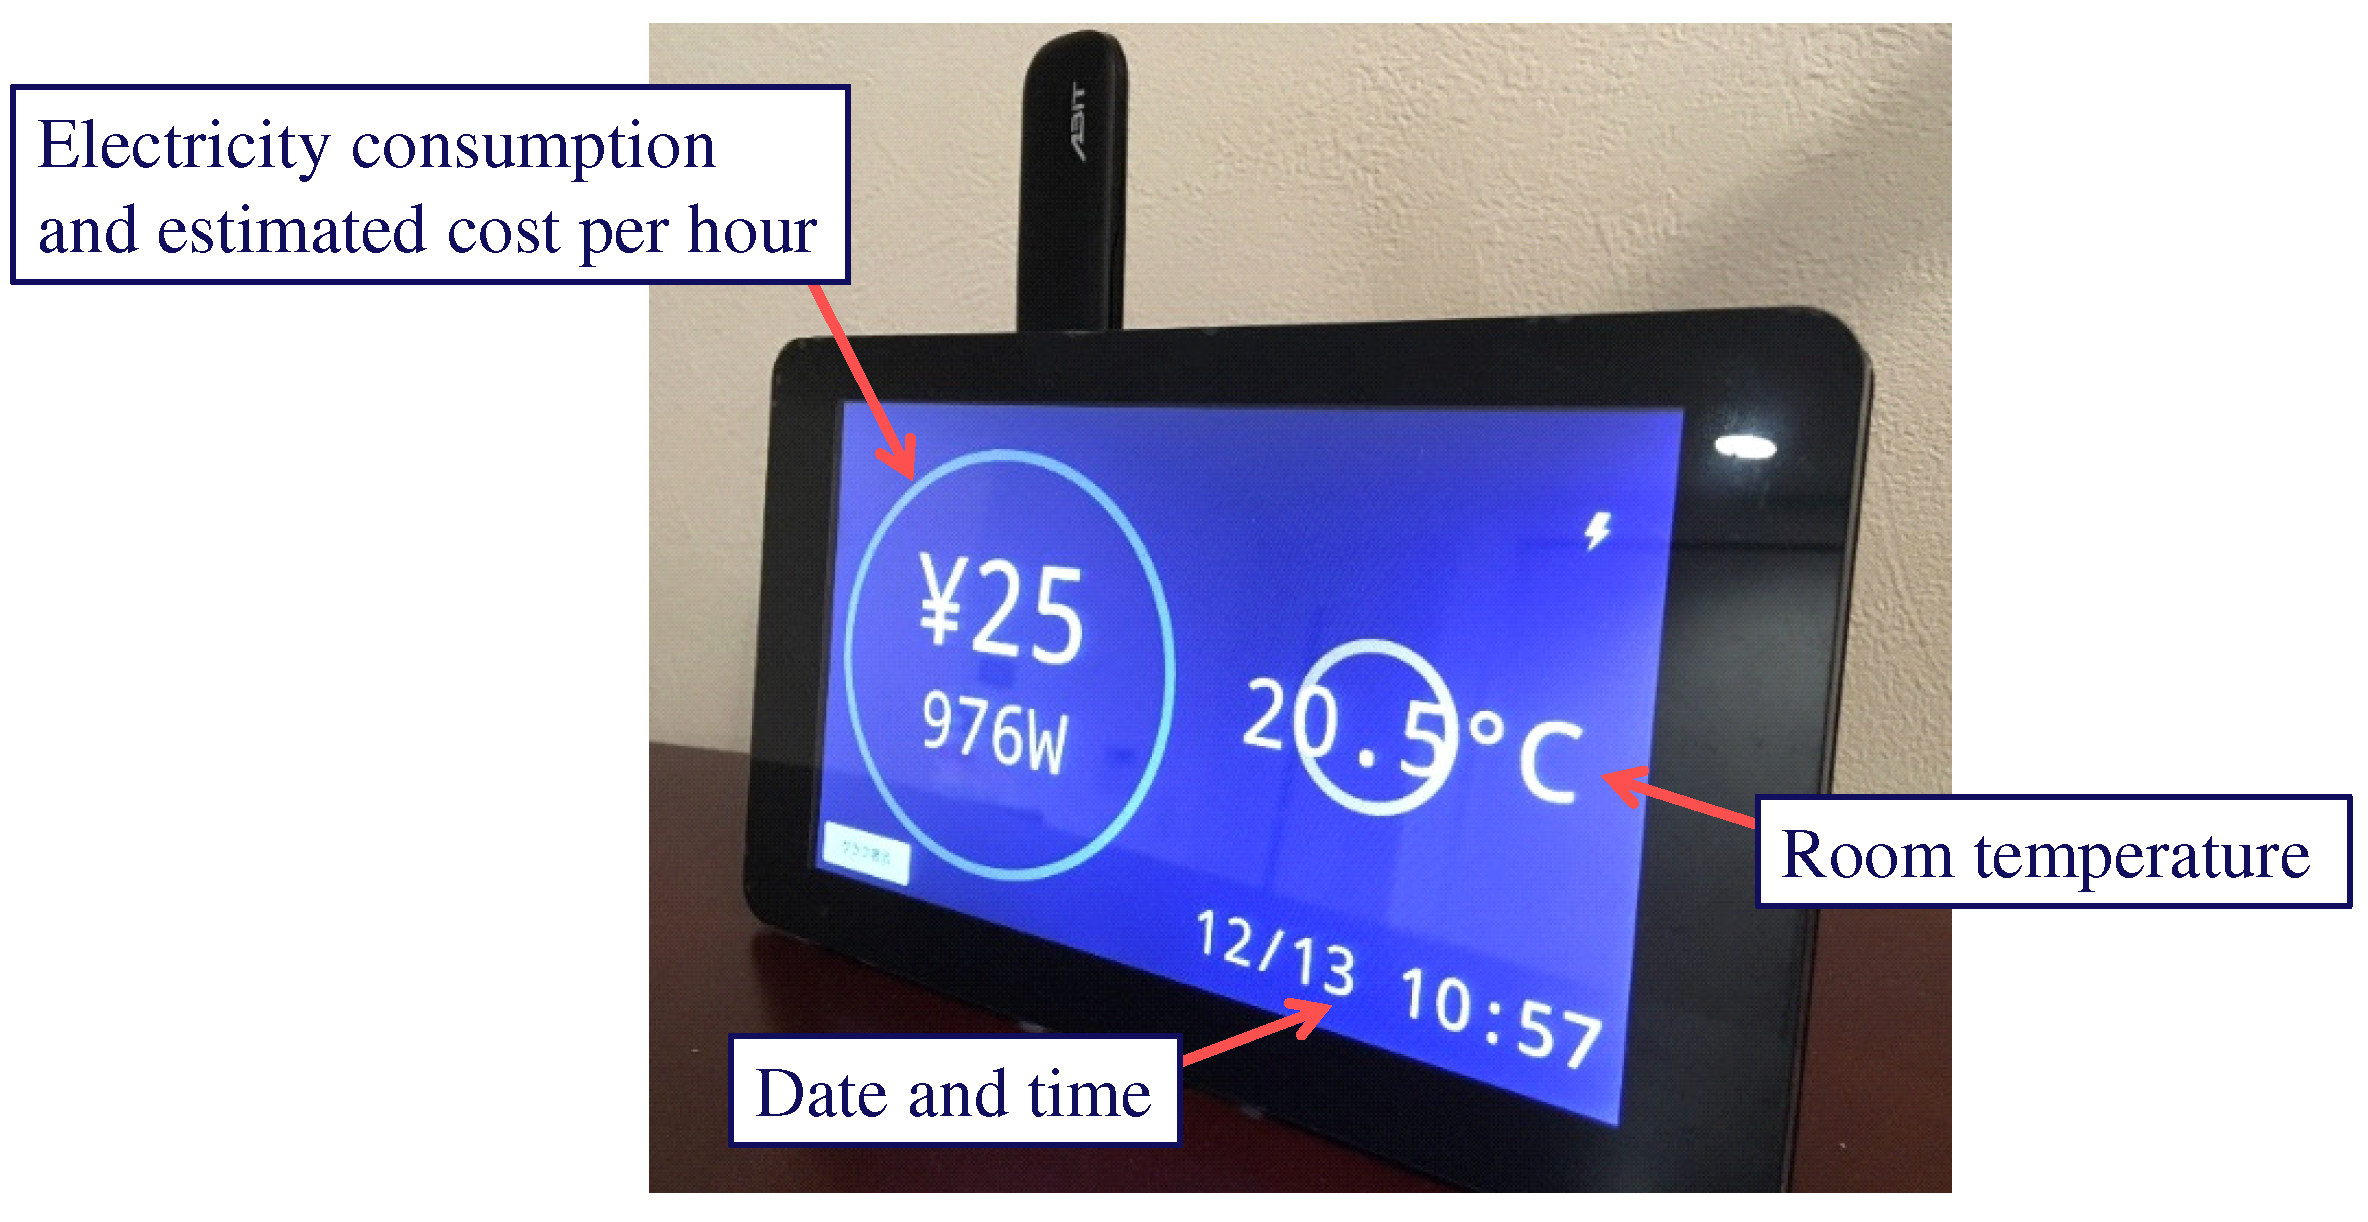
3.1. In-home Sensing with IoT Sensors

The requirements for realizing in-home observation by IoT sensors are described in this section. In the proposed method, IoT sensors substitute the existing observation methods conducted by human observers. This enables exhaustive observation involving many households for longer periods of time due to the decrease in both the costs of the investigation and the impact on the observed people. The following are the main two requirements necessary to the realization of in-home observation employing IoT sensors:
  • The capacity for in-home sensing for extended periods.
  • The ability to monitor the necessary and sufficient activities at a low cost.
Users’ in-home barriers and needs are generally related to habitual behavior and households conditions [29]. Activities observed by existing methods are limited to the those that occur during the investigation period because of the difficulties of short-term observation in grasping habitual behaviors.
Low cost monitoring is another important requirement because it enables comprehensive observation involving larger numbers of households. The greater the number of sensors employed, the more activities can be monitored in general terms. However, there are some disadvantages in terms of monitoring cost, invasion of privacy and feasibility (e.g., troubles with instrument faultiness and missing data).
Some products that fulfill these requirements, such as the Netatmo Weather Station (Netatmo Weather Station—https://www.netatmo.com/en-row/weather/weatherstation/ (Accessed 5 November 2019)) and Openblocks (Openblocks—https://www.plathome.com/products/openblocks-\iot-vx2/ (Accessed 5 November 2019)) , are currently available. It is important to either select an appropriate product or develop a sensor kit depending on cost and sensor-type data limitations.

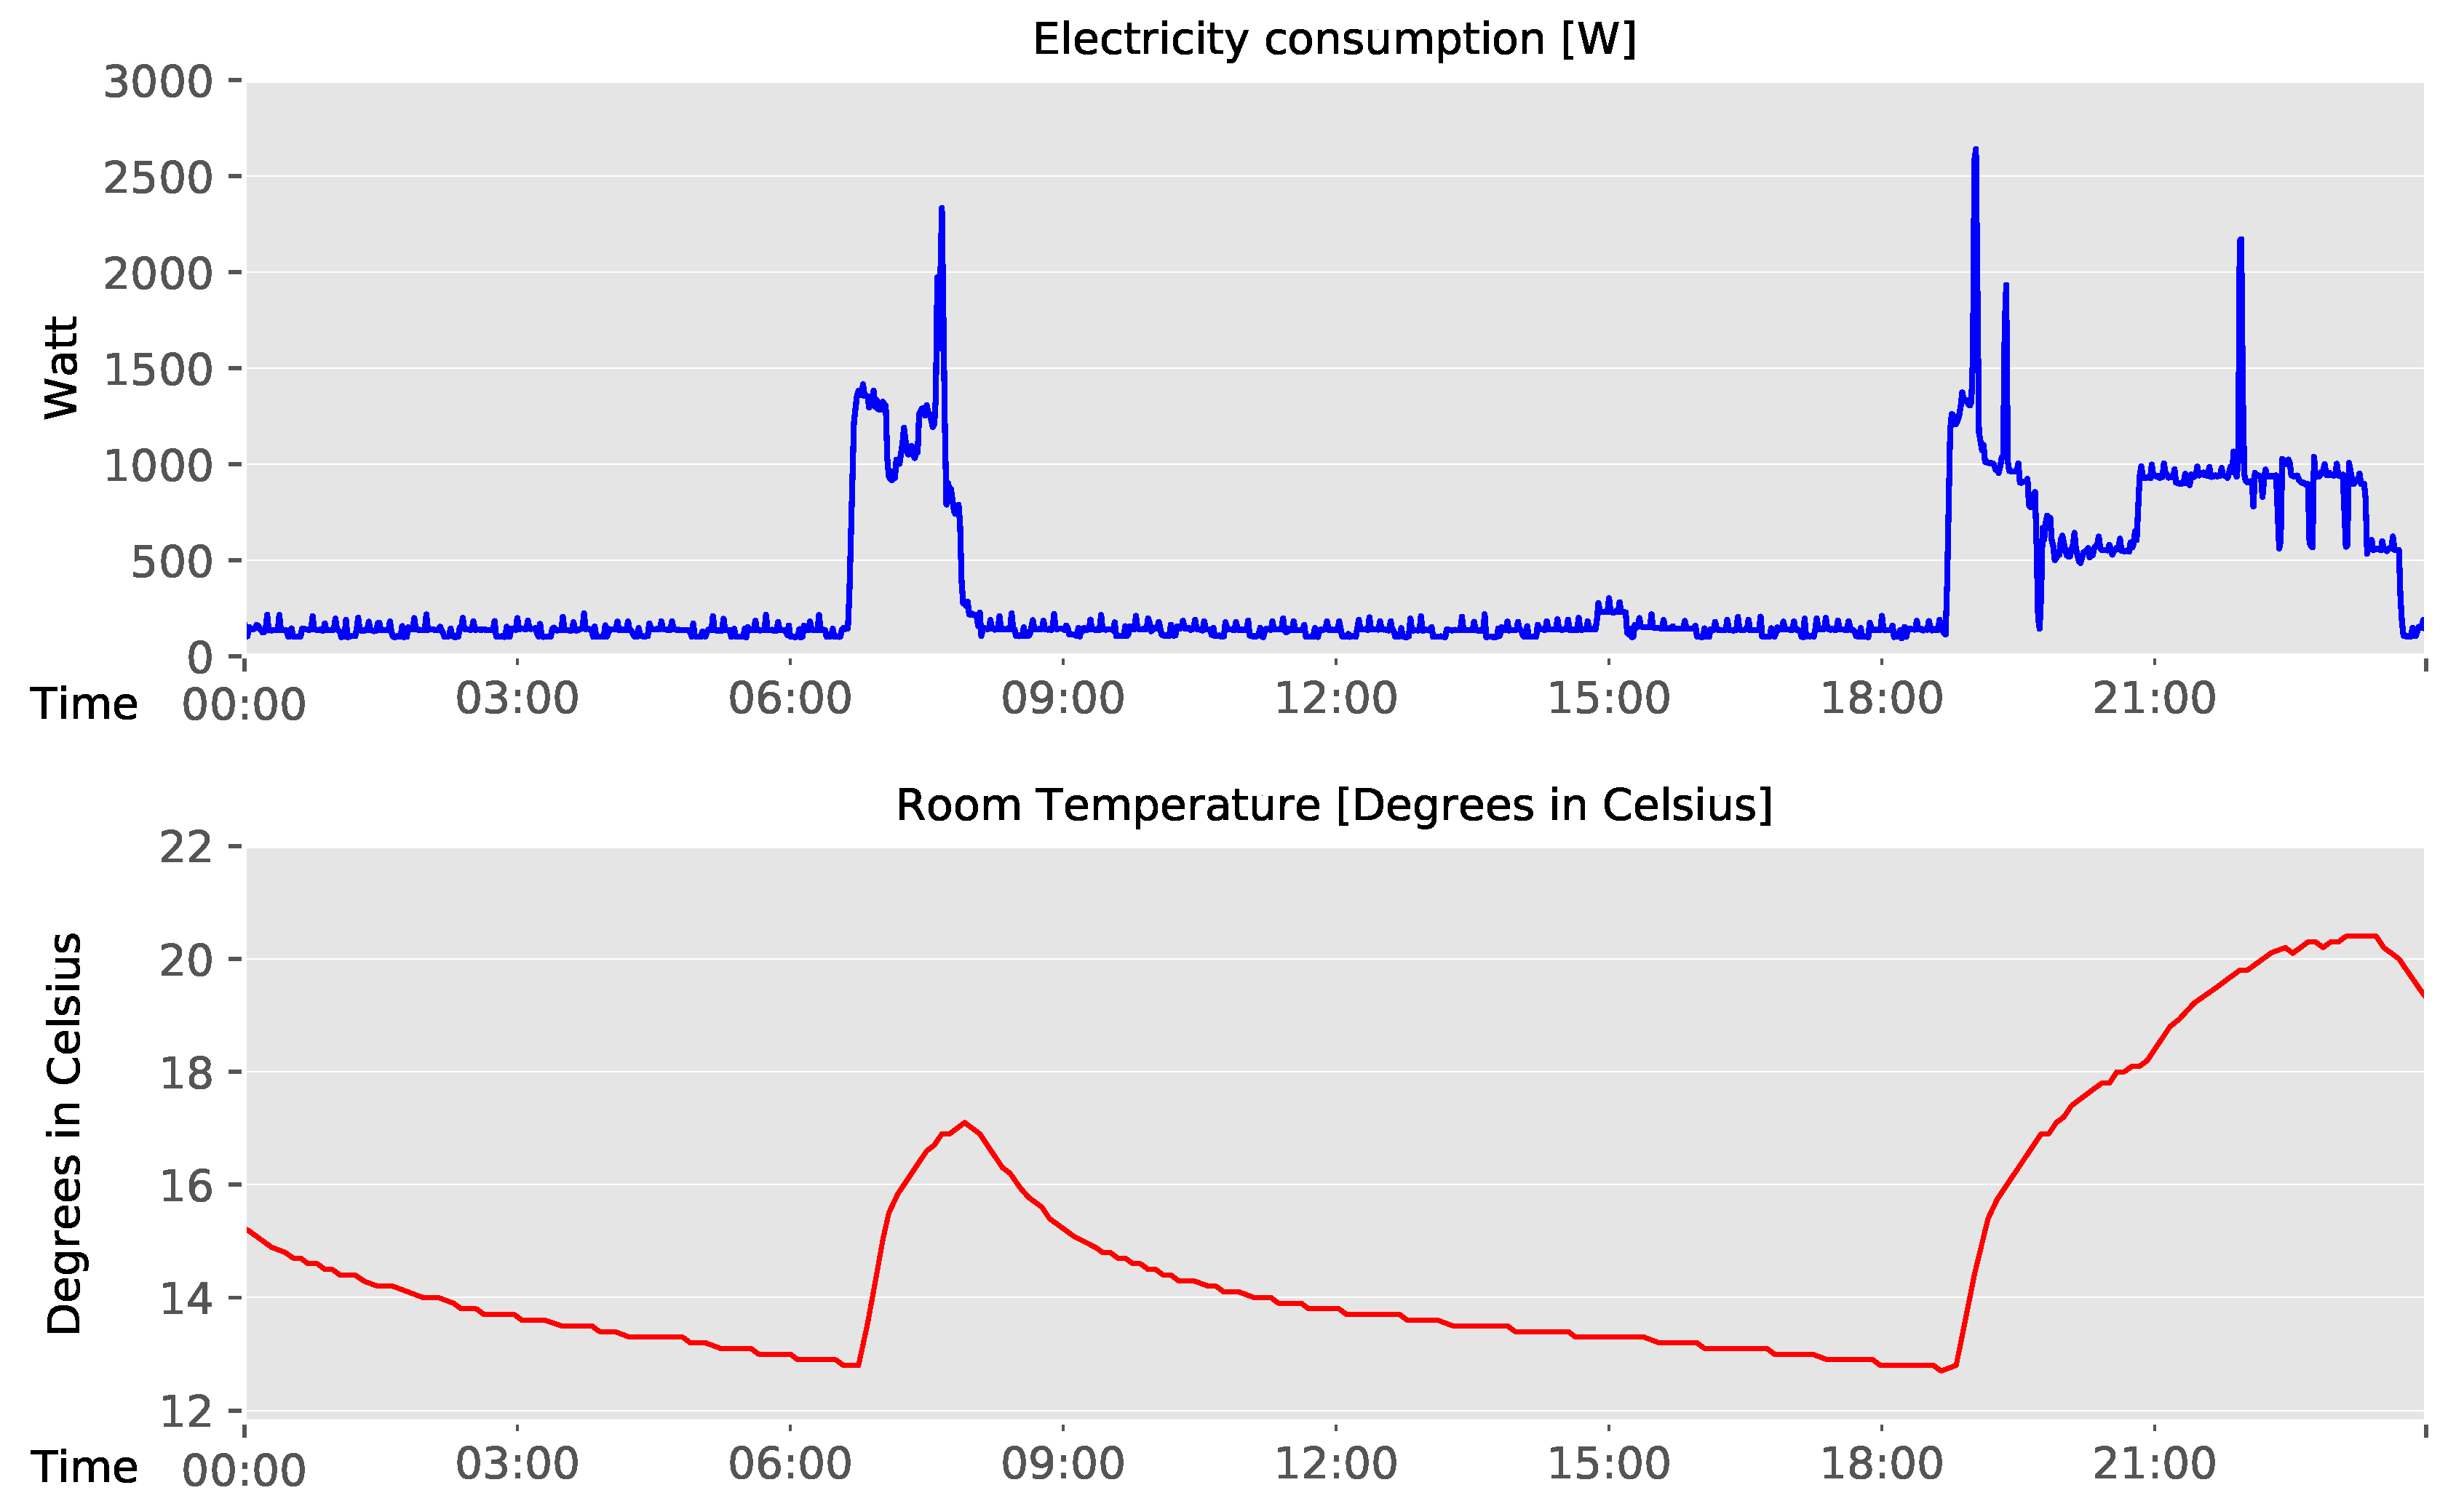
3.2. Visualization of Sensor Data

Sensor data measured in Section 3.1 is visualized according to the guidelines described in this section. Visualized sensor data is utilized in summarizing both in-home activities and corresponding in-depth interviews. The requirements of visualizing sensor data are shown below:
  • The ability to grasp the general activities of daily living.
  • The ability to grasp the usage of home appliances related to in-home activities.
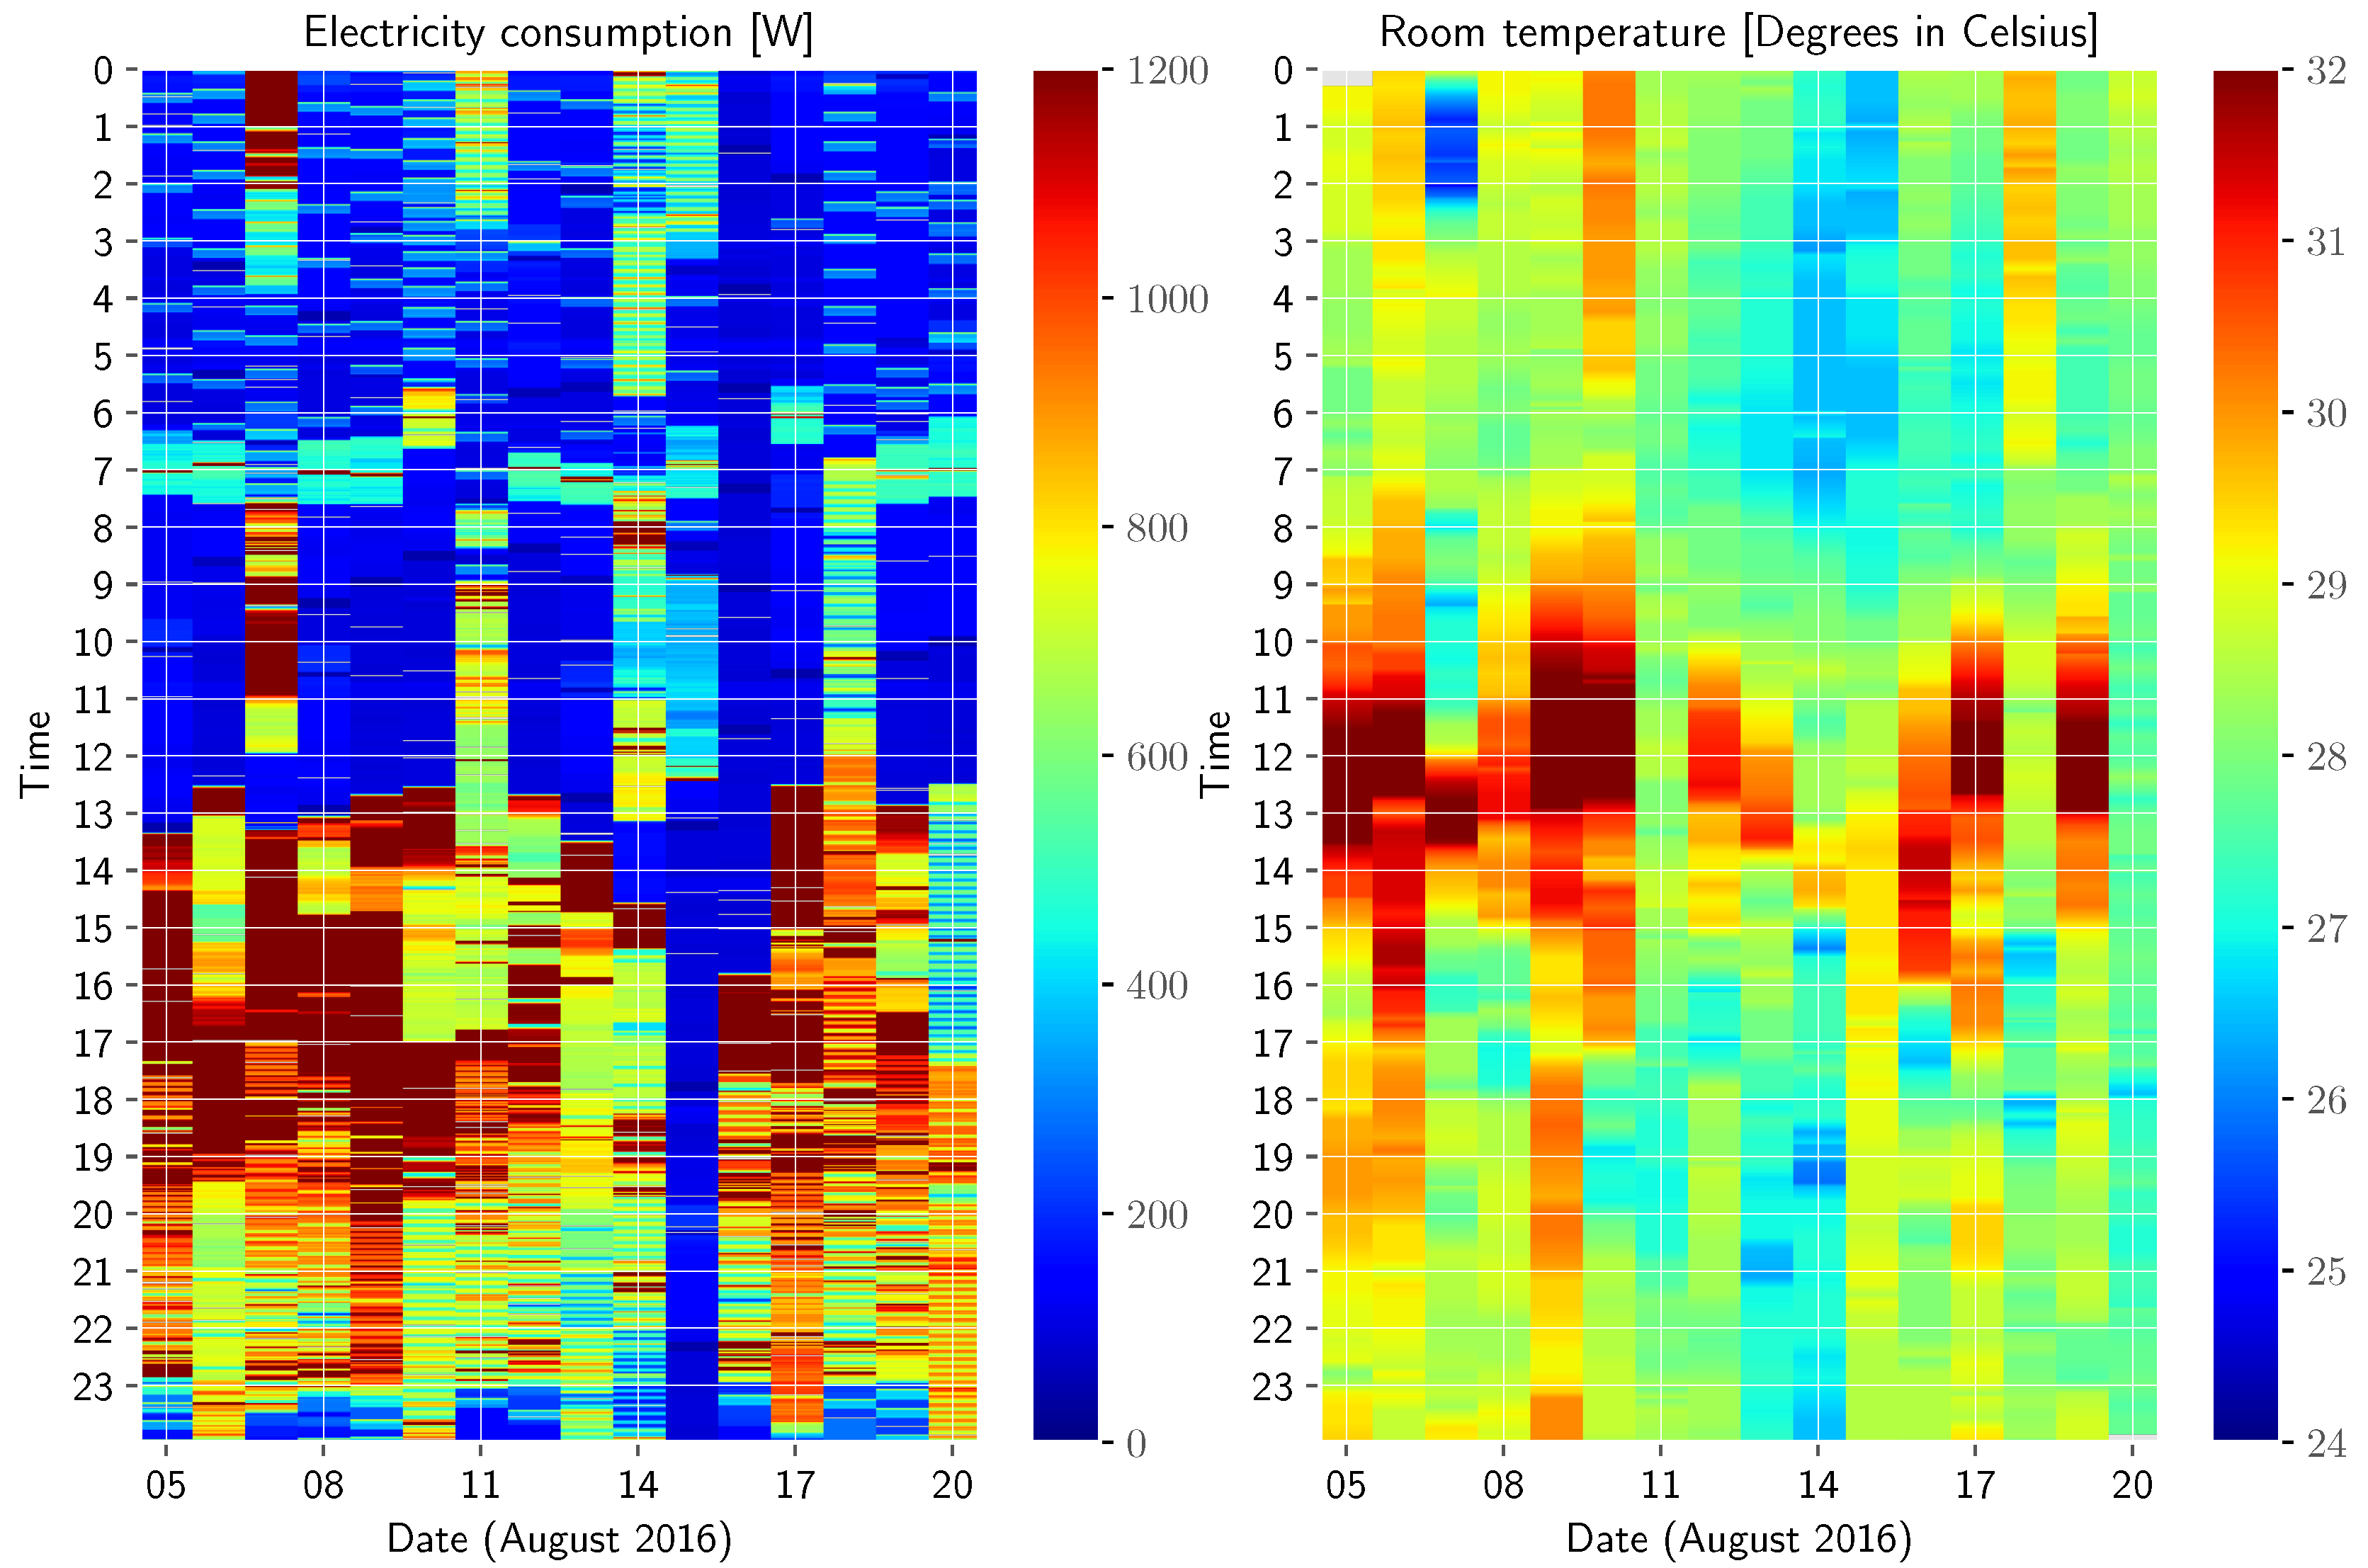
  • The ability to grasp habitual behaviors and their changes.
Two examples of visualization are shown in Figure 1 and Figure 2. Figure 1 shows line graphs that visualize one day’s electricity consumption and room temperature in a living room. In this example, electricity consumption rose just before 7 a.m., fell at 8 a.m. and rose again at 7 p.m. This data shows general activities (related to the above requirement 1), implying that an occupant in this household got up at 7 a.m., went out at 8 a.m. and came home at 7 p.m.
In addition, the usage of home appliances related to activities can be assumed (requirement 2); for example when occupants got up and moved to the living room, it is possible to assume that they used some kind of electric heater or air conditioner. This is indicated by the simultaneous rise of electricity consumption and room temperature, as measured in winter. The usage of other appliances such as microwaves, electric kettles or induction heating (IH) cookers can also be supposed based on the impulsive peak rise of electricity consumption of over 2000 W.
Figure 2 shows heatmaps that visualize electricity consumption and room temperature over a period of 16 days. A heatmap visualization enables one to overview the results of long-term monitoring. This visualization also enables one to grasp habitual behaviors and activities that deviate from it (requirement 3). Here is the example of habitual behaviors and activities that can be derived from Figure 2:
  • Getting up at approximately 6 a.m. and going out at approximately 7:30.
  • Air conditioning is usually turned off in the morning because electricity consumption is small and temperature changes slowly.
  • The room is occupied every few days from 8 to 12 a.m. and air conditioning is used when it is occupied.
  • Air conditioning is usually used after coming home around 1 p.m.
  • Usually going to bed around 11 p.m.
  • Small and short-term rise in electricity consumption is sequentially iterated from 0 to 6 a.m.
  • Electricity consumption during midnight occasionally remains high and room temperature remains low (e.g., 7 August).
In activity 6, an air conditioner in other room is assumed to be used based on the waveform of electricity consumption. Although room type is not specified in this case, it is very possible that this usage occurs in the bedroom. Activity 7 is an example of an activity that deviates from habitual behavior. While it is possible to suppose that this activity is the use of an air conditioner in the living room, the details and reasons for this activity are unknown. In-depth interviews as described in the next section, can contributes to the specification of such activities and the reason for their occurrence.

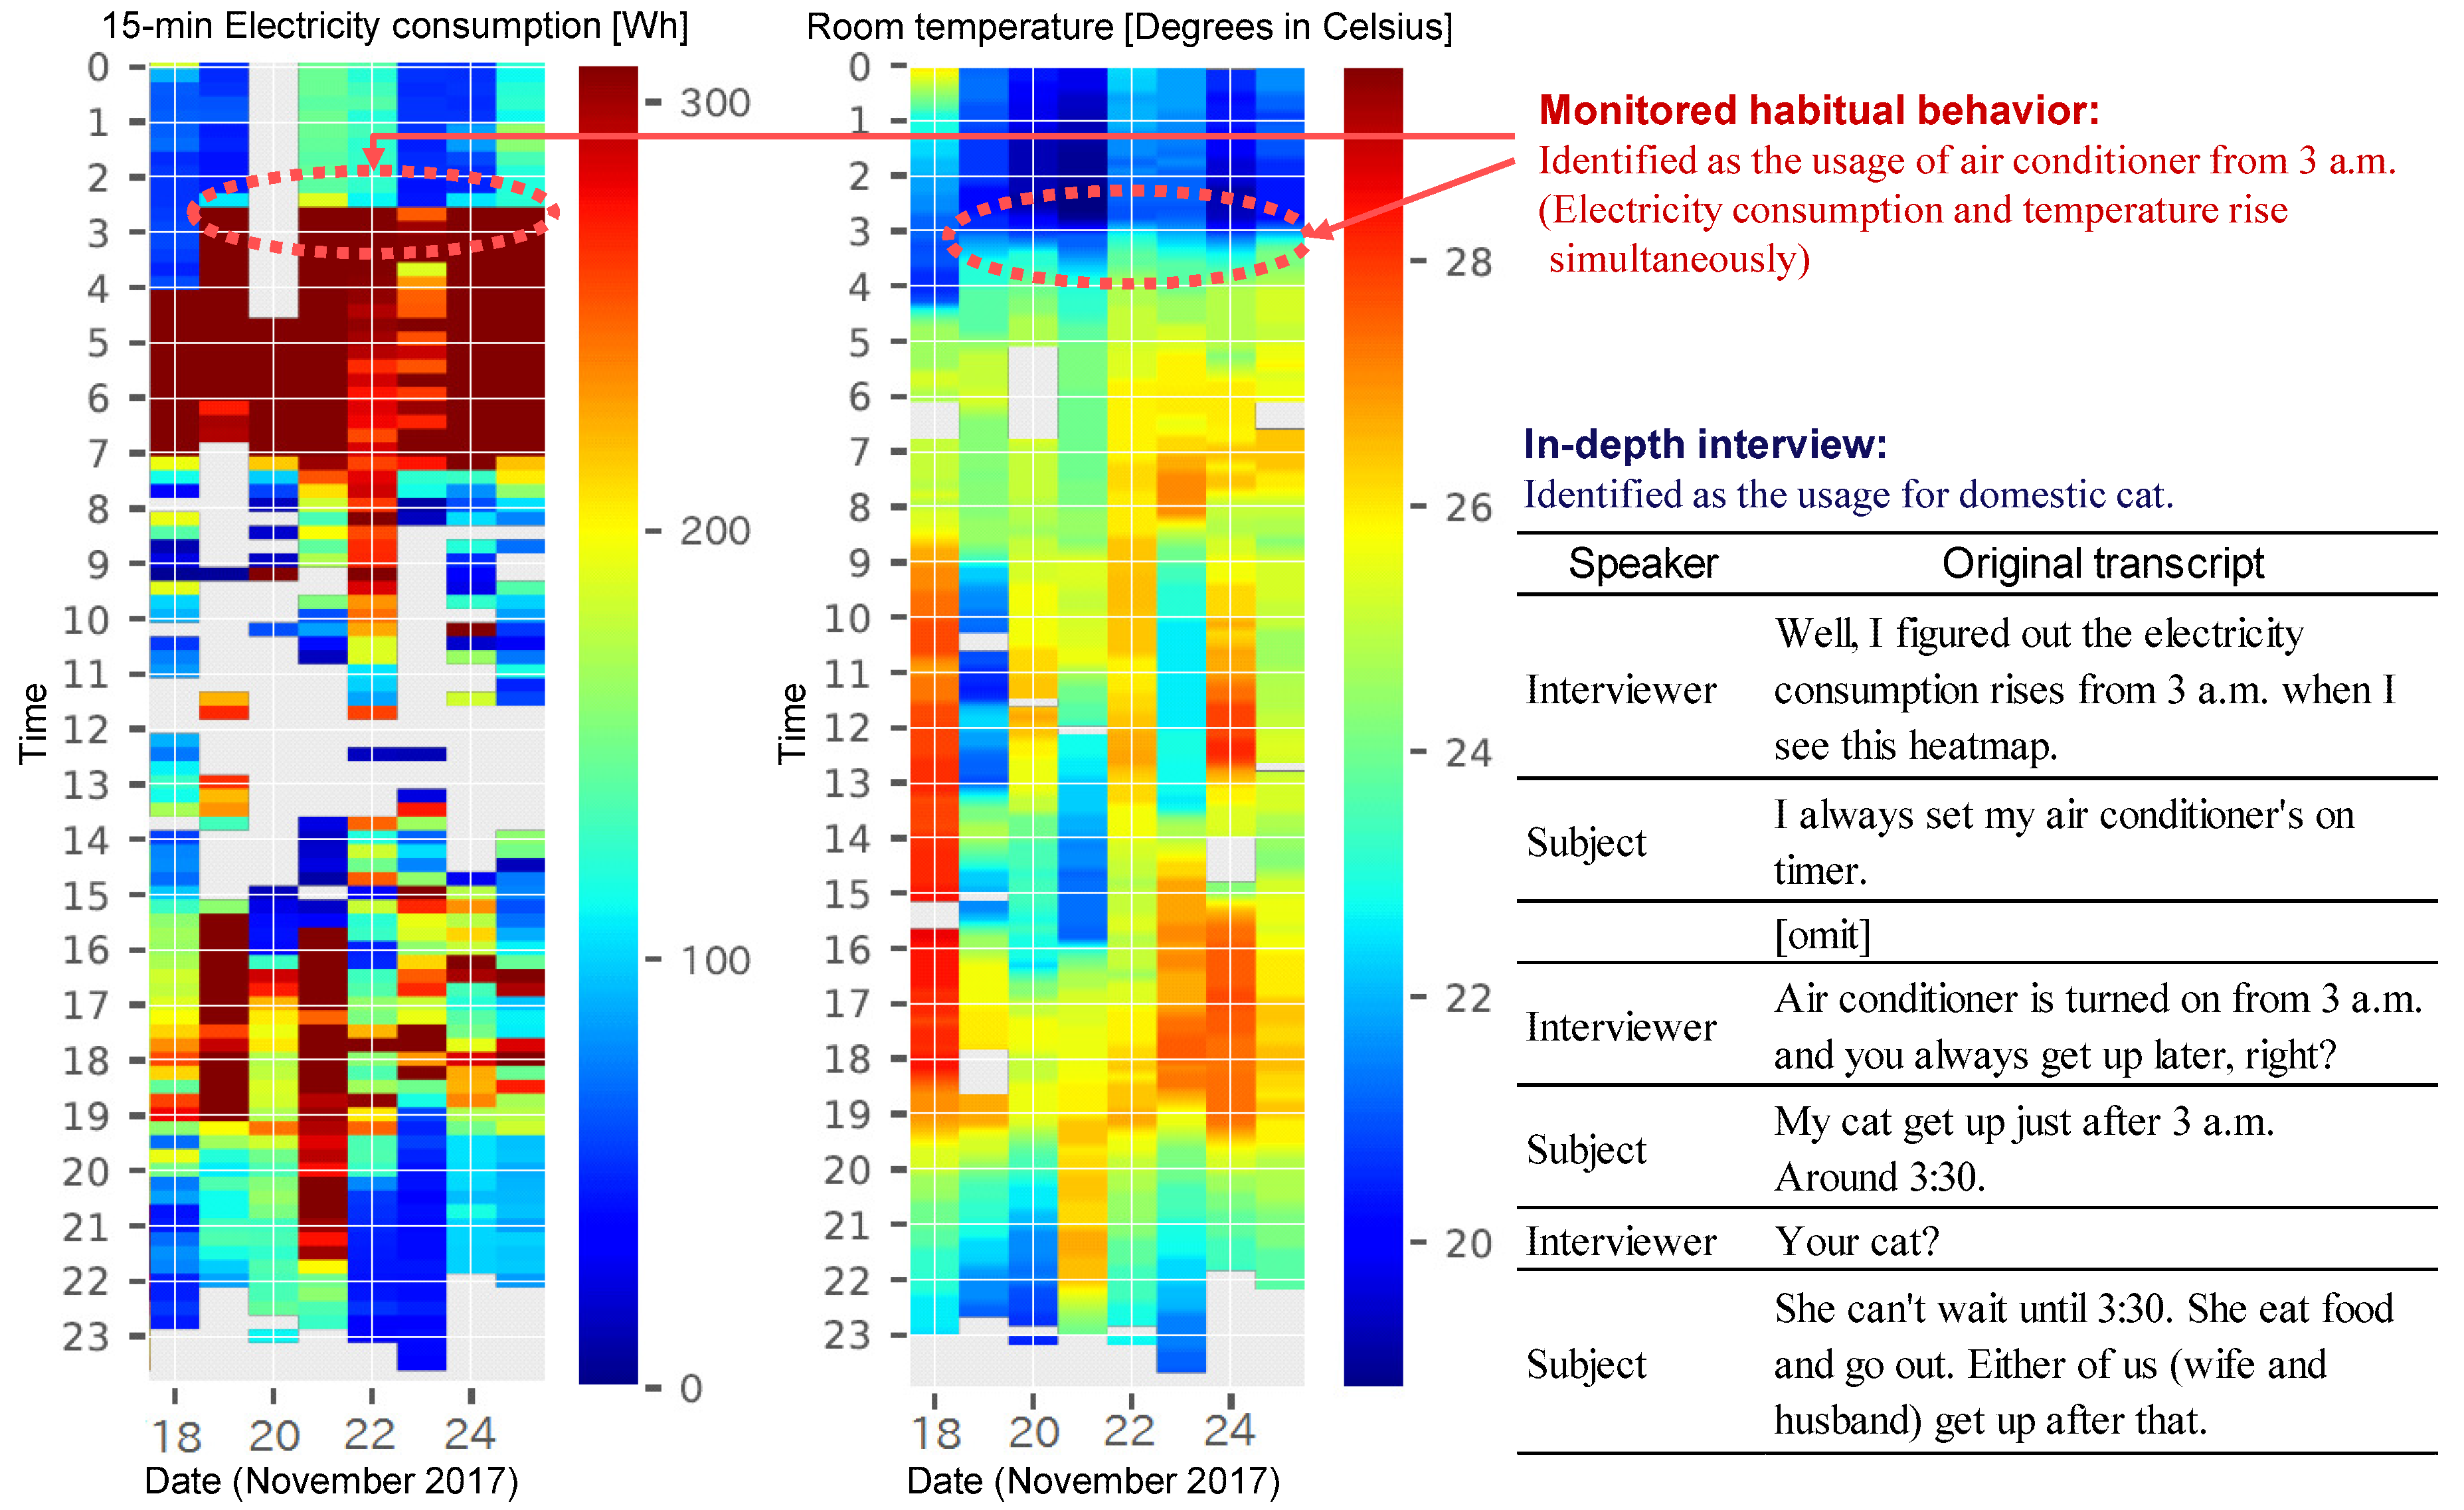
3.3. In-depth Interview

In-depth interviews are conducted for the purpose of specifying activities, finding out the reasons for these activities, as well as to grasp the user’s barriers by using visualized sensor data shown in Section 3.2.
Table 1 shows the comparison between existing human-based and proposed sensor-based observation method. As some existing research [12,13,14] has demonstrated in-home activities and their intentions can be more readily derived from interviews that rely on the assistance of subjective information based on interviewer’s cognitive ability. However, the scope of observation is limited to short-term periods with fewer households because of the significant privacy impacts on the observed people. The cost for observations is another obstacle because existing approaches require skilled observers who have some expertise in in-home energy saving activities. As shown in “1. Cost of observation” and “2. Impact on observed people” in Table 1, the proposed method replaces human-based subjective information with sensor-based monitoring; thus enabling the reduction not only of observations and analysis costs but also in terms of the impact on the observed people. Therefore, the proposed method employing IoT sensors has an advantage in realizing long-term behavioral observation targeting a larger number of households.
Whereas existing human-based methods have an advantage in terms of grasping all visible activities as shown in, “3. Characteristics of gained knowledge from observation” in Table 1, the quality of any gained knowledge depends on observer’s skill, which involves subjective determinations. Moreover, it is difficult to conduct long-term observations because of the cost and the burden on the observed person. Although the proposed method realizes long-term observations, as previously mentioned, the knowledge obtained through it is limited to activities related to sensors. Furthermore, questions for in-depth interviews can be prepared in advance by using the visualized sensor data; as a result, this method leads to more efficient and effective interviews.
Thus, the combination of in-home sensing with IoT sensors, data visualization and in-depth interviews is an appropriate approach to realize exhaustive in-home observations. Note that this method is feasible to the observation targeting in-home behaviors; existing methods remain suitable for public spaces or for conducting narrow but deep observations that require a human observer’s cognitive ability.

4. Experiments

In-home behavioral observations were conducted with the proposed method described in Section 3. The experiments were conducted with the aim of investigating barriers regarding in-home energy saving activities in order to develop effective information provision methods.

4.1. Outline of Experiments

A sensor kit, shown in Figure 3, was developed for the experiments. The kit supports the use of only the required electricity consumption and room temperature sensors. It is important to note that saving on implementation costs and reducing troubles with sensors and other components affected the feasibility of some experiments.
The kit also supported a display that indicated measured values in real-time as shown in Figure 3. Although the display is regarded as a kind of information provision, it was determined that it might influence subjects’ in-home activities. As such, the following advantages were assumed to outweigh any potential disadvantages: First, valuable comments regarding energy saving activities could be derived from users’ reactions to the display. Second, the display helped subjects understand the characteristics of sensor data and contributed to enhancing the quality of in-depth interviews. Third, it also contributed to increasing the transparency of the experiments, helping subjects comprehend the relevant implications of the study by clearly understanding what kind of data the kit monitored.
In the experiments, twenty lead users [30] were selected as subjects from among environmentally conscious people so that demographic attributes, such as income scale, types of houses, occupation and so forth were equally distributed. In-home sensing was conducted at each subject’s household for six weeks from November to December 2017 and the resulting sensor data were visualized for subsequent in-depth interviews; each interview took approximately two hours and was conducted on a one on one basis as follows.
  • After specifying the objective of the study and the duration of the interview, the subject signed an agreement form if he/she agrees with the scope of the study.
  • The interviewer then received several assignments consisting of drawing their household layout, listing their owned appliances and then questioning about them.
  • Subjects were then asked to fill out the check sheet regarding energy saving activities and answer questions about their regular energy saving activities.
  • Questions were then asked regarding daily activities and barriers for energy saving while showing visualized sensor data (see Figure 1 and Figure 2).
In the check sheet shown in step 3, twenty-three energy saving activities regarding air conditioners, refrigerators, cookware, water heaters, lighting and TVs were listed based on an existing survey [8] that was conducted by the Tokyo Metropolitan Government in Japan.

4.2. Investigation of Barriers regarding Energy Saving Activities

In-depth interviews with visualized sensor data were conducted and various habitual behaviors including appliance usage were extracted. Table 2 shows the extracted and categorized barriers regarding energy saving activities. The barriers were organized into ten categories and each category was listed along with the reason as to why subjects could not partake in energy saving activities. Any related comments from interviews were also listed here.
These results show that barriers depend on each subject and household even when the same type of appliance was used. For example, in the category 3 in Table 2, the subjects’ physical states were the main barrier in reducing air conditioning usage. In contrast, in the category 6, subjects’ pets were found to be the barrier against the same activity. In the same way, different barriers such as conservation and safety regarding lighting were determined in categories 1 and 9.
Results also showed that there could be different cognitive processes behind the same conclusions. A number of subjects mentioned reasons as to why they could not take energy saving measures such as “It’s such a hassle” or “It’s troublesome” in the in-depth interviews. These comments were often attributed to multiple reasons despite being generally the same in substance. In one example from the results, a subject mentioned that the reason for keeping the electric toilet seat on was that it was “such a hassle” to turn on and off. The implication of this comment was literally that the action was troublesome work for the subject. By contrast, another subject at first kept a water heater off when it was not being used and later came to regard this action as troublesome as well, as the subject frequently forgot it was turned off and wondered why it did not work. These examples show the variety of barriers that prevent occupants from taking energy saving measures in households.
Figure 4 shows the resulting combination of observations and in-depth interviews to illustrate habitual behavior. It can be assumed with the heatmaps in Figure 4 that an air conditioner in the living room was used from 3 a.m. onward almost every day in this household, as these demonstrate that electricity consumption and room temperature rose simultaneously. In the in-depth interview, this usage was identified as necessary not for the occupants but for a domestic cat. The cat always got up early and went out around 3:30 after eating its breakfast; the subject therefore used the air conditioner in the living room with its timer every day. This activity was extracted and identified thanks to the employment of the long-term observation from the proposed method.

4.3. Discussion

The experiments described in this study showed that long-term observations of a number of target households was realized based on a combination of in-home sensing, data visualization and in-depth interviews. Thus, when an investigation targeting actual households is conducted, the proposed method employing IoT sensors can be a privacy-considerate approach as it has a relatively low impact on the person being observed compared to existing methods utilizing human observers. Long-term observation is therefore feasible and habitual behaviors such as the example in Figure 4 can be extracted.
In addition, the experiments targeting a number of households also achieved exhaustive in-home observations thanks to low-cost monitoring with IoT sensors. In the experiments, the minimum necessary sensors, those measuring electricity consumption and room temperature, were employed. This contributed to the realization of feasible, low-cost observations; the developed sensor kit costs approximately USD $450 per unit. As shown in Table 2, the extracted and categorized barriers varied according to households and appliances. It is difficult to cover such habitual behaviors if short-term observations are conducted for fewer households; long-term observations targeting more households brought about the results shown in this section.
Furthermore, 19 of 20 subjects answered in interviews that they routinely viewed the display of the sensor kit shown in Figure 3. In addition, the display was viewed not just by subjects but also by their families. In particular, the teenage children present in certain household were interested in the display and brought up the subject with their parents. Thus, this result suggests that the display accelerated communication and influenced the education of minors regarding energy saving activities. Thus, experiments that focus on the information provided by real-time sensor data could also be promising.

5. Conclusions

This paper proposed an in-home behavioral observation method employing IoT sensors. The proposed method consists of in-home sensing with IoT sensors, visualization of sensor data and in-depth interviews. Observations for investigating the barriers regarding energy saving activities were conducted for twenty households over six weeks and then in-depth interviews with visualized sensor data were conducted. The resulting long-term observations with the number of targeted households were due to the low costs of observation and the relatively small impact on the observed persons. The barriers were extracted and organized into ten categories that showed that every subject and household had their own barriers and that these could be the result of different cognitive processes despite being related to the same activities.
The results also suggested that real-time information provision could have a positive impact on people, especially on teenage children in terms of education and behavioral changes. Future work could include the investigation of the influence by real-time information provision and the improvement of behavioral change programs that can have a positive impact on in-home energy saving activities.

Author Contributions

Conceptualization, S.H. and T.M.; Methodology, S.H. and T.M.; Investigation, S.H., T.M., R.I. and D.S.; Software, S.H. and T.M.; Data Curation, S.H., T.M., R.I. and D.S.; Formal Analysis, S.H., T.M., R.I. and D.S.; Visualization, S.H. and T.M.; Validation, S.H., T.M., R.I. and D.S.; Writing-Original Draft Preparation, S.H.; Writing-Review & Editing, S.H., T.M., R.I. and D.S.; Project Administration, T.M.; Funding Acquisition, S.H. and T.M.

Funding

This research was funded by the Ministry of the Environment, Government of Japan.

Acknowledgments

This research was supported by Deloitte Tohmatsu Consulting LLC and Toppan Printing Co., Ltd. We would also like to thank Editage (www.editage.com) for English language editing.

References

  1. Allcott, H. Social norms and energy conservation. J. Public Econ. 2011, 95, 1082–1095. [Google Scholar] [CrossRef]
  2. Komatsu, H.; Nishio, K. An experimental study on motivational change for electricity conservation by normative messages Appl. Energy 2015, 158, 35–43. [Google Scholar] [CrossRef]
  3. Ehrhardt-Martinez, K.K.; Donnelly, A.; Laitner, S.; Advanced metering initiatives and residential feedback programs: A meta-review for household electricity-saving opportunities. American Council for an Energy-Efficient Economy. 2010. Available online: https://www.smartgrid.gov/files/ami_initiatives_aceee.pdf (accessed on 5 November 2019).
  4. Armel, K.C.; Gupta, A.; Shrimali, G.; Albert, A. Is disaggregation the holy grail of energy efficiency? The case of electricity. Energy Policy 2010, 52, 213–234. [Google Scholar] [CrossRef]
  5. Niemeyer, S. Consumer voices: Adoption of residential energy-efficient practices. Int. J. Consum. Stud. 2010, 34, 140–145. [Google Scholar] [CrossRef]
  6. Beillan, V.; Battaglini, E.; Goater, A.; Huber, A.; Mayer, I.; Barriers and drivers to energy-efficient renovation in the residential sector: Empirical findings from five European countries. ECEEE Report. 2011. Available online: https://www.eceee.org/library/conference_proceedings/eceee_Summer_Studies/2011/5-saving-\energy-in-buildings-the-time-to-act-is-now/barriers-and-drivers-to-energy-efficient-renovation-in-the-\residential-sector-empirical-findings-from-five-european-countries/ (accessed on 5 November 2019).
  7. Tuominen, P.; Klobut, K.; Tolman, A.; Adjei, A.; Best-Waldhober, M. Energy savings potential in buildings and overcoming market barriers in member states of the European Union. Energy Build. 2012, 51, 48–55. [Google Scholar] [CrossRef]
  8. Tokyo Metropolitan Government. Survey on Barriers Regarding Energy Saving Activities in Residential Sector; written in Japanese. 2015. Available online: https://www.tokyo-co2down.jp/action/behavioral_inhibition/ (accessed on 5 November 2019).
  9. Hartmann, D.P.; Barrios, B.A.; Wood, D.D. Principles of behavioral observation. Compr. Handb. Psychol. Assess. 2003, 3, 108–127. [Google Scholar]
  10. Brown, T. Change by Design: How Design Thinking Transforms Organizations and Inspires Innovation; HarperBusiness: New York, NY, USA, 2009; ISBN 978-0061766084. [Google Scholar]
  11. Abras, C.; Maloney-Krichmar, D.; Preece, J. User-centered design. In Bainbridge W. Encyclopedia of Human-Computer Interaction; Sage Publications: Thousand Oaks, CA, USA, 2004; Volume 37. [Google Scholar]
  12. Katz-Buonincontro, J.; Anderson, R.C. How do we get from good to great? The need for better observation studies of creativity in education. Front. Psychol. 2018, 9, 39–48. [Google Scholar] [CrossRef] [PubMed]
  13. Meyer, A.A.; Lederman, N.G. Inventing creativity: An exploration of the pedagogy of ingenuity in science classrooms. Sch. Sci. Math. 2013, 113, 400–409. [Google Scholar] [CrossRef]
  14. Eysenbach, G.; Köhler, C. How do consumers search for and appraise health information on the world wide web? Qualitative study using focus groups, usability tests, and in-depth interviews. BMJ 2002, 324, 573–577. [Google Scholar] [CrossRef] [PubMed]
  15. Geertz, C. Thick description: Toward an interpretive theory of culture. In The Cultural Geography Reader; Routledge: Abingdon, UK, 1973; pp. 41–51. [Google Scholar]
  16. Singler, E.; Waintrop, F.; Bordenave, R.; Bressoud, E.; French Government: Nudge Me Tender: How to Turn Ethnographic Insight Into More Efficient Policy-Making. ESOMAR Congress. 2014. Available online: https://www.warc.com/content/paywall/article/french_government_nudge_me_tender__how_to_turn_ethnographic_insight_into_more_efficient_policymaking/102656 (accessed on 5 November 2019).
  17. Thaler, R.H.; Sunstein, C.R. Nudge: Improving Decisions About Health, Wealth, and Happiness; Yale University Press: New Haven, CT, USA, 2008; ISBN 978-0-14-311526-7. [Google Scholar]
  18. Rashidi, P.; Mihailidis, A. A survey on ambient-assisted living tools for older adults. IEEE J. Biomed. Health Inform. 2013, 17, 579–590. [Google Scholar] [CrossRef] [PubMed]
  19. Dey, N.; Ashour, A.S.; Shi, F.; Fong, S.J.; Sherratt, R.S. Developing residential wireless sensor networks for ECG healthcare monitoring. IEEE Trans. Consum. Electron. 2017, 63, 442–449. [Google Scholar] [CrossRef]
  20. Krupitzer, C.; Sztyler, T.; Edinger, J.; Breitbach, M.; Stuckenschmidt, H.; Becker, C. Hips do lie! A position-aware mobile fall detection system. In Proceedings of the IEEE International Conference on Pervasive Computing and Communications, Athens, Greece, 19–23 March 2018; pp. 1–10. [Google Scholar] [CrossRef]
  21. George, G.; Ihle, H.; Miura, W.; Electricity Market Reform in Japan. Public Utilities Fortnightly. pp. 18–25. 2016. Available online: https://www.nera.com/content/dam/nera/publications/2016/PUF_Article_1_2016.08.pdf (accessed on 5 November 2019).
  22. Nomura, K.; Kashiwagi, T.; Yamashita, T.; Kawade, T. Solution to utilization of smart meter data. Fujitsu Sci. Tech. J. 2014, 50, 58–66. Available online: https://www.fujitsu.com/global/documents/about/resources/\publications/fstj/archives/vol50-2/paper07.pdf (accessed on 5 November 2019).
  23. Molina-Markham, A.; Shenoy, P.; Fu, K.; Cecchet, E.; Irwin, D. Private memoirs of a smart meter. In Proceedings of the 2nd ACM Workshop on Embedded Sensing Systems for Energy-efficiency in Buildings, Zurich, Switzerland, 2 November 2010; pp. 61–66. [Google Scholar] [CrossRef]
  24. Kleiminger, W.; Beckel, C.; Santini, S. Household occupancy monitoring using electricity meters, In Proceedings of the 2015 ACM International Joint Conference on Pervasive and Ubiquitous Computing, Osaka, Japan, 7–11 September 2015; pp. 975–986. [Google Scholar] [CrossRef]
  25. Hattori, S.; Shinohara, Y. Actual consumption estimation algorithm for occupancy detection using low resolution smart meter data. In Proceedings of the 6th International Conference on Sensor Networks, Porto, Portugal, 9–11 February 2017; pp. 39–48. [Google Scholar] [CrossRef]
  26. Zoha, A.; Gluhak, A.; Imran, M. A.; Rajasegarar, S. Non-intrusive load monitoring approaches for disaggregated energy sensing: A survey. Sensors 2012, 12, 16838–16866. [Google Scholar] [CrossRef] [PubMed]
  27. Froehlich, J.; Larson, E.; Gupta, S.; Cohn, G.; Reynolds, M.; Patel, S. Disaggregated end-use energy sensing for the smart grid. IEEE Pervasive Comput. 2011, 10, 28–39. [Google Scholar] [CrossRef]
  28. Batra, N.; Kelly, J.; Parson, O.; Dutta, H.; Knottenbelt, W.; Rogers, A.; Singh, A.; Srivastava, M. NILMTK: An open source toolkit for non-intrusive load monitoring. In Proceedings of the 5th International Conference on Future Energy Systems, Cambridge, UK, 11–13 June 2014; pp. 265–276. [Google Scholar] [CrossRef]
  29. Kurz, T.; Gardner, B.; Verplanken, B.; Abraham, C. Habitual behaviors or patterns of practice? Explaining and changing repetitive climate-relevant actions. Wiley Interdiscip. Rev. Clim. Chang. 2015, 6, 113–128. [Google Scholar] [CrossRef]
  30. Urban, G.L.; Von Hippel, E. Lead user analyses for the development of new industrial products. Manag. Sci. 1988, 34, 569–582. [Google Scholar] [CrossRef]
Figure 1. Line graph visualization of sensor data.
Proceedings 31 00031 g001
Figure 2. Heatmap visualization of sensor data.
Proceedings 31 00031 g002
Figure 3. The developed sensor kit for in-home observation.
Proceedings 31 00031 g003
Figure 4. A example of an in-depth interview employing visualized sensor data.
Proceedings 31 00031 g004
Table 1. Comparison between human-based and Internet of Things (IoT) sensor-based observation.
Observation by human observer (Existing Method)Observation by IoT sensor (Proposed method)
 1.
Cost of observation (Monitoring, analysis, interview)
Monitoring: Expensive (employ an observer)Monitoring: Low-cost (use IoT sensors)
Analysis: By humans (depend on observer's skill)Analysis: Visualization (easily automated)
Interview: Depend on observer's skillInterview: Conduct efficiently with prepared questions based on visualized sensor data
 2.
Impact on observed people (Privacy, impact on behavior)
Privacy: Big impact (perceptual information)Privacy: Small impact (sensor data)
Behavior: Big impact (monitored by observer)Behavior: Small impact (monitored by sensors)
 3.
Characteristics of gained knowledge from observation
-
Short-term and subjective information about a few households by observer's cognitive ability
-
Cover all visible activities (depend on observer's skill)
-
Long-term and diversified information about a large number of households
-
Limited to activities related to sensors
Table 2. Extracted and categorized barriers regarding energy saving activities.
CategoryDetailMention in interviews (Example of activities)
Category 1: Saving moneyConsider that an action do not lead to savingWorry about friction and wear of on-off switch
(Keep the lights on even while unoccupued)
Category 2: Food preservationCan't take energy saving actions for food preservationWorry about food rotting
(Cram all kinds of food in fridge)
Category 3: Air conditioning given his/her physical stateAdjust room temperature not for saving but for occupant's stateCan't stand the cold (Raise the temperature on air conditioner / electric heater)
Category 4: Layout of appliances and furnitureLayout of appliances and furniture prevents from taking actionsAppliance or its plug is out of reach
(Don't unplug appliances)
Category 5: Habitual behavior and attitudeCan't take actions departing from habitual behaviorForget to take actions
(Don't unplug appliances)
Category 6: Family and pet animalsCan't take actions because of the consideration for family and petsUse air conditoner for my cat
(Use air conditioner for a long time)
Category 7: Functionality of appliancesFunctionality of appliances prevents from taking actionsFor record a TV program
(Keep main power supply of appliances)
Category 8: Information from othersRegard an action as unnecessary based on information from othersI heared we don't have to switch off appliances
(Keep main power supply of appliances)
Category 9: Security and safetyCan't take actions for keeping occupant's home safeAfraid of the dark
(Keep the lights on even while unoccupued)
Category 10: ConvenienceCan't take actions for removing the burden of appliance operationToo much work to do it every time
(Don't unplug appliances)
Publisher’s Note: MDPI stays neutral with regard to jurisdictional claims in published maps and institutional affiliations.

