
Techno-Economic Analysis of Automated iPSC Production


1
Fraunhofer Institute for Production Technology IPT, 52074 Aachen, Germany
2
Laboratory for Machine Tools and Production Engineering (WZL), 52074 Aachen, Germany
*
Authors to whom correspondence should be addressed.
Processes 2021, 9(2), 240; https://doi.org/10.3390/pr9020240
Submission received: 22 December 2020
/
Revised: 13 January 2021
/
Accepted: 14 January 2021
/
Published: 28 January 2021
(This article belongs to the Section Biological Processes and Systems)
Abstract
:Induced pluripotent stem cells (iPSC) open up the unique perspective of manufacturing cell products for drug development and regenerative medicine in tissue-, disease- and patient-specific forms. iPSC can be multiplied almost without restriction and differentiated into cell types of all organs. The basis for clinical use of iPSC is a high number of cells (approximately 7 × 10⁷ cells per treatment), which must be produced cost-effectively while maintaining reproducible and high quality. Compared to manual cell production, the automation of cell production offers a unique chance of reliable reproducibility of cells in addition to cost reduction and increased throughput. StemCellFactory is a prototype for a fully automated production of iPSC. However, in addition to the already tested functionality of the system, it must be shown that this automation brings necessary economic advantages. This paper presents that fully automated stem cell production offers economic advantages in addition to increased throughput and better quality. First, biological and technological basics for a fully automated production of iPSC are presented. Second, the basics for profitability calculation are presented. Third, profitability of both manual and automated production are calculated. Finally, different scenarios effecting the profitability of manual and automated production are compared.
1. Introduction
Induced pluripotent stem cells (iPSC) open up the unique perspective of manufacturing cell products for drug development and regenerative medicine in tissue-, disease- and patient-specific forms. As known from embryonic stem cells, iPSC can be multiplied almost without restriction and differentiated into cell types of all organs of the body [1,2]. Of particular importance is the possibility of testing active substances directly on iPSC-derived body cells of patients [3]. For diseases of the nervous system and heart, this approach holds a special potential from a medical point of view, as no patient- and disease-specific cell sources for drug development are available for these non-regenerative tissues [4,5,6,7,8]. The basis for the research and clinical use of iPSC is a high number of cells (approximately 7 × 10⁷ cells per treatment), which must be produced as cost-effectively as possible while maintaining the same high quality [9,10,11]. Manual production does not meet these requirements. The automation of production, which has already been established in many other industrial fields for years, offers the decisive advantage of reliable reproducibility of the products in addition to cost reduction and increased throughput. Especially, the current coronavirus pandemic has once again shown that automation in the field of bioprocesses is urgently needed to achieve reproducible results and high throughput. This article will present the economic benefits of an automated platform for the production of stem cells. This example can be applied universally to other processes from the broad field of bioprocesses.
The StemCellFactory (SCF) is a prototype for such a fully automated production of iPSC [12]. The automation and parallelization of the handling processes makes it possible to reproduce iPSC-lines. The reproducibility of the cell lines produced on the plant ensures that the results of subsequent research and applications are comparable, since they are based on the same starting product. However, in addition to the tested functionality of the system, it must be shown that automation also brings the necessary economic advantages. It is therefore important to find out whether the operation of the plant is profitable in principle and more economical than the manual processes currently used. In addition to investment and operation cost, the demonstrably higher quality of the cell products must also be taken into account.
This paper presents that fully automated stem cell production offers economic advantages in addition to increased throughput and better quality. First, biological and technological basics for a fully automated production of iPSC are presented. Second, the basics for profitability calculation are presented. Third, profitability of both manual and automated production are calculated. Finally, different scenarios effecting the profitability of manual and automated production are compared.
2. iPSC-Production
In recent years, high throughput and novel experimental technologies have been gaining traction, opening up entirely new dimensions in which biological, biochemical or pharmacological products are produced [9,10,11]. The iPSC have gained particular importance in the development of disease-specific in vitro models. It is only through human iPSC technology that it is possible that stem cells from patients with specific genetic diseases can be obtained [13,14,15]. These patient-derived stem cells can then be used to generate disease-relevant tissue cells from them [16,17]. In this way, the disease processes can be simulated in vitro with the aim of identifying the underlying mechanism of the disease and finally developing new therapeutic approaches [18].
2.1. Manual iPSC Production Process
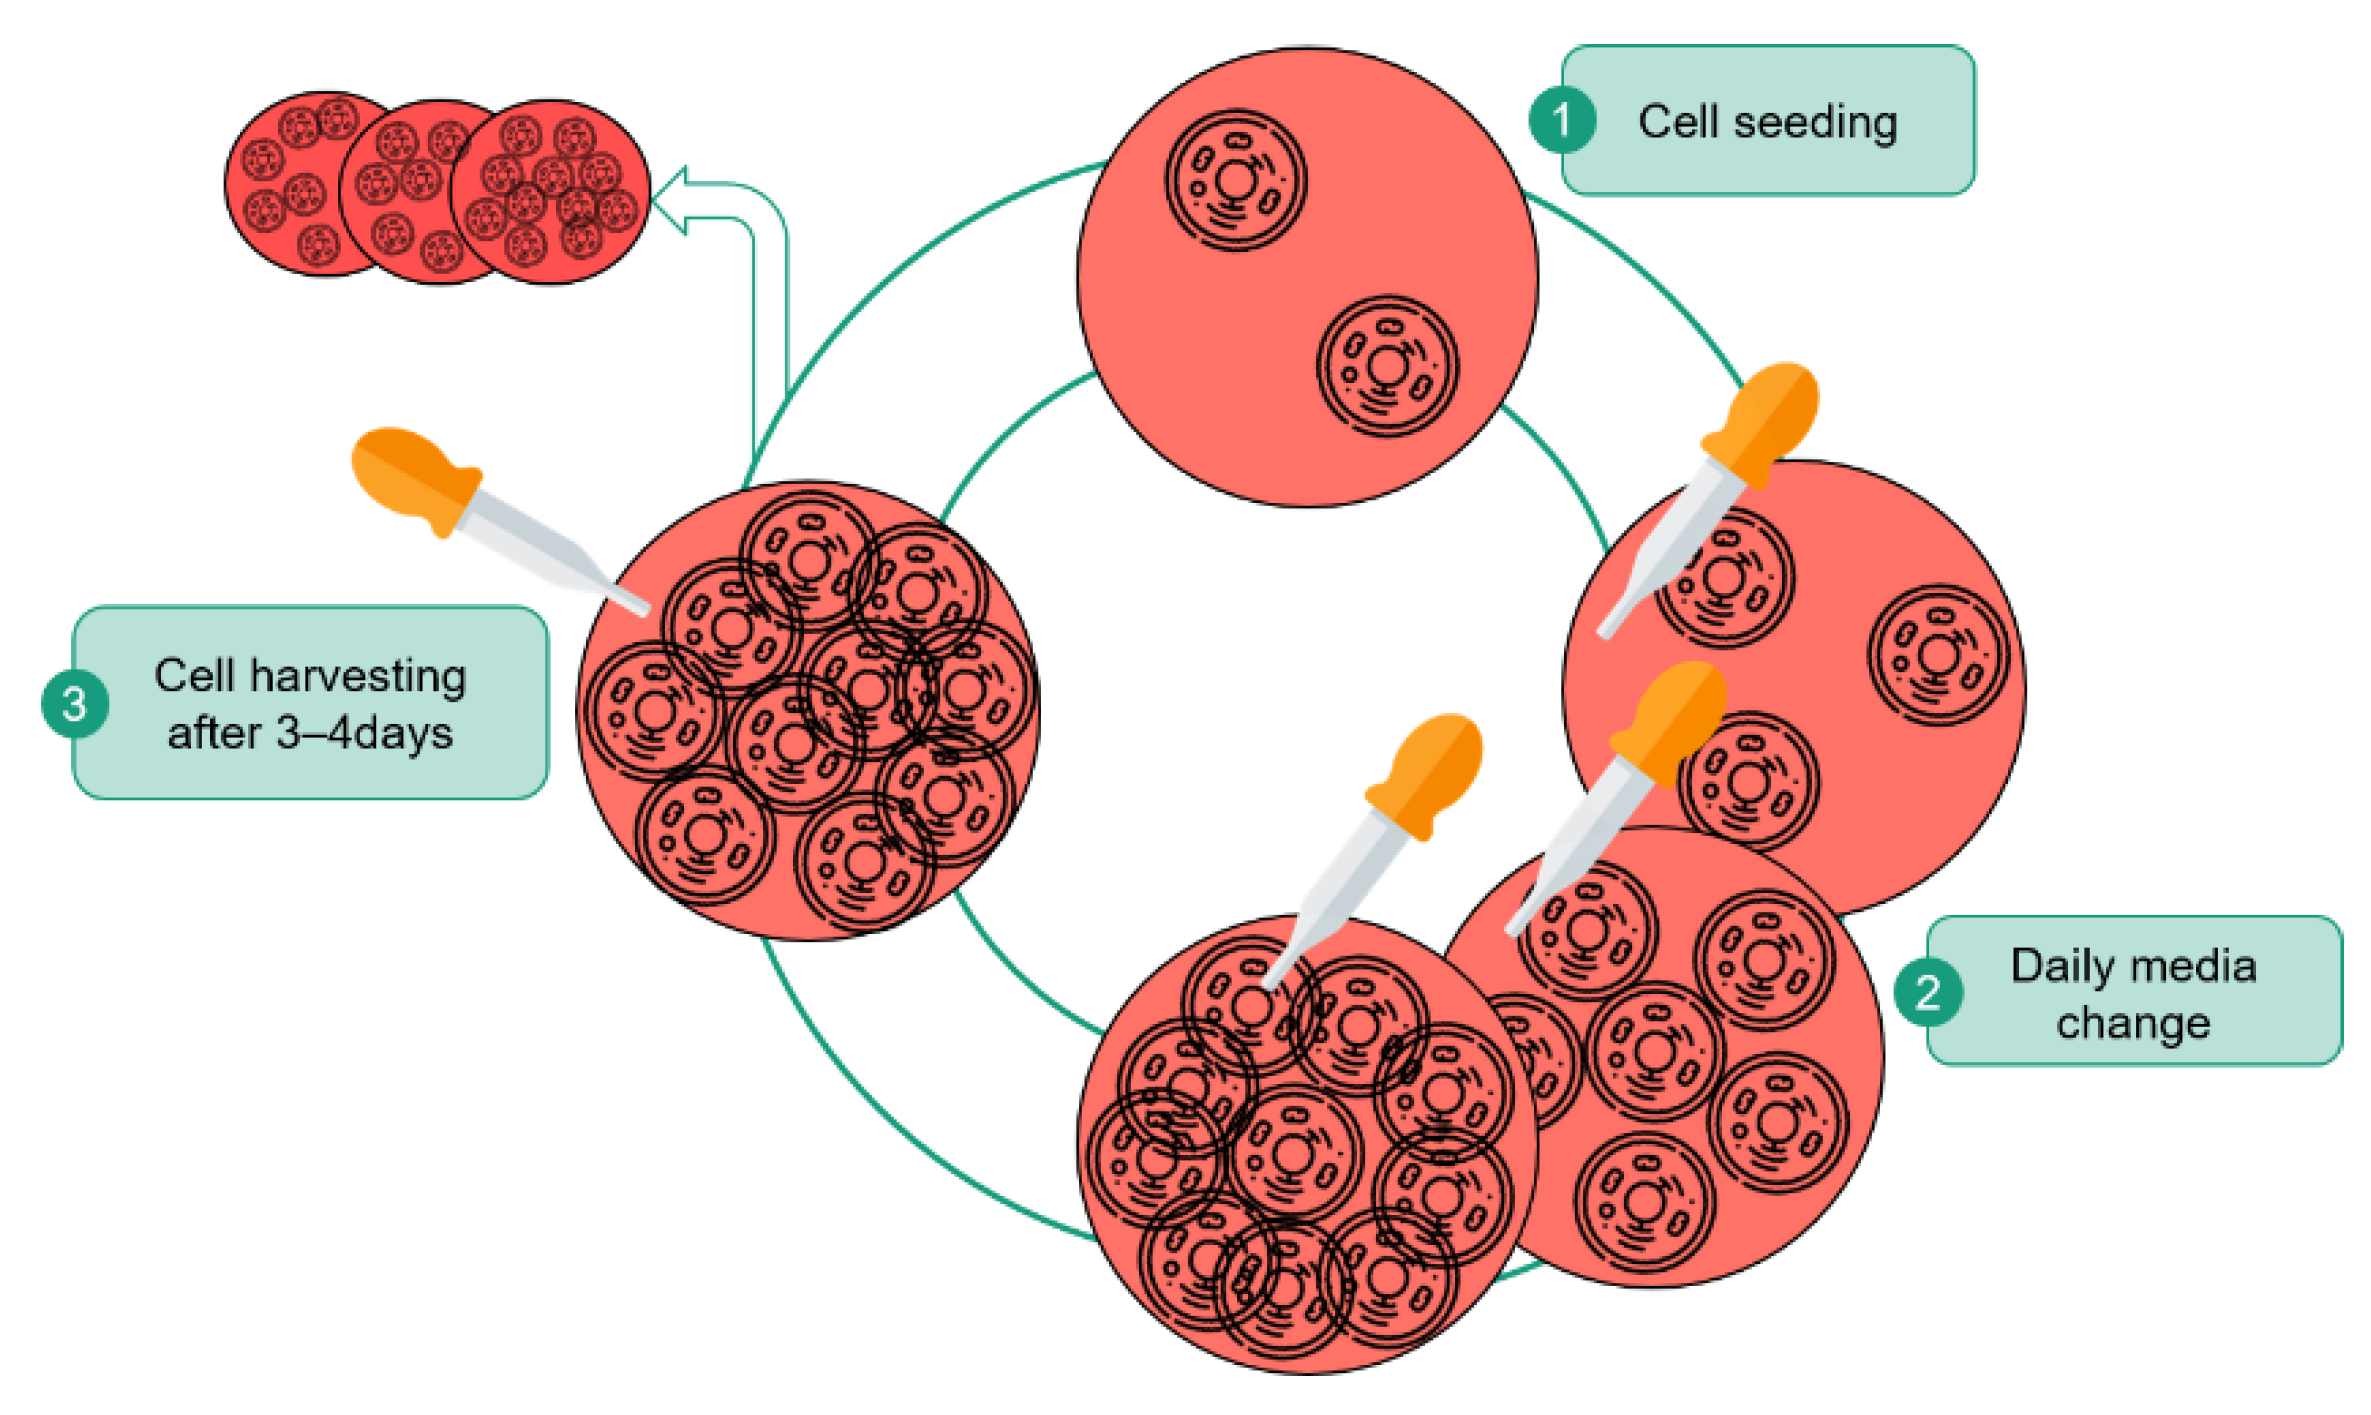
In order to realize the above-mentioned fields of research and therapy possibilities with stem cells, a high number of cells per experiment is required. The desired number of cells can be obtained by expanding the cells in the cell culture. Figure 1 shows the general process of cell cultivation.
The process shown comprises three different steps, which are repeated over and over again. The cells of a certain density (number of cells/mL) are seeded into a cell culture vessel (1). Through cell division, the cells multiply exponentially and consume the nutrients from the medium through metabolic processes. When handling iPSC cultivations, a major concern is the maintenance of pluripotency, as this is highly sensitive to the cultivation conditions, such as media composition, growth surface and high cell densities [19,20]. To avoid accumulation of waste products and replenish growth factors such as basic fibroblast growth factor (bFGF) or transforming growth factor beta (TGF-β) to maintain pluripotency, the medium is exchanged regularly (2) [21]. If the cells become confluent, meaning they have colonized the available surface to a large extent, the growth rate is reduced. To avoid this and to maintain pluripotency, the cells are harvested and then reseeded (3). Different ratios can be chosen for the new seeding process, which is called splitting ration. Each of these three procedures requires numerous steps to be performed, increasing the amount of manual effort involved in cell cultivation. For instance, harvesting includes dissociation of the cells, interruption of dissociation and centrifugation, discarding of the supernatant, resuspension of the cells, determining cell number and then reseeding.
In addition to this process, daily microscopic analyses of the cells are performed by biological experts to assess cell quality and morphology [22,23]. Decisions are made based upon this visual analysis, such as when the next split is required or whether only the medium should be changed. Various other devices are required for the complex process of cultivating stem cells:
- Cell counting device: Determining cell number for reseeding
- Fridge: Storage of media and supplements
- Microscope: Cell quality control, determining confluence
- Incubators: Cultivation of cells
- Clean benches: Open processing during cell seeding, media exchange and harvest
- Centrifuge: Harvesting of cells.
This means that the biological expert must be familiar with a large number of different devices and procedures and the process chain must be planned precisely by the operator. If the process is planned incorrectly, equipment such as the laminar flow hood, a device that creates a controlled environment through filtered air and laminar flow, may be occupied in two ways and the process may not be performed. In the worst case, this can lead to loss of cells. The process described here is routinely performed manually in every cell culture laboratory. It requires highly qualified and well-trained personnel, as it is important to ensure that the cells are handled correctly and not subjected to contamination by external substances. The human activity is extremely repetitive, as the media exchange is performed daily and harvest and reseeding every other day.
By using the SCF, this repetitive task of expanding stem cells can be automated. A major advantage is the exact parameterization of the processes and the extremely high repeatability of the individual processes. A machine can carry out repetitive processes such as changing cell culture medium an unlimited number of times with constant accuracy. A human being, on the other hand, tends to make mistakes when processes remain the same. Using a machine, decision-making can be standardized as the visual analysis of confluence is subject to variations in between operators.
2.2. Need for Automated iPSC Production
To facilitate the application of iPSC in research for disease models and drug screening, cost-effective production at a high quality is required. Up to now, the production of iPSC has mainly been done manually. This can result in differences in product quality, scalability, reproducibility and economic efficiency of the process and thus endanger the production process. Here, automatable production processes can counteract this.
Using the SCF platform as shown in Figure 2, it is possible to automate this complex process and it was shown to allow for undifferentiated iPSC cultivation [12]. The SCF platform was equipped by the Fraunhofer Institute for Production Technology (IPT) with processing, analysis and storage modules The integrated equipment includes the essential incubators in which the iPSC and all other cells grow (I), a microscope for daily visual examination of the cells (II), a plate reader for turbidity-based detection of bacterial contamination (III), a material gate for the controlled loading and storage of consumables (IV) and a liquid handling unit (LHU) for performing the various pipetting operations (V). The LHU is central, as all cell manipulations (media exchange, passenging, harvest, etc.) are realized by the exchange of liquids, and these protocols are the main focus of the entire system. Other important modules are the CellCelector, which is used for the isolation of cells, and the robot arm, which carries out the transport of all consumables within the system and thus connects all modules with each other. Quality control of the iPSC is performed by a high-speed microscopy procedure developed at the IPT for analysis of morphology and confluence. This is able to scan in motion, so that no blurring is caused by the sloshing of the cell culture medium [24]. All modules are integrated within a cleanroom cabinet to ensure aseptic conditions during open handling of the iPSC.
Additionally, process automation enables recording of all data generated in the process and assign them to each individual MTP (microtiter plate). This has the advantage that all processes are precisely recorded for later quality control. The control software developed at the Fraunhofer IPT enables the user to control all machines with only one software. The scheduler established in the control software enables the platform to plan the process optimally and to parallelize processes in the best possible way in order to increase the throughput of the system. The user is able to create process chains with abort criteria and decisions, so that a databased process control is possible [25]. This is especially important to ensure high quality of the cells produced, as cell growth is subject to subtle changes and the process needs to be adaptable to account for these differences. All this does not only allow a higher production rate of iPSC but also ensures a constant high quality of the cells. With a capacity of producing 213 cell lines per year if operated continuously, the SCF is well equipped for the high throughput needed in iPSC production.
The global market value for iPSC is predicted by a wide range of market research institutes to grow at an annual rate of 10%, with a market value of between USD 2 to 3.5 billion in the coming years [26]. Especially, pharmaceutical companies with research facilities, but also pure research institutes, contribute to these growth rates by developing or using iPSC cells and associated products. The great interest of the pharmaceutical industry in iPSC technology can be attributed to the many alliances with providers of stem cell products. For example, Evotec, which also operates an iPSC platform, has entered into several partnerships with pharmaceutical companies such as Bayer, Boehringer, Novartis and Bristol-Myers Squibb. The collaboration with Bristol-Myers Squibb, which aims at drug development in the field of neurodegenerative diseases, was expanded in 2020 to include the use of additional cell lines, for which Evotec received payments of USD 6 million [27].
The use of iPSC cells and their derivatives for drug discovery and identification is a major economic driver. The development of a new drug takes on average 10 to 15 years and costs on average USD 2.6 billion [27]. In particular, the share of costs for research and development (R&D) has steadily increased over the past decades, whereby toxicity is still the leading reason for the failure of potential drug candidates in the late phases of development (late drop-out) [28]. Using iPSC to test drug candidates for toxicity in early phases of development would help to avoid late drop-outs and potentially decrease costs of R&D.
3. Economic Analysis of Automated iPSC-Production
To analyze the presented iPSC production types from an economic point of view, Section 3.1 presents the methodological approach of the economic analysis. In Section 3.2, the methods are then applied for the economic analysis of manual and automated iPSC production.
3.1. Capital Budgeting for Economic Analysis
Economic theory and entrepreneurial practice mainly distinguishes between two approaches: Static methods and dynamic methods.
Static methods determine the economic efficiency under constant framework conditions and explicitly consider only one period, which is assumed to be representative for all such periods (e.g., one year). The data for the observed period is gained by considering the whole planning period (in general the expected lifetime of an investment) and finally deriving the average cost and profit data for the period under review [29].
Dynamic methods also analyze the influence of the time of investment on the economic efficiency. By discounting payments and earnings on an identical benchmark via compound interests, the impact of both their amount and their investment time on the profitability are considered. If, for example, an investment in a new machine needs to be analyzed, dynamic methods enable to include factors such as learning effects and decreasing manufacturing costs, which have a big impact on the economic efficiency [30,31].
3.1.1. Static Capital Budgeting Methods
Static economic evaluations consider only one average period (e.g., a year), which is assumed to be representative for the whole procedure. These methods focus on a pure financial measure of the profitability, which can be thought of in two ways:
- Absolute profitability: Making an investment/running a business is economically better than rejecting it.
- Relative profitability: Investing in/running project A is economically more valuable than investing in/running project B.
Static methods assume constant payments and earnings and do not take the changing actual cash value or the time of investments into account. The main advantage of the static method over the dynamic method therefore is the simplicity of the calculation method [11,12]. In theory, it is mainly distinguished between four methods to statically analyze the economic efficiency. The methods are built on each other, but differ in regard to their target measures. They are described in the following [30,31].
Cost Comparison Method (CCM)
The cost comparison method (CCM) rates different projects and investments regarding to their major costs per period or per output. Costs analyzed include personnel expenditures, cost of raw materials or depreciations. Absolute profitability is achieved if the total costs of making the investment are lower than the total cost of rejecting it. Relative profitability is obtained if the costs for the selected project are lower than the costs of alternative projects [30,31,32].
Profit Comparison Method (PCM)
The profit comparison method (PCM) is an expansion of the CCM: Besides costs, it also considers revenues of a project. PCM is particularly used if outputs of a process are different and cannot be compared with each other. In these cases, the performances of the projects are equated with their profits, which enables comparisons. Leading to a profit greater than zero, a project achieves absolute profitability. If a project results in higher profit than its alternatives, it reaches relative profitability [30,31,32].
Return on Investment (RoI)
Return on Investment (RoI) is an indicator that shows to which extent a specific business produce gain from the use of capital. It shows the extent to which the amount invested in a particular action returns as profit or loss. Thus, RoI enables efficiency assessment of an amount invested. RoI is calculated as the ratio between operating profit obtained after the action of investment and the total investment costs. The result being a percentage the relation obtained is multiplied by 100. The calculation is shown in Equation (1):
An absolute profitability of an investment is given if the RoI is higher than 100%. Relative profitability is obtained when the RoI of one alternative is higher that the RoI of all other alternatives [33].
Payback Period
The payback period determines the time it takes to recover the capital invested in a project considering the average cash flow surpluses. It is expressed as shown in Equation (2):
To achieve absolute profitability, the project’s payback period needs to be shorter than a given target length of time (usually expressed in years). The project with the shortest payback period represents the most advantageous alternative and is therefore relatively profitable [30,31,32].
The payback period serves not only as a comparison of available alternatives, but also as a measure of the investment risk. For this reason, the payback period is a good addition to other capital budgeting methods that only assess the economic efficiency.
3.1.2. Dynamic Capital Budgeting Methods
With the dynamic procedures, several periods are considered from the point of view of economic efficiency. The value spent on the investment is compared with the value of the revenue in a plan created over several accounting periods. Procuring the data is time-consuming due to the time difference, but it does weight the cash flows over time by means of discounting or addition. If the value of the revenue exceeds the capital expenditure, the investment is considered to be economical.
The most common dynamic capital budgeting method is the net present value. For the purpose of this paper, this is therefore the only method applied for the economic analysis. The net present value (NPV) is the sum of the future cash flows of an investment discounted to the present. By discounting future successes to the present, the time value of money is taken into account: The sooner money is available, the more value it has. By discounting successes to a uniform point in time, payments can be made comparable even if they occur at different times [33]. Equation (3) presents the NPV calculation:
NPV is an indicator of how much value an investment or project adds to the firm. An NPV > 0 means the investment would add value to the firm, while an NPV < 0 means the investment would subtract value from the firm [33].
3.1.3. Choice of Capital Budgeting Methods for the Economic Analysis of iPSC Production
In order to benefit from both the simplicity of the static methods and the realism of the dynamic methods, three methods will be used to analyze and compare manual and automated iPSC production:
- Return on Investment (RoI)
- Payback Period
- Net Present Value (NPV)
As the cost comparison, and respectively profit comparison, are covered by the NPV and RoI, these methods are not further applied.
3.2. Economic Analysis of Stem Cell Production
In the following, the main assumption for economic analysis are summarized. Afterwards, the costs for both manual iPSC production (Section 3.2.2) and automated iPSC production (Section 3.2.3) are analyzed. The cost are composed of investments, personnel, operation resources and depreciation. In Section 3.2.5, the profits are compared with the chosen methods from Section 3.1.3. The costs of machines and employees are based on information of suppliers.
3.2.1. Assumptions for Economic Analysis
To compare both production methods, the assumptions in Table 1 were made for both manual and automated iPSC production.
For the following calculations, the number of 213 cell lines per year is chosen for both manual and automated iPSC production due to the production projections of the SCF (see Section 2.2). This number assumes a constantly running factory (24 h a day). As the selling price for both production types is assumed identical, the yearly revenues are the same. The main difference consequently is the production cost, which now will be further analyzed.
3.2.2. Cost of Manual iPSC Production
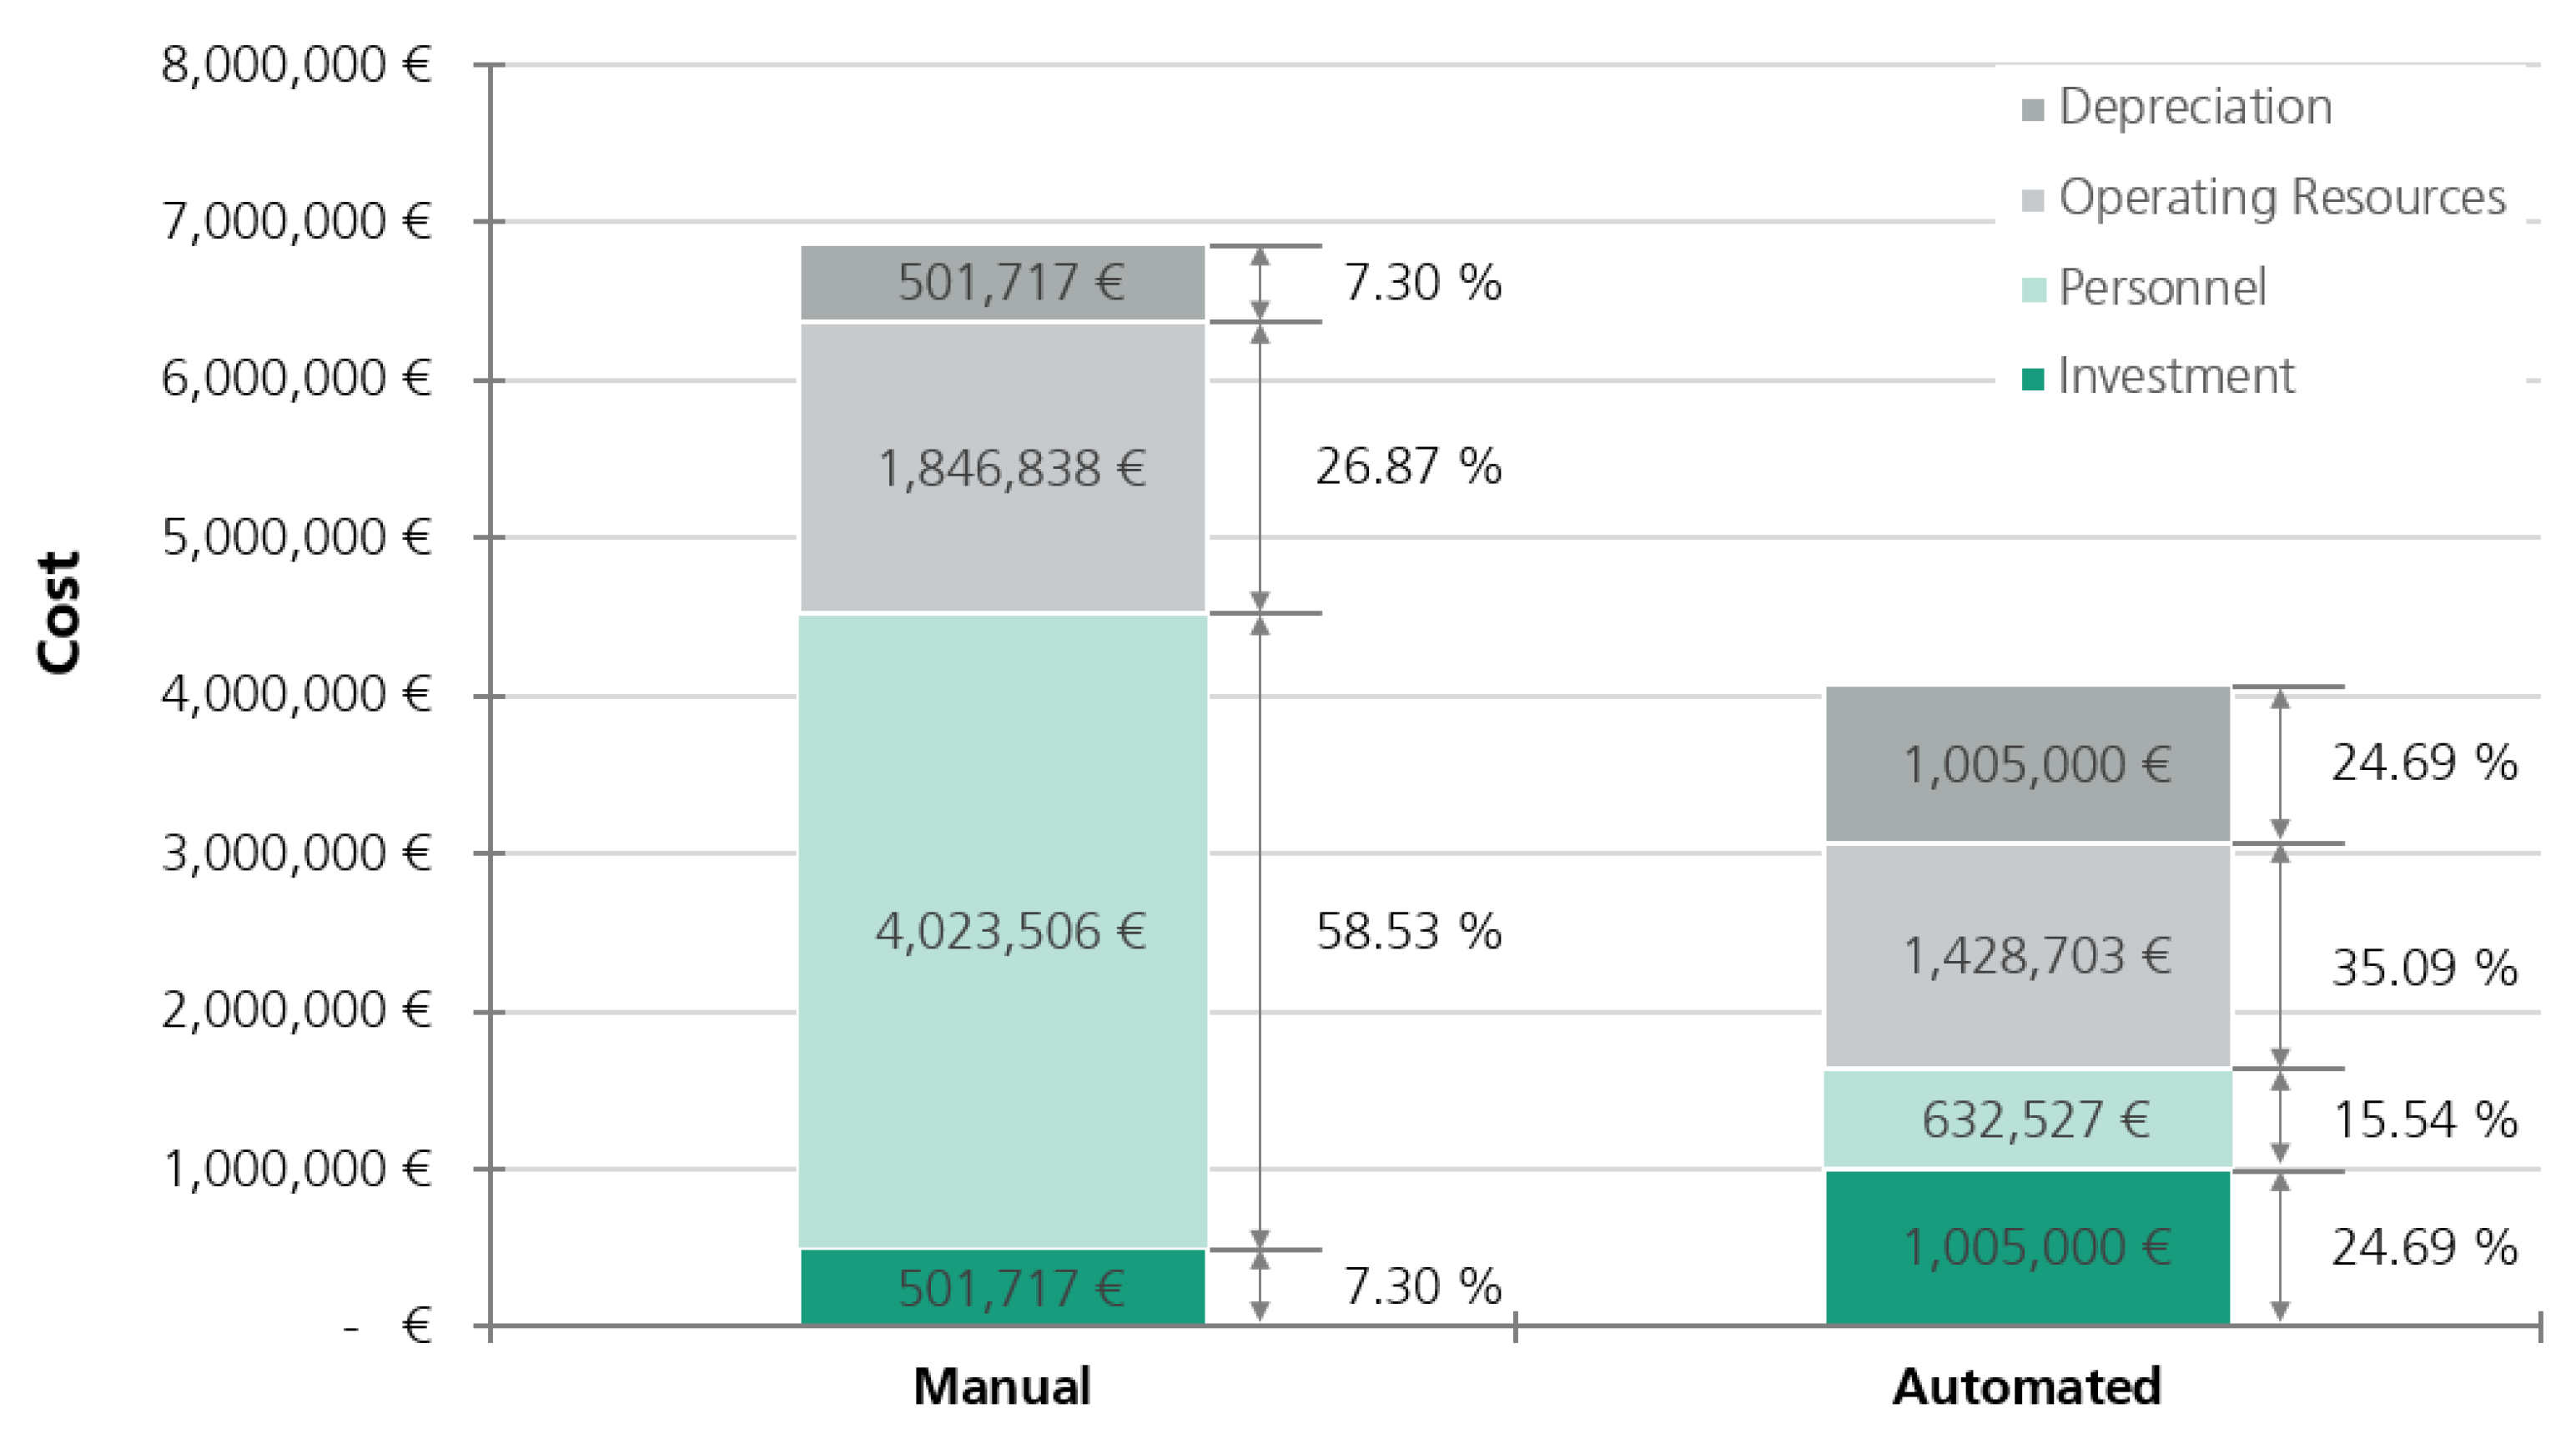
To manually execute iPSC expansion as shown in Figure 1, several equipment is required. The main equipment is one cell counting system, one centrifuge, four clean benches, one fridge, one incubator STX 500, one incubator STC 44, one microscopy system and one vacuum pump. The assumed equipment cost is summarized in the associated excel calculation file. For the fixed number of 213 cell lines per year, the investment adds up to around 500 k€ (7.3% of total cost).
The reproducibility of the cell lines is difficult to achieve in manual production. In order to ensure that the cells have a comparable quality after production, each cell line should be processed by the same medical technical assistant (MTA). This ensures that the cells are always subjected to the same treatment for this manufacturing process. Experiences further show that a period of 70 days is required for the manual reprogramming of cells. An average MTA works on eight to ten cell lines in parallel. Working 260 days a year, one MTA can produce 31 iPSC lines per year. In order to produce the target of 213 iPSC lines per year, seven MTA are required. Working 1824 h per year, one MTA costs 37 k€, which adds up to 450 k€ personnel costs in the first year (annual growth rate of 3.35%) and around 4 M€ (58.53% of total cost) overall.
As the MTA work in two shifts (max. four at the same time), four clean benches are necessary (one MTA requires one clean bench). For the cell production, several resources are needed. The main resources are the chamber cell culture plates (4, 6, 24 and 48), the different factors for cell nutrition (I to VIII), culture medium, tubes and stripettes, as well as personnel protection equipment (e.g., face mask, gloves) for the MTA. In our calculation, 37 different operating resources were considered. Per cell line, the cost for operating resources add up to 1 k€. The assumed equipment costs are summarized in the associated excel calculation file. Total operating resource cost add up to 1.8 M€ (26.87% of total cost).
As the depreciation is linear and identical to the machine life time of eight years, it also adds up to around 500 k€ (7.3% of total cost).
3.2.3. Cost of Automated iPSC Production with StemCellFactory
To produce iPSC with SCF, equipment shown in Figure 2 has to be bought. The shown hardware and its in-house and out-house software investments amount to 1 M€ (25% of total cost).
Personnel cost for the automated production consist of installation and assembly cost, as well as wages for a part-time employee, who, i.e., changes the cell medium and regularly monitors the SCF. Furthermore, technicians, engineers and maintenance staff are partly required to keep the SCF running. Besides 17 k€ of one-time installation cost, the yearly personnel costs account for 68 k€ in the first year (annual growth rate of 3.35%), adding up to personal costs of 630 k€ (15% of total cost).
The main operating resources of SCF are equal to the ones described for the manual process, meaning cell culture plates, culture mediums, tubes and pipettes. Per cell line, the total cost for operating resources are 820 €, adding up to total operating resources cost of 1.4 M€ (35% of total cost). The deprecation is assumed linear as well and equals the investment of 1 M€ (25% of total cost).
3.2.4. Cost Comparison of Manual and Automated iPSC Production
Figure 3 shows the cost distribution of manual and automated iPSC production over the lifetime of eight years. Overall, manual production is 42% more expensive than automated production. The biggest cost difference is personnel cost, which accounts for nearly 60% of total manual cost. Personnel costs of manual production are already higher than total cost for automated iPSC production. The investment for automated iPSC production is twice as high as for manual iPSC production, but only a quarter of the personnel cost of manual cell production. As both manual and automated produce the same iPSC, operating resources are equal. The price difference mainly results from the personnel protection equipment, which is only required for MTA during manual production.
3.2.5. Economic Analysis of Manual and Automated iPSC Production
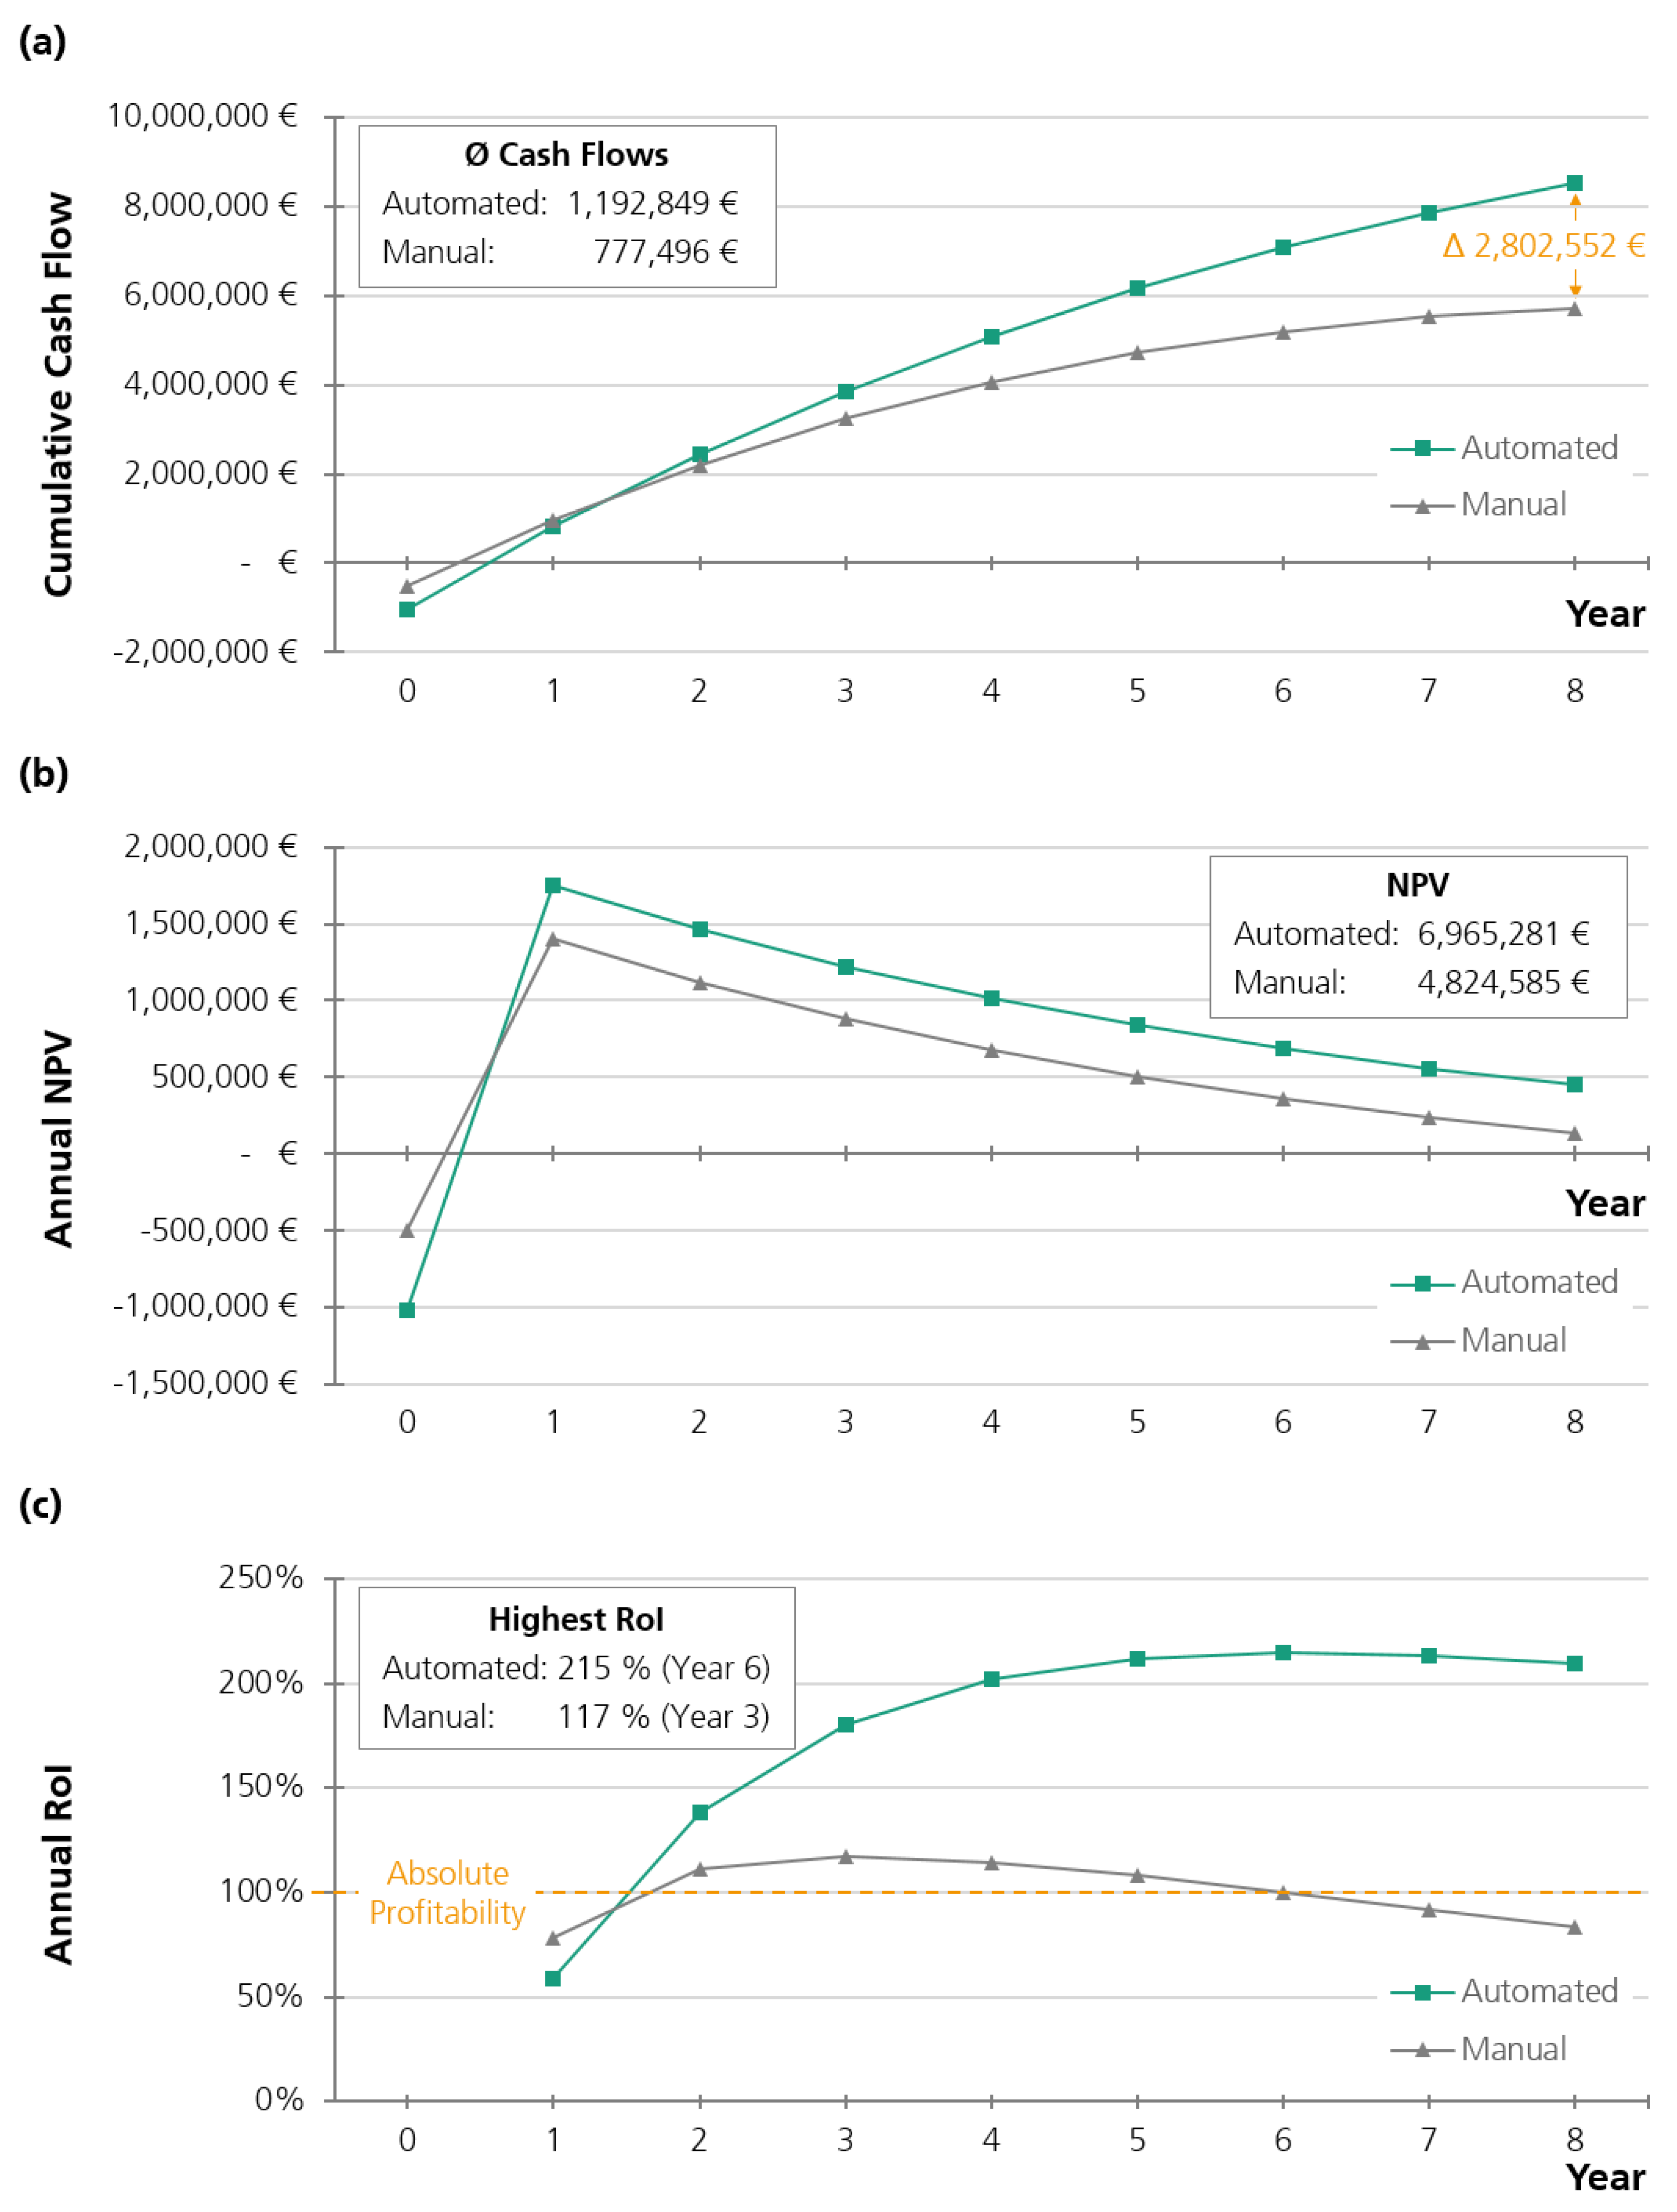
After calculating the costs and assuming the same revenue for both manual and automated production, the profit of the processes is analyzed and compared. Figure 4 shows the results for both processes for a machine lifetime of 8 years.
Considering the cumulative cash flow, both manual and automated processes have a positive cash flow within the first year. As the investment of the manual process is lower, a positive cash flow is reached earlier. This is represented by the lower payback period of manual iPSC production:
Despite the slightly longer payback period, the cumulated cash flow of automated iPSC production is higher after 1.5 years. After eight years, the total cash flow of the automated process is nearly 3 M€ higher than of the manual process (Figure 4a).
This is also represented by the NPV: After nine months, NPV of the automated process is higher than NPV of the manual process. The cumulated difference after eight years is nearly 2.2 M€ (Figure 4b).
The RoI further shows that the benefit of automation gets comparably higher with longer lifetime. After eight years, the RoI of the SCF is still over 200%, whereas the manual process has only 89% RoI in year eight, meaning that the cash flow is lower than the initial investment (Figure 4c).
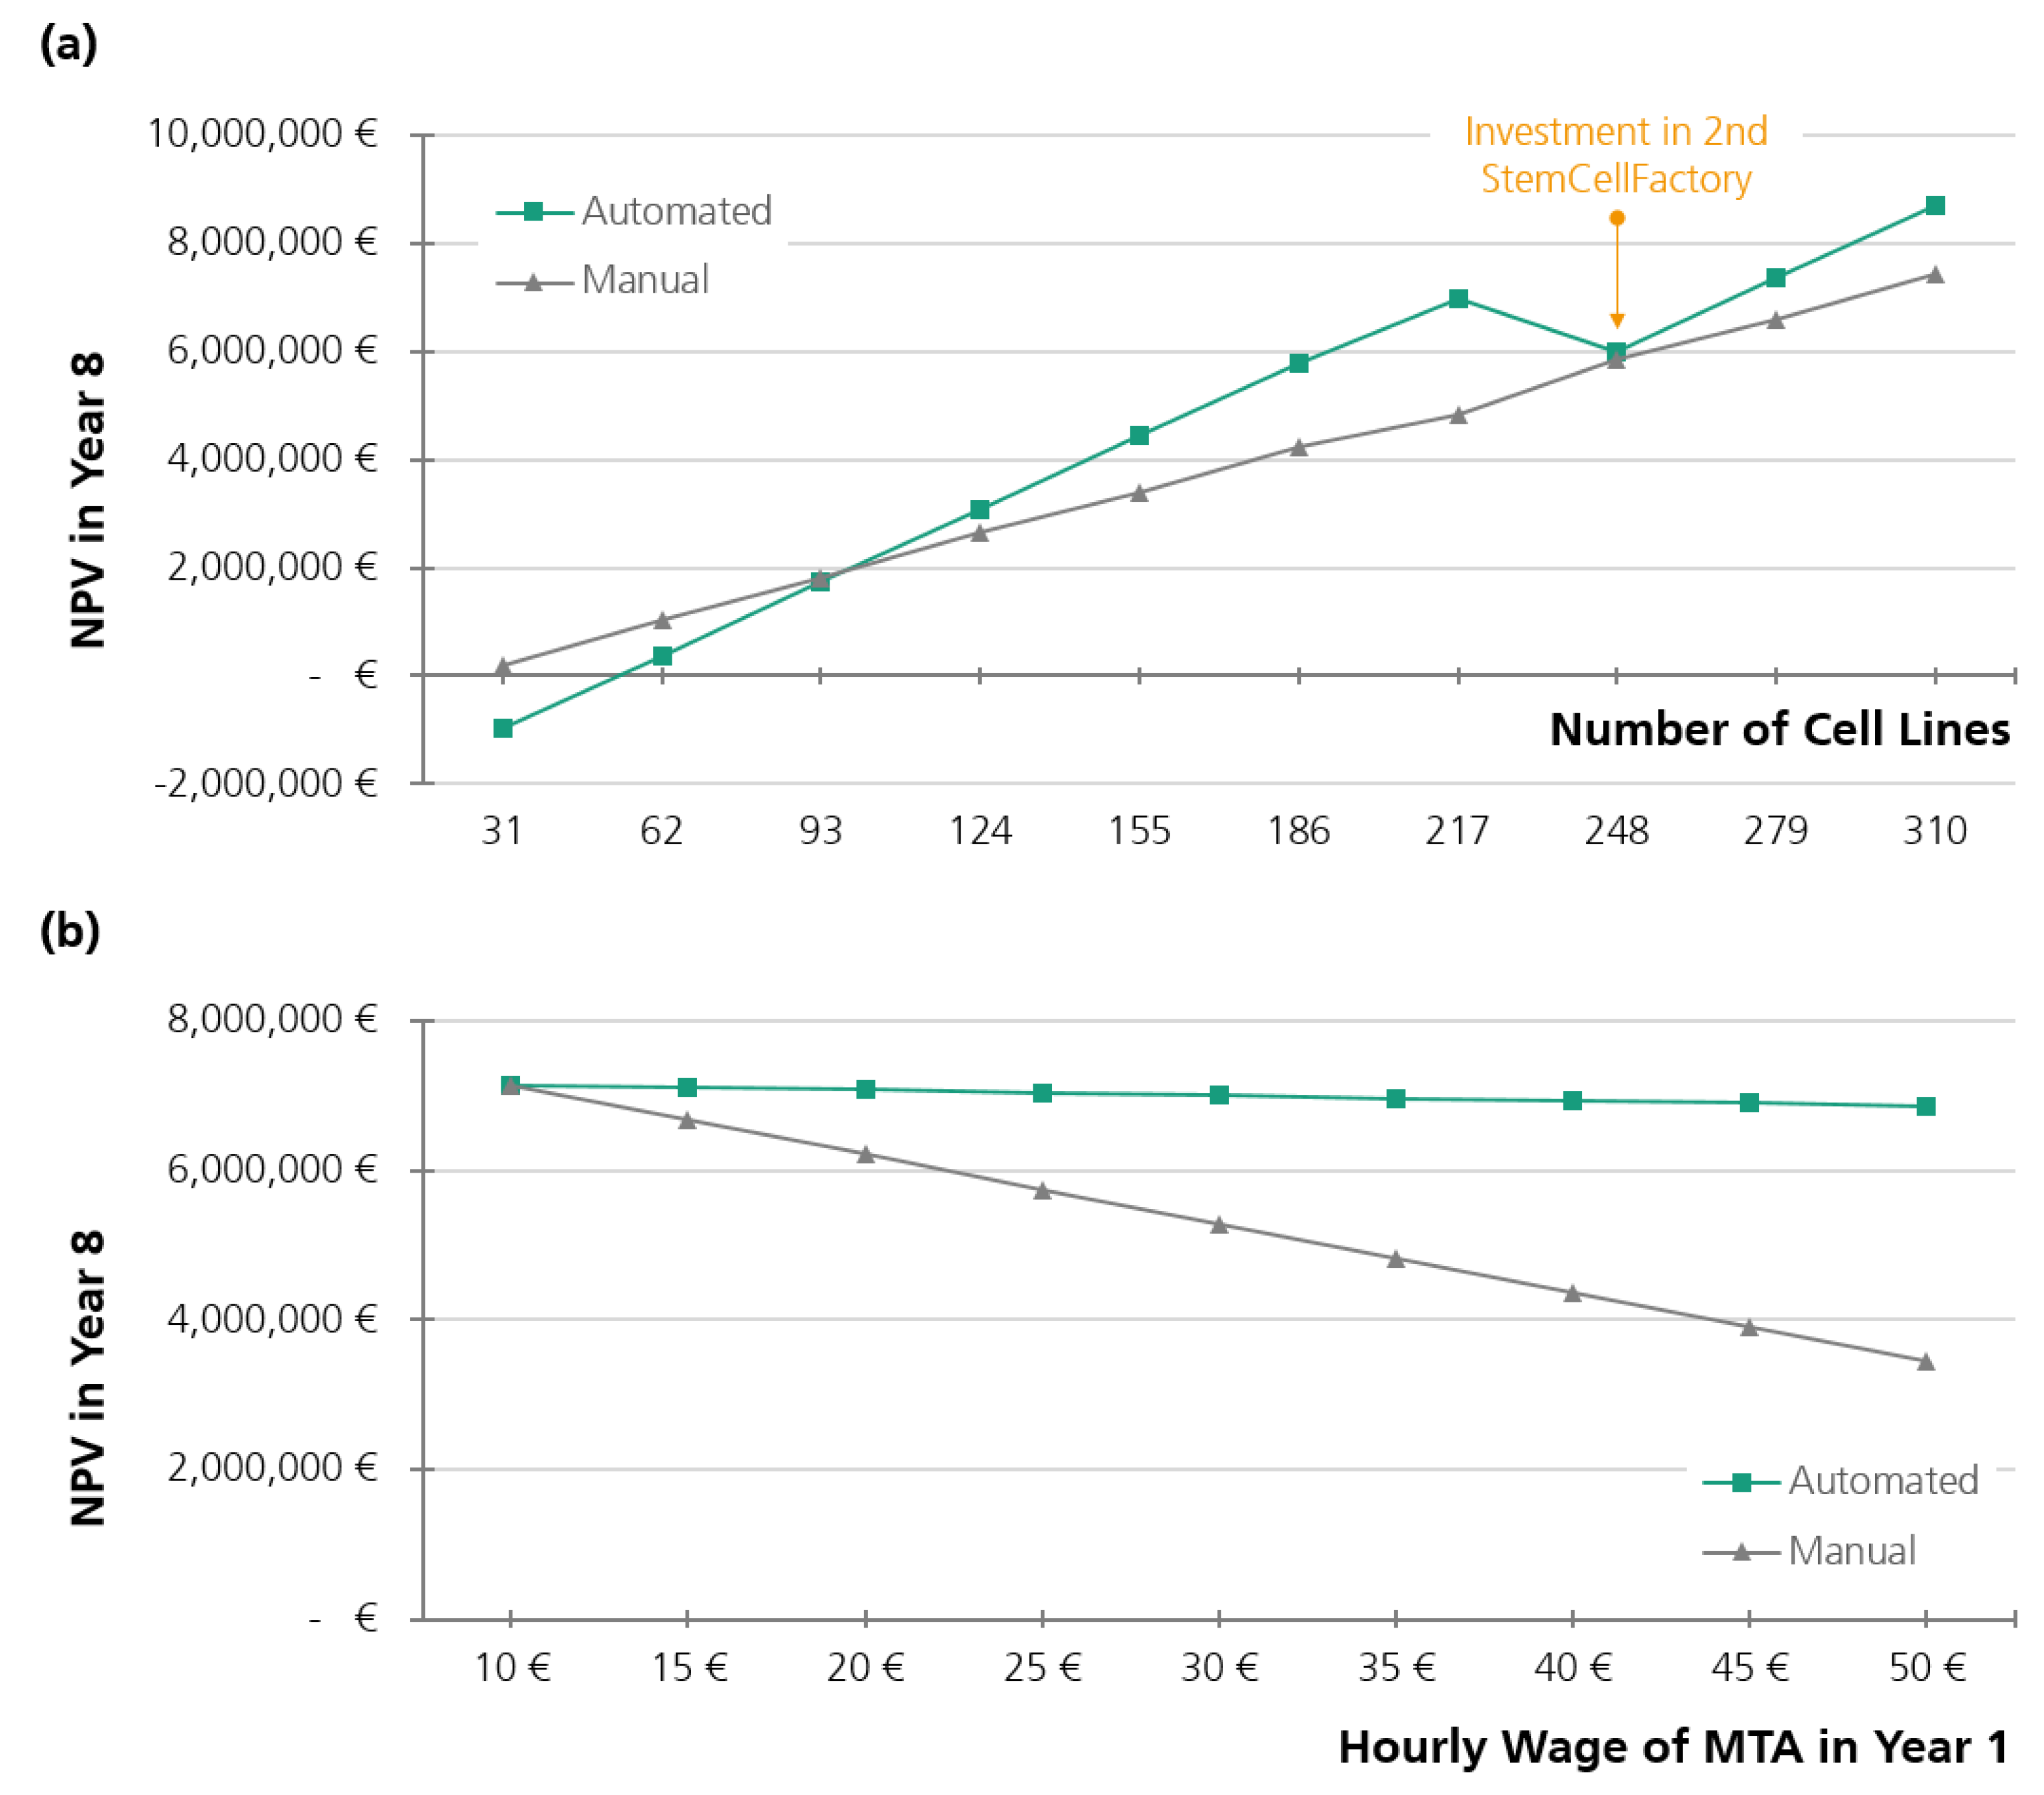
This analysis shows that automated iPSC production has an immense economic potential, especially compared to manual production. However, this assumes a near-failure-free production and a best-case scenario of produced cell lines of SCF. In Figure 5, different scenarios are analyzed to show, in more detail, in which cases automation is beneficial or not.
4. Discussion
In the following, first, the impact of the quality of the stem cells on profitability of automated production is discussed (Section 4.1). Afterwards, profitability is discussed for different production scenarios to evaluate the difference of automated and manual production in more detail (Section 4.2).
4.1. Quality of Stem Cells
Section 2.2 illustrated the increasing demand for large numbers of high-quality iPSC for application in drug testing and toxicity screening and the capacity of automated systems like the SCF platform to meet this demand. In Section 3.2.5, the economic potential of automated iPSC production was discussed, however, the selling price and thus potential profit made by production of iPSC is strongly dependent on the reproducibility and quality of the cells produced.
Reproducibility is currently a challenge in applying iPSC in research and development as they are subject to several sources of variability. Differences between donors account for a major part of iPSC variability [35,36]. Also, biological variability of cells of the same donor [37,38,39] and variability introduced by differences in handling during production of the cell lines contribute to the unreliability of iPSC production. For instance, the decision when to split the cells can be subject to high operator-to-operator variability. A common method for splitting of cells is confluence-based splitting. When performing manual cultivation of iPSC, the confluence is determined by the operator based on microscopic analysis of the cells. As the perception of confluence is different in between operators, variability is introduced into the production process. In an automated system, confluence is determined algorithmically based upon high-speed microscopy and therefore independent of the perception of the operator [40]. Reproducible cultivation of iPSC is further complicated by the fact that different iPSC lines typically exhibit differing growth patterns. Therefore, an adaptive process control is required to account for these differences. Automation is a key technology to achieve more reliable iPSC production, as it allows for standardization of protocols and avoids human error or differences in handling in between different personnel while also providing the adaptability needed to cultivate cell lines differing in growth.
Quality of stem cells is mainly defined by growth characteristics, morphology, lack of differentiation and expression of pluripotency markers. When automating the production of iPSC, it is crucial to ensure automation does not negatively impact the quality of the cells produced. To this end, high-speed microscopy and flow cytometry were employed to study growth, morphology and expression of iPSC. iPSC produced in the SCF platform exhibited linear growth with only slight variations and more than 90% of cells expressed the pluripotency marker TRA-1-60 after expansion over 10 passages. A positive Epi-Pluri-Score additionally confirmed pluripotency, establishing the SCF as a platform for production and expansion of high-quality iPSC [40].
Optimally implemented automation of the production of iPSC does not only consistently yield cells of equivalent quality to manually produced cells, but reliably produces cells of higher quality. This might lead to an increase in value of the cells leading to an increase in selling price making automation more profitable overall.
4.2. Analysis of Different Production Scenarios
Section 3.2 showed an immense economic potential of automation compared to manual production. However, this analysis was based on the assumption that SCF constantly produces on a best-case-scenario level, meaning 213 cell lines per year. Furthermore, employee costs or machine lifetime may vary from the assumptions summarized in Table 1. To analyze in more detail, whether automation is really profitable, three factors are varied and analyzed in more detail: lifetime of machines, number of produced cell lines and hourly wage of MTA.
The assumed lifetime of eight years for SCF is relatively short. Despite this short lifetime, total NPV of automated stem cell production was nearly 2 M€ higher than total NPV of manual production, which is a difference of around 40%. The results in Figure 4 show that the relative profitability of automated production is even increasing over time. The RoI is still over 200% (for manual production: RoI in year 8 = 85%), with the NPV in year 8 around 500 k€ (for manual production: NPV in year 8 = 50 k€). This means a longer lifetime would increase the relative profitability of automated production compared to manual production.
The produced and sold number of cell lines have a high influence on the profitability of the production process. In order to analyze this influence, NPV after 8 years was compared, assuming a constant number of produced cells over the lifetime of 8 years. The number of cell lines is varied based on the number of cell lines one MTA can produce per year (31 cell lines). This has different effects on the costs of automated and manual iPSC production. For the manual process, a production of 31 cell lines only requires one MTA and one clean bench. Assuming a 2-shift-production, for 62 cell lines, only one other MTA is required. The production of 93 cell lines requires a third MTA as well as a second clean bench, and so on. This shows that the cost of the manual production process varies a lot with the number of cell lines, as the OPEX (operating expenditure) is a lot higher than the CAPEX (capital expenditure) (see Figure 3). Considering the automated iPSC production, the dependence of cost from the number of produced cell lines is comparably low, as nearly two thirds of the cost are investment cost, and there is depreciation of personnel costs to install and maintain the factory. These costs would not reduce in case of a decrease in produced cell lines. Figure 5a shows the influence of the produced number of cell lines on the profitability of both manual and automated production. The comparison shows that automated production is more profitable when 100 cell lines are produced per year, so around 50% of the best-case-scenario. From this point on, automated production is more profitable than manual production. Even in case of a second SCF (over 213 cells per year), the automation would be more profitable. As already mentioned in the Introduction, the need for cell lines is increasing. Thus, this analysis again shows the value of automated production.
The third factor that is considered in the sensitivity analysis is the hourly wage of MTA. Figure 5b shows the results of the analysis, assuming the production of 213 cell lines (original scenario). A minimum hourly wage of 10.00 € is assumed in a year, which is the minimum hourly wage in Germany in 2020 (assumed growth rate of hourly wage per year: 3.35%). Even for minimum wage, automated production is slightly more profitable than manual production. As the employee costs have a big influence on manual production (Figure 3), the relative profitability of automated production increases with increasing hourly wages. As the assumed hourly wages of 35.00 € will rise rather than fall, automated production will be even more profitable in the future.
5. Conclusions and Outlook
The automation of production, which has already been established in many other industrial fields, offers the decisive advantage of reliable reproducibility of the products in addition to cost reduction and increased throughput. This paper showed that automation of stem cell production offers economic advantages in addition to increased throughput and better quality.
The production principle of SCF—a prototype for a fully automated iPSC production—was described. By standardization of protocols and avoiding of manual handling, variability is reduced. This improves reproducibility as well as throughput and consistently yields high-quality iPSC. Compared to automated production with SCF, manual cultivation is time-consuming as well as error-prone due to both the highly repetitive nature of tasks and sensitivity of cells to contamination, as well as differences in handling. However, SCF lacks a module for reprogramming of the cells using the viral Sendai vector. Reprogramming was not integrated within the automated process, as the Sendai virus may only be handled within a S2 class laboratory and the SCF is placed in an S1 class laboratory. To further improve atomization of iPSC production, this step would need to be integrated in the SCF.
This higher quality and throughput is reflected in the economic analysis. Automation of iPSC production has an immense economic potential, especially compared to manual production. This was shown for a basic scenario of automated production with SCF. Despite the slightly longer payback period, the cumulated cash flow of automated iPSC production is higher after 1.5 years. After eight years, the total cash flow of the automated process is nearly 3,000,000 € higher than that of the manual process. Furthermore, NPV of the automated process is higher than NPV of the manual process after nine months. The cumulated difference after eight years is nearly 2,200,000 €. If this scenario would be scaled up, the advantages of automation would increase, as shown in Section 4.2. The constantly rising hourly wages of technical assistance further increase the relative profitability of automated production with SCF.
To set the calculated economic potential, the current SCF prototype would need to be industrialized and produced as small series. For now, the described platform is the only one of its kind, and the development and assembly took several years. The modular design of the SCF platform is a promising approach for this industrialization. Furthermore, production of other promising cell types, e.g., mesenchymal stem cells (MSC), on the same platform could be of interest. Therefore, the results from the project AUTOSTEM could be combined with the SCF platform [24]. Within the AUTOSTEM project, MSC were produced in a stirred tank bioreactor, in contrast to the two-dimensional (2D) cultivation methods employed in the SCF. This allowed for greater expansion of cells to higher cell numbers. Combining the SCF and the AUTOSTEM platforms allows for cultivation of cells in different dimensionalities suited to their respective requirements concerning cultivation conditions.
Author Contributions
Conceptualization, B.N. and R.K.; economic methodology, R.K.; validation, B.N., R.K. and L.H.; writing—original draft preparation, B.N., R.K. and L.H.; writing—review and editing, R.H.S.; visualization, R.K.; supervision, R.H.S.; project administration, B.N.; funding acquisition, B.N. All authors have read and agreed to the published version of the manuscript.
Funding
This research received funding from the European Union’s Horizon 2020 research and innovation programme under grant agreement no 667932. Furthermore, this research was co-funded by the State and the Ministry of Innovation, Science and Research of the State of North Rhine-Westphalia, the European Union (grant no. 005-1007-0021 (StemCellFactory I), grant no. 005-1403-0102 (StemCellFactory II), and grant no. EFRE-0800978 (StemCellFactory III)).
Institutional Review Board Statement
Not applicable.
Informed Consent Statement
Not applicable.
Data Availability Statement
The data presented in this study are available on request from the corresponding author.
Acknowledgments
We thank our colleagues in the AUTOSTEM project and the StemCellFactory network for the assistance in the project and the manuscript.
Conflicts of Interest
The authors declare no conflict of interest.
References
- Takahashi, K.; Yamanaka, S. Induction of pluripotent stem cells from mouse embryonic and adult fibroblast cultures by defined factors. Cell 2006, 126, 663–676. [Google Scholar] [CrossRef] [Green Version]
- Yu, J.; Vodyanik, M.A.; Smuga-Otto, K.; Antosiewicz-Bourget, J.; Frane, J.L.; Tian, S.; Nie, J.; Jonsdottir, G.A.; Ruotti, V.; Stewart, R.; et al. Induced pluripotent stem cell lines derived from human somatic cells. Science 2007, 318, 1917–1920. [Google Scholar] [CrossRef]
- Shi, Y.; Inoue, H.; Wu, J.C.; Yamanaka, H.I.S. Induced pluripotent stem cell technology: A decade of progress. Nat. Rev. Drug Discov. 2017, 16, 115–130. [Google Scholar] [CrossRef]
- Lee, G.; Ramirez, C.; Kim, H.; Zeltner, N.; Liu, B.; Radu, C.; Bhinder, B.; Kim, Y.; Choi, I.; Mukherjee-Clavin, B.; et al. Large-scale screening using familial dysautonomia induced pluripotent stem cells identifies compounds that rescue IKBKAP expression. Nat. Biotechnol. 2012, 30, 1244–1248. [Google Scholar] [CrossRef] [PubMed] [Green Version]
- Harris, K.; Alyott, M.; Cui, Y.; Louttit, J.; McMahon, N.; Sridhar, A. Comparison of electrophysiological data from hu-man-induced pluripotent stem cell-derived cardiomyocytes to functional preclinical safety assays. Toxicol. Sci. 2013, 134, 412–426. [Google Scholar] [CrossRef] [PubMed] [Green Version]
- Ebert, A.D.; Yu, J.; Rosem, F.; Mattis, V.B.; Lorson, C.L.; Thomson, J.A.; Svendsen, C.N. Induced pluripotent stem cells from a spinal muscular atrophy patient. Nat. Cell Biol. 2008, 457, 277–280. [Google Scholar] [CrossRef] [PubMed]
- Kondo, T.; Asai, M.; Tsukita, K.; Kutoku, Y.; Ohsawa, Y.; Sunada, Y.; Imamura, K.; Egawa, N.; Yahata, N.; Okita, K.; et al. Modeling Alzheimer’s Disease with iPSCs Reveals Stress Phenotypes Associated with Intracellular Aβ and Differential Drug Responsiveness. Cell Stem Cell 2013, 12, 487–496. [Google Scholar] [CrossRef] [Green Version]
- Devine, M.J.; Ryten, M.; Vodicka, P.; Thomson, A.J.; Burdon, T.; Houlden, H.; Cavaleri, F.; Nagano, M.; Drummond, N.J.; Taanman, J.-W.; et al. Parkinson’s disease induced pluripotent stem cells with triplication of the α-synuclein locus. Nat. Commun. 2011, 2, 440. [Google Scholar] [CrossRef]
- Daniszewski, M.; Crombie, D.E.; Henderson, R.; Liang, H.H.; Wong, R.C.-B.; Hewitt, A.W.; Pébay, A. Automated Cell Culture Systems and Their Applications to Human Pluripotent Stem Cell Studies. SLAS Technol. Transl. Life Sci. Innov. 2017, 23, 315–325. [Google Scholar] [CrossRef] [Green Version]
- Kulik, M.; Ochs, J.; König, N.; McBeth, C.; Sauer-Budge, A.; Sharon, A.; Schmitt, R. Parallelization in Automated Stem Cell Culture. Procedia Cirp 2017, 65, 242–247. [Google Scholar] [CrossRef]
- Kulik, M.; Ochs, J.; König, N.; Schmitt, R. Automation in the context of stem cell production—Where are we heading with Industry 4.0? Cell Gene Ther. Insights 2016, 2, 499–506. [Google Scholar] [CrossRef]
- Elanzew, A.; Nießing, B.; Langendoerfer, D.; Rippel, O.; Piotrowski, T.; Schenk, F.; Kulik, M.; Peitz, M.; Breitkreuz, Y.; Jung, S. The StemCellFactory: A modular system integration for automated generation and expansion of human induced plu-ripotent stem cells. Front. Bioeng. Biotechnol. 2020, 8, 1155. [Google Scholar] [CrossRef] [PubMed]
- Brennand, K.J.; Simone, A.; Jou, J.; Gelboin-Burkhart, C.; Tran, N.; Sangar, S.; Li, Y.; Mu, Y.; Chen, G.; Yu, D.; et al. Modelling schizophrenia using human induced pluripotent stem cells. Nat. Cell Biol. 2011, 473, 221–225. [Google Scholar] [CrossRef]
- Lee, G.; Papapetrou, E.P.; Kim, H.; Chambers, S.M.; Tomishima, M.J.; Fasano, C.A.; Ganat, Y.M.; Menon, J.; Shimizu, F.; Viale, A.; et al. Modelling pathogenesis and treatment of familial dysautonomia using patient-specific iPSCs. Nat. Cell Biol. 2009, 461, 402–406. [Google Scholar] [CrossRef] [PubMed] [Green Version]
- Lancaster, M.A.; Renner, M.; Martin, C.A.; Wenzel, D.; Bicknell, L.S.; Hurles, M.E.; Homfray, T.; Penninger, J.M.; Jackson, A.P.; Knoblich, J.A. Cerebral organoids model human brain development and microcephaly. Nature 2013, 501, 373–379. [Google Scholar] [CrossRef]
- Spence, J.R.; Mayhew, C.N.; Rankin, S.A.; Kuhar, M.F.; Vallance, J.E.; Tolle, K.; Hoskins, E.E.; Kalinichenko, V.V.; Wells, S.I.; Zorn, A.M.; et al. Directed differentiation of human pluripotent stem cells into intestinal tissue in vitro. Nat. Cell Biol. 2010, 470, 105–109. [Google Scholar] [CrossRef] [Green Version]
- Kumar, S.; Blangero, J.; Curran, J.E. Induced pluripotent stem cells in disease modeling and gene identification. Toxic. Assess. 2018, 1706, 17–38. [Google Scholar]
- Villa-Diaz, L.; Ross, A.; Lahann, J.; Krebsbach, P. Concise Review: The Evolution of human pluripotent stem cell culture: From feeder cells to synthetic coatings. Stem Cells 2013, 31, 1–7. [Google Scholar] [CrossRef] [Green Version]
- Kinney, M.A.; Sargent, C.Y.; McDevitt, T.C. The multiparametric effects of hydrodynamic environments on stem cell culture. Tissue Eng. PartB Rev. 2011, 17, 249–262. [Google Scholar] [CrossRef] [Green Version]
- Ludwig, T.; Levenstein, M.; Jones, J.; Berggren, W.; Mitchen, E.; Frane, J.L.; Crandall, L.J.; Daigh, C.A.; Conrad, K.R.; Piekarczyk, M.S.; et al. Derivation of human embryonic stem cells in defined conditions. Nat. Biotechnol. 2006, 24, 185–187. [Google Scholar] [CrossRef]
- Kim, Y.; Rim, Y.A.; Yi, H.; Park, N.; Park, S.-H.; Ju, J.H. The Generation of Human Induced Pluripotent Stem Cells from Blood Cells: An Efficient Protocol Using Serial Plating of Reprogrammed Cells by Centrifugation. Stem Cells Int. 2016, 2016, 1329459. [Google Scholar] [CrossRef] [PubMed]
- Takahashi, K.; Tanabe, K.; Ohnuki, M.; Narita, M.; Ichisaka, T.; Tomoda, K.; Yamanaka, S. Induction of Pluripotent Stem Cells From Adult Human Fibroblasts by Defined Factors. Obs. Gynecol. Surv. 2008, 63, 153. [Google Scholar] [CrossRef] [Green Version]
- Schenk, F.W.; Brill, N.; Marx, U.; Hardt, D.; König, N.; Schmitt, R. High-speed microscopy of continuously moving cell culture vessels. Sci. Rep. 2016, 6, srep34038. [Google Scholar] [CrossRef] [PubMed] [Green Version]
- Jung, S.; Ochs, J.; Kulik, M.; König, N.; Schmitt, R.H. Highly modular and generic control software for adaptive cell processing on automated production platforms. Procedia Cirp 2018, 72, 1245–1250. [Google Scholar] [CrossRef]
- Fan, M. Induced Pluripotent Stem Cells: Global Markets; BCC Research; BCC Pusblishing: Wellesley, MA, USA, 2020. [Google Scholar]
- Gabriele Hansen SVP. Evotec and Bristol-Myers Squibb Expand iPSC Collaboration; Evotec: Hamburg, Germany, 2020. [Google Scholar]
- Sullivan, T. A Tough Road: Cost to Develop One New Drug Is $2.6 Billion; Approval Rate for Drugs Entering Clinical Development Is Less than 12%. 2019. Available online: https://www.policymed.com/2014/12/a-tough-road-cost-to-develop-one-new-drug-is-26-billion-approval-rate-for-drugs-entering-clinical-de.html (accessed on 1 October 2020).
- Kramer, J.A.; Sagartz, J.E.; Morris, D.L. The application of discovery toxicology and pathology towards the design of safer pharmaceutical lead candidates. Nat. Rev. Drug Discov. 2007, 6, 636–649. [Google Scholar] [CrossRef]
- Götze, U.; Northcott, D.; Schuster, P. Investment Appraisal: Methods and Models; Springer: Berlin/Heidelberg, Germany, 2015. [Google Scholar]
- Hering, E. Investitions- und Wirtschaftlichkeitsrechnung für Ingenieure; Springer Vieweg: Wiesbaden, Germany, 2014. [Google Scholar]
- Bradu, M. Statistical-Financial Valuation Methods of the Investment projects. Theor. Appl. Econ. Rev. 2007, 508, 49–52. [Google Scholar]
- Zamfir, M.; Manea, M.D.; Ionescu, L. Return on Investment—Indicator for Measuring the Profitability of Invested Capital. Valahian J. Econ. Stud. 2016, 7, 79–86. [Google Scholar] [CrossRef] [Green Version]
- Olfert, K.; Rahn, H.-J. Einführung in die Betriebswirtschaftslehre, 11th ed.; NWB Verlag: Herne, Germany, 2016. [Google Scholar]
- Applied Biological Materials Inc. (abm), Custom iPSC Generation Service. Available online: https://www.abmgood.com/iPSC-Generation.html (accessed on 12 January 2021).
- Kilpinen, H.; Goncalves, A.; Leha, A.; Afzal, V.; Alasoo, K.; Ashford, S.; Bala, S.; Bensaddek, D.; Casale, F.P.; Culley, O.J.; et al. Common genetic variation drives molecular heterogeneity in human iPSCs. Nat. Cell Biol. 2017, 546, 370–375. [Google Scholar] [CrossRef] [Green Version]
- Carcamo-Orive, I.; Hoffman, G.E.; Cundiff, P.; Beckmann, N.D.; D’Souza, S.L.; Knowles, J.W.; Patel, A.; Papatsenko, D.; Abbasi, F.; Reaven, G.M.; et al. Analysis of Transcriptional Variability in a Large Human iPSC Library Reveals Genetic and Non-genetic Determinants of Heterogeneity. Cell Stem Cell 2017, 20, 518–532.e9. [Google Scholar] [CrossRef] [Green Version]
- Bar, S.; Benvenisty, N. Epigenetic aberrations in human pluripotent stem cells. EMBO J. 2019, 38, e101033. [Google Scholar] [CrossRef]
- Young, M.A.; Larson, D.E.; Sun, C.-W.; George, D.R.; Ding, L.; Miller, C.A.; Lin, L.; Pawlik, K.M.; Chen, K.; Fan, X.; et al. Background Mutations in Parental Cells Account for Most of the Genetic Heterogeneity of Induced Pluripotent Stem Cells. Cell Stem Cell 2012, 10, 570–582. [Google Scholar] [CrossRef] [PubMed] [Green Version]
- D’Antonio, M.; Benaglio, P.; Jakubosky, D.; Greenwald, W.W.; Matsui, H.; Donovan, M.K.R.; Li, H.; Smith, E.N.; D’Antonio-Chronowska, A.; Frazer, K.A. Insights into the Mutational Burden of Human Induced Pluripotent Stem Cells from an Integrative Multi-Omics Approach. Cell Rep. 2018, 24, 883–894. [Google Scholar] [CrossRef] [PubMed] [Green Version]
- Piotrowski, T.; Rippel, O.; Elanzew, A.; Nießing, B.; Stucken, S.; Jung, S.; König, N.; Haupt, S.; Stappert, L.; Brüstle, O.; et al. Deep-learning-based multi-class segmentation for automated, non-invasive routine assessment of human pluripotent stem cell culture status. Comput. Biol. Med. 2020, 129, 104172. [Google Scholar] [CrossRef] [PubMed]
Figure 1.
Expansion of stem cells.

Figure 2.
The StemCellFactory—a fully automated platform for the expansion of induced pluripotent stem cells (iPSC).
Figure 2.
The StemCellFactory—a fully automated platform for the expansion of induced pluripotent stem cells (iPSC).

Figure 3.
Cost distribution over machine lifetime (8 years) for manual and automated iPSC production.
Figure 3.
Cost distribution over machine lifetime (8 years) for manual and automated iPSC production.

Figure 4.
Economic analysis of automated and manual iPSC production for a machine lifetime of 8 years.
Figure 4.
Economic analysis of automated and manual iPSC production for a machine lifetime of 8 years.

Figure 5.
Sensitivity analysis of automated and manual iPSC production.


Table 1.
Key assumptions for economic analysis of manual and automated iPSC production.
| Position | Unit | Value |
|---|---|---|
| Produced and Sold Cell Line per annum (p.a.) | - | 213.00 |
| Selling Price per Cell Line [34] | € | 10,380.00 |
| Growth Rate of Selling Price p.a. [34] | % | −10.00 |
| Growth Rate of Produced and Sold Cell Lines p.a. | % | 0.00 |
| Market Discount Rate | % | 5.00 |
| Hourly Wage for Medical Technical Assistant (MTA) | € | 35.00 |
| Growth Rate of Wage p.a. | % | 3.35 |
| Working days per year | Days | 260 |
| Life Time of Machine | Years | 8.00 |
| Depreciation Period | Years | 8.00 |
| Depreciation Method | - | linear |
Publisher’s Note: MDPI stays neutral with regard to jurisdictional claims in published maps and institutional affiliations. |
© 2021 by the authors. Licensee MDPI, Basel, Switzerland. This article is an open access article distributed under the terms and conditions of the Creative Commons Attribution (CC BY) license (http://creativecommons.org/licenses/by/4.0/).
Share and Cite
MDPI and ACS Style
Nießing, B.; Kiesel, R.; Herbst, L.; Schmitt, R.H. Techno-Economic Analysis of Automated iPSC Production. Processes 2021, 9, 240. https://doi.org/10.3390/pr9020240
AMA Style
Nießing B, Kiesel R, Herbst L, Schmitt RH. Techno-Economic Analysis of Automated iPSC Production. Processes. 2021; 9(2):240. https://doi.org/10.3390/pr9020240
Chicago/Turabian StyleNießing, Bastian, Raphael Kiesel, Laura Herbst, and Robert H. Schmitt. 2021. "Techno-Economic Analysis of Automated iPSC Production" Processes 9, no. 2: 240. https://doi.org/10.3390/pr9020240
Note that from the first issue of 2016, this journal uses article numbers instead of page numbers. See further details here.