Life-Cycle Assessment of Dairy Products—Case Study of Regional Cheese Produced in Portugal
by
 , ,
, ,
Óscar Soares Nunes
1, 
Pedro Dinis Gaspar
1,2,* ,
,
José Nunes
3,
Paula Quinteiro
4,
Ana Cláudia Dias
4 and 
Radu Godina
5,*
1
Electromechanical Engineering Department, University of Beira Interior, Rua Marquês d’Ávila e Bolama, 6201-001 Covilhã, Portugal
2
C-MAST—Centre for Mechanical and Aerospace Science and Technologies, 6201-001 Covilhã, Portugal
3
Agriculture School, Polytechnic Institute of Castelo Branco, Quinta da Senhora de Mércules, 6001-909 Castelo Branco, Portugal
4
Centre for Environmental and Marine Studies (CESAM), Department of Environment and Planning, University of Aveiro, Campus Universitário de Santiago, 3810-193 Aveiro, Portugal
5
UNIDEMI, Department of Mechanical and Industrial Engineering, Faculty of Science and Technology (FCT), Universidade NOVA de Lisboa, 2829-516 Caparica, Portugal
*
Authors to whom correspondence should be addressed.
Processes 2020, 8(9), 1182; https://doi.org/10.3390/pr8091182
Submission received: 6 August 2020
/
Revised: 12 September 2020
/
Accepted: 15 September 2020
/
Published: 18 September 2020
(This article belongs to the Special Issue Sustainable Development of Waste towards Green Growth)
Abstract
:Nowadays, there is a growing promotion to label products ecologically in European markets. Knowing that daily products have relevant environmental impact associated with their production, it is of utmost importance to analyse all the related production processes for a better understanding of each process impact. The present study analysed the potential environmental impacts of a Portuguese regional product, the Beira Baixa cheese, coming from the largest national sheep milk region. So, a life cycle assessment (LCA) methodology is used from -cradle-to -gate, including the supplying of the animal feedstock. Impact calculations are performed using the ReCiPe midpoint 2008 method, allowing an analysis of the environmental impacts contributing to climate change, terrestrial acidification, freshwater and marine eutrophication of all productive processes. The results have shown that the greatest impacts occur within the milk production process for all four selected impact categories. This happens mainly due to the fodder cultivation process, also necessary to produce animal feed, which contain processes of fertilization and land preparation. The enteric fermentation and manure management processes have also shown relevant contributions. The impact assessment also showed that the cheesemaking industry has practically insignificant impacts. Nonetheless, the cheesemaking industry can promote their business with these results, by advertising and marketing their product as environmentally friendly, with production processes causing reduced impacts, and therefore also their products.
1. Introduction
Currently, the major industrial concerns are related to energy, environment, quality, and cost. Cost and environmental impacts are regarded as a key factor for corporations; in order to achieve success, it is crucial to find solutions that optimize overall sectors processes. Among these, energy has been identified as one of the most expensive factors over the years, which also brings unwanted environmental pollution [1,2].
There has been an increase of regulations in international markets, due to energy and environmental concerns [3,4,5]. Knowing that all products have a potential environmental impact, it will become crucial to analyse all production processes. Thus, it is of utmost importance to use tools such as life cycle assessment (LCA), which is known as an environmental management tool and consists of compilating and evaluating inputs, outputs and corresponding environmental impacts of a good or service throughout its life cycle [6].
This work evaluated the potential environmental impacts resulting from the production of a sheep cheese in Beira Baixa, which in the Nomenclature of Territorial Units for Statistics (NUTS3) is the subregion of Centro Region (NUTS II subdivision) of Portugal. This assessment was performed using the LCA methodology, following a cradle-to-gate approach. Beira Baixa region is responsible for the highest sheep milk production [7], having around 74% of the total dairy herd in Portugal. In 2015, the total cheese production in Portugal was 77,167 t, of which 11,502 t correspond to the total sheep cheese produced [8].
During the year 2014, the world production of sheep cheese was 680.3 million tons. Europe is the region with the highest sheep cheese production, with around 50% of total world production, followed by Asia with 40.2% and Africa with 8.4%, with America owning a total of only 1.2%. Greece is considered the world’s main producer with about 125 thousand tons, which was equivalent to 18.4% of the total production during that year. Furthermore, it is noteworthy that China leads with a sheep cheese production around 16%, followed by Spain with 9.6%. Portugal ranks as the 14th world producer, with a total production of about 11.4 thousand tons [9].
The manufacture of sheep cheese in Portugal is regarded as a very traditional activity, by using distinct processes giving the final product a special texture and analyse [10]. This tradition has been maintained over the years, which led to a recognition of its quality on some cheeses, benefitting from the protection designation of origin (PDO) from the European Union legislation [11], meaning that this cheese has special characteristics related to a location, and, it is the only cheese in Portugal to have this designation.
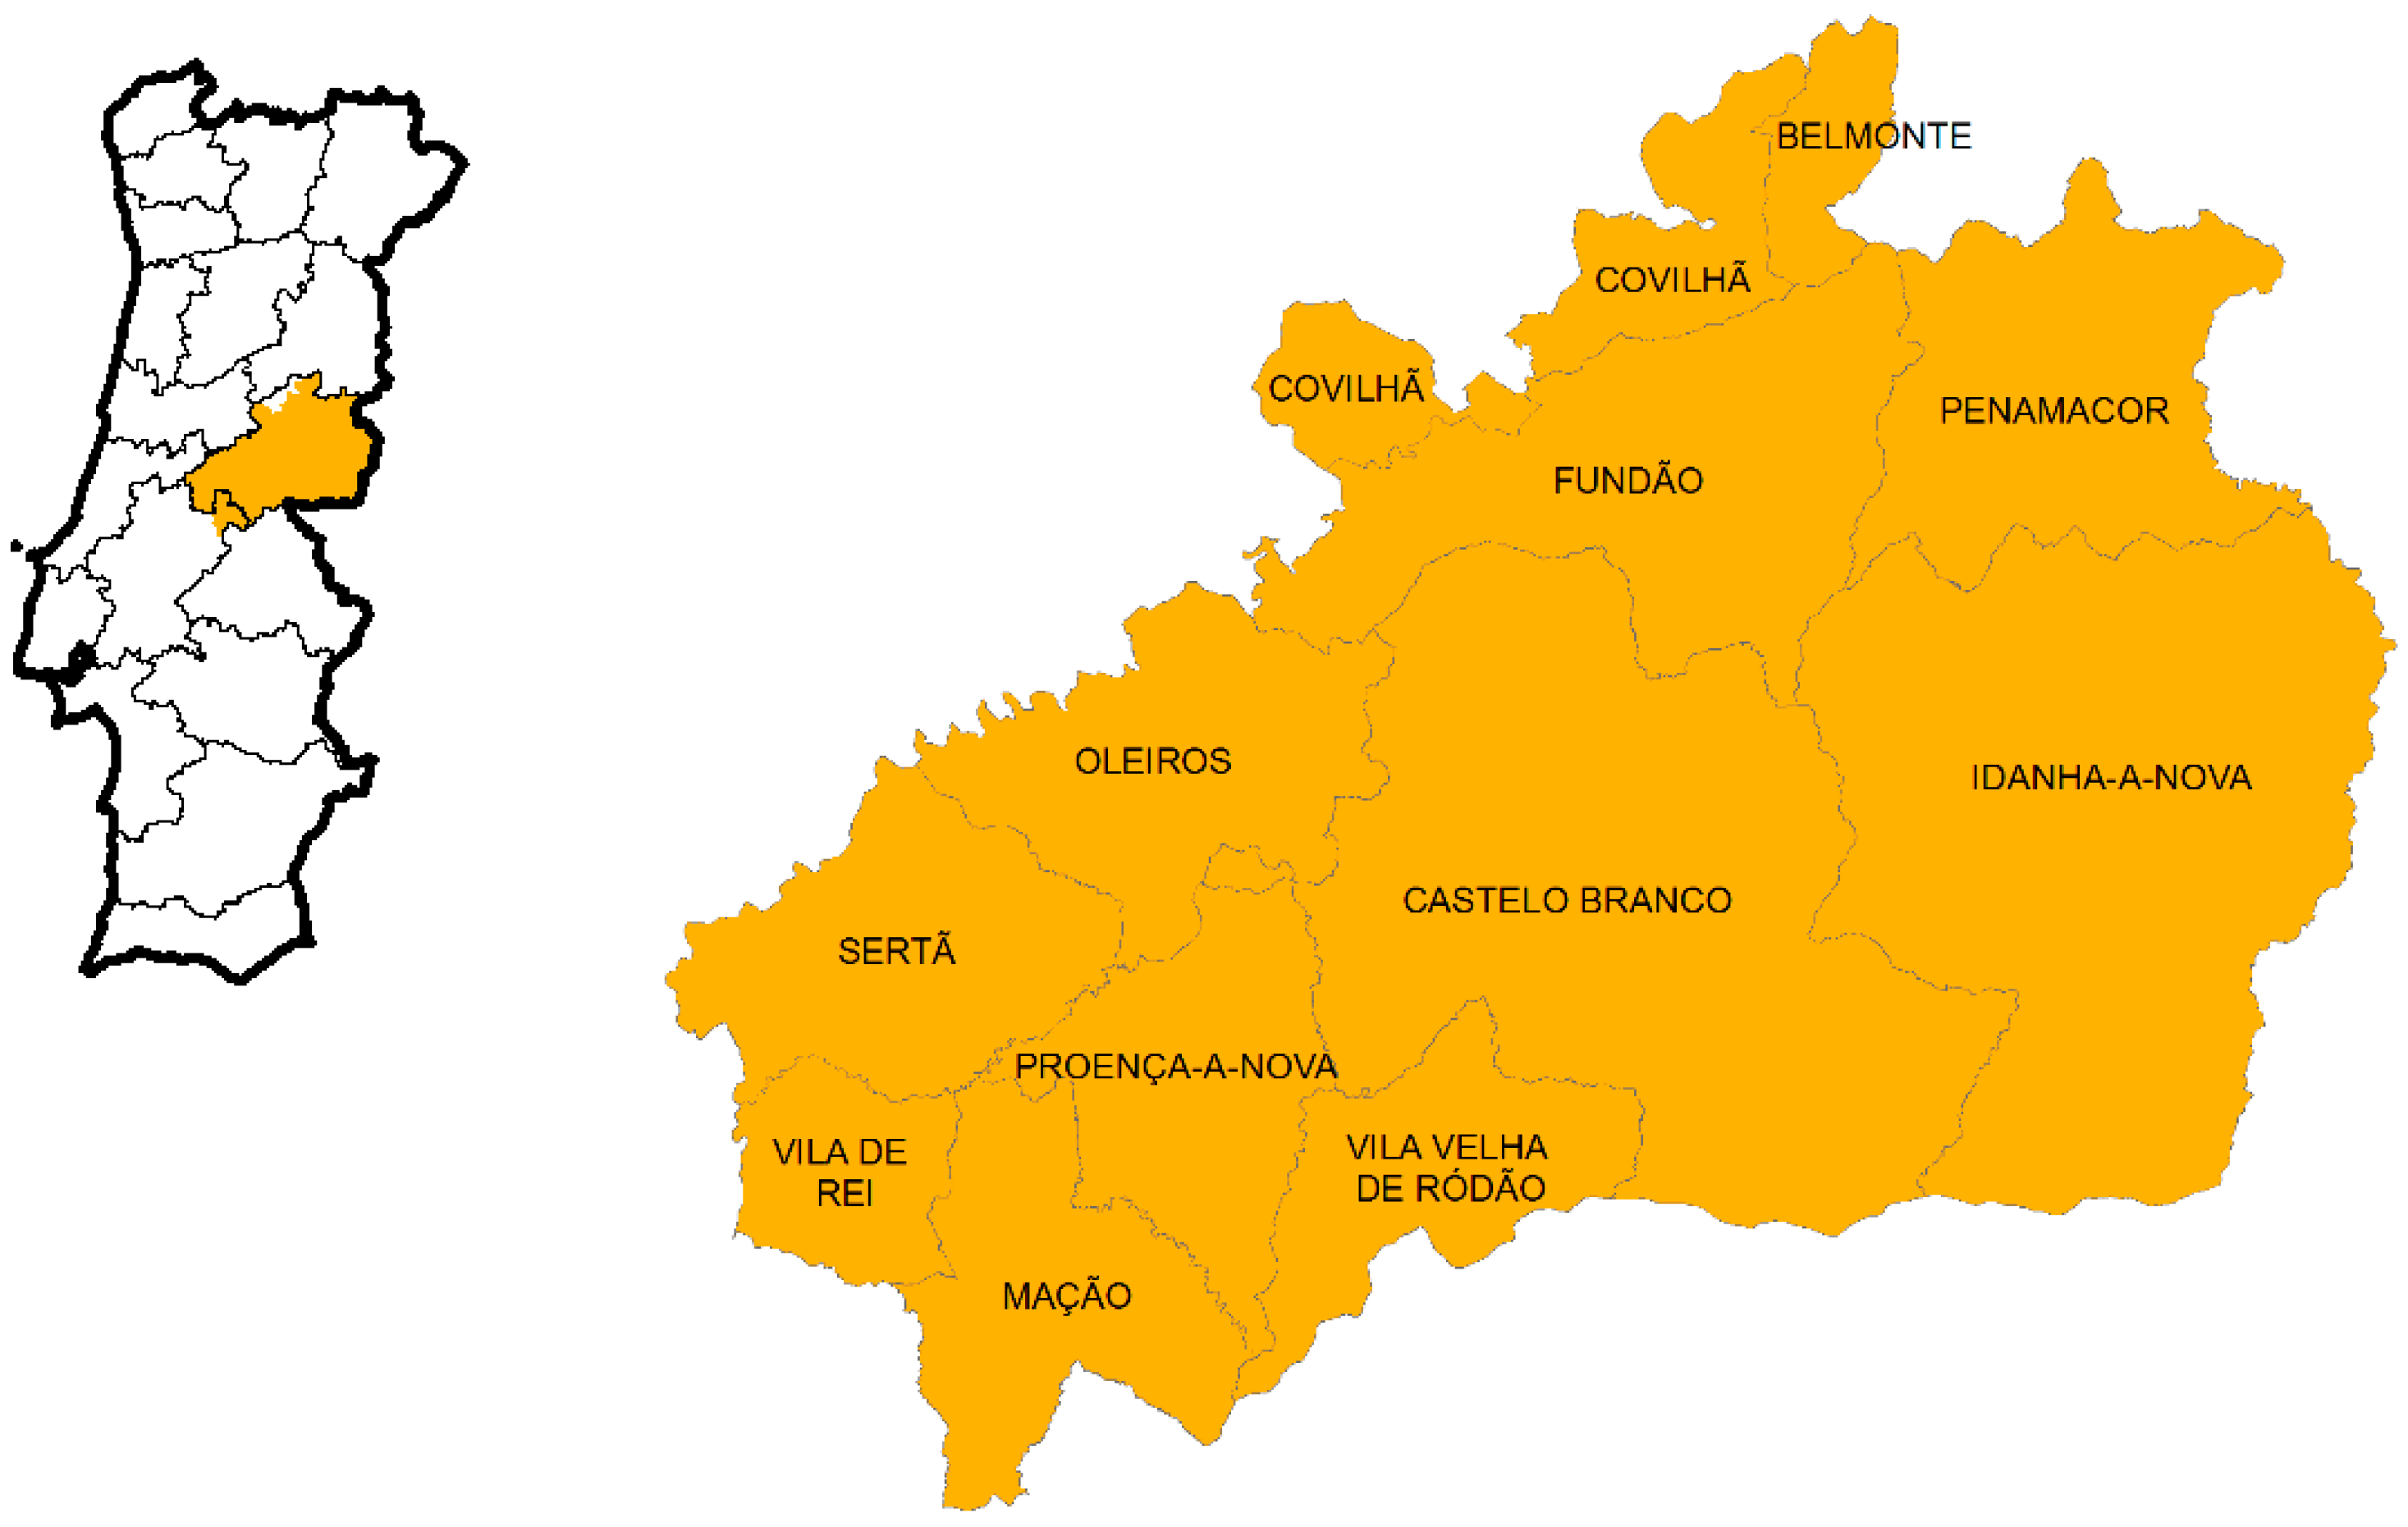
The Beira Baixa region, represented in Figure 1, is known for its sheep dairy products, specially known for the production of high-quality cheeses, such as the Castelo Branco, Picante and Amarelo cheeses, all of them PDO products [10].
For the manufacture of these cheeses, only sheep or goat milk from dairy farms located in the Beira Baixa geographical area is allowed for its production. The cheeses are mainly based on raw milk, not requiring any heat treatment for their manufacture, and are characterized by the simple addition of rennet, originated from a cardoon plant (Cynara Cardunculus L.) and salt, without any other addition of dairy cultures [12].
The unique characteristics of these cheeses are also due to the fact of the sheep or goat herds being kept mainly outdoors throughout the year, having access to a wide range of several natural pastures. As for the animal diet, it is not only based on natural pastures, but also the additional supplementation of forages and concentrated feed [13,14].
The goal of this study was to apply the LCA methodology on the production process of the traditional “Beira Baixa” Portuguese sheep cheese, by quantifying its potential environmental impacts, therefore, revealing the most critical processes of its manufacture, and establishing a comparison with other similar cheese studies of dairy products. These results can be seen as a driver for the implementation of production management strategies that may influence climate change and other impact categories. In this way, the production of more ecological products, in this particular case, traditional sheep cheese, may be accomplished, that is not solely required by consumers and international markets, but also by national and international environmental guidelines and directives.
2. Materials and Methods
All the data were collected in a typical cheese making company located at Castelo Branco (Portugal). It is a small familiar company, with eight workers, producing cheese for more than three decades. The LCA of “Protected Designation of Origin” cheese were performed following ISO 14040 and 14044 standards.
2.1. Environmental Science and Pollution Research
To carry out this LCA study, distinct functional units (FU) were adopted for the different systems, in the case of the dairy farm, an FU of 1 kg raw sheep milk was considered. Whereas, for the cheese factory, an FU of 1 kg of produced sheep cheese ready to be consumed was chosen. The selection of these units is in conformity with other cheese studies [15,16]. A cradle-to-grave approach was applied, i.e. since it starts from dairy farming, including the production of feed and other foods, including milk collection, to milk production.
2.2. System Boundaries
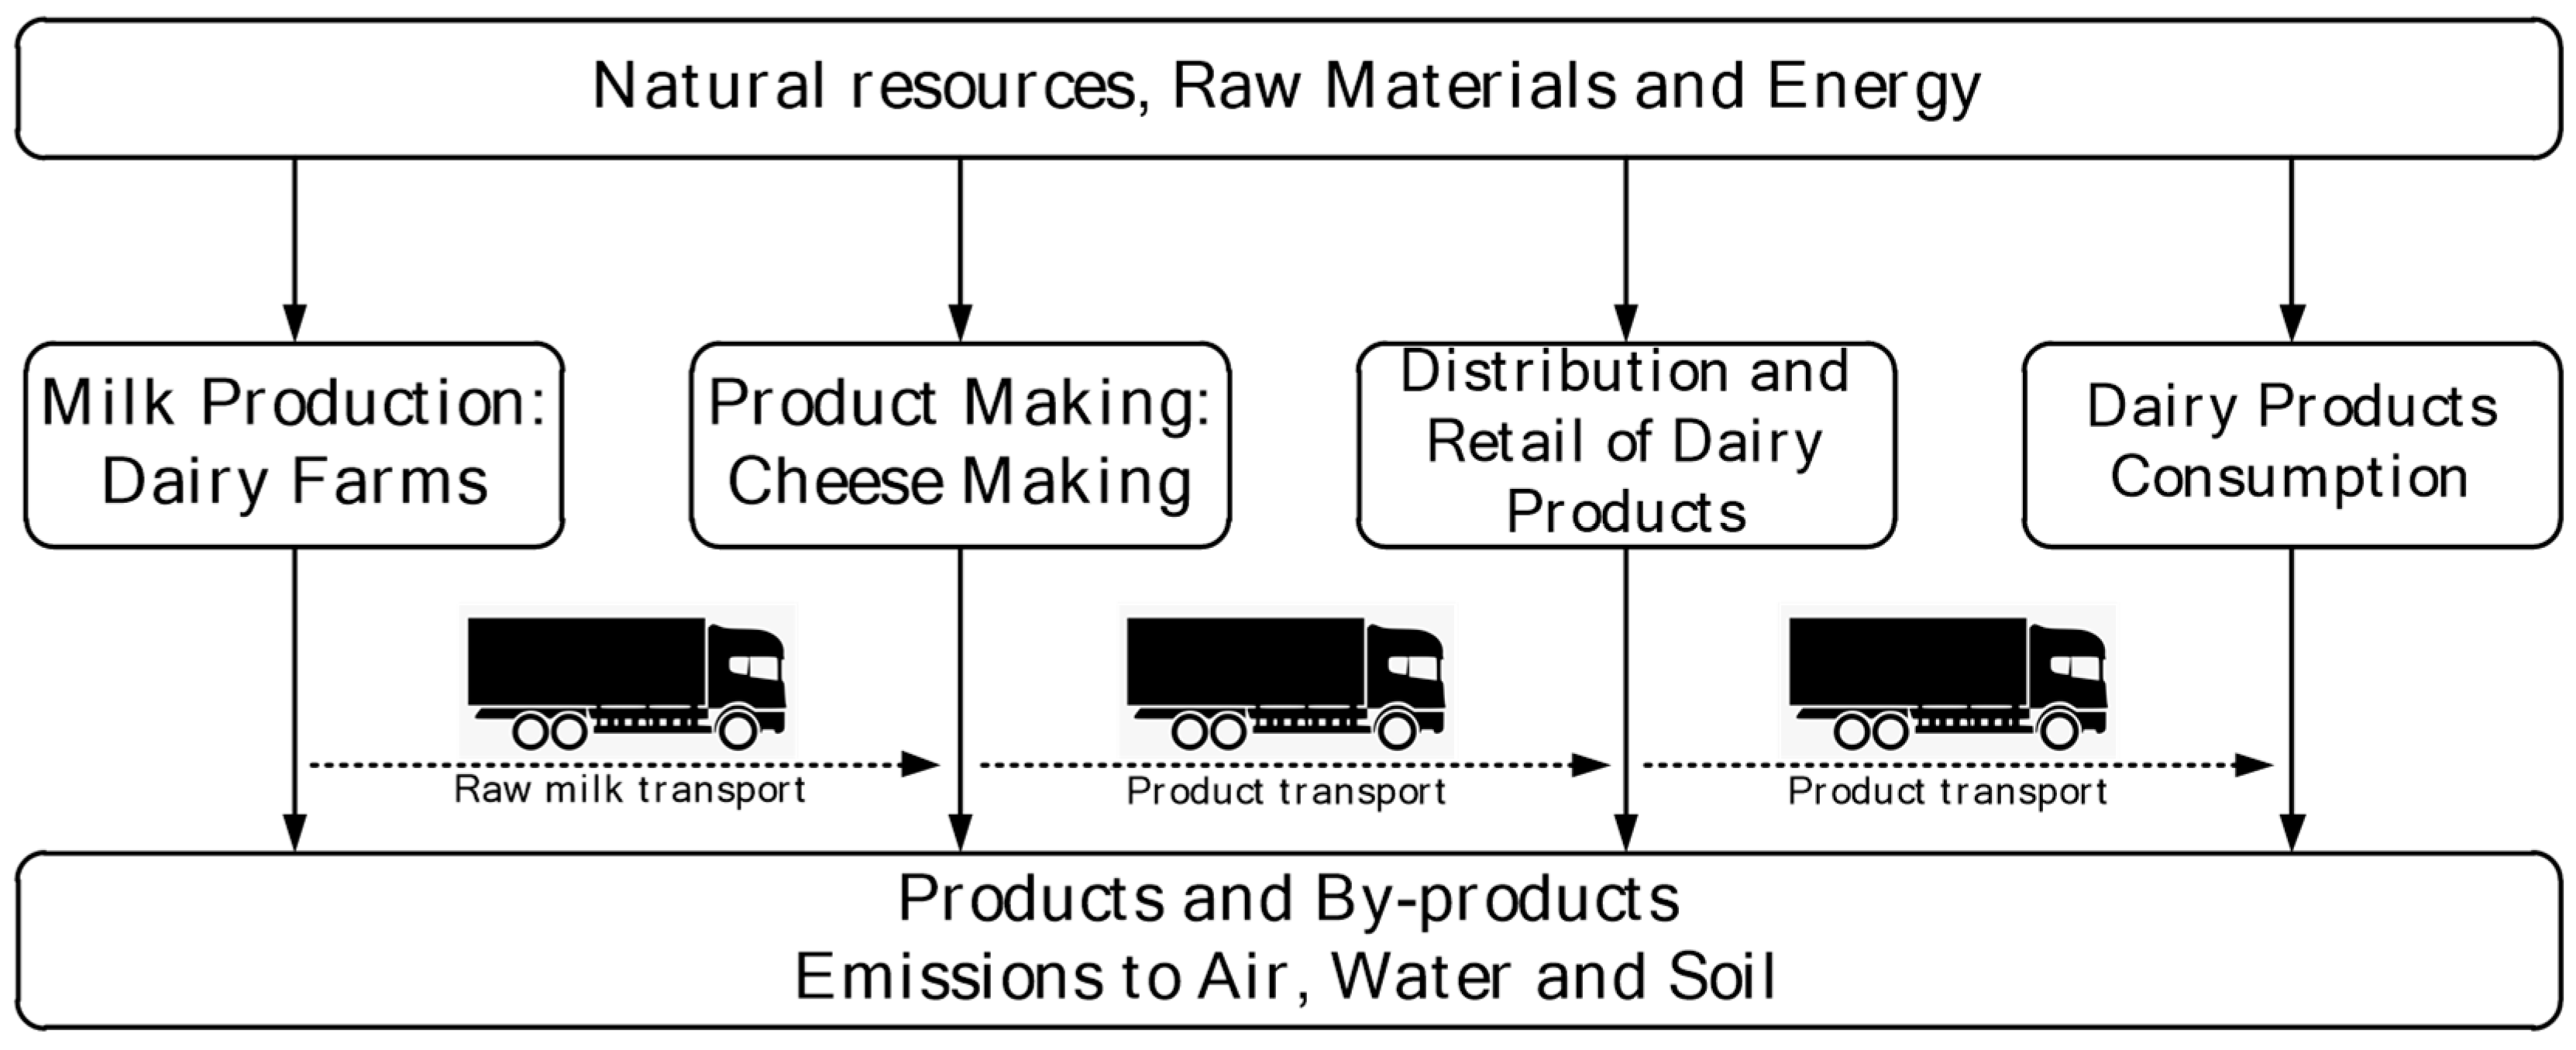
In order to separate the systems, first, the raw milk production of a regional dairy farm was assessed and after, a cheese factory from the milk to cheese processes, until the retail distribution was analysed. The boundaries considered on both assessed systems are as shown on Figure 2, where the main mass and energy flows of the production were considered. Moreover, within this system, all inventory data concerning the production process of the agglutination of all animal feed ingredients were considered. According with other studies, the production of capital goods of machinery and building was excluded [16,17].
The transport to the customer and consumption of milk has been excluded from the system boundaries, since these are hard to quantify. The transport of workers and machinery was excluded, as well as the production of capital goods (buildings, machinery and equipment).
2.3. Dairy Farm
The assessed cheese factory receives milk from twenty-three different regional dairy farm suppliers. In order to simplify the analysis of this stage/system, and by being a regional product where all producers have typical regional proceedings, one of the raw milk suppliers was chosen for assessment as the only producer, a procedure which agrees and was adapted in similar studies [16].
The chosen dairy farm consists of an extensive regime system, where the sheep wander during a lot of their time in open air, where they feed themselves on surrounding grazing. Concentrated feed is provided to attract the animals during the milking procedure and preserved fodder, such as alfalfa, black-eyed pea plants, maize, oats and rye, the latter two are also used as straw for bedding.
The milk production stage/system was divided into three distinct subsystems: concentrated feed production, fodder production and milk production [16].
2.3.1. Subsystem 1 (S1)—Concentrated Feed Production
The concentrated feed supplying of this farm was entrusted to a cooperative where the dairy farm producer is registered as a partner.
Within this system, all the inventory data referred to the production process of the agglutination of all animal feed ingredients were considered. This particular feed consists of maize (27%), alfalfa meal (24%), oats (22%), sunflowers (15%), soybean meal (7%), cottonseeds (2%), beet flour (2%), and the remainder was composed of vitamins, hydrogenated fatty acids, baking soda and beet molasses.
This blend is transformed into feed pellets, where the data of consumed electricity, fuel and water for the manufacture process were assessed.
2.3.2. Subsystem 2 (S2)—Fodder Production
For the fodder inventory data, cultivation operations of agricultural machines and their fuel consumption were taken from the ecoinvent database for all distinct forages, which includes all soil preparation processes, sowing, manure and fertilizer distribution, harvesting and the transportation to the warehouse [18].
Regarding irrigation water use, no data were included, because all plantations were based on an unirrigated production, which is common practice in this region.
The farm is also based on organic forage farming, but due to the fact that database data already include fertilizers, only the available organic forages, were considered with no fertilization. Lastly, the annual manure production from all animals of 150 t was included.
The annual production of dried fodder, 85% of dry matter (DM) of alfalfa was 10 t∙ha−1 d.b.; the farm also externally imports 100 t per year. Black-eyed peas have an annual production of 0.5 t∙ha−1 d.b. and the maize 0.7 t∙ha−1 d.b. Forages meant for straw production with a percentage of 90% dry-matter fulfil an annual yield of 0.43 t∙ha−1 d.b. and 0.5 t∙ha−1 d.b. of rye and oats respectively.
2.3.3. Subsystem 3 (S3)—Milk Production
The last subsystem gathers information on the remaining carried out activities on the dairy farm, as well as the information belonging to the sheep flock.
This subsystem can be divided into three steps: the stable where the sheep are housed mainly during the night period and during the winter; the milking room where the animals spend 5 h on a daily basis for milking purposes; the refrigeration room to storage and refrigerate the milk gathered from the milking room.
The farm has a total of 950 sheep, 500 of which are dairy sheep. No distinction was made between animal diets in their different stages of life, not only because there are no significant differences between them. Each animal consumes about 0.6 kg of forage food and around 1.2 kg concentrated feed per day. The milk production on the farm is around 820 L per day and about 300,000 L of milk annually. The gathered milk then goes to the refrigeration storage room, where the water used to wash the milking equipment and its pipes was included in the inventory data, and the cleaning agents used to disinfect the equipment and the animals. As far as effluents are concerned, the emissions of the manure were included in inventory data.
Regarding wastewater data, the water used to wash the milking room was also included, but not its emissions, due to lack of data, a total annual water use of 2358 m3 was accounted.
2.4. Cheese Factory
The cheese making system wraps up all processes needed to produce the product, starting from the milk reception of one of the regional dairy farms to the cheese packaging, and ending with its distribution [19]. The cheese production process is based on the coagulation of casein and whey proteins present in milk, where cheese is obtained through coagulation processes, drainage and moulding, giving the cheese its shape and lastly the cure [20].
For this study, all those processes were considered as a whole system, where inventory data were obtained based on annual values of the assessed factory, namely of electricity, fuel, water, salt, cleaning agents, packaging materials and transportations. The use of cardoon was excluded because of lack of inventory data, similar to studies where cultures were not considered due to lack of information [16].
The whey resulting from the cheese processing does not get mixed into wastewater treatment in this case, instead it is offered to the local animal producers in its entirety; as such, its transportation was also not included in the systems boundaries.
Cheese Production Process
The raw material for this product is either sheep or goat milk, stemming from local farms located on the geographical area of Beira Baixa. The milk is transported and refrigerated on a maximum temperature of 6 °C [21]. The assessed factory receives milk on a daily basis, which then gets filtered and clarified in order to remove greater impurities, like animal hair for example. After this process, it is sent to tank, where the milk stays on a temperature between 4 to 6 °C. Before the coagulation, the milk gets a low thermal treatment between 26 to 28 °C, for an ideal coagulation temperature. After hitting the temperature, a rennet is added, which in this particular case is cardoon (Cynara cardunculus L.), which is very typical for this region and product [22]. The coagulation process may take between 30 to 60 min to happen, until a curd is obtained. The curd is then cut evenly to promote whey removal, and then it rests for a short time to expel whey even further, until the final mouldable curd is formed [23]. After this process, the curd is spread out on moulds with its characteristic shape and pressed during around two hours to totally drain the whey, and therefore enhance the cheese texture [24]. The following process is the salting, which serves not only for cheese seasoning but also to hasten the humidity extraction [25]. The salt immersion time varies according to its size; in this case, the salt is added in a traditional way, spread over the cheese surface after the cheese assembly [21]. After the brine removal, it is followed by the cheese ripening, which is carried out under controlled conditions by simulating ideal environmental conditions for the process, in order to dry the cheese. The first phase consists of fermentation, where the cheese is placed on a relative air humidity between 96 to 98% and an air temperature between 4 to 6 °C. These conditions last for at least ten days, which are important to control the action of microorganisms during fermentation and for crust shaping [26]. The second phase consists on maturation, where the cheese is first washed with slightly salted water, in order to keep a clean yellowish crust [27]. The cheese is also placed in an environment with a relative air humidity between 86 to 90% and a higher air temperature, between 8 and 12 °C for at least fifteen days. Lastly, after the ripening process, the cheese is labelled and packaged for retail distribution inside cardboard boxes [24]. Thus, the cheese production process takes between 30 to 60 days. During this period, each one of these steps of the production process generates environmental impact. This impact is mostly related to the environmental control of air temperature and humidity, heat sources, and dirty waters from cleaning (process and cleaning).
2.5. Inventory Analysis
In this study, real data were gathered from the annual productions of 2015/2016 data, with surveys for the concentrated feed cooperative data, surveys, interviews and observations made for the dairy farm data and interviews and observations for the cheese factory data. In the case of the latter, some data from a previously elaborated study in the same factory was used [28].
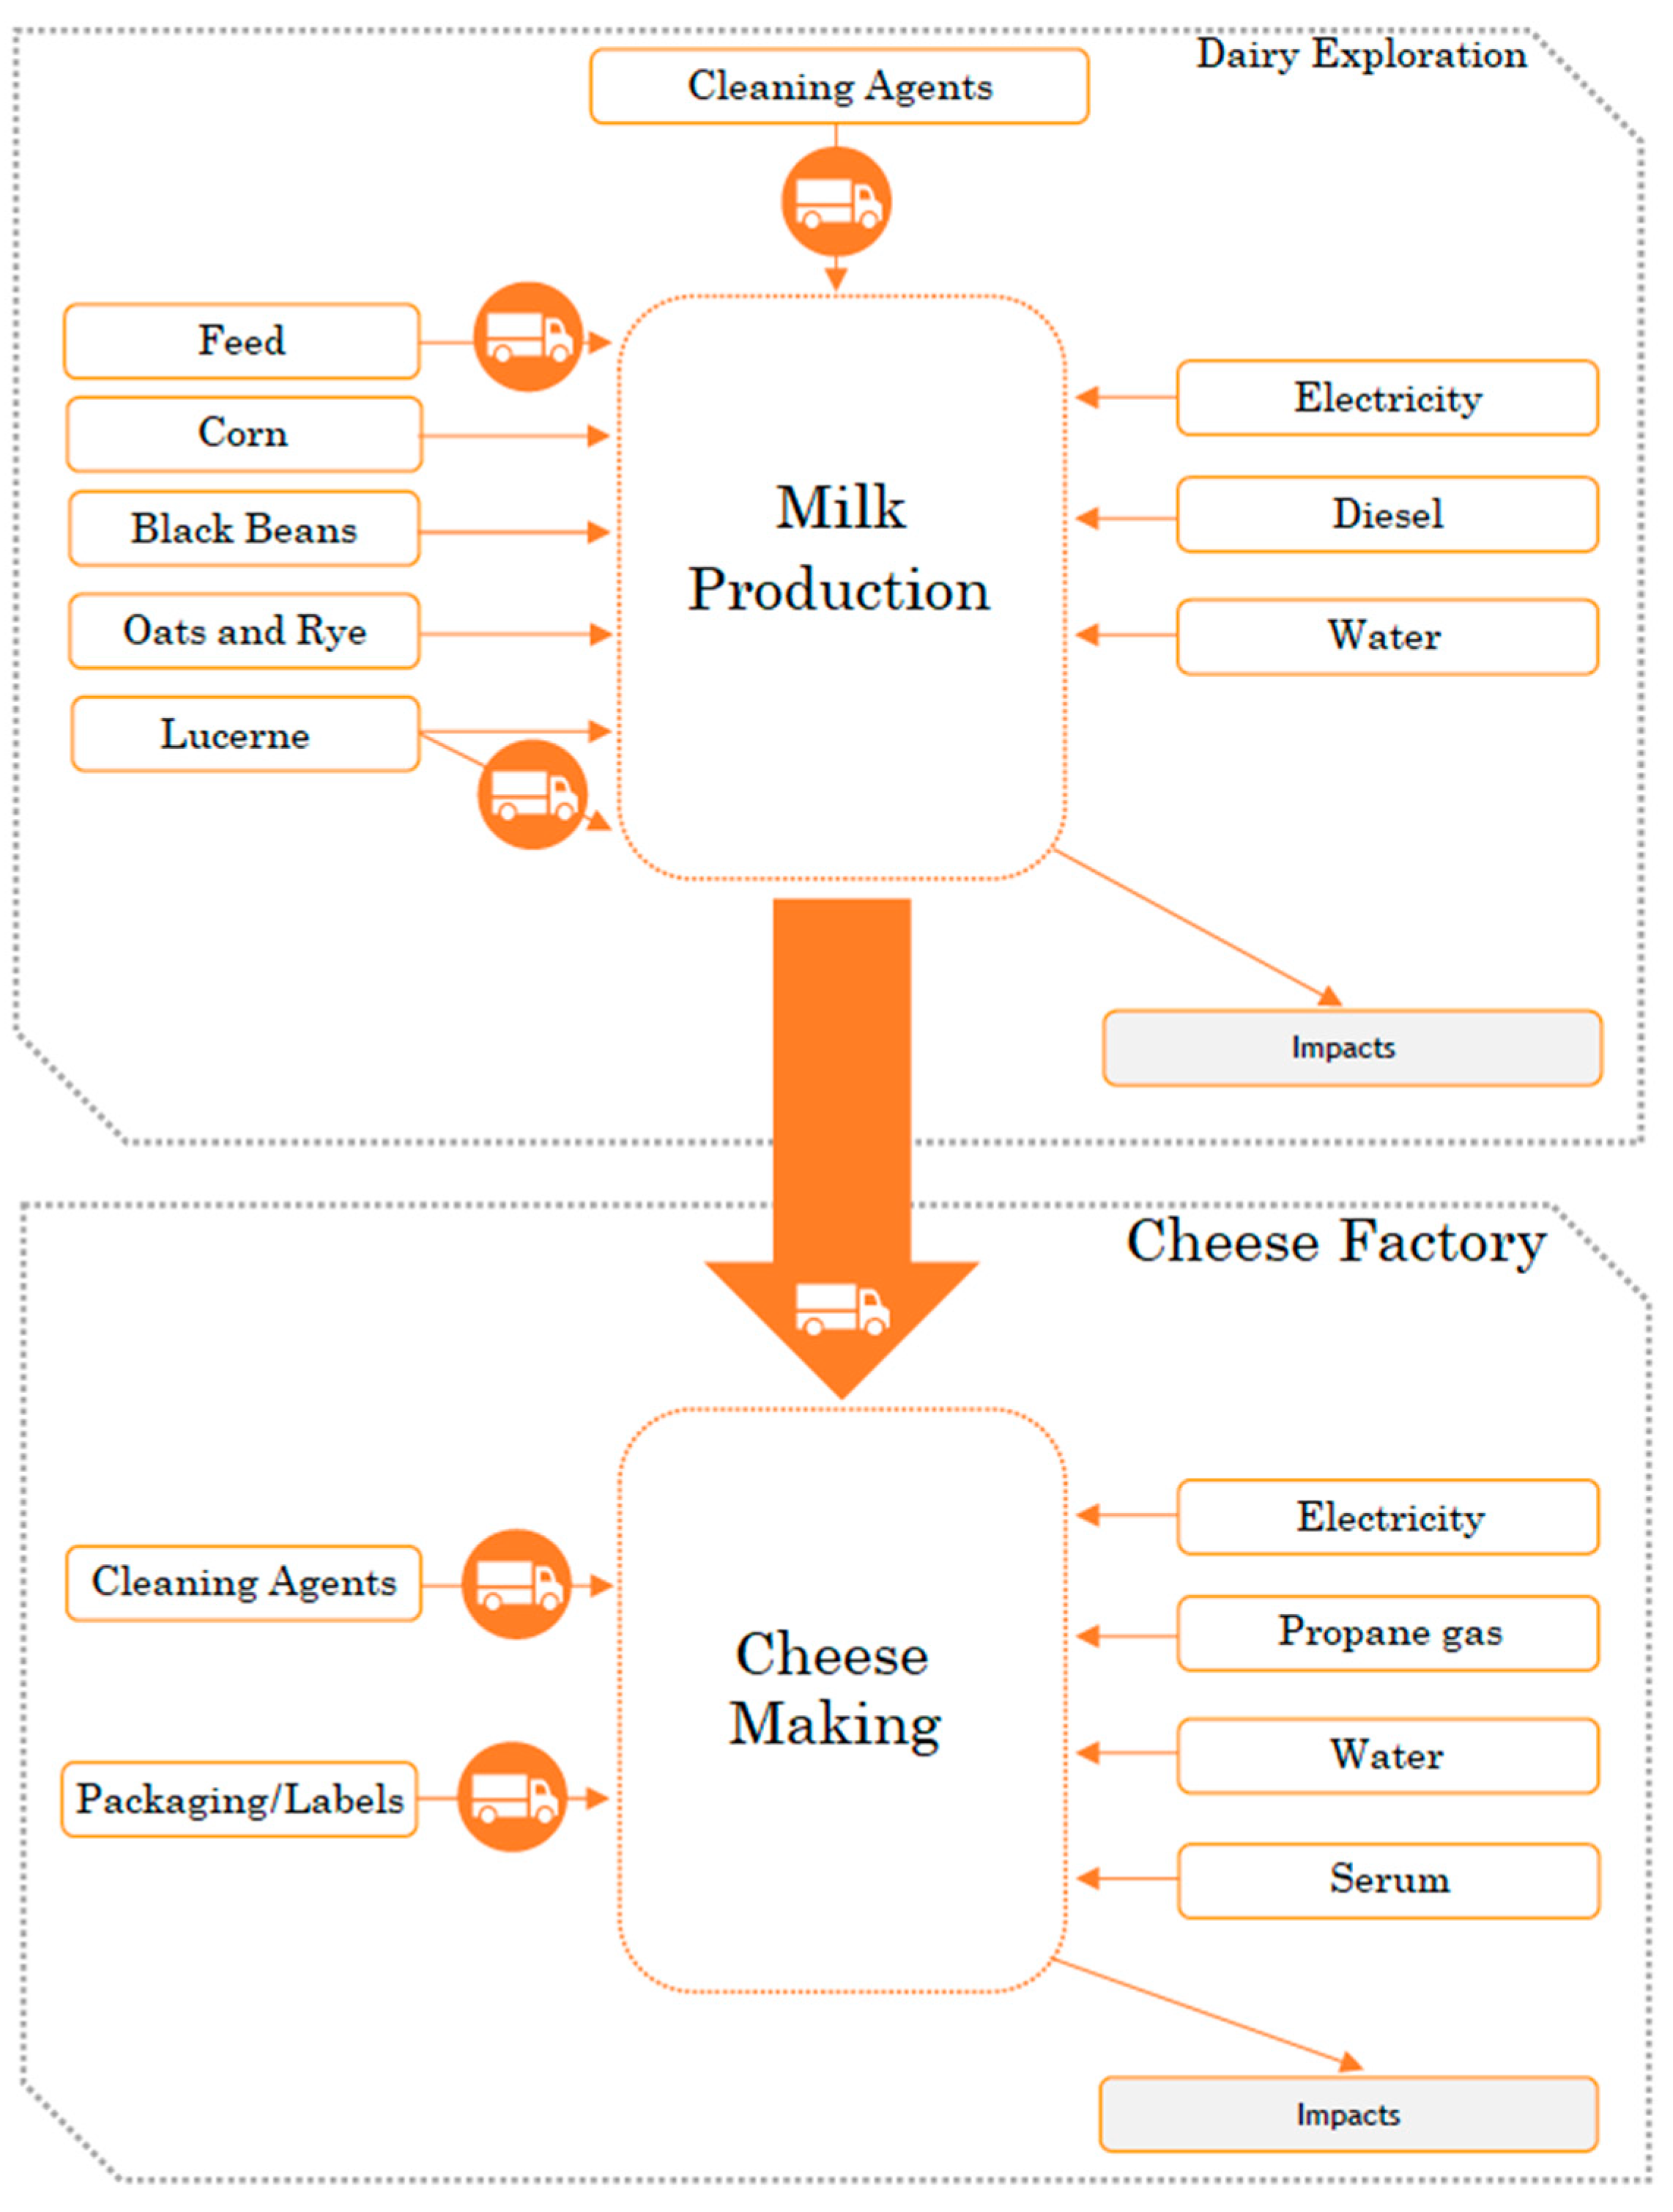
All primary data of inputs and outputs for the inventory information related to milk and cheese production of this study can be seen in Figure 3, and details can be found in Table 1 and Table 2.
The dairy farm includes input data of concentrated feed, plantations for fodder from the own farm, electricity, fuel, and cleaning agents based on 1L raw sheep milk. All these data will influence the impacts of milk production, which then gets transported to the dairy factory, where it will be transformed into cheese.
In Table 1 and Table 2, the unit of mass is on a dry basis. The materials are from annual consumption. These values were supplied by the company. The results were obtained from the company invoices. Energy consumption was obtained by the analysis of the invoices of the electricity supplier as well as from the installation of two energy analysers over two weeks. One of the energy analysers was installed in the main electricity switchboard while the second was installed in the supply electrical circuit of the refrigeration systems. The refrigeration systems consume almost half of the electricity of the company.
As for the dairy factory, the input data consist mainly of electricity, boiler fuel, packaging and labels and cleaning agents, in order to obtain the final impact of a FU of 1 kg sheep cheese.
The whey derived from cheese production was not accounted for, because the factory gives it away to local animal producers, which then use this as animal food, so it does not have environmental impacts associated to the factory. Like was mentioned before, cardoon data was considered negligible as well, because of the small quantities it weighs, with an annual consumption of 100 L. Lastly, the used plastic did not make it into the inventory data either, once again because of the small quantities used, with an annual consumption of 30 kg, which was also considered negligible.
All animal feed and fodder data related to agriculture activities were taken from the Ecoivent database, which includes manure, fertilization and agricultural machinery time data, for the cultures of maize, alfalfa, oats, rye and black-eyed peas plants, and all cultures needed for the concentrated feed [18].
During the simulation of these data on the LCA tool GaBi, there was an absence of some cultures on the database, which had to be replaced by similar ones, namely the alfalfa, which was replaced by clover due to its planting similarities, and because it is a common planted species for ruminants in the Beira Baixa region [29]. Moreover, the black-eyed peas were non-existent on the database and were replaced by fava beans, as the only bean available with an organic mindset planting, thus, resembling the real case.
Data from the electricity generation was chosen with a Portuguese profile and taken from the ecoinvent database [18]; the same was also valid for cleaning agents data [18] and is valid for Table 1 and Table 2. For diesel production data, needed not only for the transportation but also agricultural machinery, the info was taken from the GaBi database itself [30].
Regarding the values of “Outputs to environment”, particularly combustion emission data from the boilers, from the concentrated feed cooperative and the cheese factory, these were calculated from “Guidelines for National Greenhouse Gas Inventories” [31], as well as “Air Pollutant Emission Inventory Guidebook” [32]. Moreover, the enteric fermentation of animals and its manure management emission data were taken from Intergovernmental Panel on Climate Change (IPCC) [31].
The travelled distance for transportation and vehicle dimension data were also considered from the surveys and interviews, and were inserted based on average transport distances to its destination. After these data are entered on the LCA tool, GaBi calculates the emissions of the trips and turns, based on the average distance information and input values of the transported materials, as seen in Table 3.
The quantitative impact assessment was performed for 4 impact categories—climate change, terrestrial acidification, freshwater eutrophication and marine eutrophication—applying the characterization factors and the respective equations from the ReCiPe midpoint 2008 method [33].
2.6. Comparison of Results with Similar Studies
There are several cheese LCA studies in the literature, however with different realities compared to the present study, since these assessed mostly cow milk cheeses with raw milk stemming from an intensive animal production. While the present study intended to assess a typical regional sheep cheese, produced with raw sheep milk stemming from an extensive method, in this study, a comparison is made from of the most identical available studies with the present study, especially when the ones with a more in-depth comparison was made with three studies, namely [34,35,36]. These three studies were chosen for comparison purposes, not only because of being recent studies, but also because environmental impacts are presented with a midpoint ReCiPe method and the boundary parameters are from a cradle-to-gate perspective, all these characteristics coinciding with the present study. Comparing the results of this work with the results from the literature is an important factor for the validity of this entire study.
3. Results and Discussion
3.1. Impact Assessment
Table 4 presents the total impact obtained for the production of 1 kg of cheese.
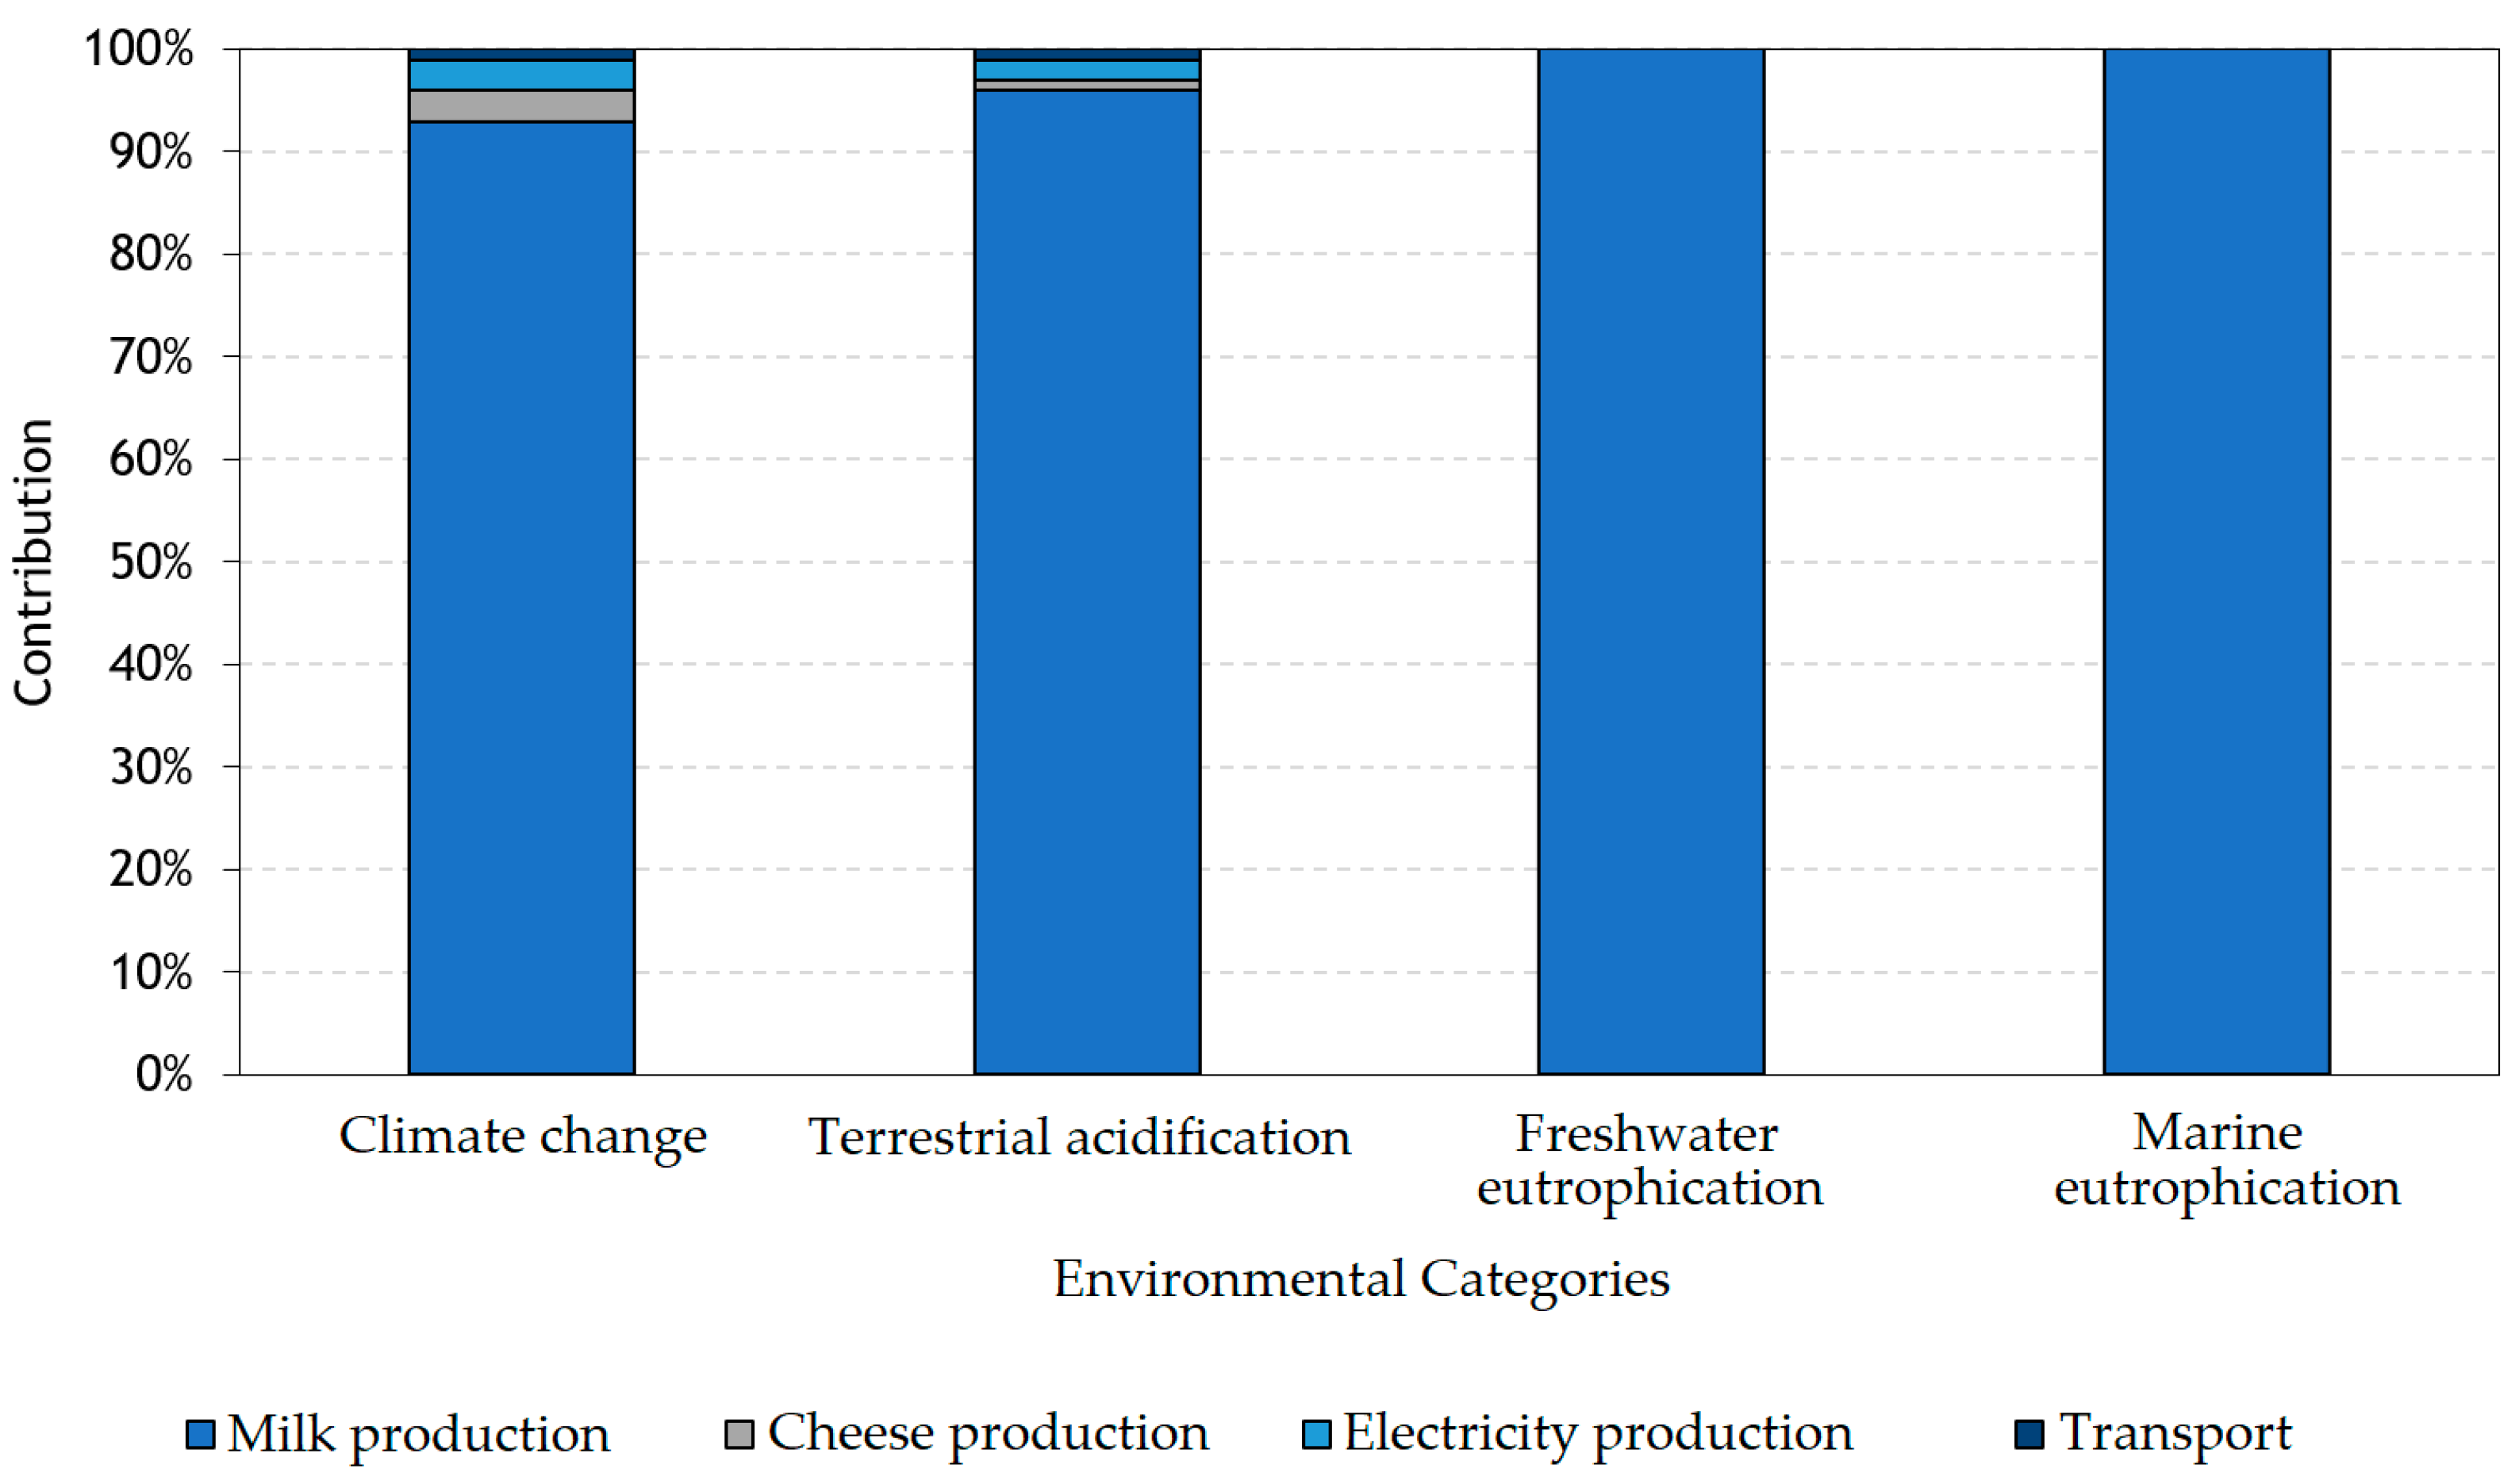
The demonstration of relative contribution by each system according to the chosen impact categories (Table 4) for the cheese production are presented on Figure 4, from which it can be concluded that the overall processes for milk production is the main environmental hotspot for the cheese production of this study, being in agreement with other similar studies [15,16,34].
3.1.1. Climate Change
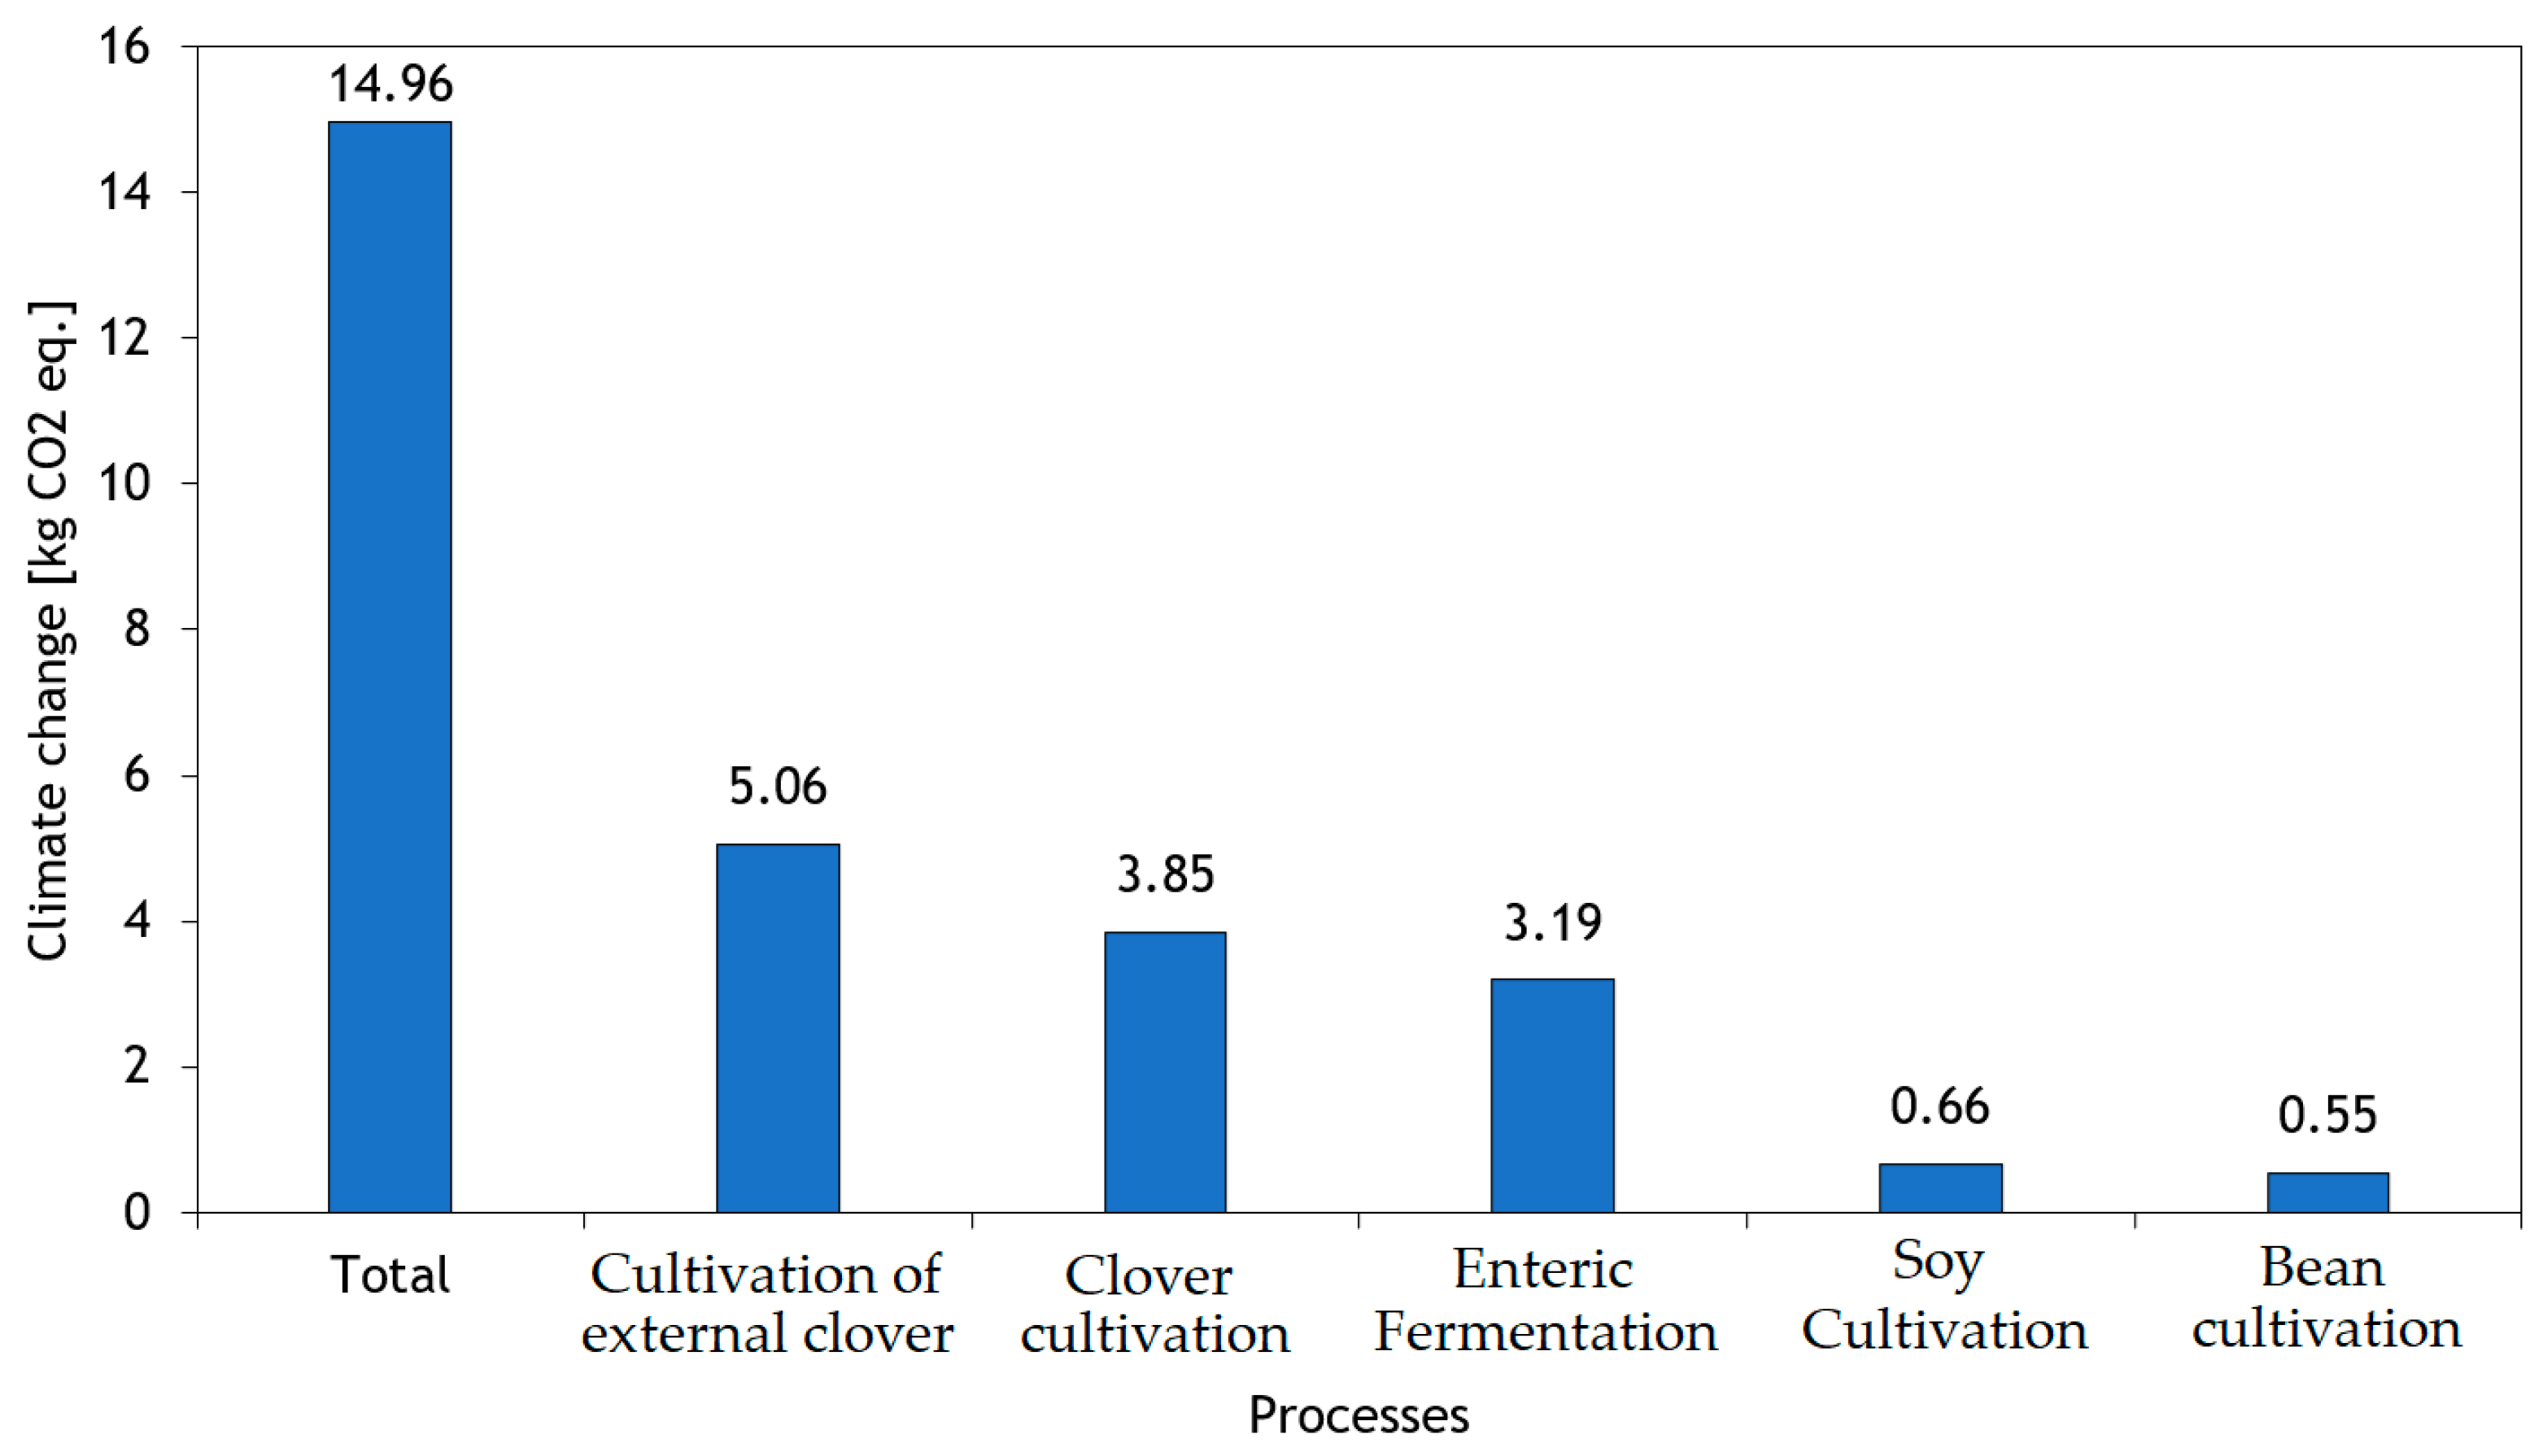
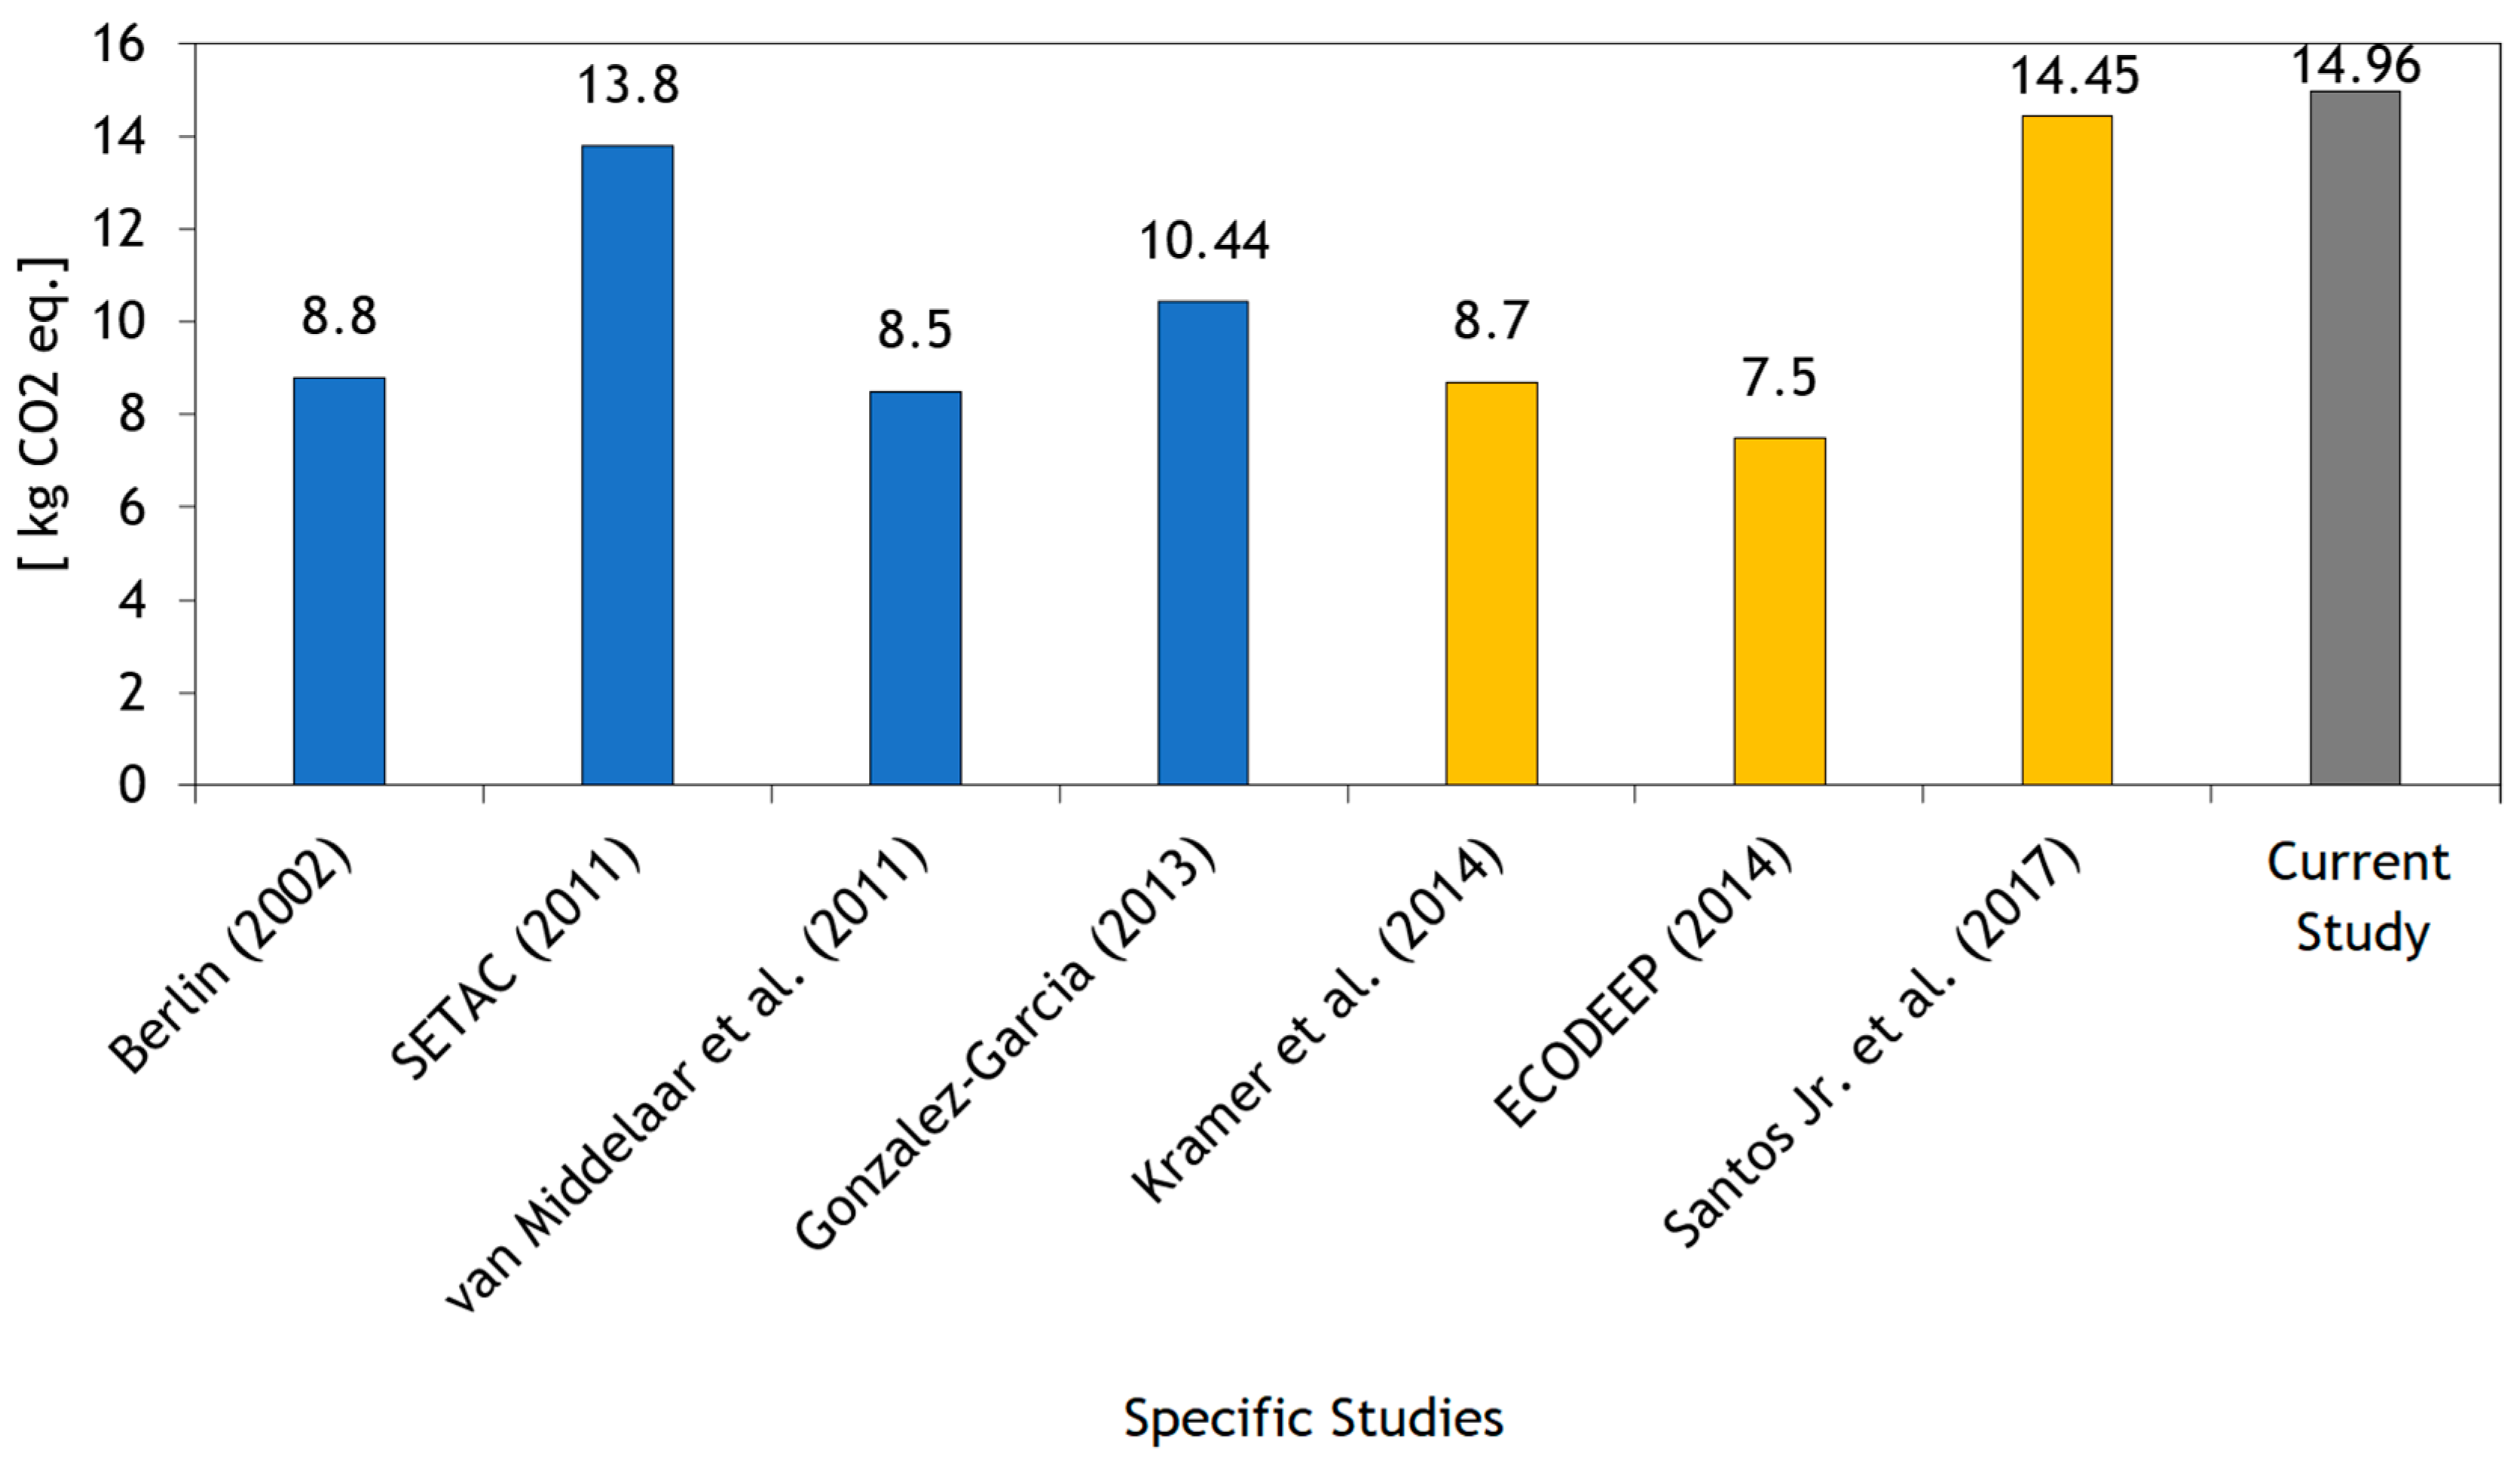
For the climate change impact category, the cheese production by FU is responsible for the impact of 14.96 kg of CO2eq. Out of the assessed process systems, raw milk production contributes by far the most, with about 93% overall. Followed by the electricity production and the cheese production, both with a total of about 3%. Lastly, transportation contributed with about 1%, whereas other processes have shown irrelevant contributions (as can be seen in Figure 4). The raw milk production process contains all processes related to crop farming coming from the own dairy farm but also those supplied to the cooperative for the concentrated feed production and the resulting emissions from manure management, also enteric fermentation. The main greenhouse gas emissions (GHG) are essentially CO2, N2O and CH4. The processes involving the highest impacts originate from crop farming and livestock production, as depicted in Figure 5.
The main hotspots for crop farming are the production of the imported clover with a contribution of 34% to the total impact, followed by the cultivation of clover in the dairy farm itself with a contribution of 26% to the total impact. The cultivation of soybeans meant for concentrated feed production and the cultivation of fava beans are next, both with contributions around 4%. For crop farming processes, impacts result not only from the burning of fossil fuels by the used machinery contributing with CO2 emissions, but also from the application of fertilizers into the soil contributing with N2O emissions.
In the case of livestock production, impacts originate essentially from the emissions of manure management, also enteric fermentation. In similar studies concerning cow milk production where those emissions are substantially higher compared to sheep milk, these were always the main cause of the greenhouse effect [15,16,34]. Nevertheless, the enteric fermentation of sheep in this study corresponded to 21% of the total CO2 emissions, being the third largest hotspot.
During the inventory computation within the software the plans were simplified, by attaching both the process of concentrated feed production and milk production. Thus, it was not possible to measure the relative contributions of each process, since both share the same crop processes within the database.
3.1.2. Terrestrial Acidification
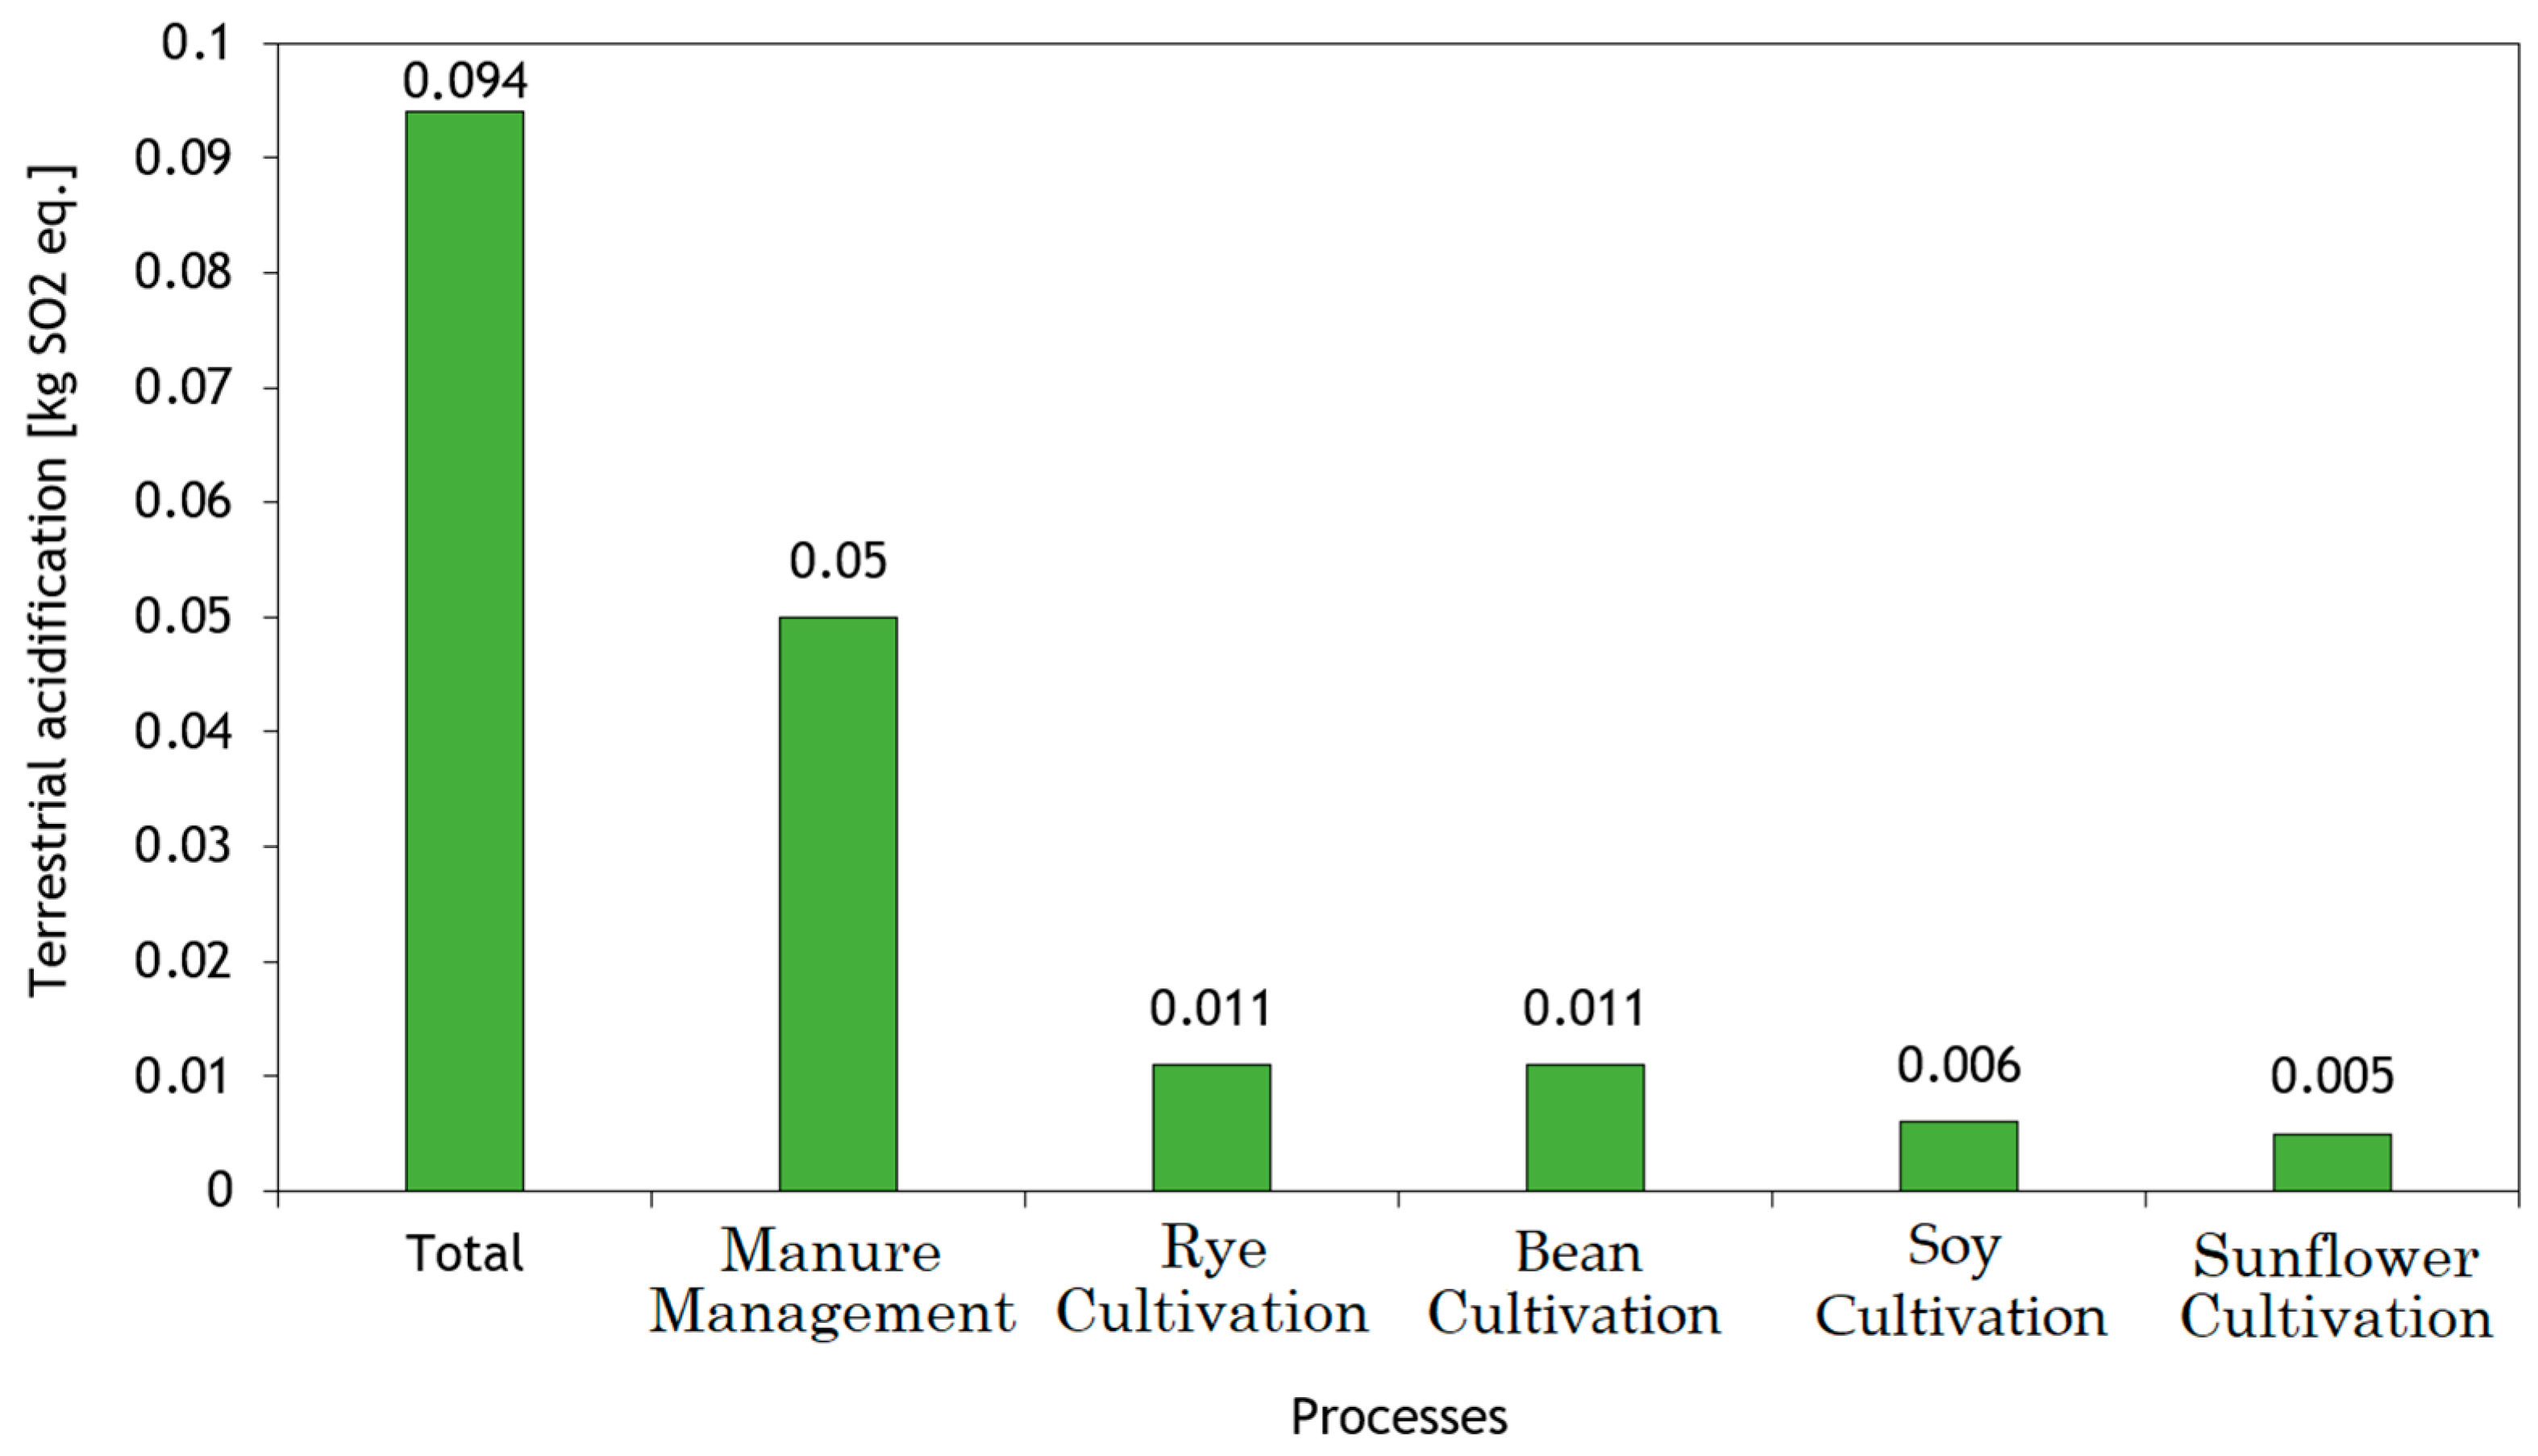
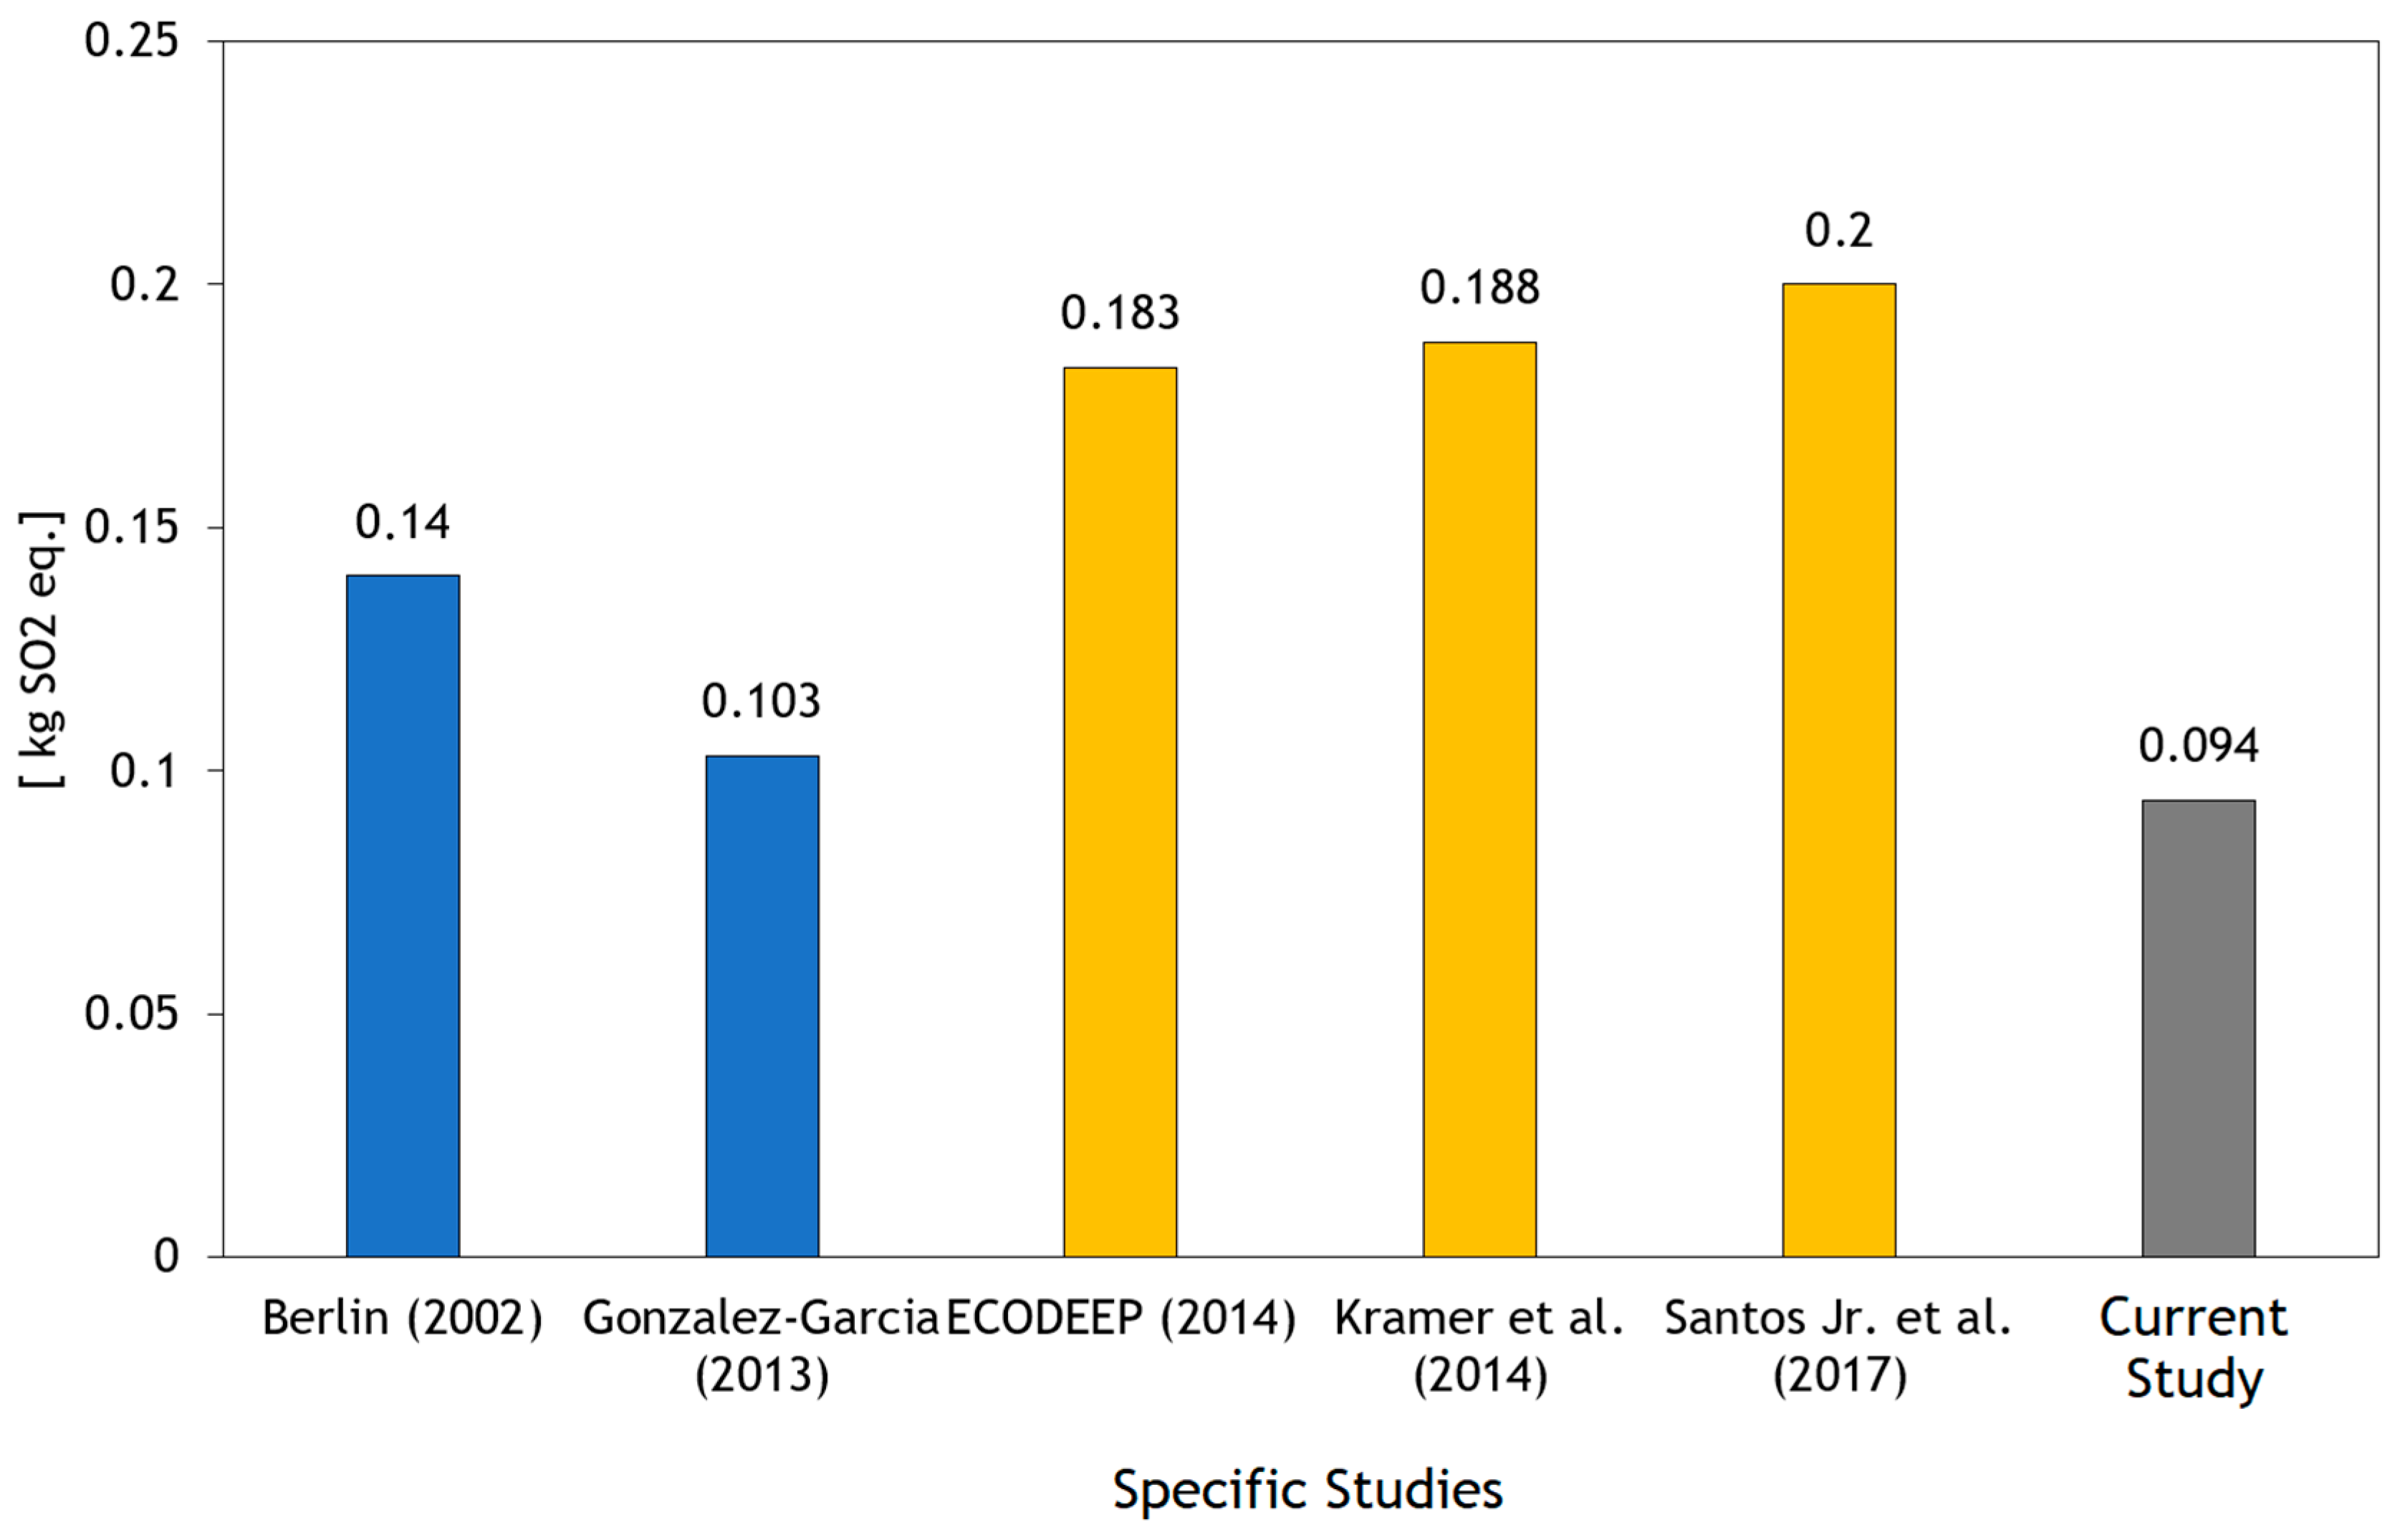
For the terrestrial acidification impact category, the cheese production by FU is responsible for the impact of 0.094 kg of SO2eq. Once again, the raw milk production contributes by far the most out of the assessed process systems, with an overall relative contribution of 96%, followed by the electricity production with a contribution of 2%, whereas cheese production and transportation both present a contribution of 1% each. Other processes have shown irrelevant contributions to the overall process, as can be seen in Figure 4. Since raw milk production is the main hotspot, it is important to assess the parameters influencing this impact in greater detail, considering that terrestrial acidification occurs from NH3, N2O, NOx and SO2 emissions. The NH3 in dairy farm systems occur mainly from manure management and spreading, whereas the remainder originate mainly due to fossil fuel burning for farm machinery tasks, boilers and transportation as well. The processes involving the highest impacts originate from manure management and crop farming (Figure 6). Manure management had a total relative contribution of 53%, followed by the crop farming which include soil fertilizing processes, and fossil fuel burning emissions from agricultural machinery. Fava bean and rye cultivation both had the highest crop impacts, with a contribution around 12%, followed by soybean cultivation, with a contribution around 6%.
3.1.3. Freshwater Eutrophication
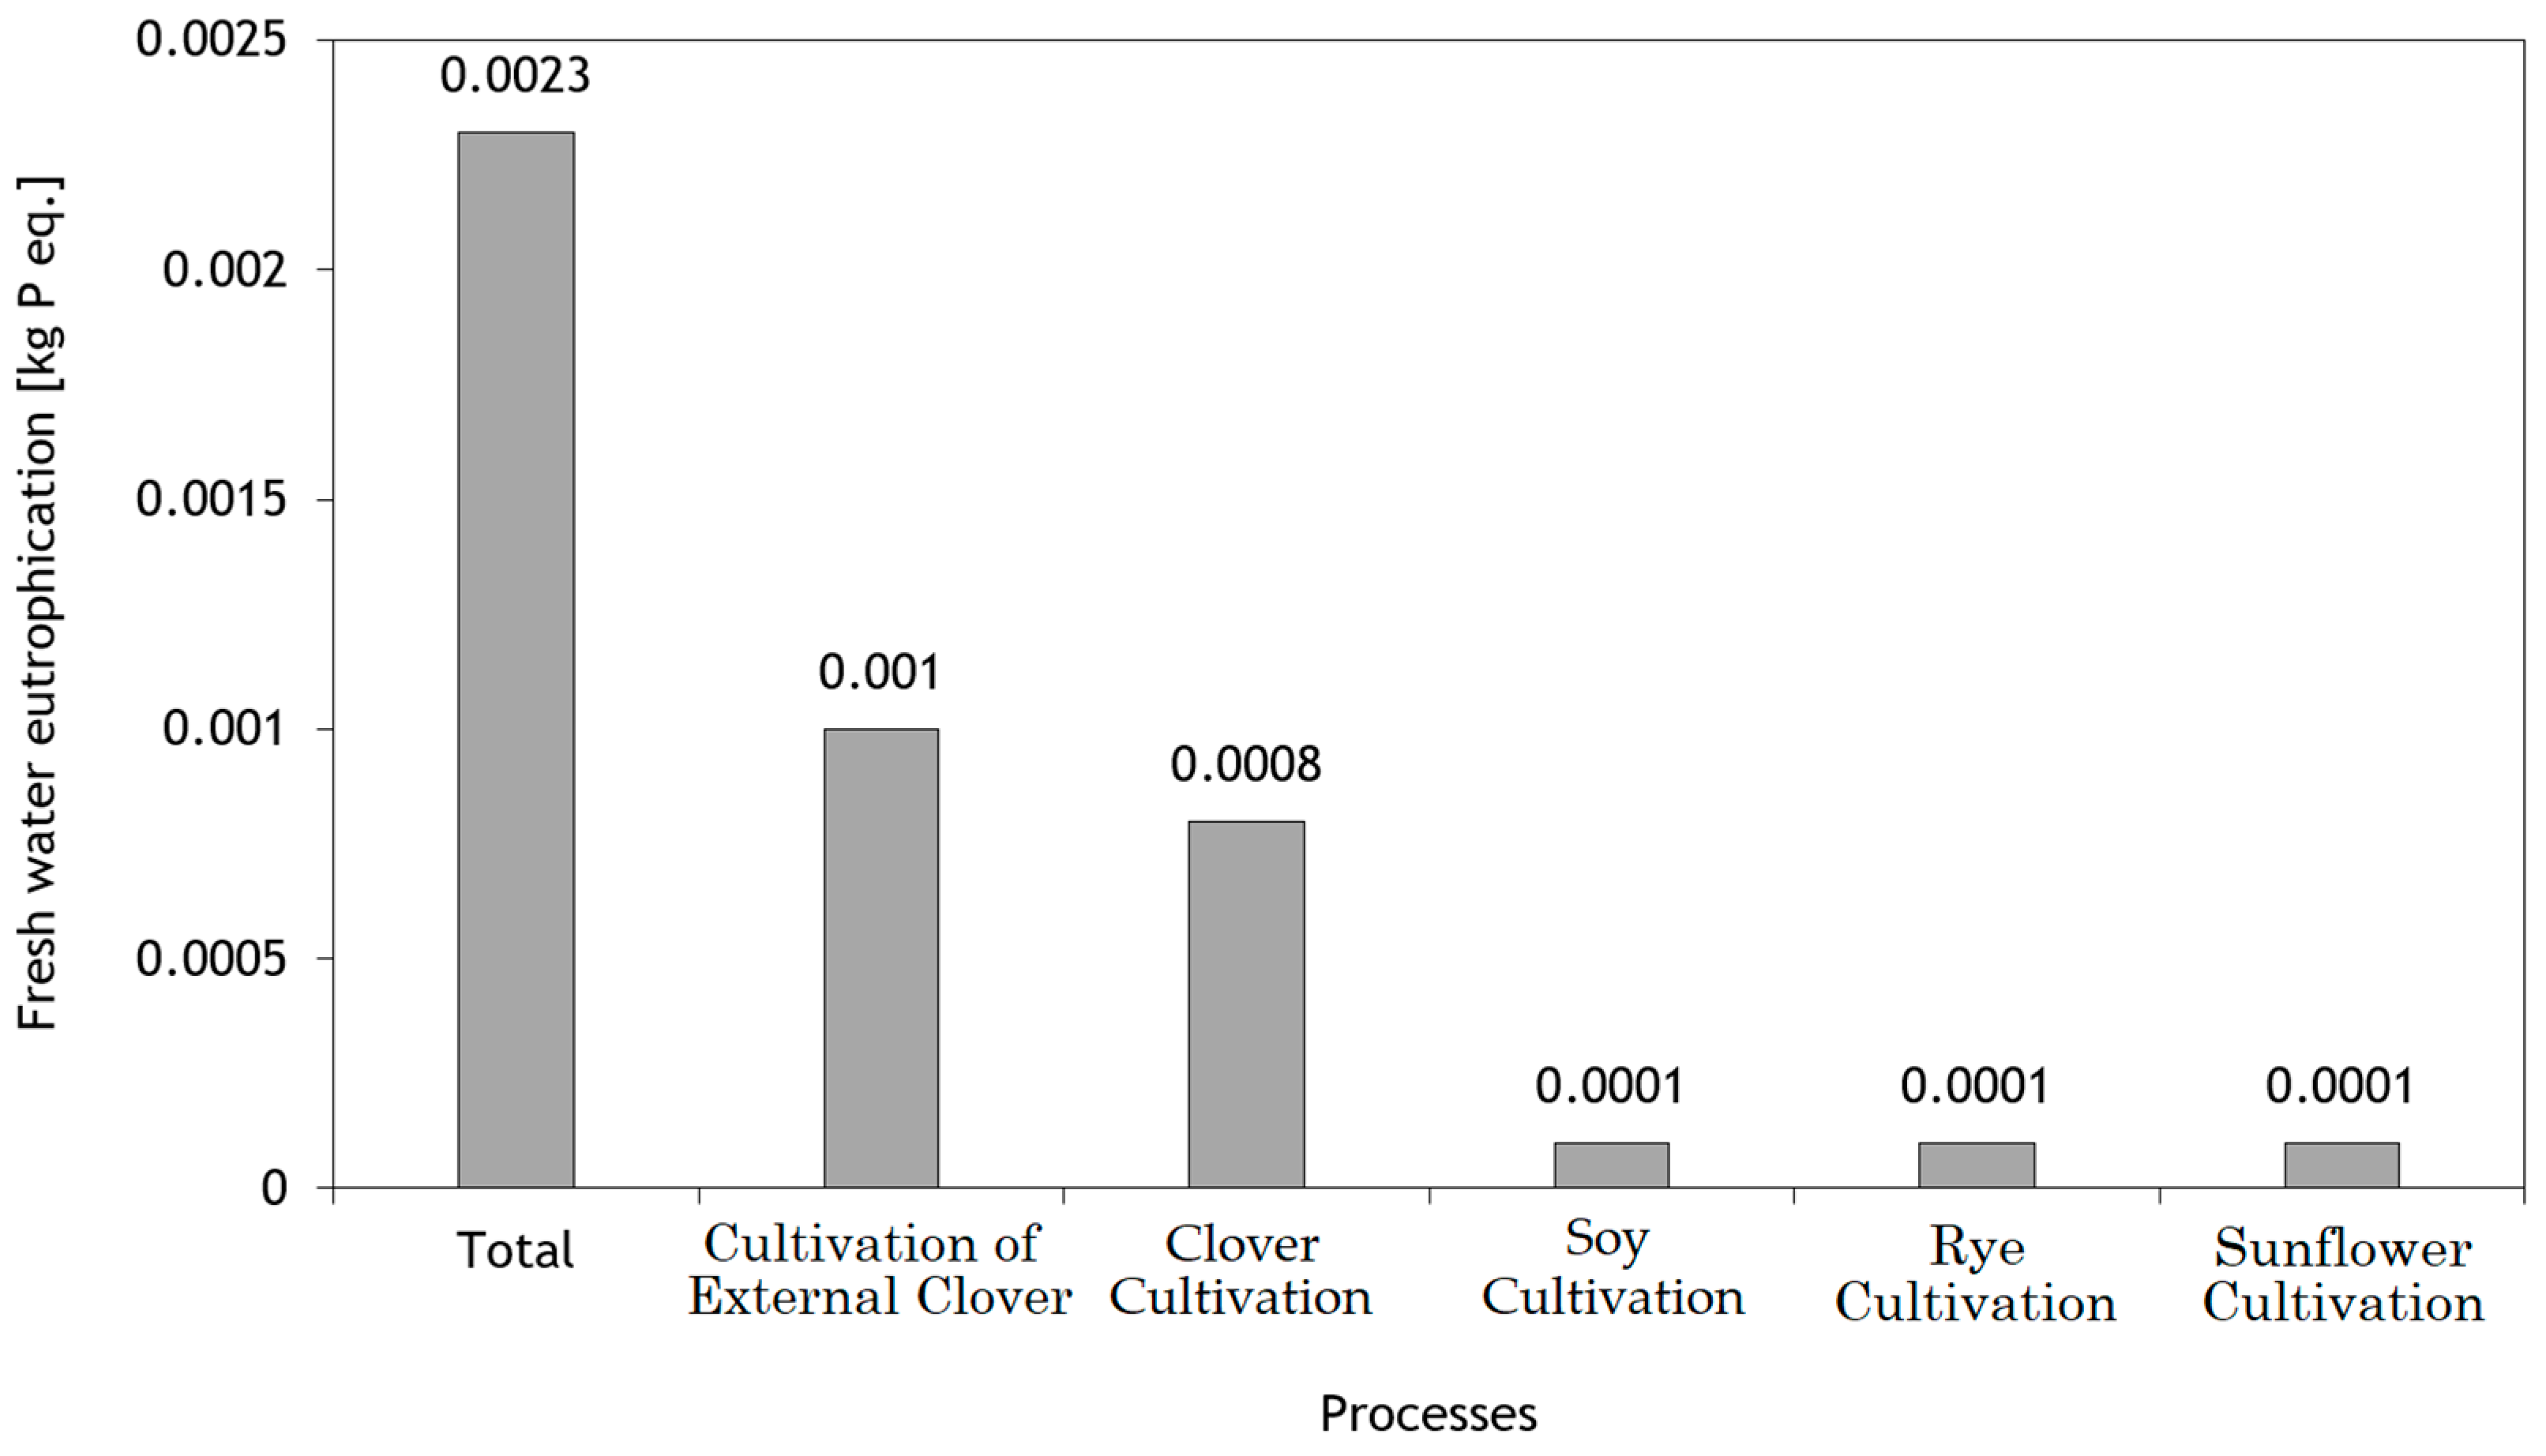
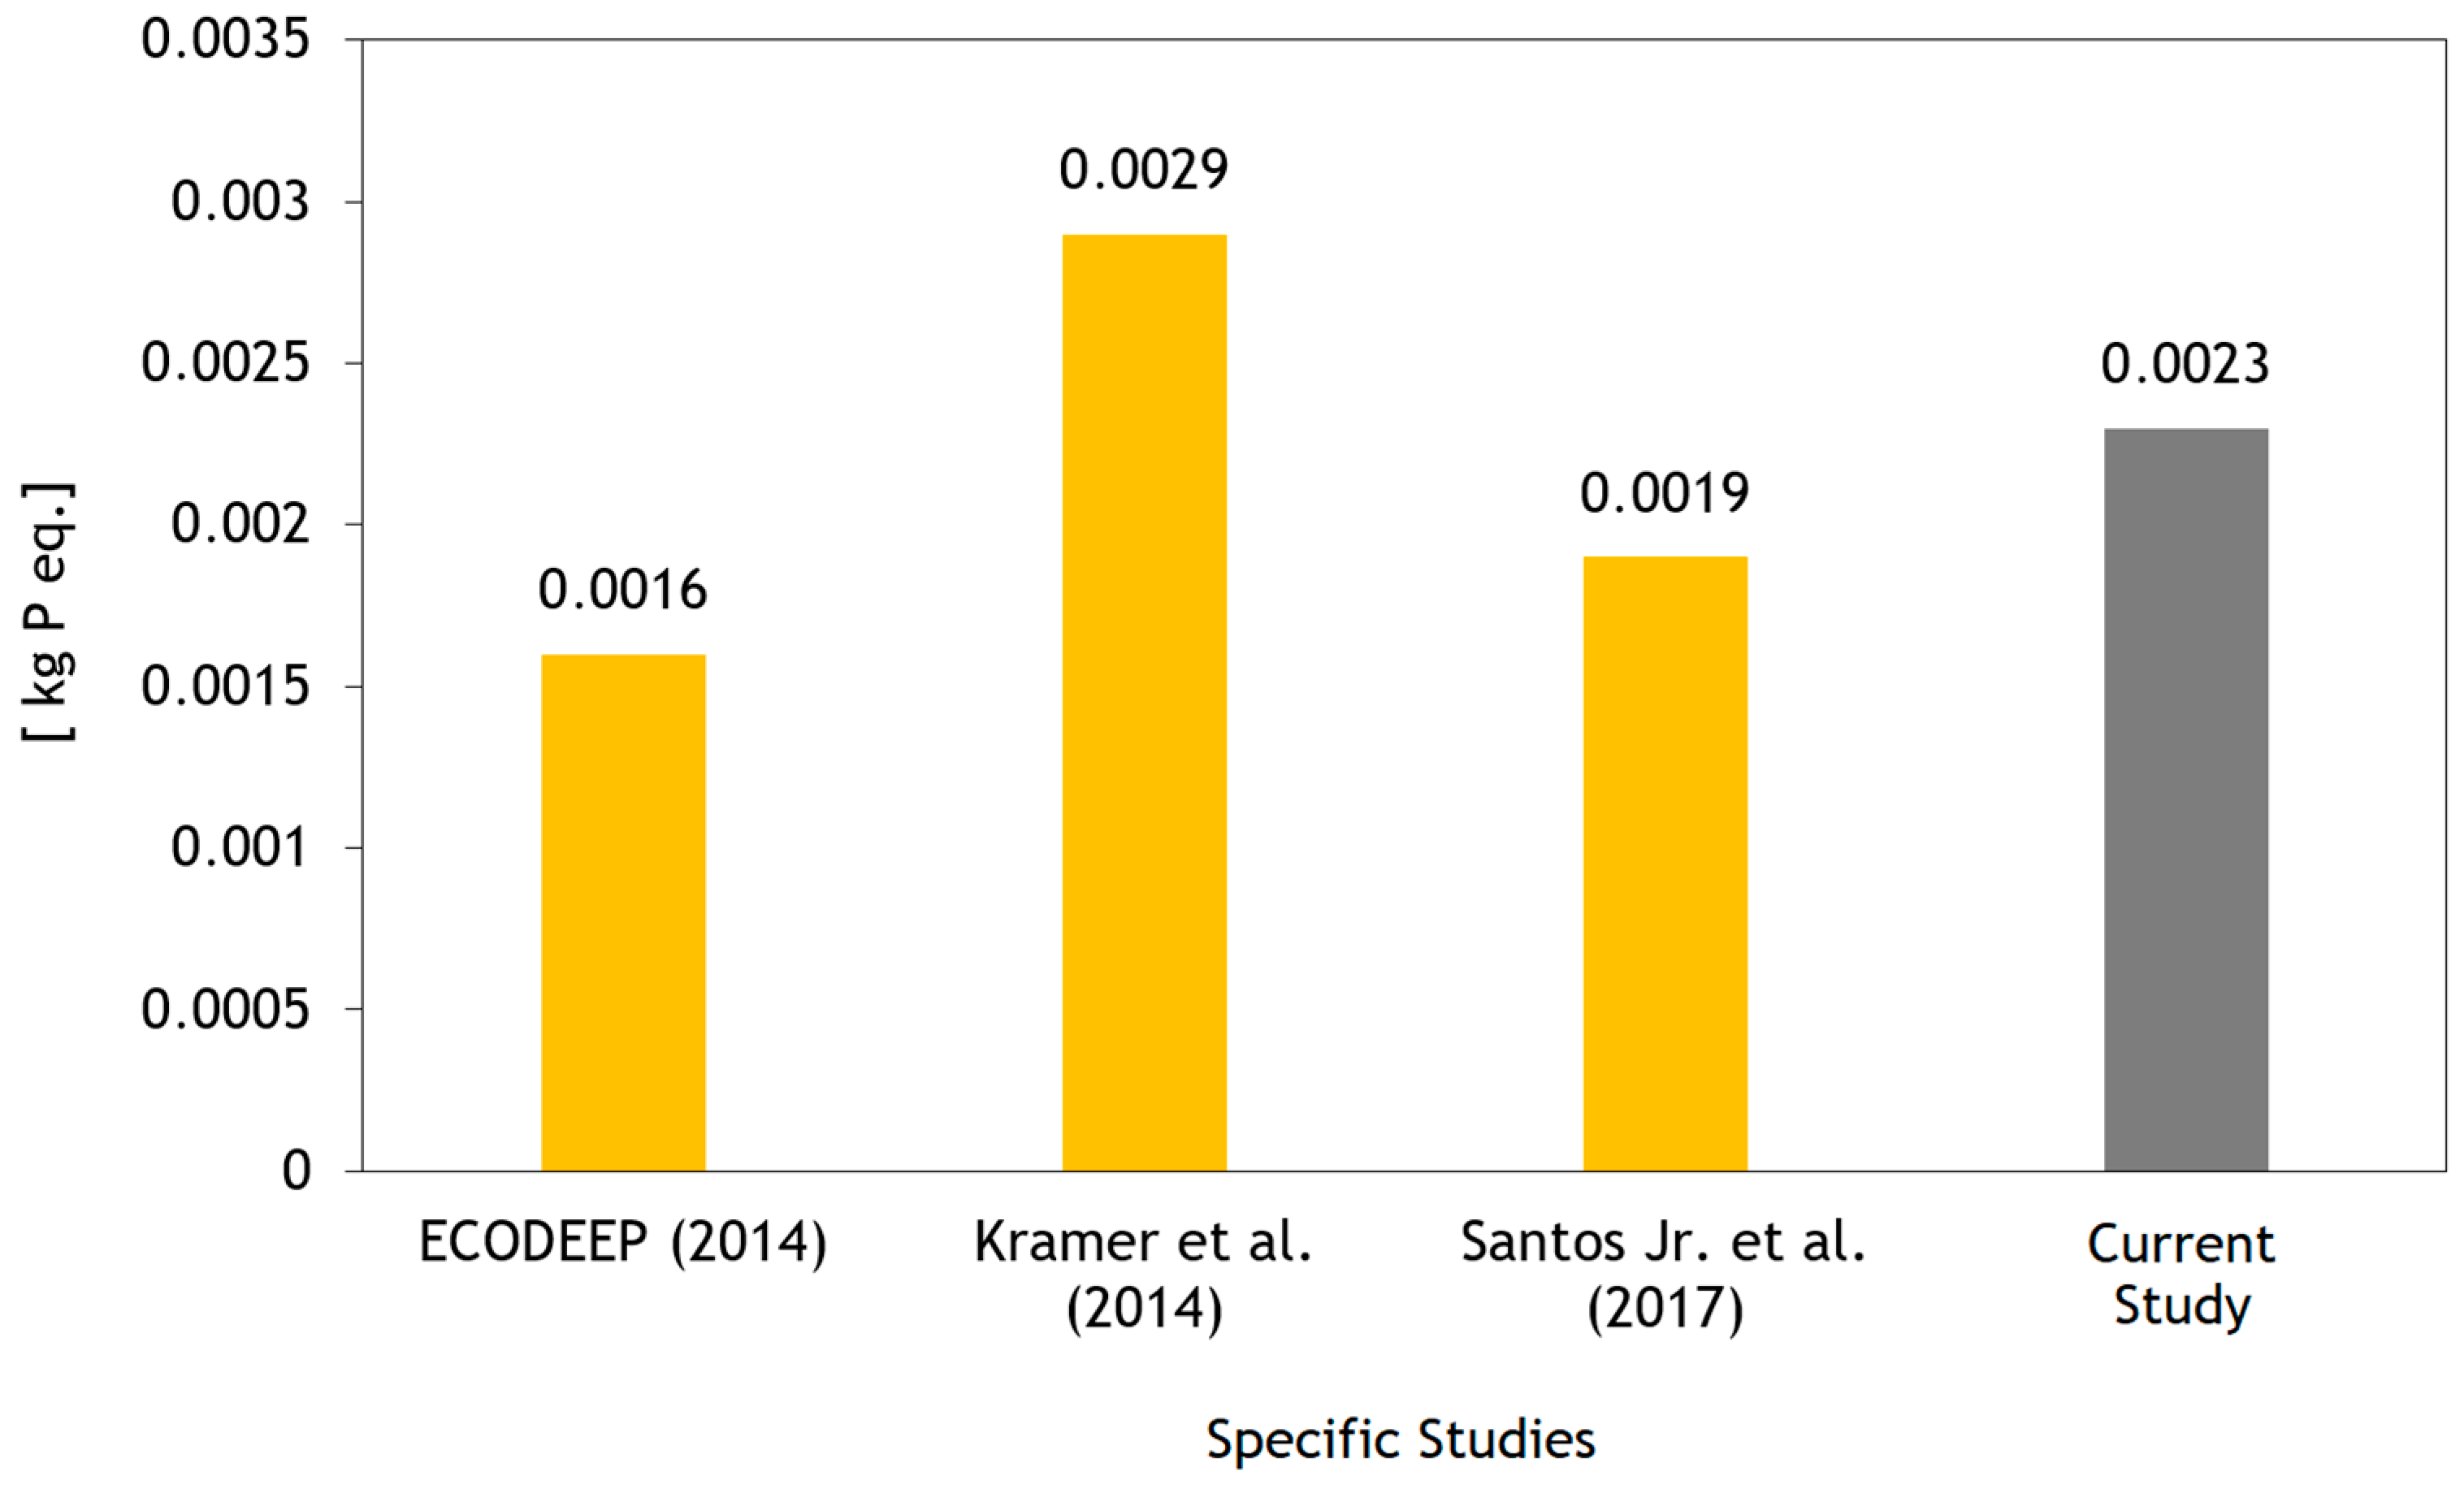
For the freshwater eutrophication impact category, the cheese production by FU is responsible for the impacts of 0.0023 kg of Peq. The process contributing to these impacts is the production of raw milk, with near 100%. In the vast majority of LCA cheese studies, the process contributing most to this impact category occurs from whey effluents when considered in the system boundary, caused by phosphate leakage to the wastewater. Since the present study did not include the whey to wastewater leakage, within the boundary under assessment, this contribution is nil.
In this case, it is appropriate to assess the main agricultural processes contributing with phosphate emissions, where the application of fertilizers on crops, both synthetic and organic, pollute the most.
The crop cultivations with the largest impacts were in this study the imported clover used as animal forage on the dairy farm with a relative contribution of 44%, followed by the clover cultivated in the dairy farm itself and needed for the production of concentrated feed, showing a contribution of 35%. As for the remainder, both soybean and sunflower cultivation, both necessary for the concentrated feed only contribute with 4%. Lastly, the rye cultivated within the dairy farm shows the result with 4% as well, as depicted in Figure 7.
3.1.4. Marine Eutrophication
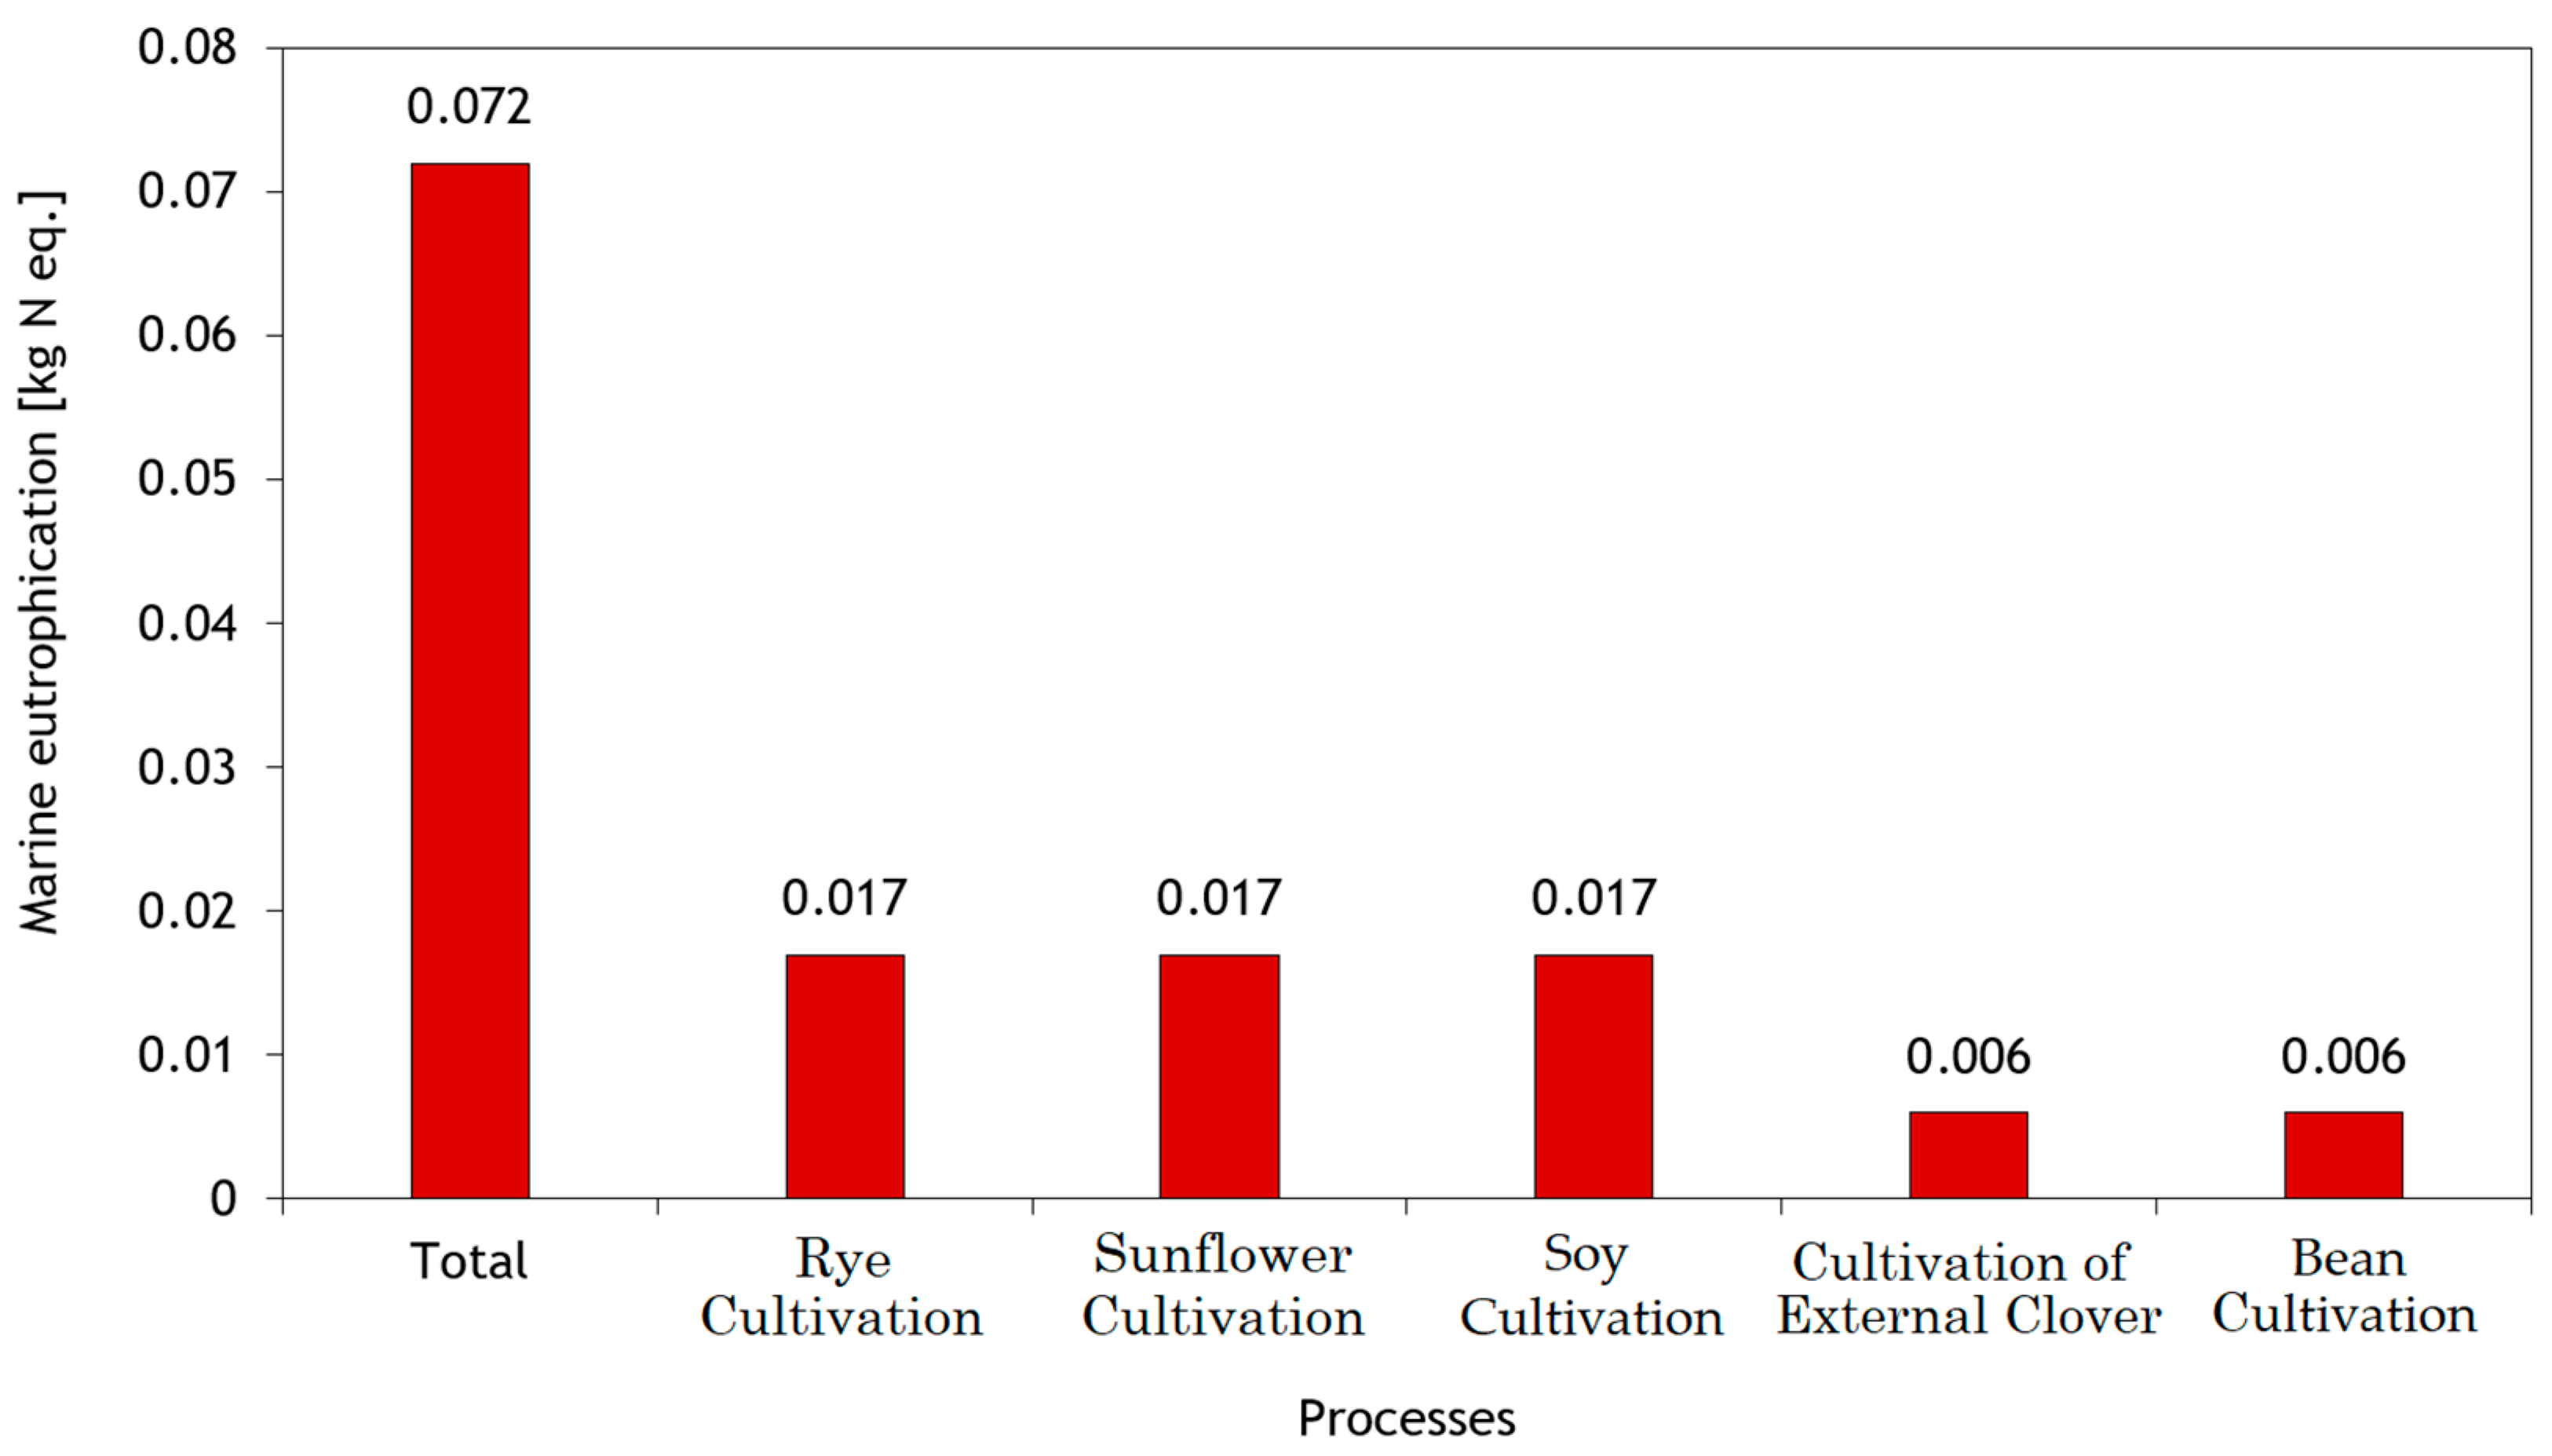
For the marine eutrophication impact category, the cheese production by FU is responsible for the impacts of 0.072 kg of Neq. Like in the freshwater eutrophication category, if whey leakage to the wastewater had been considered within the cheese factory boundary, the effluents would contribute with larger emissions. For marine eutrophication, the main contributors are N, NH3 and NO3− emissions, these result mainly from crop cultivations, especially from the application of fertilizers to the soil once again, but also manure from manure management. The processes with the highest values of kg of Neq are presented in Figure 8.
Thus, within the milk production, the largest contributors from the dairy farm cultivation is the rye contributing with 24%, and from the concentrated feed exclusive cultivations of soybean and sunflower, both showing results of 24% as well. These are followed by the imported clover cultivation and fava beans from the dairy farm crops with results of around 8%.
3.2. Cheese Production Stage—Impact Assessment
Based on the fact that milk production is by far the highest global hotspot, the cheesemaking process are almost irrelevant on a global scale. Therefore, it is important to assess the factory impacts only, which is the primary focus of this study.
3.2.1. Climate Change
The cheese production only had a weight of 3% of climate change with a weight of 0.32 kg CO2eq on a global scale, for the production of 1 kg of cheese (Figure 4).
The largest CO2 hotspot within the dairy factory was due to electricity mix production, having a contribution around 69%. Followed by the boiler fossil fuel burning of propane, not only with CO2 emissions but also N2O and CH4, with a total weight within the factory of 25%. Lastly, the cleaning agent production contributed with impacts around 3%, whereas the remainder processes have shown almost irrelevant contributions.
3.2.2. Terrestrial Acidification
The cheese production only had a weight of 1% of terrestrial acidification on a global scale for the production of 1 kg of cheese (Figure 4).
The largest SO2 hotspot within the dairy factory was once again due to electricity mix production, with contribution around 94%. These results mainly due to the fossil energy burning by releasing SO2 and NOx. This is followed by the cleaning agent production contributing with around 5% to the impacts within the factory, whereas the remainder processes have shown almost irrelevant contributions, with a total of 1%.
3.2.3. Water Eutrophication
Because of the irrelevant eutrophication stemming from the cheese factory, no detailed analysis was made. This, however, is since no whey wastewater emissions were considered within the factory. Whereas similar studies with whey effluents within the assessed system boundary have shown contributions up to 60% for freshwater eutrophication, due to phosphate leakage into the water. For marine eutrophication, a similar study has shown low values within a global scale, with a total contribution of around 5% [34].
3.3. Comparison of Results with Similar Studies
In this section, a comparison is made between the most identical available studies with the present study, specifically with studies that are more detailed, namely [34,35,36].
3.3.1. Climate Change
In terms of climate change percentage contribution, [35] reports that the average percentage of cheese studies show results ranging from 75–99% contribution from the milk production process, thus contributing to the largest impacts. In all three reference studies, the veracity of this statement can be verified as true, since in [34] it is reported that the dairy farm contributes 85% to total CO2 emissions, as well as the study made in [35] showing a contribution around 86%. Lastly, in [36] are displayed the results of a contribution around 97% from the dairy farm. These figures, show identical results with the present study, especially compared to the latter, where the dairy farm contributed with a percentage of 93%.
As for the contribution from the dairy farm, the [34] study reports that about 58% originates due to enteric fermentation and manure management, while the remainder belongs to crop farming, contributing around 40% to total impacts. The study by [35] reports results of animal farm contributing with around 35%, once again due to enteric fermentation and manure management, and where crop farming is considered the main hotspot, with a contribution of around 65%. Lastly, the study made in [36] did not provide any detailed report of the dairy farm; therefore, no comparison could be made. In comparison, this present study has shown inferior values due to animal farming emissions originating from enteric fermentation and manure management, where results have shown a contribution of 21% and crop farming showed a contribution of total impacts of about 70%, therefore, values more similar with the second study.
The present study shows the highest overall values of CO2 emissions among the other studies on, as depicted in Figure 9, with an climate change of 14.96 kg CO2eq by FU, values above the average compared to some of these studies, but also similar with others. Concerning the impactes of the cheese factory alone, only a few studies presented climate change of 0.99 kg and 0.63kg CO2eq [37,38], respectively. Since climate change in the present study are around 0.32 kg CO2eq, this makes it the less polluting factory out of the three.
While analysing the overall results, it can be stated that, due to the difference of the dairy animal being sheep, the contributions of enteric fermentation and manure management are lower compared to others. However, when comparing food inputs per litre of milk, the values are similar and even higher one some compared to cows, and sheep also produce less milk per animal, which could also lead to higher environmental impacts [27]. As previously shown, the biggest impacts are generated by food production meant for farm animals, which in the present study, were computed from Swiss databases that may not fully correspond to the Portuguese reality. Likewise, some of the crops not available on the databases have been replaced by other similar ones and the fact of an extensive variety of plantations, which involve more processes, may have inflated the overall impact results.
3.3.2. Terrestrial Acidification
For the results of terrestrial acidification, the [34] study identifies the milk production phase again as the largest contributor, with a percentage of 95% overall, where cheesemaking itself only weighs 3%. Moreover, in [35], it was found that the milk production phase was the most polluting one, with a total weight of 97%. Finally, Santos Jr. et al. (2017) [36] presented results with a 99% contribution from milk production. For comparison purposes, the present study has shown that the weight of milk production processes is around 96%, meaning similar results with these other studies.
The present study shows the lowest overall values of SO2 emissions among the other studies on (Figure 10), with an impact of 0.094 kg SO2eq by FU, making these emissions about 50% lower compared to the highest impact value.
Within these contributions, the [34] study shows that 78% of total emissions originate from the animal farming phase, mainly due to manure NH3 emissions, whereas 20% are due to manure and fertilizer applied to crops. The study by [35] indicates that about 65% of these impacts stem from manure management and that about 33% correspond to manure and fertilizer spreading on crops meant for animal food. As for the study made by Santos Jr. et al. (2017) [36], once again, no detailed information of the milk production data was provided, which means that no comparison could be established. As for the comparison with the present study, this study has shown a weight from manure management of 53% and about 42% related to soil crop fertilization, which also included the burning of fossil fuels from the machinery processes. These values reflect around 25% lower manure management impacts, which could be explained by the absence of slurry and lower amounts of manure from sheep animals compared to cows [39]. The higher percentage from crop fertilization could be due to the fact that the present study did not separate the impacts from the crop machinery processes, which may have inflated the overall value.
3.3.3. Freshwater Eutrophication
Before the comparison with the other studies, it is important to mention that there could be impact result differences in the freshwater eutrophication if this study would have included whey within the system boundaries.
Therefore, the [34] study, which included environmental impacts stemming from whey within the cheese factory, which have shown a contribution of 61% in total impacts, and 35% resulted from milk production processes. Regarding the study by [35], which only considered wastewater treatment, mentioned that this process contributed to 15% impacts overall, where milk production processes were the largest contributors, with a total weight of 85%. Lastly, the study made in [36] assessed a similar whey scenario with the present study, where whey effluents were not considered within system boundaries, due to the fact that the cheese factory also exported whey to neighbouring farms to serve as animal feed. Therefore, milk production had a total impact of 99%. Although, all studies presented different boundaries for this parameter, the overall results were quite similar. For comparison purposes, the latter study was the most comparable to the present study, which attributed a weight of 100% to the milk production process.
Within the contribution of milk production processes, the [34] study attributed a weight of 79% due to the chemical fertilization of crop soils and 18% due to the spreading of manure on crop soils. On the other hand, [35] reported that chemical fertilization accounted for around 88% of total milk production impacts, and about 10% due to manure fertilization. The study made by [36] did not provide a detailed analysis from the dairy farm processes, so no comparison could be made, as mentioned before. Given that the present study computed inventory data from an integrated database for crop farming, it was not possible to distinguish the contribution of organic and chemical fertilizers, but total fertilization accounted for about 94% of total impacts.
The present study has shown overall freshwater eutrophication impacts values within the average among the other studies, as seen on Figure 11, with a total impact of 0.0023 kg Peq by FU.
Based on the results of all studies, it can be stated that, even though different boundaries between studies have been assessed for the freshwater eutrophication parameter, with or without whey emissions, the results have shown similar overall impacts, due to the fact of the fertilization of crops being the greatest hotspot.
3.3.4. Marine Eutrophication Comparison
Regarding the marine water eutrophication, according to these results, it occurs mainly by manure spreading to crop soils, and due to the production and application of synthetic fertilizers. The study by [34] reported results around 95% stemming from milk production in the dairy farm, and about 4% caused by the effluents within the cheese factory, considering that this study kept whey effluents within the system boundary. The study by [35] has shown a weight of 99% on overall impacts caused by the milk production system, keeping in mind that no whey was considered within its border. The study made by [36] did not show any results regarding marine eutrophication. Even though all studies considered different system boundaries, the results were once again similar among them. The most comparable with the present study was the one by [35], which also presented a weight close to 100% towards the milk production.
By assessing the relative contributions of processes involved in milk production, the study by [34] reported that 80% of impacts within the dairy farm are due to the spreading of fertilizers on crop plantations, where the remaining 20% are due to manure spreading. The study made in [35] in turn, mentioned that 40% are due to the spreading of fertilizers on crop soils and the remaining 60% due to the manure spreading on soils. Again, the present study used integrated database data for crops, which did not allow one to distinguish the contribution of organic and chemical fertilizers, but both together, have shown a contribution of 90%.
The present study has shown that overall N emission values fall within the average when compared to other studies on (Figure 12), with a total impact of 0.072 kg Neq by FU. According to the assessed results, these have shown again, that given the different boundaries between the studies, with the inclusion of whey data within the boundary or not, the final results are quite similar, since once again, the largest hotspot is within the dairy farm caused by crop farming, specially due to its fertilization, organic or not.
The different relative contribution of fertilization between the studies could mean that different databases were used, or may be from different countries or cultures, requiring different fertilizer dosage and different edaphoclimatic conditions.
4. Conclusions
This study had the peculiarity of assessing a sheep farm with a fodder production in an extensive agricultural regime. The results have shown to be in line with the other carried out studies on dairy products, where it had been identified that the higher environmental load resulted from the milk production phase within the dairy farm. This leads to the conclusion that attention should particularly be paid to the processes at this stage. Regarding the processing industry, that is, the cheese factory, the results have shown that overall environmental impacts are practically insignificant, and the most relevant processes are related to energetic requirements, in particular, the impacts associated with electricity production, whether coming from renewable or non-renewable sources stemming from the electricity mix, contributing with as much as 69% of CO2 emissions, and coming from the combustion of fossil fuels coming from the boiler.
Regarding the results for climate change, the present study has shown above average results, where the main influences were the processes of agricultural machinery, crop fertilization, manure management and enteric fermentations. In terms of terrestrial acidification results, these were slightly below average. Considering that these impacts are mostly influenced by manure management, this may suggest that the reduced values are mainly due to the lower impacts from sheep manure when compared with other studies.
Regarding freshwater and marine eutrophication, although the present study did not include whey effluents within its border, the final results were similar to other studies, who included or also discarded whey, suggesting that there are no large differences overall. The whole process that contributed to these impacts is the production of raw milk with a full contribution of 100%. Considering that processes within the dairy farm are, by a wide margin, the most polluting in all categories of impact, it can be concluded that before assessing products it is even more important to have a detailed LCA of the most varied crop animal diets, so that producers can make decisions with greater awareness, in order to minimize environmental impacts. These results can be useful to support adjustments and improvements in production practices, by making this production chain greener and less harmful to the environment.
Author Contributions
Data curation, A.C.D. and Ó.S.N.; formal analysis, Ó.S.N. and P.D.G.; investigation, J.N. and P.Q.; supervision, P.D.G. and P.Q.; writing—original draft, Ó.S.N.; validation, P.Q., A.C.D. and J.N.; visualization, R.G.; writing—review and editing, P.D.G. and R.G. All authors have read and agreed to the published version of the manuscript.
Funding
Pedro Dinis Gaspar acknowledges Fundação para a Ciência e a Tecnologia (FCT—MCTES) for its financial support via the project UIDB/00151/2020 (C-MAST—Centre for Mechanical and Aerospace Science and Technologies). Ana Cláudia Dias and Paula Quinteiro acknowledge FCT-MCTES for the contracts CEECIND/02174/2017 and CEECIND/00143/2017, respectively, and for the financial support to CESAM (UIDB/50017/2020+UIDP/50017/2020), through national funds. Radu Godina acknowledges Fundação para a Ciência e a Tecnologia (FCT—MCTES) for its financial support via the project UIDB/00667/2020 (UNIDEMI).
Conflicts of Interest
The authors declare no conflict of interest.
References
- Claudino, E.S.; Talamini, E. Análise do Ciclo de Vida (ACV) aplicada ao agronegócio: Uma revisão de literatura. Rev. Bras. Eng. Agrícola E Ambient. 2013, 17, 77–85. [Google Scholar] [CrossRef] [Green Version]
- Han, Y.; Wu, H.; Geng, Z.; Zhu, Q.; Gu, X.; Yu, B. Review: Energy efficiency evaluation of complex petrochemical industries. Energy 2020, 203, 117893. [Google Scholar] [CrossRef]
- Lupp, G.; Steinhäußer, R.; Starick, A.; Gies, M.; Bastian, O.; Albrecht, J. Forcing Germany’s renewable energy targets by increased energy crop production: A challenge for regulation to secure sustainable land use practices. Land Use Policy 2014, 36, 296–306. [Google Scholar] [CrossRef]
- Xie, Y.; Guo, W.; Wu, Q.; Wang, K. Robust MPC-based bidding strategy for wind storage systems in real-time energy and regulation markets. Int. J. Electr. Power Energy Syst. 2020, 124, 106361. [Google Scholar] [CrossRef]
- Du, W.; Wang, F.; Li, M. Effects of environmental regulation on capacity utilization: Evidence from energy enterprises in China. Ecol. Indic. 2020, 113, 106217. [Google Scholar] [CrossRef]
- Cabral, C.F.S.; Elabras Veiga, L.B.; Araújo, M.G.; de Souza, S.L.Q. Environmental Life Cycle Assessment of goat cheese production in Brazil: A path towards sustainability. LWT 2020, 129, 109550. [Google Scholar] [CrossRef]
- Reis, P.J.M.; Malcata, F.X. Current state of Portuguese dairy products from ovine and caprine milks. Small Rumin. Res. 2011, 101, 122–133. [Google Scholar] [CrossRef]
- Portal do INE. Available online: https://www.ine.pt/xportal/xmain?xpid=INE&xpgid=ine_indicadores&indOcorrCod=0000920&contexto=bd&selTab=tab2&xlang=pt (accessed on 30 July 2020).
- Statistics. Available online: http://www.fao.org/statistics/en/ (accessed on 30 July 2020).
- Tiberio, M.L.; Diniz, F. Sheep and Goat Production in Portugal: A Dynamic View. Mod. Econ. 2014, 2014. [Google Scholar] [CrossRef] [Green Version]
- Monjardino de Souza Monteiro, D.; Raquel Ventura Lucas, M. Conjoint measurement of preferences for traditional cheeses in Lisbon. Br. Food J. 2001, 103, 414–424. [Google Scholar] [CrossRef]
- Freitas, A.C.; Fresno, J.M.; Prieto, B.; Franco, I.; Malcata, F.X.; Carballo, J. How milk type, coagulant, salting procedure and ripening time affect the profile of free amino acids in Picante da Beira Baixa cheese. J. Sci. Food Agric. 1999, 79, 611–618. [Google Scholar] [CrossRef]
- Freitas, A.C.; Pais, C.; Malcata, F.X.; Hogg, T.A. Microbiological Characterization of Picante da Beira Baixa Cheese. J. Food Prot. 1996, 59, 155–160. [Google Scholar] [CrossRef] [PubMed]
- Freitas, C.; Xavier Malcata, F. Microbiology and Biochemistry of Cheeses with Appélation d’Origine Protegée and Manufactured in the Iberian Peninsula from Ovine and Caprine Milks. J. Dairy Sci. 2000, 83, 584–602. [Google Scholar] [CrossRef] [Green Version]
- Berlin, J. Environmental life cycle assessment (LCA) of Swedish semi-hard cheese. Int. Dairy J. 2002, 12, 939–953. [Google Scholar] [CrossRef]
- González-García, S.; Hospido, A.; Moreira, M.T.; Feijoo, G.; Arroja, L. Environmental Life Cycle Assessment of a Galician cheese: San Simon da Costa. J. Clean. Prod. 2013, 52, 253–262. [Google Scholar] [CrossRef]
- Hospido, A.; Moreira, M.T.; Feijoo, G. Simplified life cycle assessment of galician milk production. Int. Dairy J. 2003, 13, 783–796. [Google Scholar] [CrossRef]
- Wernet, G.; Bauer, C.; Steubing, B.; Reinhard, J.; Moreno-Ruiz, E.; Weidema, B. The ecoinvent database version 3 (part I): Overview and methodology. Int. J. Life Cycle Assess. 2016, 21, 1218–1230. [Google Scholar] [CrossRef]
- McSweeney, P.L.H.; Fox, P.F.; Cotter, P.D.; Everett, D.W. (Eds.) Cheese: Chemistry, Physics and Microbiology, 4th ed.; Academic Press: Cambridge, MA, USA, 2017. [Google Scholar]
- Tedeschi, T.; Galaverna, G.; Dossena, A.; Sforza, S. Chapter 19—Cheeses. In Comprehensive Analytical Chemistry; de la Guardia, M., Gonzálvez, A., Eds.; Food Protected Designation of Origin; Elsevier: Amsterdam, The Netherlands, 2013; Volume 60, pp. 479–509. [Google Scholar]
- Fernandes, D. Produtos Tradicionais Portuguese. Available online: https://tradicional.dgadr.gov.pt (accessed on 30 July 2020).
- Reis Lima, M.J.; Bahri, H.; Sá Morais, J.; Veloso, A.C.A.; Fontes, L.; Lemos, E.T.; Peres, A.M. Assessing Serra da Estrela PDO cheeses’ origin-production date using fatty acids profiles. Food Meas. 2019, 13, 2988–2997. [Google Scholar] [CrossRef] [Green Version]
- Fogeiro, É.; Barracosa, P.; Oliveira, J.; Wessel, D.F. Influence of Cardoon Flower (Cynara cardunculus L.) and Flock Lactation Stage in PDO Serra da Estrela Cheese. Foods 2020, 9, 386. [Google Scholar] [CrossRef] [Green Version]
- Roseiro, L.B.; Wilbey, R.A.; Barbosa, M. Serpa Cheese: Technological, biochemical and microbiological characterisation of a PDO ewe’s milk cheese coagulated with Cynara cardunculus L. Lait 2003, 83, 469–481. [Google Scholar] [CrossRef] [Green Version]
- Coelho, D.A.; Carrola, T.E.P.; Couvinhas, A.F. Improvement of Certified Artisan Cheese Production through Systemic Analysis—Serra da Estrela PDO. Sustainability 2017, 9, 468. [Google Scholar] [CrossRef] [Green Version]
- Araújo-Rodrigues, H.; Tavaria, F.K.; dos Santos, M.T.P.G.; Alvarenga, N.; Pintado, M.M. A review on microbiological and technological aspects of Serpa PDO cheese: An ovine raw milk cheese. Int. Dairy J. 2020, 100, 104561. [Google Scholar] [CrossRef]
- Guiné, R.P.F.; Fontes, L.; Lima, M.J. Evaluation of texture in Serra da Estrela cheese manufactured in different dairies. Open Agric. 2019, 4, 475–486. [Google Scholar] [CrossRef]
- Valente, C.R.; Valente, S.R. Melhoria da Eficiência Energética de uma Indústria de Fabrico de Queijo; Instituto Politécnico de Castelo Branco—Escola Superior de Tecnologia: Castelo Branco, Portugal, 2016. [Google Scholar]
- Queijo da Beira Baixa DOP—Caderno de Especificações; Gabinete do Secretário de Estado das Florestas e do Desenvolvimento Rural: Portugal, 2016. Available online: https://tradicional.dgadr.gov.pt/images/prod_imagens/queijos/docs/CE_Queijo_Beira_Baixa_analise.pdf (accessed on 13 July 2020).
- Life Cycle Assessment Software—Sphera. PE International (2019). Sphera Solutions GmbH. Available online: http://www.gabi-software.com/international/software/ (accessed on 16 February 2020).
- 2006 IPCC Guidelines for National Greenhouse Gas Inventories. Task Force on National Greenhouse Gas Inventories (TFI), 2006. Available online: https://www.ipcc-nggip.iges.or.jp/public/2006gl/ (accessed on 27 April 2020).
- EEA. EMEP/EEA Air Pollutant Emission Inventory Guidebook 2016Technical Guidance to Prepare National Emission Inventories; EEA Report; European Environment Agency: Copenhagen, Denmark, 2016. [Google Scholar]
- Goedkoop, M.; Heijungs, R.; Huijbregts, M.; de Schryver, A.; Struijs, J.; Van Zelm, R. ReCiPe 2008. A life Cycle Impact Assessment Method Which Comprises Harmonised Category Indicators at the Midpoint and the Endpoint Level, 1st ed.; (version 1.08); Ministerie van Volkshuisvesting, Ruimtelijke Ordening en Milieubeheer: Den Haag, The Netherlands, 2013. [Google Scholar]
- Arroja, L.; Belo, S.; Dias, A.C.; Trindade, H.; Almeida, J.; Pinto de Andrade, L. Fileira do Leite e Derivados—Avaliação de Ciclo de Vida do Leite UHT, Iogurte e Queijo; ECODEEP—EcoEficiência e EcoGestão no sector AgroIndustrial: St Paul, MN, USA, 2014. [Google Scholar]
- Broekema, R.; Kramer, G. LCA of Dutch Semi-Skimmed Milk and Semi-Mature Cheese; Blonk Consultants: Gouda, The Netherlands, 2014. [Google Scholar]
- Santos, H.C.M.; Maranduba, H.L.; de Almeida Neto, J.A.; Rodrigues, L.B. Life cycle assessment of cheese production process in a small-sized dairy industry in Brazil. Environ. Sci. Pollut. Res. 2017, 24, 3470–3482. [Google Scholar] [CrossRef] [PubMed]
- van Middelaar, C.E.; Berentsen, P.B.M.; Dolman, M.A.; de Boer, I.J.M. Eco-efficiency in the production chain of Dutch semi-hard cheese. Livest. Sci. 2011, 139, 91–99. [Google Scholar] [CrossRef]
- Nemecek, T.; Schmid, A.; Alig, M.; Schnebli, K.; Vaihinger, M. Variability of the global warming potential and energy demand of Swiss cheese. In Proceedings of the SETAC Europe 17th LCA Case Study Symposium “Sustainable Lifestyles”, Budapest, Hungary, 28 February–1 March 2011; pp. 57–58. [Google Scholar]
- Portaria 259/2012, 28 August 2012. Available online: https://dre.pt/pesquisa/-/search/174783/details/maximized (accessed on 30 July 2020).
Figure 1.
Geographical location of the Beira Baixa PDO cheese production area.

Figure 2.
System boundaries.

Figure 3.
Inventory from both main systems, dairy farm and dairy factory.

Figure 4.
Relative contribution of involved system processes for cheese production by impact category.
Figure 4.
Relative contribution of involved system processes for cheese production by impact category.

Figure 5.
Climate change results associated with each sub-system of the production of 1 kg of cheese.
Figure 5.
Climate change results associated with each sub-system of the production of 1 kg of cheese.

Figure 6.
Terrestrial acidification results associated with each sub-system of the production of 1 kg of cheese.
Figure 6.
Terrestrial acidification results associated with each sub-system of the production of 1 kg of cheese.

Figure 7.
Freshwater eutrophication results associated with each sub-system of the production of 1 kg of cheese.
Figure 7.
Freshwater eutrophication results associated with each sub-system of the production of 1 kg of cheese.

Figure 8.
Marine eutrophication results associated with each sub-system of the production of 1 kg of cheese.
Figure 8.
Marine eutrophication results associated with each sub-system of the production of 1 kg of cheese.

Figure 9.
Climate change results comparison with similar studies.

Figure 10.
Terrestrial acidification results comparison with similar studies.

Figure 11.
Freshwater eutrophication result comparison with similar studies.

Figure 12.
Marine eutrophication result comparison with similar studies.


Table 1.
Inventory data of 1 L raw sheep milk produced in the dairy farm.
| Flow | Unit | Value |
|---|---|---|
| Inputs from technosphere | ||
| Animal diet | ||
| Concentrated feed | kg | 1.390 |
| Alfalfa fodder | kg | 0.100 |
| Imported alfalfa fodder | kg | 0.330 |
| Black eyed peas fodder | kg | 0.170 |
| Maize fodder | kg | 0.070 |
| Oats fodder | kg | 0.100 |
| Rye fodder | kg | 0.070 |
| Water | dm3 | 7.860 |
| Energy | ||
| Electricity (Milking) | kWh | 0.077 |
| Electricity (Cold storage) | kWh | 0.088 |
| Cleaning agents | ||
| Sodium hypochlorite | mL | 1.200 |
| Phosphoric acid | mL | 0.200 |
| Outputs to technosphere | ||
| Sheep raw milk | L | 1.000 |
| Manure | kg | 0.500 |
| Outputs to environment | ||
| CH4 (Enteric fermentation) | g | 25.300 |
| CH4 (Manure management) | g | 0.900 |
| NH3 (Manure housing) | g | 1.270 |
| NH3 (Manure open air) | g | 2.530 |
Table 2.
Inventory data of 1 kg sheep cheese produced in the dairy factory.
| Flow | Unit | Value |
|---|---|---|
| Inputs from technosphere | ||
| Sheep raw milk | kg | 5.500 |
| Salt | kg | 0.040 |
| Cleaning agents | ||
| Sodium hypochlorite | mL | 4.550 |
| Nitric acid | mL | 4.550 |
| Energy | ||
| Electricity | kWh | 0.589 |
| Propane | kg | 0.033 |
| Water | L | 5.950 |
| Cardboard/Labels | kg | 0.003 |
| Outputs to technosphere | ||
| Sheep cheese | kg | 1.000 |
| Outputs to environment | ||
| CO2 (Combustion) | g | 84.600 |
| CH4 (Combustion) | mg | 1.340 |
| N2O (Combustion) | mg | 0.134 |
| NOx (Combustion) | mg | 0.099 |
| CO (Combustion) | mg | 0.039 |
| NMVOCs (Combustion) | mg | 0.031 |
| SOx (Combustion) | mg | 0.001 |
Table 3.
Transportation related data associated with the dairy farm and cheese factory.
| Transported Material | Transport Profile | Distance | Data Quality |
|---|---|---|---|
| Dairy farm | |||
| 100 tons of imported alfalfa fodder | Truck 27 t | 180 km | Real |
| Cleaning agents | Van | 400 km | Real |
| Concentrated feed | Truck 17 t | 300 km | Real |
| Raw sheep milk into factory | Van | 25 km | Real |
| Dairy factory | |||
| Cleaning agents and salt | Van | 50 km | Real |
| Retail | Van | 100 km | Assumption |
| Packaging materials | Van | 50 km | Real |
Table 4.
Final results of the impact assessment associated with the production of 1 kg of cheese.
| Environmental Impact Category | Unity | Value |
|---|---|---|
| Climate Change (CC) | kg CO2eq | 14.96 |
| Terrestrial Acidification (TA) | kg SO2eq | 0.094 |
| Freshwater Eutrophication (FE) | kg Peq | 0.0023 |
| Marine Eutrophication (ME) | kg Neq | 0.072 |
© 2020 by the authors. Licensee MDPI, Basel, Switzerland. This article is an open access article distributed under the terms and conditions of the Creative Commons Attribution (CC BY) license (http://creativecommons.org/licenses/by/4.0/).
Share and Cite
MDPI and ACS Style
Nunes, Ó.S.; Gaspar, P.D.; Nunes, J.; Quinteiro, P.; Dias, A.C.; Godina, R. Life-Cycle Assessment of Dairy Products—Case Study of Regional Cheese Produced in Portugal. Processes 2020, 8, 1182. https://doi.org/10.3390/pr8091182
AMA Style
Nunes ÓS, Gaspar PD, Nunes J, Quinteiro P, Dias AC, Godina R. Life-Cycle Assessment of Dairy Products—Case Study of Regional Cheese Produced in Portugal. Processes. 2020; 8(9):1182. https://doi.org/10.3390/pr8091182
Chicago/Turabian StyleNunes, Óscar Soares, Pedro Dinis Gaspar, José Nunes, Paula Quinteiro, Ana Cláudia Dias, and Radu Godina. 2020. "Life-Cycle Assessment of Dairy Products—Case Study of Regional Cheese Produced in Portugal" Processes 8, no. 9: 1182. https://doi.org/10.3390/pr8091182
Note that from the first issue of 2016, this journal uses article numbers instead of page numbers. See further details here.