Modelling of a Single Passage Air PV/T Solar Collector: Experimental and Simulation Design


1
Fundamental and Applied Sciences Department, Universiti Teknologi PETRONAS, Seri Iskandar 32610, Malaysia
2
Faculty of Applied Sciences, Universiti Teknologi MARA, Arau 02600, Malaysia
3
School of Informatics and Applied Mathematics, Universiti Malaysia Terengganu, Kuala Terengganu 21030, Malaysia
*
Author to whom correspondence should be addressed.
Processes 2020, 8(7), 763; https://doi.org/10.3390/pr8070763
Submission received: 1 May 2020
/
Revised: 11 June 2020
/
Accepted: 17 June 2020
/
Published: 29 June 2020
(This article belongs to the Special Issue Sustainable Modelling, Processes and Applications for Societal Development)
Abstract
:The hybrid photovoltaic/thermal solar collector has attracted research attention for more than five decades. Its capability to produce thermal energy simultaneously with electrical energy is considered attractive since it provides higher total efficiency than stand-alone photovoltaic or thermal systems separately. This paper describes theoretical and experimental studies of a finned single pass air-type photovoltaic/thermal (PV/T) solar collector. The performance of the system is calculated based on one dimensional (1D) steady-state analysis using one dimensional energy balance equations, where simulation was carried out using MATLAB. Experiments were carried out to observe the performance of the solar collector under changes in air mass flow rate. Experimental values on photovoltaic panel temperature and air temperature on both air inlet and outlet, together with the ambient temperature and solar radiation were measured. The simulation results were validated against the results obtained from experiments using the error analysis method, Root Mean Square Error. At a solar irradiance level of 800 to 900 W/m2, the thermal efficiency increases to 20.32% while the electrical efficiency increases to 12.01% when the air mass flow rate increases from 0.00015 kg/s to 0.01 kg/s. The error analysis shows that both experimental and simulation results are in good agreement.
1. Introduction
The photovoltaic/thermal PV/T solar collector is a system of heat exchanger that is capable to harness not only electrical energy, but also thermal energy from the solar radiation absorbed with no noise, pollution or moving parts. PV/T is used to describe a solar thermal collector with integrated PV cells that can produce electrical and thermal energy at the same time [1]. Solar energy could be produced more effectively compared to operating individually, as the simultaneous operation of PV and solar thermal collector offers higher solar conversion rates [2]. By combining both systems in the same frames and brackets, PV/T also offers a smaller size collector that requires a smaller area and lower equipment cost than having two collectors with different systems [3]. Therefore, researchers have shown increasing interest in PV/T technology, wherein solar energy is predicted to be deeply exploited and utilized.
Heat and electrical energy collection is the main consideration in the related factors that affect the overall performance of the PV/T system [4]. The process of harnessing solar energy produces thermal energy, which increase the temperature of the solar cells. This is because, in a conventional PV solar collector, only photons with energy greater than or equal to the band-gap energy of the cells will create electron-hole pairs and produce electricity [5]. The rest will be wasted in the form of heat. Many studies showed that the open circuit voltage of a PV system is reduced if there is increase in temperature, which could produce lower electrical efficiency. Therefore, it has been proposed and proved that the overall PV system efficiency can be improved by the addition of a cooler, which could reduce the temperature of the PV panel [6]. Working fluid, such as water and air, are usually chosen as the medium of heat removal [7]. The role of the fluid is crucial to help reduce the temperature of the PV module and increase its photovoltaic efficiency by removing excess heat [8]. Studies carried out in previous years have investigated the effect of heat removing fluid. Water-typed PV/T collectors have common parts. What makes them different is that while the flat plat collector has the transparent glass on top, it is replaced with a plank PV for the water PV/T collector. Since the demand for clean water, as well as thermal and electrical energy, increases day by day, solar distillation is often chosen to convert contaminated water to clean water [9].
The studies in theoretical and experimental analysis of photovoltaic/thermal (PV/T) solar collectors have been conducted by researchers since the mid-1970s and have evolved overtime [3]. Wolf [10] carried out some of the earliest analysis of the performance of combined solar photovoltaic and heating systems for a single residence, while Florschuetz [11] extended the famous Hottel–Whillier model to analyze the performance of the PV/T flat plate solar collector. The technology of air-based PV/T innovation (PV plus thermal) is widely used and its known general operation efficiencies range from 20–40%. Since the efficiency of crystalline silicon cells range from 10–12%, the thermal part provides the rest of the efficiency [12]. There are several designs of air passage for a solar PV/T that have been used previously. Hegazy [13] performed a further study of the thermal, electrical, hydraulic and overall performances of flat plate photovoltaic/thermal (PV/T) air collectors. Four of the most preferred designs are considered in this study. The models represent where the air is flowing, either over the absorber (Model I) or under it (Model II) and on both sides of the absorber in a single pass (Model III) or in a double pass fashion (Model IV). The effects of air-specific flow rate and the selectivity of the absorber plate and PV cells on the performances have been examined. It has been found that Model III has the highest efficiency in higher radiation, while Model I has the lowest performance. Saygin et al. [14] proposed a modified photovoltaic/thermal (PV/T) solar collector where, in the study, air passes through a slot at the middle of the glass cover in the solar collector. They investigated the PV system with no cooling and compared the PV/T collector with different distances between the panel and glass cover (3 cm, 5 cm and 7 cm). In their research, they found that when the distance between PV module and cover was 3 cm, the highest thermal performance was obtained while a 5 cm gap between them gives out the highest electrical efficiency. Kumar and Rosen [15] investigated a double pass photovoltaic/thermal (PV/T) solar air heater attached with vertical fins in the lower channel. Their findings showed that the solar cell temperature is reduced significantly from 82 °C to 66 °C. It is also stated that one of the crucial parameters in designing PV/T collectors is the packing factor. Dubey et al. [16] analyzed two types of PV module, glass-to-glass and glass-to-tedlar, with and without duct (air pass way) and found that the first PV module type with duct produces higher efficiency than second type of PV module. This occurred because the radiation that falls on the non-packing area of the glass-to-glass PV module is transmitted through the glass cover, while in the other type of module, all radiation is absorbed by the tedlar. The heat transfer occurs through conduction, causing higher temperature of solar cells in glass to the tedlar-type, resulting in lower efficiency.
The researchers also show their interest in investigating the operation of water-type PV/T solar collectors. Kiran and Devadiga [17] studied the performance of a PV/T system with water as a cooling agent. It is found that without cooling, the electrical efficiency of the system is lower as compared to when cooling is added. The total efficiency of PV/T system was found to be higher than the individual stand-alone PV panel and currents solar water collector. Azad [18] has conducted a study comparing the experimental analysis of two heat pipe solar collectors with different numbers of heat pipes and a flow-through collector. Three collectors with six pipes, 12 pipes and one-flow through type have been constructed and tested simultaneously. It is concluded that to increase the efficiency of heat pipe collectors, the number of heat pipes and the effective absorber area need to be increased by the proper design of the heat pipe condenser. However, as water-type PV/T collector is costly and hard to maintain, the air-type PV/T collector is often preferred.
It is known that the PV cell temperature change affects the electrical efficiency of the PV module. Therefore, it is crucial to note the parameters that could affect the PV cells temperature; most importantly, the PV cell encapsulation and material properties. The effects of external factors such as the solar irradiance, ambient temperature and wind speed must also be considered [19]. A study has been completed that proved the accumulation of dust, shading, and bird fouling has a significant effect on PV current and voltage, and consequently, the harvested PV energy [20]. The changes in surrounding conditions or atmospheric phenomena could be considered as the most affecting factors contributing to the performance of a PV/T collector. An analytic expression for solar radiation can be defined on a clear sunny day, however it is not possible during cloudy days. Hence, there has been a study on a statistical tool to detect abnormal operating conditions that affect the performance of the PV panel effectively for PV plants that are not equipped with a weather station [21].
The common method used to simulate a performance of a PV/T solar collector is a one-dimensional (1D) energy balance equation representing the heat transfer occurring in the collector. Sathyamurthy et al. [22] studied a one-dimensional energy balance equation and wrote a review on the enhancement techniques of solar still, including flat plate collectors, pulsating heat pipes, concentrating collectors, evacuated tube collectors, parabolic trough, thermoelectric effect, solar water heater and PV/T still. Zondag et al. [23] used this method to investigate and compare the performance of seven different design types of PV/T collectors to study the electrical and thermal efficiency of collectors of each design which can be grouped into four; sheet-and-tube PV/T collector, channel PV/T collector, free flow PV/T collector and two-absorber PV/T collector. It is concluded that the highest efficiency is produced by channel-below-transparent-PV design. In [5], the researchers improved the PV/T solar collector design which integrated a PV panel with a water heating component; a serpentine-shaped copper tube and air heating component which is a single pass air channel. The simulations using 1D energy balance equations showed that when both fluids are operated alone, the total thermal and electrical performances are only satisfactory, and higher when operated simultaneously. Tiwari and Sodha [24] evaluated the overall performance of hybrid PV/thermal (PV/T) air collectors with different configurations; unglazed and glazed PV/T air heaters, with and without tedlar. It is found that in the unglazed PV/T module, there is no difference in the solar cell temperature of with and without tedlar, except there is a slight increase in outlet air temperature in the model due to absence of tedlar. Sarhaddi et al. [25] presented a detailed thermal and electrical model developed to calculate the thermal and electrical parameters of a typical PV/T air collector which includes the parameters such as solar cell, temperature, back surface temperature, outlet air temperature, open-circuit voltage, short-circuit current, maximum power point, voltage, maximum power point current, etc.
In this study, a 1D mathematical model of energy balance equations was uniquely developed representing the heat transfer in the solar collector system built. The simulation is used to represent the solar collector system to better understand the effect of the parameter changes on the its performance. Since the operation of the PV/T solar collector involves uncertainty of the weather changes, the simulation is extensively used to carry out a comprehensive study. The unique design of the solar collector that is used to develop the model in this study is a single pass air PV/T solar collector attached with fins. The objective of this paper is to present a comprehensive mathematical model with a focus on the simulation description details. The results of the simulation are then verified with actual data collected from the experiment carried out. This paper is structured as follows. The design of the solar collector fabricated specifically for this study is explained in Section 2. The mathematical modelling representing the solar collector system is discussed in Theoretical Analysis in Section 3 and its solution in Section 4; while in Section 5, the experimental results obtained are presented as a validation to the simulation results. The results and discussion are presented in Section 6, and the last section is dedicated for the conclusion of the study.
2. Design of Solar Collector
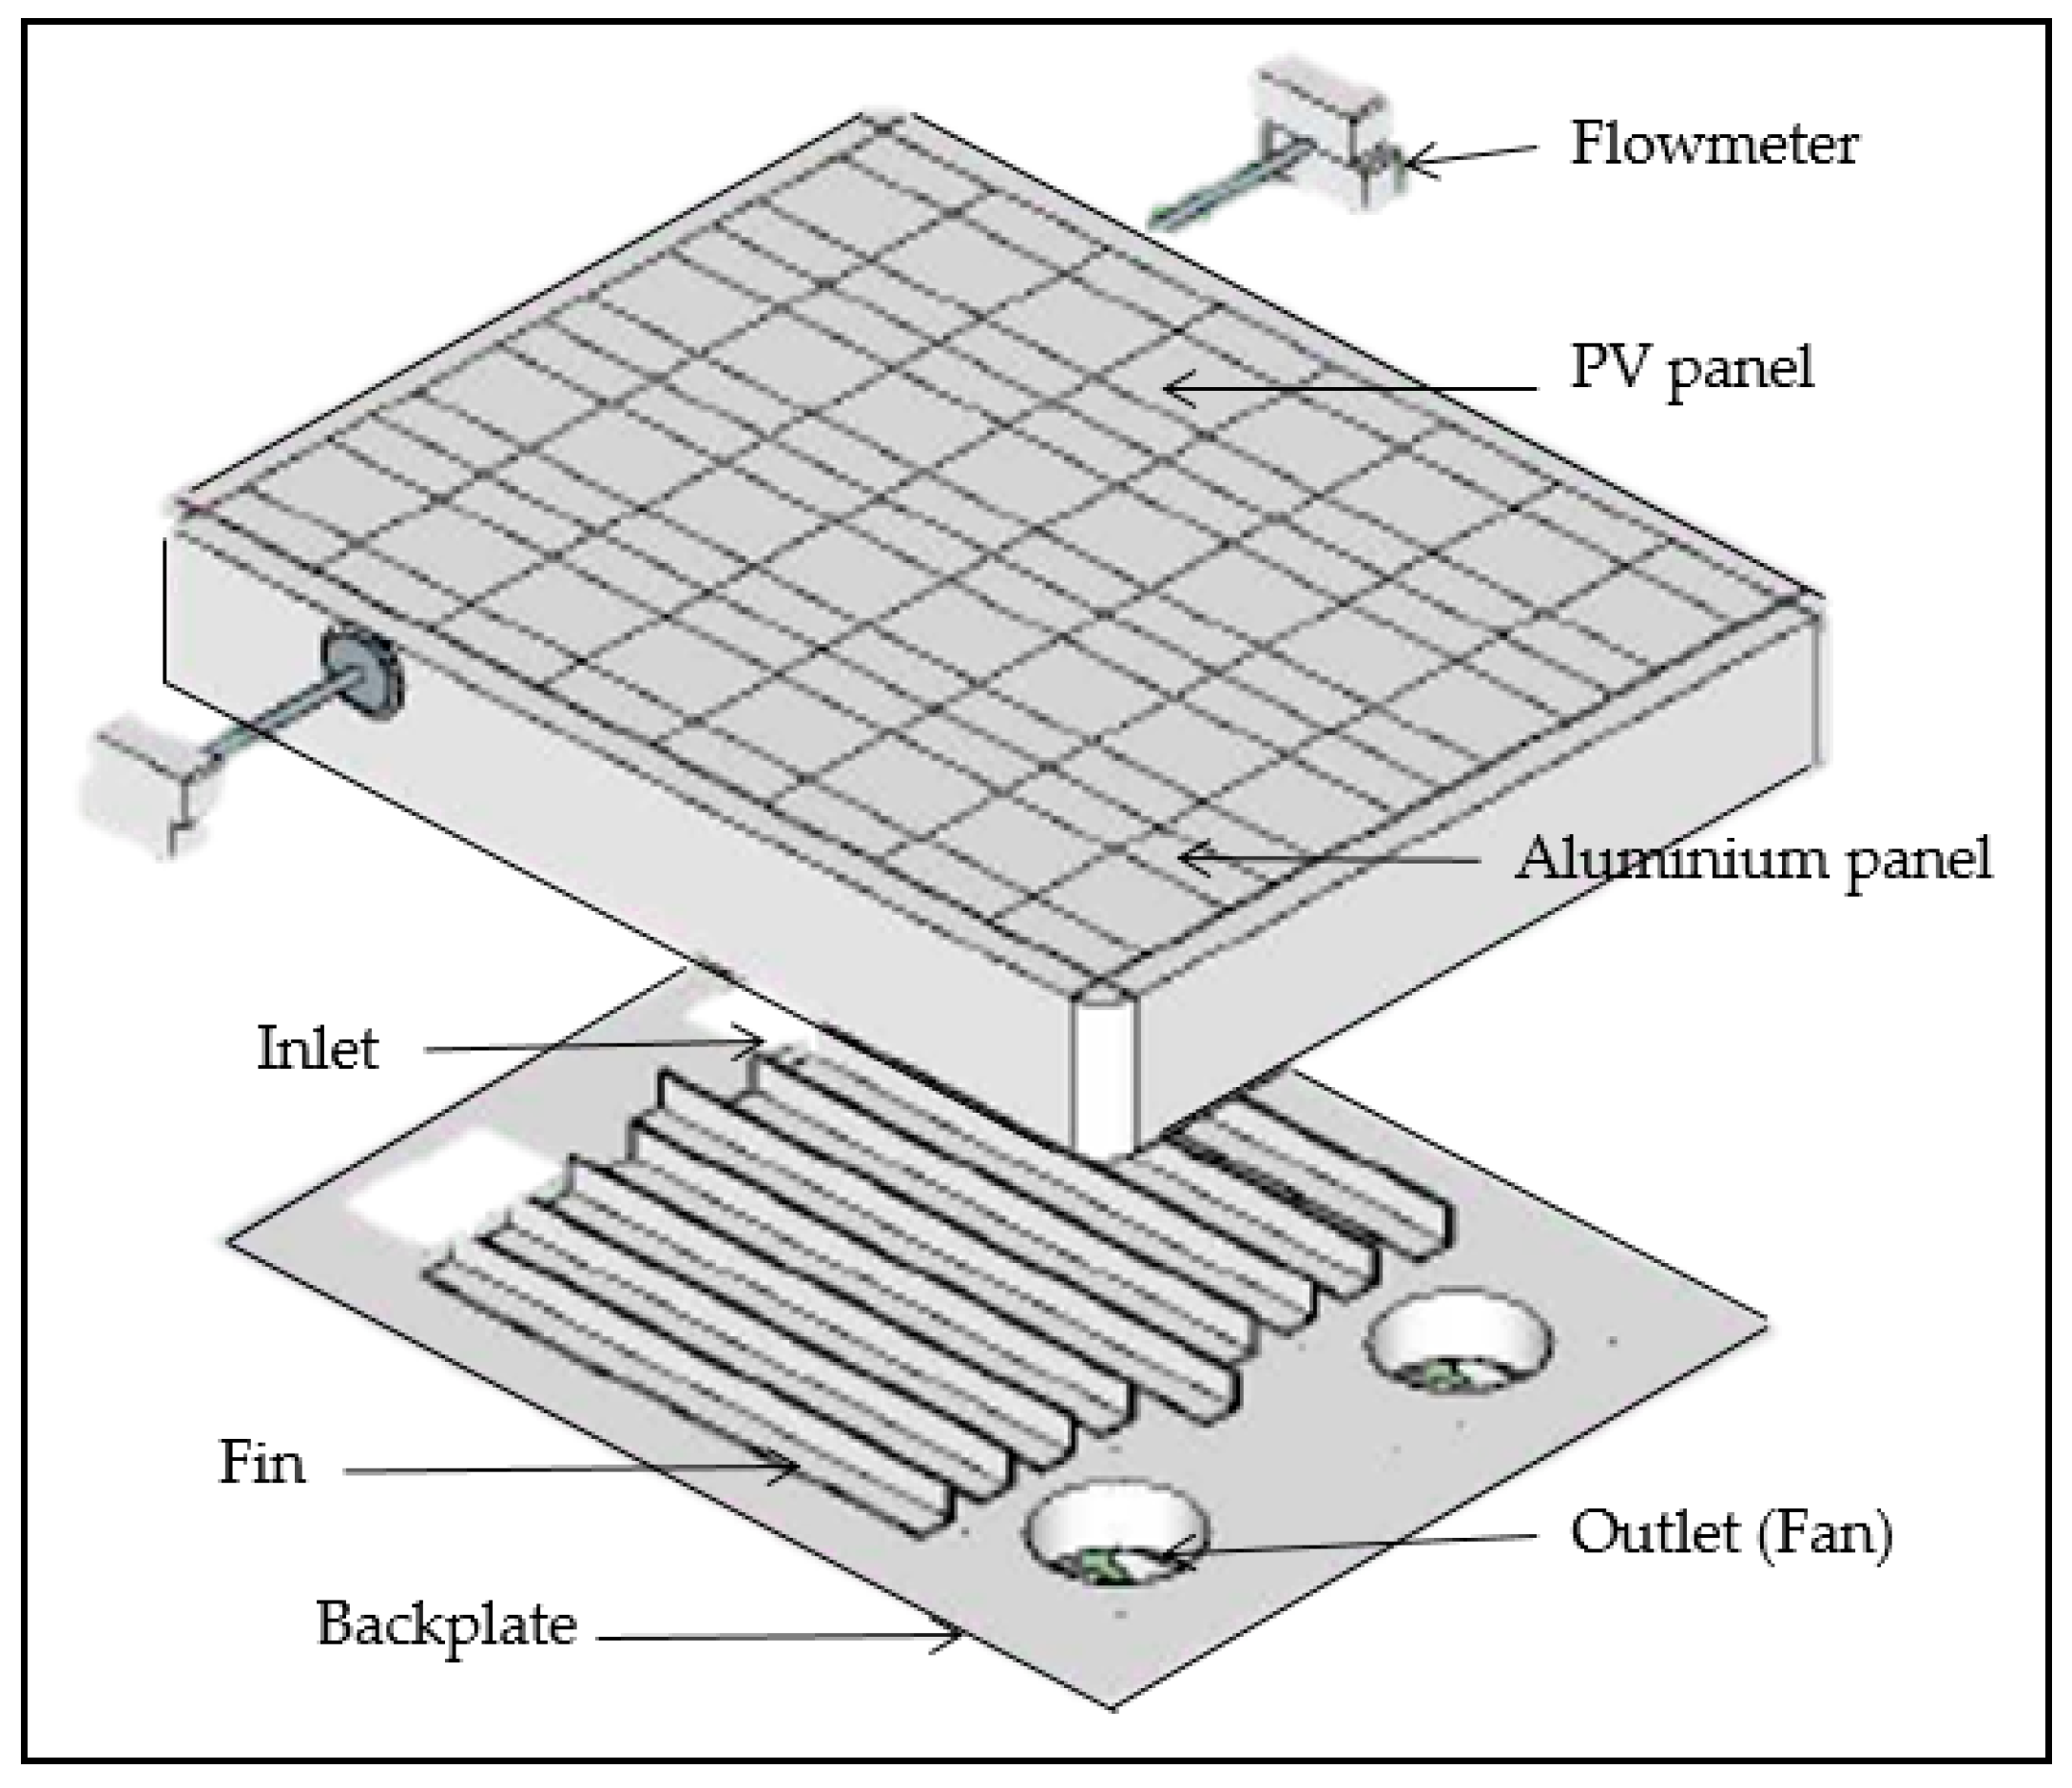
Based on the literature review, a design of a solar collector consists of a PV module and a single pass air channel below the module as shown in Figure 1. This configuration has been widely used by previous researchers, however, the system built in this study focuses on a compact design of an air PV/T solar collector. The PV panel used is a commercial 50 W monocrystalline silicon CG-M050 panel of dimension 69 cm × 54 cm × 3 cm. The PV panel is a three-layer panel with a tempered glass on top and an absorber plate at the bottom, comprised of solar cells encapsulated by a thin adhesive layer called ethylene-vinyl acetate (EVA). Fins are added parallel to the air flow direction as a heat transfer rate enhancement factor by providing augmented heat transfer area. The gap between the absorber plate and the back plate created an air passage for the heat transfer. The system operated with air is forced in and out of the collector by two 12 V DC fans to extract the excess heat from the PV module to be converted into useful heat in other energy applications. Aluminium is selected to fabricate the backplate and the fins attached on it by taking into account its ability absorb and transfer heat from solar cell, as well as the density of the material and its economic viability [26]. The fabrication of the PV panel into a solar collector was carried out by a collaboration with a local manufacturer. All data from the experiment are collected through a data logger connected to a PC. The temperature, air mass flow rate and solar irradiance are measured using temperature sensors, flowmeters and a pyranometer respectively.
3. Theoretical Analysis
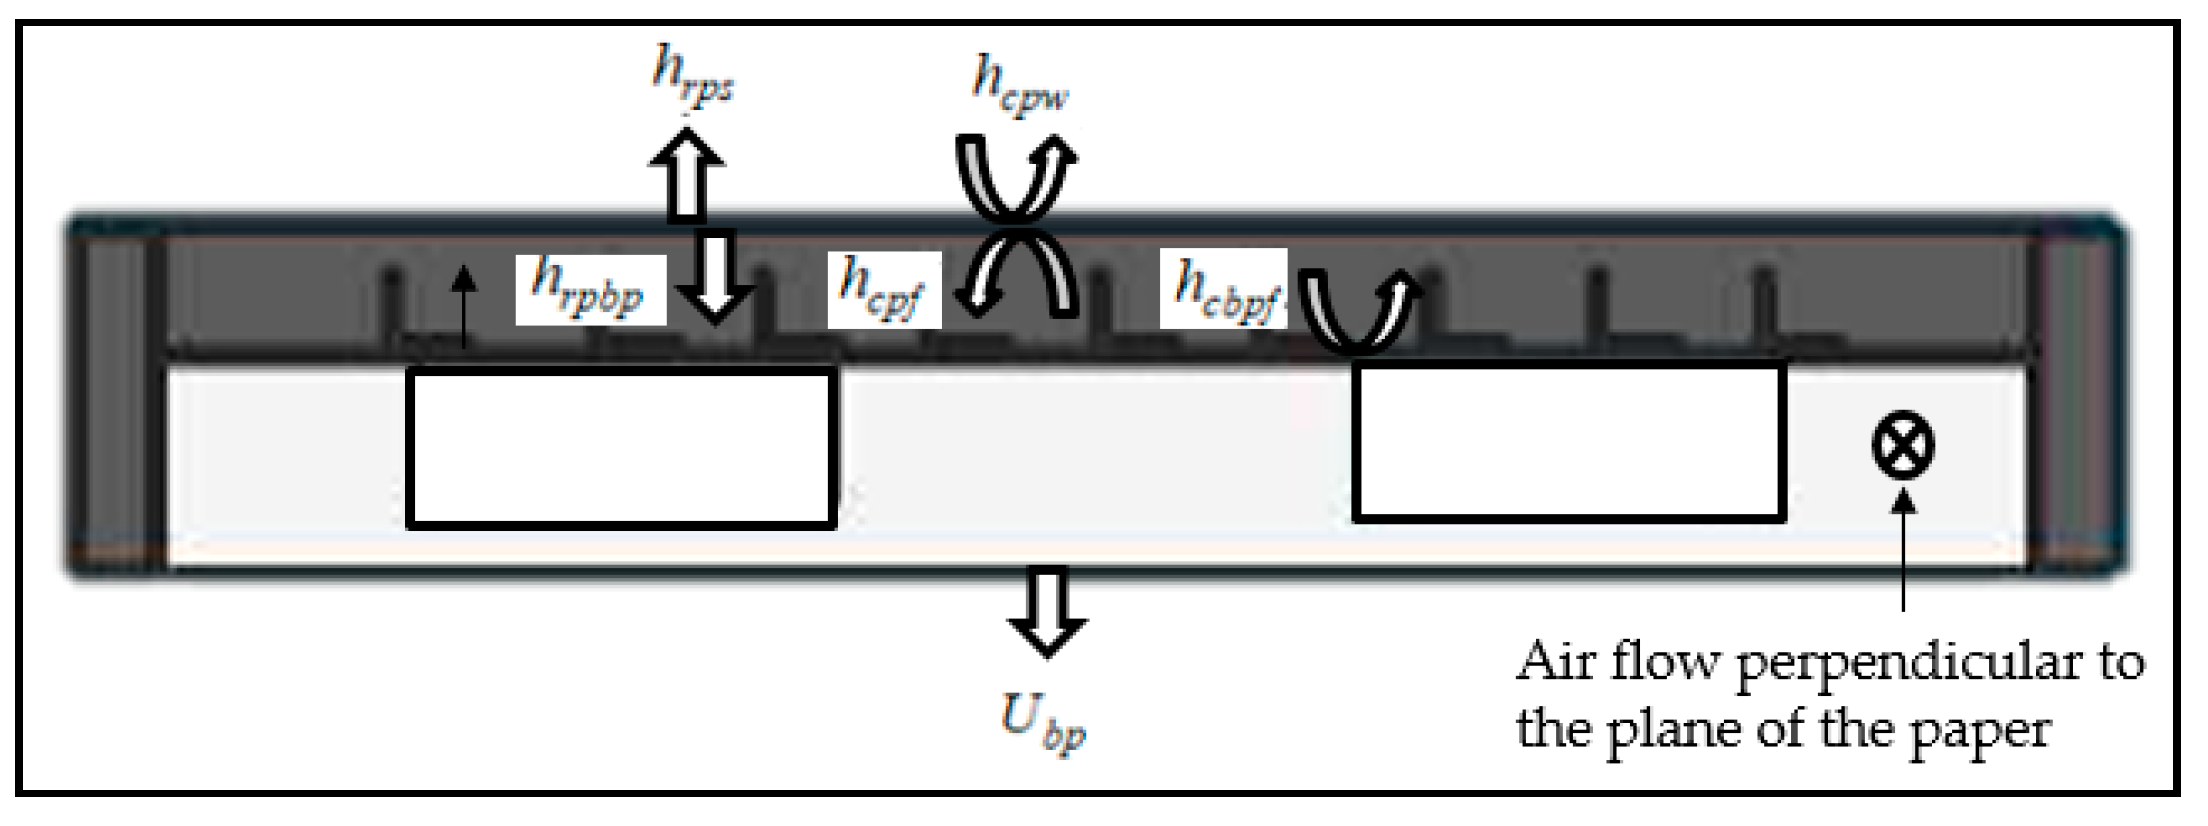
In this study, a steady-state one dimensional analysis is obtained. The governing equations are obtained which involve steady-state energy balance equations at various points of the solar collector. The thermal schematic model of the collector is shown in Figure 3.
To simplify the analysis, the following assumptions were made:
- Steady state of energy transfer was achieved.
- Heat capacity effects of the solar cells and back plate were neglected.
- The temperatures of the glass cover, solar cells and plates vary only in the direction of air flow.
- The side losses from the system are negligible.
Following the work by [23,27,28], the energy balance equations for each temperature nodes can be written as follows:
- For the nodes of the solar cells of the PV module;
- For the air temperature nodes;where fin effectiveness, fin efficiency, and .
- For the nodes of the surface of back plate with fins;
The heat transfer terms involved in the equations above are defined as follows:
- The rate of the solar energy absorbed by the absorber plate of the PV module per unit area.
- The rate of the solar energy received by solar cells of the PV module after transmission and the rate of electrical energy available per unit area.
- The rate of heat transfer to the air flow per unit area.
- The rate of energy radiated to the surface of the back plate and fins per unit area.
- The rate of energy radiated to the sky per unit area.
- The rate of heat transfer to the wind per unit area.
- The rate of heat transfer to the air flow per unit area.
- The rate of heat lost to ambient through back plate per unit area.
Equation (1) can be rearranged into:
The heat transfer coefficients are defined as
Equation (2) can be rearranged into:
where the heat transfer coefficients are defined as
Equation (3) can be rearranged into:
From Equations (4) and (6), the expression for temperature of absorber plate and backplate can be written as Equations (7) and (8), respectively:
The variables and can be eliminated from Equation (5) by substituting Equations (4) and (6) into it. The following linear first order differential equation with boundary condition is obtained.
and are the constants obtained through algebraic manipulations where
Solving the first order linear differential equation in Equation (9) gives the solution as expressed in Equation (10) below:
The average temperature of the PV is calculated using numerical integration rule as in Equation (11) to obtain Equation (12).
Following are the heat transfer coefficients employed in the above equations. The radiative heat transfer coefficient between the absorber plate of the PV panel and the sky is given by Equation (13) [25].
where is equivalent sky temperature represented by Swimbank’s formula [29] given by Equation (14).
The radiative heat transfer coefficient between the absorber plate and the backplate is obtained from Equation (15).
The wind convective heat transfer coefficient is calculated by Equation (16) (in Mac Adam (1954) as cited in [30]).
The convective heat transfer coefficient between air and absorber plate is evaluated by Equation (17), and between air and backplate by Equation (18).
in which is the cross-section area of the collector and is thermal heat conductivity in the air channel given by Equation (19).
, the Nusselt number is determined based on the flow of the air (laminar, transition and turbulent) as determined in Equations (20)–(22) (Heaton (1964) as cited in [31]).
For (Laminar flow),
where
For (Transition flow) (Hausen (1943) as cited in [32]),
For (Turbulent flow) [33],
4. Solution to the Equations
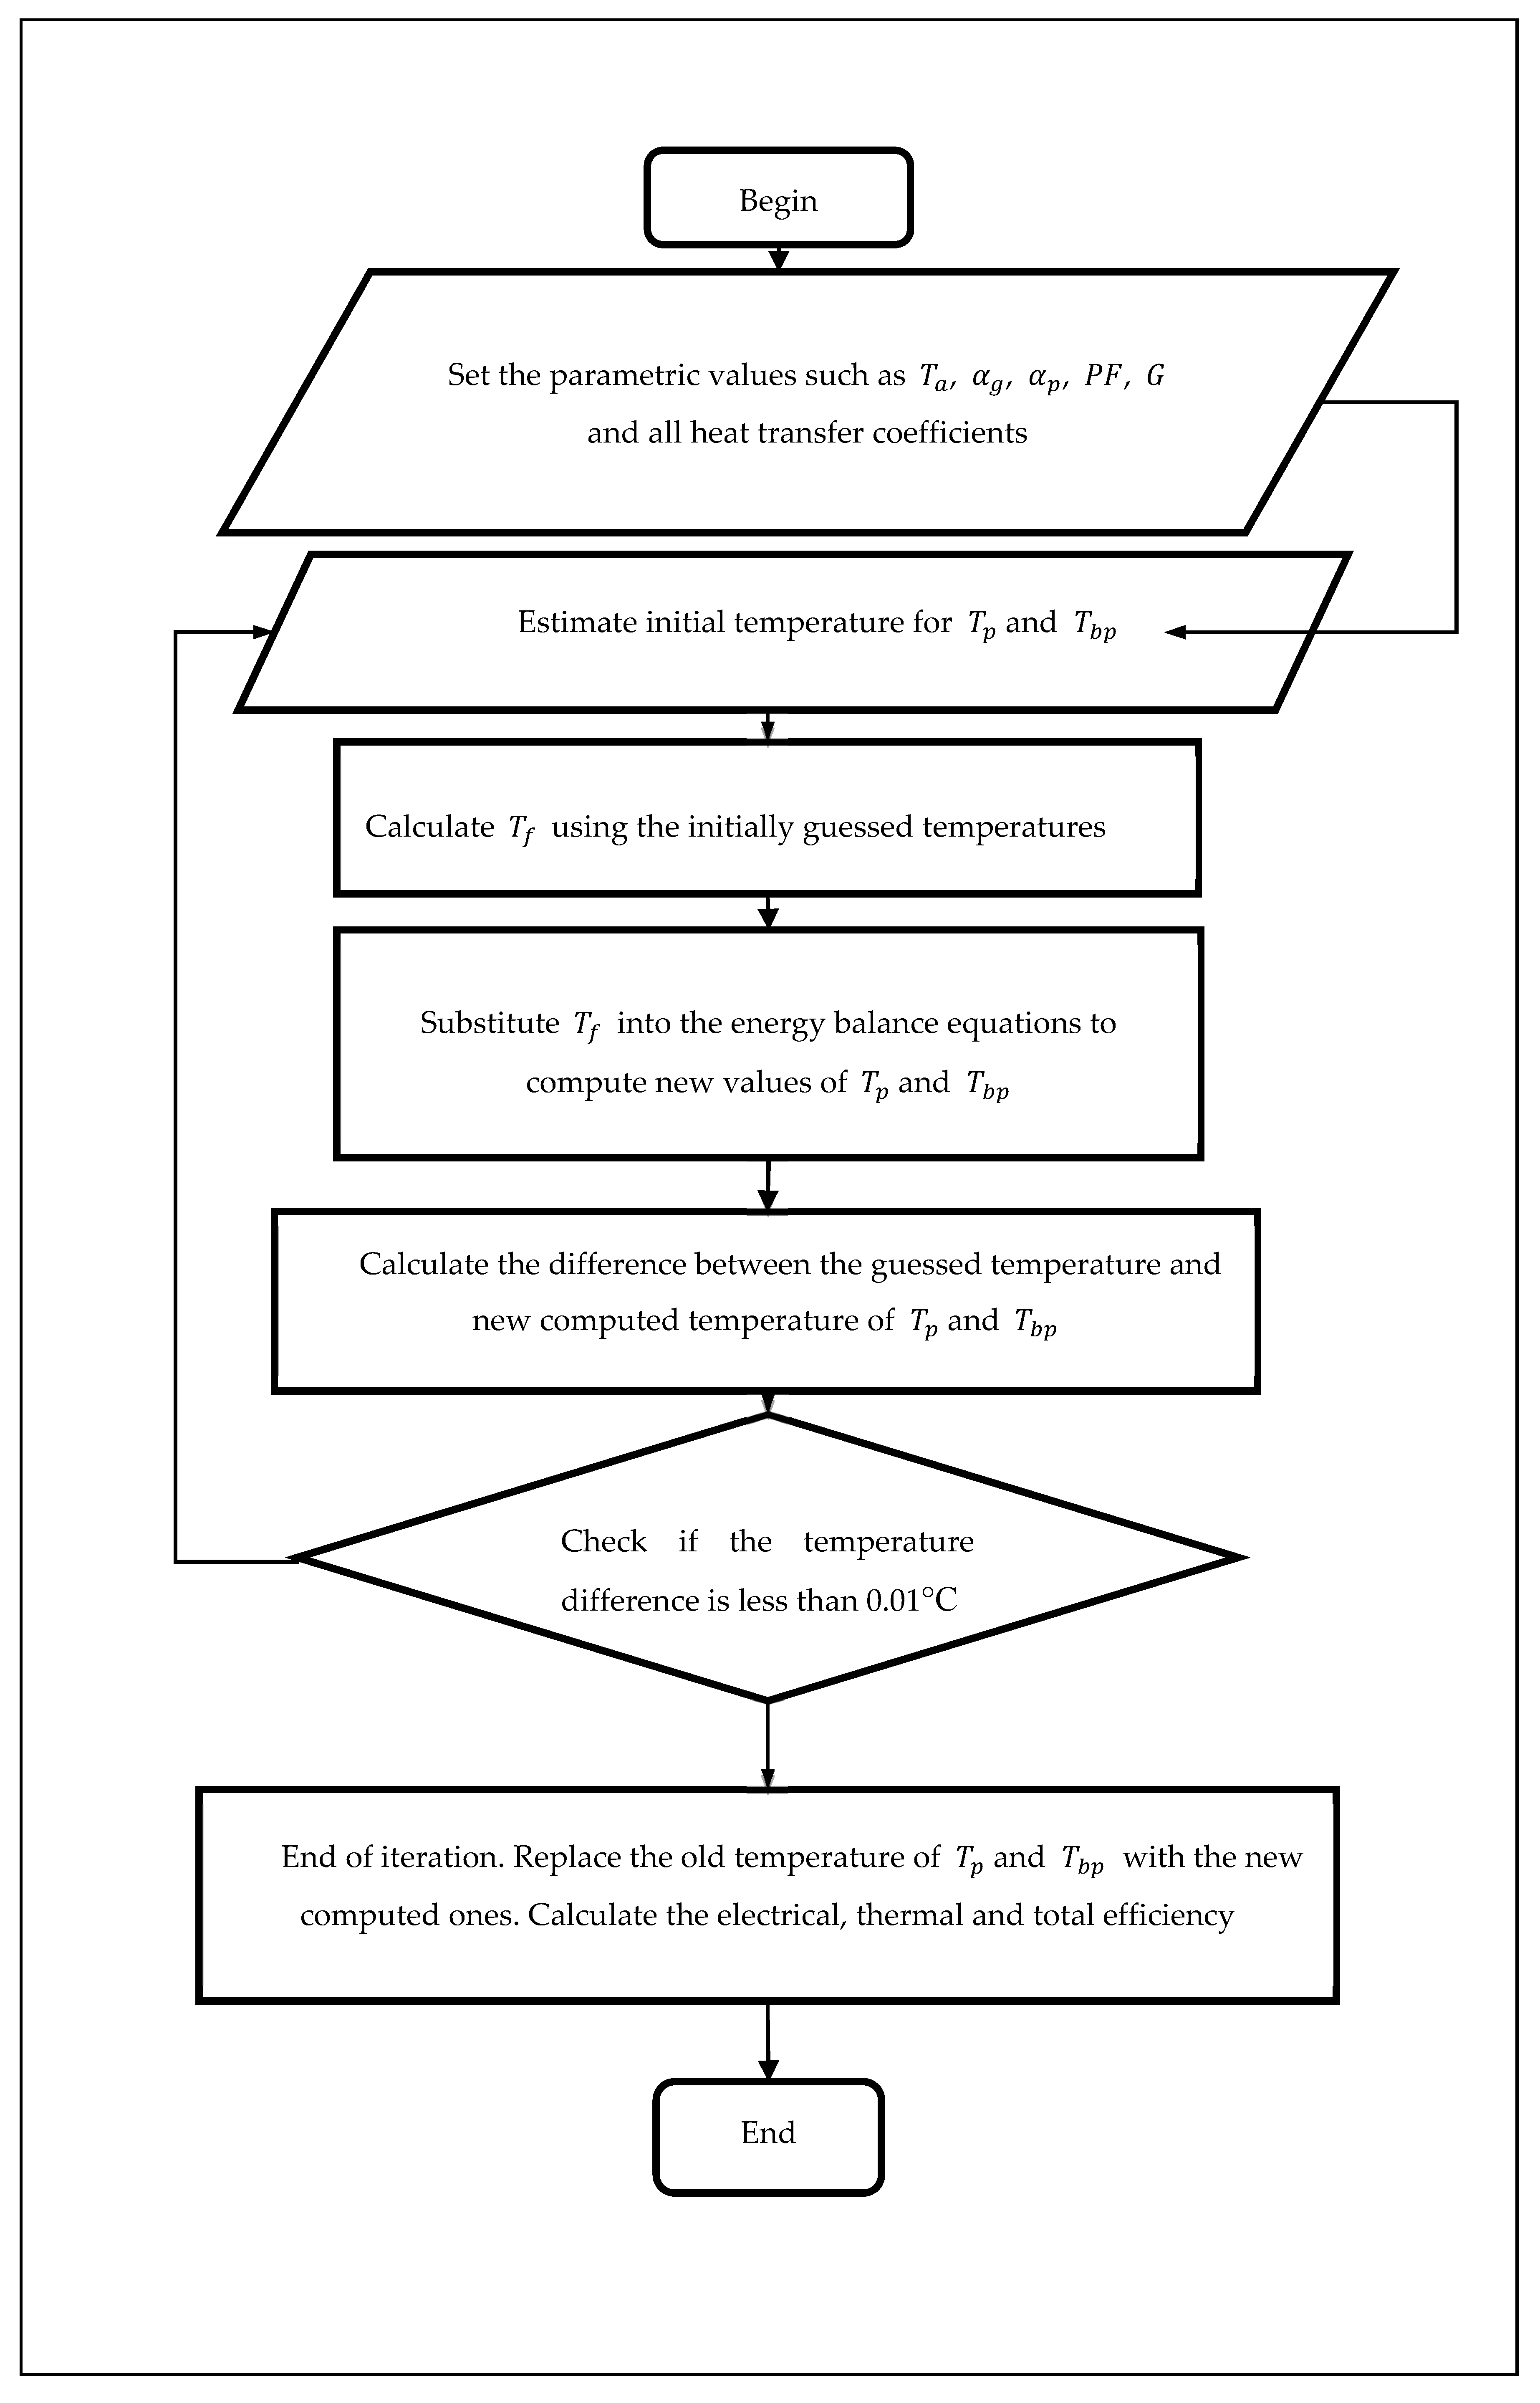
The model explained in Section 3 is used to perform simulation by using MATLAB to analyze the performance of the solar collector. The proposed algorithm built for the simulation is shown in the flowchart in Figure 4. The program is initiated with the setting up of the values of parameters (Table 1) and estimated temperatures of the absorber plate, and the temperature of the back plate, which are then used to calculate the temperature of air and thermophysical properties of the fluids. Then, the simulation runs to calculate the values of the temperature of air, to be used to compute the new value of and . The process continues by calculating the difference between the estimated temperature and the computed temperature. If the difference calculated is less than 0.01 °C, the process stops iterating, and the new computed values of the temperature will replace the old ones.
Energy Analysis
The thermal efficiency is calculated by simplifying the equations by [23]:
The efficiency of crystalline silicon cells decreases with increasing temperature, since the open circuit voltage and fill factor decreases, but the short circuit current slightly increases. The electrical efficiency of the collector written as a function of temperature based on [23,34] is as follows:
Since there is difference in the nature of the electrical and thermal energy, the total overall thermal equivalent efficiency of a PV/T solar collector, as referred to [11] is calculated as:
5. Experimental Validation
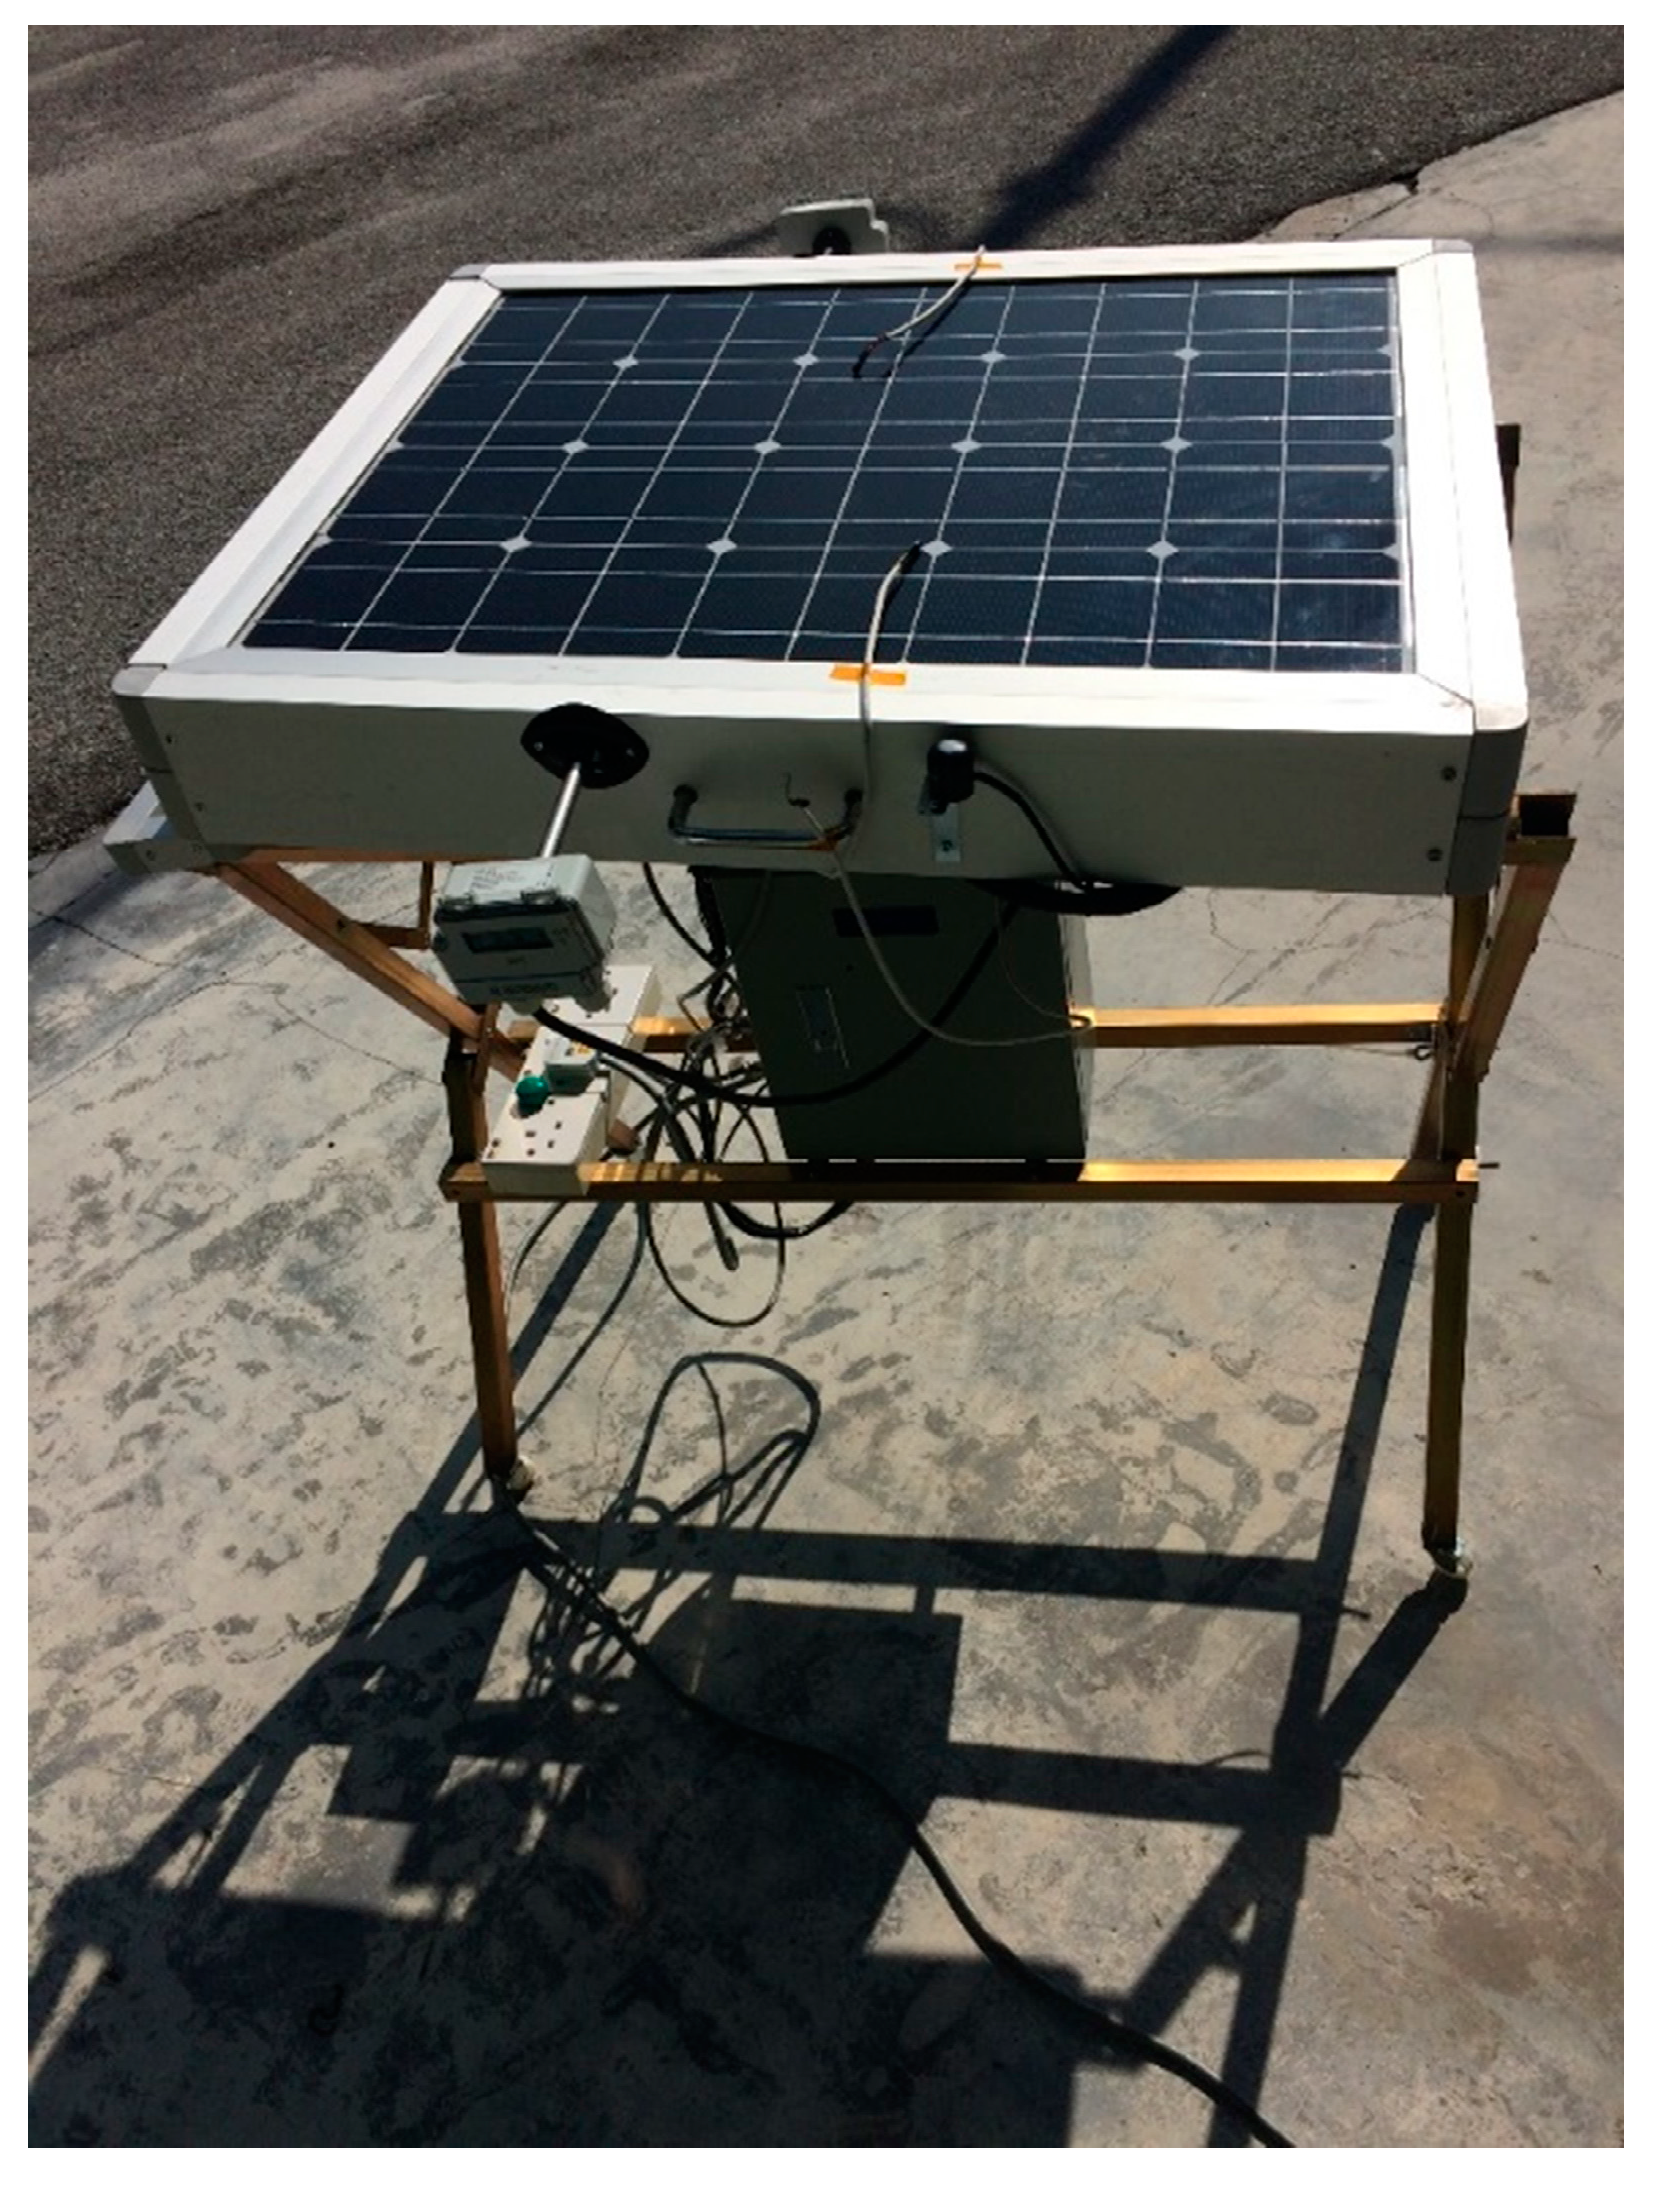
The PV/T solar collector is set up (see Figure 5) for data collection in the compound of Universiti Teknologi PETRONAS (UTP). The set-up is based on the following conditions. To simplify the analysis, the following assumptions were made:
- Mounting Location—PV modules can be mounted on ground, where a power source is available, while heat capacity effects of the solar cells and back plate were neglected.
- Shading—Photovoltaic arrays are adversely affected by shading. A well-designed PV system needs clear and unobstruct access to the sun’s rays from 9 a.m. to 3 p.m. Even small shadows, such as the shadow of a single branch of a leafless tree can significantly reduce the power output of a solar module. Keep in mind that an area may be unshaded during one part of the day but shaded at another part of the day.
- Orientation—PV modules are ideally oriented towards true south.
- Tilt—The PV modules need to be installed according to the latitude angle of the location where it is placed. For the compound of UTP where the collector system is installed, the tilt angle is approximately 4.3590°.
Validation methods were performed by comparing results obtained experimentally and theoretically based on the trend shown on the related graphs. In this study, the error analysis performed was Root Mean Square Error (RMSE) [25];
6. Results and Discussion
The mathematical model that was developed is used to carry out the simulation in MATLAB and the data collected from the experiment were used to calculate the performance of the solar collector. The algorithm in Figure 4 is used in predicting the values of parameters in the simulation, which are validated using the experimental results. The developed model is said to be valid if the results of both theoretical and experimental curves show good agreement. The results obtained from the simulation and experiment carried out are shown graphically in the figures below.
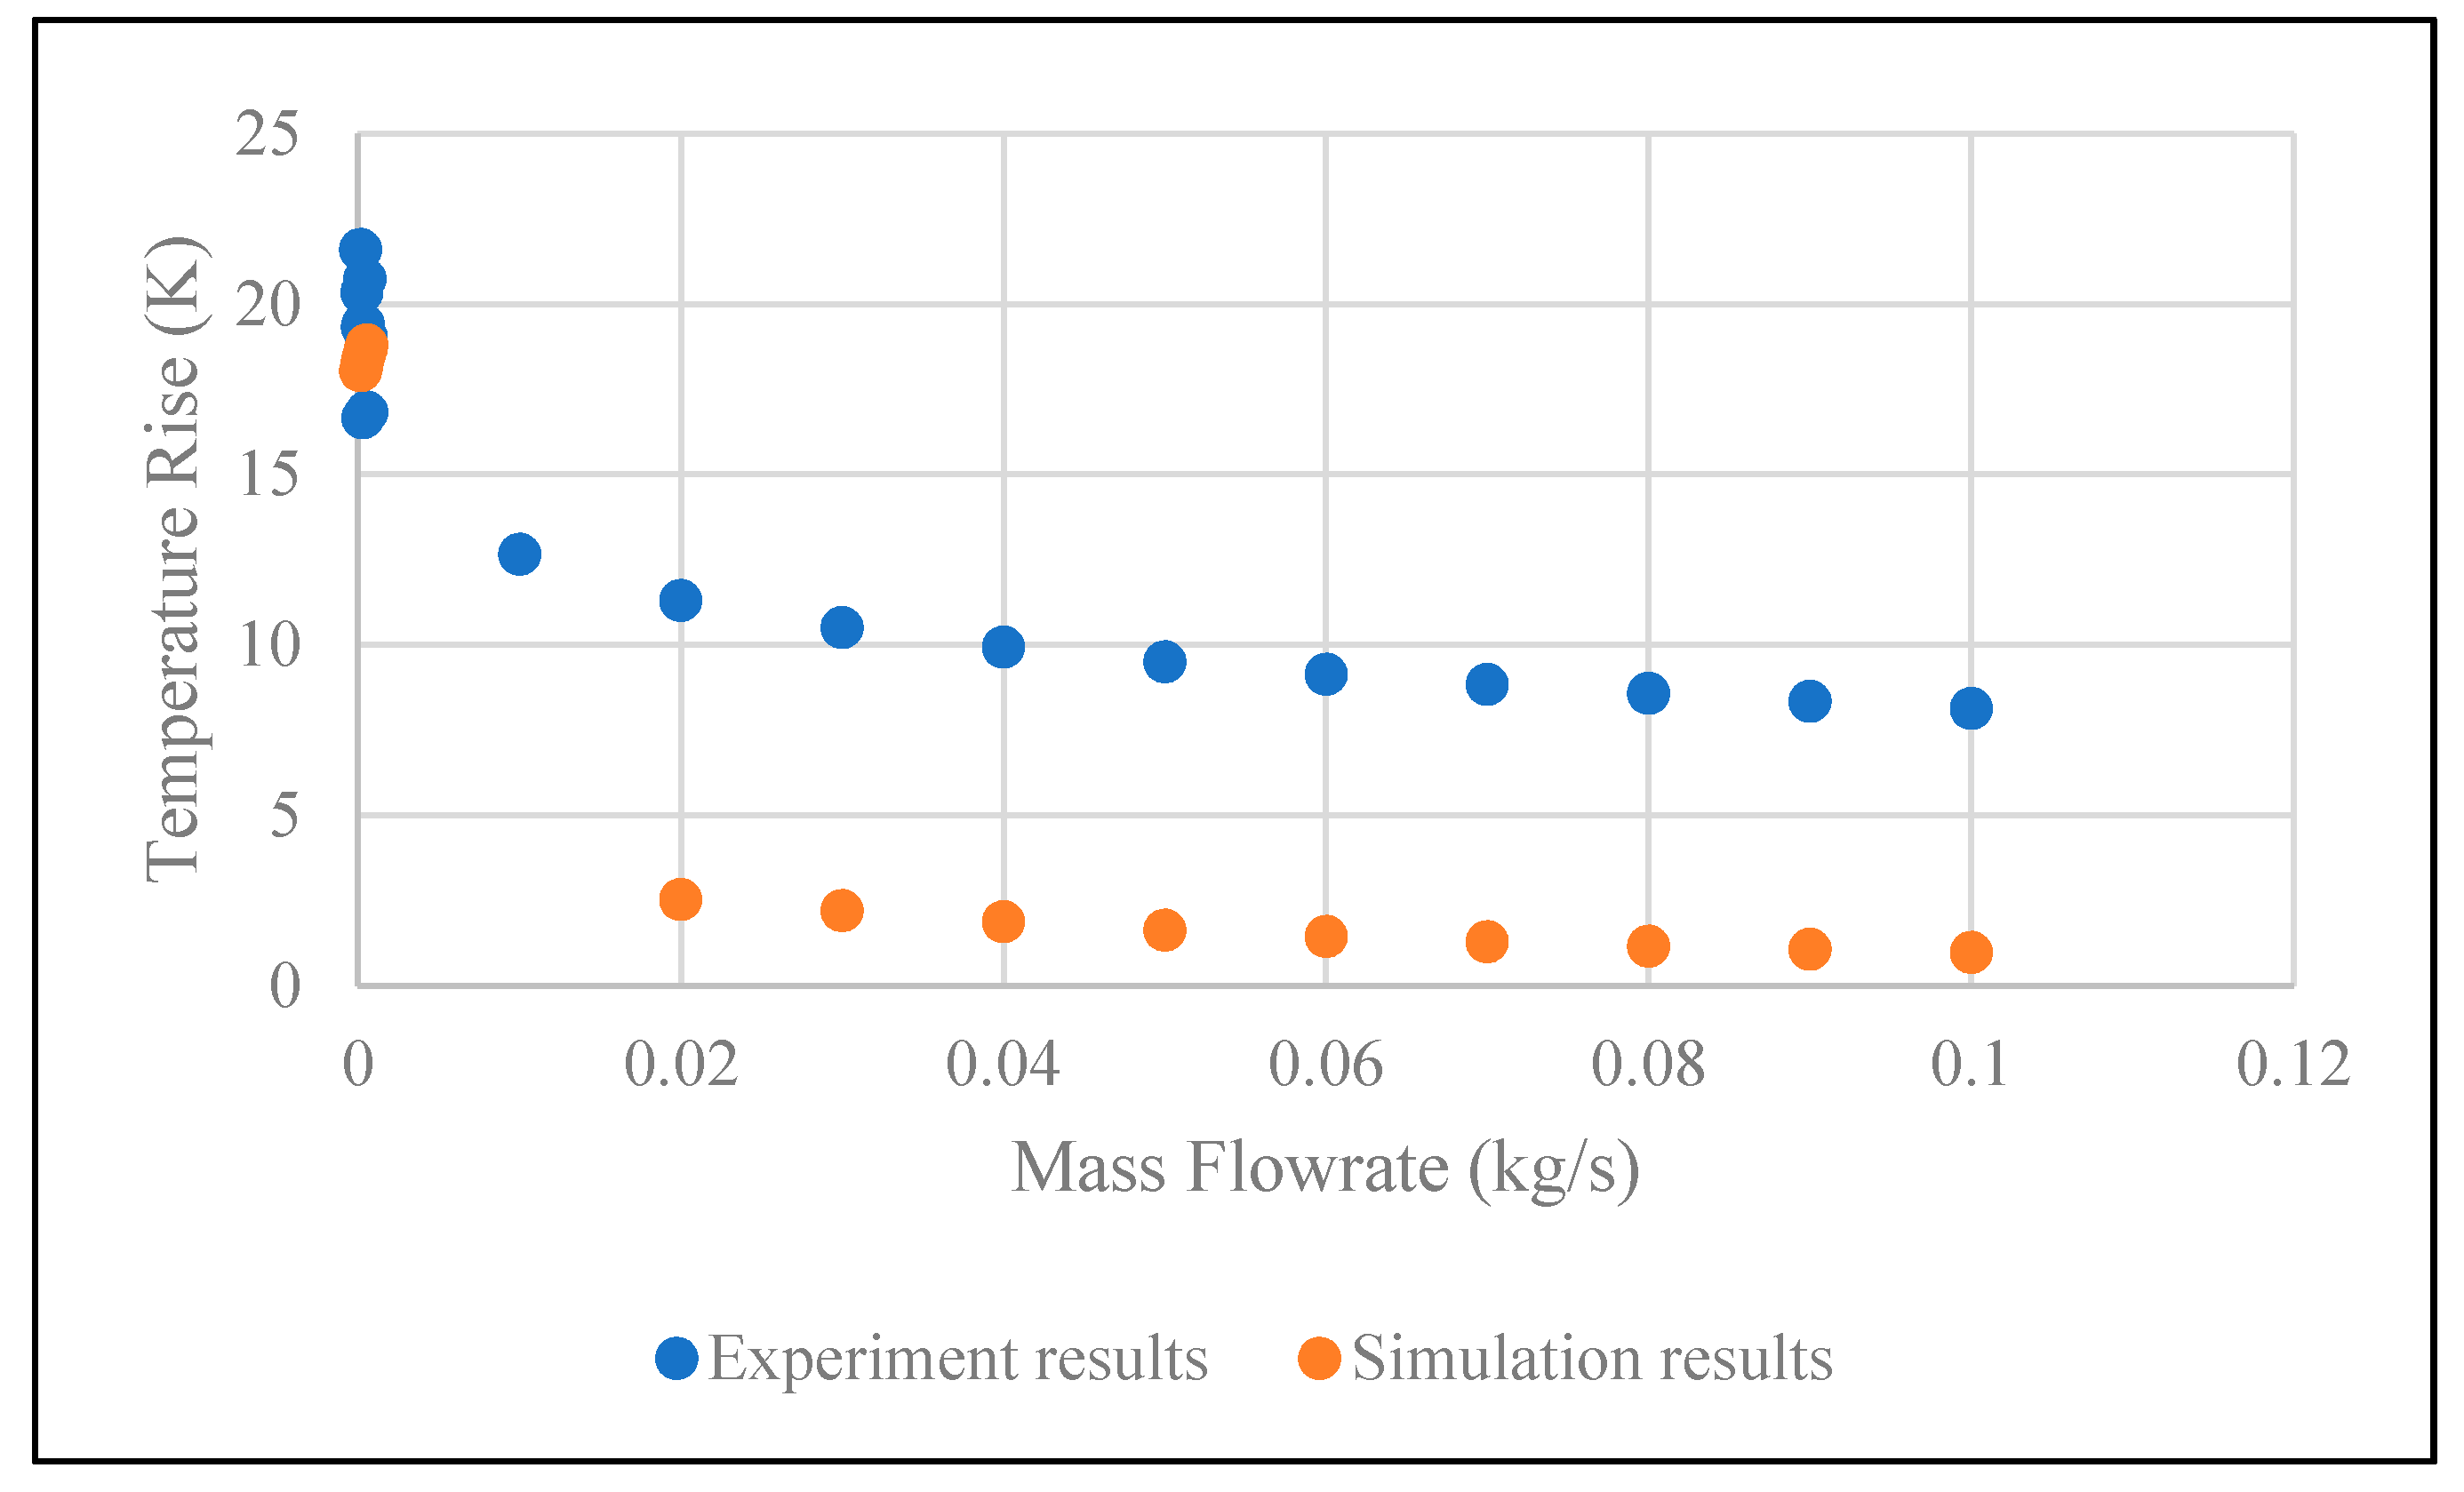
As the mass flow rate is set higher, the PV and outlet temperature drops. This can be seen in the graph of temperature rise (difference between inlet air temperature and outlet air temperature) against the air mass flow rate (Figure 6). The temperature rise decreases with the increase in air mass flow rate since heat was transferred away by the moving air.
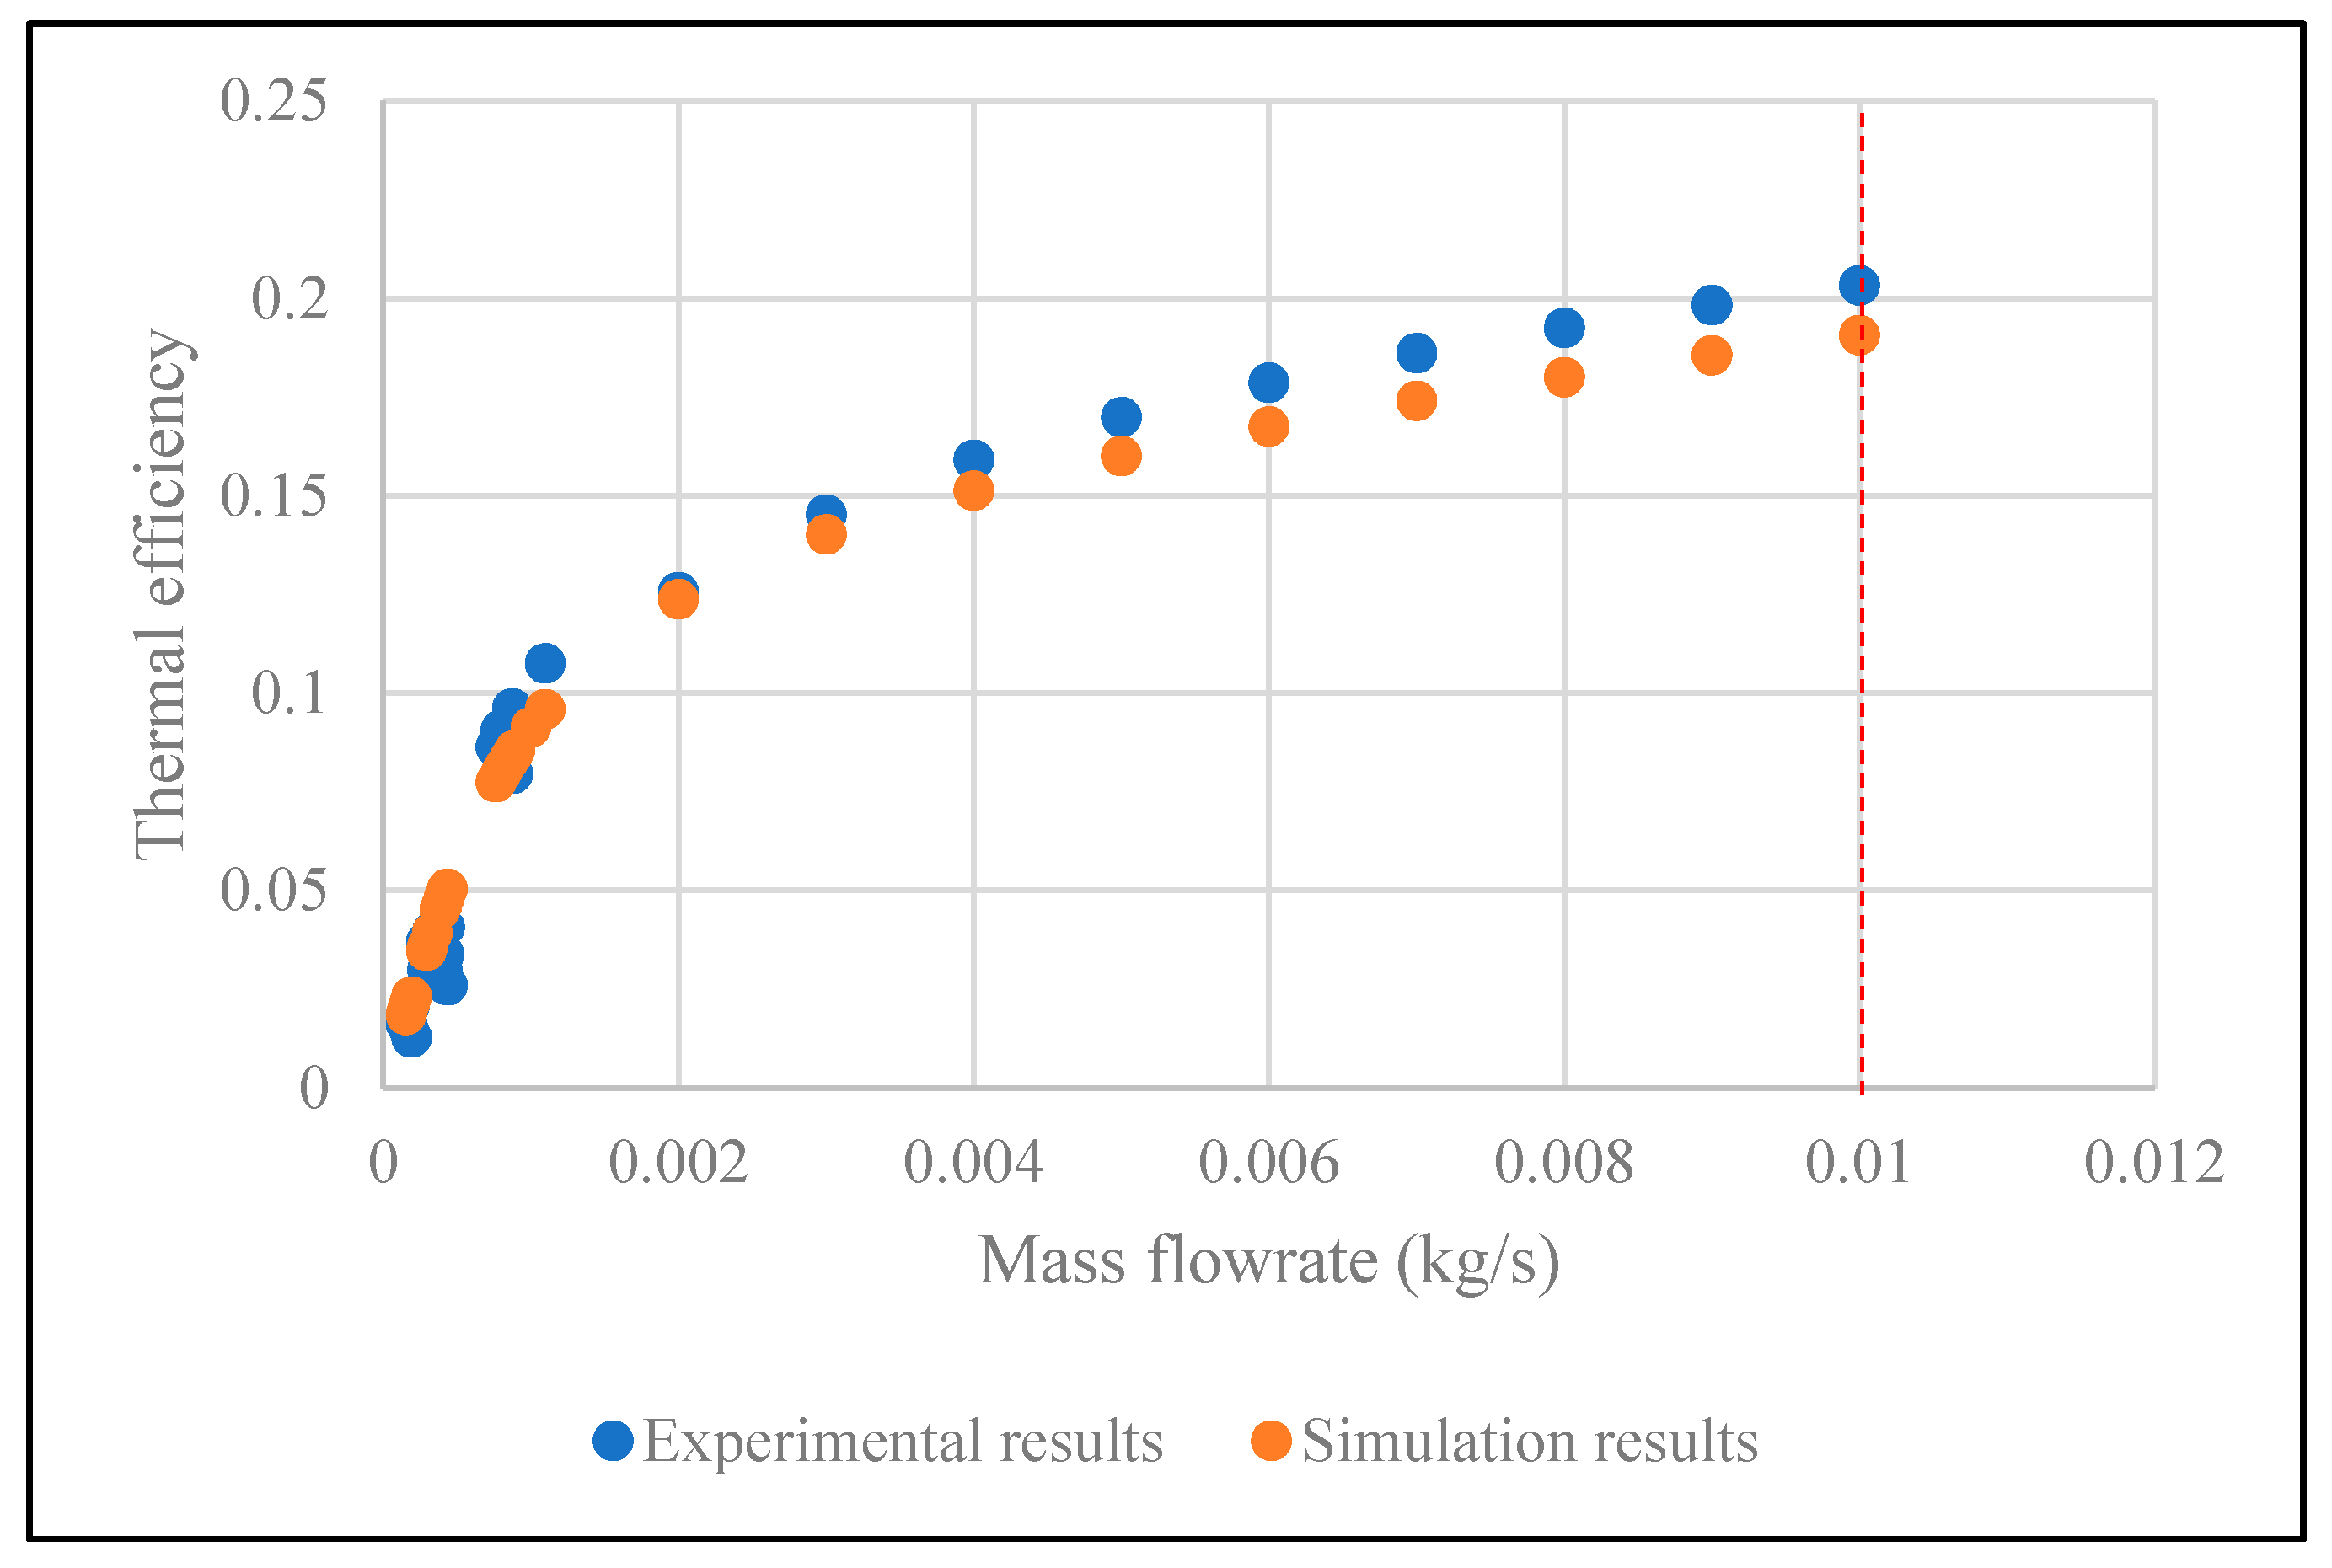
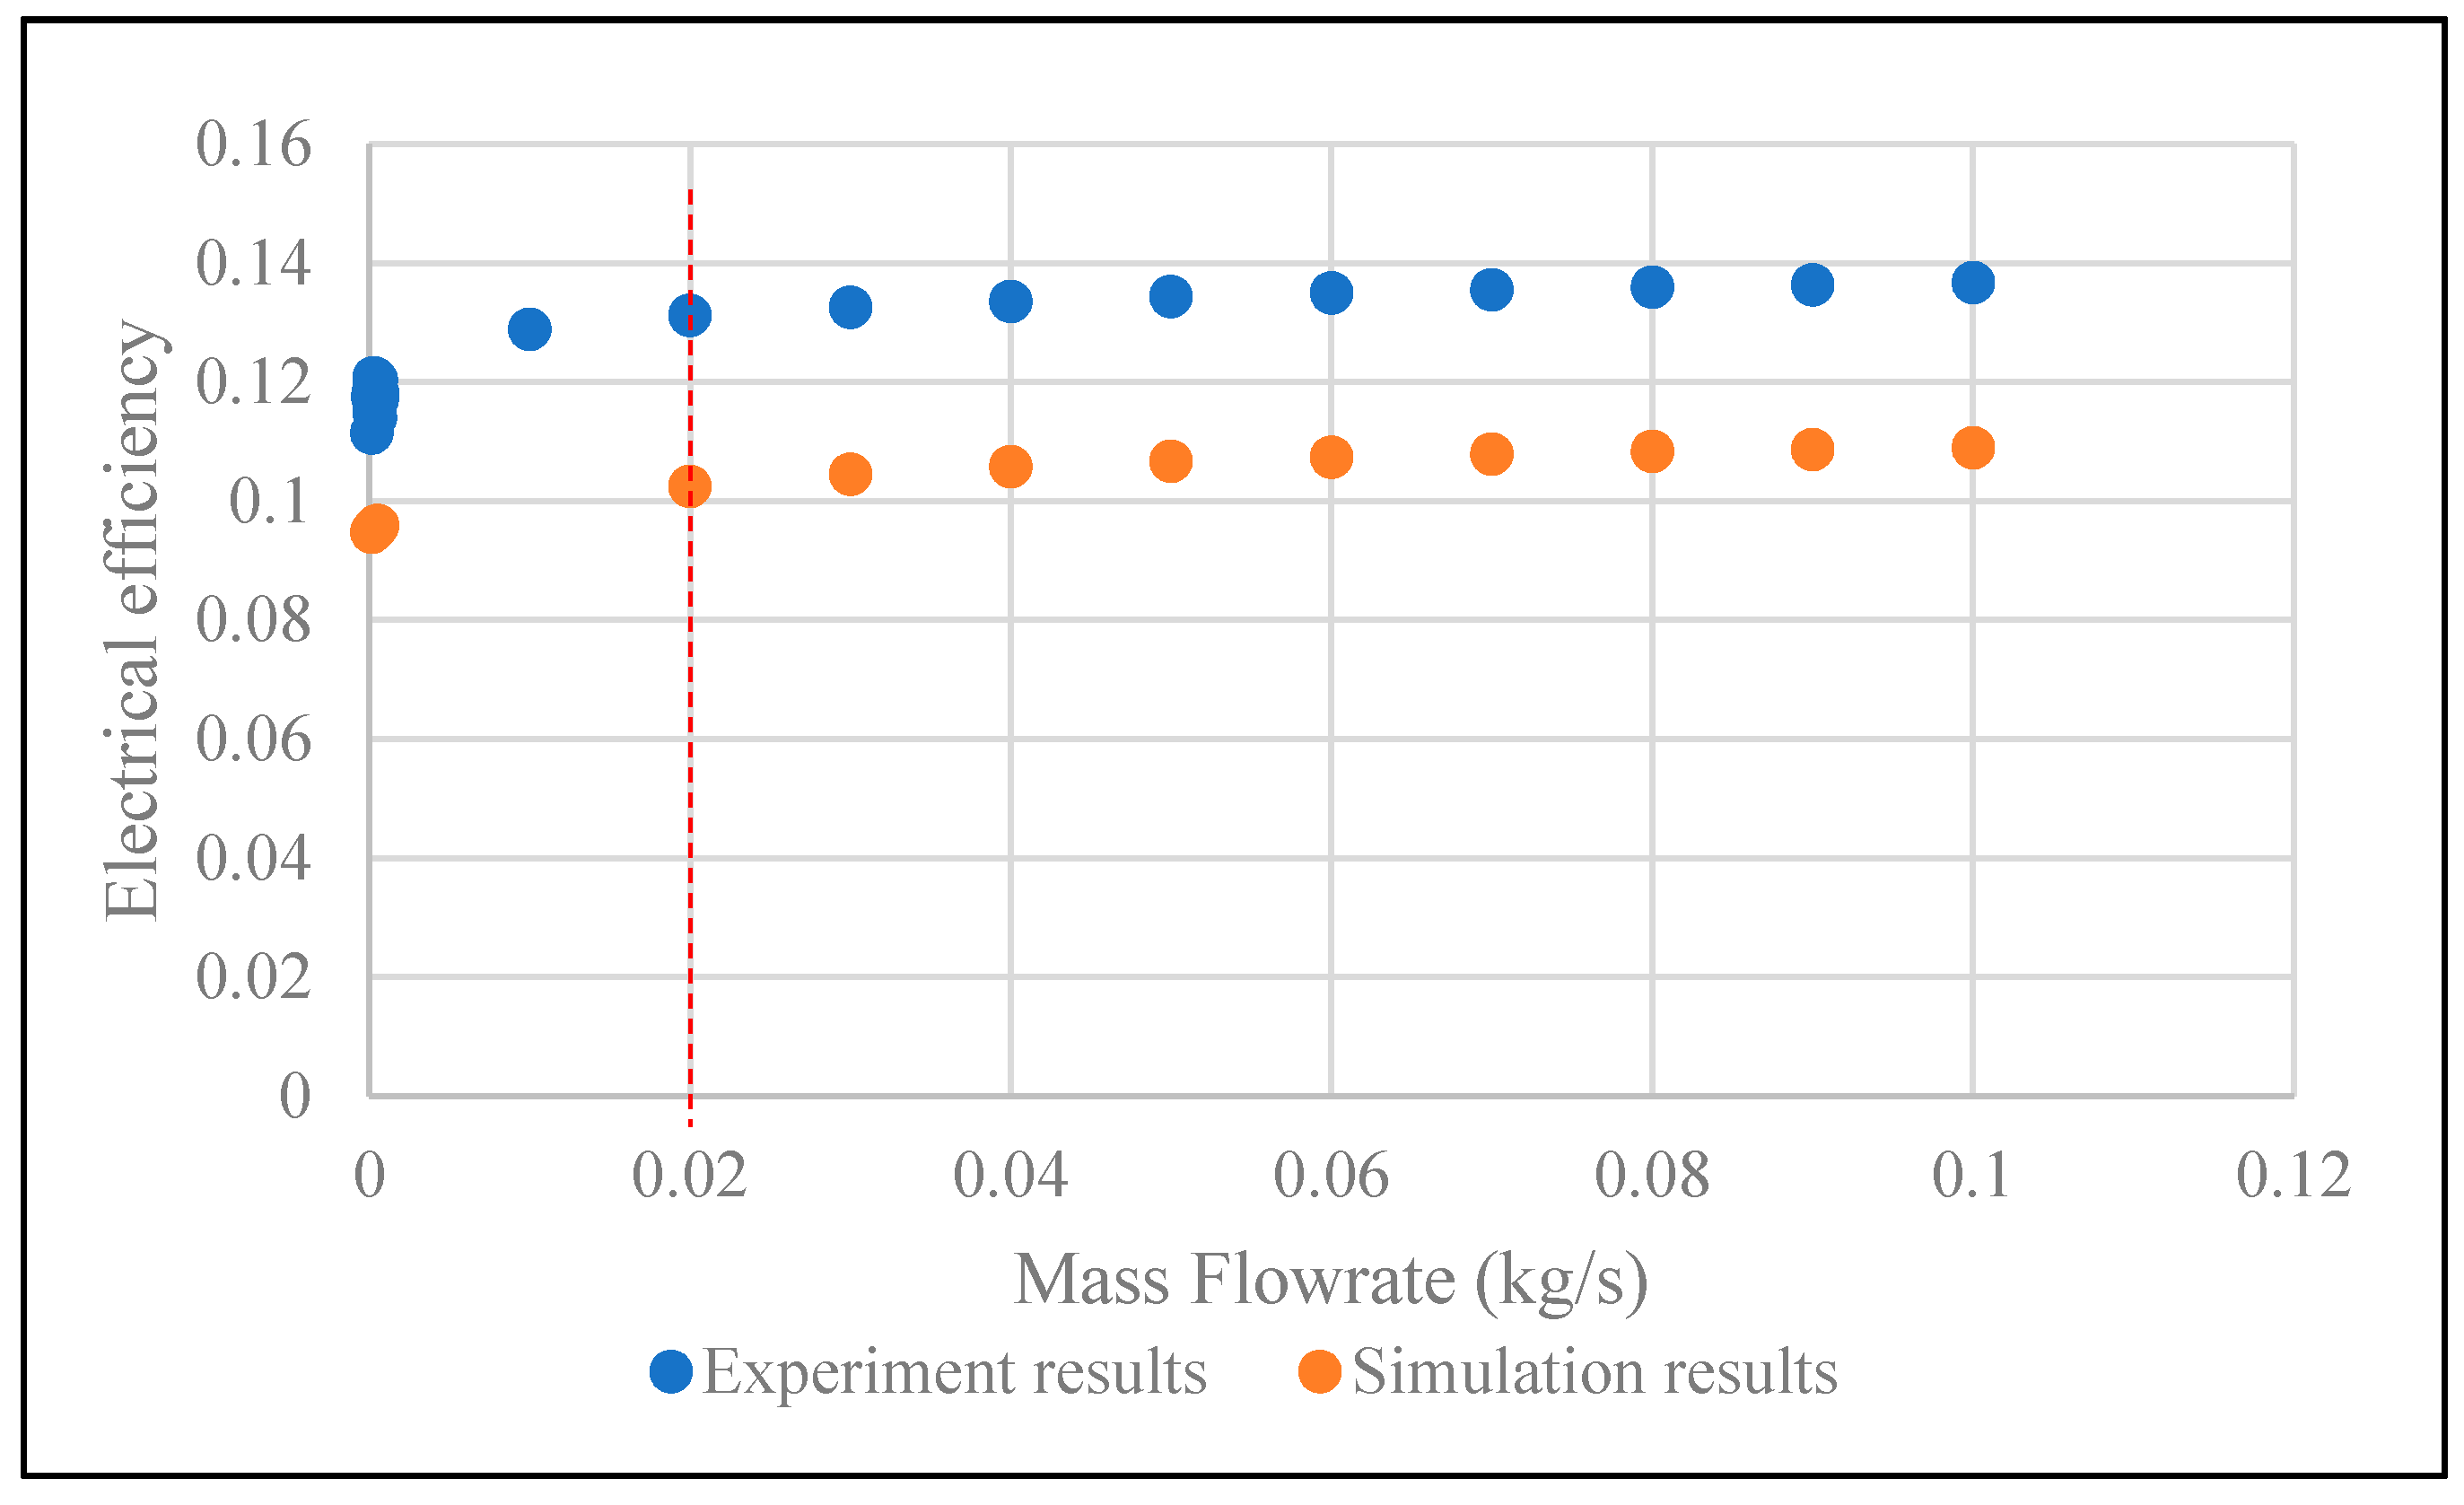
Figure 7 and Figure 8 show the effects of an increase in air mass flow rate on the collector efficiencies; electrically and thermally. At a solar irradiance level of 800 to 900 W/m2, the thermal efficiency increases to 20.32% while electrical efficiency increases to 12.01% when the air mass flow rate increases from 0.00015 kg/s to 0.01 kg/s. It can be concluded that the solar collector system achieved an optimum thermal efficiency when the air mass flow rate approached 0.01 kg/s, while optimum electrical efficiency was achieved at an air mass flow rate of 0.02 kg/s. In connection with Figure 6, it can be seen that when mass flow rate increases, the thermal efficiency increases since the average temperature of the collector drops, until a certain point. The increase in mass flow rate increases the heat transfer coefficient between the air and the air channel; which leads to a decrease in photovoltaic cells. This caused the electrical efficiency to increase, although the increase is comparatively small to the increase in mass flow rate. In spite of that, it is shown in Figure 5 that the electrical efficiency increases with the mass flow rate. In the simulation carried out, the environmental parameters are set such that ambient temperature is at 310 K, solar irradiance at 850 W/m2, and wind speed at 2 m/s. While the high flow rate produced thermal efficiency for the collector, it also increased the unnecessary electricity demand to operate the fans. However, if the air mass flow rate is too low, the collector temperature increases which leads to lower electrical efficiency. Hence, it will only be beneficial if the mass flow rate is kept at an optimum point because the significant increase in efficiencies is only at a low flow rate and approaches a plateau at higher flow rates. While thermal efficiency showed good agreement between simulation and experimental results, the slight difference between the simulated value and actual electrical efficiency is due to the fact that the data are collected under natural Malaysian weather conditions. The uncertainty of weather is a challenge faced during the data collection process since any atmospheric changes could affect the performance of the solar collector. However, due to the chaotic nature of weather to be simulated, the model is highly sensitive to the initial conditions which could lead to a very different realization of the simulated weather [35]. Therefore, since the results obtained in this study are of a similar trend presented in previous studies, it could be said that the simulation and experimental results are in good agreement.
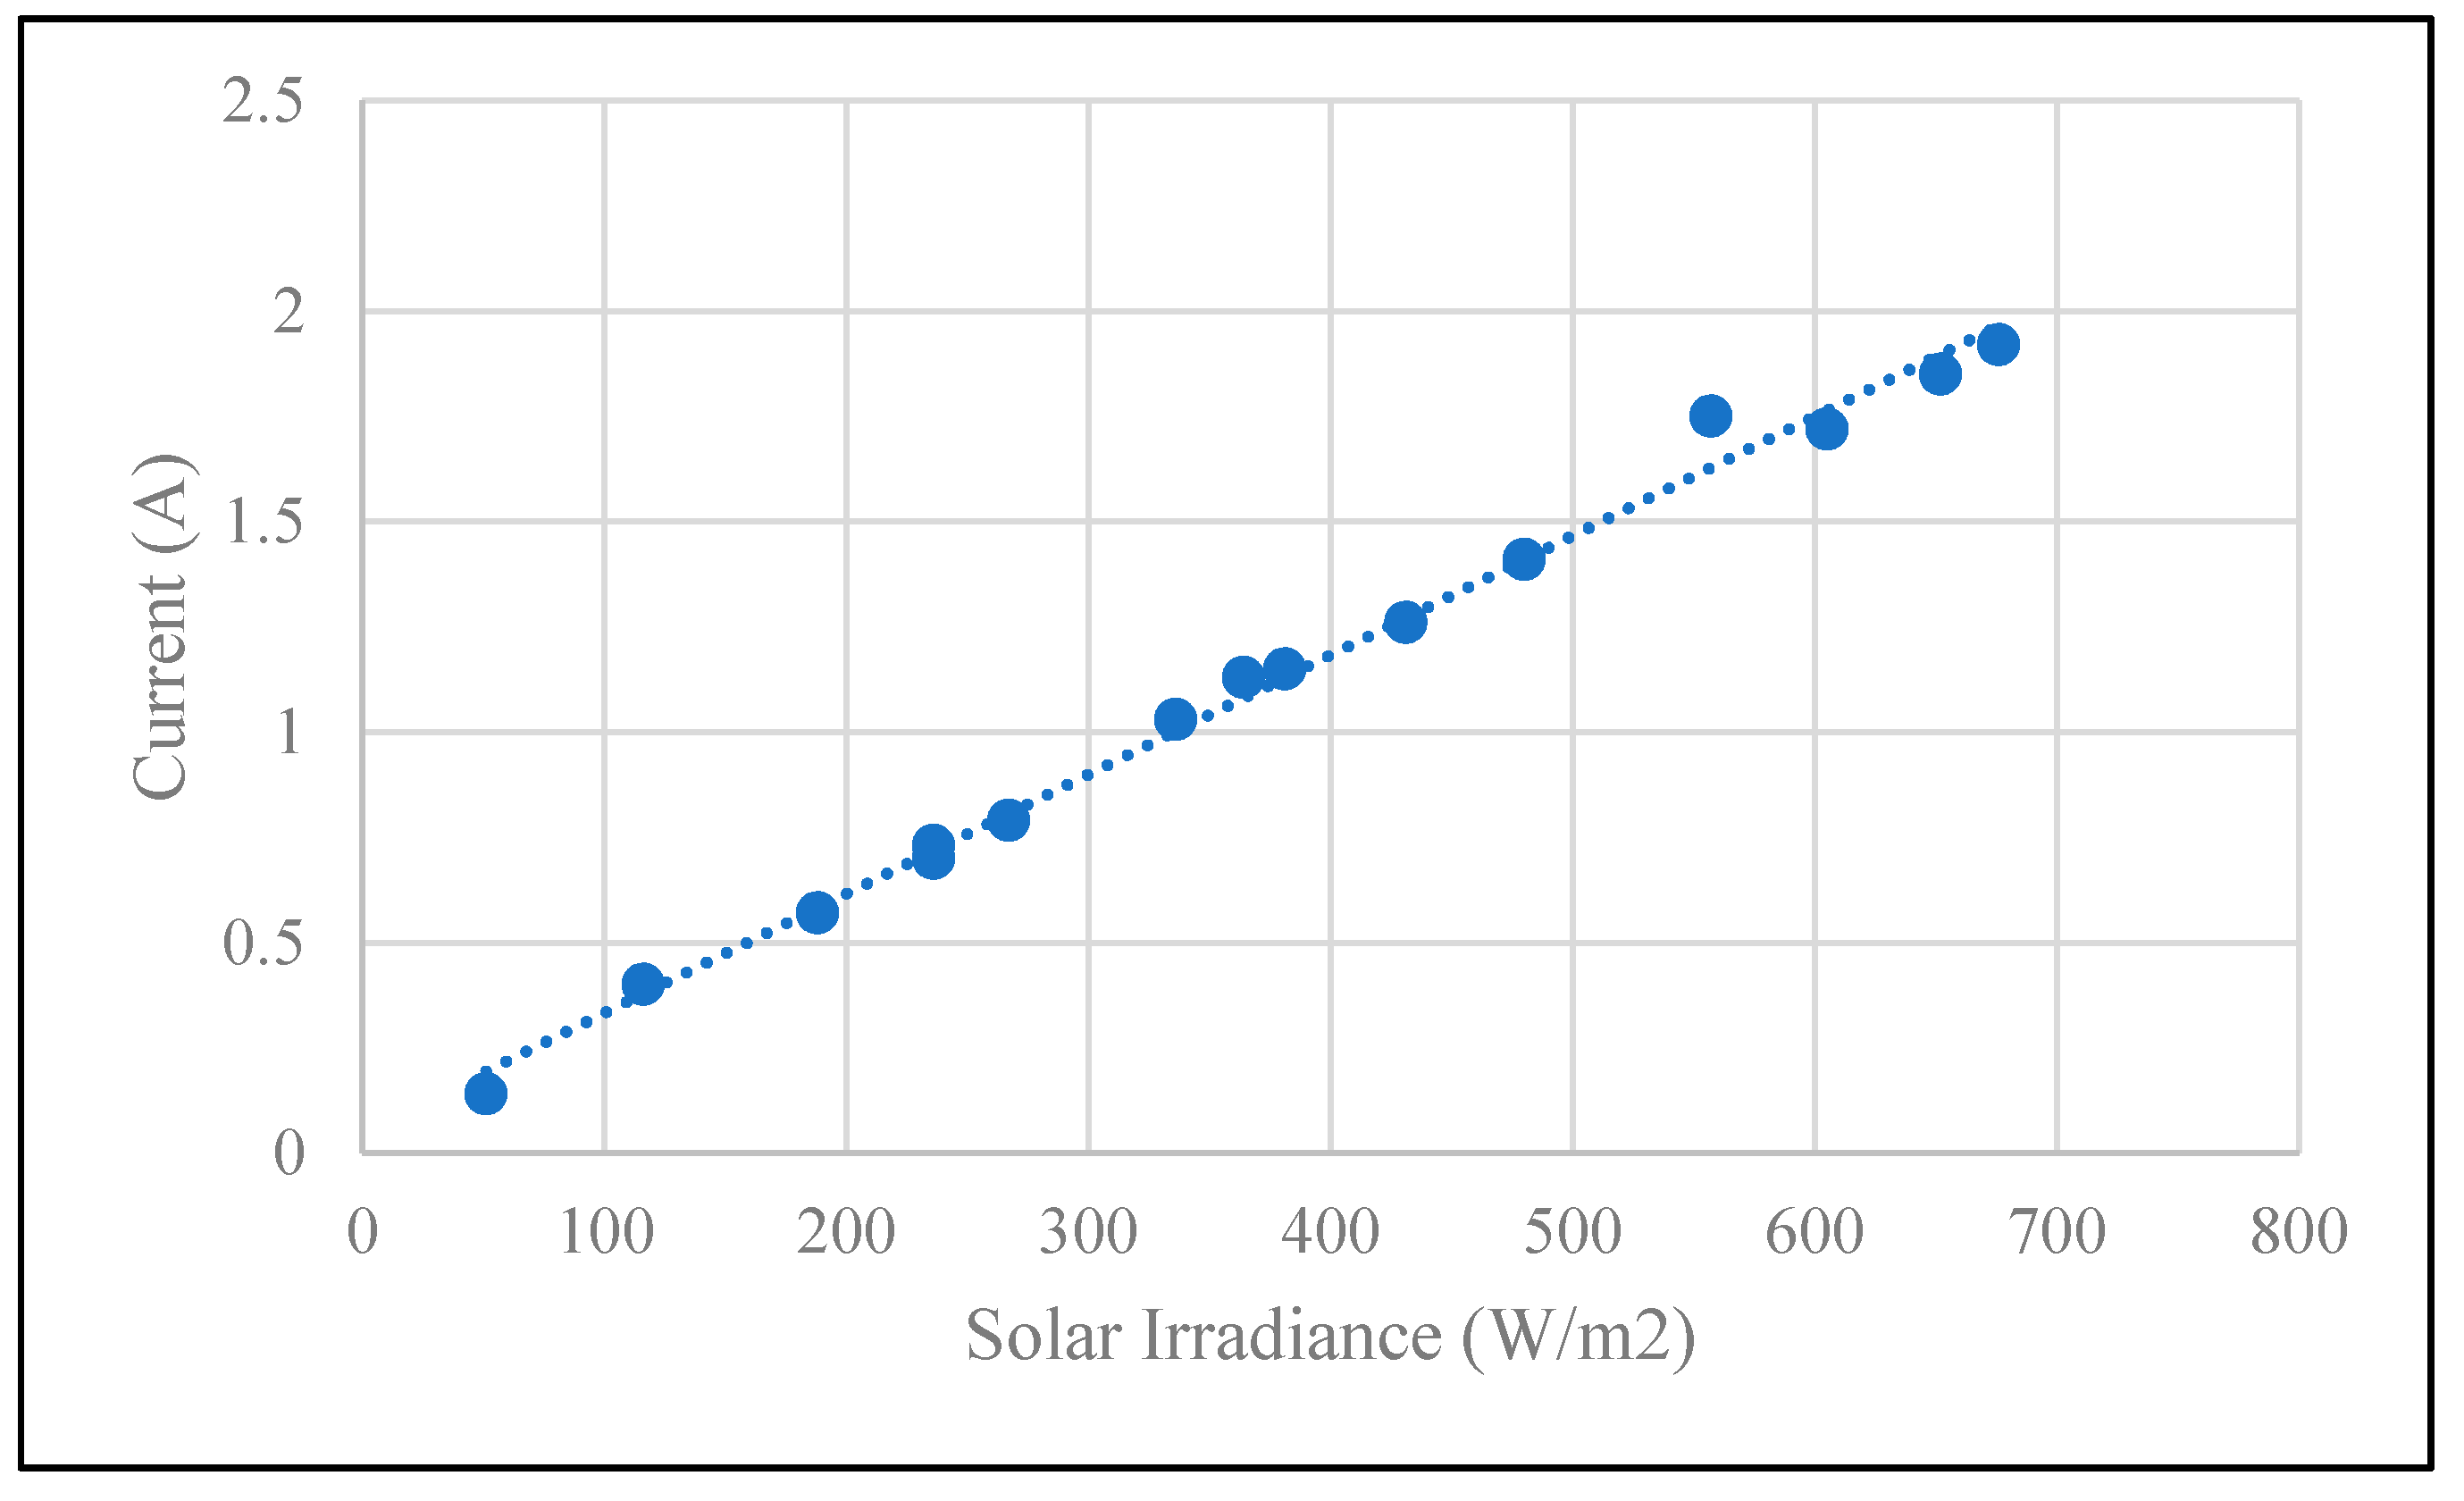
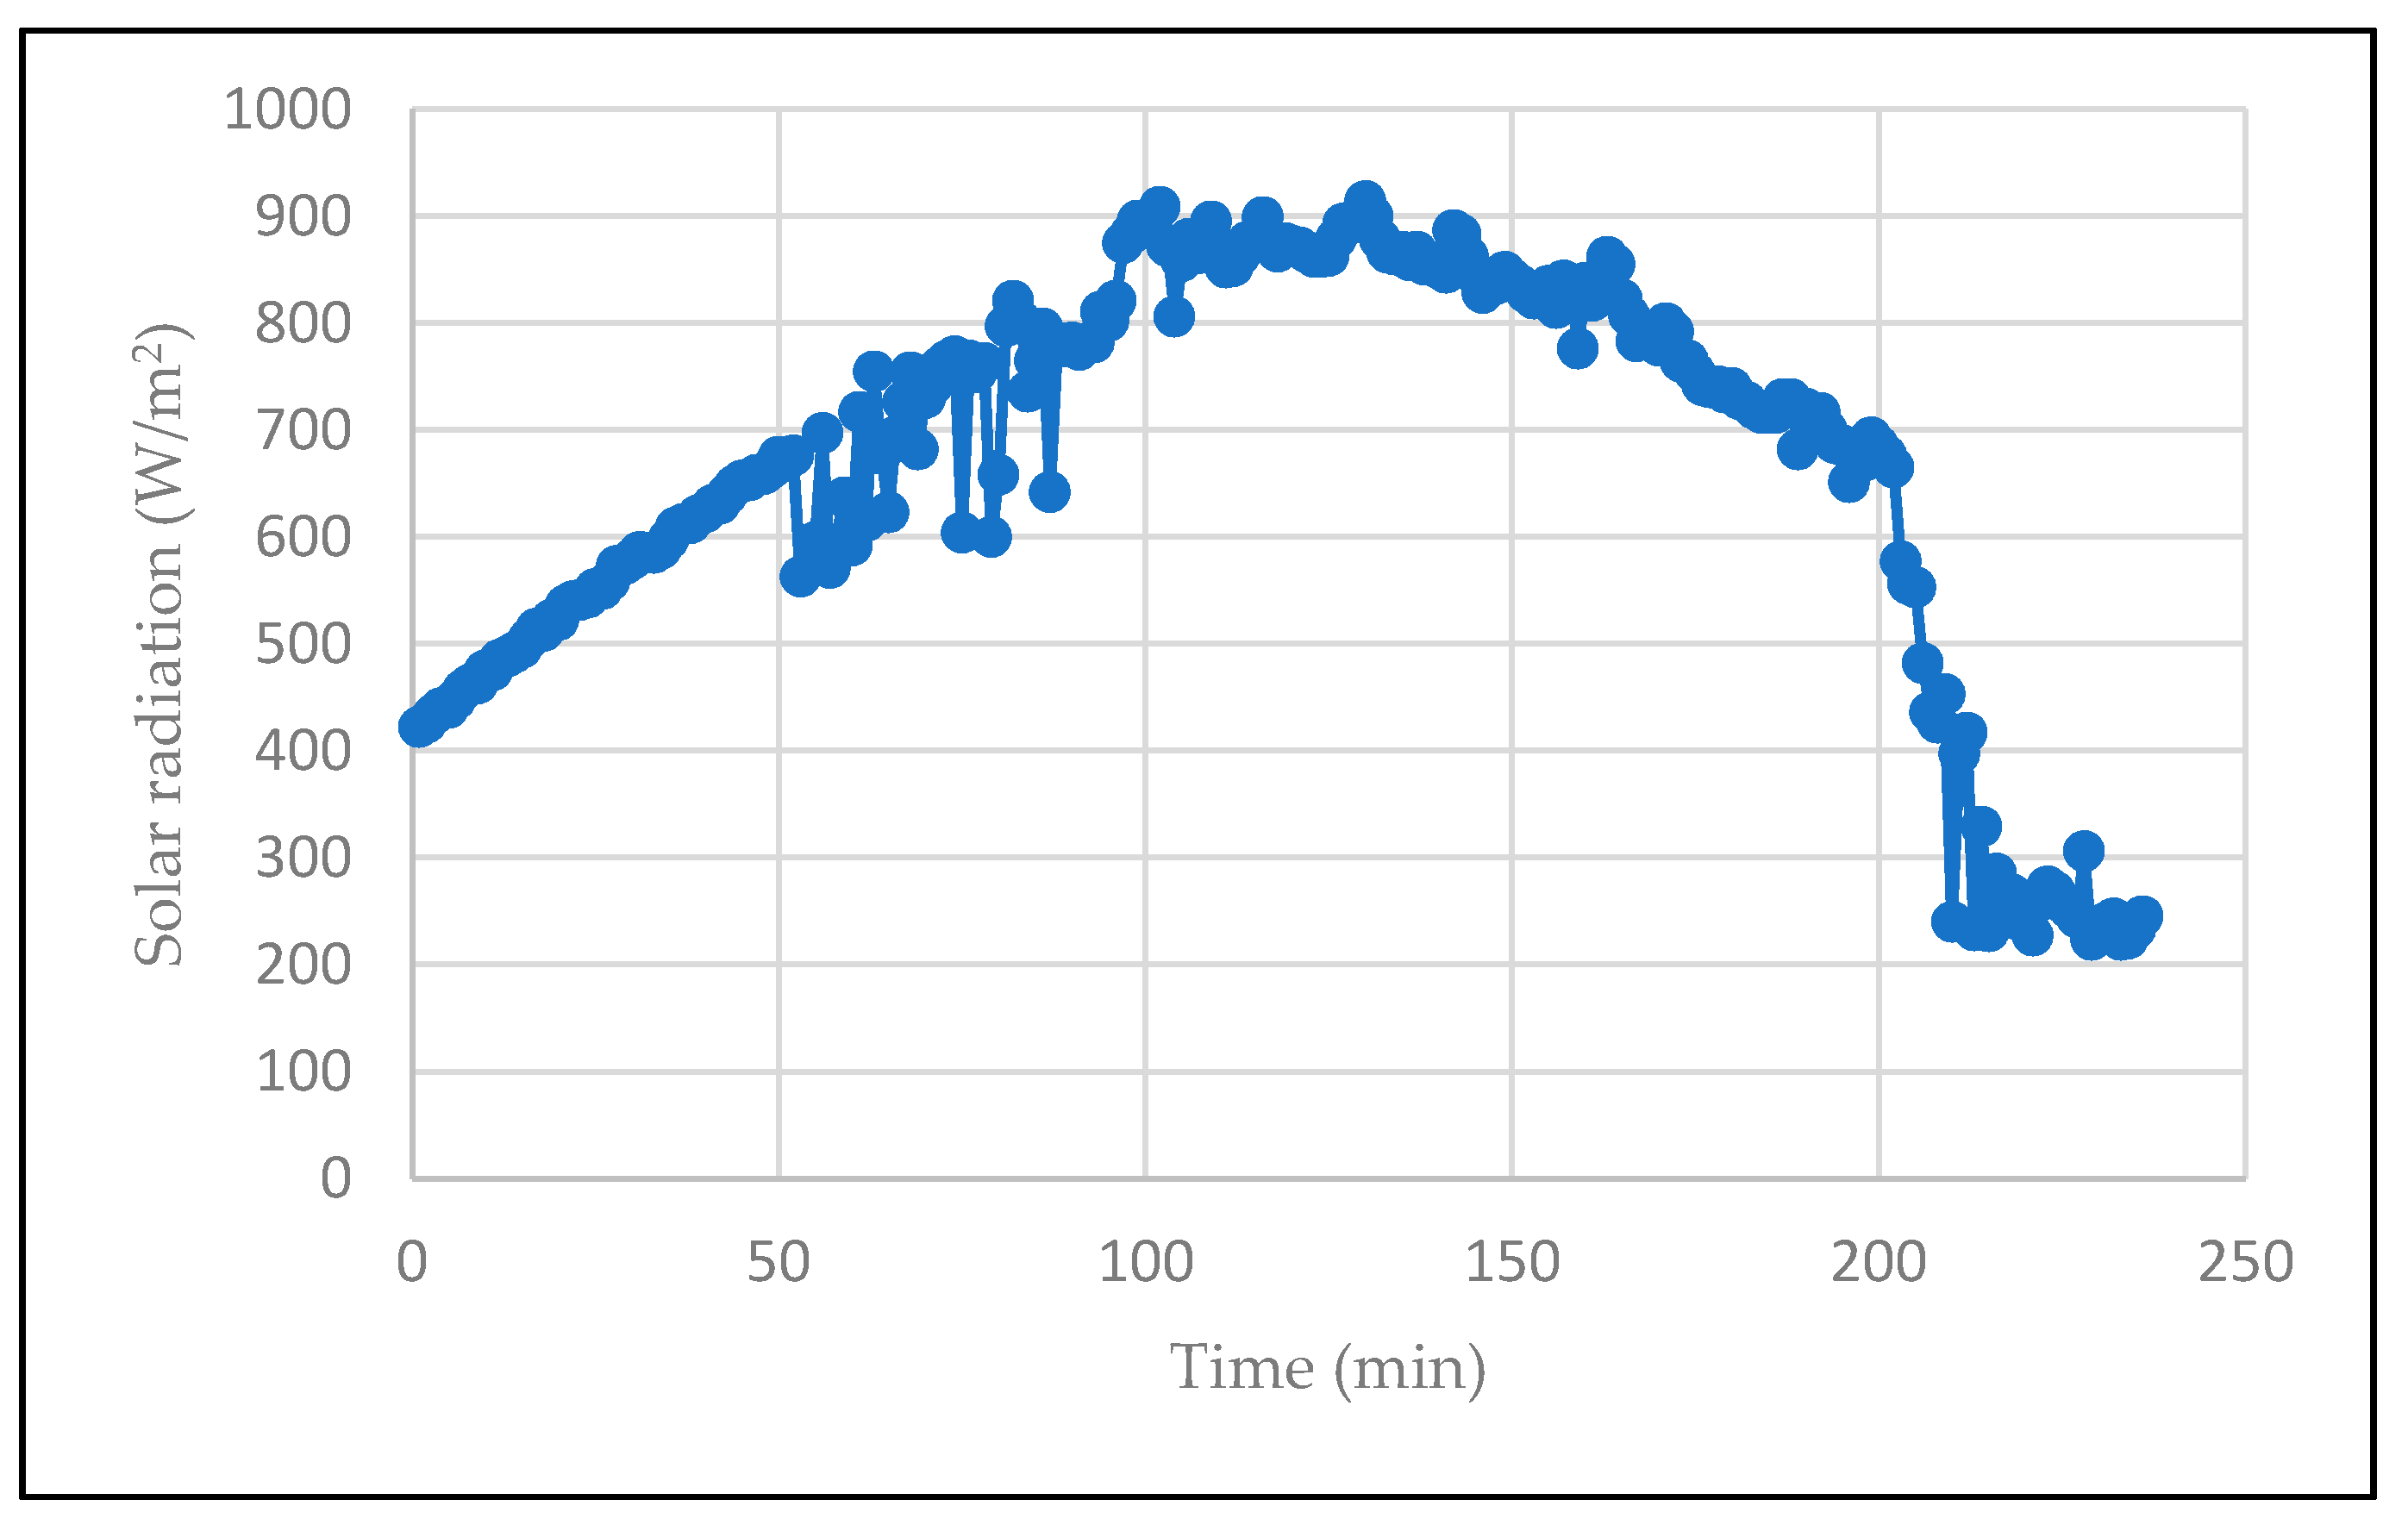
Figure 9 shows the relationship between current production and solar irradiance. Both are directly proportional and it is shown in the figure that the higher the solar radiation, the higher the current produced. In a silicon solar panel, the electron band, , decreases with increasing temperature and it enabled the absorption of additional photons [36]. These additional photons consequently slightly increase the short-circuit current, (photocurrent), produced. The graph in Figure 10 depicts a bell-curved shape which shows the solar radiation reading captured by the pyranometer throughout a day of the experiment carried out. The radiation increases when it approaches noon, and decreases when the sun sets. The ambient temperature that was recorded during the day increases from 30.64 °C in the morning to 38.85 °C during noon and later decreases to 33.53 °C in the evening.
The results of the error analysis performed on the data collected experimentally and theoretically are summarized in Table 2. When the ambient temperature is at 301–304 K, the values of RMSE for the thermal efficiency, when solar irradiance are 100–200 W/m2, 300–400 W/m2 and 500–700 W/m2 are 0.07%, 0.10% and 0.02% respectively. Meanwhile, for electrical efficiency, , when ambient temperature is at 301–304 K, the RMSE values are 0.02%, 0.03% and 0.02%. On average, the values of RMSE for , , , and are 5.99%, 7.74%, 0.07%, 0.02% and 5.38% respectively.
7. Conclusions
A PV/T solar collector integrating a PV module and a single pass air channel with a compact size design is discussed in this paper. As an enhancing factor of the heat transfer, a set of fins parallel to the air flow was attached to the back plate. A set of one-dimensional heat transfer equations representing the collector system was developed by constructing the temperature nodes at various points; on the PV module, back plate, air inlet and air outlet. The developed model was used to simulate the performance of the PV/T solar collector in MATLAB. A focus on comprehensive mathematical modelling and a detailed description of the simulation process was presented to provide a clear understanding of the model developed. From the experiment that was carried out, the following conclusions are made in this study; the developed model portrayed the performance of the solar collector since the results of both simulation and experiment are in good agreement. Hence, the model developed for the solar collector could contribute to the further analysis on the performance of the PV/T solar collector with different configurations, under different parameters.
Author Contributions
All authors contributed for this study. Conceptualization, N.N.W.K., M.O., M.N.A.B. and L.A.; methodology, N.N.W.K., M.O. and M.N.A.B.; validation, M.O., M.N.A.B. and L.A.; formal analysis, N.N.W.K., M.O. and M.N.A.B.; resources, N.N.W.K. and M.N.A.B.; software, N.N.W.K., M.N.A.B.; supervision, M.O., M.N.A.B. and L.A.; writing—original draft preparation, N.N.W.K. and M.O.; writing—review and editing, M.O., M.N.A.B. and L.A.; funding acquisition, M.O. All authors have read and agreed to the published version of the manuscript.
Funding
This research was funded by Yayasan Universiti Teknologi PETRONAS, grant number 0153AA-H27.
Acknowledgments
This research was supported by Universiti Teknologi PETRONAS, Malaysia. The authors would like to convey their gratitude to the reviewers for their significant remarks and suggestion for this paper.
Conflicts of Interest
The authors declare no conflict of interest.
Nomenclature
| total exposed surface area (m2) | back plate | ||
| solar collector surface area (m2) | convection | ||
| specific heat capacity of fluid (J/(kg K)) | fluid | ||
| heat transfer coefficient | PV panel tempered glass | ||
| air mass flow rate (kg/s) | input | ||
| temperature (K) | output | ||
| overall heat loss coefficient (W/(m K2)) | PV | ||
| fluid viscosity | radiative | ||
| fin thickness (m) | sky | ||
| wind | |||
| Greek Letters | |||
| efficiency | Abbreviations | ||
| electrical | |||
| Subscripts | packing factor | ||
| ambient | thermal |
References
- Othman, M.Y.H.; Yatim, B.; Sopian, K.; Abu Bakar, M.N. Performance analysis of a double-pass photovoltaic/thermal (PV/T) solar collector with CPC and fins. Renew. Energy 2005, 30, 716–722. [Google Scholar] [CrossRef]
- Kumar, A.; Baredar, P.; Qureshi, U. Historical and recent development of photovoltaic thermal (PVT) technologies. Renew. Sustain. Energy Rev. 2015, 42, 1428–1436. [Google Scholar] [CrossRef]
- Chow, T.T.; Pei, G.; Fong, K.F.; Lin, Z.; Chan, A.L.S.; Ji, J. Energy and exergy analysis of photovoltaic–thermal collector with and without glass cover. Appl. Energy 2009, 86, 310–316. [Google Scholar] [CrossRef]
- Lee, J.H.; Hwang, S.G.; Lee, G.H. Efficiency Improvement of a Photovoltaic Thermal (PVT) System Using Nanofluids. Energies 2019, 12, 3063. [Google Scholar] [CrossRef] [Green Version]
- Abu Bakar, M.N.; Othman, M.; Din, M.H.; Manaf, N.A.; Jarimi, H. Design concept and mathematical model of a bi-fluid photovoltaic/thermal (PV/T) solar collector. Renew. Energy 2014, 67, 153–164. [Google Scholar] [CrossRef]
- Al-Khazzar, A.A.A. Behavior of Four Solar PV Modules with Temperature Variation. Int. J. Renew. Energy Res. 2016, 6, 1091–1099. [Google Scholar]
- Othman, M.Y.; Hamid, S.A.; Tabook, M.A.S.; Sopian, K.; Roslan, M.H.; Ibarahim, Z. Performance analysis of PV/T Combi with water and air heating system: An experimental study. Renew. Energy 2016, 86, 716–722. [Google Scholar] [CrossRef]
- Zhou, C.; Liang, R.; Zhang, J. Optimization design method and experimental validation of a solar PVT cogeneration system based on building energy demand. Energies 2017, 10, 1281. [Google Scholar] [CrossRef] [Green Version]
- Diwania, S.; Agrawal, S.; Siddiqui, A.S.; Singh, S. Photovoltaic–thermal (PV/T) technology: A comprehensive review on applications and its advancement. Int. J. Energy Eviron. Eng. 2020, 11, 33–54. [Google Scholar] [CrossRef] [Green Version]
- Wolf, M. Performance analyses of combined heating and photovoltaic power systems for residences. Energy Convers. 1976, 16, 79–90. [Google Scholar] [CrossRef]
- Florschuetz, L.W. Extension of the Hottel-Whillier model to the analysis of combined photovoltaic/thermal flat plate collectors. Sol. Energy 1979, 22, 361–366. [Google Scholar] [CrossRef]
- Hazami, M.; Riahi, A.; Mehdaoui, F.; Nouicer, O.; Farhat, A. Energetic and exergetic performances analysis of a PV/T (photovoltaic thermal) solar system tested and simulated under to Tunisian (North Africa) climatic conditions. Energy 2016, 107, 78–94. [Google Scholar] [CrossRef]
- Hegazy, A.A. Comparative study of the performances of four photovoltaic/thermal solar air collectors. Energy Convers. Manag. 2000, 41, 861–881. [Google Scholar] [CrossRef]
- Saygin, H.; Nowzari, R.; Mirzaei, N.; Aldabbagh, L.B.Y. Performance evaluation of a modified PV/T solar collector: A case study in design and analysis of experiment. Sol. Energy 2017, 141, 210–221. [Google Scholar] [CrossRef]
- Kumar, R.; Rosen, M.A. Performance evaluation of a double pass PV/T solar air heater with and without fins. Appl. Therm. Eng. 2011, 31, 1402–1410. [Google Scholar] [CrossRef]
- Dubey, S.; Sandhu, G.S.; Tiwari, G.N. Analytical expression for electrical efficiency of PV/T hybrid air collector. Appl. Energy 2009, 86, 697–705. [Google Scholar] [CrossRef]
- Kiran, S.; Devadiga, U. Performance analysis of hybrid PV/Thermal systems. Int. J. Emerg. Technol. Adv. Eng. 2014, 4, 80–86. [Google Scholar]
- Azad, E. Experimental analysis of thermal performance of solar collectors with different numbers of heat pipes versus a flow-through solar collector. Renew. Sustain. Energy Rev. 2018, 82, 4320–4325. [Google Scholar] [CrossRef]
- Michael, J.J.; Selvarasan, I.; Goic, R. Fabrication, experimental study and testing of a novel photovoltaic module for photovoltaic thermal applications. Renew. Energy 2016, 90, 95–104. [Google Scholar] [CrossRef]
- Mustafa, R.J.; Gomaa, M.R.; Al-Dhaifallah, M. Environmental impacts on the performance of solar photovoltaic systems. Sustainability 2020, 12, 608. [Google Scholar] [CrossRef] [Green Version]
- Vergura, S. A statistical tool to detect and locate abnormal operating conditions in photovoltaic systems. Sustainability 2018, 10, 608. [Google Scholar] [CrossRef] [Green Version]
- Sathyamurthy, R.; El-Agouz, S.A.; Nagarajan, P.K.; Subramani, J.; Arunkumar, T.; Mageshbabu, D.; Prakash, N. A review of integrating solar collectors to solar still. Renew. Sustain. Energy Rev. 2017, 77, 1069–1097. [Google Scholar] [CrossRef]
- Zondag, H.A.; De Vries, D.W.; Van Helden, W.G.J.; Van Zolingen, R.J.C.; Van Steenhoven, A.A. The yield of different combined PV-thermal collector designs. Sol. Energy 2003, 74, 253–269. [Google Scholar] [CrossRef]
- Tiwari, A.; Sodha, M.S. Parametric study of various configurations of hybrid PV/thermal air collector: Experimental validation of theoretical model. Sol. Energy Mater. Sol. Cells 2007, 91, 17–28. [Google Scholar] [CrossRef]
- Sarhaddi, F.; Farahat, S.; Ajam, H.; Behzadmehr, A.M.I.N.; Adeli, M.M. An improved thermal and electrical model for a solar photovoltaic thermal (PV/T) air collector. Appl. Energy 2010, 87, 2328–2339. [Google Scholar] [CrossRef]
- Chabane, F.; Moummi, N.; Benramache, S.; Bensahal, D.; Belahssen, O. Collector efficiency by single pass of solar air heaters with and without using fins. Eng. J. 2013, 17, 43–55. [Google Scholar] [CrossRef] [Green Version]
- Jarimi, H.; Abu Bakar, M.N.; Othman, M.; Din, M.H. Bi-fluid photovoltaic/thermal (PV/T) solar collector: Experimental validation of a 2-D theoretical model. Renew. Energy 2016, 85, 1052–1067. [Google Scholar] [CrossRef]
- Othman, M.Y.; Yatim, B.; Sopian, K.; Abu Bakar, M.N. Performance studies on a finned double-pass photovoltaic-thermal (PV/T) solar collector. Desalination 2007, 209, 43–49. [Google Scholar] [CrossRef]
- Nowak, H. The sky temperature in net radiant heat loss calculations from low-sloped roofs. Infrared Phys. 1989, 29, 231–232. [Google Scholar] [CrossRef]
- Biwole, P.H.; Woloszyn, M.; Pompeo, C. Heat transfers in a double-skin roof ventilated by natural convection in summer time. Energy Build. 2008, 40, 1487–1497. [Google Scholar] [CrossRef] [Green Version]
- Duffie, J.A.; Beckman, W.A.; Blair, N. Solar Engineering of Thermal Processes, Photovoltaics and Wind; John Wiley & Sons: Hoboken, NJ, USA, 2020. [Google Scholar]
- Bejan, A.; Kraus, A.D. Heat Transfer Handbook; John Wiley & Sons: Hoboken, NJ, USA, 2003; Volume 1. [Google Scholar]
- Tan, H.M.; Charters, W.W.S. An experimental investigation of forced-convective heat transfer for fully-developed turbulent flow in a rectangular duct with asymmetric heating. Sol. Energy 1970, 13, 121–125. [Google Scholar] [CrossRef]
- Michael, J.J.; Iniyan, S.; Goic, R. Flat plate solar photovoltaic–thermal (PV/T) systems: A reference guide. Renew. Sustain. Energy Rev. 2015, 51, 62–88. [Google Scholar] [CrossRef]
- Gelfand, A.E.; Fuentes, M.; Hoeting, J.A.; Smith, R.L. Handbook of Environmental and Ecological Statistics; CRC Press: Boca Raton, FL, USA, 2017. [Google Scholar]
- Radziemska, E.; Klugmann, E. Thermally affected parameters of the current–voltage characteristics of silicon photocell. Energy Convers. Manag. 2002, 43, 1889–1900. [Google Scholar] [CrossRef]
Figure 1.
Exploded view of the photovoltaic/thermal (PV/T) solar collector.

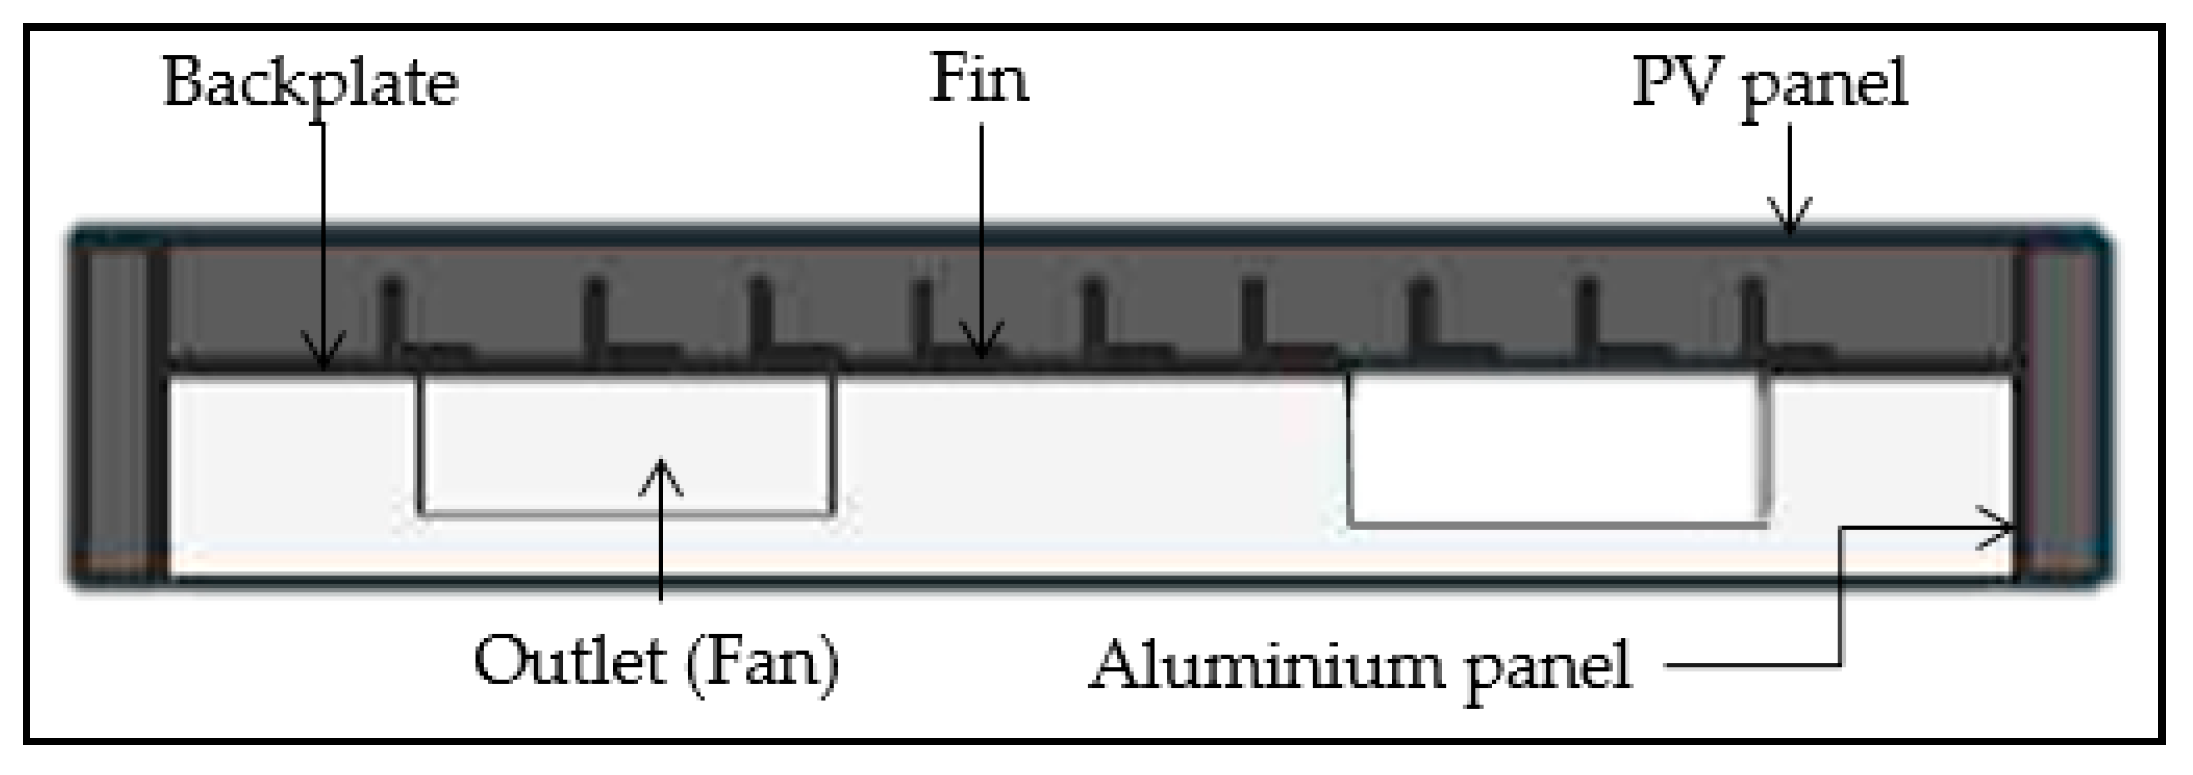
Figure 2.
Cross sectional view of the PV/T solar collector.

Figure 3.
The thermal schematic model of a finned single pass PV/T air solar collector.

Figure 4.
Flowchart for the MATLAB algorithm.

Figure 5.
Experiment set-up for data collection of the PV/T solar collector.

Figure 6.
Comparison between the theoretical and experimental results on the effect of air mass flow rate to the temperature at = 800–900 Wm−2 and = 310 K.
Figure 6.
Comparison between the theoretical and experimental results on the effect of air mass flow rate to the temperature at = 800–900 Wm−2 and = 310 K.

Figure 7.
Comparison between the theoretical and experimental results on the effect of air mass flow rate to the thermal efficiency at = 800–900 Wm−2 and = 307.5 K.
Figure 7.
Comparison between the theoretical and experimental results on the effect of air mass flow rate to the thermal efficiency at = 800–900 Wm−2 and = 307.5 K.

Figure 8.
Comparison between the theoretical and experimental results on the effect of air mass flow rate to the electrical efficiency at = 800–900 Wm−2 and = 310 K.
Figure 8.
Comparison between the theoretical and experimental results on the effect of air mass flow rate to the electrical efficiency at = 800–900 Wm−2 and = 310 K.

Figure 9.
Direct relationship between current produced by the PV panel and the solar irradiance.

Figure 10.
Reading of solar irradiance throughout a day (6 November 2019) during experiment.


Table 1.
Values of coefficients and ambient conditions used in the simulations.
| Parameter | Value | Parameter | Value | ||
|---|---|---|---|---|---|
| Width of collector | 0.54 | Height of fin | 0.01905 | ||
| Length of collector | 0.69 | Width of fin | 0.001 | ||
| Depth of collector | 0.02 | Distance between fins | 0.05 | ||
| Absorptivity of PV | 0.938 | Number of fins | 9 | ||
| Absorptivity of absorber plate | 0.951 | Ambient temperature (K) | 303 | ||
| Absorptivity of glass | 0.06 | Wind speed | 2.0 | ||
| Emissivity of PV | 0.8 | Irradiance | 800 | ||
| Emissivity of glass | 0.94 | The solar cell temperature at reference condition | 298 | ||
| Emissivity of back plate | 0.96 | PV panel power temperature coefficient | 0.005444 | ||
| Electrical conductivity | 5.67 × 10⁻⁸ | Electrical efficiency at the reference temperature | 0.14 | ||
Table 2.
Values of coefficients and ambient conditions used in the simulations.
| Ambient Temp. (K) | Solar Irradiance (W/m2) | Root Mean Square Error (RMSE) (%) | ||||
|---|---|---|---|---|---|---|
| 301–304 | 100–200 | 5.22 | 1.56 | 0.07 | 0.02 | 5.46 |
| 300–400 | 5.31 | 4.00 | 0.10 | 0.03 | 6.68 | |
| 500–700 | 4.69 | 9.96 | 0.02 | 0.02 | 2.93 | |
| 305–306 | 100–200 | 5.40 | 0.98 | 0.18 | 0.02 | 6.15 |
| 300–400 | 3.26 | 5.15 | 0.08 | 0.02 | 5.16 | |
| 500–600 | 3.86 | 9.74 | 0.02 | 0.02 | 3.34 | |
| 700–800 | 5.68 | 14.01 | 0.02 | 0.02 | 3.62 | |
| 307–308 | 100–200 | 8.09 | 0.92 | 0.17 | 0.02 | 8.66 |
| 300–400 | 5.54 | 5.67 | 0.08 | 0.04 | 6.92 | |
| 500–700 | 4.69 | 12.03 | 0.02 | 0.02 | 3.92 | |
| 800–900 | 7.20 | 16.72 | 0.01 | 0.02 | 3.96 | |
| 309–311 | 100–400 | 9.12 | 3.10 | 0.09 | 0.03 | 11.17 |
| 800–900 | 9.83 | 16.76 | 0.00 | 0.02 | 1.98 | |
© 2020 by the authors. Licensee MDPI, Basel, Switzerland. This article is an open access article distributed under the terms and conditions of the Creative Commons Attribution (CC BY) license (http://creativecommons.org/licenses/by/4.0/).
Share and Cite
MDPI and ACS Style
Khalili, N.N.W.; Othman, M.; Abu Bakar, M.N.; Abdullah, L. Modelling of a Single Passage Air PV/T Solar Collector: Experimental and Simulation Design. Processes 2020, 8, 763. https://doi.org/10.3390/pr8070763
AMA Style
Khalili NNW, Othman M, Abu Bakar MN, Abdullah L. Modelling of a Single Passage Air PV/T Solar Collector: Experimental and Simulation Design. Processes. 2020; 8(7):763. https://doi.org/10.3390/pr8070763
Chicago/Turabian StyleKhalili, Noran Nur Wahida, Mahmod Othman, Mohd Nazari Abu Bakar, and Lazim Abdullah. 2020. "Modelling of a Single Passage Air PV/T Solar Collector: Experimental and Simulation Design" Processes 8, no. 7: 763. https://doi.org/10.3390/pr8070763
Note that from the first issue of 2016, this journal uses article numbers instead of page numbers. See further details here.