Article

Chemotaxonomic Classification Applied to the Identification of Two Closely-Related Citrus TCMs Using UPLC-Q-TOF-MS-Based Metabolomics

1
School of Chinese Materia Medica, Beijing University of Chinese Medicine, Beijing 100029, China
2
State Key Laboratory of Bioactive Substance and Function of Natural Medicines, Institute of Materia Medica, Chinese Academy of Medical Sciences and Peking Union Medical College, Beijing 100700, China
3
Institution of Basic Theory, China Academy of Chinese Medical Sciences, Beijing 100700, China
4
Institute of Basic Research in Clinical Medicine, China Academy of Chinese Medical Sciences, Beijing 100700, China
5
School of Chinese Medicine, Hong Kong Baptist University, Hong Kong, China
*
Authors to whom correspondence should be addressed.
Molecules 2017, 22(10), 1721; https://doi.org/10.3390/molecules22101721
Submission received: 4 September 2017 / Revised: 4 October 2017 / Accepted: 10 October 2017 / Published: 13 October 2017
(This article belongs to the Section Natural Products Chemistry)

Abstract

:
This manuscript elaborates on the establishment of a chemotaxonomic classification strategy for closely-related Citrus fruits in Traditional Chinese Medicines (TCMs). UPLC-Q-TOF-MS-based metabolomics was applied to depict the variable chemotaxonomic markers and elucidate the metabolic mechanism of Citrus TCMs from different species and at different ripening stages. Metabolomics can capture a comprehensive analysis of small molecule metabolites and can provide a powerful approach to establish metabolic profiling, creating a bridge between genotype and phenotype. To further investigate the different metabolites in four closely-related Citrus TCMs, non-targeted metabolite profiling analysis was employed as an efficient technique to profile the primary and secondary metabolites. The results presented in this manuscript indicate that primary metabolites enable the discrimination of species, whereas secondary metabolites are associated with species and the ripening process. In addition, analysis of the biosynthetic pathway highlighted that the syntheses of flavone and flavone glycosides are deeply affected in Citrus ripening stages. Ultimately, this work might provide a feasible strategy for the authentication of Citrus fruits from different species and ripening stages and facilitate a better understanding of their different medicinal uses.

Graphical Abstract

1. Introduction

Herbal medicines are widely used around the world and are gaining more attention in many fields due to their low toxicity and therapeutic performance [1,2]. Traditional Chinese Medicines (TCMs) have a long and storied history of use in China and were first documented in approximately 200 AD in the text ‘Shen nong ben cao jing’. Most herbal medicines are homologous in medicines and foods such as Citrus, Dioscorea, etc. It is well acknowledged that herbal medicines exert their curative effect via a holistic mode through primary metabolites and especially secondary metabolites [3]. The quality and content of active metabolites in herbs are highly variable, depending on factors such as the species, growth stage when harvested and geographical origins, climate and cultivation [4]. The resources and cultures of TCMs are profound and magnificent and have a long history. TCMs derived from different species, different development stages or different processing procedures exert different efficacies, which has been verified by modern pharmacology to correspond to variations in active metabolites. Therefore, the efficacy, based on variable metabolites, is an important measure to ensure the safety and effectiveness of TCMs in clinical use [5]. In the present paper, we focused on two main factors, species and development stage, to elucidate how their variation is related to the presence of primary and secondary metabolites.
DNA sequence analysis and traditional taxonomic procedures based on phenotypic traits were applied for species authentication [3]. However, only using one taxonomic method is not sufficient for quality control of TCMs. For instance, TCMs from the same species, but different development stages can hardly be discriminated by DNA sequencing [6]. Alternatively, chemotaxonomic classification provides an efficient methodology based on the diversity of plant metabolites to achieve species identification, and the method could contribute to the identification of relationships among development stages. It has been estimated that the total number of metabolites in plants is over 200,000, and each plant may contain its own chemotypic expression pattern [7]. Metabolites are the end products of the response to genetic and enzyme regulated biosynthesis. The pattern of metabolites should be more closely related to the genotype of an organism than to classic morphological traits, which are mainly based on what we can observe about the characteristics of an organism [3]. The chemotaxonomic strategy has been successfully used to reveal the functions of genes involved both in primary plant metabolism and secondary metabolism [8,9,10,11]. In addition, studies of the interactions between species and their development stage have revealed comprehensive and coordinated reprogramming of metabolic pathways via different enzyme catalysis.
Metabolomics reveals global metabolic networks, which reflect the pathophysiological states through the fluctuation of primary and secondary metabolites and can serve as a valuable tool in understanding the biosynthesis mechanisms and variable markers of TCMs [12]. Metabolomics platforms using gas chromatography-mass spectrometry (GC-MS), liquid chromatography-mass spectrometry (LC-MS) or nuclear magnetic resonance (NMR) methods have been reported to be effective tools for quality control of medicinal plants and their products [12]. Ultra-performance liquid chromatography-quadrupole-time-of-flight-MS (UPLC-Q-TOF-MS) is one of the most powerful analytical tools for the identification and discrimination of metabolic profiles in plant extracts, allowing metabolite screening to be performed over a wide range of concentrations [1,13]. The classification of global metabolites based on metabolomics is emerging as a powerful chemotaxonomic tool that provides a detailed view of the differences and similarities between herbal medicines, and it has been successfully applied for quality control of herbs, foods and their products [9]. In this paper, metabolomics using an UPLC-Q-TOF-MS method coupled with multivariate statistical analysis was applied for chemotaxonomic classification of Citrus fruits from different species and different development stages.
Citrus fruits, which are the most popular TCMs of homology of medicine and food, are of great interest because they contain large amounts of dietary phenoloids possessing important therapeutic properties for human health, and Citrus fruits and their juices are consumed in large quantities around the world [14]. Four different Citrus TCMs recorded in Chinese Pharmacopeia, 2015 edition, Zhishi (ZS, young fruit of C. aurantium L., harvested in May and June), Zhiqiao (ZQ, immature fruit of C. aurantium L., harvested in July), Qingpi (QP, pericarps of the young or immature fruit of C. reticulate Blanco, harvested in June) and Chenpi (CP, pericarps of the ripe fruit of C. reticulate Blanco, harvested in August–December), were used as research subjects [15]. Moreover, as a famous medicinal herb, Citrus aurantium L. is a special genus, which is composed of thin pulps and thick peels, especially in the young and immature stage. The peels contained a huge proportion of active phenolic compounds versus the full fruit. The comparison between the peels, pulps and fruits of Citrus aurantium L. have been put in the Supplementary Material. In the following research, the composition of peels and full fruits from Citrus aurantium L. was used in the same. Although they belong to the same genus, their efficacy and clinical indications are different. As we know, Citrus fruits contain a large number of bioactive phenolic metabolites, which have been associated with lower risks of different types of cancers and cardiovascular diseases and have been shown to exhibit antioxidant, anti-inflammatory and anti-ageing activities [14,16,17,18]. According to our previous research, the total phenolic products could be used as characteristic markers for species discrimination of different Zhishi samples, while phenolic metabolites varied over the ripening process [19]. Therefore, Citrus TCMs from different species (C. aurantium L. and C. reticulate Blanco) and different development stages (ZS/ZQ and QP/CP) were divided into three groups to explore their potential chemotaxonomic bioactive markers and query their corresponding biosynthesis pathways.
As a result, a metabolomics study aimed at primary and secondary metabolites from three groups of Citrus TCMs was performed using UPLC-Q-TOF-MS analysis. The two basic species of C. aurantium L. and C. reticulate Blanco were clearly differentiated based on their primary and secondary metabolite profiles using hierarchical cluster analysis (HCA) and orthogonal signal correction partial least squares-discriminate analysis (OPLS-DA). In addition, the variation of secondary metabolites was further used to determine the development stage, as depicted in the HCA-dendrogram and OPLS-DA score plot. Using two-stage receiver operating characteristic (ROC) analysis and the Plackett–Burman (PB) test, 79 secondary (among them, 35 metabolites were unambiguously identified compared with the reference standards) metabolites were recognized as potential chemotaxonomic markers related to biosynthetic pathways. Multivariate statistical analysis coupled with MetaboAnalyst (www.metaboanalyst.ca) permitted the comprehensive metabolomic data to be visualized and interpreted and supported integrative pathway analysis for both primary and secondary metabolites. Therefore, we propose that the chemotaxonomic classification approach focus on metabolomics-guided metabolic pathway interrogation to reveal different pharmacodynamical mechanisms of metabolites, which will be an effective strategy for quality control of closely-related TCMs and facilitate a better understanding of their different medicinal uses.

2. Results and Discussion

2.1. Optimization and Validation of the Method

2.1.1. Optimization of Chromatographic Conditions

Different mobile phase compositions were screened to obtain LC chromatograms that had good peak shapes and separation. It was found that methanol and 0.1% acetic acid were the most suitable eluting solvent system. In order to acquire better sensitivity for base ions of most compounds in the TOF-MS spectra, the ionization parameters, including the desolvation gas flow rate, desolvation gas temperature, fragmentor voltage, nebulizer pressure and capillary voltage, were optimized. The optimum conditions of TOF/MS were decided as follows: capillary voltage positive ion mode 3.0 kV/negative ion mode 3.5 kV, desolvation gas flow 800.0 L/h, desolvation gas temperature 400 °C and nebulizer pressure 40 psi.

2.1.2. Validation of the Analytical Method

To ensure the stability of the sequence analysis, a quality control (QC) sample was prepared by pooling a same volume (100 μL) from each Citrus sample and then preparing the pooled QC sample in the same way as the samples. To provide assurance that the system was suitable for use, five pooled QC samples were run prior to analysis. These pooled QC samples were also interspersed between every five samples during the analytical run.
The precision of the method was validated by the determination of the intra- and inter-day variances. For the intra-day test, the samples were analyzed six times within the same day, and for the inter-day test, the samples were examined three times per day for three consecutive days. The relative standard deviations (RSD) from UPLC-Q-TOF-MS are listed in Tables S1 and S2. To confirm the repeatability, six replicates of the QC sample were analyzed. Reproducibility was analyzed by repeating the whole method for the same sample within one day using UPLC-Q-TOF/MS (n = 6). For most of the metabolites investigated, the peak area RSD values of reproducibility were 0.69–2.79%.
The present method was found to have acceptable precision for the intra-day RSD values (0.36–2.92%) and inter-day RSD values (1.45–3.36%). The samples and analytical method exhibited good stability, with an RSD range of 0.04–6.31%. The method validation terms are summarized in Tables S1 and S2.

2.2. Identification of Primary Metabolites

As the central metabolism in plants, primary metabolism has been referenced in the assimilation, respiration, transport and differentiation processes that take place in cells [20]. It is well known that primary metabolites determine relevant crop quality traits related to nutritional content and composition, for they include a wide range of intermediate compounds and end products of metabolic pathways that accumulate in sink organs (e.g., seeds, fruits and tubers), such as lipids, amino acids and organic acids [21]. Most recently, Jing et al. [22] found that primary metabolites are fundamental to genetic improvement and metabolic engineering of either metabolic composition or plant primary production.
In the present study, following pretreatment of the metabolite data, eighty-eight metabolites were detected, including 13 glycerophosphatidic acid (GPA), 13 monogalactosyl (MG), 6 glycerophosphoethanolamine (GPEtn), 3 Glycerophosphatidylinositol (GPIns), 3 Glycerophosphatidylserine acid (GPSer), 1 Glycerophosphatidylglycerol (GPGro), 8 diacylglycerol (DG), monogalactosyldiacylglycerol (MGDG), digalactosyldiacylglycerol (DGDG) and sulfoquinovosyldiacylglycerol (SQDG), 4 phosphatidylcholine (PC), 10 phosphatidylethanolamine (PE), 5 amino acids, 3 phenolic acids, 2 nucleosides, 2 organic acids and some others. They are tentatively identified in Table 1 and Table S3. All of the primary metabolites were putatively identified according to the retention time, accurate mass, MS2 and searches of the Human Metabolome Database (HMDB) and LIPID MAPS Structure Database (LMSD) metabolomics databases. The LMSD is a relational database containing structures and annotations of biologically-relevant lipids [23].
Plant cells have numerous membranes that are generally the same as those in animal cells, including the plasma, mitochondrial, nuclear and peroxisomal membranes. In addition, plant cells contain unique membrane-bound compartments, the chloroplast, vacuole and symbiosome, which have other cellular structures composed of lipids, e.g., the cuticle of epidermal cells [24]. As the key photosynthetic organelle in plants, the focus of plant lipid research has been on the chloroplast being predominant; its known membrane was unique in its lipid composition, with two galactolipids, monogalactosyldiacylglycerol (MGDG) and digalactosyldiacylglycerol (DGDG) [24,25]. They also contain a significate unique sulfolipid, sulfoquinovosyl diacylglycerol (SQDG), whose head group was a modified galactose. Nevertheless, the phospholipid components of plastids are less abundant. On the other hand, the two most abundant classes of phospholipids in plant mitochondria are similar to yeast and mammals, which are phosphatidylcholine (PC) and phosphatidylethanolamine (PE), the “star products” in lipid research [26]. PC species are not only an essential component of biomembranes, but also protect cells and their organelles from oxidative stress, lipotoxicity and endoplasmic reticulum (ER) stress [26]. PE species have been reported as the second most abundant membrane phospholipid in plant cells, and they have been identified as modulators in cold temperature stress. The other productions of biologically-active lipids, glycerophosphatidic acid (GPA) and glycerophosphoethanolamine (GPEtn), are derivatives of glycerophospholipids. GPA has been reported to be the simplest phospholipid and is also one of the building units for phospholipid biosynthesis [27].
Some other primary metabolites that are detected, including amino acids, phenolic acids, nucleosides and organic acids, have been reported to be essential elements in plant cells. Amino acids are unarguably the most important metabolites from a biological point of view. Not only are they the basic structural units of proteins, but also a source of energy. Furthermore, some amino acids play important roles as neurotransmitters [28]. Now, much more attention has been paid to nucleosides, nucleotides and nucleobases, as they are the group of highly active metabolites, exhibit anti-platelet aggregation, antiarrhythmic, anti-oxidant, anti-seizure and anti-tumor effects [29]. Furthermore, phenolic acids have been found to be stronger antioxidants against free radicals and other reactive oxygen species, which are essential in preventing chronic human diseases such as cancer and cardiovascular diseases [18].

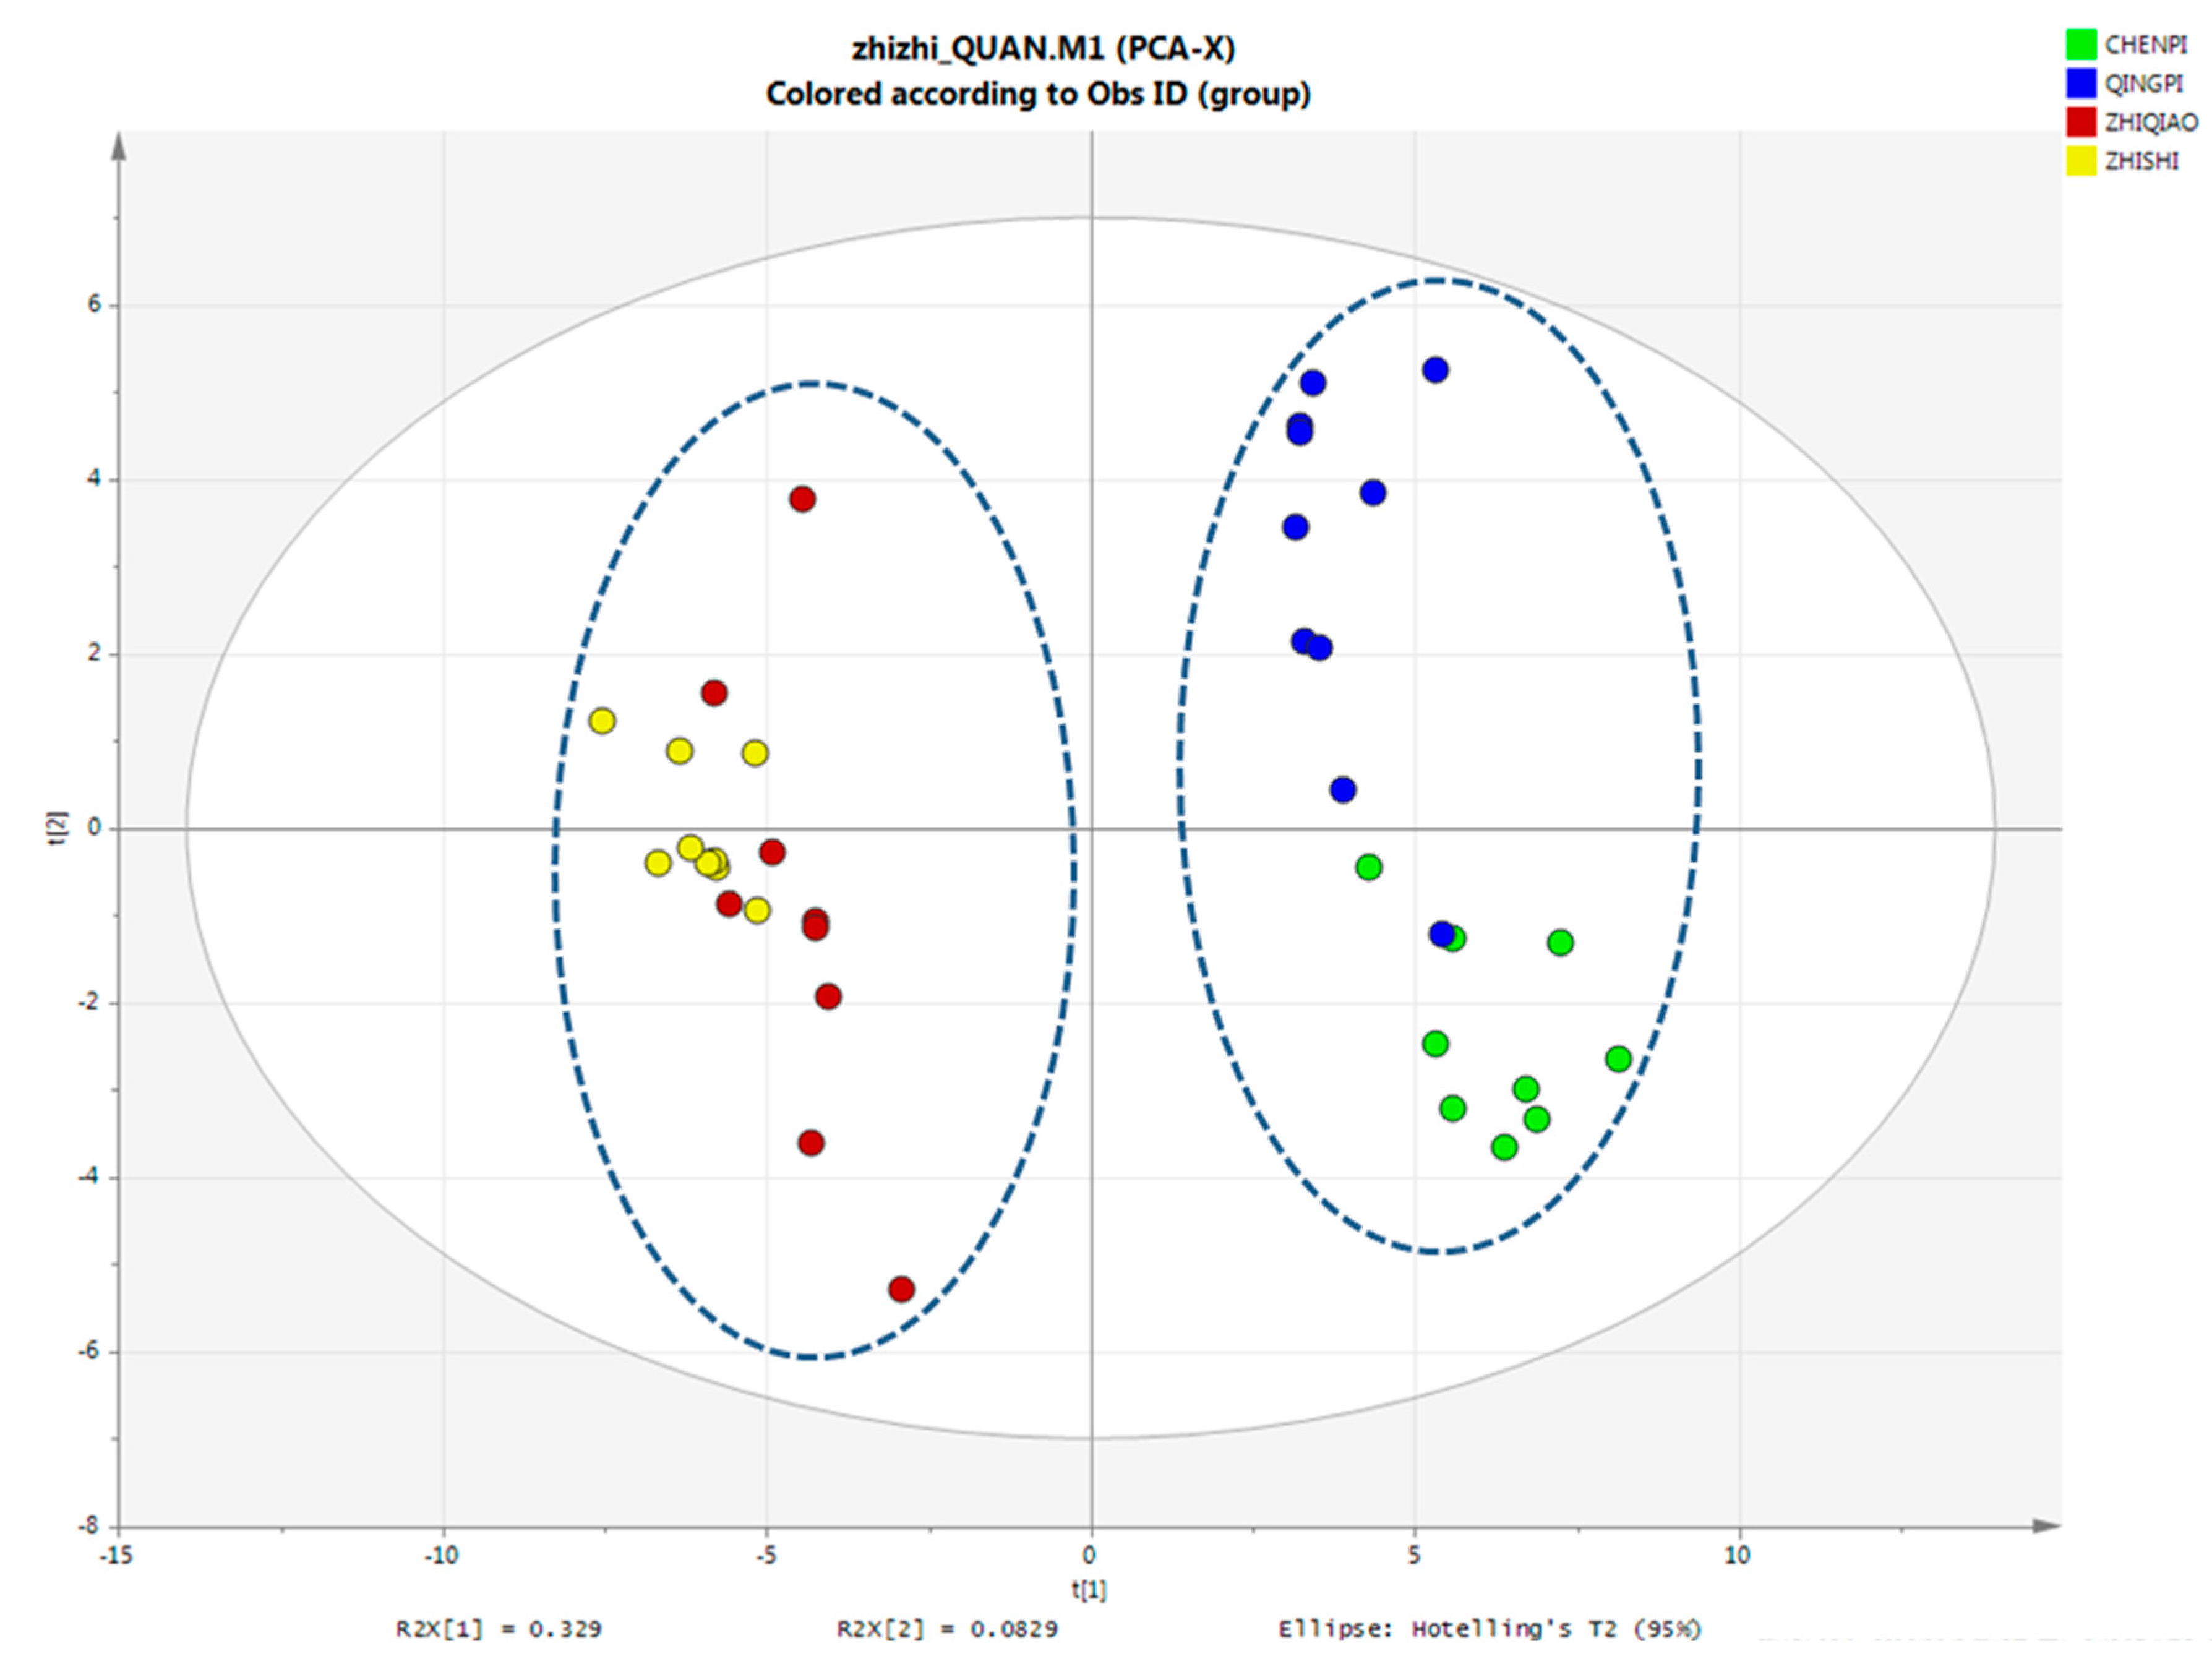
PCA Analysis of Primary Metabolites

PCA was carried out to provide additional insight into the chemical differences between the Citrus samples. PCA is an unsupervised pattern recognition method that is used for analyzing, classifying and reducing the dimensionality of numerical datasets in multivariate problems. This approach has been widely used for quality control of herbal medicines. The contents of the 88 analytes were set as the variables, and 37 sample batches were set as the observations. The score scatter plot is shown in Figure 1, and the first two principal components accounted for 75.2% of the variance. According to the PCA score plot, all of the QP and CP samples were clustered in a small region and can be separated from the ZS and ZQ samples; the QP and CP, as well as ZS and ZQ samples from the same species might be more difficult to divide, as the collection stage may be closer. Although some inevitable differences arise from cultivation regions, harvesting time and the storage process may substantially influence the contents, and the species source was one of the most important factors. From this result, primary metabolites can be easily clustered within the different species of Citrus.

2.3. Identification of Secondary Metabolites

Compared with the advent of modern DNA sequencing techniques, chemotype-based classification methods, which are mainly based on Citrus secondary metabolites, are undeniably the most useful characteristic accompanying morphology in the discrimination of Citrus species. In current studies, it seems that a certain group of Citrus TCMs, which are defined by their morphology, tends to have a stable pool of secondary metabolites, which is a good indication of their classification. For instance, some articles have indicated that chemotype-based classification methods are reliable [3].
Phenolic metabolites are one of the most important groups of plant secondary metabolites; they are widespread in plants and encompass more than 8000 molecules [30]. Numerous studies have focused on polyphenols as they are a group that has multiple biological effects. Polyphenols are involved in many plant processes, such as development (participating in plant hormone signaling or pollen germination), reproduction (pigments attracting pollinators) and plant defense (protecting from UV, pathogens and predators) [31,32]. Polyphenols also play a significant part of food quality and taste, as well as potentially participating in the prevention of chronic diseases in relation to their antioxidant properties [33].

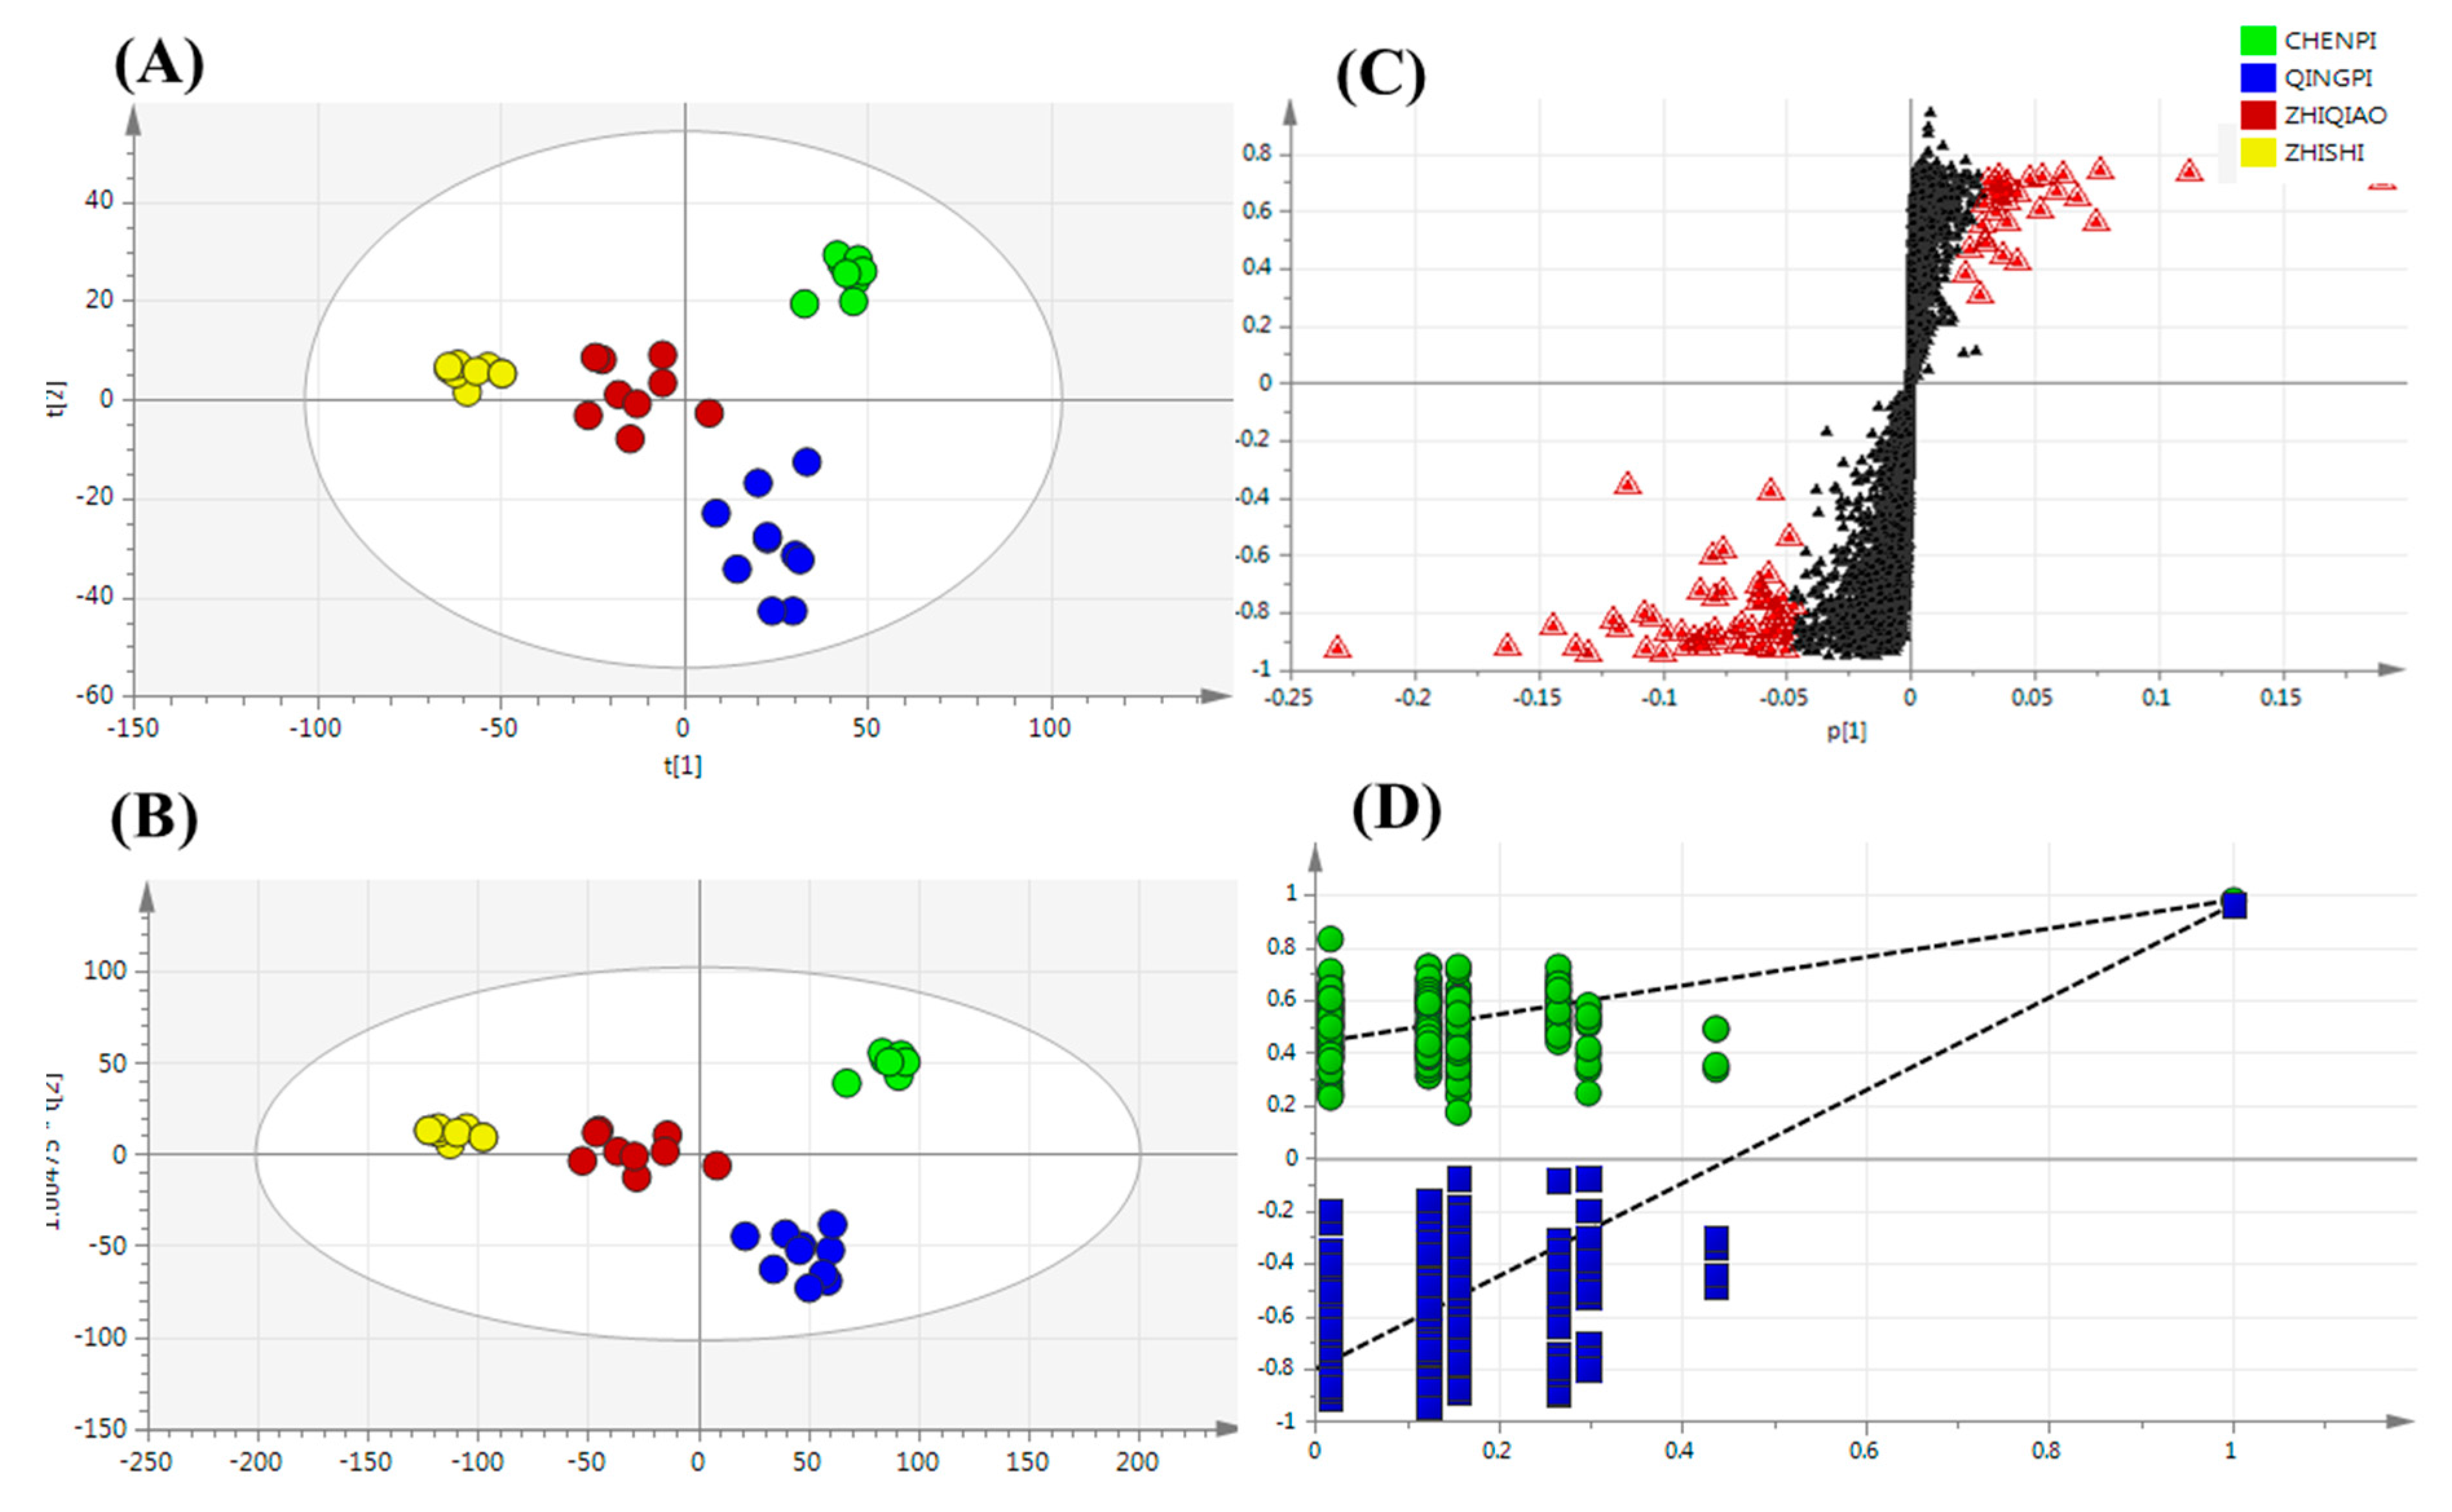
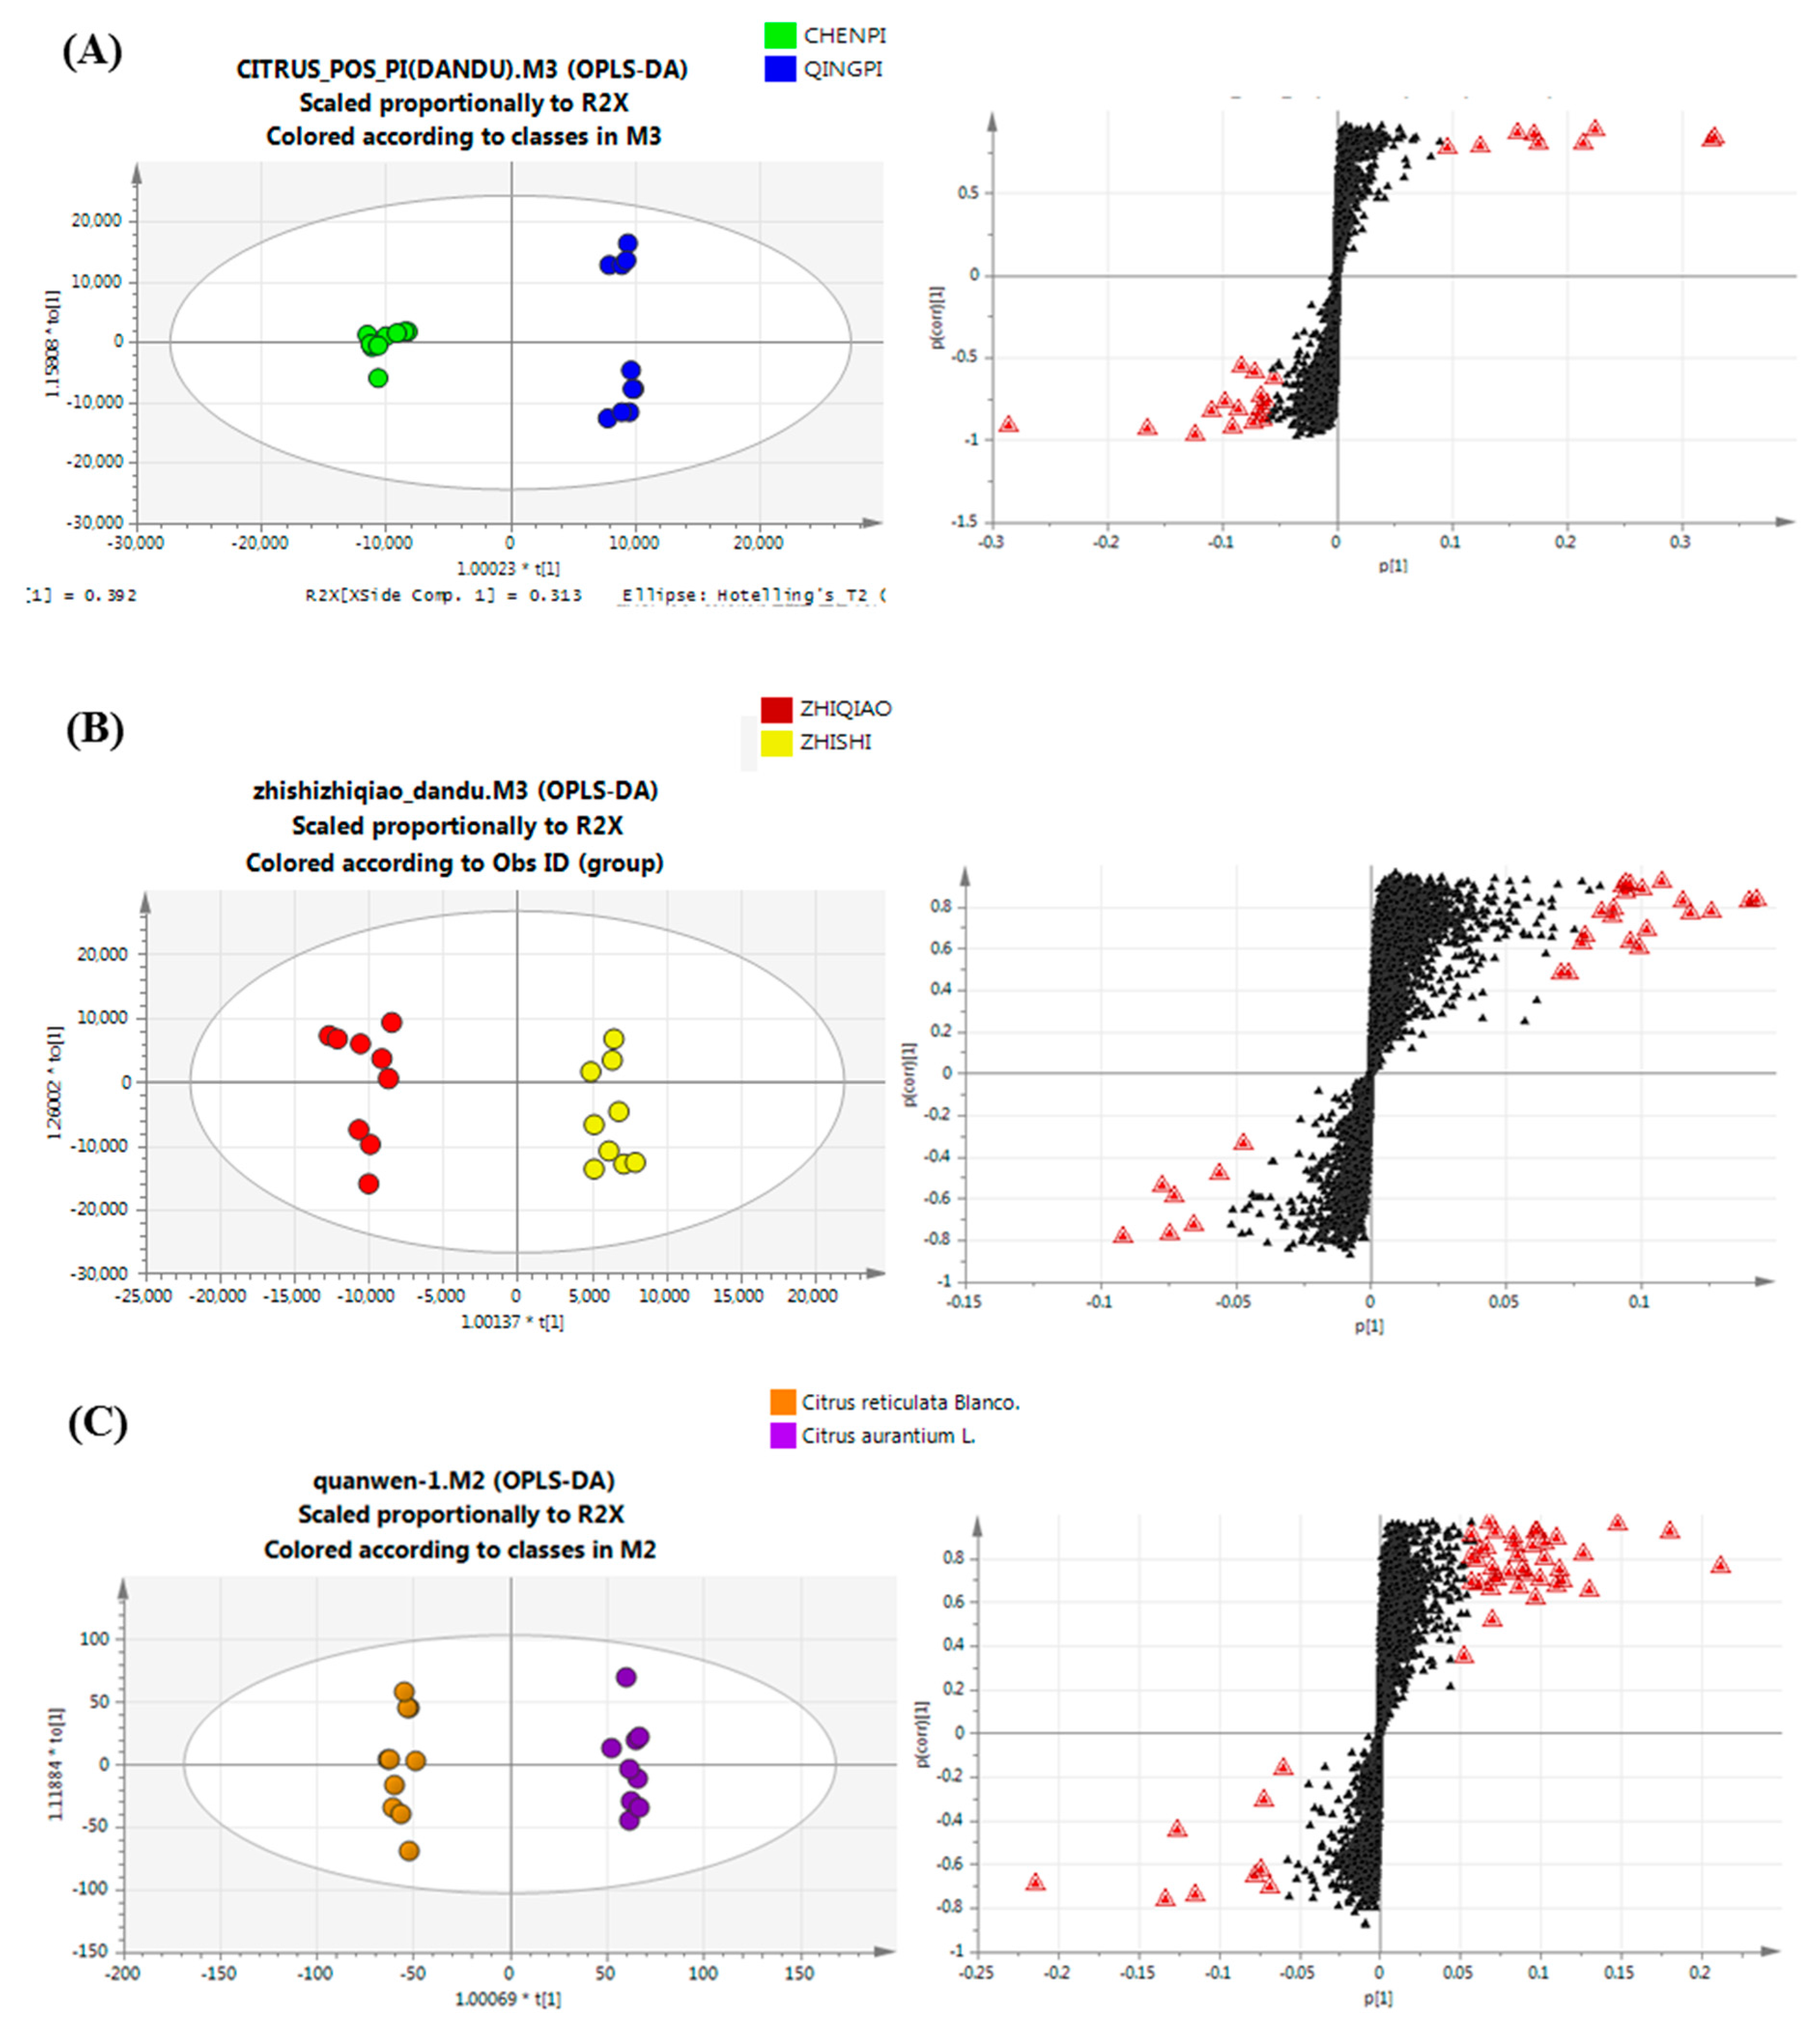
Non-Targeted Analysis of Secondary Metabolite Features

The plot of PCA scores clearly indicated that the first two PCs were able to separate the different developmental and ripening stages in Citrus (Figure 2A); 72.12% of the variance was explained using the first two PCs (scores) alone. The clear separation of the four samples of QP, CP, ZQ and ZS in the score plot indicated a more significant effect of the harvest season than variety on the Citrus metabolome. According to the 2015 edition of the Chinese Pharmacopoeia, ZS is harvested in May and June ZQ in July, CP in August–December and QP in June. Due to the passage of time, the quality and quantity of phenolic metabolites in ZS samples tend to be similar to those in ZQ samples. Therefore, the PCA score plot indicated that the first two components were able to separate the different species of the Citrus samples, as well as the different developmental and ripening stages of those Citrus samples, which indicated that multiple sources were important factors that can affect the use of TCMs. Of course, differences in the developmental and ripening stages should not be neglected.
A supervised PLS-DA approach was used to investigate the metabolites that showed the greatest differences. As shown in Figure 2B, the Citrus samples were separated into the QP, CP and ZS, ZQ samples by PC 1, and the QP samples were easily separated from the CP samples by PC 2, which indicated different secondary metabolite phenotypes for Citrus picked at different ripening stages. Cross-validation analysis showed that the R2 and Q2 intercepts were 0.487 and 0.894, respectively, thus demonstrating that the PLS-DA model was reliable (Figure 2D). An S-plot was used to discover key metabolites that contributed to the differentiation of the QP, CP, ZQ and ZS samples (Figure 2C). Seventy-nine metabolites, including 14 flavanones, 24 flavone and flavone glycosides, 4 flavonol and flavonol glycosides, 29 coumarins, 1 anthocyanin, 4 limonoids and glycosides and 1 abscisic acid, were tentatively identified (Table 2). The secondary metabolites were putatively identified according to the retention time, accurate mass, MS2 and searches of the PubChem and ChemSpider databases. ChemSpider (http://www.chemspider.com/) is a free chemical structure database providing fast access to over 34 million structures, properties and associated information. Among them, 35 metabolites were confirmed by authentic standards. Others were putatively identified according to retention time, accurate mass, MS2 and metabolomics databases.
A heat-map was applied to visualize the developmental variations of differential metabolites in the Citrus samples (Figure 3). The data were Pareto scaled. A red box indicates that a metabolite occurred at greater than the mean level in a sample, and a blue box means that the metabolite was at a lower level. Flavonol and flavonol glycosides, some coumarins (6′-7′-dihydroxybergamottin and psoralen) and anthocyanin clearly occurred at higher levels in the QP and CP than in the ZS and ZQ samples; while others, flavone and flavone glycosides, flavanones, majority coumarins and limonoids and glycosides, were found to be significantly higher in ZS and, especially, in ZQ samples. Otherwise, some coumarins (bergapten, xanthotoxin, isopimpinellin, aurapten, auraptene and bergaptol) and some flavone and flavone glycosides (amentoflavone and acacetin) were at their lowest levels in ZQ samples.

2.4. Variable Selection and Annotation of Metabolites

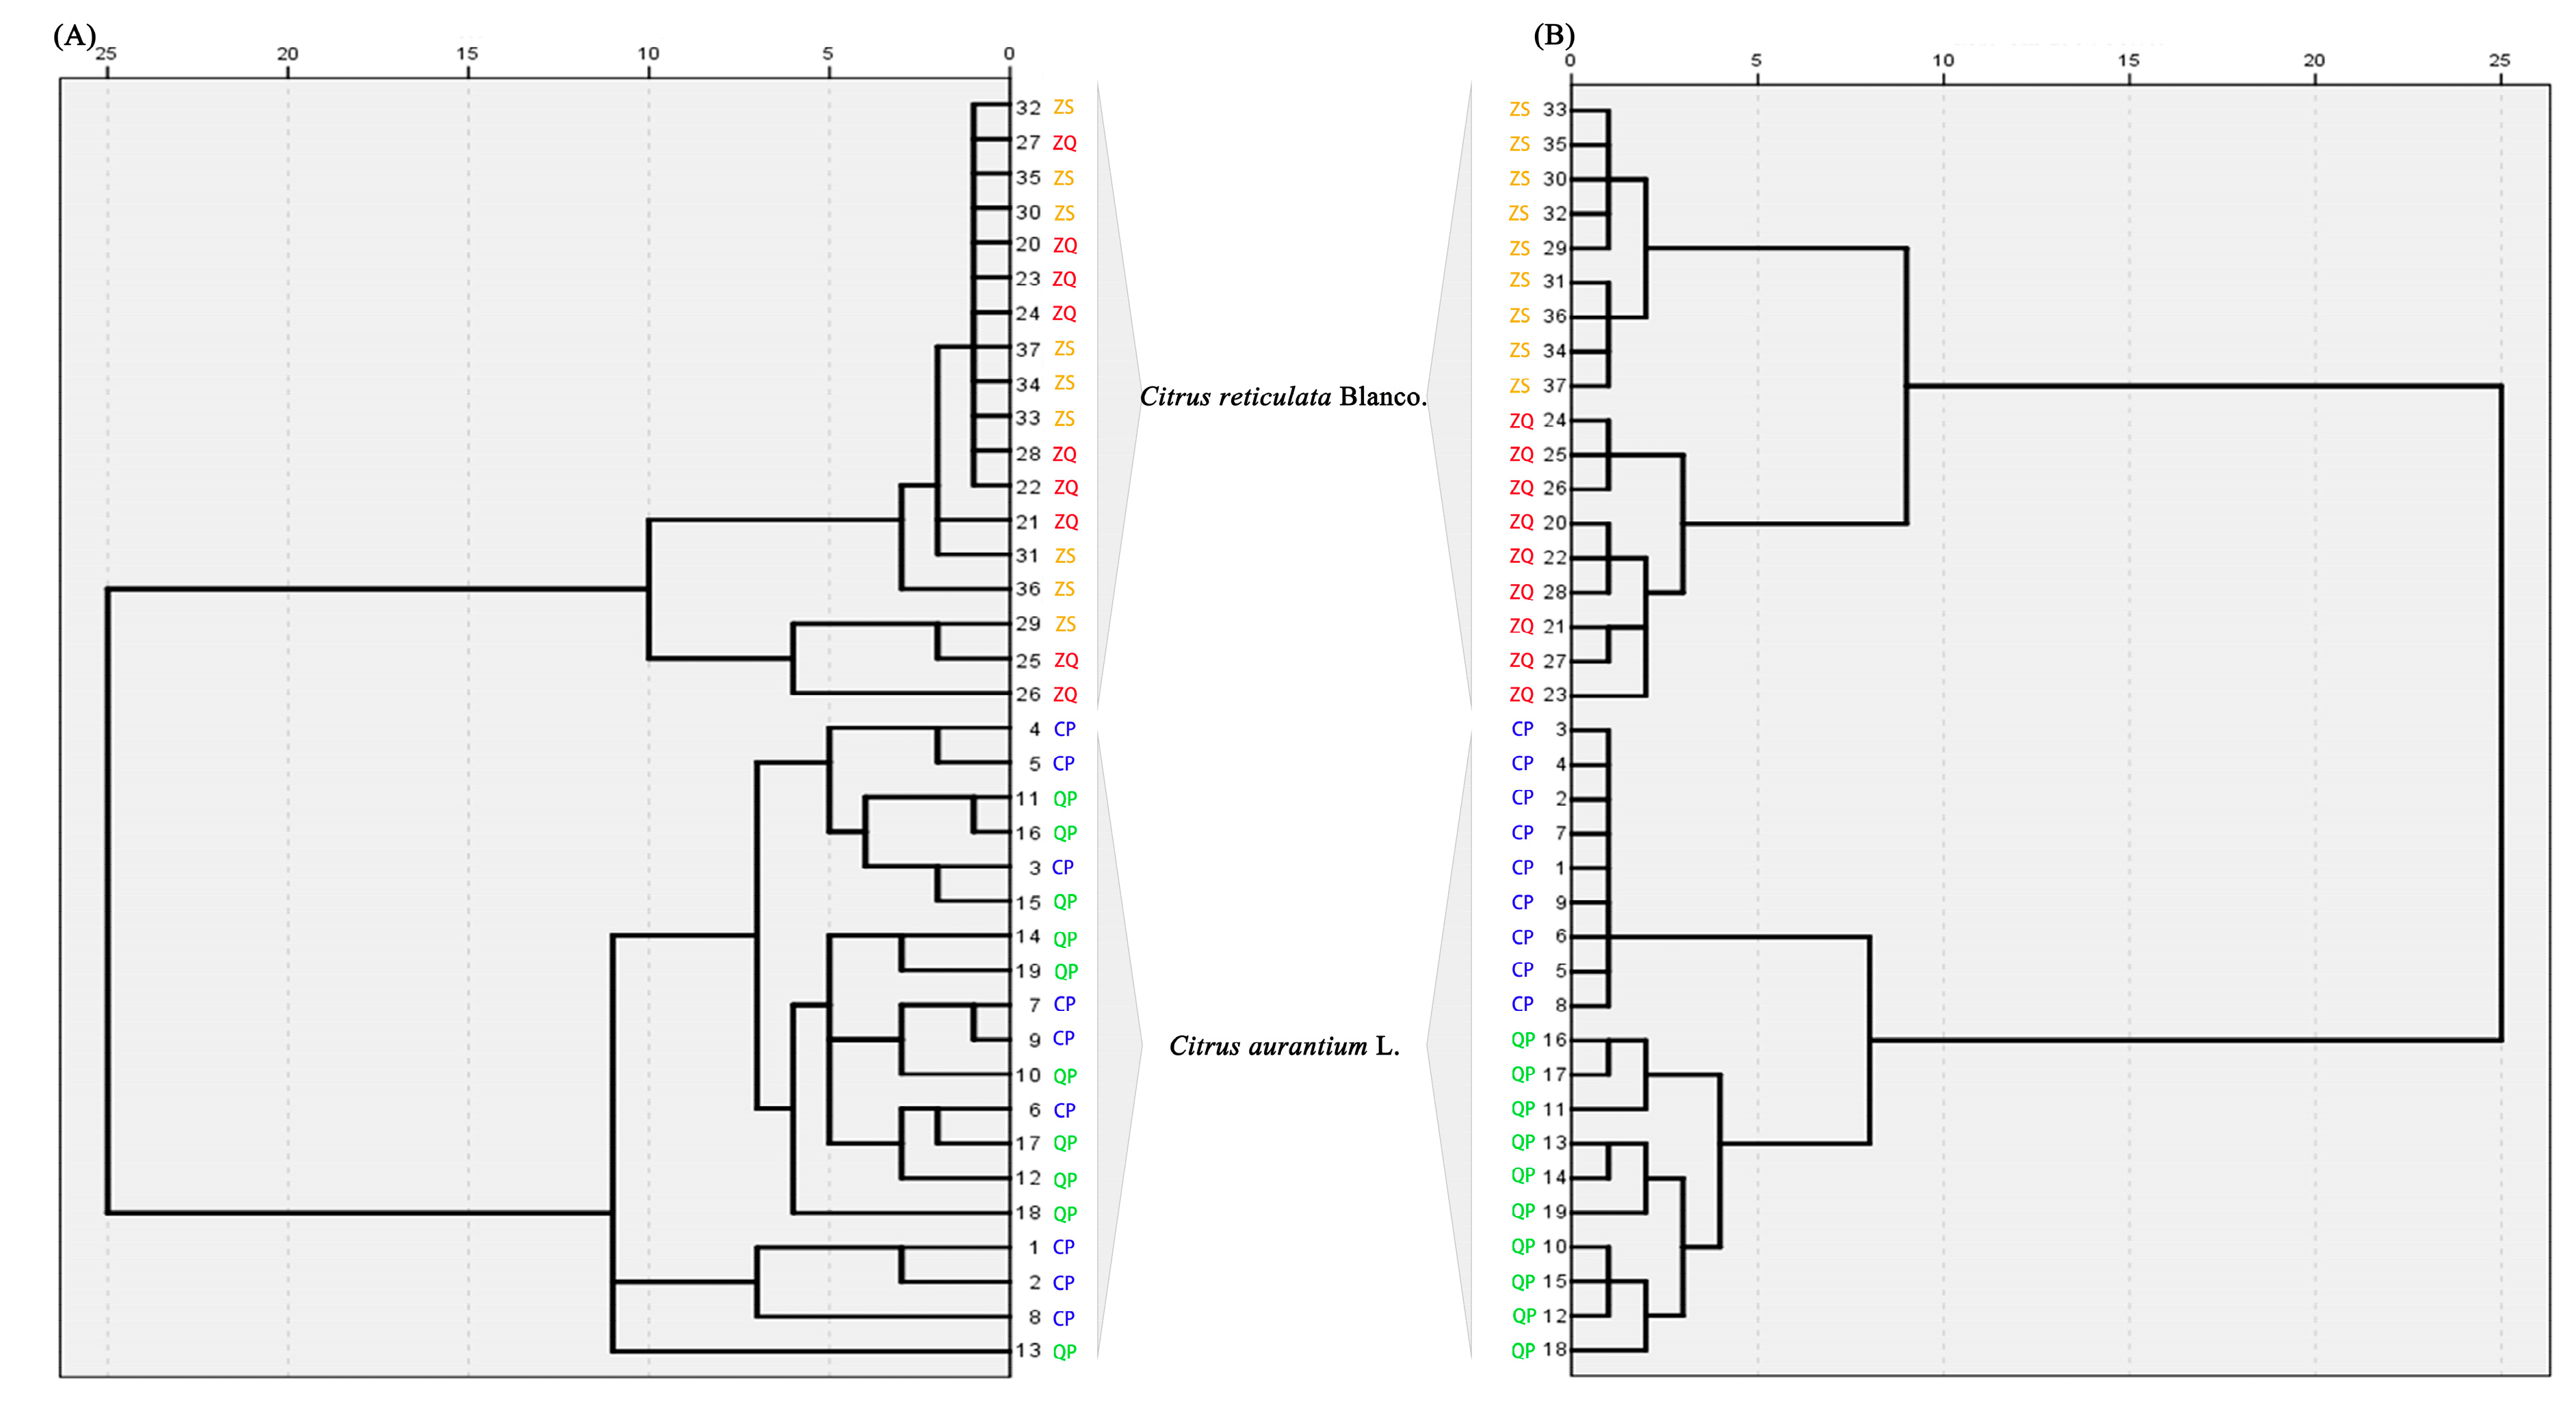
2.4.1. Chemotaxonomy of Citrus by Primary and Secondary Metabolites

The databases we obtained were introduced to the HCA technique, taking into account the concentration of each sample. HCA examines the distances between the samples in a dataset, and the information is represented in a two-dimensional plot (dendrogram). The most similar points were grouped and then formed clusters [34]. The process is repeated until all of the points are inserted into a unique group. The style of the data is auto-scaled, and the Euclidean distance with the complete linkage method is used to calculate the sample similarities. A hierarchical agglomerative procedure is employed to establish clusters.
The results showed groupings of primary metabolites in tight clusters according to the Citrus species. In addition, the relationship between clusters was in agreement with the expected phylogenetic relationships among varieties, showing a perfect separation of the represented groups, C. aurantium L. and C. reticulate Blanco (Figure 4A). Nevertheless, by representing other combinations of components, the model is chaotic in differentiating harvesting period-related varieties within a group. In general, varieties were grouped according to genotype, but not harvesting period.
It seemed clear that the development stage had an influence on the fruit secondary metabolite composition as shown in previous research. Accordingly, the 37 Citrus samples were analyzed by chemotaxonomic classification using the 79 secondary metabolites as reference markers. HCA showed that those Citrus samples were divided into four branches (QP, CP, ZS and ZQ) according to their secondary metabolite chemotaxonomy (Figure 4B). Compared with primary metabolites, the HCA results of secondary metabolites showed different results for the chemotype-based classification methods, which reflected how the secondary metabolites play an important role in the chemotaxonomic classification of the Citrus harvesting period.

2.4.2. Potential Chemotaxonomic Markers Associated with Primary Metabolites

A two-stage ROC curve analysis was carried out to identify potential markers associated with species. ROC analysis is a useful tool for evaluating the accuracy of a statistical model (e.g., logistic regression, linear discriminate analysis). The area under the ROC curve is a summary measure that essentially averages diagnostic accuracy [35].
As a result, 48 altered primary metabolites, with areas under the ROC curves ranging from 0.85–1 (Figure S1, Table 1 and Table S3), were considered to show the greatest diagnostic accuracy. Subsequently, an ROC curve-based model was established to assess the integrated predictive power of the combined 48 altered metabolites to distinguish C. aurantium L. from C. reticulate Blanco. The AUC value of the established model was 1.000, which showed a good ability for discriminating the two different Citrus species. Thus, those 48 altered metabolites (Table 1) can be defined as potential primary chemotaxonomic markers that are associated with different species.

2.4.3. Potential Chemotaxonomic Markers Associated with Secondary Metabolites

In this study, a detailed analysis of potential markers was conducted to determine the chemotype-features of these closely-related TCMs and the associations between the species and ripening stages of Citrus species [36]. To identify the metabolites that are significantly affected by ripening stages, OPLS-DA modeling was performed on the profiling datasets. The model separated young samples from ripe samples of Citrus by discriminating, according to their difference in light intensity. The OPLS-DA model of group QP/CP and ZS/ZQ explained (R2 = 0.812 and 0.886, respectively) and predicted (Q2 = 0.991 and 0.935, respectively) the total variance [37]. S-plots (Figure 5A,B) were constructed by presenting covariance (p) against correlation (pcorr), and the potential chemotaxonomic markers for the separation of shading effects were obtained by filtering with the variables that had an influence on the projection (VIP) > 1 and p < 0.05 in the statistical analysis. VIP was a weighted sum of squares of the PLS weight, and a value >1 was generally used as a criterion to identify the variables that were important to the model. Although many of the significantly differing components remained unknown, a total of 50 potential biomarkers was identified from the PLS-DA and S-plot as chemotaxonomic markers for ripening stages. The p-values of potential markers between groups (expressed as QP/CP and ZS/ZQ in Table 2) were calculated from their peak intensity to show the effects of different developmental stages of Citrus. As a result, flavones played a significantly important role in discriminating the ripening stage of Citrus; for example, sinensetin decreased and rutin increased in ripe fruits.
To explore the ripening effect by development stages, another multivariate statistical analysis was performed on the datasets from the two different species. Again, the two groups of samples were well separated by discriminating according to their differences. The OPLS-DA model explained more than 80% (R2) and predicted more than 95% (Q2) of the total variances. Analysis of the S-plot (Figure 5C) showed that most coumarins increased in the C. aurantium L. species, while flavonol, flavonol glycosides and anthocyanin increased in C. reticulate Blanco. A total of 57 potential biomarkers were identified as species chemotaxonomic markers, with a p-value between the group (C. aurantium L. and C. reticulate Blanco.), which is shown in Table 2.
Next, the PLS-DA-based receiver operating characteristic (ROC) curve was performed on each group to further find specific chemotaxonomic markers. This contribution map allowed comparisons between contrasting species groups and ripening stage groups (Figure S2), and it highlighted the potential regulatory nodes involved in different group variability by ROC curve analysis. In general, metabolites with areas under the ROC curves ranging from 0.85–1 are marked in the figure. As is shown, 25, 34 and 47 metabolites have been marked for QP/CP, ZS/ZQ and species group again, which is shown in Table 2. The AUC value of the established model is 0.934, 1.000 and 0.984 (Figure S2), which showed a good ability for discriminating.

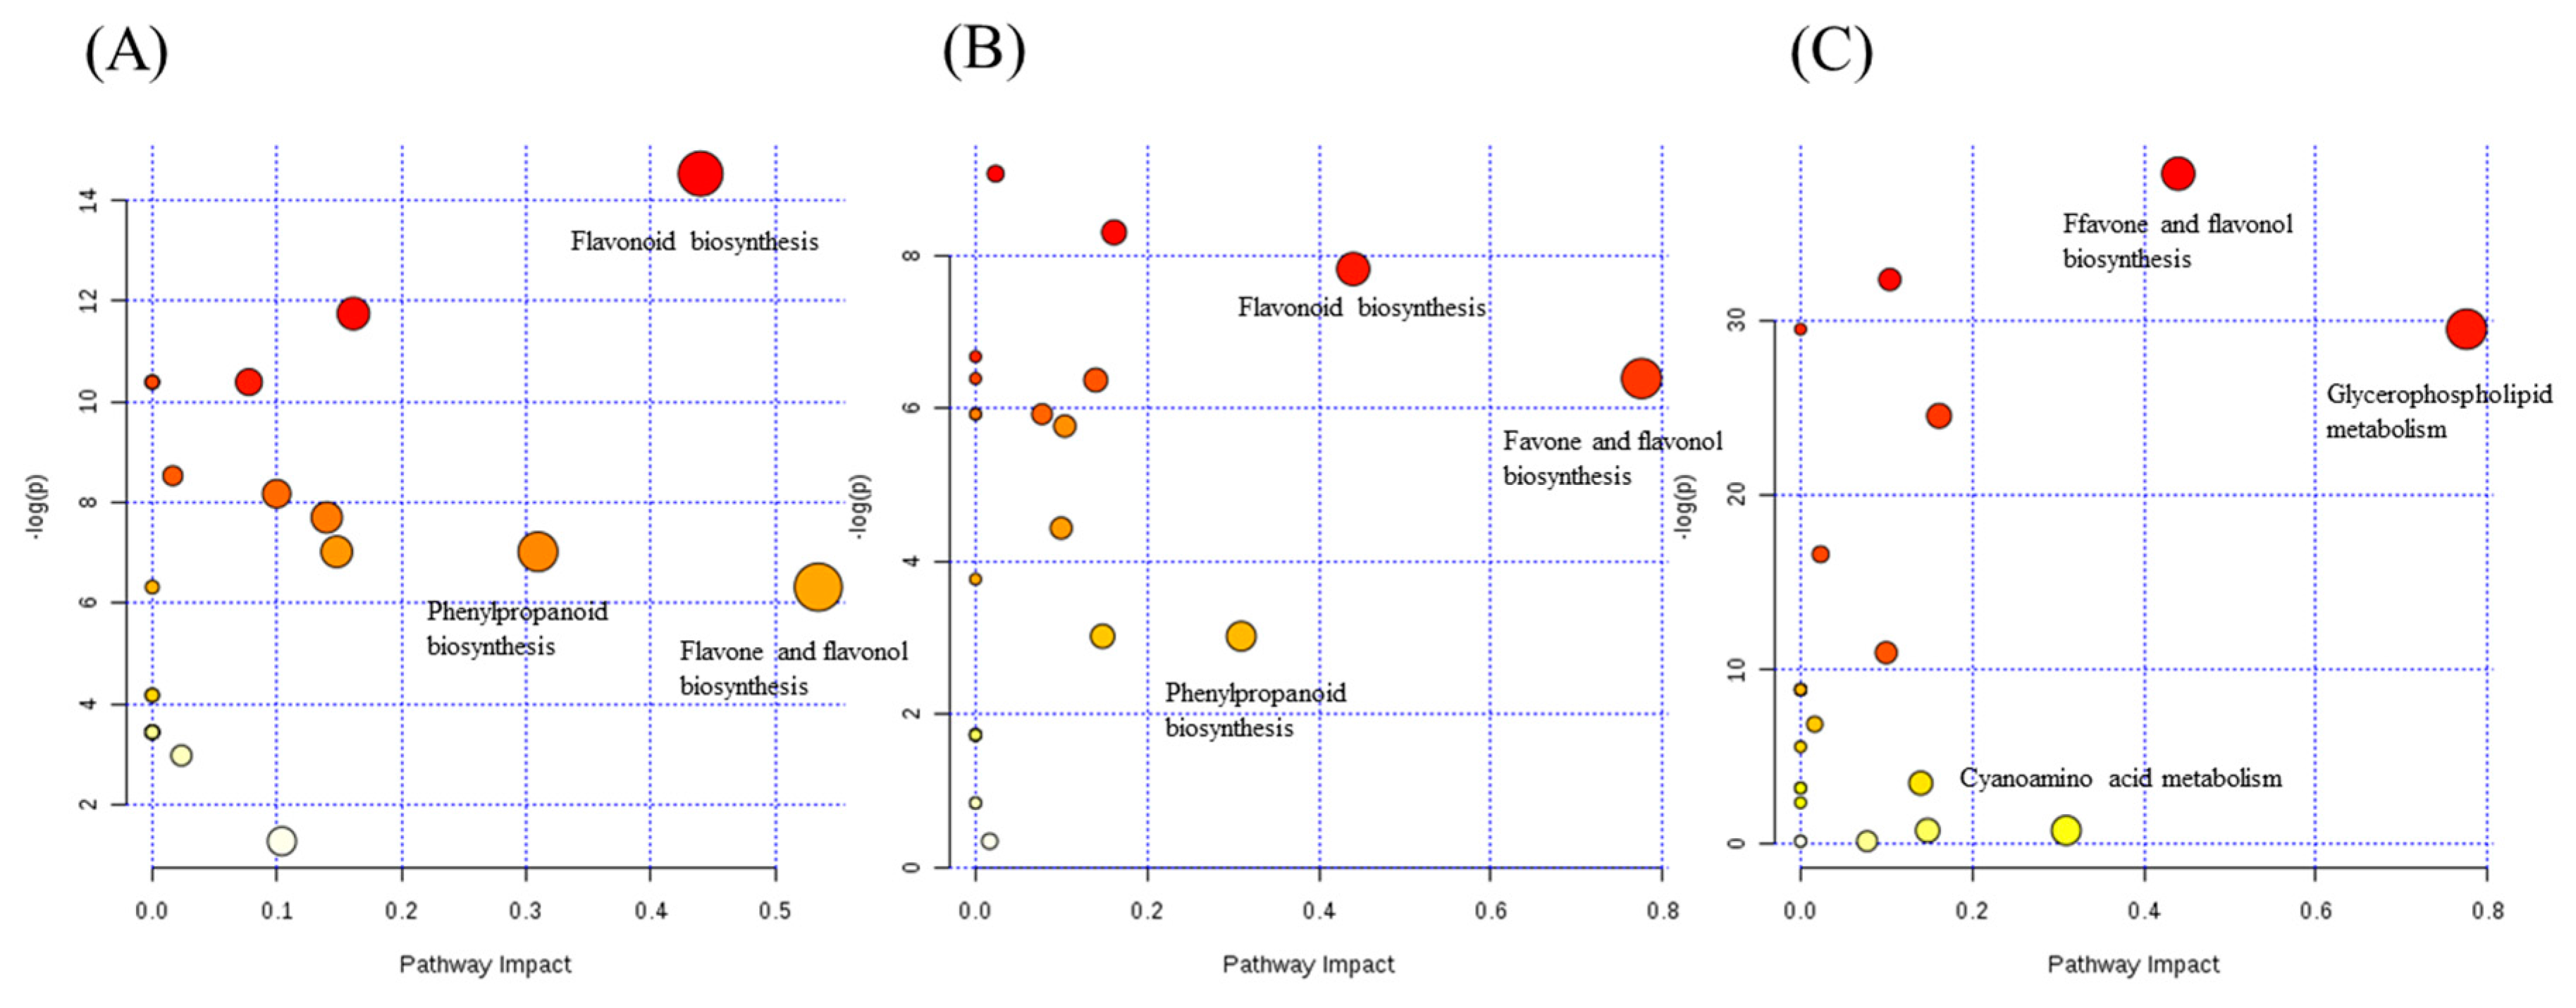
2.5. The Pathway Analysis Associated with Chemotaxonomic Markers

Pathway analysis has been used to determine vegetative metabolic regulation that chiefly affected the following pathways: flavone and flavonol biosynthesis; flavonoid biosynthesis; anthocyanin biosynthesis; glyoxylate and dicarboxylate metabolism; alanine, aspartate and glutamate metabolism; starch and sucrose metabolism; amino sugar and nucleotide sugar metabolism; citrate cycle (TCA cycle); pyrimidine metabolism; pentose and glucuronate interconversions; lysine biosynthesis; cysteine and methionine metabolism; butanoate metabolism; beta-alanine metabolism; phenylalanine, tyrosine and tryptophan biosynthesis; nicotinate and nicotinamide metabolism; glycerophospholipid metabolism; cyanoamino acid metabolism; pyrimidine metabolism; carbon fixation pathways in photosynthetic organisms metabolism; and phenylpropanoid biosynthesis.
Based on the primary metabolites and secondary chemotaxonomic markers, a comprehensive metabolic network for the discrimination of the species and ripening stages of Citrus fruits was mapped by KEGG (Kyoto Encyclopedia of Genes and Genomes) and MetaboAnalyst 3.0 [38] (shown in Figure 6A–C). Twenty-four metabolic pathways were disturbed in the QP/CP group, ZS/ZQ group and CA/CS group. The top three metabolic pathways with an impact value >0.2 influencing the species were glycerophospholipid metabolism, cyanoamino acid metabolism and flavone and flavonol biosynthesis; at the same time, three of the metabolic pathways were considered to be the most pertinent to the ripening stages in both the QP/CP and ZS/ZQ groups, including flavone and flavonol biosynthesis, flavonoid biosynthesis and phenylpropanoid biosynthesis.

2.5.1. The PB Test of the Analysis Factor

A PB design is utilized to find experimental designs for investigating the dependence of some measured quantity on a number of independent variables to minimize the variance of the estimates of these dependencies using a limited number of experiments [39]. It was performed to investigate which factors significantly affected the different markers, as well. The two factors that we discussed below were assessed, including species (A) and ripening stages (B) (shown in Table S4). The contents of analyses were determined to be the influencing parameters of the markers. Main effects plots were used to examine differences between mean levels for those factors. Different levels of a factor affected the response differently. In main effect plots, if the line were parallel to the x-axis, there was no effect in reality. Conversely, this means a main effect. The steeper the slope of the line, the greater the magnitude of the main effect was observed. As shown in Figure S3, two factors seem to affect the content of the analyses because the lines are not horizontal. The slopes of the species and ripening stages curves in these graphs are all proportional to the absolute value of the estimated effects and the factors that have a significant effect on the response. Different chemotaxonomic markers have different effects on species and ripening stage.

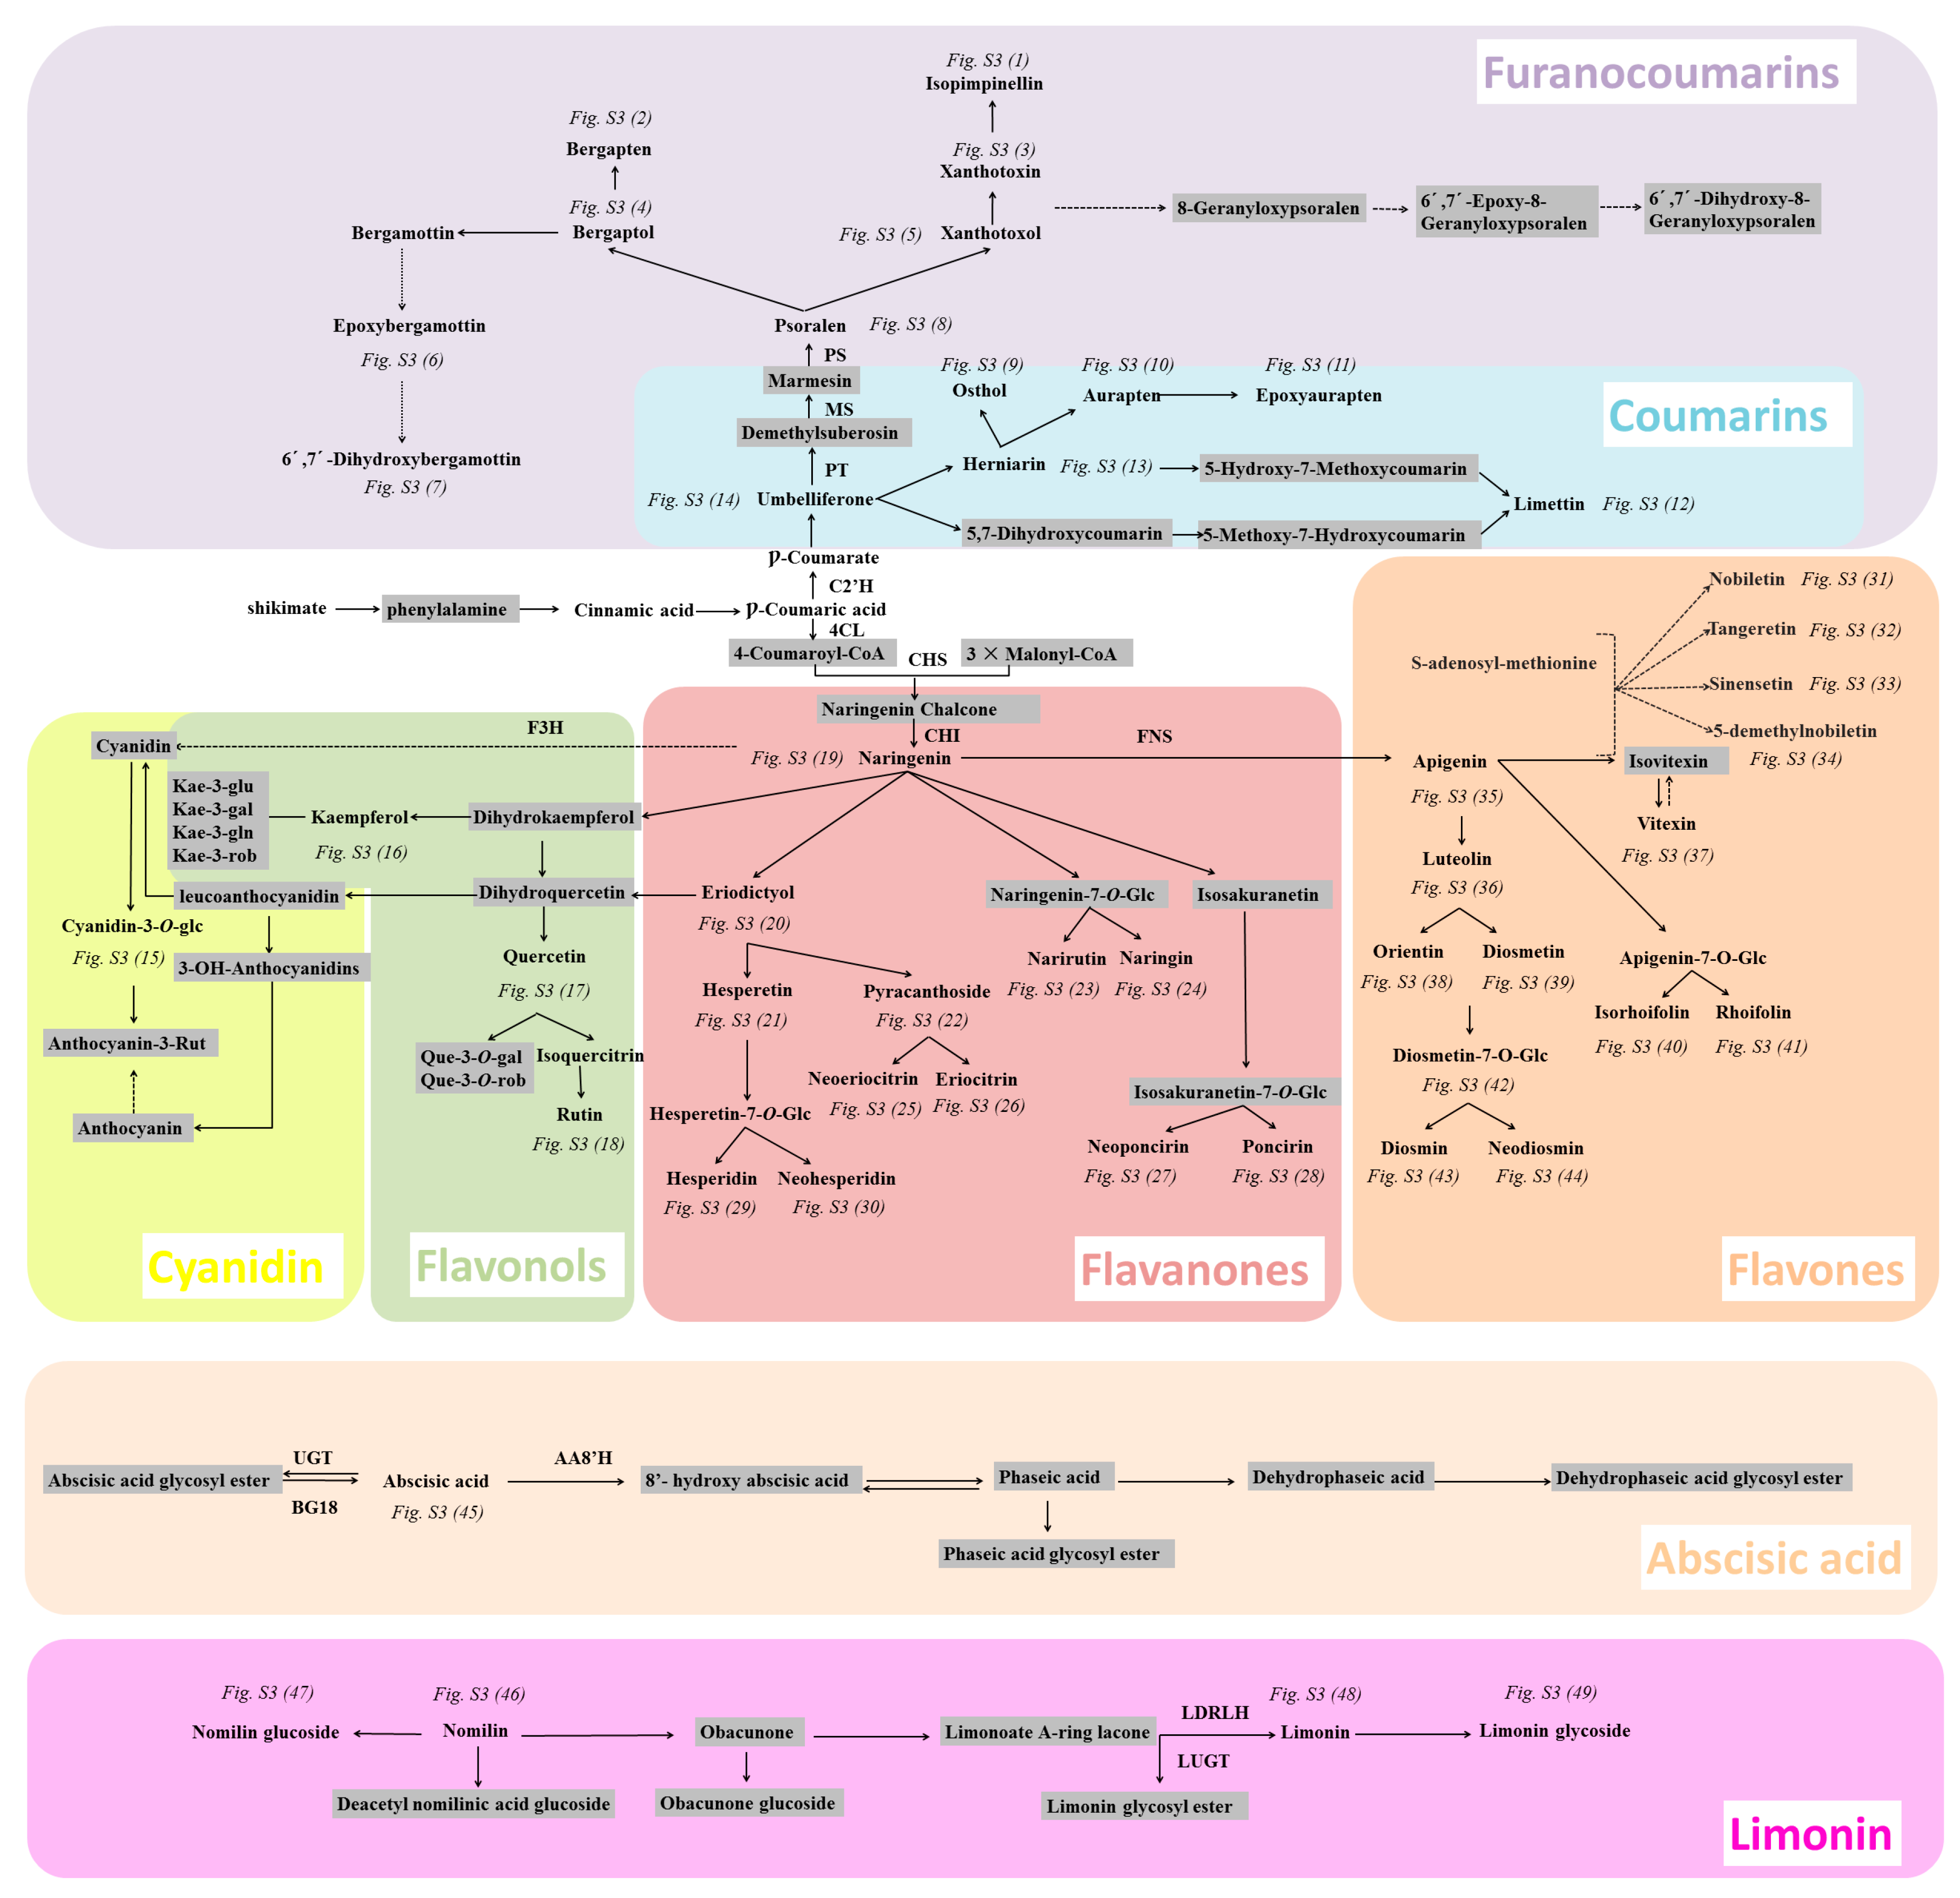
2.5.2. Analyzing a Wide Range of Secondary Metabolites to Understand the Metabolic Network

Flavonoids: This class of metabolites has great bioactivities, such as antioxidant activity, antifungal activity, antiparasitic activity and the beneficial health properties of Citrus. Indeed, the high radical scavenging activity in Citrus has been almost rarely associated with flavonoids and other phenolic constituents. In this study, from the same flavanone core, several following derivatives were identified by substitution with methyl groups or hexose moieties: naringin, hesperidin, narirutin, neohesperidin and eriodictyol (Figure 7 and Table 2). Among this group, the most widespread compounds were hesperidin, narirutin, sakuranetin and eriodictyol 7-O-neohesperidoside. These flavanone metabolites appeared to be found at higher concentrations in C. aurantium L. species. Regarding the ripening stage, hesperetin, hesperidin, neohesperidin and neoeriocitrin were marked as markers. The synthesis of flavonoid has been reported to start from the flavanone naringenin by continuous transfer of glycosyl groups (a first step by which glucose is transferred to oxygen in position 7, generating a 7-O-glucoside). In turn, a 1,6 rhamnosyl transferase renders the hesperidosides (or rutinosides) hesperidin and narirutin. Conversely, the action of 1,2 rhamnosyl transferase on flavanone 7-O-hexosides generates the neohesperidosides neohesperidin and naringin [40].
Flavone and flavonols: Flavones and flavonols synthesized from the same flavanone naringenin by hydroxylation include isorhamnetin, kaempferol and quercetin. One of the most important flavonols, rutin, has shown the highest accumulation in immature samples, which was the most different from other flavonols. This may be representative of a better flavonoid 3-monooxygenase activity in these imam ture samples. Moreover, isorhamnetin 3-O-rutinoside also showed a higher accumulation in immature samples and was derived from the addition of a hexose moiety to oxygen at position 3 catalyzed [40]. In our investigation, the variation trends of flavonol/flavone glycosides were found to depend on both aglycone species and ripening stages (Figure 7). The flavonoid content, as observed for apigenin, luteolin, chrysoeriol, vitexin-2-Orhamnoside, diosmetin, tetramethyl-isoscutellarein, sinensetin, tangeretin, nobiletin, diosmin, neodiosmin, luteolin-3′-7-di-O-glucoside, diosmetin-7-O-Glucoside, 5-demethylnobiletin and vitexin, was significantly elevated in QP samples and especially in ZS samples. By contrast, orientin and myricetin had higher contents in mature samples, both in CP and ZQ samples. Almost all of the flavonoids were markers in both the ripened stage and in spices; however, polymethoxylated flavones, such as sinensetin, tangeretin and 5-demethylnobiletin, did not perform well in the identified species.
Regarding flavonoids, temperature has an important effect on the biosynthesis and accumulation of phenolics in many plant species. Sub-groups of flavonoids were shown to be differently affected, which might be plant species dependent. For instance, flavonol in tomato increased when the temperature was low (18–12 °C), whereas grape plants grew under high temperatures (30–35 °C) [41]. Zhang et al. reported that lower temperature decreased flavonols and their glycosides in tea species [42].
Coumarins: The pathway of coumarin biosynthesis was largely discovered during the 1960s and 1970s, with the help of tracer feeding experiments. Some research indicated that umbelliferon is derived from cis-coumaric acid, whereas coumarin originates from cis-cinnamic acid [43]. As the beginning of coumarin biosynthesis, umbelliferon plays an important role in both the discrimination of species and ripening stage. For other coumarins, aurapten, epoxyaurapten and limettin have been identified as reflecting the ripening stage and species, whereas herniarin, 5,7-dihydroxycoumarin and 5-methoxy-7-hydroxycoumarin were only ripening stage factors [44].
While coumarin biosynthesis has remained a black box, several enzymes of the furanocoumarin pathway were isolated and characterized. Umbelliferone, rather than coumarin, is also the parent compound of furanocoumarins, as was reported a long time ago [44]. It is first prenylated at the 8-position for angular furanocoumarins to yield psoralen as the furanocoumarin beginning. Furanocoumarin performed well in identifying Citrus. Xanthotoxol, bergaptol, psoralen, xanthotoxin and bergapten 6′-7′-dihydroxybergamottin were both markers of species and ripening stages, and almost all furanocoumarin had a higher content in the C. aurantium L. species.
Abscisic acid (ABA) and derivatives: The pathway starting from ABA has two major branches: the catabolic and conjugating branches. The catabolic branch starts with the transfer of ABA into 8′-hydroxy ABA, which is catalyzed by ABA 8′-hydroxylase and then isomerizes to phaseic acid (PA). This metabolite will further catabolize to dehydrophaseic acid (DPA). The conjugating branch involves the temporary storage of ABA into a glycosylated form, catalyzed by an UDP-ABA glycosyl transferase (Figure 7). Actually, in this research, ABA had a higher content in mature samples [45].
Limonoids and glycosides: Limonoids are highly oxygenated triterpenes that are present in Rutaceae and Meliaceae. These metabolites are derived from squalene, although the first true limonoid precursor is nomilin, which can be directly glucosylated by a limonoid UDP-glucosyl transferase or also deacetylated (Figure 7), rendering obacunone [45]. All of the limonoids had higher contents in the C. aurantium L. species, especially in ZQ samples. Limonin could be used as a marker of the ripening stages in our study, and three other limonoids were both markers of ripening stage and species.
The phenylpropanoid biosynthesis, flavone and flavonol biosynthesis and flavonoid biosynthesis pathways are the most critical pathways for the synthesis of characteristic phenolic metabolites, including flavones, flavonols, flavanones and their glycosides, abscisic acid and procyanidins. Flavonoids have been reported to be lower in Citrus that is cultured in low temperature and low sun exposure conditions. Herein, we mapped the changes of metabolites involved in these pathways in Figure 7. The level of shikimate, which is a substrate of the phenylpropanoid biosynthesis pathway, was lower in CP and ZQ than in QP and ZS. At the same time, downstream metabolite products, such as cis-coumaric acid, abscisic acid, flavone glycosides, flavan-3-ols, procyanidins, coumarin and furanocoumarin, were significantly higher, which indicated more vigorous biosynthesis of phenolic secondary metabolites in QP and ZS than in CP and ZS. These results agreed with the study showing that the expression of structural genes encoding biosynthesis of flavonoids and the activity of some important enzymes increased under high light intensity and therefore led to a subsequent increase in the contents of flavonoids. This work paves the way for further analyses aiming to describe the control of the metabolism of phenolic metabolites in Citrus in response to genetic and ripening factors.

3. Materials and Methods

3.1. Chemicals and Reagents

HPLC-grade methanol was obtained from Fisher Scientific (Fair Lawn, NJ, USA). The deionized water was redistilled. Formic acid (HPLC grade, Lot. 095224) was obtained from MREDA Technology Inc. (Palo Alto, CA, USA). 7-hydroxycoumarin, bergapten and narirutin were obtained from Chengdu Must Bio-Technology Co., Ltd. (Chengdu, China). Hesperidin, naringin, apigetrin, kaempferitrin, diosmetin-7-O-glucoside and sinensetin were obtained from Shanghai Source Leaf Biological Technology Co., Ltd. (Shanghai, China). Eriocitrin, neohesperidin, naringenin, hesperetin, luteolin, rutin, quercetin, and tangeretin were obtained from Tianjin Mark Biological Technology Co., Ltd. (Tianjin, China). 5-femethylnobiletin, nobiletin, auraptene and bergamottin were obtained from Nanjing JingZhu Biological Technology Co., Ltd. (Nanjing, China). Rhoifolin, apigenin, scoparone, isorhamnetin-3-O-glucoside and diosmetin were purchased from the National Institute for Control of Biological and Pharmaceutical Products of China. Poncirin, eriodictyol, xanthotoxol, acacetin, isosakuranetin, imperatorin, limonin, nomilin and abscisic acid were purchased from Beijing Fufan Biological Technology Co., Ltd. (Beijing, China). The purity of the standards was relatively high (i.e., higher than 98%).

3.2. Sample Preparation

3.2.1. Reference Standard Solution

Reference standards were dissolved in 50% methanol (1.0 mg/mL) and then stored at 4 °C until analysis.

3.2.2. Extraction of Plant Material

A total of 37 batches of four different Citrus medicinal plants were collected from the Jiangxi, Sichuan, Hunan, Hubei and Zhejiang provinces and Chongqing municipality in China. (Table 3) Dried voucher specimens were deposited at the Institute of Basic Theory, China Academy of Chinese Medical Sciences, Beijing, China. The samples used for ACQUITY UPLC HSS T3 column extract detection were pulverized and sifted through a 60-mesh sieve. The method of sample preparation established and validated in our previous study was used. Accurately weighed powder (1.0 g) was placed in a conical flask. The material was sonicated three times with 10 mL of 50% MeOH for 30 min. The extraction solutions were filtered. The supernatant solution was combined and filtered through a 0.22-μm filter membrane. Each sample was extracted in parallel three times and then analyzed by UPLC-Q-TOF-MS.
As the samples for the ACQUITY UPLC BEH HILIC column method, the dried powder (1.0 g) was weighed accurately into a 10-mL conical flask with a stopper, and 10 mL water were added accurately. After weighing the filled flask accurately, ultrasonication (40 kHz) was carried out at room temperature for 30 min, then weighing again, and the same solvent (water) was added to compensate for the lost weight during the extraction as needed. After centrifugation (15,000× g, 10 min), the supernatant was stored at 4 °C and filtered through a 0.22-μm polytetrafluoroethylene filter before injection into the HILIC-UPLC-Q-TOF/MS system for analysis.
The extraction protocols and the repeatability data of samples have been reported in our pervious article [19,46].

3.3. Chromatographic Conditions

Chromatographic separation was performed on the Waters ACQUITY UPLC System (Waters Corp. Milford, MA, USA), equipped with a binary solvent delivery system and an autosampler. The extracts were performed on an ACQUITY UPLC HSS T3 column (100 mm × 2.1 mm, 1.8 μm). Water with 0.1% (v/v) formic acid and acetonitrile were used as Mobile Phases A and B, respectively, for chromatographic elution: from 0–2 min, Phase B was linearly increased from 0–20%, then linearly increased to 50% at 7.0 min and after that, linearly increased to 100% at 11 min and maintained for 3.0 min; Phase B was adjusted to 0% at 14.1 min for re-equilibration and maintained for 0.9 min. The total elapsed time required for a given chromatographic analysis was thus 15.0 min. The columns were maintained at 45 °C and eluted at a flow rate of 0.30 mL/min. The injection volume was 2 μL. The chromatograms of ACQUITY UPLC HSS T3 column have been put in the Supplemental Materials (Figure S8).
The extracts of samples were performed on the ACQUITY UPLC BEH HILIC column (100 mm × 2.1 mm, 1.7 μm). With the same Mobile Phases A and B with the ACQUITY UPLC HSS T3 column method, the gradient program for these samples was: from 0–1 min, 99% Phase B, then decreased at 70% B from 1–10 min, and remained at 99% Phase B from 10–15 min. The chromatograms of the ACQUITY UPLC BEH HILIC column have been put in the Supplemental Materials (Figure S9).
On the other side, we have demonstrated the chromatographic conditions in our pervious research [19].

3.4. Mass Spectrometry Condition

Mass spectrometry data were collected by using a Q-TOF analyzer in a Xevo G2 QTOF Mass system (Waters Corporation, Milford, MA, USA) in both positive and negative ion modes. The source temperature was set at 100 °C with a cone gas flow of 25.0 L/h, a desolvation gas flow of 800.0 L/h and a desolvation gas temperature of 400 °C. For the positive and negative ion modes, the capillary voltage was set to 3.0 kV, and the cone voltage was set to 40 V. The mass spectrometric data were collected in centroid mode from m/z 50–1200 with a scan time of 0.1 s and an interscan delay of 0.014 s over a 15.0-min analysis time. Leucine-enkephalin was used as the lock mass (m/z 556.2771 in positive mode and m/z 554.2615 in negative mode) at a concentration of 0.5 μg/mL with a flow rate of 30 μL/min The lock spray frequency was set at 20 s, and the lock mass data were averaged over 10 scans for correction. Compared with the negative ion mode, positive ion mode performed well in this study.

3.5. Data Processing and Statistical Analysis

Raw data files acquired from the UPLC-Q-TOF/MS analysis were imported into the Progenesis QI (Waters, Manchester, U.K.), which is used for UPLC-Q-TOF/MS data processing and database researching to pathway interrogation, to generate a peak table that included information on retention time, mass-to-charge ratio (m/z) and MS intensity of the metabolites in the sample. Additionally, the retention time tolerance and mass tolerance for the peak alignment were set to 0.20 and 0.05, respectively.
In order to perform the multivariate statistical analysis, the data we obtained from the UPLC-Q-TOF/MS including sample names (observations), the arbitrary compound index (m/z) and peak areas (variables) were introduced into the SIMCA-P 13.5 software (Umetric, Umeå, Sweden). The raw data were subjected to principal component analysis (PCA) to visualize general clustering, trends or outliers among the observations. Partial least-squares discriminant analysis (PLS-DA) was utilized to validate the PCA model and identify the differential metabolites. R2 represented the explanation capacity of the model (R2X and R2Y represent the fraction of the variance of X matrix and Y matrix), whereas Q2 suggested the predictive accuracy of the model. The cumulative values of R2X, R2Y and Q2 close to 1 meant an excellent model. The differential metabolites were selected by the statistically-significant threshold of the variable influence on projection (VIP) values. Heat-map analysis, pathway analysis and ROC curves were performed using MetaboAnalyst 3.0, which is an open bioinformatics website for metabolite data interpretation. The significance level of the metabolite differences between groups was calculated by Student’s t-test using the SPSS software (Version 22.0, International Business Machines Corp., Armonk, NY, USA). Results were considered significant when the p-value was less than 0.05.
Putative metabolites were first derived by searching the exact molecular mass data from redundant m/z peaks against the online HMDB (http://www.hmdb.ca/), PubMed (http://www. ncbi.nlm.nih.gov/pubmed/), LMSD (http://www.lipidmaps.org/), KEGG (http://www.kegg.jp/) and ChemSpider (http://www.chemspider.com) databases. A specific metabolite would be sieved out when a match with a difference between observed and theoretical mass was less than 5 ppm. Then, the metabolite molecular formula of matched metabolites was further identified by the isotopic distribution measurement.

4. Conclusions

In this study, a metabolomics-guided chemotaxonomic classification strategy was applied to investigate four closely-related Citrus TCMs. A UPLC-Q-TOF-MS method was employed for the analysis of primary and secondary metabolites from Citrus TCMs with different species and ripening stages. It indicated that different Citrus TCMs have different metabolic profiles depending on genotype-regulated primary/secondary metabolites and that the development stage influenced secondary metabolites, which could have an impact on Citrus nutritional properties for quality control and efficient clinical usage. Thus, the genotype is expected to be the major contributing factor in determining fruit compositional properties related to species; however, it is worth noting that different growth stages may give rise to new varieties that can also affect the fruit chemical composition. Moreover, multivariate statistical analysis coupled with MetaboAnalyst permits a comprehensive depiction of the variable chemotaxonomic markers and the elucidation of the biosynthesis mechanism of Citrus TCMs from different species and different ripening stages. The top three metabolic pathways with an impact value >0.2 influencing the species were glycerophospholipid metabolism, cyanoamino acid metabolism and flavone and flavonol biosynthesis. Meanwhile, three of the metabolic pathways were considered to be the most pertinent to the ripening stages in both the QP/CP and ZS/ZQ groups, including flavone and flavonol biosynthesis, flavonoid biosynthesis and phenylpropanoid biosynthesis.

Supplementary Materials

The supplementary materials are available online.

Acknowledgments

This study was financially supported by the National Science Foundation of China (Project Nos. 81573569, 81470177, 81001623 and 81373773), the Beijing Nova Program (xx2014B073), the Beijing Natural Science Foundation (No. 7142144) and the Fundamental Research Funds for the Central public welfare research institutes (No. YZ-1714); also supported by the long-term subsidy mechanism from the Ministry of Finance and the Ministry of Education of PRC for BUCT.

Author Contributions

Y.-Y.L., C.L., Z.-L.L. and A.-P.L. provided the concept and designed the study. S.-Y.Z., Y.-S.S. and Z.-Q.S. conducted the analyses and wrote the manuscript. S.-Y.Z., M.-L.W., D.H., H.-L.Z. and Z.-C.N. participated in the research. All authors have read and approved the final manuscript.

Conflicts of Interest

The authors declare no conflict of interest. The founding sponsors had no role in the design of the study; in the collection, analyses or interpretation of data; in the writing of the manuscript; nor in the decision to publish the results.

References

  1. Zhou, J.; Qi, L.; Li, P. Herbal medicine analysis by liquid chromatography/time-of-flight mass spectrometry. J. Chromgr. A 2009, 1216, 7582–7594. [Google Scholar] [CrossRef] [PubMed]
  2. Zhu, H.; Bi, K.; Han, F.; Guan, J.; Zhang, X.; Mao, X.; Zhao, L.; Li, Q.; Hou, X.; Yin, R. Identification of the absorbed components and metabolites of Zhi-Zi-Da-Huang decoction in rat plasma by ultra-high performance liquid chromatography coupled with quadrupole-time-of-flight mass spectrometry. J. Pharm. Biomed. 2015, 111, 277–287. [Google Scholar] [CrossRef] [PubMed]
  3. Xu, M.; Heidmarsson, S.; Olafsdottir, E.S.; Buonfiglio, R.; Kogej, T.; Omarsdottir, S. Secondary metabolites from cetrarioid lichens: Chemotaxonomy, biological activities and pharmaceutical potential. Phytomedicine 2016, 23, 441–459. [Google Scholar] [CrossRef] [PubMed]
  4. Cai, Y.; Li, X.; Wang, R.; Yang, Q.; Li, P.; Hu, H. Quality Traceability System of Traditional Chinese Medicine Based on Two Dimensional Barcode Using Mobile Intelligent Technology. PLoS ONE 2016, 11, e165263. [Google Scholar] [CrossRef] [PubMed]
  5. Li, P.; Qi, L.; Liu, E.; Zhou, J.; Wen, X. Analysis of Chinese herbal medicines with holistic approaches and integrated evaluation models. Trends Anal. Chem. 2008, 27, 66–77. [Google Scholar] [CrossRef]
  6. Jing, L.; Lei, Z.; Zhang, G.; Pilon, A.C.; Huhman, D.V.; Xie, R.; Xi, W.; Zhou, Z.; Sumner, L.W. Metabolite profiles of essential oils in citrus peels and their taxonomic implications. Metabolomics 2015, 11, 952–963. [Google Scholar] [CrossRef]
  7. Bijttebier, S.; Van der Auwera, A.; Foubert, K.; Voorspoels, S.; Pieters, L.; Apers, S. Bridging the gap between comprehensive extraction protocols in plant metabolomics studies and method validation. Anal. Chim. Acta 2016, 935, 136–150. [Google Scholar] [CrossRef] [PubMed]
  8. Braunberger, C.; Zehl, M.; Conrad, J.; Wawrosch, C.; Strohbach, J.; Beifuss, U.; Krenn, L. Flavonoids as chemotaxonomic markers in the genus Drosera. Phytochemistry 2015, 118, 74–82. [Google Scholar] [CrossRef] [PubMed]
  9. Kim, Y.M.; Lee, J.; Park, S.; Lee, C.; Lee, J.W.; Lee, D.; Kim, N.; Lee, D.; Kim, H.Y.; Lee, C.H. LC–MS-based chemotaxonomic classification of wild-type Lespedeza sp. and its correlation with genotype. Plant Cell Rep. 2012, 31, 2085–2097. [Google Scholar] [CrossRef] [PubMed]
  10. Sandasi, M.; Kamatou, G.P.P.; Viljoen, A.M. An untargeted metabolomic approach in the chemotaxonomic assessment of two Salvia species as a potential source of α-bisabolol. Phytochemistry 2012, 84, 94–101. [Google Scholar] [CrossRef] [PubMed]
  11. Liu, Z.; Liu, Y.; Liu, C.; Song, Z.; Li, Q.; Zha, Q.; Lu, C.; Wang, C.; Ning, Z.; Zhang, Y.; et al. The chemotaxonomic classification of Rhodiola plants and its correlation with morphological characteristics and genetic taxonomy. Chem. Cent. J. 2013, 7, 118. [Google Scholar] [CrossRef] [PubMed]
  12. Ning, Z.; Lu, C.; Zhang, Y.; Zhao, S.; Liu, B.; Xu, X.; Liu, Y. Application of plant metabonomics in quality assessment for large-scale production of traditional Chinese medicine. Planta Med. 2013, 79, 897–908. [Google Scholar] [CrossRef] [PubMed]
  13. Ma, C.; Gao, W.; Gao, Y.; Man, S.; Huang, L.; Liu, C. Identification of chemical constituents in extracts and rat plasma from Fructus Aurantii by UPLC-PDA-Q-TOF/MS. Phytochem. Anal. 2011, 22, 112–118. [Google Scholar] [CrossRef] [PubMed]
  14. Lv, X.; Zhao, S.; Ning, Z.; Zeng, H.; Shu, Y.; Tao, O.; Xiao, C.; Lu, C.; Liu, Y. Citrus fruits as a treasure trove of active natural metabolites that potentially provide benefits for human health. Chem. Cent. J. 2015, 9, 68–73. [Google Scholar] [CrossRef] [PubMed]
  15. Chinese Pharmacopoeia Commission (CPC). Pharmacopoeia of the People’s Republic of China; Chinese Medical Science and Technology Press: Beijing, China, 2015; Volume 1, pp. 191, 197, 246–247. [Google Scholar]
  16. Chen, H.; Zhang, W.; Yuan, J.; Li, Y.; Yang, S.; Yang, W. Simultaneous quantification of polymethoxylated flavones and coumarins in Fructus aurantii and Fructus aurantii immaturus using HPLC-ESI-MS/MS. J. Pharm. Biomed. 2012, 59, 90–95. [Google Scholar] [CrossRef] [PubMed]
  17. Wang, C.; Pan, Y.; Fan, G.; Chai, Y.; Wu, Y. Application of an efficient strategy based on MAE, HPLC-DAD-MS/MS and HSCCC for the rapid extraction, identification, separation and purification of flavonoids from Fructus Aurantii Immaturus. Biomed. Chromatogr. 2010, 24, 235–244. [Google Scholar] [CrossRef] [PubMed]
  18. Barreca, D.; Bellocco, E.; Caristi, C.; Leuzzi, U.; Gattuso, G. Distribution of C- and O-glycosyl flavonoids, (3-hydroxy-3-methylglutaryl)glycosyl flavanones and furocoumarins in Citrus aurantium L. juice. Food Chem. 2011, 124, 576–582. [Google Scholar] [CrossRef]
  19. Zeng, H.; Liu, Z.; Zhao, S.; Shu, Y.; Song, Z.; Wang, C.; Dong, Y.; Ning, Z.; He, D.; Wang, M.; et al. Preparation and quantification of the total phenolic products in Citrus fruit using solid-phase extraction coupled with high-performance liquid chromatography with diode array and UV detection. J. Sep. Sci. 2016, 39, 3806–3817. [Google Scholar] [CrossRef] [PubMed]
  20. Fernie, A.R.; Schauer, N. Metabolomics-assisted breeding: A viable option for crop improvement? Trends Genet. 2009, 25, 39–48. [Google Scholar] [CrossRef] [PubMed]
  21. Wen, W.; Li, K.; Alseekh, S.; Omranian, N.; Zhao, L.; Zhou, Y.; Xiao, Y.; Jin, M.; Yang, N.; Liu, H.; et al. Genetic Determinants of the Network of Primary Metabolism and Their Relationships to Plant Performance in a Maize Recombinant Inbred Line Population. Plant Cell 2015, 27, 1839–1856. [Google Scholar] [CrossRef] [PubMed]
  22. Lisec, J.; Meyer, R.C.; Steinfath, M.; Redestig, H.; Becher, M.; Witucka-Wall, H.; Fiehn, O.; Torjek, O.; Selbig, J.; Altmann, T.; et al. Identification of metabolic and biomass QTL in Arabidopsis thaliana in a parallel analysis of RIL and IL populations. Plant J. 2008, 53, 960–972. [Google Scholar] [CrossRef] [PubMed]
  23. Fahy, E.; Sud, M.; Cotter, D.; Subramaniam, S. LIPID MAPS online tools for lipid research. Nucleic Acids Res. 2007, 35, W606–W612. [Google Scholar] [CrossRef] [PubMed]
  24. Hurlock, A.K.; Roston, R.L.; Wang, K.; Benning, C. Lipid Trafficking in Plant Cells. Traffic 2014, 15, 915–932. [Google Scholar] [CrossRef] [PubMed]
  25. Michaud, M.; Prinz, W.A.; Jouhet, J. Glycerolipid synthesis and lipid trafficking in plant mitochondria. FEBS J. 2016, 284, 376–390. [Google Scholar] [CrossRef] [PubMed]
  26. Schmid, K.M. Lipid Metabolism in Plants. In Biochemistry of Lipids, Lipoproteins and Membranes, 6th ed.; Elsevier: Amsterdam, The Netherlands, 2015; Chapter 4; pp. 113–147. [Google Scholar]
  27. Kennedy, E.P. Biosynthesis of complex lipids. Fed. Proc. 1961, 20, 934–940. [Google Scholar] [PubMed]
  28. Guo, S.; Duan, J.; Qian, D.; Tang, Y.; Qian, Y.; Wu, D.; Su, S.; Shang, E. Rapid Determination of Amino Acids in Fruits of Ziziphus jujubaby Hydrophilic Interaction Ultra-High-Performance Liquid Chromatography Coupled with Triple-Quadrupole Mass Spectrometry. J. Agric. Food Chem. 2013, 61, 2709–2719. [Google Scholar] [CrossRef] [PubMed]
  29. Guo, S.; Duan, J.; Qian, D.; Wang, H.; Tang, Y.; Qian, Y.; Wu, D.; Su, S.; Shang, E. Hydrophilic interaction ultra-high performance liquid chromatography coupled with triple quadrupole mass spectrometry for determination of nucleotides, nucleosides and nucleobases in Ziziphus plants. J. Chromatogr. A 2013, 1301, 147–155. [Google Scholar] [CrossRef] [PubMed]
  30. Durand-Hulak, M.; Dugrand, A.; Duval, T.; Bidel, L.P.R.; Jay-Allemand, C.; Froelicher, Y.; Bourgaud, F.; Fanciullino, A.L. Mapping the genetic and tissular diversity of 64 phenolic compounds in Citrus species using a UPLC-MS approach. Ann. Bot-Lond. 2015, 115, 861–877. [Google Scholar] [CrossRef] [PubMed]
  31. Agati, G.; Azzarello, E.; Pollastri, S.; Tattini, M. Flavonoids as antioxidants in plants: Location and functional significance. Plant Sci. 2012, 196, 67–76. [Google Scholar] [CrossRef] [PubMed]
  32. Agati, G.; Brunetti, C.; Di Ferdinando, M.; Ferrini, F.; Pollastri, S.; Tattini, M. Functional roles of flavonoids in photoprotection: New evidence, lessons from the past. Plant Physiol. Biochem. 2013, 72, 35–45. [Google Scholar] [CrossRef] [PubMed]
  33. Cheynier, V. Polyphenols in foods are more complex than often thought. Am. J. Clin. Nutr. 2005, 81, 223S–229S. [Google Scholar] [PubMed]
  34. Da Costa, D.; E Silva, C.; Pinheiro, A.; Frommenwiler, D.; Arruda, M.; Guilhon, G.; Alves, C.; Arruda, A.; Da Silva, M. Using LC and Hierarchical Cluster Analysis as Tools to Distinguish Timbó Collections into Two Deguelia Species: A Contribution to Chemotaxonomy. Molecules 2016, 21, 569. [Google Scholar] [CrossRef] [PubMed]
  35. Jia, H.; Li, Q.; Zhou, C.; Yu, M.; Yang, Y.; Zhang, H.; Ding, G.; Shang, H.; Zou, Z. Chronic unpredictive mild stress leads to altered hepatic metabolic profile and gene expression. Sci. Rep. 2016, 6, 23441. [Google Scholar] [CrossRef] [PubMed]
  36. Sarangowa, O.; Kanazawa, T.; Nishizawa, M.; Myoda, T.; Bai, C.; Yamagishi, T. Flavonol glycosides in the petal of Rosa species as chemotaxonomic markers. Phytochemistry 2014, 107, 61–68. [Google Scholar] [CrossRef] [PubMed]
  37. Alcalde-Eon, C.; García-Estévez, I.; Rivas-Gonzalo, J.C.; De La Cruz, D.R.; Escribano-Bailón, M.T. Anthocyanins of the anthers as chemotaxonomic markers in the genus Populus L. Differentiation between Populus nigra, Populus alba and Populus tremula. Phytochemistry 2016, 128, 35–49. [Google Scholar] [CrossRef] [PubMed]
  38. Xia, J.; Sinelnikov, I.V.; Han, B.; Wishart, D.S. MetaboAnalyst 3.0—Making metabolomics more meaningful. Nucleic Acids Res. 2015, 43, W251–W257. [Google Scholar] [CrossRef] [PubMed]
  39. Plackett, P.L.; Burman, J.P. The design of optimum multifactorial experiments. Biometrike 1946, 33, 305–325. [Google Scholar] [CrossRef]
  40. Frydman, A.; Liberman, R.; Huhman, D.V.; Carmeli-Weissberg, M.; Sapir-Mir, M.; Ophir, R.; W Sumner, L.; Eyal, Y. The molecular and enzymatic basis of bitter/non-bitter flavor of citrus fruit: Evolution of branch-forming rhamnosyltransferases under domestication. Plant J. 2013, 73, 166–178. [Google Scholar] [CrossRef] [PubMed]
  41. Dai, W.; Qi, D.; Yang, T.; Lv, H.; Guo, L.; Zhang, Y.; Zhu, Y.; Peng, Q.; Xie, D.; Tan, J.; et al. Nontargeted Analysis Using Ultraperformance Liquid Chromatography–Quadrupole Time-of-Flight Mass Spectrometry Uncovers the Effects of Harvest Season on the Metabolites and Taste Quality of Tea (Camellia sinensis L.). J. Agric. Food Chem. 2015, 63, 9869–9878. [Google Scholar] [CrossRef] [PubMed]
  42. Zhang, Q.; Shi, Y.; Ma, L.; Yi, X.; Ruan, J. Metabolomic analysis using ultra-performance liquid chromatography-quadrupole-time of flight mass spectrometry (UPLC-Q-TOF MS) uncovers the effects of light intensity and temperature under shading treatments on the metabolites in tea. PLoS ONE 2014, 9, e112572. [Google Scholar] [CrossRef] [PubMed]
  43. Metternich, J.B.; Gilmour, R. One Photocatalyst, Activation Modes Strategy for Cascade Catalysis: Emulating Coumarin Biosynthesis with (−)-Riboflavin. J. Am. Chem. Soc. 2016, 138, 1040–1045. [Google Scholar] [CrossRef] [PubMed]
  44. Bourgaud, F.; Hehn, A.; Larbat, R.; Doerper, S.; Gontier, E.; Kellner, S.; Matern, U. Biosynthesis of coumarins in plants: A major pathway still to be unravelled for cytochrome P450 enzymes. Phytochem. Rev. 2006, 5, 293–308. [Google Scholar] [CrossRef]
  45. Arbona, V.; Iglesias, D.J.; Gómez-Cadenas, A. Non-targeted metabolite profiling of citrus juices as a tool for variety discrimination and metabolite flow analysis. BMC Plant Biol. 2015, 15, 38. [Google Scholar] [CrossRef] [PubMed]
  46. Shu, Y.; Liu, Z.; Zhao, S.; Song, Z.; He, D.; Wang, M.; Zeng, H.; Lu, C.; Lu, A.; Liu, Y. Integrated and global pseudotargeted metabolomics strategy applied to screening for quality control markers of Citrus TCMs. Anal. Bioanal. Chem. 2017, 409, 4849–4865. [Google Scholar] [CrossRef] [PubMed]
Sample Availability: Samples of the compounds are not available from the authors.
Figure 1. The PCA plot of primary metabolites using SIMCA (13.0 version). The data are UV scaled.
Molecules 22 01721 g001
Figure 2. Multivariate statistical analysis of secondary metabolites: (A) PCA score plot; (B) PLS-DA score plot; (C) S-plot of PLS-DA (VIP > 1.0 have been marked); (D) cross-validation plot of the PLS-DA model with 100 permutation tests. The most differential compounds are marked with red triangles.
Molecules 22 01721 g002
Figure 3. Heat-map of metabolite contents in Qingpi, Chenpi, Zhishi and Zhiqiao. The data are UV scaled.
Molecules 22 01721 g003
Figure 4. Hierarchical cluster analysis (HCA) of Citrus samples. (A) The dendrogram of primary metabolites between the production of Citrus reticulate Blanco and Citrus aurantium L. in the species; (B) the dendrogram of secondary metabolites between Citrus samples.
Molecules 22 01721 g004
Figure 5. OPLS-DA score plots and loading S-plots of metabolites analyzed by UPLC-Q-TOF/MS in Citrus samples with the QP/CP group, ZS/ZQ group and CR/CA group. (A) Qingpi vs. Chenpi group; (B) Zhishi vs Zhiqiao group; (C) Citrus reticulate Blanco vs. Citrus aurantium L. group. The most differential compounds are marked with red triangles.
Molecules 22 01721 g005
Figure 6. Pathway analysis of the identified metabolites. Each point represents one metabolic pathway; the size of the dot and shades of color represent a positive correlation with the impaction of the metabolic pathway. (A) The pathway analysis of the identified metabolites of the QP/CP group; (B) the pathway analysis of the identified metabolites of the ZS/ZQ group; (C) the pathway analysis of the identified metabolites of the CR/CA group.
Molecules 22 01721 g006
Figure 7. Comparison of the biosynthesis and accumulation of metabolites between Citrus samples. A simplified polyphenol biosynthetic pathway, starting from phenylalanine, was constructed on the basis of ‘omics’ data from previous studies on Citrus. The PB test was performed to investigate which factors significantly affected the different markers and is shown in Figure S3. Abbreviations for the main enzymes: CHS, chalcone synthase; CHI, chalcone isomerase; C2′H, cis-coumaroyl CoA 20-hydroxylase; C4H, cinnamate-4-hydroxylase; 4CL, 4-coumarate CoA ligase; F3H, flavanone 3-hydroxylase; FNS, flavone synthase; MS, marmesin synthase; PAL, phenylalanine ammonia lyase; PT, prenyltransferase; PS, psoralen synthase; BG18, beta-glucosidase 18; UGP, UDP-glucosyl transferase; AA8′H, abscisic acid 8′ hydroxylase; LDRLH, limonoid D-ring lactone hydrolase; LUGT, limonin UDP-glycosyl transferase. Compounds in grey are unidentified.
Molecules 22 01721 g007
Table 1. Differential primary metabolites between the Citrus reticulate Blanco and Citrus aurantium L. group profile in positive and negative ion modes. GPA (glycerophosphatidic acid); MG (monogalactosyl); PE (phosphatidylethanolamine); DG (diacylglycerol); GPEtn (glycerophosphoethanolamine); PC (phosphatidylcholine); GPIns (Glycerophosphatidylinositol), GPSer (Glycerophosphatidylserine acid), GPGro (Glycerophosphatidylglycerol); UMP (Uridine monophosphate).
No.Retention Time (RT)Formula[M + H]+ m/z[M − H] m/zIdentificationp ValueAUCMetabolic Pathways
DetectedMass ErrorDetectedMass Error
M14.38C10H13NO2180.10241.9--3,5-Dimethylphenyl methylcarbamate8.77 × 10−91.0000Not known
M26.52C10H19O8P299.08920.7--GPA(5:0/2:0)/GPA(2:0/5:0)0.00101.0000Glycerophospholipid metabolism
M32.91C11H12N2173.1079−0.8171.1077−1.61,2,3,4-Tetrahydro-beta-carboline2.63 × 10−61.0000Not known
M47.06C14H27O8P355.1523−0.4--GPA(9:0/2:0)/GPA(2:0/9:0)1.93 × 10−91.0000Glycerophospholipid metabolism
M58.73C15H28O8P369.1681−0.9--GPA(10:0/2:0)/GPA(2:0/10:0)3.99 × 10−71.0000Glycerophospholipid metabolism
M64.75C18H35O8P411.21684.9--GPA(10:0/5:0)/GPA(5:0/10:0)1.37 × 10−81.0000Glycerophospholipid metabolism
M79.71C18H36O4339.25142.6--MG(15:0/0:0/0:0)3.95 × 10−51.0000Not known
M89.32C19H35O8P423.2139−0.7--GPA(14:1/2:0)/GPA(2:0/14:1)1.00 × 10−201.0000Glycerophospholipid metabolism
M94.32C19H36O4369.26952.5--MG(16:1/0:0/0:0)3.45 × 10−41.0000Not known
M106.53C19H36NO7P423.2410−2.1--PE(14:1/0:0)7.70 × 10−91.0000Phosphatidylethanolamine biosynthesis
M119.95C19H38O4331.28502.0--MG(16:0/0:0/0:0)1.94 × 10−91.0000Not known
M122.73C20H37O8P437.23010.5--GPA(14:1/3:0)/GPA(3:0/14:1)1.94 × 10−41.0000Glycerophospholipid metabolism
M1310.31C20H38O5359.26202.3--DG(8:0/9:0/0:0)/DG(9:0/8:0/0:0)5.11 × 10−51.0000Not known
M1411.63C21H34O4351.25382.9--MG(18:4/0:0/0:0)0.00201.0000Not known
M1510.03C21H44NO7P454.27830.3452.2781−0.3PE(16:0/0:0)1.69 × 10−51.0000Phosphatidylethanolamine biosynthesis
M1611.41C25H44O15585.2551−3.6--DGDG(2:0/8:0)/DGDG(8:0/2:0)0.00531.0000DGDG synthase
M1712.05C26H46O15599.2709−3.3--DGDG(2:0/9:0)/DGDG(9:0/2:0)4.64 × 10−61.0000DGDG synthase
M1810.99C26H49O8P521.32570.72--GPA(14:1/9:0)/GPA(9:0/14:1)3.80 × 10−71.0000Glycerophospholipid metabolism
M1911.78C8H16O4177.11262.5--MG(5:0/0:0/0:0)4.90 × 10−101.0000Not known
M202.61C8H18OS2195.06941.4193.06900.43-[(2-Mercapto-1-methylpropyl)thio]-2-butanol2.78 × 10−91.0000Not known
M215.36C8H6O2135.04463.9133.0438−1.8Phthalide0.0221.0000Not known
M220.87C8H9NO2152.07081.0150.07070.42-Phenylglycine3.94 × 10−131.0000Not known
M238.54C26H52O8P--524.67840.23GPA(11:0/12:0)/GPA(12:0/11:0)5.15 × 10−41.0000Glycerophospholipid metabolism
M248.57C27H51O13P--613.30051.7GPIns(10:0/8:0)/GPIns(8:0/10:0)1.01 × 10−61.0000Not known
M258.57C19H37O8P--424.4562−3.3GPA(10:0/6:0)/GPA(6:0/10:0)7.03 × 10−121.0000Glycerophospholipid metabolism
M268.44C13H25O8P--339.12232.6GPA(2:0/8:0)/GPA(8:0/2:0)2.66 × 10−81.0000Glycerophospholipid metabolism
M276.48C14H25O13P--431.09774.0GPIns(2:0/3:0)/GPIns(3:0/2:0)2.14 × 10−51.0000Glycerophospholipid metabolism
M2810.78C25H46O10--503.2850−2.4MGDG(14:1/2:0)/MGDG(2:0/14:1)0.00101.0000monogalactosyldiacylglycerol synthase
M290.92C5H10N2O3147.06180.0145.0616−1.7Glutamine0.00391.0000Inosine monophosphate biosynthesis
M309.16C21H36O4353.26922.1--MG(18:3/0:0/0:0)1.13 × 10−130.9941Not known
M3110.96C21H40O4357.30082.4--MG(18:1/0:0/0:0)0.0120.9941Not known
M325.44C26H30O14567.17171.0565.1703−1.4Mulberroside F0.00400.9941Not known
M334.12C10H10O2163.07582.2161.0749−3.44,5-Dihydro-1-benzoxepin-3(2H)-one5.98 × 10−80.9912Not known
M340.80C9H13N2O9P321.02890.7323.02911.3UMP9.79 × 10−150.9912Uridine monophosphate biosynthesis
M353.38C10H20NO8P314.19280.3312.1916−2.4GPEtn(2:0/3:0)/GPEtn(3:0/2:0)1.63 × 10−80.9883Glycerophospholipid metabolism
M362.73C16H25N5O6384.1865−3.3--Dihydrozeatin-O-glucoside5.77 × 10−50.9854Not known
M373.44C10H19O10P--330.13461.9GPGro(2:0/2:0)8.11 × 10−80.9854Glycerophospholipid metabolism
M383.26C11H22NO8P--326.2290−2.2GPEtn(2:0/4:0)/GPEtn(4:0/2:0)2.28 × 10−90.9795Glycerophospholipid metabolism
M392.92C8H18NO7P--270.1774−1.2PE(3:0/0:0)4.11 × 10−40.9795Phosphatidylethanolamine biosynthesis
M406.28C20H20O9405.11851.3405.1174−1.3cis-resveratrol 4′-O-glucuronide1.26 × 10−70.9737Not known
M410.87C7H14N2O3175.0920−4.5173.0929−1.4Theanine1.21 × 10−80.9737Theanine synthetase
M420.67C4H8N2O3133.0461−1.3131.0458−3.0Asparagine1.58 × 10−130.9503Asparagine synthase
M439.15C18H34O4315.23571.5--MG(15:1/0:0/0:0)0.0160.9386Not known
M449.67C26H50NO7P520.33301.4--PC(18:2/0:0)5.44 × 10−50.9211Phosphatidylcholine biosynthesis
M453.37C20H23NO9422.14490.2--5-O-cis-Coumaroylnigrumin7.01 × 10−40.9152Not known
M4610.50C26H52NO7P522.34871.1--PC(18:1/0:0)/PE(P-16:0/5:0)/PE(P-18:0/3:0)2.20 × 10−50.9006Phosphatidylcholine biosynthesis
M472.86C7H10O5175.0454−0.4173.04560.4Shikimic acid1.73 × 10−50.8918TCA cycle
M480.81C4H7NO4133.0300−1.4133.03030.7Aspartic acid1.44 × 10−40.8801TCA cycle
Table 2. Differential secondary metabolites between Chenpi (CP)/Qingpi (QP), Zhiqiao (ZQ)/Zhishi (ZS) and Citrus aurantium L. (CA)/ Citrus reticulate Blanco. (CR) group profiles in positive and negative ion modes.
No.RT (min)Formula[M + H]+ m/z[M − H] m/zMw (Da)IdentificationVIP (p-Value)AUC
DetectedMass ErorrDetectedMass Erorr
Flavones and flavones glycoside
13.37C15H10O8319.0446−0.6317.0447−0.3318.0448Myricetin1.22 (2.08 × 10⁻⁵) a, 1.17 (2.99 × 10⁻⁵) c0.9778 a
23.83C21H20O10433.09881.2431.0978−1.1432.0983Vitexin1.78 (1.46 × 10⁻⁴) c0.9181 c
3 *3.86C22H22O12479.11850.2477.1175−1.9478.1184Isorhamnetin-3-O-glucoside1.24 (6.37 × 10⁻⁴) a, 2.11 (0.019) c0.9000 a
4 *3.93C22H22O11463.1156−1.1461.11834.7462.1161Diosmetin-7-O-glucoside2.23(9.87 × 10⁻⁹) b1.0000 b
54.09C27H30O14579.1630−1.0577.16522.8578.1636Isorhoifolin1.48 (0.005) a, 1.40 (0.031) c0.9111 a
64.13C21H20O11449.1003−0.4447.0989−3.6448.1005Orientin2.68 (1.52 × 10⁻⁹) a, 1.25 (0.017) c1.0000 a
74.18C26H28O14565.1475−0.7563.14830.7564.1479Apiin13.68 (9.24 × 10⁻¹⁵) c1.0000 c
8 *4.2C27H30O14579.1626−1.7577.16553.3578.1636Rhoifolin9.35 (3.86 × 10⁻¹¹) c1.0000 c
94.28C28H32O15609.17450.7607.1720−3.5608.1741Diosmin1.32 (0.013) a, 2.52 (0.0021) b, 4.39 (8.97 × 10⁻¹⁰) c0.9012 b, 0.9737 c
104.37C28H32O15609.17450.7607.1720−3.5608.1741Neodiosmin4.52 (1.80 × 10⁻⁵) b, 5.89 (3.21 × 10⁻¹⁰) c1.0000 b, 0.9971 c
114.42C27H30O16611.1526−1.3609.1530−0.7610.1534Luteolin-3′,7-di-O-glucoside7.28 (0.0033) b, 10.19 (7.85 × 10⁻¹²) c0.8642 b, 0.9883 c
124.47C21H20O11449.10090.9447.0989−3.6448.1005Cynaroside4.52 (0.0035) b, 8.87 (1.83 × 10⁻¹³) c0.9912 c
134.47C28H32O14593.1786−1.0591.1785−1.2592.1792Linarin1.20 (0.049) b, 2.0 (1.19 × 10⁻¹²) c0.9883 c
145.21C16H12O6301.0629−1.7299.0621−4.3300.0634Chrysoeriol7.02 (7.09 × 10⁻⁴) b, 12.07 (9.40 × 10⁻¹³) c0.9136 b, 1.0000 c
155.21C30H18O10539.0896−0.7537.09112.0538.0900Amentoflavone1.93 (6.36 × 10⁻⁵) b, 2.21 (2.30 × 10⁻⁷) c0.9630 b, 1.0000 c
16 *5.51C21H20O10433.1040−3.9431.1037−4.6432.1057Apigetrin1.52 (8.6 × 10⁻⁴) b, 4.66 (1.83 × 10⁻¹⁷) c1.0000 c
175.51C21H20O11449.10152.2447.0989−3.6448.1005Luteolin-4′-O-glucoside1.68 (0.0019) b, 3.96 (1.17 × 10⁻¹⁵) c0.8889 b, 1.0000 c
185.51C27H30O15595.15890.8593.1577−1.2594.1584Saponarin2.44 (0.0012) b, 5.54 (1.04 × 10⁻¹⁵) c0.9136 b, 1.0000 c
19 *5.58C15H10O6287.0476−0.3285.04770.0286.0477Luteolin1.39 (0.0016) a, 2.46 (0.035) b, 8.67 (3.48 × 10⁻¹⁷) c1.0000 c
206.3C15H10O5271.0526−0.7269.0524−1.5270.0528Apigenin3.43 (0.032) a, 2.27 (7.13 × 10⁻⁴) c0.9667 a, 0.8889 c
21 *6.58C16H12O6301.06371.0299.0630−1.3300.0634Diosmetin3.42 (6.16 × 10⁻⁴) b, 2.37 (0.0020) c0.8778 a, 0.9753 b, 0.8597 c
22 *6.95C16H12O5285.0678−2.5283.06901.8284.0685Acacetin1.24 (0.0030) b, 1.49 (3.95 × 10⁻⁷) c0.8667 a, 0.8642 b, 1.0000 c
23 *7.75C20H20O7373.12120.8371.1208−0.3372.1209Sinensetin8.98 (0.0083) a, 4.79 (0.016) b-
24 *8.35C21H22O8403.13201.2--402.1315Nobiletin16.79 (0.025) a, 14.60 (0.0087) b-
258.38C19H18O6343.11081.5--342.1103Tetramethyl-isoscutellarein9.15 (0.0059) a, 9.34 (0.035) b, 4.48 (0.046) c-
26 *8.88C20H20O7373.1201−2.1--372.1209Tangeretin17.13 (0.015) a, 16.34 (0.0094) b0.8642 b
27 *9.31C20H20O8389.11621.0--388.11585-demethylnobiletin11.83 (0.0045) a, 8.46 (1.63 × 10⁻⁶) b, 3.89 (0.050) c0.8667 a, 0.9260 b
Flavanones and flavanone glycoside
28 *3.71C27H32O15597.17450.7595.17450.7596.1741Eriocitrin2.71 (2.70 × 10⁻⁸) c0.9357 c
293.73C21H22O11451.1156−1.3449.11640.4450.1162Pyracanthoside2.85 (9.22 × 10⁻¹⁶) c0.9971 c
303.74C28H34O14595.1940−1.5593.1945−0.7594.1949Neoponcirin2.74 (0.0012) a, 1.58 (0.0047) c0.8778 a
313.82C27H32O15597.17460.8595.1735−1.0596.1741Neoeriocitrin1.73 (0.050) b, 3.88 (5.98 × 10⁻¹¹) c1.0000 c
32 *3.84C28H34O14595.1935−2.3593.19551.0594.1949Poncirin1.38 (3.97× 10⁻¹¹) a, 1.24 (5.44 × 10⁻⁸) c1.0000 a, 0.9620 c
33 *4.1C27H32O14581.1786−1.0579.1780−2.1580.1792Narirutin2.06 (0.010) a, 1.07 (0.044) b, 5.38 (5.12 × 10⁻²⁰) c-
34 *4.26C27H32O14581.18021.7579.17970.9580.1792Naringin1.43 (0.013) a, 2.52 (0.032) b, 13.64 (5.97 × 10⁻¹⁹) c1.0000 c
35 *4.34C28H34O15611.1882−2.5609.1896−0.2610.1897Hesperidin1.39 (0.031) a, 2.00 (0.0092) b, 2.89 (2.81 × 10⁻⁵) c0.9912 c
36 *4.49C28H34O15611.1889−1.3609.19051.3610.1897Neohesperidin1.91 (0.041) a, 7.92 (0.0082) b, 16.60 (5.1 × 10⁻⁵) c-
374.69C16H14O6303.07920.7301.0785−1.7302.0790Homoeriodictyol4.85 (5.43 × 10⁻⁴) b, 8.93 (3.55 × 10⁻¹²) c0.8778 a, 0.9506 b, 0.9912 c
38 *4.82C15H12O6289.0628−2.1287.0628−2.1288.0634Eriodictyol5.99 (8.49 × 10⁻¹⁴) c1.0000 c
395.51C16H14O5287.0835−2.1285.08544.5286.0841Sakuranetin1.46 (0.022) a, 2.47 (0.035) b, 9.26 (3.48 × 10⁻¹⁷) c1.0000 c
40 *6.3C15H12O5273.0673−4.4271.06912.2272.0685Naringenin4.64 (0.028) a, 8.95 (9.7 × 10⁻⁴) b, 9.37 (2.30 × 10⁻⁵) c0.9240 c
41 *6.62C16H14O6303.07951.7301.0785−1.7302.0790Hesperetin2.31 (0.0011) a, 8.57 (0.049) b, 7.07 (3.52 × 10⁻¹³) c-
Flavonols
42 *3.39C27H30O14579.1630−1.0577.1629−1.2578.1636Kaempferitrin1.66 (2.16 × 10⁻⁷) a, 1.74 (0.025) b1.0000 a, 0.8518 b
43 *3.67C27H30O16611.15431.5609.15411.1610.1534Rutin2.59 (6.42 × 10⁻⁹) a, 2.08 (1.22 × 10⁻⁴) c1.0000 a, 0.8742 c
44 *5.60C15H10O7303.0425−0.7301.0425−0.7302.0427Quercetin2.56 (2.77 × 10⁻⁴) c0.9506 b, 0.8684 c
Cyanidin
452.98C21H21ClO11485.07822.1483.0770−0.4484.0772Cyanidin-3-O-glucoside2.42 (0.0061) a1.0000 a
Coumarins
463.46C11H10O4207.0577−1.0205.05852.9206.0579Limettin3.06 (1.10 × 10⁻⁸) a, 2.08 (6.4 × 10⁻⁴) c1.0000 a
47 *4.35C9H6O3163.0312−3.1161.0310−4.3162.0317Umbelliferone1.96 (7.53 × 10⁻⁵) b, 1.89 (2.86 × 10⁻⁵) c1.0000 b, 0.9270 c
48 *5.34C11H10O4207.0570−4.4--206.0579Scoparone1.09 (0.0077) b-
496.15C20H24O4329.16812.1--328.16745-Geranyloxy-7-Methoxycoumarin2.17 (0.0089) a, 2.04 (0.0212) b0.9012 b
507.85C19H22O4315.1507−3.5--314.1518Epoxyaurapten1.16 (0.0075) a, 4.62 (1.73 × 10⁻⁷) b, 4.12 (6.73 × 10⁻⁸) c0.8667 a, 1.0000 b, 0.9737 c
519.60C15H16O3245.11021.2--244.1099Osthol3.6 (0.016) b, 4.12 (2.12 × 10⁻⁸) c1.0000 c
5210.67C19H22O3299.15710.7--298.1569Aurapten4.76 (2.16 × 10⁻⁵) b, 5.17 (4.83 × 10⁻⁷) c0.9753 b
53 *11.00C19H22O3299.1565−1.3297.1568−0.3298.1569Auraptene10.50 (1.39 × 10⁻⁴) b, 12.57 (6.83 × 10⁻⁸) c0.8556 a, 0.9506 b, 1.0000 c
Furanocoumarins
544.56C17H18O7335.10530.3--334.1052Byakangelicin1.23 (3.19 × 10⁻⁴) b, 1.33 (0.0016) c0.8889 a, 1.0000 b
555.31C16H16O6305.0941−2.0--304.0947Heraclenol2.47 (2.79 × 10⁻⁶) b, 1.01 (0.0015) c1.0000 b, 0.9591 c
565.51C16H14O5287.08451.4--286.0841Heraclenin1.05 (0.022) a, 5.37 (1.41 × 10⁻¹⁷) c-
575.72C16H16O6305.0940−2.3--304.0947Oxypeucedanin hydrate1.01 (0.0016) c0.9532 c
586.75C11H6O3187.03180.5--186.0317Psoralen1.27 (0.0078) b, 1.72 (5.99 × 10⁻⁹) c0.8642 b
597.06C12H8O4217.0420−0.9215.0418−1.9216.0422Xanthotoxin1.01 (2.09× 10⁻⁷) b,1.02 (3.07 × 10⁻⁷) c0.9971 c
607.06C21H22O5355.14721.4--354.1467Epoxybergamottin1.00 (0.0305) a, 6.77 (7.82 × 10⁻⁷) b, 8.57 (2.94 × 10⁻⁹) c0.8667 a, 1.0000 b, 1.0000 c
61 *7.43C12H8O4217.0421−0.5--216.0422Bergapten3.07 (0.019) b, 2.82 (0.0063) c0.9673 c
627.48C13H10O5247.05311.2--246.0528Isopimpinellin1.03 (2.10 × 10⁻⁴) b0.9591 c
63 *7.89C11H6O4203.02744.0201.02702.0202.0266Xanthotoxol6.44 (0.027) a, 2.73 (2.82× 10⁻⁷) b, 6.43 (1.6× 10⁻⁴) c-
647.89C17H16O5301.10073.0--300.0998Cnidilin1.01 (6.16 × 10⁻⁴) b, 1.09 (0.0020) c0.8778 a, 0.9753 b, 0.8597 c
658.22C21H24O6373.15812.1--372.15736′-7′-dihydroxybergamottin1.11 (4.49 × 10⁻⁵) b, 1.02 (5.61 × 10⁻⁶) c0.8778 a, 0.9753 b, 0.8655 c
668.24C16H14O5287.0832−3.1--286.0841Oxypeucedanin1.46 (0.016) a, 2.04 (0.0083) b, 1.94 (0.0047) c0.8778 a
678.45C17H16O6317.09562.8--316.0947Byakangelicol1.05 (0.0063) b0.9383 b
68 *9.27C16H14O4271.08951.1--270.0892Imperatorin1.62 (0.0060) b, 1.52 (7.13 × 10⁻⁴) c0.8889 c
699.54C17H16O5301.0997−0.3--300.0998Phellopterin1.14 (7.09 × 10⁻⁴) b0.9136 b
709.76C16H14O4271.08920.0--270.0892Isoimperatorin1.84 (0.032) b, 1.67 (0.023) c-
7110.37C21H22O5355.1465−0.6353.1460−2.0354.1467Cnidicin1.39 (0.017) b, 2.61 (3.33E−7) c1.0000 c
7210.87C21H22O4339.1513−1.5--338.15188-geranyloxypsoralen1.07 (0.0078) b0.8642 b, 0.9357 c
7311.26C11H6O4203.02670.5201.02712.5202.0266Bergaptol3.70 (0.046) a, 3.14 (1.16 × 10⁻⁴) b, 3.70 (5.51 × 10⁻⁷) c0.9506 b
74 *11.56C21H22O4339.15221.2337.15100.5338.1518Bergamottin1.47 (6.11 × 10⁻⁵) b, 1.42 (2.14 × 10⁻⁵) c0.9630 b, 1.0000 c
Limonin
753.93C32H42O14651.2430−1.2649.24410.5650.2438Limonin glycoside4.45 (3.45 × 10⁻⁵) a, 3.01 (0.0055) b-
76 *7.82C26H30O8471.20330.4469.20350.9470.2031Limonin3.01 (0.0023) a, 5.66 (1,8 × 10⁻⁵) b, 9.63 (3.04 × 10⁻⁵) c0.8510 c
777.86C34H46O15695.24990.6693.2490−0.7694.2495Nomilin glycoside2.10 (0.012) a, 1.42 (0.0010) b, 1.44 (0.0090) c-
78 *8.38C28H34O9515.2447−0.2513.2444−0.8514.2448Nomilin6.40 (0.0011) b, 4.05 (0.0063) c-
Abscisic acid
79 *4.14C15H20O4265.13802.3263.1373−0.4264.1374Abscisic acid1.62 (3.95 × 10⁻⁵)a, 5.74 (0.035) b, 7.54 (1.72 × 10⁻⁵) c-
* metabolites were confirmed by authentic standards; a group of QP/CP; b group of ZS/ZQ; c group of species (CA/CR).
Table 3. Origins of the collected 37 QP, CP, ZS and ZQ samples.
No.Original PlantLocal NameLocation and Collection TimeGrowing Environment
Pericarps of the ripe fruit of Citrus reticulate Blanco
1Citrus reticulate BlancoChenpiFengjie, Sichuan; August 2015Field margins (29° N 106° E; Alt.200–230 m)
2Citrus reticulate BlancoChenpiQinglong, Guizhou; September 2015Hillsides (25° N 105° E; Alt.1200–1301 m)
3Citrus reticulate BlancoChenpiJiangjin, Sichuan; September 2014Hillsides (29° N 106° E; Alt.231 m)
4Citrus reticulate BlancoChenpiJiangjin, Sichuan; October 2014Field margins (29° N 106° E; Alt.200–230 m)
5Citrus reticulate BlancoChenpiGanzhou, Jiangxi; September 2015Plain (26° N 115° E; Alt.500 m)
6Citrus reticulate BlancoChenpiGanzhou, Jiangxi; September 2015Plain (25° N 115° E; Alt.520 m)
7Citrus reticulate BlancoChenpiQinglong, Guizhou; October 2015Hillsides (25° N 105° E; Alt.1200–1300 m)
8Citrus reticulate BlancoChenpiHuangyan, Zhejiang; September 2013Field margins (28° N 121° E; Alt.45m)
9Citrus reticulate BlancoChenpiJiangjin, Sichuan; August 2015Hillsides (29° N 106° E; Alt.238 m)
Pericarps of the young or immature fruit of Citrus reticulate Blanco
10Citrus reticulate BlancoQingpiXingan, Jiangxi; May 2015Hillsides (27° N 115° E; Alt.50–60 m)
11Citrus reticulate BlancoQingpiJiangjin, Sichuan; May 2015Hillsides (29° N 106° E; Alt.220 m)
12Citrus reticulate BlancoQingpiXingan, Jiangxi; June 2015Hillsides (27° N 115° E; Alt.50–60 m)
13Citrus reticulate BlancoQingpiXingan, Jiangxi; May 2014Hillsides (27° N 115° E; Alt.50–60 m)
14Citrus reticulate BlancoQingpiJiangjin, Sichuan; May 2014Hillsides (29° N 106° E; Alt.220 m)
15Citrus reticulate BlancoQingpiXingan, Jiangxi; June 2014Hillsides (27° N 115° E; Alt.50–60 m)
16Citrus reticulate BlancoQingpiXingan, Jiangxi; May 2013Hillsides (27° N 115° E; Alt.50–60 m)
17Citrus reticulate BlancoQingpiJiangjin, Sichuan; May 2013Hillsides (29° N 106° E; Alt.220 m)
18Citrus reticulate BlancoQingpiXingan, Jiangxi; June 2013Hillsides (27° N 115° E; Alt.50–60 m)
19Citrus reticulate BlancoQingpiGanzhou, Jiangxi; June 2015Hillsides (27° N 115° E; Alt.50–60 m)
Immature fruit of Citrus aurantium L.
20Citrus aurantium cv XiuchengXiuchengXingan, Jiangxi; July 2014Plain (27° N 115° E; Alt.20–30 m)
21Citrus aurantium L.Sour orangeEzhou, Hubei; July 2013Hillsides (21° N 110° E; Alt.300 m)
22Citrus aurantium cv XiuchengXiuchengXingan, Jiangxi; July 2015Plain (27° N 115° E; Alt.20–30 m)
23Citrus aurantium L.Jiangjin sour orangeJiangjin, Sichuan; July 2014Hillsides (29° N 106° E; Alt.231 m)
24Citrus aurantium cv JizichengJizhichengZhangshu, Jiangxi; July 2015Plain (27° N 115° E; Alt.20–30 m)
25Citrus aurantium L.Sour orangeJian, Jiangxi; July 2015Plain (27° N 115° E; Alt.20–30 m)
26Citrus aurantium L.Sour orangeZhangshu, Jiangxi; July 2014Plain (27° N 115° E; Alt.20–30 m)
27Citrus aurantium L.Sour orangeJian, Jiangxi; July 2014Plain (27°N115°E; Alt.20–30 m)
28Citrus aurantium × P. trifoliataCitrangeYuanjiang, Hunan; July 2014Hillsides (29° N 112° E; Alt.310 m)
Young fruit of Citrus aurantium L.
29Citrus aurantium cv XiuchengXiuchengXingan, Jiangxi; May 2014Plain (27° N 115° E; Alt.20–30 m)
30Citrus aurantium L.Sour orangeJiangjin, Sichuan; June 2014Field margins (29° N 106° E; Alt.200–230 m)
31Citrus aurantium cv XiuchengXiuchengXingan, Jiangxi; May 2015Plain (27° N 115° E; Alt.20–30 m)
32Citrus aurantium L.Jiangjin sour orangeJiangjin, Sichuan; June 2014Hillsides (29° N 106° E; Alt.231 m)
33Citrus aurantium cv DaidaiDaidaiJiangjin, Sichuan; May 2014Field margins (29° N 106° E; Alt.200–230 m)
34Citrus aurantium cv XiuchengXiuchengZhangshu, Jiangxi; June 2014Plain (27° N 115° E; Alt.20–30 m)
35Citrus aurantium cv Morocco sour orangeMorocco sour orangeHuangyan, Zhejiang; May 2013Field margins (28° N 121° E; Alt.45 m)
36Citrus aurantium L.XiuchengQingjiang, Jiangxi; June 2012Plain (27° N 114° E; Alt.100–200 m)
37Citrus aurantium cv XiuchengXiuchengXingan, Jiangxi; June 2015Plain (27° N 115° E; Alt.20–30 m)

