Article

Probabilistic Modeling of Slip System-Based Shear Stresses and Fatigue Behavior of Coarse-Grained Ni-Base Superalloy Considering Local Grain Anisotropy and Grain Orientation

1
Gas Turbine and Transmission Center Research Center (G2TRC), University of Nottingham, Nottingham NG7 2RD, UK
2
Department for Technology & Innovation, Gas and Power Division, Siemens AG, Huttenstraße 12, 10553 Berlin, Germany
3
Institute of Materials Science and Engineering, TU Kaiserslautern, 67663 Kaiserslautern, Germany
4
School of Mathematics and Science, Bergische Universität Wuppertal, 42119 Wuppertal, Germany
*
Author to whom correspondence should be addressed.
Metals 2019, 9(8), 813; https://doi.org/10.3390/met9080813
Submission received: 26 June 2019 / Revised: 17 July 2019 / Accepted: 20 July 2019 / Published: 24 July 2019
(This article belongs to the Special Issue Metal Plasticity and Fatigue at High Temperature)

Abstract

:
New probabilistic lifetime approaches for coarse grained Ni-base superalloys supplement current deterministic gas turbine component design philosophies; in order to reduce safety factors and push design limits. The models are based on statistical distributions of parameters, which determine the fatigue behavior under high temperature conditions. In the following paper, Low Cycle Fatigue (LCF) test data of several material batches of polycrystalline Ni-base superalloy René80 with different grain sizes and orientation distribution (random and textured) is presented and evaluated. The textured batch, i.e., with preferential grain orientation, showed higher LCF life. Three approaches to probabilistic crack initiation life modeling are presented. One is based on Weibull distributed crack initiation life while the other two approaches are based on probabilistic Schmid factors. In order to create a realistic Schmid factor distribution, polycrystalline finite element models of the specimens were generated using Voronoi tessellations and the local mechanical behavior investigated in dependence of different grain sizes and statistically distributed grain orientations. All models were first calibrated with test data of the material with random grain orientation and then used to predict the LCF life of the material with preferential grain orientation. By considering the local multiaxiality and resulting inhomogeneous shear stress distributions, as well as grain interaction through polycrystalline Finite Element Analysis (FEA) simulation, the best consistencies between predicted and observed crack initiation lives could be achieved.

1. Introduction

Due to the worldwide increase in fluctuating renewable energy generation, flexibly operating gas turbine power plants are necessary to secure stable power supply and grid frequencies. However, frequent start-ups and shut downs as well as load changes lead to high requirements to the materials used in the hot gas section components, foremost the turbine blades. Due to their outstanding properties at high temperatures, Ni-base superalloys are appropriate as turbine blade material. While single crystal and directionally solidified components are nowadays used to accommodate the highest demands in creep and oxidation resistance, components made of polycrystalline solidified nickel-base superalloys from conventional cast are still more often used for economic reasons. The remarkable Low Cycle Fatigue (LCF) crack initiation life scatter observed in lab tests at polycrystalline Ni-base superalloys samples is well known and usually considered by material safety factors for engine part designs. Deterministic models to predict the LCF lives of the components have been applied successfully for decades, but the increasing demand for risk-based business decision making and the reduction of conservatism in design (safety factors) have led to the development of probabilistic fatigue prediction models. In the early days of probabilistic modeling for LCF, defects were considered as sources of randomness in fatigue behavior. Accordingly, [1,2] utilized measured defect size distributions for probabilistic modeling. This approach is also used for fatigue prediction of turbine disks [3,4]. Other probabilistic fatigue models are based on the weakest link concept which is often described with a Weibull distribution in fatigue limit [5,6,7,8,9,10] but also in fatigue life [11,12,13,14,15]. The probabilistic fatigue limit and fatigue life modeling often resulted in integral approaches to model the probabilistic size effect, which are already put down in design guidelines [16,17,18], but are up to now still under research [19,20,21,22,23]. Particularly in [22], a local probabilistic approach based on a Weibull distribution in LCF life arising from inherent material scatter was validated with Ni-base superalloy specimens. While the previously mentioned approaches use mostly parametric distributions to describe the stochastic nature of fatigue mechanisms and the statistical size effect, more physics and micro-mechanics-based approaches are favorable to improve the model accuracy. Therefore, it is necessary to determine the distributional aspects of the high temperature fatigue mechanisms in the investigated materials and the influence of those factors to the cyclic life and life scatter.
Coarse-grained polycrystalline Ni-base superalloys such as IN 738 LC or René80 are used for turbine blades in the rear stages of gas turbines. Due to the vacuum casting process and geometry-related cooling conditions, they tend to form grains of up to 3 mm and more in diameter. As a result, only a few grains in highly stressed areas of limited size are formed within the component, such as the transition from root to the airfoil. Due to the low grain numbers, the orientation of the crystal lattice of each grain has a major influence on the mechanical behavior of the component. On the one hand, the orientation has a direct influence on the elastic material behavior. Due to the pronounced elastic anisotropy of nickel and Ni-base superalloys (anisotropy factor of up to 3), the effective value of Young’s modulus for uniaxial loading of a single grain varies over a wide range. For room temperature it can vary between 130 GPa and 330 GPa and between 95 GPa and 260 GPa at 850 °C [24,25,26]. This aspect in combination with low grain numbers, leads to high scatter in the determined mechanical properties, which makes high safety factors in design inevitable. On the other hand, the crystal orientation in addition to the elastic behavior has an influence on the onset of plastic behavior. As determined by [27], the resolved shear stress at a slip system can be calculated by projecting the applied normal stress at the slip system orientation. The modified Schmid factor is defined as the quotient of maximum resolved shear stress and equivalent stress and compares the propensity of shear glide between crystals of different orientation. The effects of Schmid factor on the crack initiation and fatigue behavior have been investigated in several studies. Seibel et al. [28,29] could show for the coarse grain Ni-base superalloy René80 at 850 °C and low total strain amplitudes, that fatigue cracks initiate on slip bands at grains with high Schmid factors. A plot of the LCF life against the resulting shear stresses in the crack-initiating slip system led to a significant reduction in life scatter compared to a strain Wöhler plot. Gottschalk et al. [28,30] showed, that there is a correlation between the distribution of the Schmid factor and the lifetime of the Ni-base superalloy René80 tested in high temperature LCF tests. Engel [25,31] could also show coarse grained René80 that, besides the Schmid factor, also the local Young’s modulus of the crack initiating grain has a huge influence on the resulting shear stress within the slip systems. With the proposed E·m model, it could be shown, experimentally and analytically, that cracks predominantly initiate in grains with Schmid factors between 0.35–0.45 and high corresponding Young’s moduli and therefore high values in the product E·m. Cracks in grains can also initiate if these are surrounded by grains with high E·m values (neighborhood effect). The presented models all are used to estimate the resulting shear stress in the slip system of the grains, to provide predictions about the LCF life distribution of Ni-base superalloys. However, the following simplifying assumptions are applied in these models:
  • Uniaxial stress states in each grain with global uniaxial load
  • No influence of the deformation behavior of the surrounding grains
  • Only Young’s modulus and Schmid factor in direction of a uniaxial stress were considered
  • Homogeneous resolved shear stress field at slip system within the grain.
In order to improve the model for probabilistic Schmid factor distribution modeling from [30], several polycrystalline finite element models are generated by 3D Voronoi tessellation using the software Neper [32,33,34] and solved in ABAQUS® 2017; considering the elastic anisotropy of the crystals. These simulations allow approximating the local mechanical properties in a coarse-grained polycrystalline, uniaxially loaded LCF specimen where the local grain orientations and their interaction lead to various multiaxial stress states. The polycrystalline Finite Element Analysis (FEA) simulations were carried out for the case of randomly and for preferentially oriented grains. These preconditions led to distinct distributions of local resolved shear stresses and therefore Schmid factors. Deterministic formulae are used to derive statistical distributions for the LCF crack initiation life of both cases. In order to verify the differences seen in the simulation results, LCF test data of two René80 batches (isothermal 850 °C) was generated in strain-controlled experiments. One batch has had coarse grains with random orientation, while the other batch has had smaller grains with preferential orientation. Hence, polycrystalline FEA simulations according to this grain orientation were carried out. The thereof derived life distribution was shifted to a higher median compared to the case of random grain orientation. Using the large LCF test data set of Seibel [29] (coarse, randomly oriented grains) for calibration of the Schmid factor based crack initiation life model, it was possible to predict the observed crack initiation lives of the René80 batch with preferential grain orientation.
The presented work is subdivided into three major sections. The examined material and applied testing and simulation methods are described in Section 2. Experimental and simulation outcomes are presented in Section 3 and discussed in Section 4. Section 2 and Section 3 follow an equivalent substructure. It starts by describing the investigated material René80 and its microstructural examination (Section 2.1 and Section 3.1). The LCF testing procedure and its outcomes are detailed in the Section 2.2 and Section 3.2. Section 2.3 and Section 3.3 switch to the simulation part of the presented work specifying how polycrystalline anisotropic FEA models of the LCF specimen were set up and how they can capture their global stiffness. These FEA models are partly the basis for probabilistic Schmid factor modeling, which is introduced in Section 2.4 and presented in Section 3.4. Probabilistic Schmid factors are the basis for the microstructure-based crack initiation life models that are described in Section 2.5 and calibrated with the test data in Section 3.5. These microstructure based probabilistic approaches for LCF are the highlight of the presented work and are furthermore compared to the Weibull approach from [19] in Section 4. It is concluded that the LCF life prediction based on the “modified Schmid factor” distribution derived from polycrystalline FEA simulations has the best prediction accuracy.

2. Materials and Methods

Two batches of René80 LCF specimens from the same melt, but different solidification processes are investigated in the present work. The mechanical properties of the specimens are simulated with FEA models mimicking the polycrystalline microstructure and the anisotropic stiffness of the grains. From those FEA solutions, the distribution of normalized maximum shear stresses at the slip systems (modified Schmid factors) are derived. It is then explained how the distribution of Schmid factors leads to a distribution in crack initiation life.

2.1. Material

Cylindrical bars with 150   mm length made of the polycrystalline Ni-base superalloy René80 [35,36,37,38,39], were conventionally casted and heat treated by Doncasters/Germany. To achieve the final microstructure, a two-step heat treatment consisting of solution annealing and aging was applied to the material. From the same melt, bars with diameters of 20   mm (coarse grained batch) as well as 12   mm were produced in order to generate a different grain size and grain orientation distribution.
These bars were machined to the final specimen geometry shown in Figure 1 and the gauge section was polished to a surface roughness of N5.
Table 1 shows the chemical compositions of the René80 melt, determined by the manufacturer, as well as the composition of Inconel 738 with low amount of carbon (IN 738 LC).

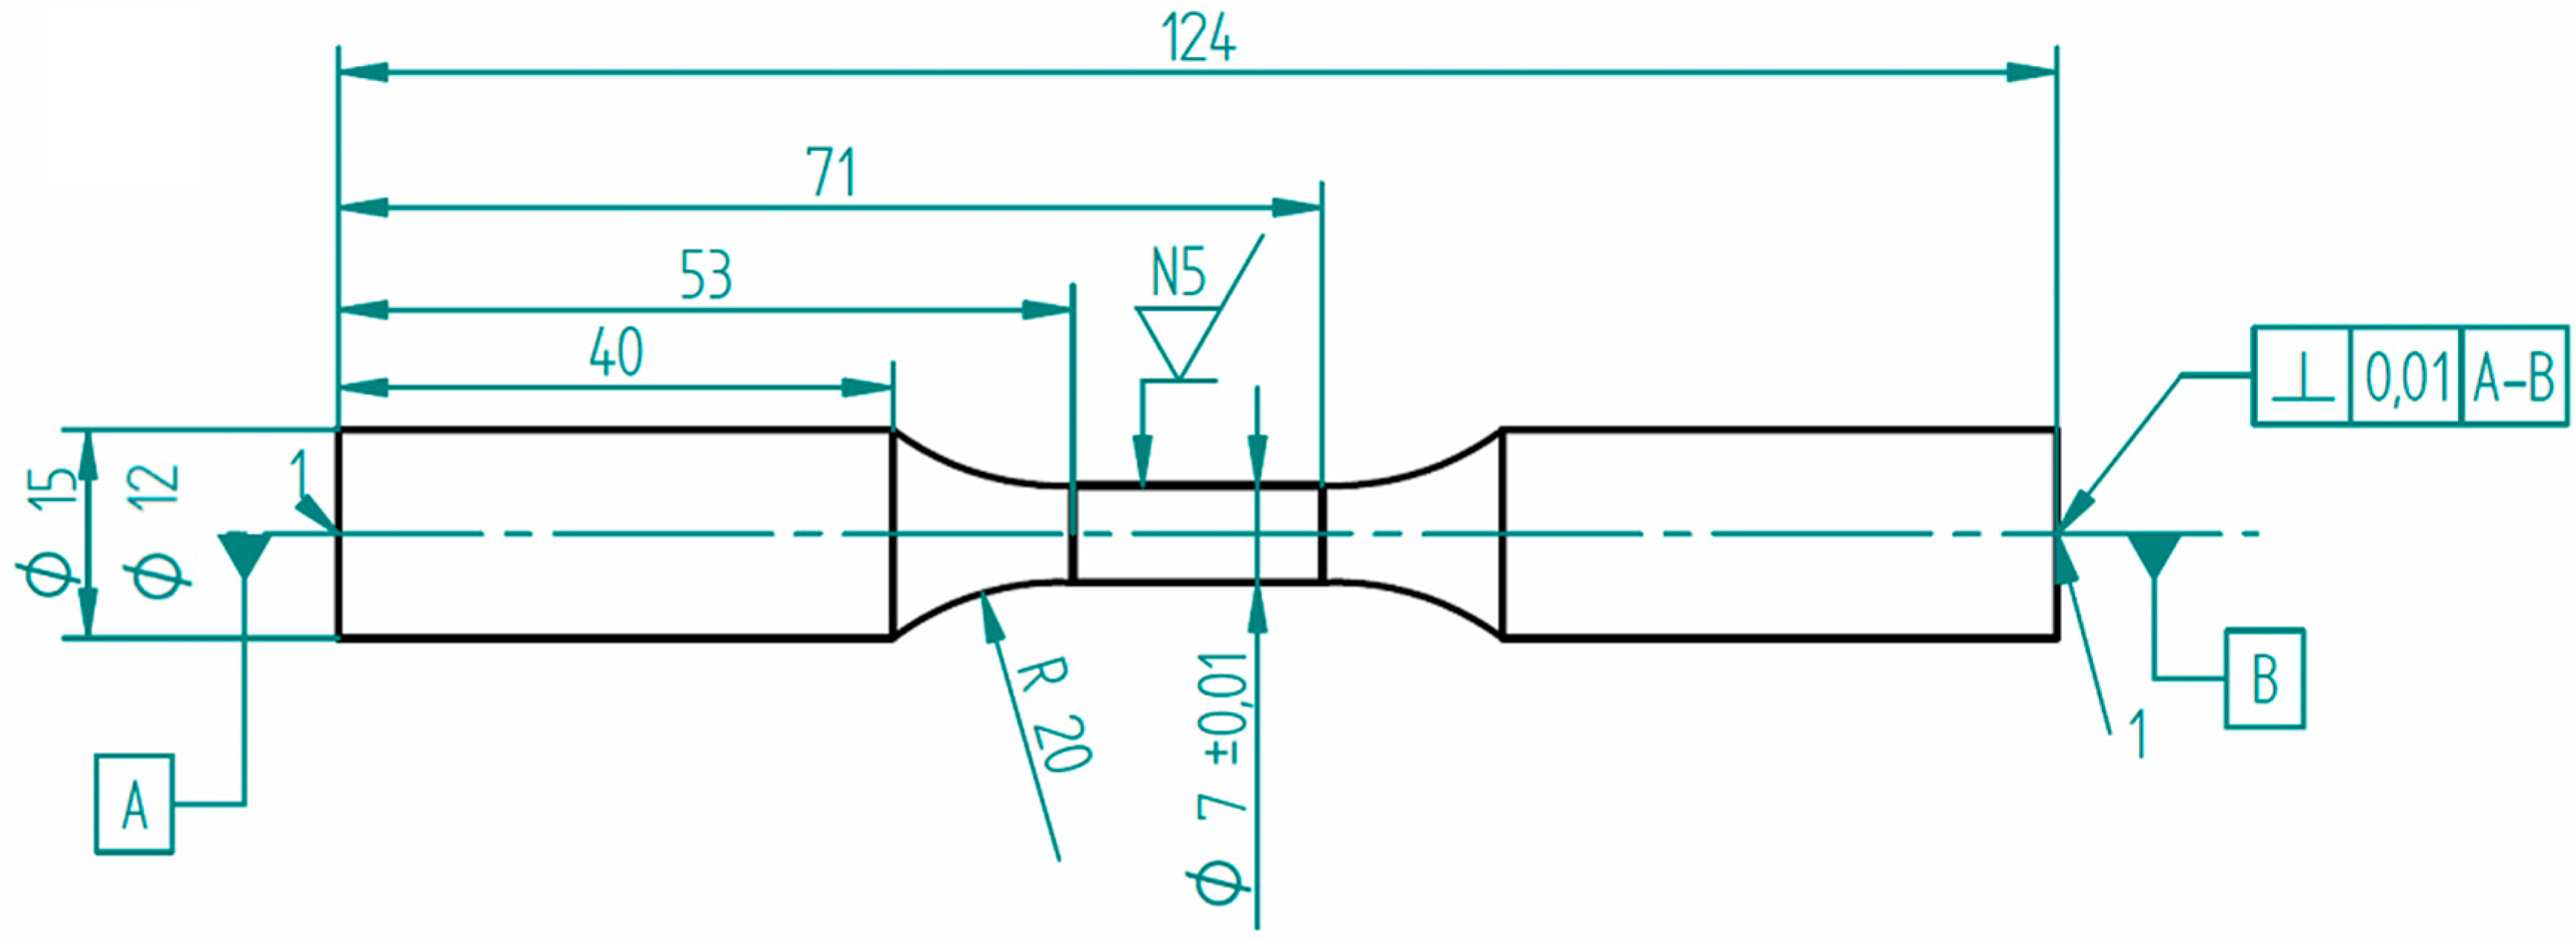
2.2. Experimental Isothermal LCF Testing

Isothermal LCF tests were carried out at 850 °C on an MTS 810 servo hydraulic test rig with a maximum load capacity of 100 kN. The specimens were heated by a Huttinger TruHeat generator MF5000 with an induction coil and temperature controlled by a ribbon thermocouple type K attached to the middle of the gauge length. The temperature gradient was measured before the testing campaign and was below ±8 °C across the entire gauge length. Total strain control condition with R = 1 was realized by a 12 mm MTS high temperature extensometer Type MTS 632.53. Depending on the value of total strain, the test frequency varies between 1 Hz for low total strain and 0.1 Hz for high total strains. Cycles to failure were determined by a load drop of 2.5% from the stabilized measured stress amplitude in order to reach a crack surface of 0.962 mm2 and to compare the results to [29].

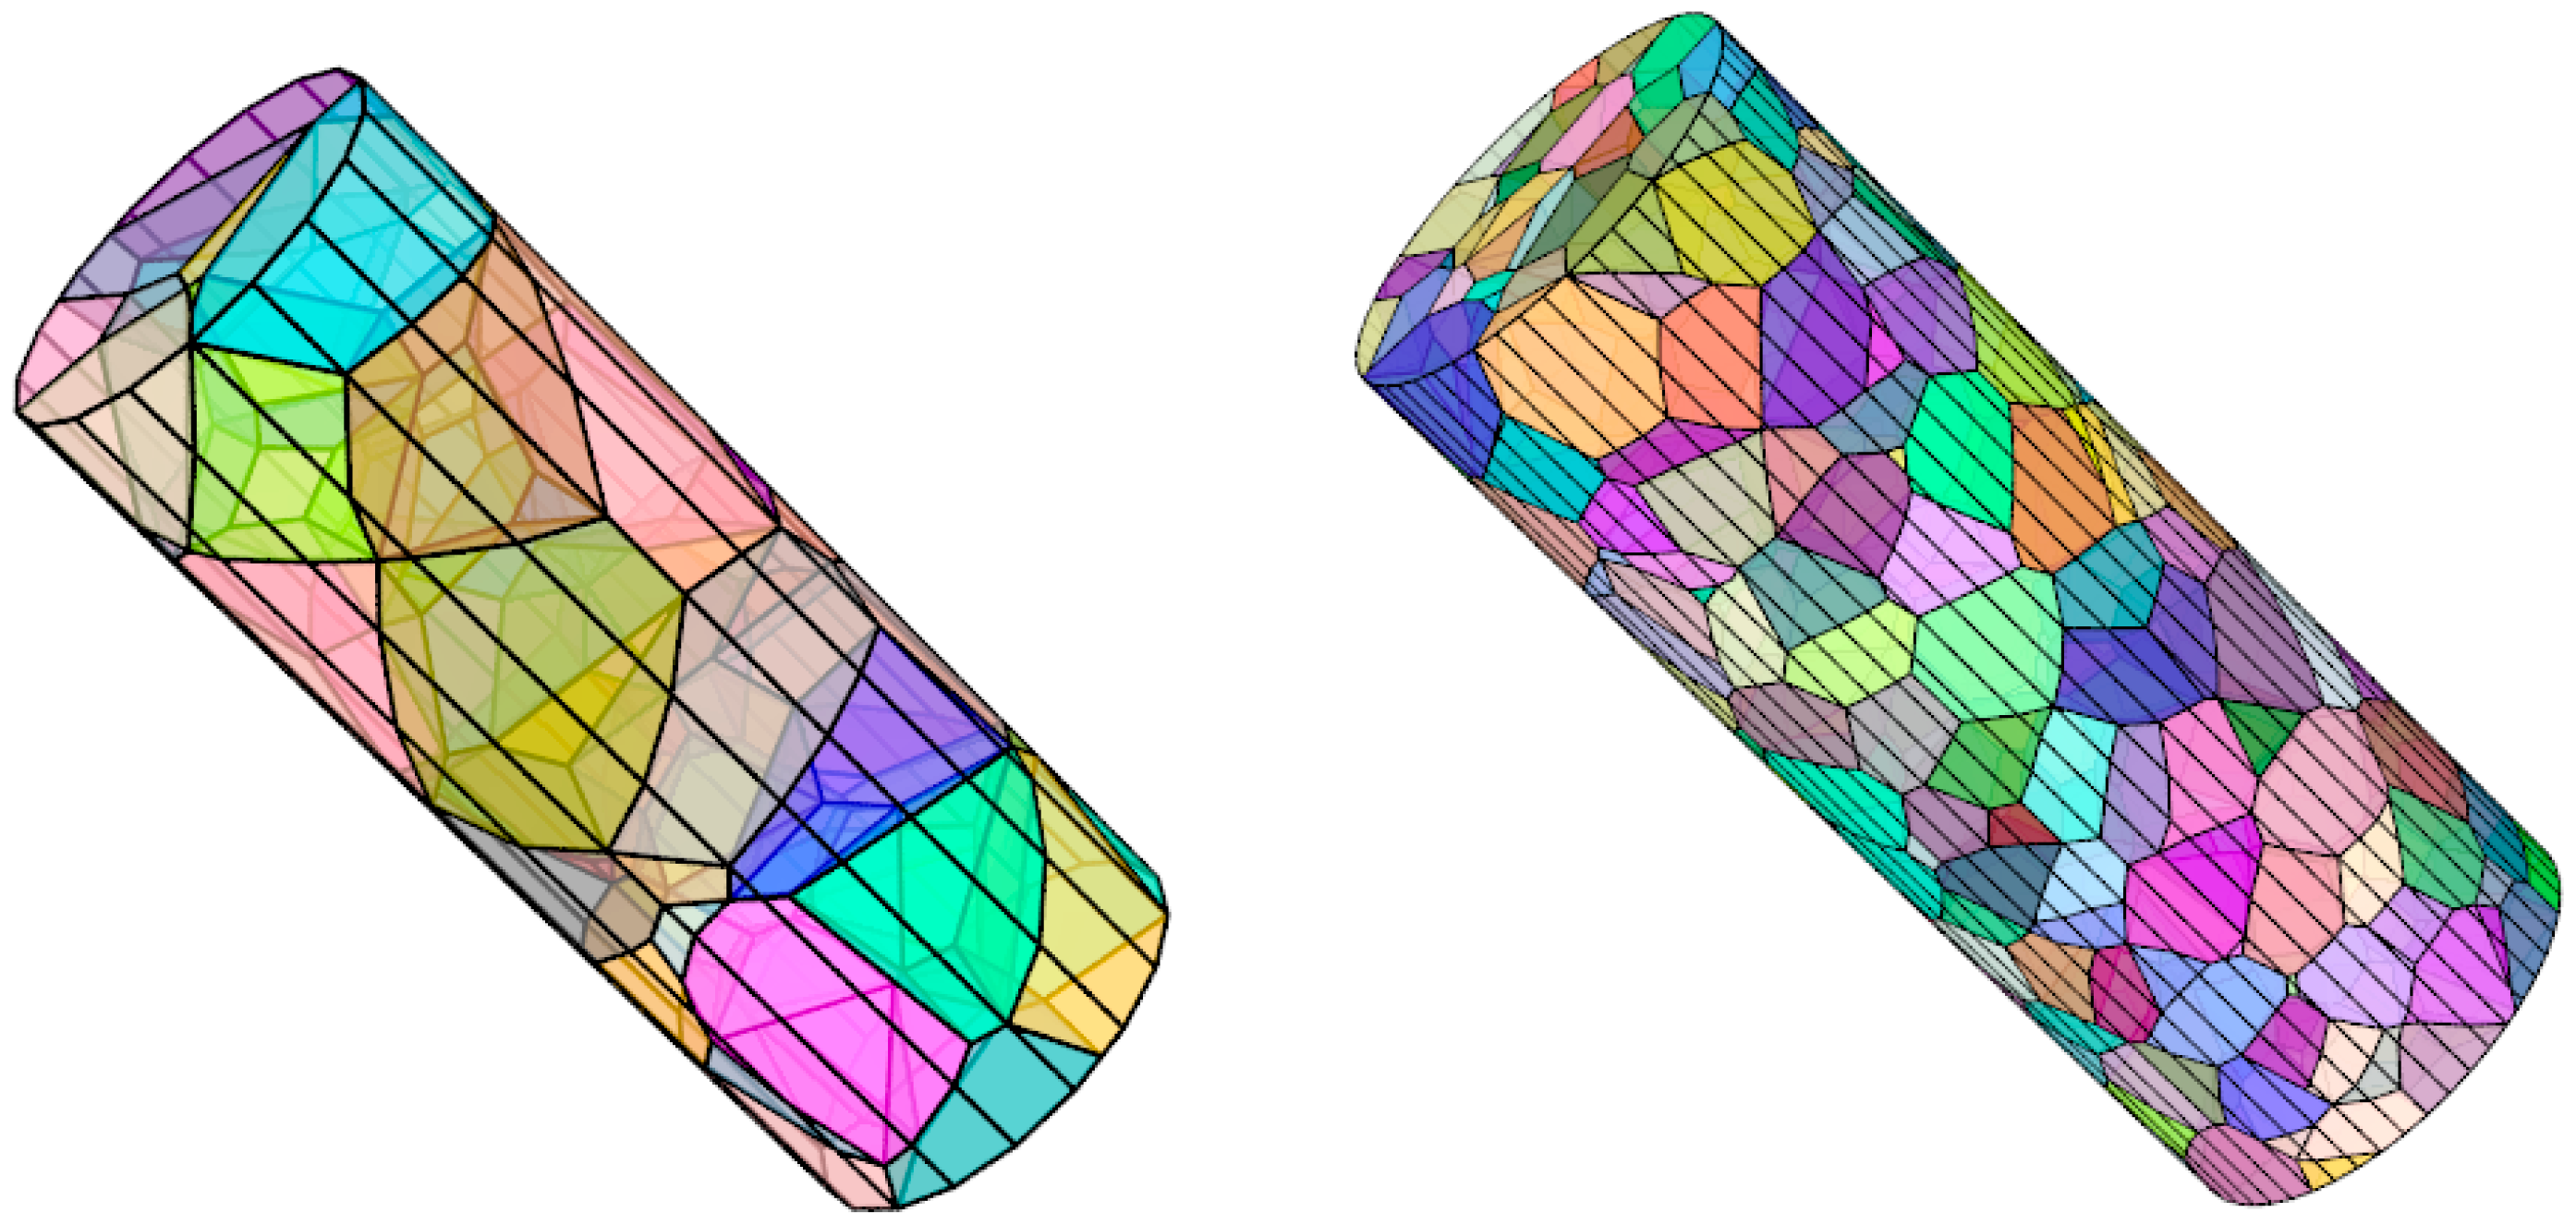
2.3. FEA Models for Polycrystalline Microstructure Modelling

In order to simulate polycrystalline material behavior, the open source software NEPER (Version 3.3, by Romain Quey, MINES Saint-Étienne, Saint-Étienne, France) was applied to generate random grain morphologies using the 3D Voronoi tessellation method [40,41]. Since only the gauge lengths of the specimens were of interest in the simulation, a cylinder with the dimensions r = 7   mm , h = 18   mm were created. The specification of 49 Voronoi seeds leads to 49 grains with an average grain diameter d g r a i n 3   mm for the given volume. This is in good accordance to metallographic analyzes of the tested coarse grain René80 batch (random orientation) presented in Section 3.1. Equivalently, the model for the other batch which solidified to grains with an average grain size of d g r a i n 1.3   mm and preferential direction in orientation contains 500 grains. Within the meshing tool of NEPER a relative characteristic length value of rcl = 0.3 defines the size of the elements relative to the average cell size. As a result, the mesh consists of a uniform distribution of approximately 50,000 quadratic tetrahedral elements for the coarse grain model and approximately 90,000 quadratic tetrahedral elements for the fine grain model. Both polycrystalline specimen models are shown in Figure 2.
Additionally, to the morphology, Neper also creates a consistent mesh at the boundary interfaces of the grains such it can be used as an input for ABAQUS® (Dessault systemes, Vélizy-Villacoublay, France). In order to account for anisotropic stiffness of René80, a global, anisotropic, linear-elastic material law was defined in ABAQUS®.
σ _ _ = C _ _ _ _ · ε _ _   where   C _ _ _ _ = [ C 11 C 12 C 12 C 12 C 11 C 12 C 12 C 12 C 11 C 44 C 44 C 44 ]
As the authors are not aware of any values for the elastic constants of René80 at high temperatures, elastic constants for IN 738 LC were taken from Hermann, W. (2014) [26]. Since both, composition and content of the γ′ phase are very similar in IN 738 LC and René80, it is assumed that the elastic behavior of both alloys are qualitatively comparable. A linear interpolation from 800 °C and 898 °C to 850 °C results in C 11 = 225.83   MPa , C 12 = 161.45   MPa and C 44 = 98.79   MPa . In order to create local material models, each grain was rotated in a preprocessing step and the respective data written to the input file. The grains in the first René80 batch (coarse-grained) are assumed to have no preferential direction in orientation, which is why the rotational matrices U used in this preprocessing step are distributed according to the isotropic measure, mathematically given by the Haar measure at the SO3 group of rotations [42]. For the second batch (fine grains) however, the grains are assumed to have a non-isotropic orientation distribution (see Section 3.1) and the respective FEA models are set up accordingly. During the calculation, ABAQUS® transfers the globally defined material law by means of tensor rotation with U into the local coordinate system of the individual grains. With this procedure, the grains interact according to their orientation dependent stiffness. However, grain boundary interactions are not explicitly modeled by physics-based considerations. In order to have high comparability to the LCF experiments, all FEA simulations were modeled with given displacements using a material model for T = 850   °C. Since the latter was linear-elastic and a stable cyclic behavior for low total strain amplitudes was observed [43], only one load case was evaluated. All nodes of the cylinder top face were displaced by 0.045 mm which is equal to a total strain of 0.25%. The nodes at the bottom face were fixed but allowed transverse contraction.

2.4. Derivation of the Schmid Factor Distribution

Plastic deformation of a metallic grain begins if one resolved shear stress within the slip systems of the crystal exceeds a critical value τ C R S S . As the E·m model in [25,31] proposed for coarse grained Ni-base superalloys, the resulting shear stress in the slip systems depends on the grains local Young’s moduli and its Schmid factor m ˜ . According to [28,30] m ˜ is defined as
m ˜ = max i , j ( τ i , j σ v M )   where   τ i , j   is   the   resolved   shear   stresses   at   slip   systems   j   of   slip   plane   i
The 12 possible values for τ i , j , representing the slip systems <111>{110} in a fcc crystal are obviously dependent on the crystal orientation towards the load. Let U be the rotation matrix describing the orientation from the coordinate system of the stress tensor σ _ _ and the lattice coordinate system. The resolved shear stresses τ i , j ( U ) in a crystal rotated by U are calculated by
τ i , j ( U ) = n i · σ _ _ a n i s o ( U ) · s i , j   where   U SO ( 3 )
σ _ _ a n i s o ( U ) = C _ _ _ _ ( U ) · ε _ _ i s o
n i are the normal vectors of the slip planes and s i , j are the slip vectors on each slip plane. Equation (3) was simplified exploiting the orthogonality of U [30]. In order to also account for the stiffness anisotropy of the Ni lattice cell the anisotropic stress tensor σ _ _ a n i s o ( U ) is calculated by the tensor product of isotropic strain tensor ε _ _ i s o and rotated C _ _ _ _ ( U ) stiffness tensor. The randomness of crystal grain orientations in a polycrystal is the root cause why the Schmid factor as defined in (2) is a stochastic variable with the cumulative distribution function F S F ( m ˜ ) = P ( S F m ˜ ) .
Repeated plastic deformation of the crystal causes lattice dislocations to move along the slip systems towards the surface eventually creating persistent slip bands (PSB’s) which are manifested as intrusions and extrusions and initiate surface fatigue cracks. Grains with an orientation leading to high E · m ˜ values under given load are creating PSB’s faster than those with a lower value of E · m ˜ . That is why it could be shown that LCF cracks preferably initiate in grains with such an orientation [29,31]. A high stiffness in direction of the load leads to high anisotropic stresses in the crystal and a high Schmid factor leads to high resolved shear stresses at the slip system.
In order to include the stochastic character of the Schmid factor in a fatigue life prediction, it is necessary to quantify the Schmid factor distribution F S F ( m ˜ ) in a first step. One approach uses only the geometric considerations for a single crystal at isotropic strain, which is reflected in Equations (3) and (4). A Monte-Carlo sampling of lattice orientations described by rotation matrices U creates a distribution of resolved shear stresses τ i , j ( U ) according to (3) which translates into the Schmid factor distribution F S F ( m ˜ ) via (2.2) [30]. Note that U = U ( ϑ , φ 1 , φ 2 ) is conveniently defined as a function of the Euler angles ϑ , φ 1 , φ 2 in this publication.
This approach is computationally inexpensive but suffers from a major drawback. The derived single crystal Schmid factor distribution has limited meaning for reflecting the true distribution of maximum shear stresses in a polycrystal since no grain interaction and therefore no complex grain distortion is considered.
Hence, a second approach to simulate the Schmid factor distribution was carried out in order to overcome the drawback of simplification to only single crystal behavior. The polycrystalline FEA simulations described in Section 2.2 were repeated three times with different grain orientations. These were realized using Monte-Carlo sampled rotation matrices U . Following these simulations, Schmid factor values were calculated from all nodal stress tensors according to Equations (2) and (3) during the post-processing routine [30]. The thereby received distribution will be denoted as modified Schmid factor m ˜ m o d distribution in the following. Section 3.3 describes the differences from the single grain Schmid factor distribution. They arise from the distinct distribution of stress tensors with different multiaxiality, even within single grains, which develops due to the mutual grain interactions which is discussed in Section 3.2.
Note, that both approaches do not consider elastic-plastic deformation models and therefore only linear-elastic shear stresses at the slip systems are calculated. Still, their distribution at the model surface give an indication about the expected onset of plasticity. Table 2 summarizes the description of the two types of Schmid factor distributions.

2.5. Calibration of the Probabilistic LCF Fatigue Model and the Cyclic Material Strength Model

Three probabilistic models are chosen for modeling the strain Wöhler curves of the LCF test results. The first model combines deterministic LCF life modeling using the Coffin-Manson-Basquin equation C M B ( N i )
ε a = σ f σ m E ( 2 N i ) b + ε f ( 2 N i ) c
with the Weibull distribution in crack initiation life.
F N ( n | η , m ) =   1 e ( n η ) m
The deterministic Coffin-Manson-Basquin CMB life N i is considered as the distributions median value and hence determines the Weibull scale
η = N i · ( ln 2 ) 1 / m
The Weibull distributed crack initiation life is also the basis for the approach in [19]. There, it is furthermore combined with a surface integration approach to cover the statistical size effect. The latter was not carried out in the presented work. In order to calibrate the CMB parameters for this Weibull based model, a Maximum-Likelihood estimation (MLE) is used. The other two approaches combine the Schmid factor distribution with the CMB equation to derive a life distribution. This is based on the hypothesis that crack initiation life scatter observed in the experiments emanates from the underlying statistical distribution of shear stresses in the crystallites which itself originates in the statistical distribution of grain orientation (see Section 2.4). In order to project the distributional behavior of crack initiating shear stresses to an actual cycle distribution, the approach by [28,30] is followed. The averaged stress in the specimen is calculated from the applied strain with the Ramberg-Osgood model, R O ( σ a ) .
ε a = σ a E + ( σ a K ) 1 / n
R O ( σ a )   is   inverted   such   that   σ a = R O 1 ( ε a )
A large sample set (>200,000 samples) is drawn from the Schmid factor distribution F S F ( m ˜ ) and its median m ˜ 50 % renormalized to one. The specimen stress σ a is then multiplied with this sample set and all values are subsequently transferred back to strain values with the Ramberg-Osgood equation.
ε a ( m ˜ ) = R O ( σ a ( m ˜ ) )
This set of strain samples is then calculated into a set of life samples with the Coffin-Manson-Basquin relationship.
N i ( m ˜ ) = C M B 1 ( ε a ( m ˜ ) )
Equation (10) is the numerical representation for the crack initiation life distribution F N ( n ( m ˜ ) ) based on probabilistic Schmid factors. Note, that the procedure described above is applied identically for the distributions F S F ( m ˜ ) and F S F ( m ˜ m o d ) . For model calibration with MLE, the likelihood summands are calculated from the probability density function.
f N ( n ( m ˜ ) ) = d d n F N ( n ( m ˜ ) )
Since F S F ( m ˜ ) is only available as a numerical sample set, f N ( n ( m ˜ ) ) is differentiated numerically from the empirical cumulative distribution function.
Furthermore, fine and coarse-grained metals have different strengths due to the different intensity of dislocation pile up at the grain boundaries (Hall-Petch relation) [44]. In order to account for this effect, the cyclic stress-strain relation was calibrated by estimating the Ramberg-Osgood model parameters in Equation (8) by means of Maximum-Likelihood. Though the cyclic stress response was assumed to be statistically distributed in a log-normal fashion for simplicity in the MLE, only the median values of the cyclic stress prediction is used in (9).

3. Results

The results of metallographic examination of the specimen material (Section 3.1) and its implications on the FEA modelling (Section 3.2) are described in this section. It follows that different specimen stiffness (Section 3.2) and Schmid factor (Section 3.3) distributions are calculated for the two material batches (coarse grains with random grain orientation and fine grains with preferential grain orientation). By considering the different grain orientation distributions in both batches it is possible to explain the observed crack initiation life differences qualitatively, as well as quantitatively (Section 3.4 and Section 3.5). Note that LCF test data from Seibel [29] was used for probabilistic model calibration and its predictions are compared to the fine grain test data generated by Engel et al. [25,31].

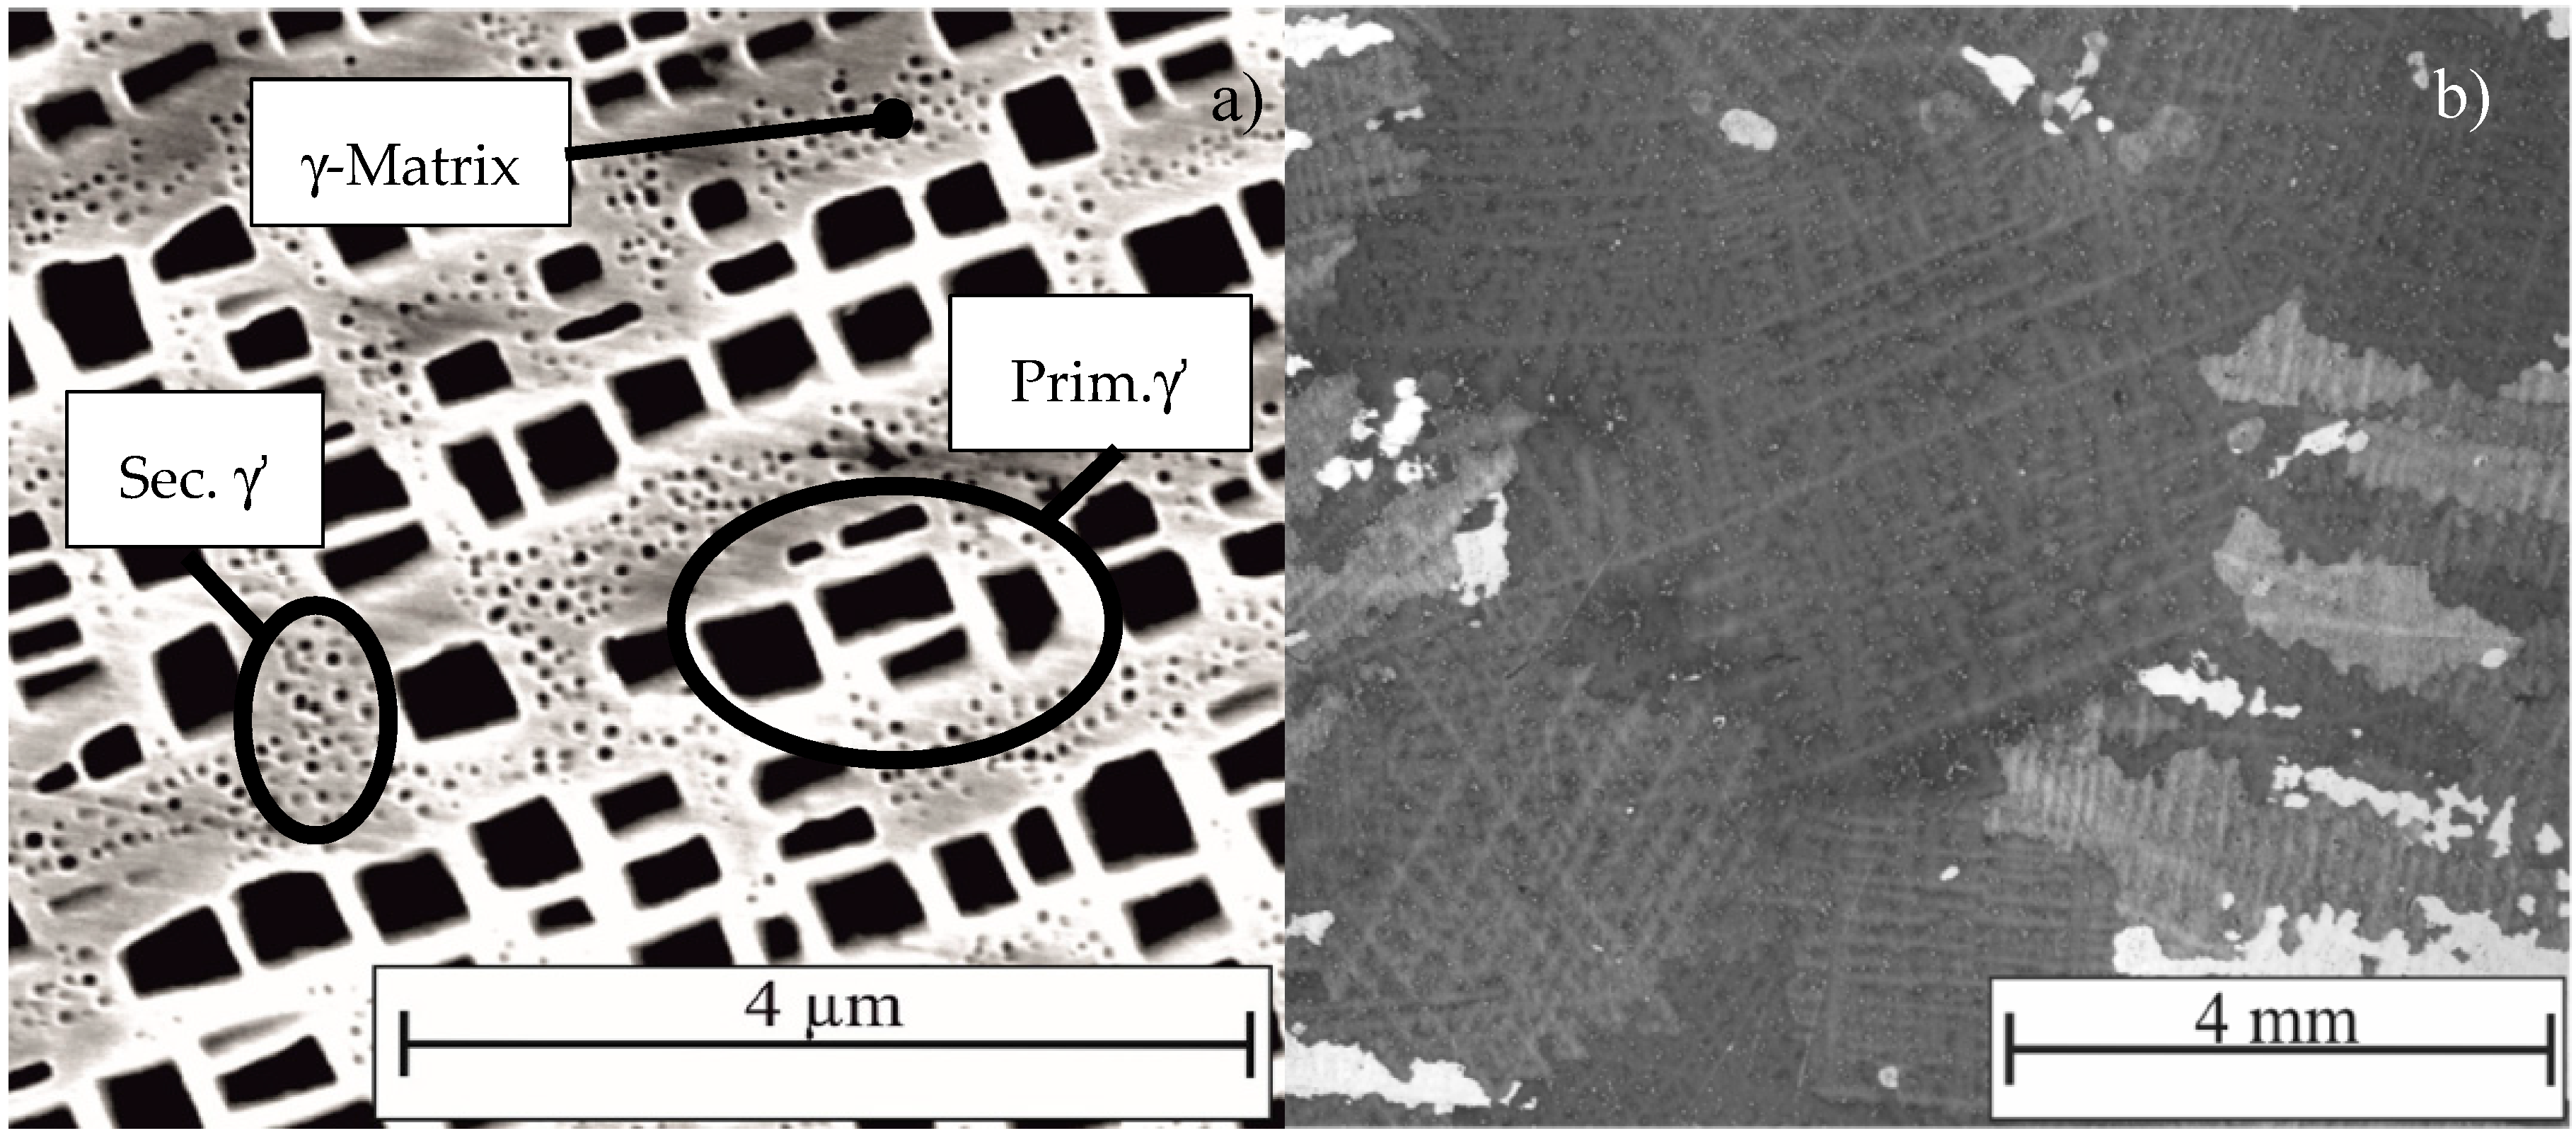
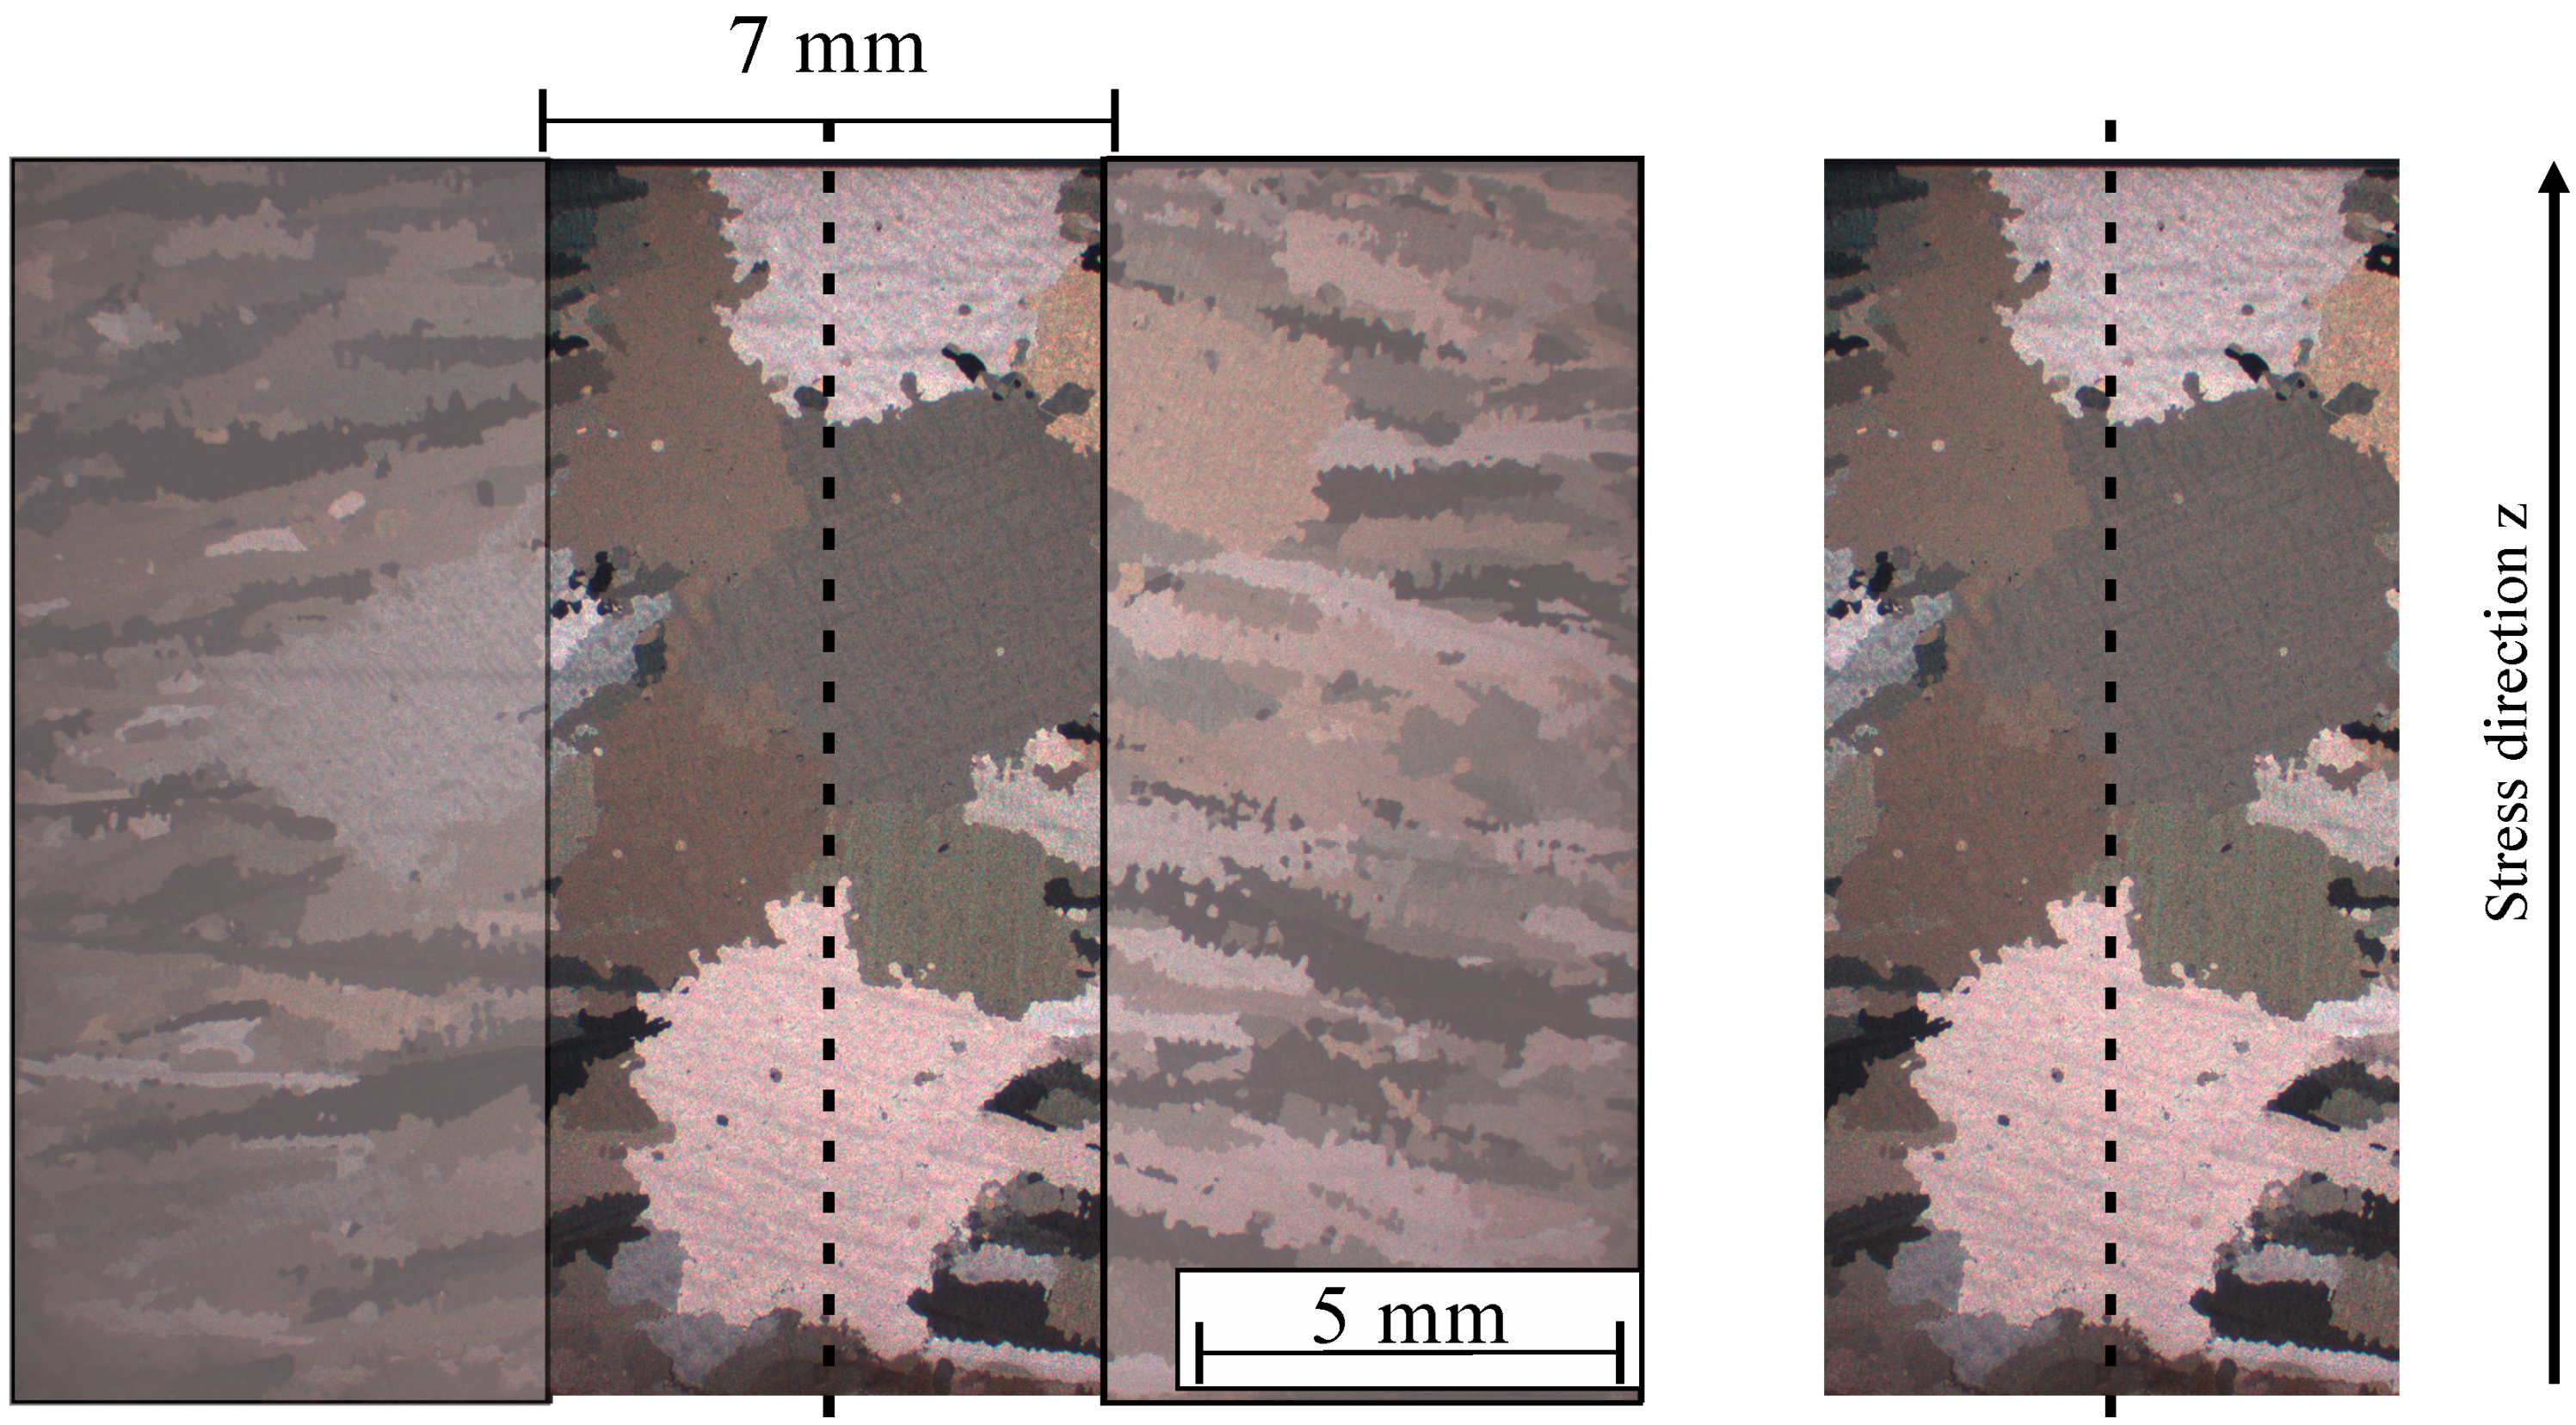
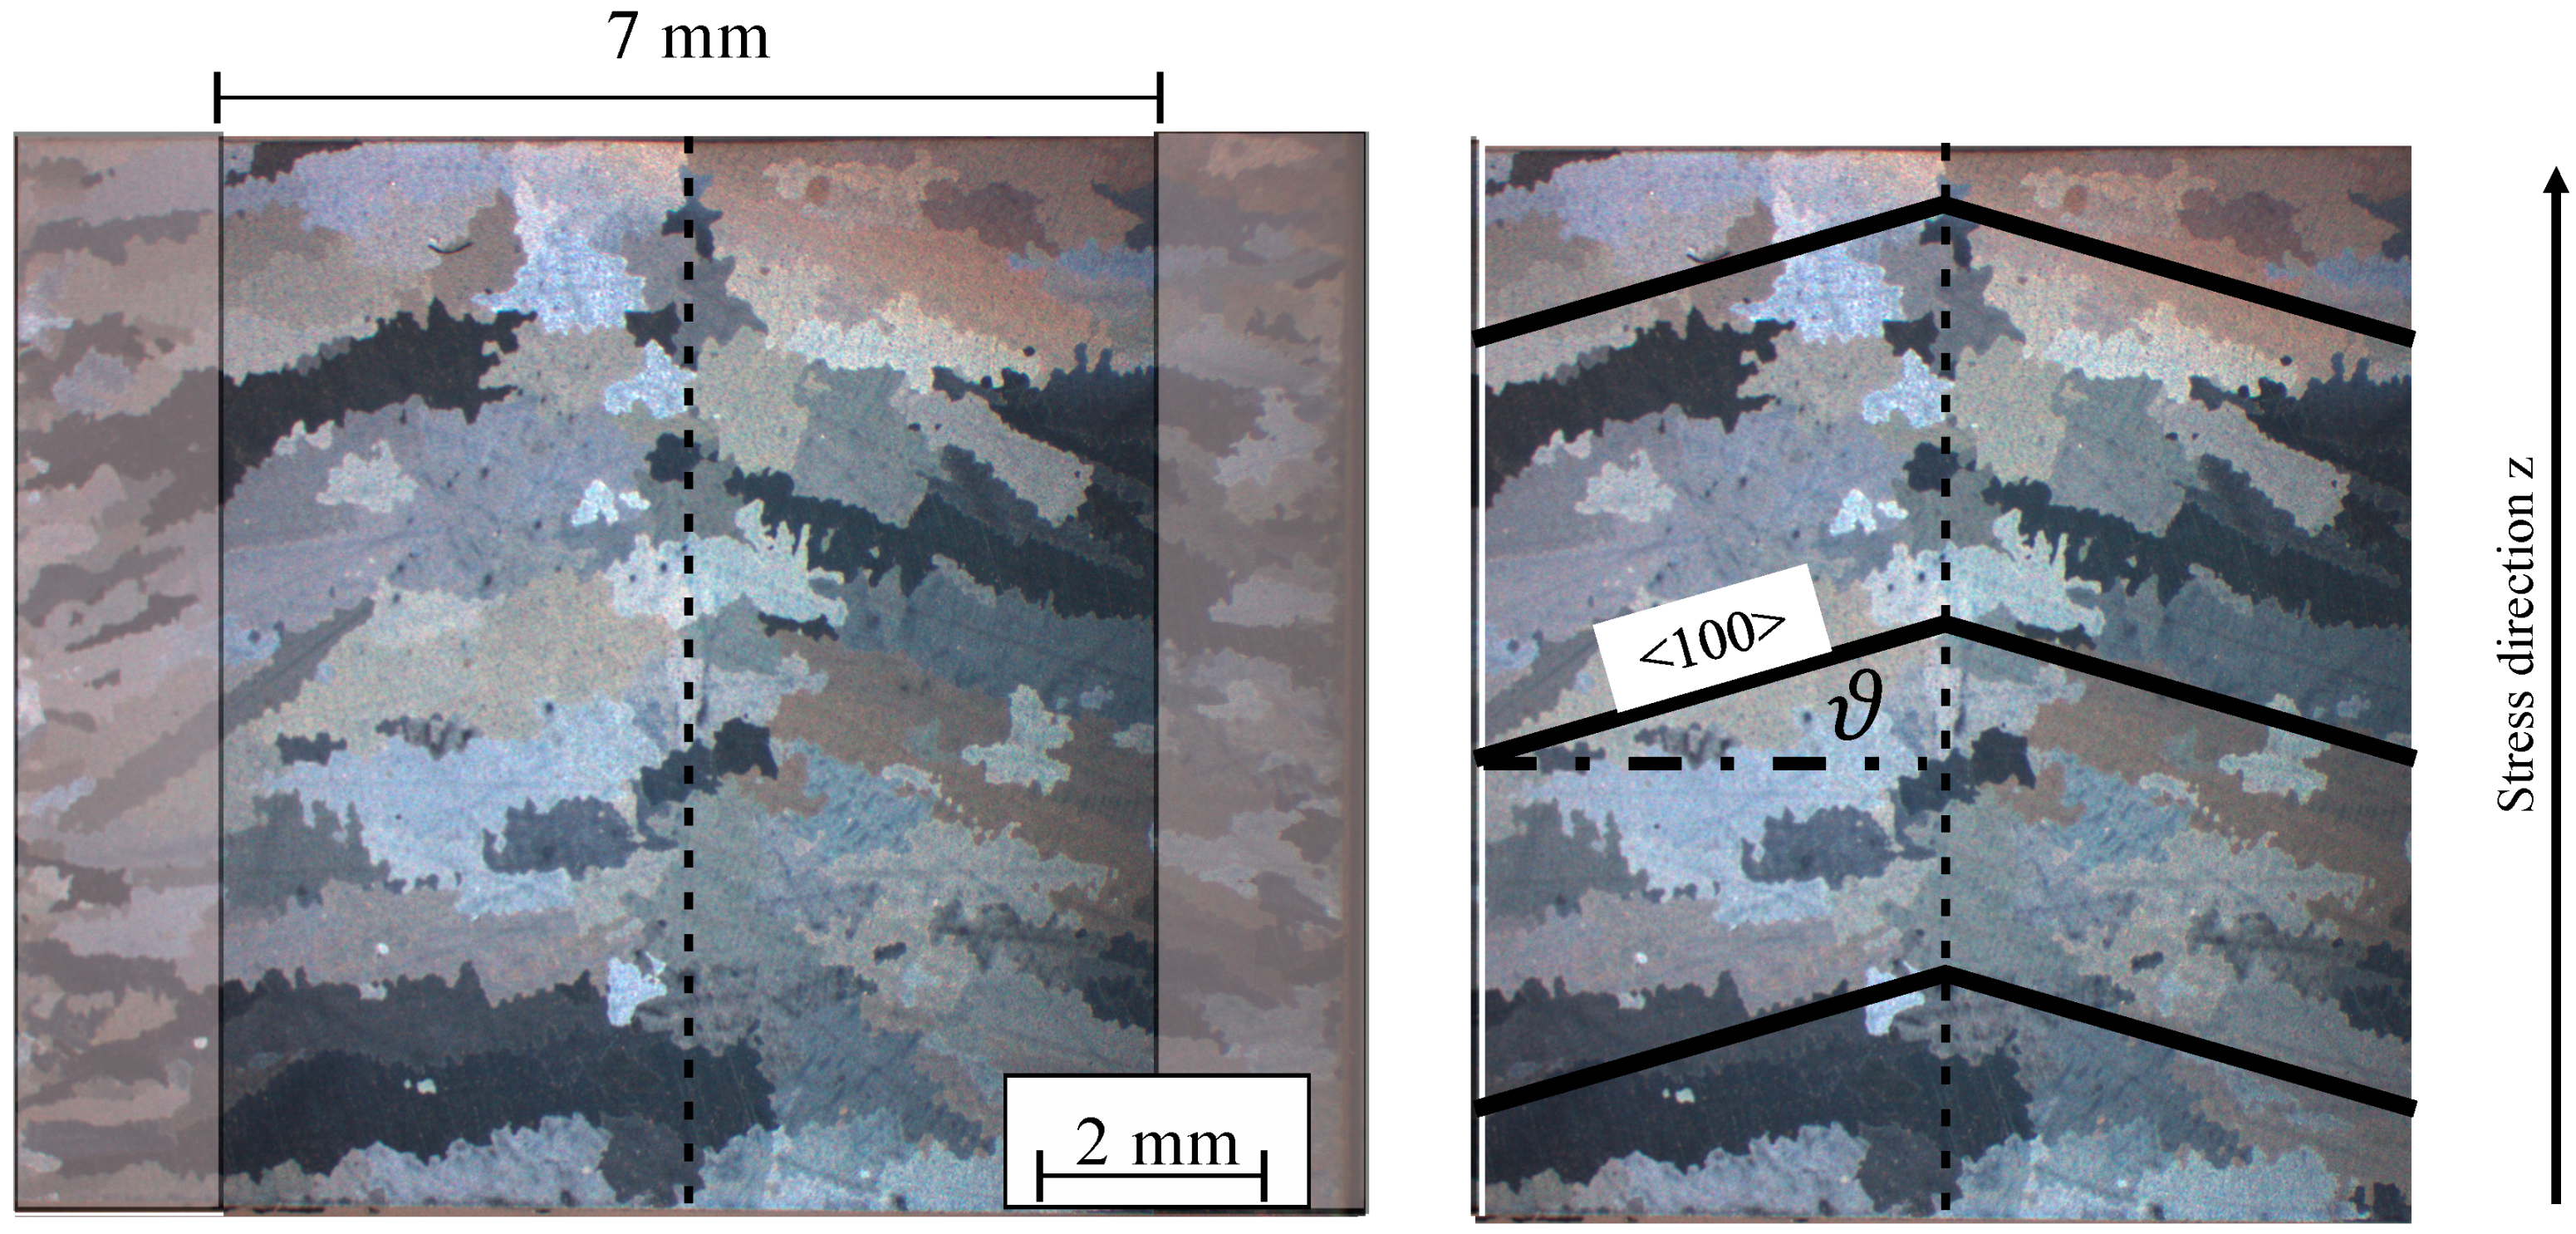
3.1. Microscopic Material Examinations and Orientation Distributions

Metallographic investigations using scanning electron microscope (SEM) reveal the typical γ,γ′microstructure with an averaged γ′ content of about 35 vol.%, as Figure 3 illustrated for both batches. The average size of the primary cuboidal γ′ is 0.4 µm whereas the secondary spherical γ′ shows diameters between 10–50 nm.
Due to the different cooling conditions, especially thin cross sections of components made of polycrystalline, Ni-base superalloys tend to form a crystallographic texture on edge layers, due to the preferred grain growth of <100> near orientations in direction of the temperature gradient [45]. The specimen slugs for the data from Engel [25,31] were casted as cylindrical bars of 12   mm in diameter for fine grain realization and 20   mm for coarse grain realization. It is important to note, that the fine grain batch, with an average grain size of about 1   mm , is still coarse with regard to material science, but in order to differentiate it from the material with an average grain size of about 3   mm it is called fine grained batch.
Based on the metallographic etching of the vertical cross section of the 20   mm bar in Figure 4, it is assumed, that a radial and an axial temperature gradient were present during the solidification. The edge layer shows a dendritic solidification with small elongated grains. The 20   mm specimens show large, randomly oriented grains towards the bar center. It is assumed that rapid cooling rates occurred in the edge areas, resulting in small grains. The preferential grain orientation of those might have originated from an axial temperature gradient, as the melt started to cool at the bottom of the upright standing mold. However, it could have originated from crystal seeds at the mold wall as well. With a decrease of the cooling rate towards the bar center, the grains have more time to grow resulting in large grains with no preferential direction. Within the gauge length, they have an averaged diameter of approximately d c o a r s e = 3   mm , determined as an equivalent circular diameter of the grain area. This size allows roughly 49 grains in the gauge section. By machining the specimens gauge section geometry (see Figure 1) most of the dendritically solidified material is removed. The mechanical behavior of the specimen is then mainly determined by coarse randomly oriented grains in the gauge length.
Furthermore, bars of René80 with a length of 150   mm and diameter of 12   mm were cast. The metallographic etching of the vertical cross section in Figure 5 also shows small, dendritically solidified, elongated grains but throughout the entire cross section of the bar. While the axial and radial temperature gradients were most likely comparable to those in the 20   mm bar, the faster cooling in 12   mm bar prevented the formation of larger grains without preferential direction in the center. Due to the large grain size, the determination of the orientation distribution of the material using electron backscatter diffraction (EBSD) was not suitable as only an insufficient number of grains could be examined, which provided inadequate statistics. Therefore, the alignment within the gauge length were measured by light microscope and image processing. On average, the grains’ <100> direction is aligned to the specimen horizontal in an angle ϑ of approximately 25°.
The dendritic character of the grains is present in the entire gauge length. Thus, it is assumed that the mechanical behavior is significantly determined by this texture. In contrast to the coarse-grained material, the grains appear rather lengthy in the cross section with an average grain size of d f i n e = 1.3   mm . This relates to approximately 500 grains in the gauge section.
The LCF test data from cylindrical bar slug specimens is shown in Section 3.5. However, the probabilistic model calibration presented there uses only LCF test data from Seibel [29] where the specimen slug was casted as a plate with a thickness of 20   mm . The materials microstructure is comparable to the just described coarse-grained bar material regarding grain size distribution and morphology. Therefore, a similar mechanical and fatigue behavior can be assumed. The consistency of properties is proven in Section 3.2 and Section 3.5.

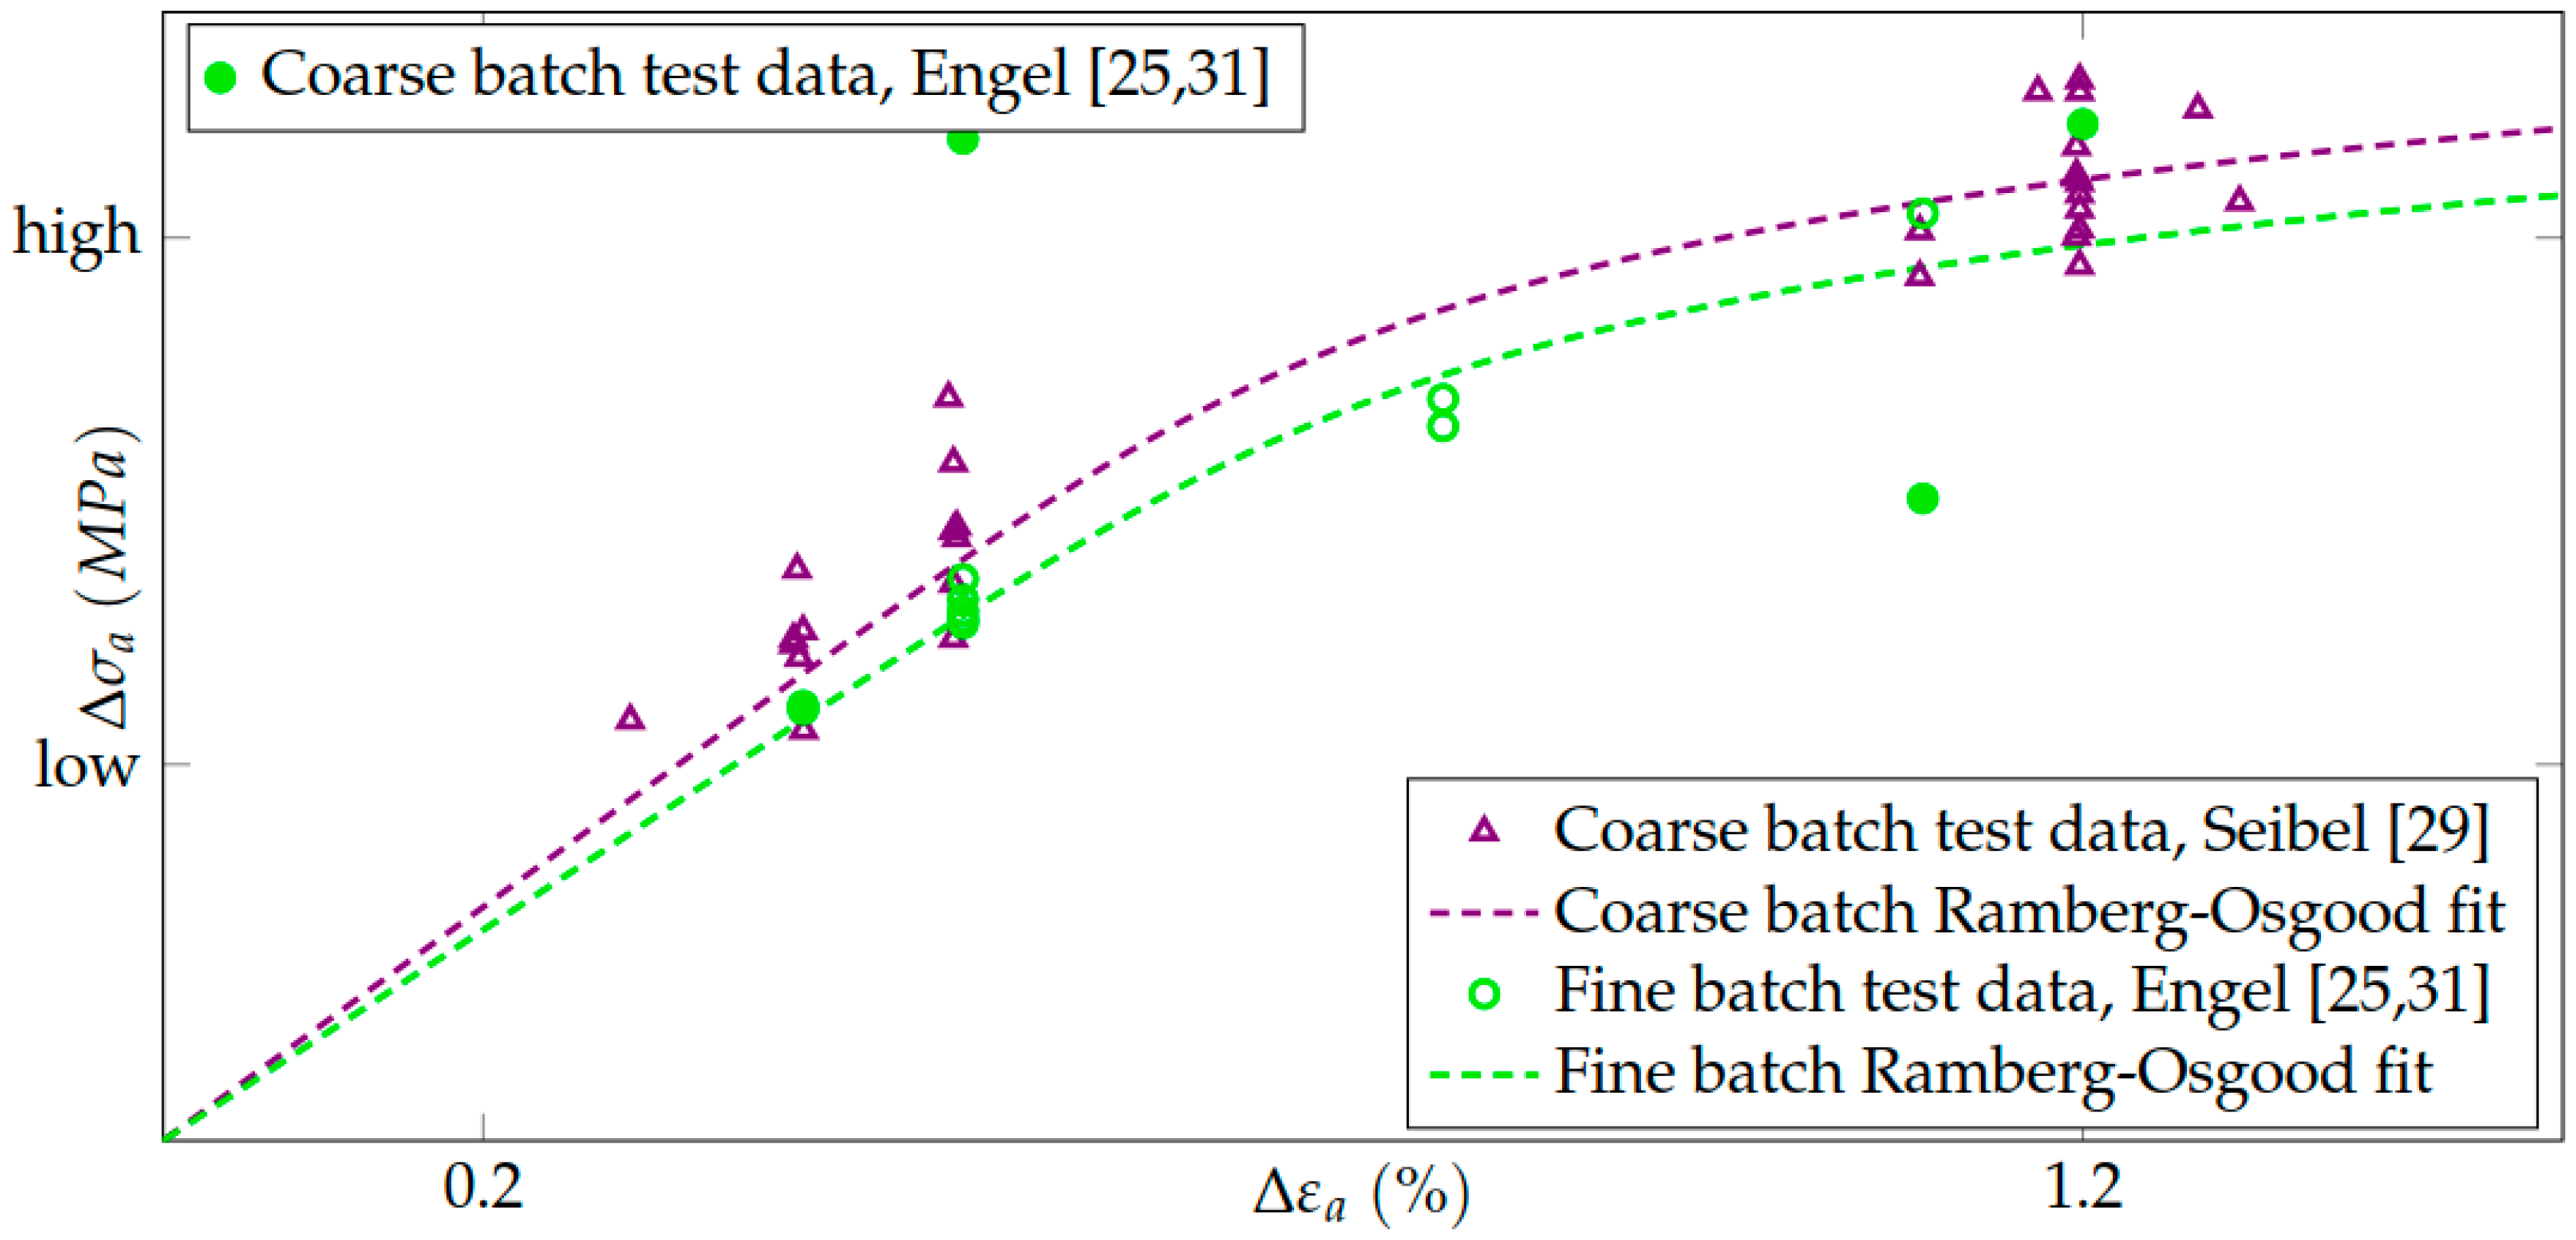
3.2. Results of the Isothermal LCF Tests at 850 °C

Figure 6 shows the cyclic stress-strain data in the stabilized regime and the calibration curves of the respective Ramberg-Osgood model.
It is found that the average cyclic Young’s moduli of the test specimens (global values from hysteresis using extensometer) are different. The value E f i n e from the fine-grained batch with preferential grain orientation is 9.8 % lower than the value of E c o a r s e with approximately random grain orientation ( E c o a r s e / E f i n e 1.11 ) . The Ramberg-Osgood model calibration using the cyclic stress strain data was conducted using only the cyclic strength coefficient K as a degree of freedom. The Young’s moduli from the experiment were set according to the experimental data of the respective batch. Since the amount of data points in the plastic deformation regime was insufficient for a reliable description of the hardening slope determined by the exponent n , an n value for René80 was taken from the Siemens proprietary material data base. The derived K values differ in the ratio K c o a r s e / K f i n e 1.07 meaning the coarse-grained material has also a higher plastic strength than the fine-grained. The results for the experimentally derived Young’s moduli and the calibrated cyclic strength coefficient are discussed in Section 4.1.
The cyclic stress-strain plot in Figure 6 indicates that the coarse grain batches from both data sets (Engel and Seibel) show comparable mechanical behavior as assumed in Section 3.1. The crack initiation life data derived from the 2.5% load drop as crack initiation criterion is presented as strain-life Wöhler plot in Figure 14 for all data sets from Engel [25,31] and Seibel [29]. It is found that the fine grain batch specimen withstands a significantly higher number of cycles at equal strain level. The detailed examination of this findings and graphs of the respective data are presented in Section 3.5.

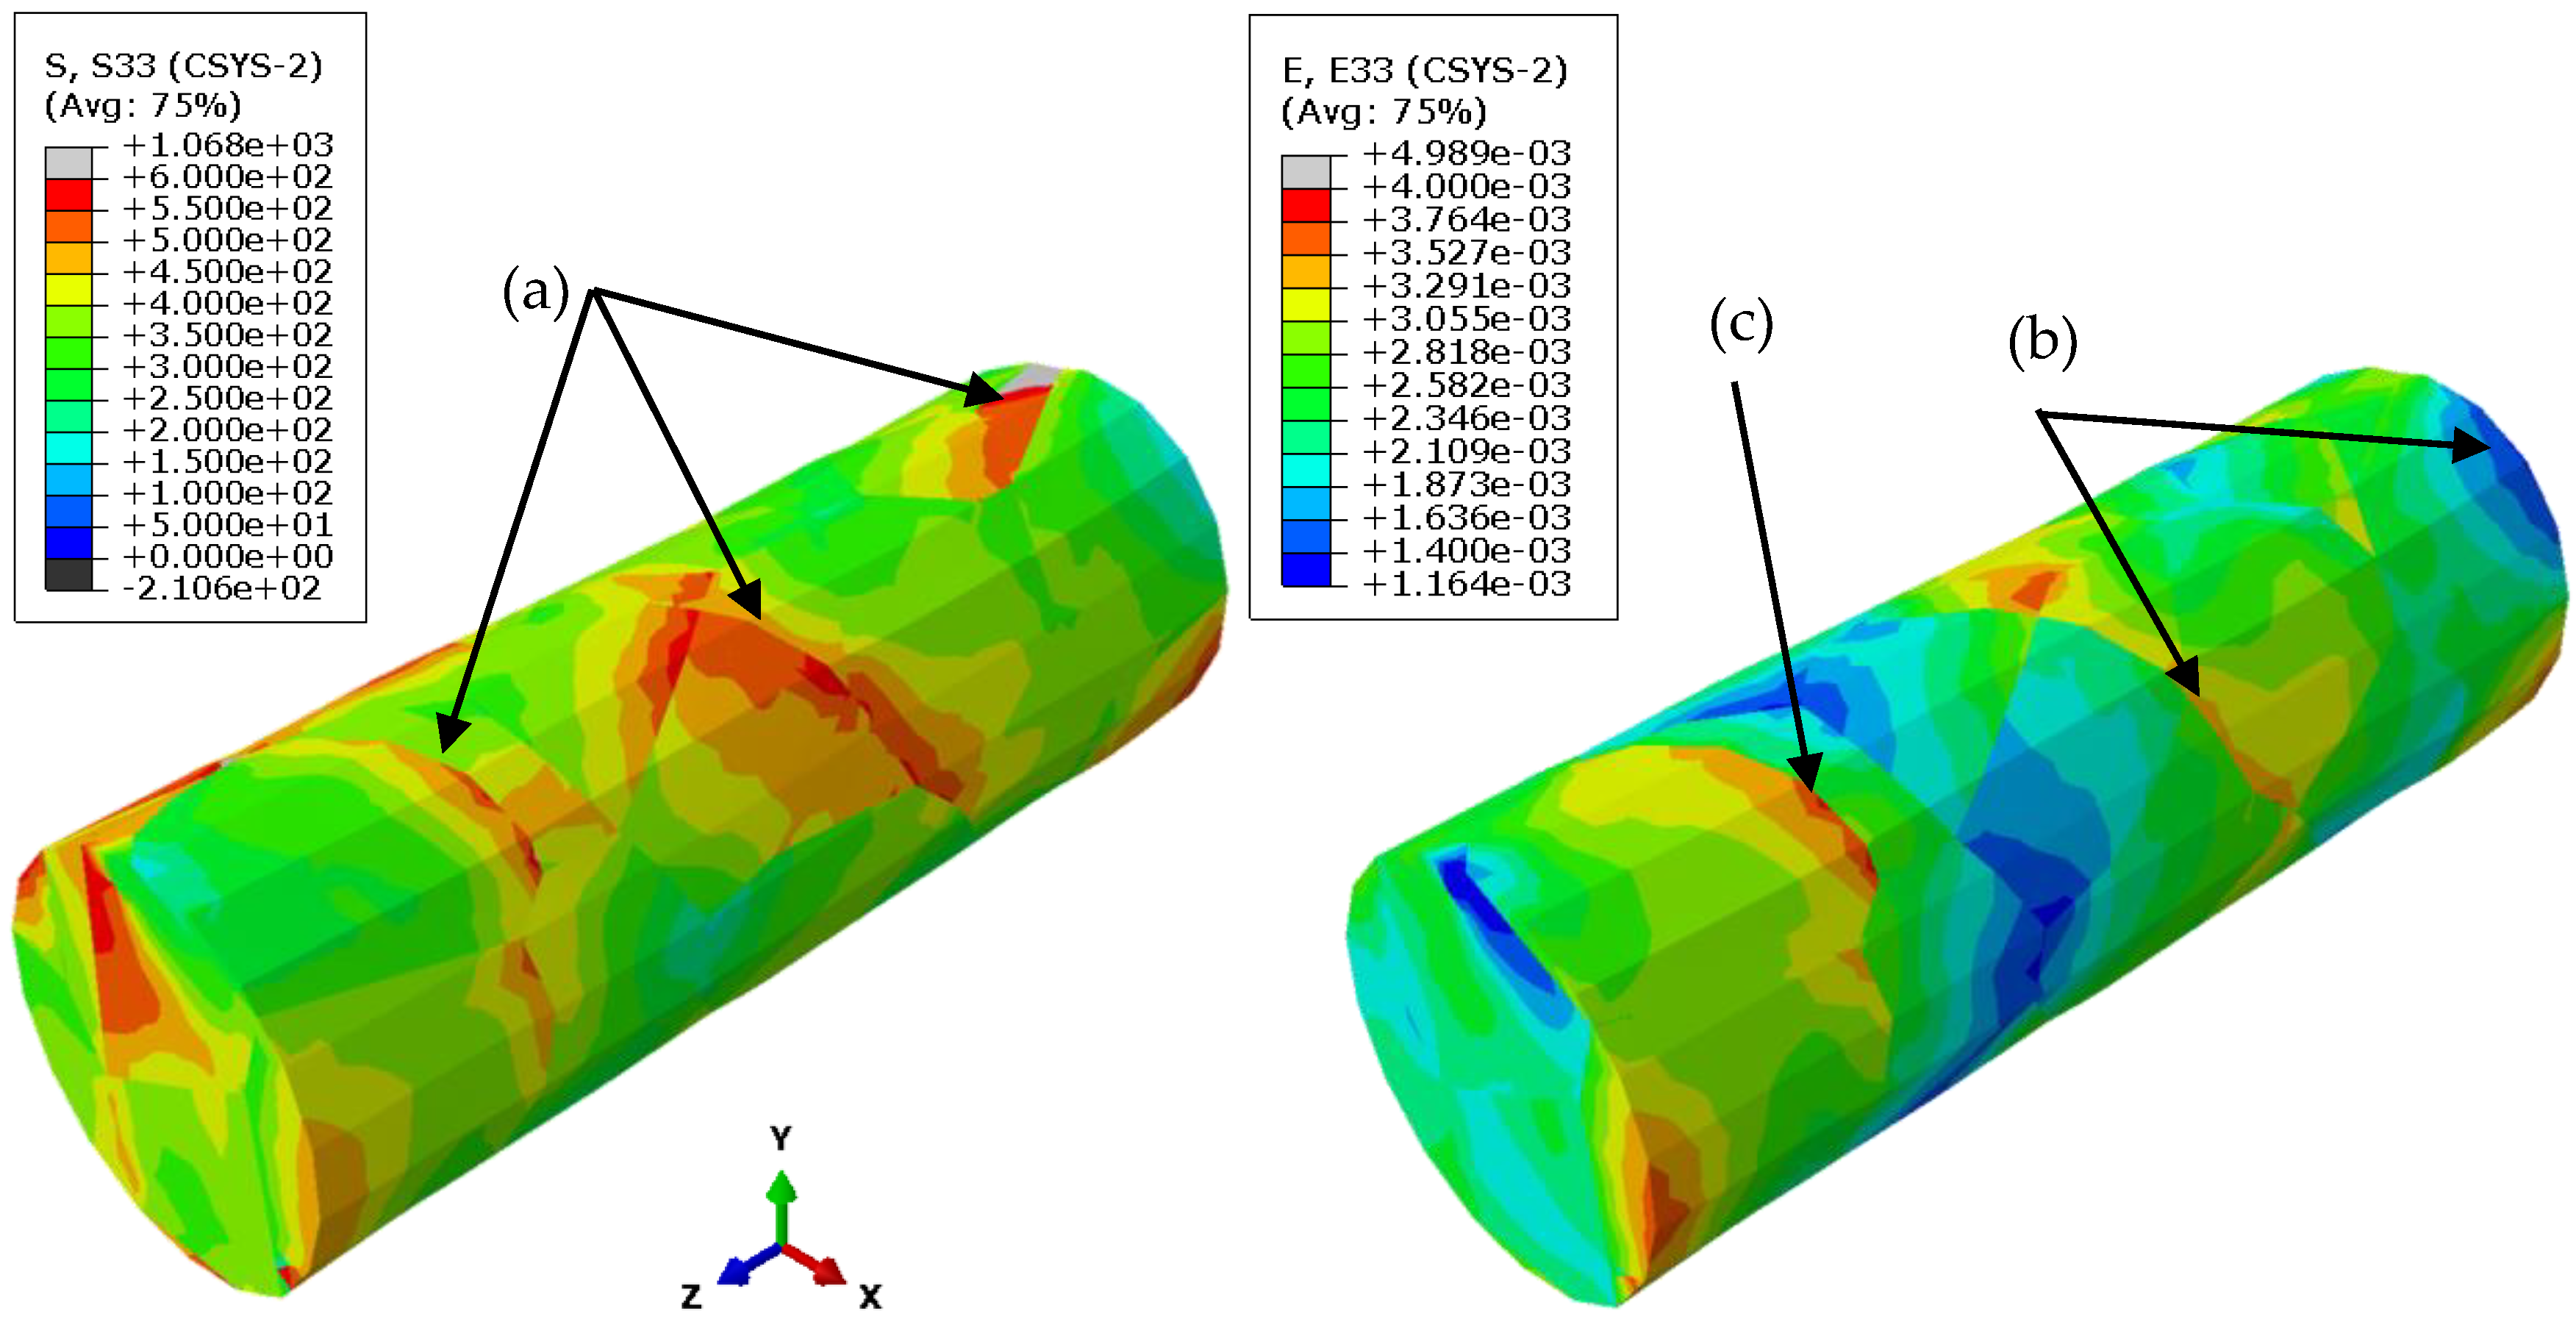
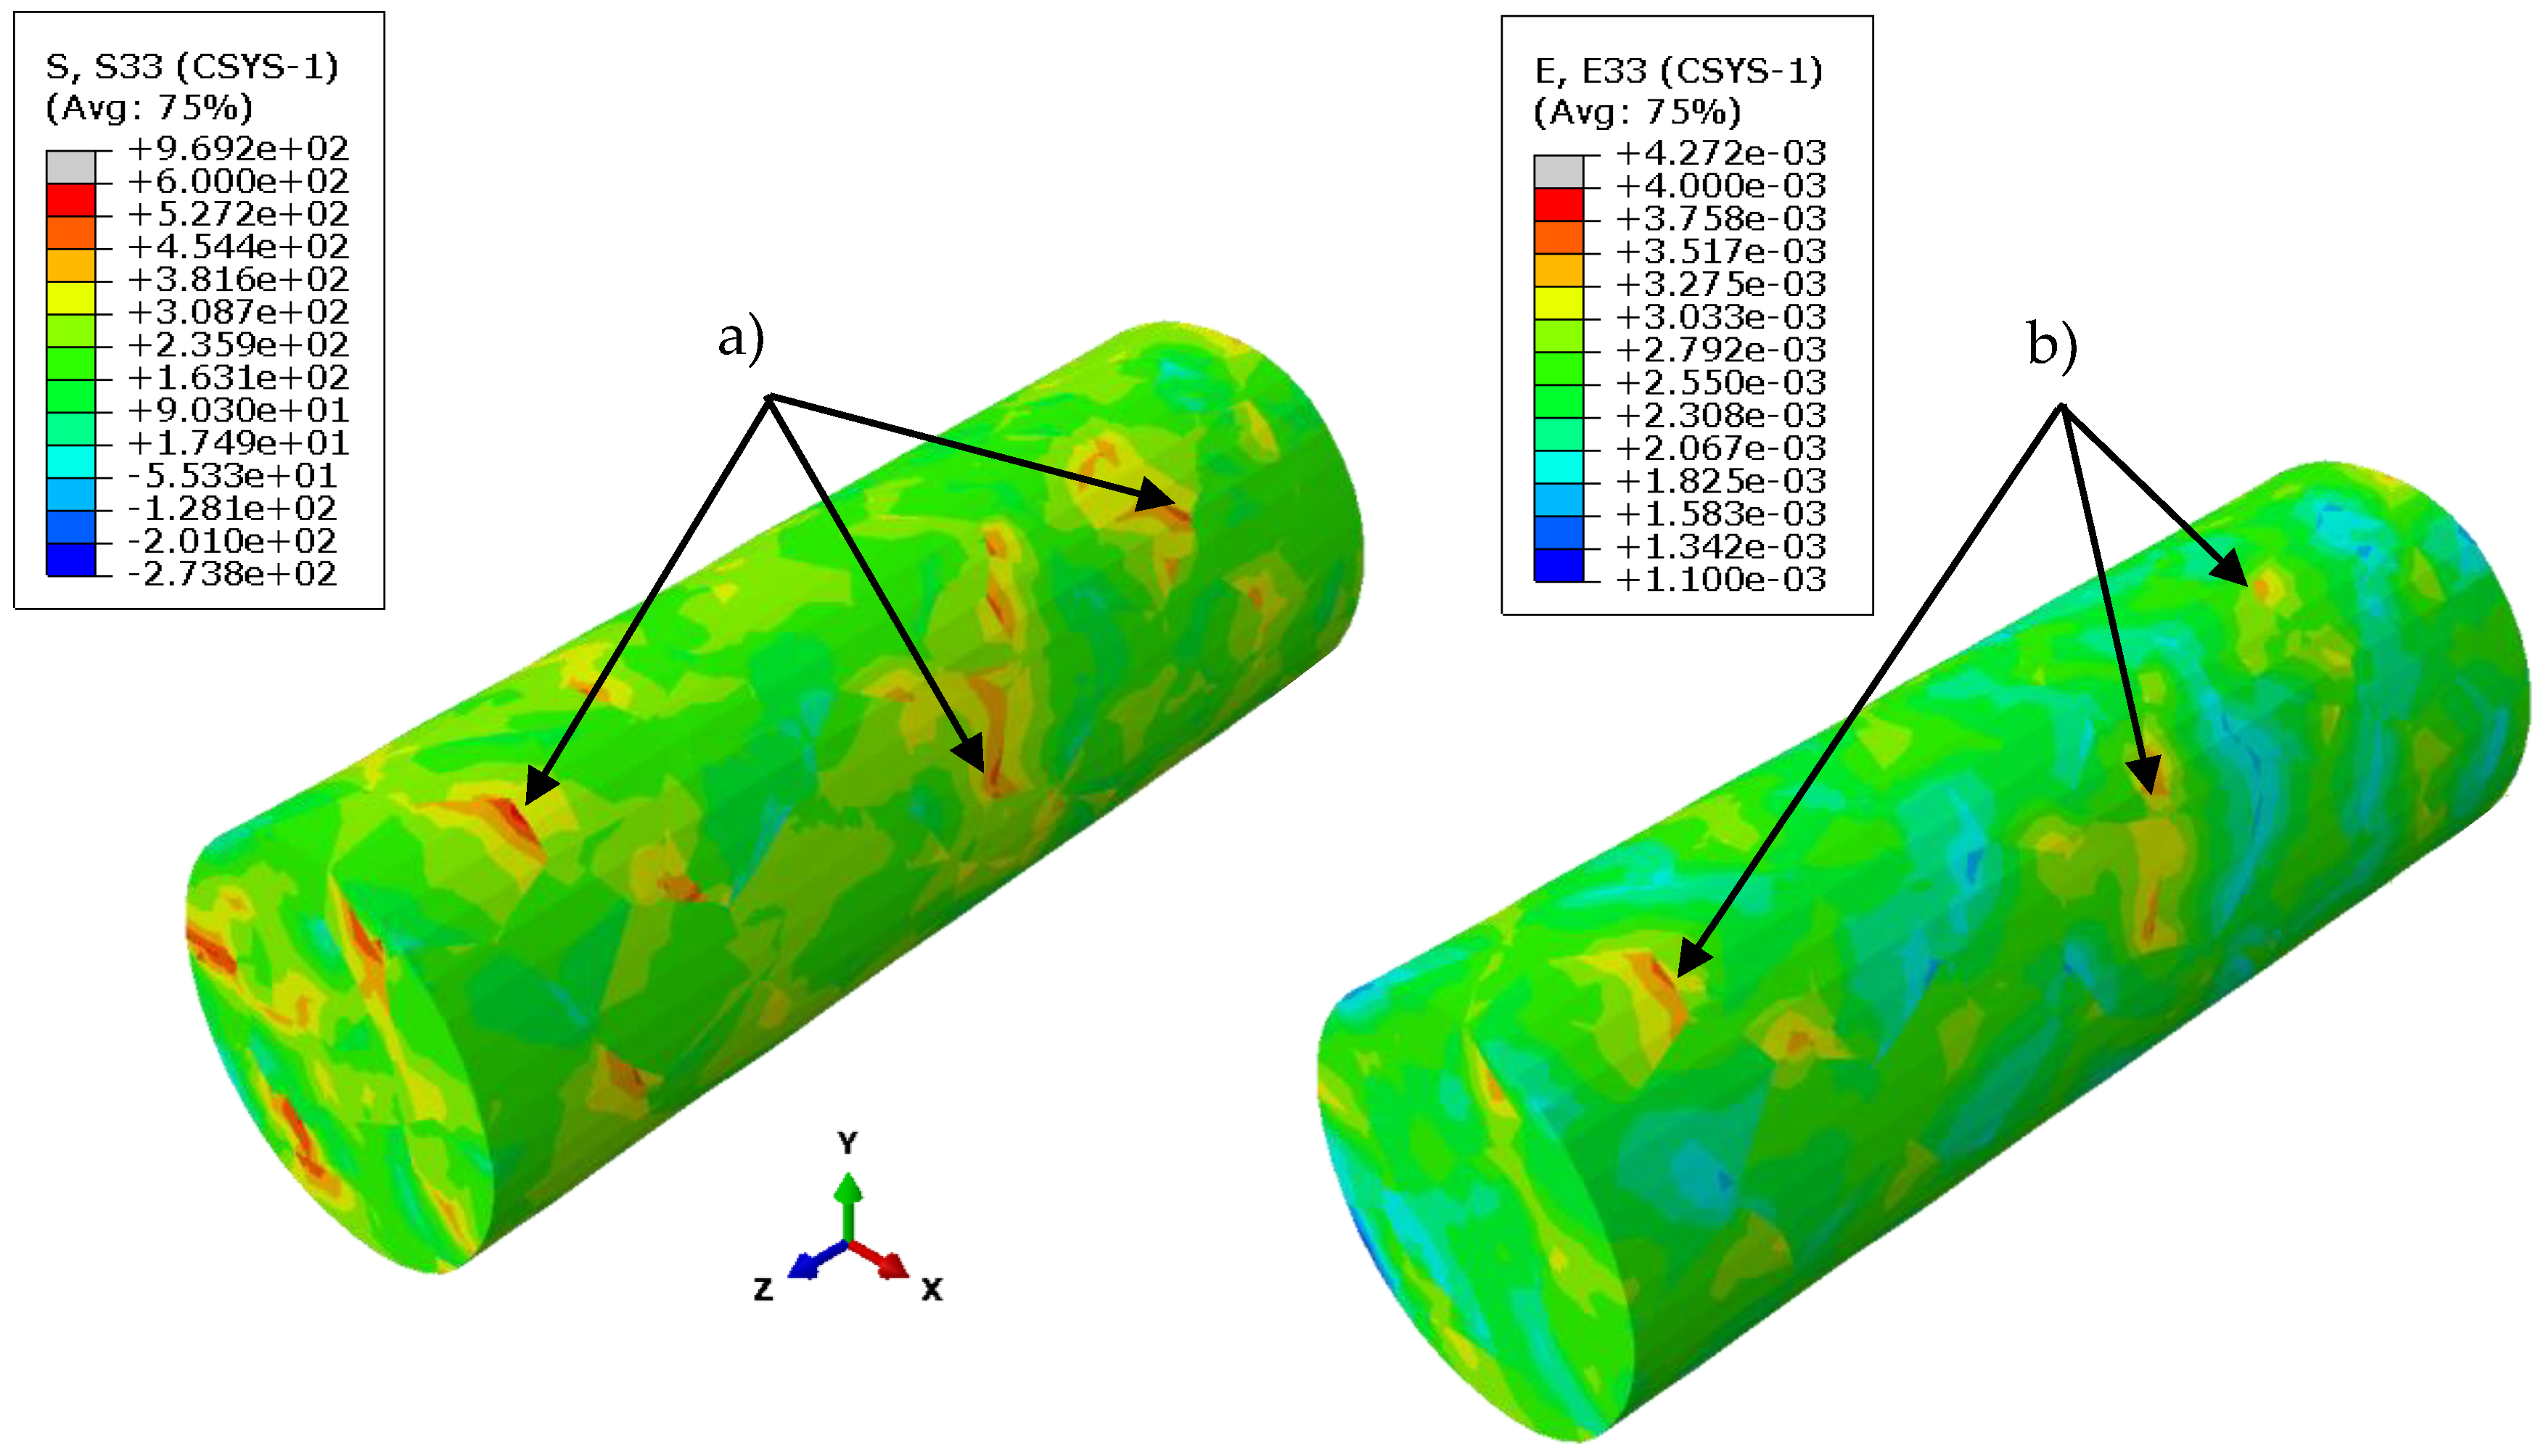
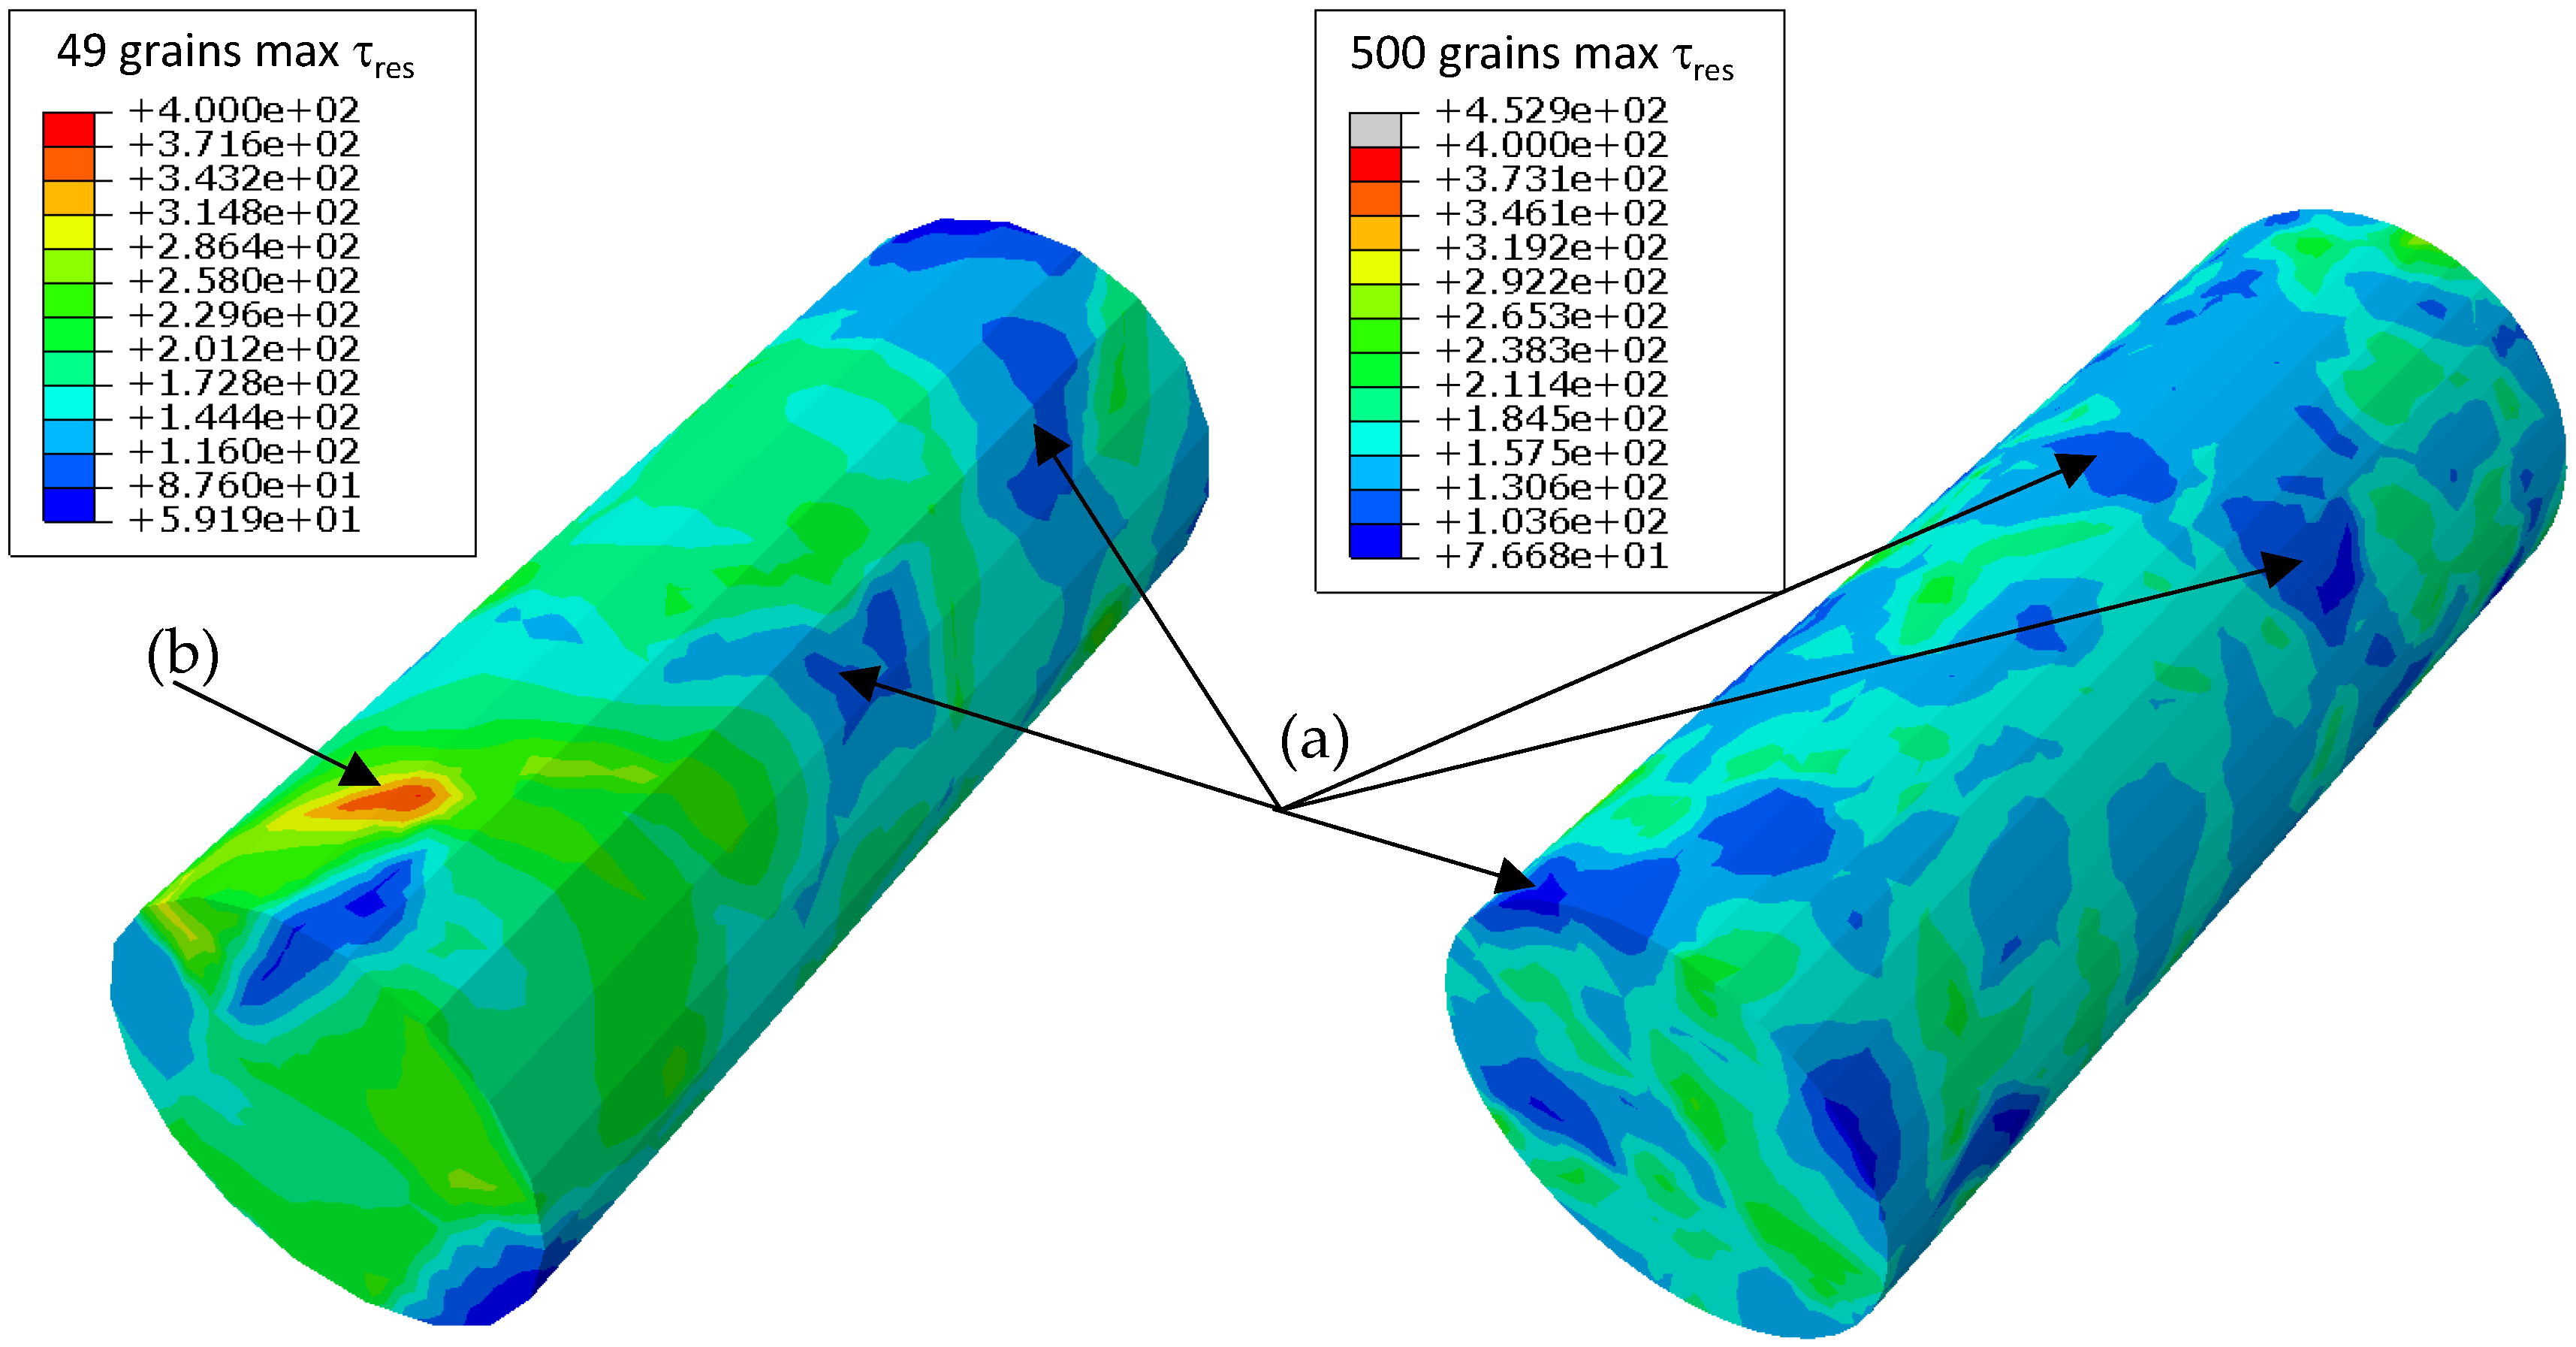
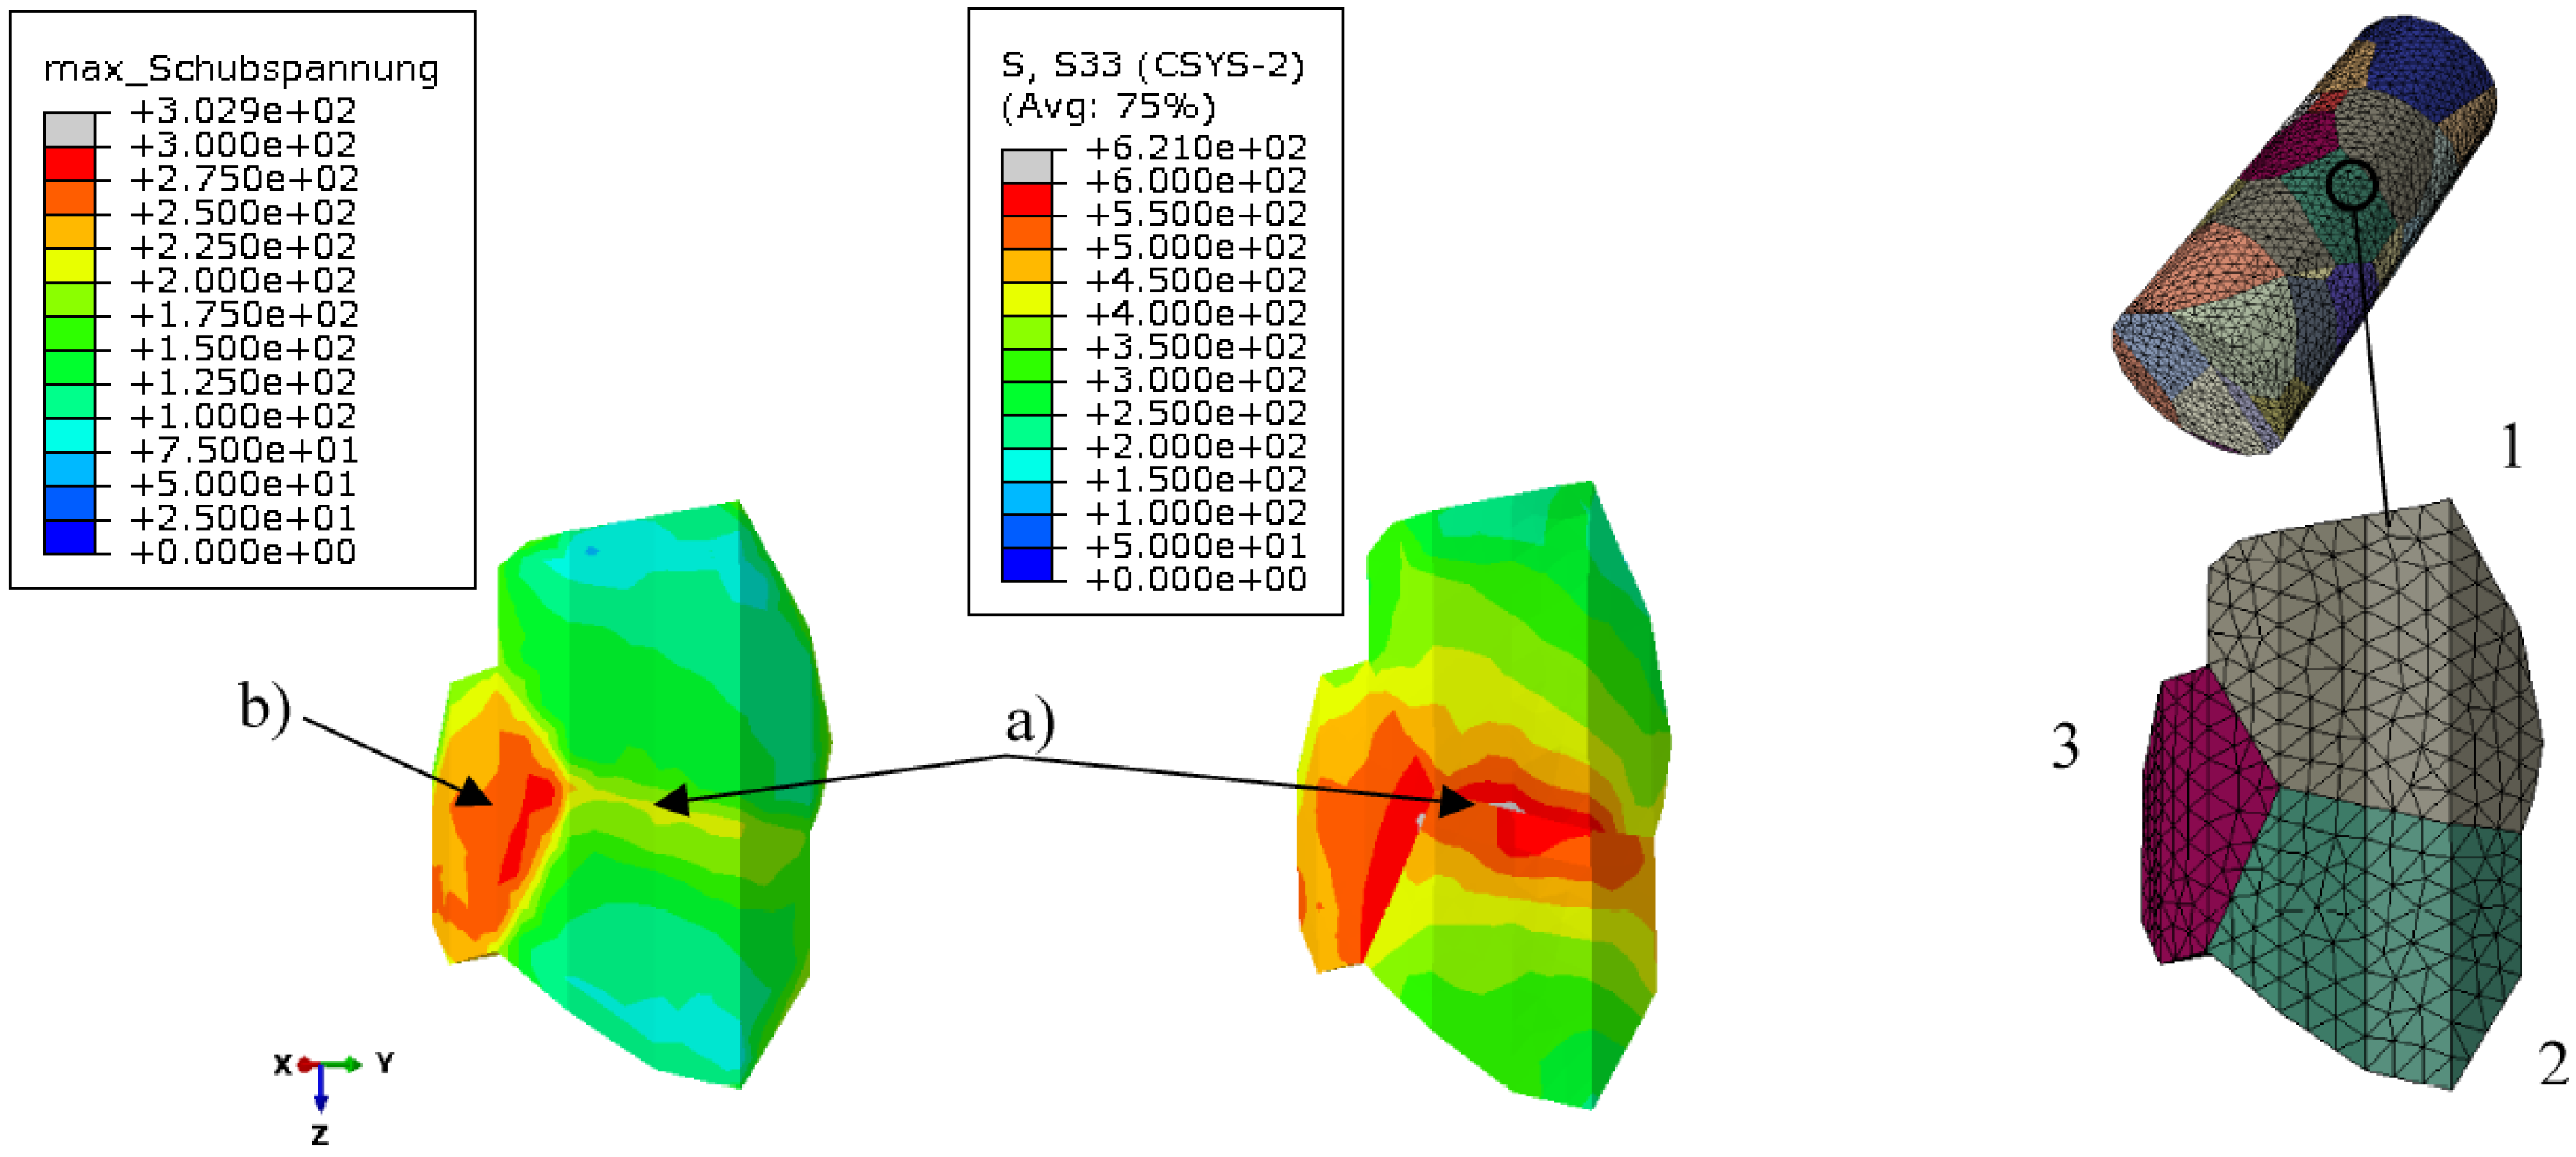
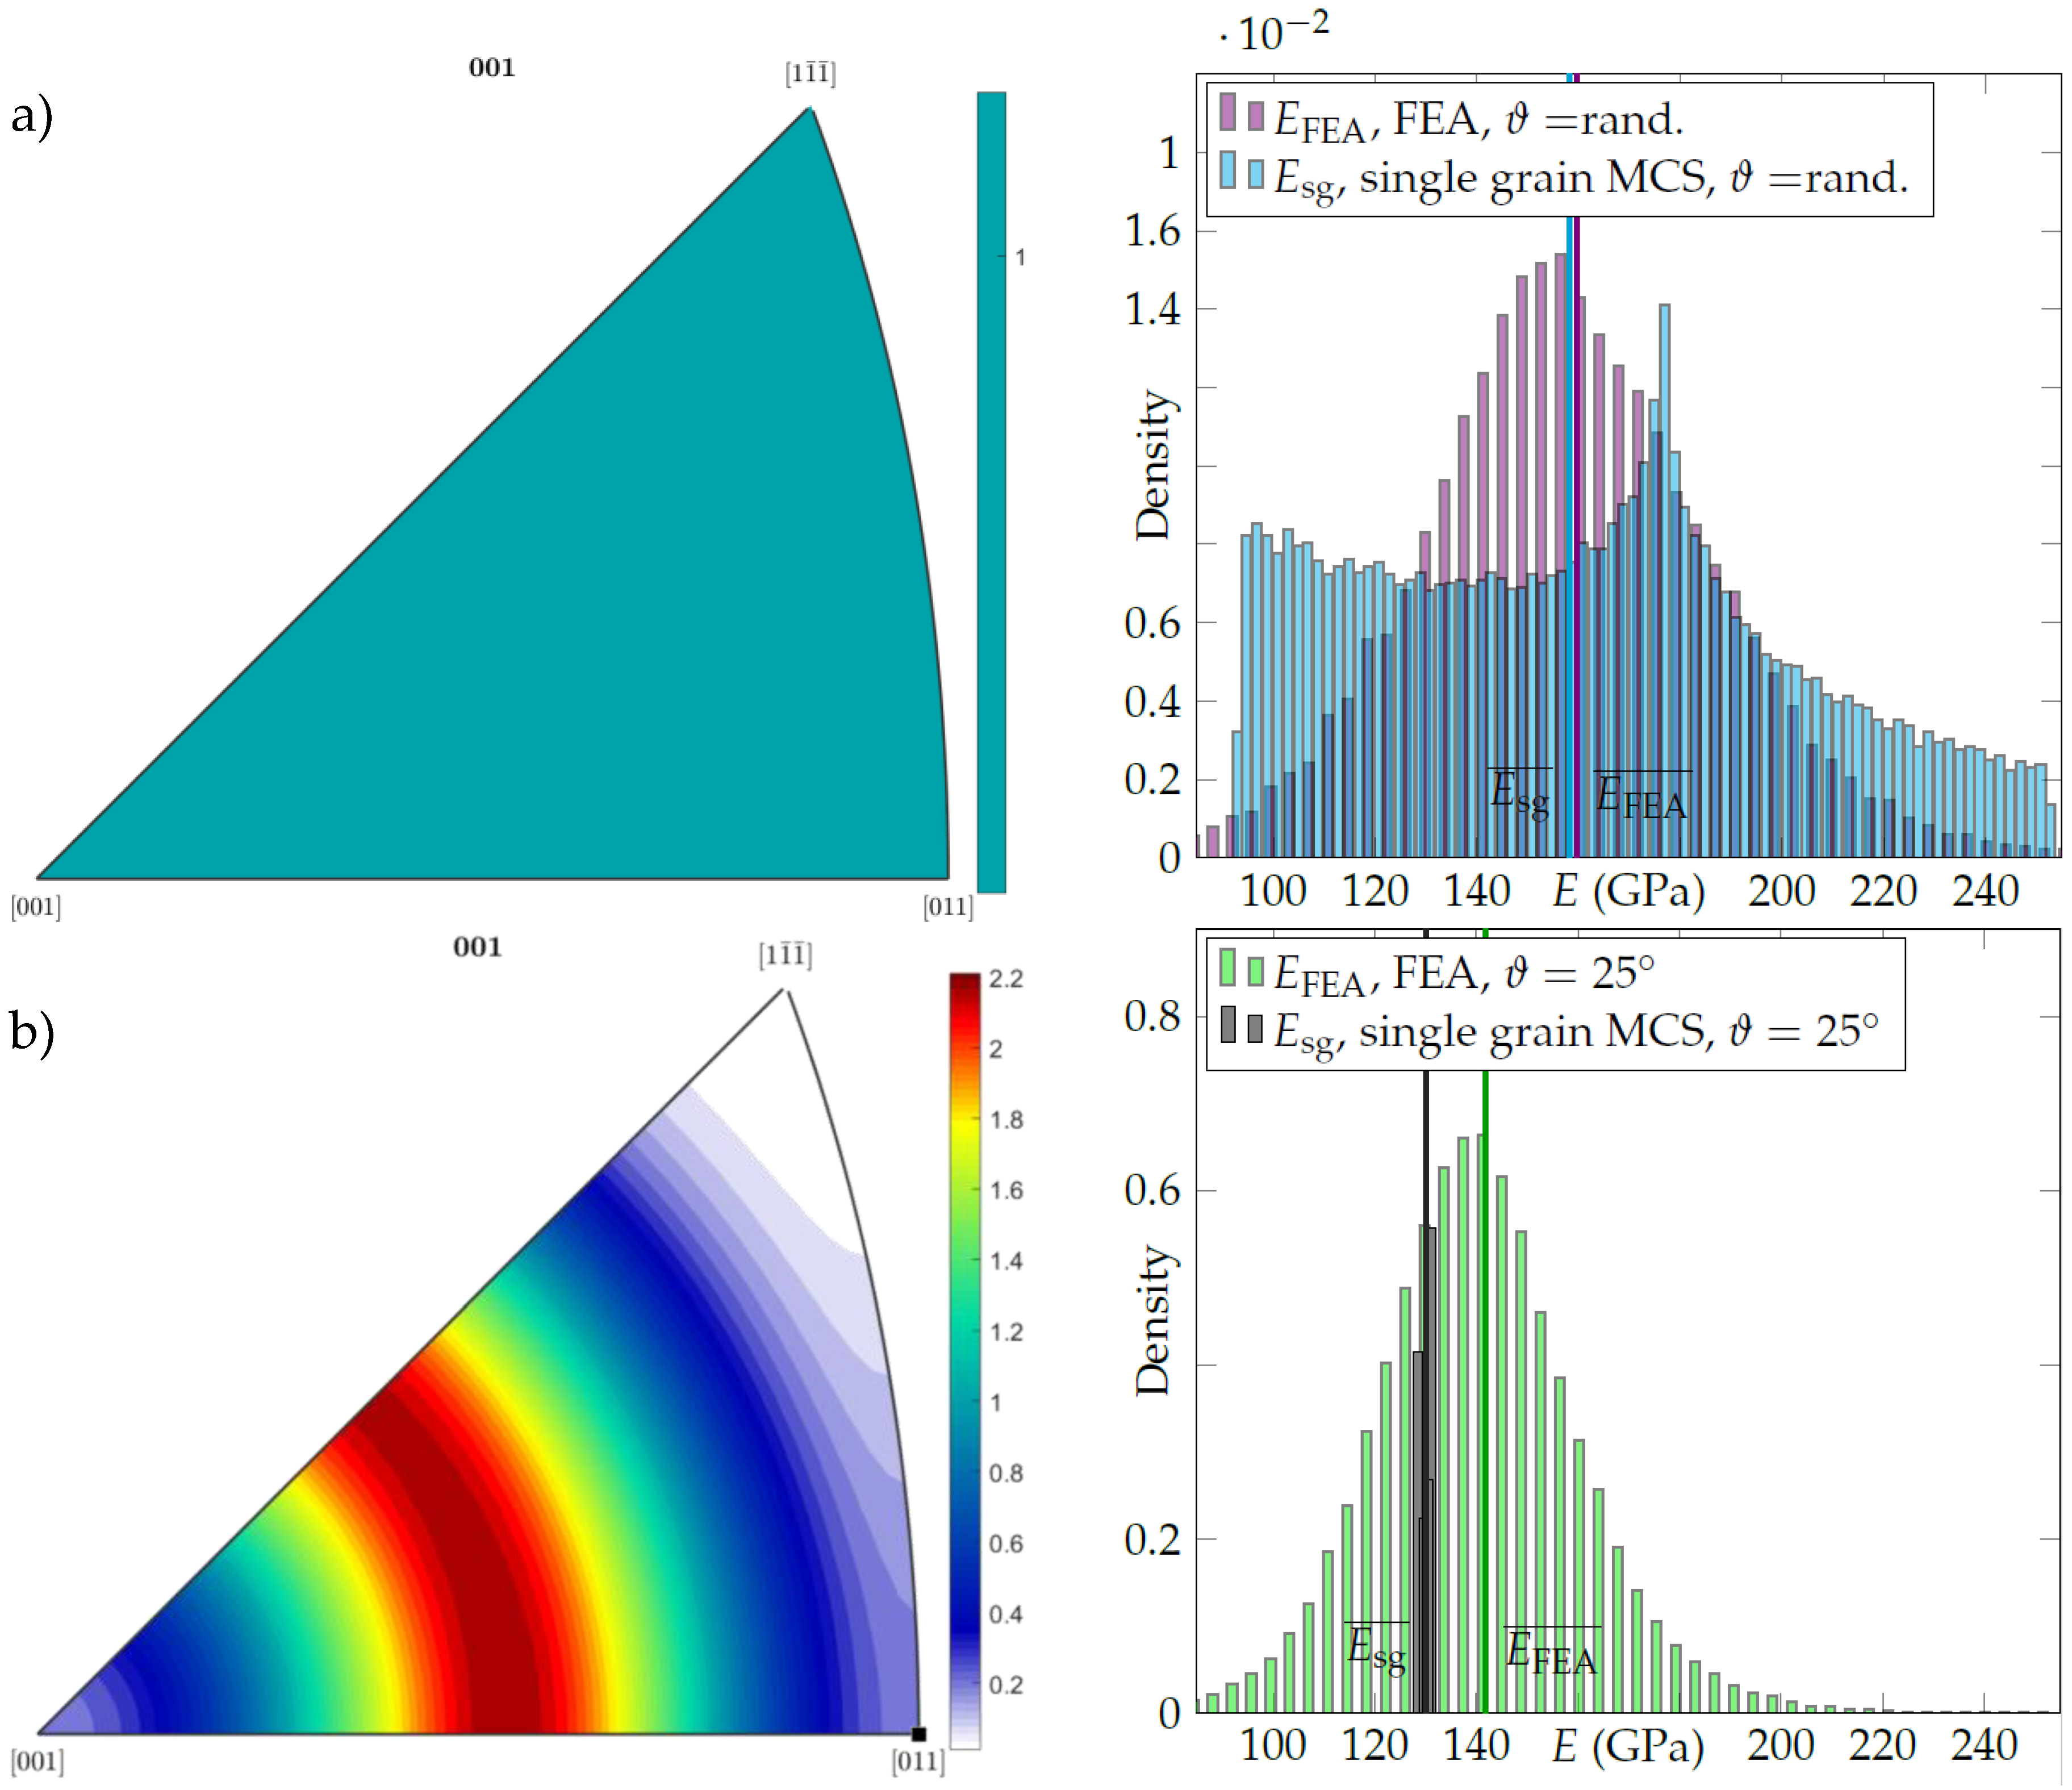
3.3. Results of the Finite Element Simulation

Linear elastic simulations of polycrystalline FEA models were carried out to model the mechanical interactions during an LCF test in a coarse-grained Ni-base superalloy. Therefore, an anisotropic elasticity model of IN 738 LC at 850 °C was applied. Figure 7 shows the computed stress and strain distribution in z-direction for the coarse-grained batch model (49 grains with random orientation distribution) for a globally applied strain of 0.25%. The stress distribution indicates maximal values with more than 600 MPa near some grain boundaries as seen in (a). Most parts of the surface show a significantly lower stress of about 300 MPa. Considering a homogenized Young’s modulus of IN 738 LC of E = 152   GPa a stress of σ i s o = 379   MPa is expected for isotropic modeling.
In contrast to an isotropic material behavior, high stresses do not simultaneously lead to high strains in this anisotropic simulation, as obvious for area (b) in Figure 7. Area (c) shows both, high stresses and high strains. The local strains can vary compared to the globally applied strain by nearly a factor of 2. Hence, local plastic deformation may occur in some grains, despite the globally elastic response. The yield of these grains is however not modelled explicitly. Furthermore, also inhomogeneous stress and strain states within individual grains are observed. Figure 8 shows this for a free cut grain of the previously described specimen.
The examination of the individual nodes in Figure 8 clearly shows that stress and strain are also inhomogeneously distributed within the grains. An evaluation of the stress tensors at each node shows that a globally applied uniaxial stress leads to local multiaxial stress and strain states within the grains. The unidimensional parameter κ is introduced for describing the multiaxiality of the stress tensor using the principal components of the stress deviator σ _ _ .
For   | σ I | | σ I I | | σ I I I | ,   κ = | σ I I I σ I I | | σ I |
For κ = 0, the stress state at the node is equal to a uniaxial load, while κ = 1 is equivalent to a stress state where | σ I | = | σ I I I | which is equal to a full torsional loading on the node. Figure 9 shows the histograms of all κ values calculated from the nodes of both FEA models, the coarse grain model (random grain orientation) and the fine grain model (preferential grain orientation).
The histograms indicate a continuous distribution of κ values across the entire range. No node in the globally uniaxial loaded specimen has a real uniaxial stress state with κ = 0 but also none with κ = 1 . Although the κ distributions differ in dispersion, the median quantiles are similar. κ 50 % = 0.285 for the coarse grain model and κ 50 % = 0.293 for the fine grain model.
As described in Section 2.3, a preferential orientation of the grains was simulated in the fine-grained FEA model (500 grains) in order to accommodate the corresponding observation at the tested material described in Section 3.1. Hence, the rotation matrices were set up such that all grains align their <100> direction at an angle of ϑ = 25   ° towards the specimen horizontal. This correlates approximately to the grain alignment observed in the metallographic etchings (see Figure 5). The Euler angles φ 1 , φ 2 however were assumed to be uniformly distributed as no further distribution information could be derived from the metallographic examination. Figure 10 shows the stress and strain distribution in z-direction computed for the fine-grained batch model for a globally applied strain of 0.25%.
It can be observed, that the surface distribution of stresses is generally more homogeneous than in the coarse-grained material (cf. Figure 7). Small maxima are located at the grain boundaries, as seen in area (a). Large areas of the surface show a stress in loading direction close to the average value of 200 MPa. Furthermore, the strains in loading direction are also very homogeneously distributed and close to the globally applied strain of 0.25%. Occasionally higher values occur in small areas at the grain boundaries as seen in (b). There, they can reach values up to 0.4%. The examination regarding the local stress state multiaxiality is also presented as a histogram for κ in Figure 8.
Comparing the stress fields of both specimen simulations (coarse-grained, isotropically distributed grain orientation with ϑ = r a n d . and fine-grained, preferential grain orientation, ϑ = 25 ° ) it becomes apparent, that peak stress levels in the fine-grained model are comparable to the coarse-grained model. The explanation for both observations is discussed in Section 4.1. A global Young’s modulus E g l o b a l is introduced for comparing the effective stiffness of the specimen models in loading direction.
E g l o b a l = σ z z , n o d e ¯ ε t
Here, σ z z , n o d e ¯ is average of all nodal stresses in loading direction z (see coordinate system in Figure 7.) of all simulated specimens and ε t is the applied total strain. The following Table 3 shows the results for E g l o b a l in dependence of the orientation distribution.
The global Young’s modulus of the textured material model is 18 GPa lower than for the model with randomly oriented grains.

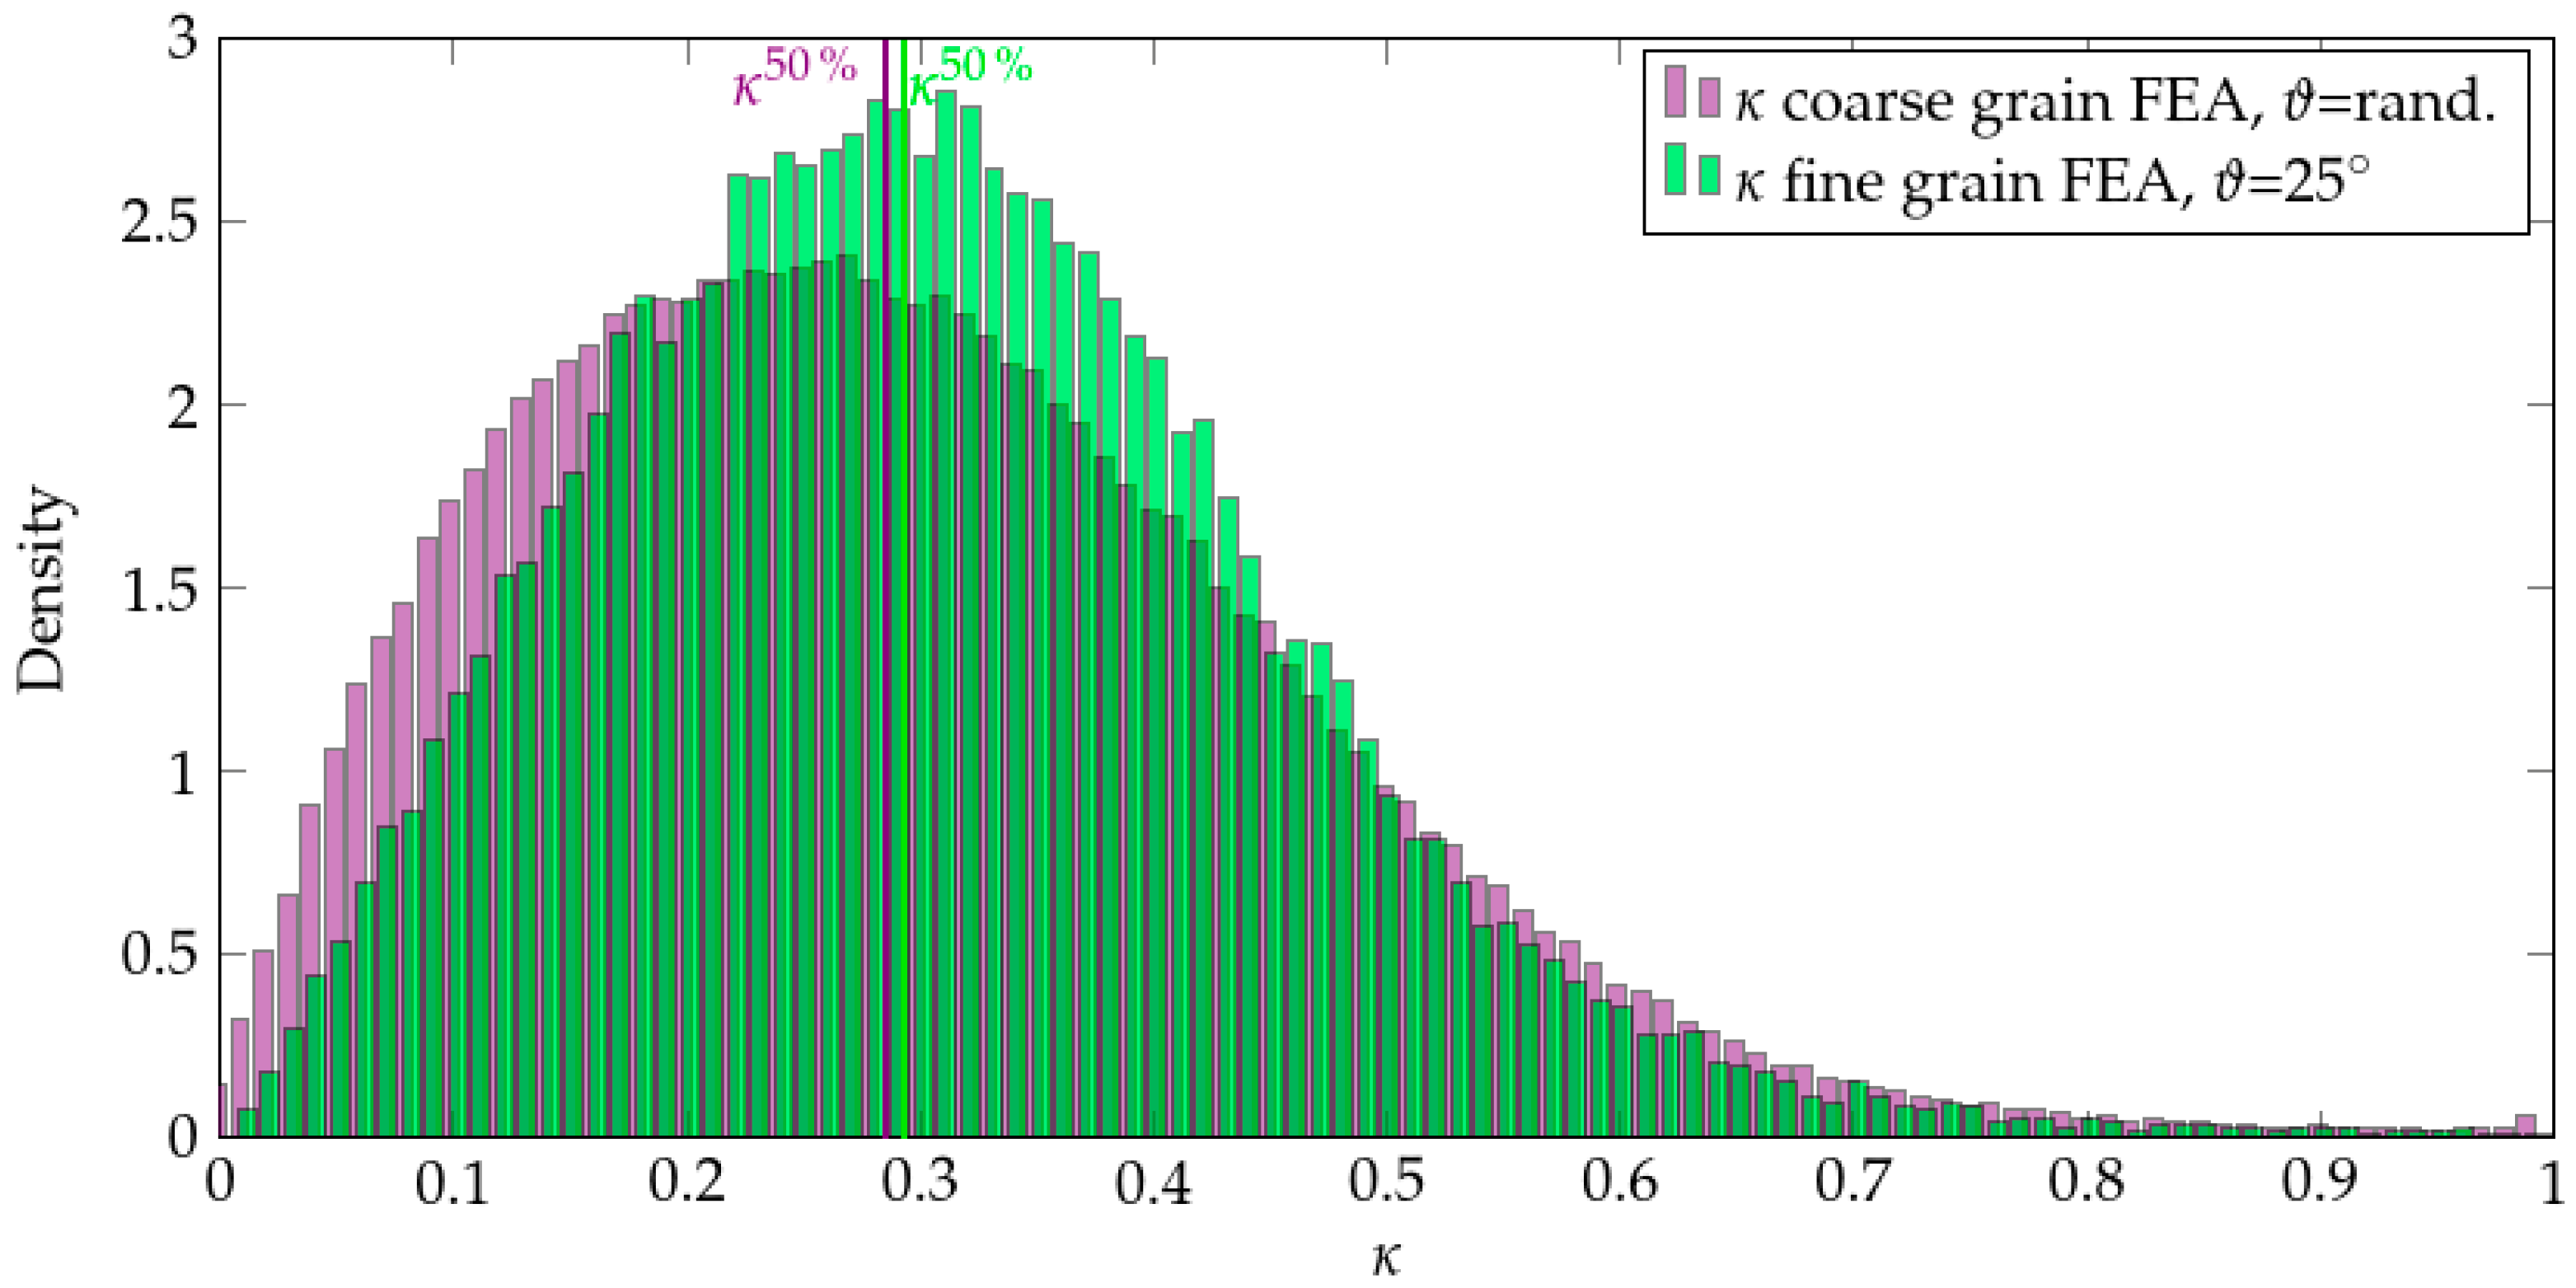
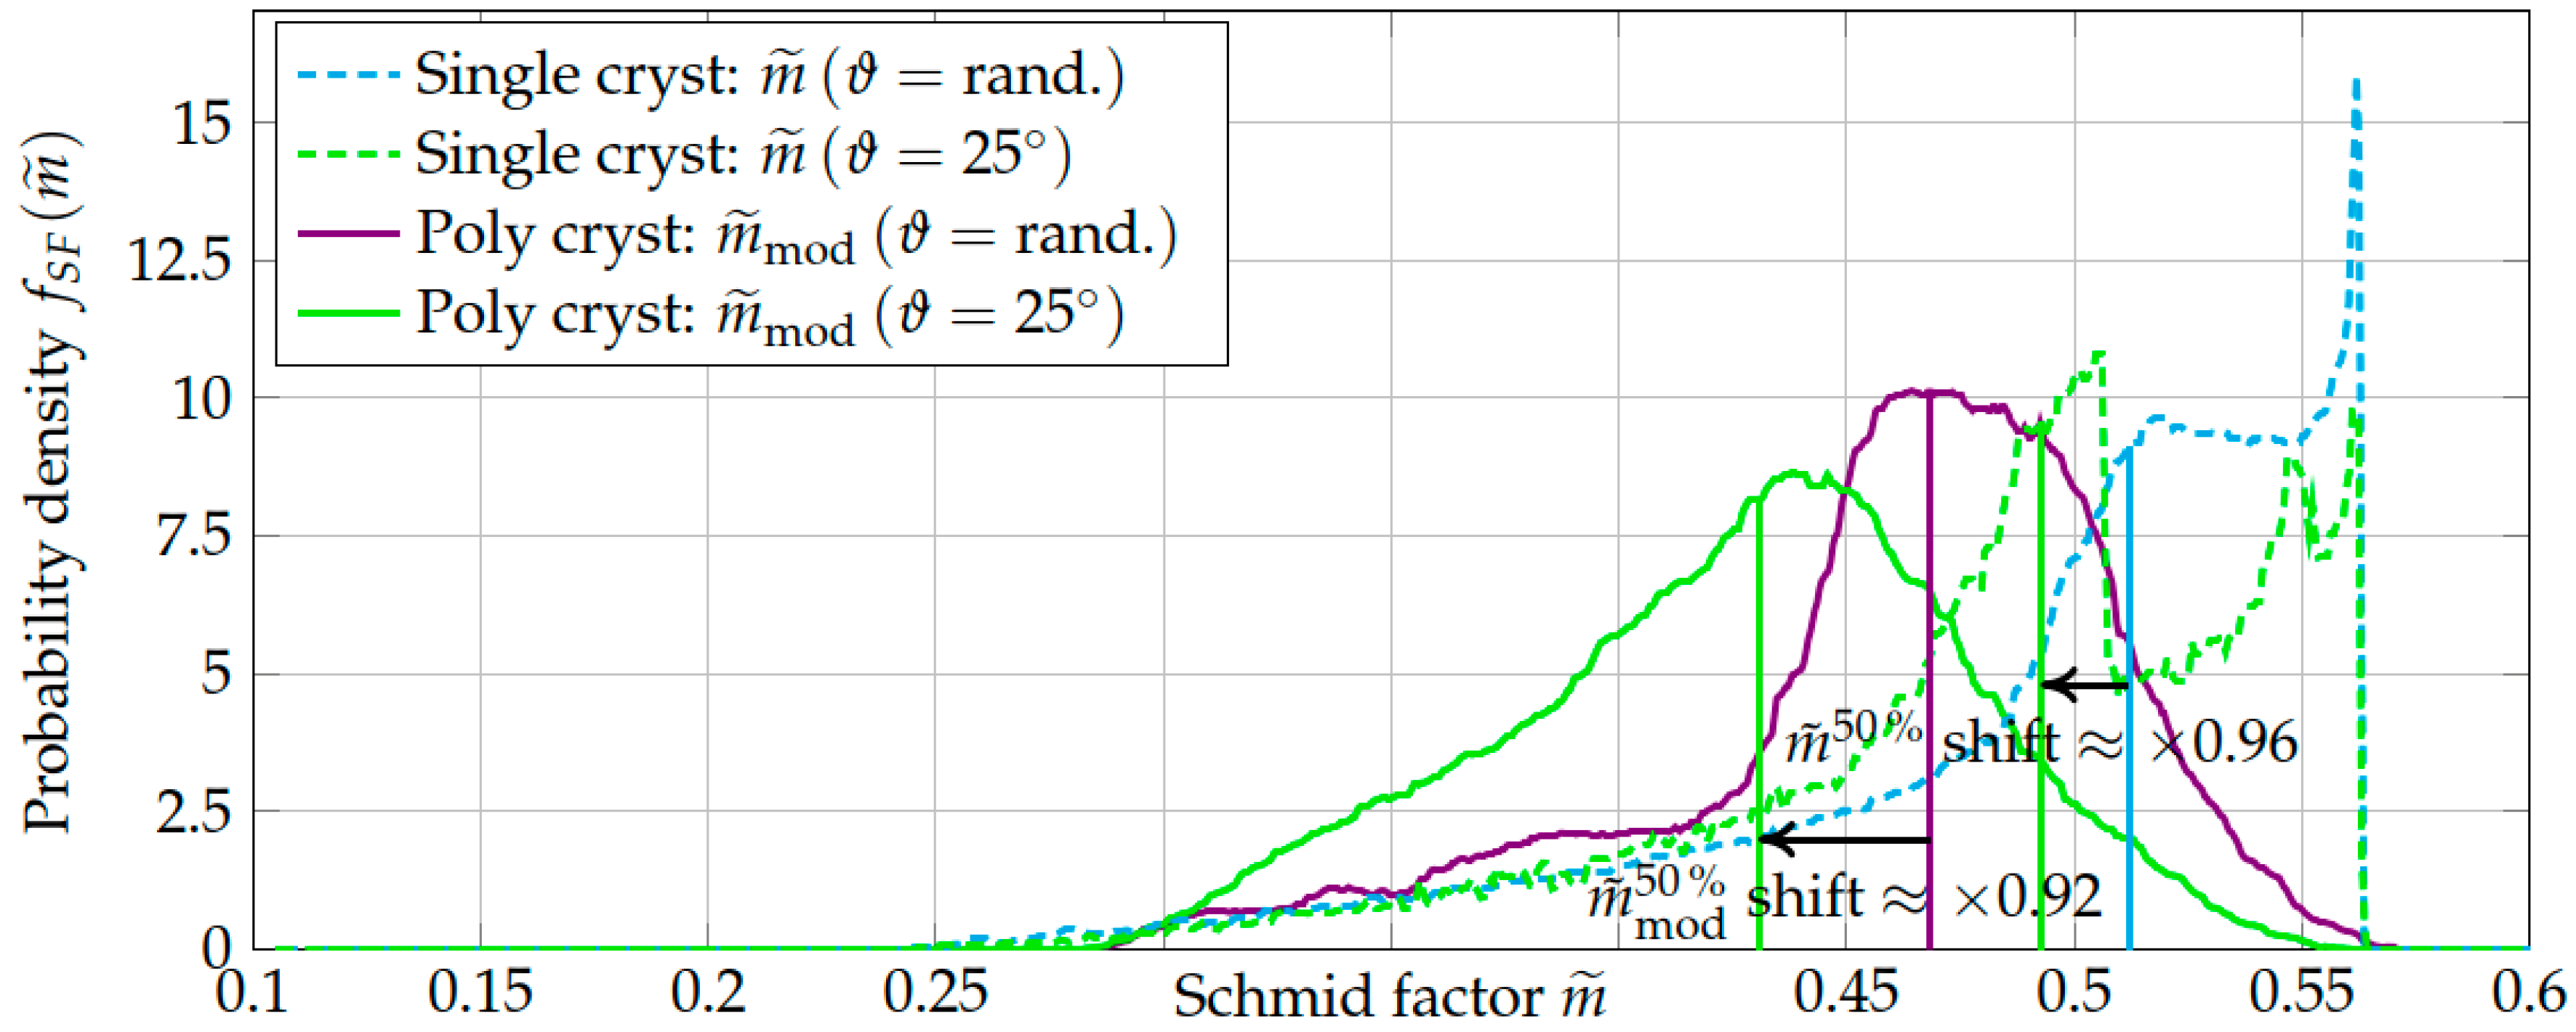
3.4. Results of the Schmid-Factor Distribution Calculations

The resulting shear stresses at the slip systems τ i , j were calculated for both FEA models, using Equation (3). Figure 11 shows the distribution of the maximum resulting shear stresses max i , j ( τ i , j ) at each node of the FEA models. The one with large, randomly orientated grains to the left and the one with smaller, preferentially directed grains to the right. As in Section 3.3, the total applied strain was 0.25% and an anisotropic elasticity model of IN 738 LC at 850 °C was applied.
The spots marked with (a) clearly indicate local minima of the resulting shear stress distribution in the slip systems of the grains. Here, a purely elastic behavior can be assumed because τ r e s < τ c r i t . . These spots occur much more frequent at the surface of the textured specimen model. In addition, the spot in area (b) shows an example of clearly increased shear stresses in the slip systems. There, dislocation movement, i.e., local plastic deformation can be expected. These areas with significantly increased shear stresses were not found at the surface of the fine-grained textured FEA model. Most regions at the coarse-grained model show an average value of τ r s s 250   MPa , while the resolved shear stresses of the fine-grained FEA model fluctuate between τ r s s ( 180 200 )   MPa . Values for the critical resolved shear stresses of René80 are not known to the authors and would have to be determined in further experiments. However, Nitz and Nembach [46] present values of the critical resolved shear stress (crss) for different crystal orientations for the Ni-base superalloy Nimonic 105 (single-crystalline) under compression loads. The highest crss at 850 °C was measured with in [110] direction (325 MPa), the crss for the [111]-orientation is slightly lower (319 MPa) and in [100] it was measured to approximately 290 MPa. Österle, et al. showed for the Ni-base superalloy single crystal SC16 that besides octahedral slip, which is generally assumed in this paper, especially for grain orientations near [111] cubic slip can occur at very high temperatures. The reason is a higher Schmid factor of 0.46 occurring at the [011](100)-slip system compared to 0.293 at the [111](110) slip systems [47]. Due to the statistical rarity, as shown in [31], [111]-orientations with low corresponding octahedral Schmid factors of 0.29 only occur with a probability of <0.5% and are therefore neglected in this work.
Figure 12 shows the z-component of the stress (middle) and maximum resolved shear stress (left) distribution for three grains of the coarse-grained FEA model (49 grains, random orientation). Grain 1 and 2 show the previously discussed high stresses near the grain boundaries (area a). However, the maximum resolved shear stresses at these nodes are low, due to the local grain orientation with corresponding low values for the local Schmid factors. Grain 3 shows high stress and high corresponding resulting shear stress. Therefore, a high local Schmid factor can be observed for this grain.
Figure 12 also shows that the inhomogeneous stress field at the surface nodes leads to an inhomogeneous shear stress distribution, i.e., pronounced shear stress gradients across the grain. As presented in Section 3.3, the polycrystalline FEA simulations have confirmed the observed differences in the global Young’s modulus between the two specimen models (randomly oriented grains and preferentially oriented grains). It was also of interest whether a systematic effect of grain orientation could be found for the crack initiation life. For that reason, the Schmid factor distributions for both polycrystal realizations were computed with the two approaches explained in Section 2.4.
In the first approach two Schmid factor distributions F S F ( m ˜ ) are created by rotating a single crystal lattice using Monte-Carlo sampled rotation matrices U ( ϑ , φ 1 , φ 2 ) from the isotropic distribution of orientations and calculating the Schmid factor according to Equations (2)–(4). This corresponds to the coarse-grained material batch. The effect of the preferential grain orientation in the fine grain batch (see Section 3.1) was modelled by creating a distribution of rotation matrices U ( φ 1 , φ 2 , ϑ = 25 ° ) with fixed Euler angle ϑ to 25 ° while the other Euler angles φ 1 and φ 2 were uniformly distributed. This corresponds to the observation of the <100> alignment to the specimen horizontal and the assumption of no preferential orientation of the other crystal directions.
In the second approach, the Schmid factors were calculated from the nodal stress states in the three different realizations (different grain rotations) of the two polycrystalline FEA models. The resulting Schmid factor distribution densities of the two modeling approaches are compared to each other in Figure 13.
Figure 13 visualizes that the Schmid factor distribution densities derived from polycrystalline FEA simulations are less structured, resulting in lower median values than the densities from the first, purely geometric approach (see Table 4). The distributions from nodal Schmid factors are also broadened, especially towards the upper tail. Particularly the distribution for a randomly oriented single crystal at purely uniaxial load has a concentration at high Schmid factors. Values larger than 0.5 are reached because of the elastic anisotropy. This is discussed in more detail in Section 4.2. Figure 13 further shows that the median values of the Schmid factor distributions are shifted to lower values for the cases where a preferential orientation was modeled. The median shift for m ˜ m o d 50 % (FEA model approach) is more significant.
These differences will affect the calibration and prediction result presented in the following Section 3.5.

3.5. Procedure of the LCF Life Calibration and Prediction

Three different probabilistic fatigue models were created and calibrated only with the LCF data of the coarse-grained batch (random grain orientation). They are then used for prediction the LCF life distribution of the fine-grained batch (preferential grain orientation). All values commonly use the CMB model (2.5) as deterministic baseline for the median curve modeling but use different distributions. They are listed Table 5 below.
The aim of creating these three models is to evaluate their applicability for predicting the observed differences in crack initiation life between the two tested batches. The latter two Schmid factor-based models are taking the grain orientation into account. The applicability of each model is tested by visual comparison of calibration and prediction curves, and the associated negative log-Likelihood. The life differences of the strain-Wöhler curves are quantified at a strain range Δ ε c o m p = 0.6 % , which is common for all three analyses. Equivalently to the Ramberg-Osgood model calibration, all CMB model calibrations use fixed exponents b and c as not enough test points in the plastic deformation regime exist to confidently calibrate a slope for the elastic-plastic branch c which in return largely influences the slope b of the elastic branch when calibrated. Hence, Siemens proprietary values for b and c for René80 are used here as well and only the cyclic fatigue strength coefficient σ f and the cyclic fatigue ductility coefficient ε f are calibrated with the coarse-grained batch data and the same values are used for predicting the fine-grained batch data. Furthermore, all calibrations and predictions were conducted using the respective average value for the Young’s modulus of each batch. During the calibration of the model CMB with Weibull distribution, the Weibull shape value m is also calibrated at the test data. The presented strain-Wöhler curves are drawn by interpolating the median values of the respective LCF life distribution along the strain axis.

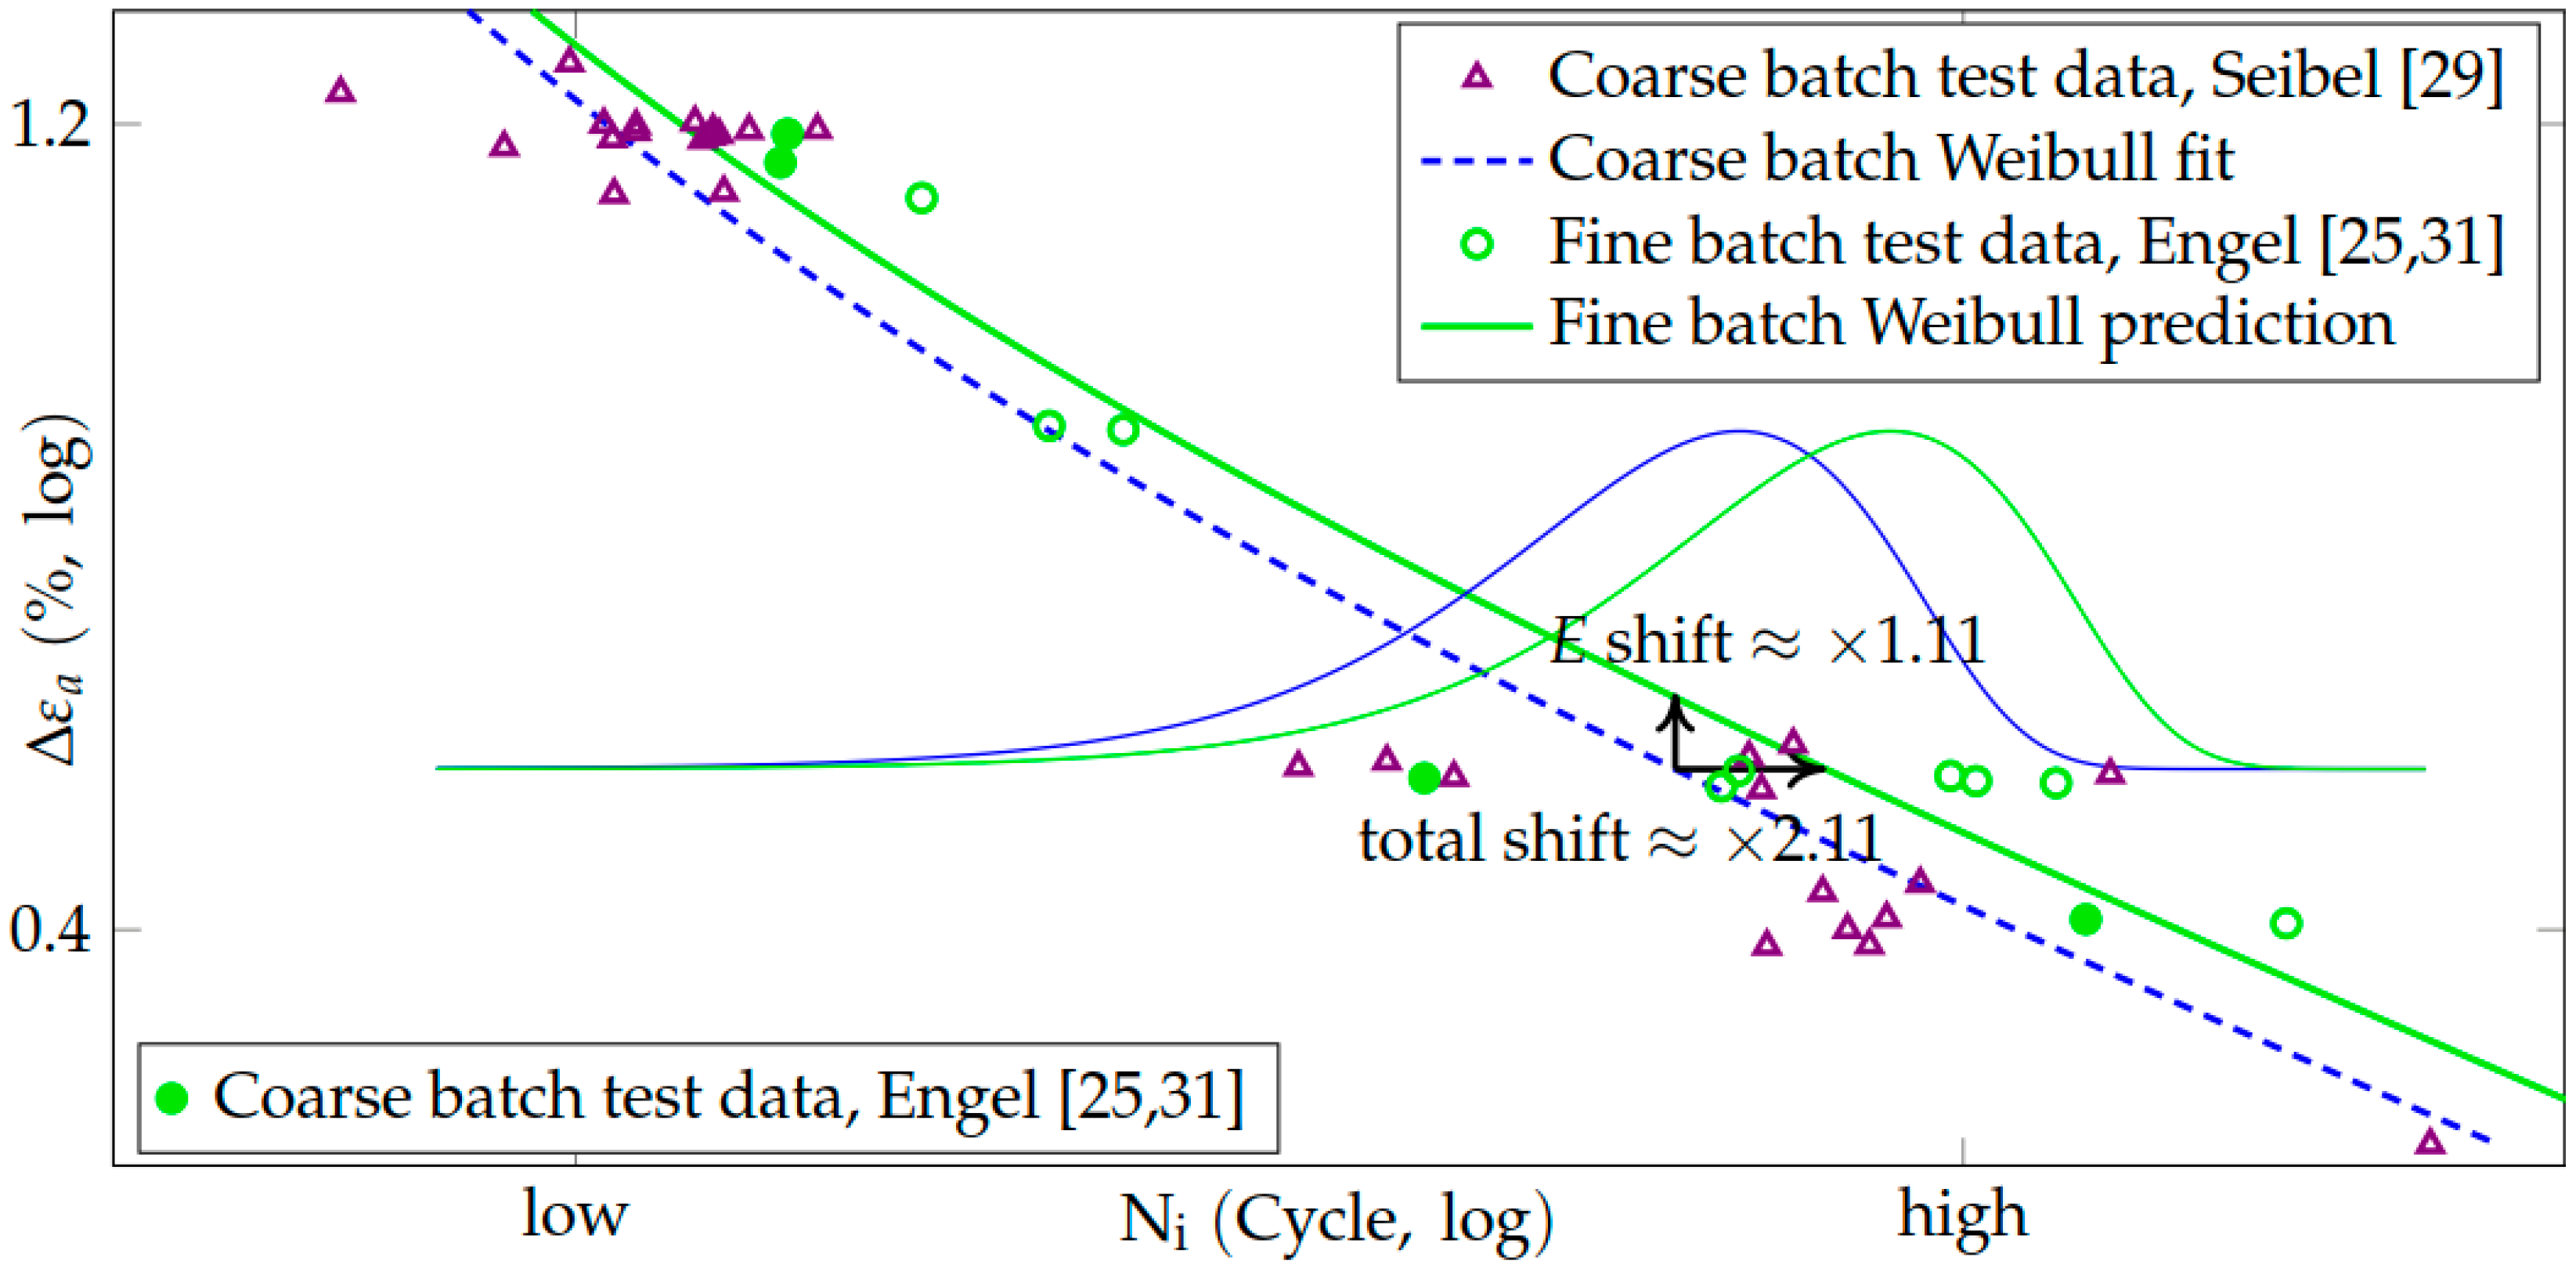
Prediction of the Wöhler Curve from a Weibull Distribution

The strain-life Wöhler plot in Figure 14 contains all LCF data from the present work and the LCF data set from Seibel [29]. As mentioned in Section 3.2, the data of the coarse-grained batch generated by Engel [25,31] and the presented data of Seibel [29] show comparable fatigue behavior due to the similar microstructure and grain size. Moreover, the grains in both material batches (Seibel and Engel-coarse) seemed to be oriented randomly, according to the isotropic distribution of orientations. Since the data set from Seibel contains many more values, only those are used for calibrating the probabilistic LCF models. The other coarse grain batch test points from Engel [25,31] are therefore not shown in the further strain-life Wöhler plots. Figure 14 shows the test points as well as the calibrated and predicted strain Wöhler curves given by the median of the Weibull LCF life distribution.
The CMB model was calibrated with the coarse-grained batch test data. The LCF life distributions are qualitatively equal (relative dispersion) for both data sets since the Weibull shape value calibrated with the coarse grain batch data set is also used for the prediction curve of the fine grain batch. The difference between fit and prediction curve results only from the different values of global Young’s modulus. The lower value of E f i n e compared to E c o a r s e ( E c o a r s e / E f i n e 1.11 ) causes a positive shift of the fine batch prediction curve in Δ ε a direction and effectively results in shift towards higher LCF life by a factor of 2.11 at Δ ε c o m p . Hence, the Weibull model explains the increased crack initiation life observed in the strain controlled LCF experiments only with the decreased stiffness of the fine grain batch material (preferential grain orientation).
N f i n e 50 % 2.11 · N c o a r s e 50 %

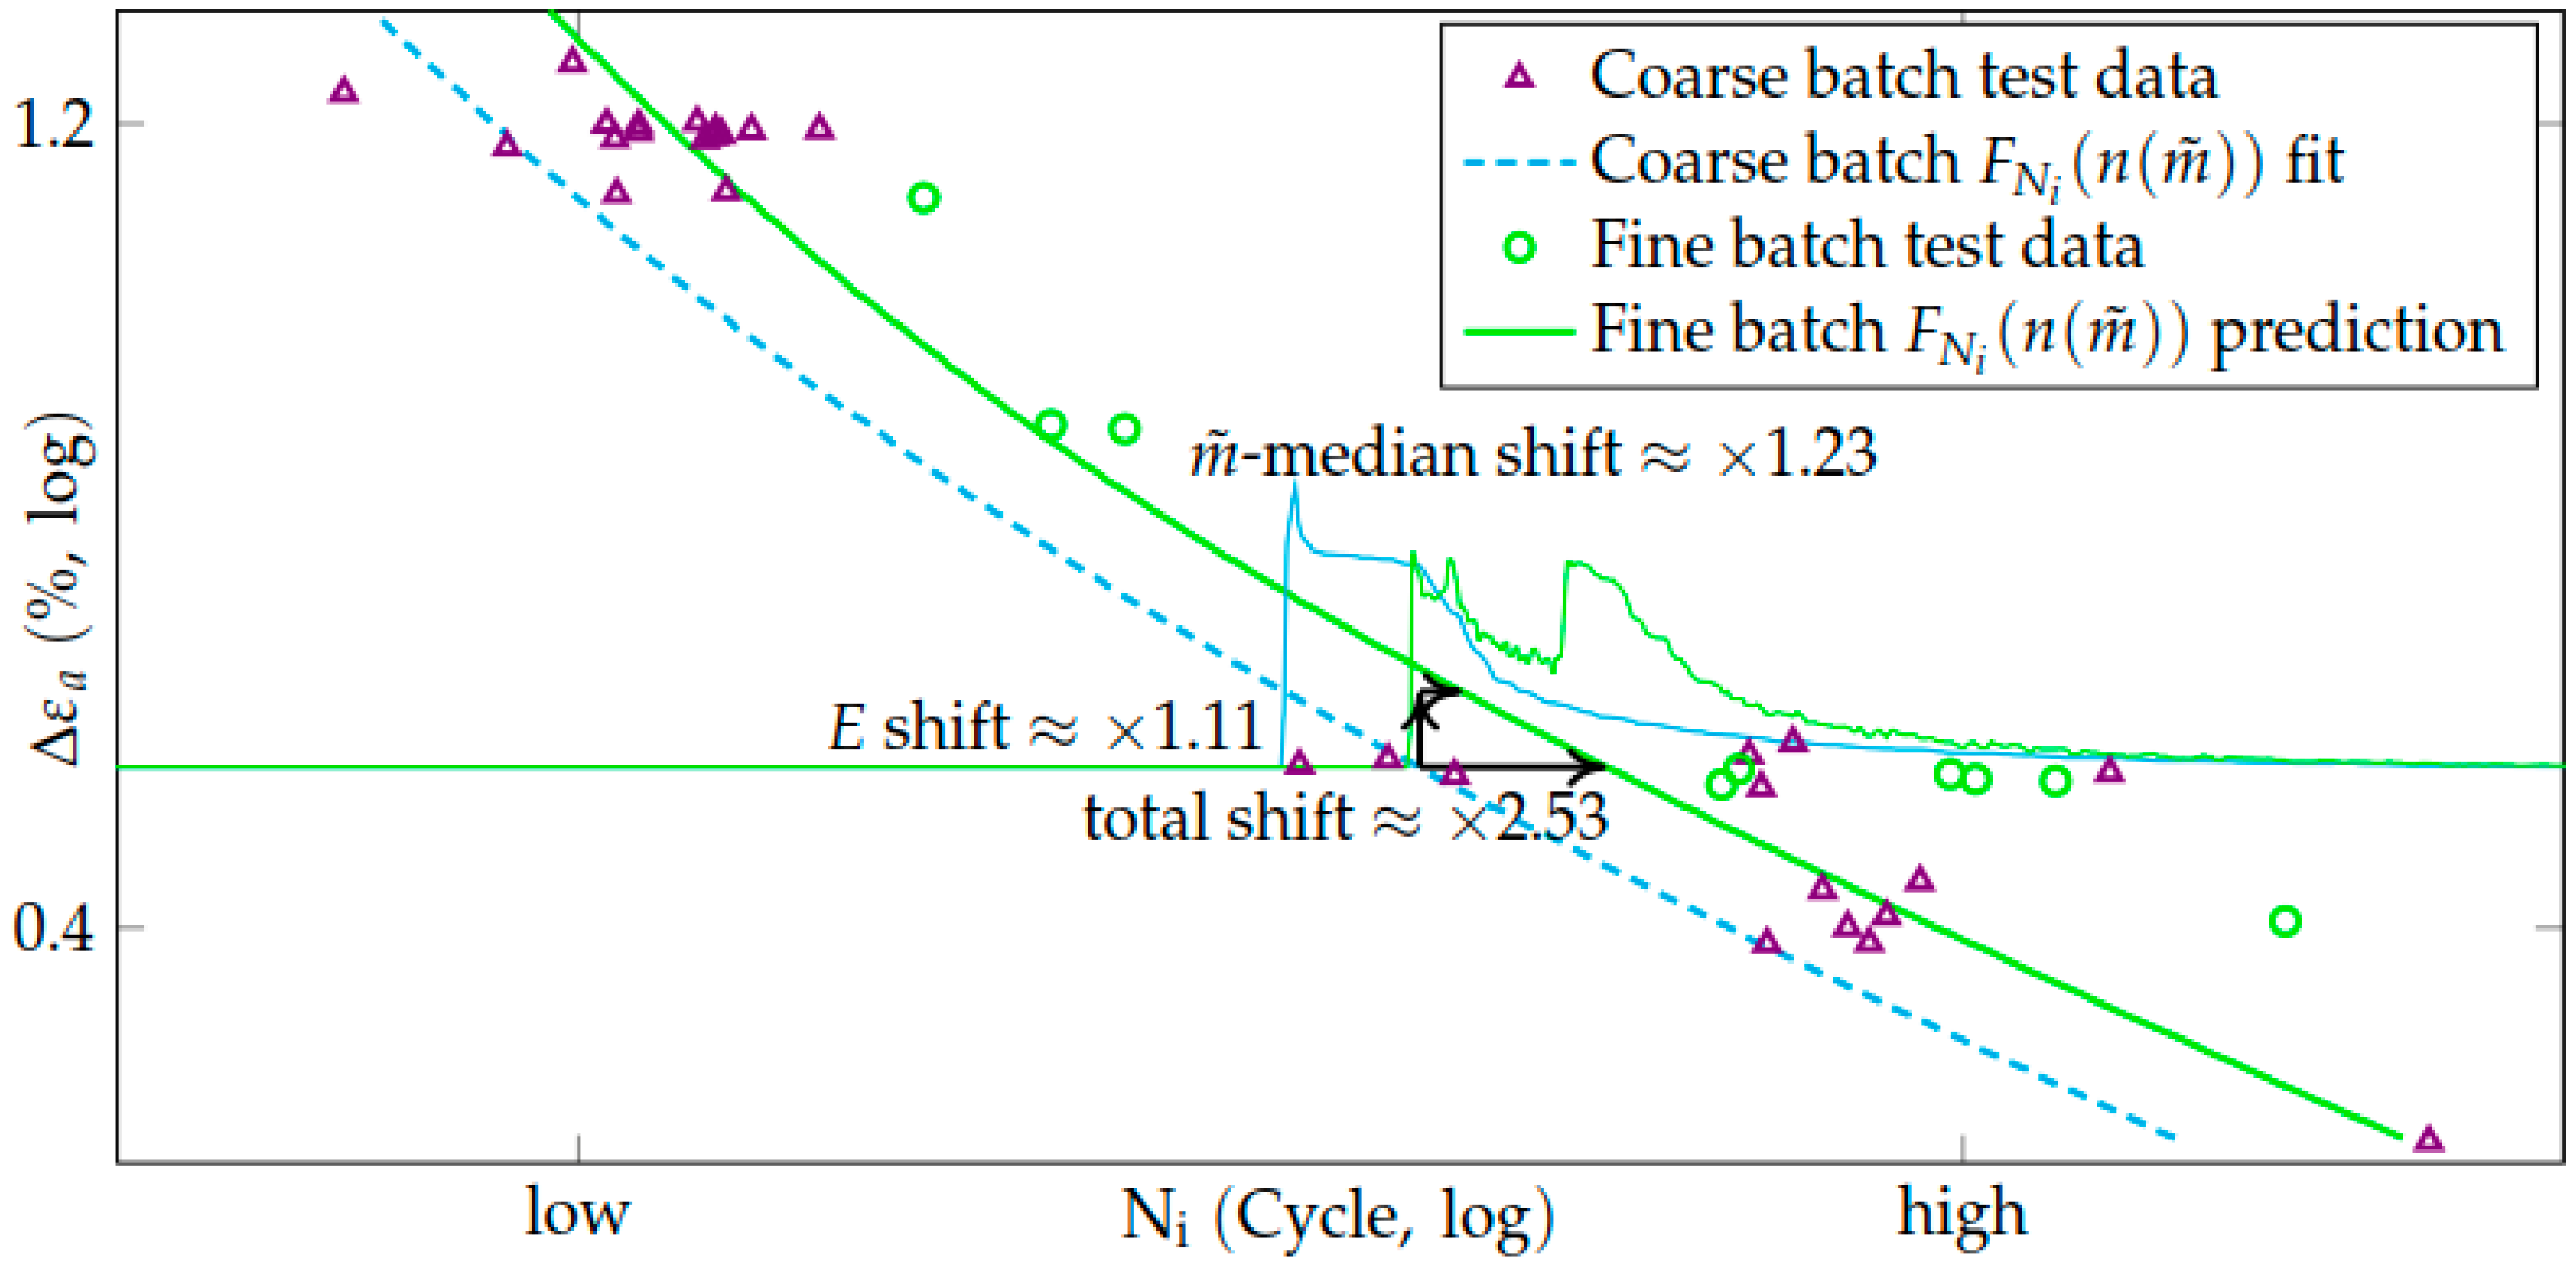
Prediction of the Wöhler Curve from the Single Grain Schmid Factor Distribution

Figure 15 shows the strain Wöhler curves given by the median values of the LCF life distributions F N ( n ( m ˜ ) ) calculated according to Equations (9) and (10) from the Schmid factor distributions F S F ( m ˜ ) . One was computed for random single grain orientation (for coarse batch) and the other for preferential single grain orientation (for fine batch) as described in Section 3.4.
The CMB model was also calibrated only with the coarse batch test data. The lower E value of the fine grain batch causes the prediction to shift in positive Δ ε a direction. Additionally, the effect of the grain orientation becomes apparent. For the modeled preferential orientation, the median value of the Schmid factor distribution m ˜ 50 % is 4% lower than for an entirely random grain orientation (see Figure 13). This is visible as a second, positive shift of the life distribution F N ( n ( m ˜ ) ) . Altogether, the total effective life shift factor between coarse and fine batch median is 2.53 at Δ ε c o m p . It is already apparent that both curves are located too far left of the test point clouds. The reason for that is the shape of the underlying distribution which is discussed in more detail in Section 4.3.
N f i n e 50 % 2.53 · N c o a r s e 50 %

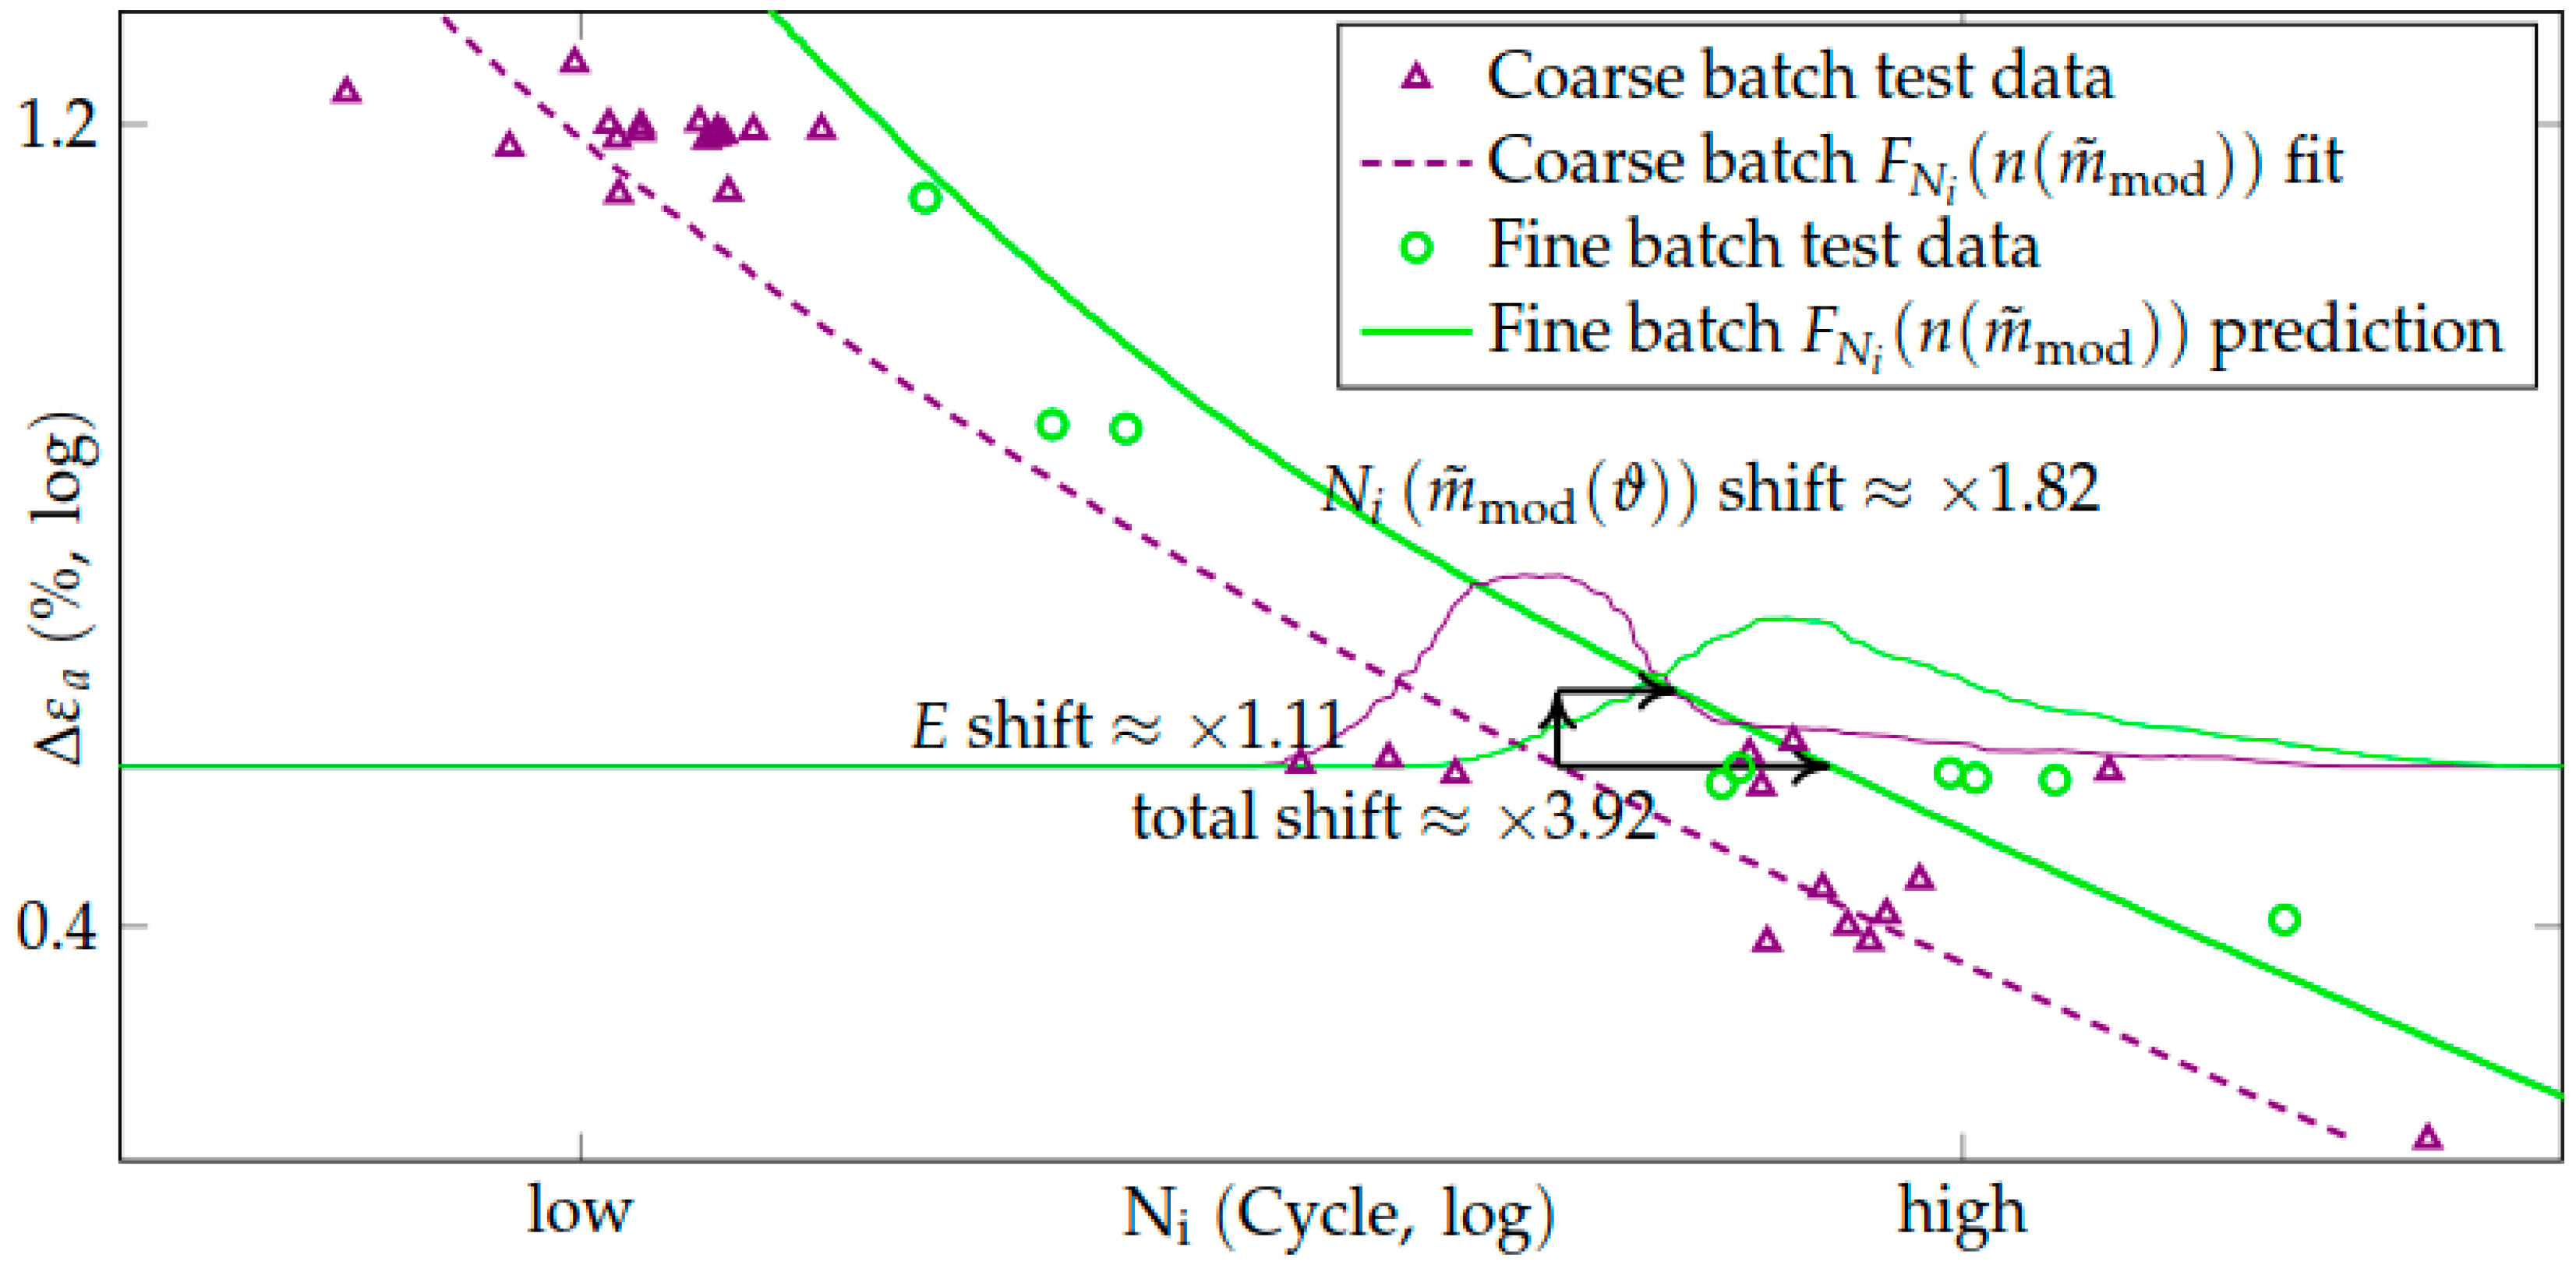
Prediction of the Wöhler Curve from the Modified Schmid factor Distribution

Figure 16 shows the strain Wöhler curves given by the median values of the LCF life distributions F N ( n ( m ˜ m o d ) ) calculated according to Equations (9) and (10) from the modified Schmid factor distributions F S F ( m ˜ m o d ) derived from the coarse FEA model (random grain orientation) and fine FEA model (preferential grain orientation) described in the Section 3.3 and Section 3.4.
As before, the CMB model was calibrated with the coarse batch test data. The difference between fit and prediction curve originates on one hand from the different values of global Young’s modulus between both batches and on the other hand significantly from the different median values m ˜ m o d 50 % of the modified Schmid factor distributions F S F ( m ˜ m o d ) . The Schmid factor distribution from the fine-grain FEA model where a preferential orientation of <100> aligning with ϑ = 25 ° to the specimen horizontal, the median value of the Schmid factor distribution m ˜ m o d 50 % is 8% lower than for an entirely random grain orientation (see Figure 13). The total median life is shifted by a factor of 3.6 at Δ ε c o m p .
N f i n e 50 % 3.6 · N c o a r s e 50 %

4. Discussion

4.1. Influence of the Grain Orientation Distribution on the Mechanical Properties

The tested René80 batches were different with respect to grain size and grain orientation distribution. It was observed that specimens of the fine-grained material batch which had a preferential grain orientation (see Section 3.1) showed lower global Young’s moduli (in loading direction) in average. An equivalent observation was made for the polycrystalline FEA models whose grain orientations were sampled according to the assumed distributions in the two batches (isotropically distributed orientations for the coarse-grained batch and preferentially oriented for the fine-grained batch). Both orientation distribution density functions (ODF) are visualized as inverse pole plot in the left column of Figure 17. The right column shows the histograms of local stiffnesses in z-direction calculated by Equation (13). For both orientation cases, σ z z was once derived from the respective polycrystalline specimen FEA results and once from a single crystal Monte-Carlo-simulation. For these, a single crystal with the elastic anisotropy of IN 738 LC at 850 °C was rotated according to the respective ODF (100,000 times) and an isotropic strain load was applied to it.
The global Young’s moduli averaged from nodal FEA stresses (z-components only) have a difference of 18 GPa between the batch with (coarse) and without preferential grain orientation (fine). The ratio E c o a r s e / E f i n e = 1.13 of the Young’s moduli averaged from FEA results is slightly larger for the experimental results where E c o a r s e / E f i n e = 1.11 . Although also the absolute values of the tested Young’s moduli are slightly lower than the averaged computed values the comparison of the ratios indicates a good qualitative consistency. That is a satisfying outcome as it confirms the applicability of the elasticity model from IN 738 LC for René80 with respect to the anisotropies at 850 °C. Nevertheless, the uncertainties in the determination of the Young’s moduli must not be neglected. The computed average value is based on FEA solutions considering just three different grain orientation realizations at one grain morphology. The simulated grain orientation distributions are also an approximation derived from the results of a limited microstructure evaluation. Particularly approving the assumption of uniformly distributed Euler angles φ 1 , φ 2 would need further investigations. Moreover, the scatter in experimentally determined Young’s moduli is significant, particularly for large grain realizations. Only the grains between the extensometer tips (distance of 12 mm) are influencing on the measurement results of Young’s moduli. As investigations in [31] reveal, the measured Young’s moduli strongly depend on the extensometer position. Different measurements positions along the gauge length lead to results in a window of ±18 GPa for a coarse-grained specimen. Further polycrystalline FEA simulations in combination with a virtual 12 mm extensometer revealed differences of up to 20 GPa between the Young’s modulus derived from this virtual extensometer strain and the globally averaged Young’s modulus considering the entire volume. The reason for that is the large stiffness anisotropy of the René80 lattice. Many grains are required to homogenize the materials global stiffness (Young’s modulus) over a certain volume of interest [48]. Due to the lower standard deviation of local stiffnesses in the case of preferentially oriented grains (see green histogram in Figure 17b), homogenization and quasi-isotropic mechanical behavior is more pronounced at lower grain numbers already.
A Monte-Carlo simulation on different orientations of a single-grain was conducted to study the pure effect of orientation at the stiffness distributions. Figure 17a shows the resulting z-stiffness distribution (in z-direction) of a single crystal with random orientation (as for the coarse-grained material). The values vary between 100–260 GPa because orientations leading to low and high stiffness in loading direction are equally likely. The equivalent distribution of local stiffnesses from FEA in comparison is less dispersed but centered around a similar average. The single grain z-stiffness distribution in subfigure Figure 17b) however shows a very different result. The ODF was constructed as described in Section 3.5. This results in a slim peak band in the ODF with values > 2 (left column). Hence, also the distribution of z-stiffness from all single grain rotations is hardly dispersed and varies only between 126–129 GPa. Especially orientations near [111], which correlate to high stiffness and orientations close to [001], with the lowest stiffness are unlikely for this orientation distribution. The equivalent distribution of local stiffnesses from FEA in is now much more dispersed, has a higher average and resembles a normal distribution. The latter is also reflected in the stress fields shown in Figure 7; Figure 10 (Section 3.3). Despite discriminated contact stresses (gray) at the top and bottom surface comparable surface stresses are observable in Figure 7 at the coarse-grained model and at the fine-grained model in Figure 10. All boundary conditions (material law, temperature, applied strain load) were identical. The mutual mechanical grain interaction which is considered in the polycrystalline FEA leads to different multiaxial stress tensors across the specimen and even within single grains (Figure 8). Due to the high elastic anisotropy of the material (anisotropy up to a factor of 3 [31]), agglomerations of grains with different stiffnesses in load direction undergo strain restrictions near the grain boundaries, which result in the observed inhomogeneities and high peak stresses. These peak stresses emerging from grain interactions are the reason why the resulting local stiffnesses from the FEA model with preferential grain orientation are so different from the single grain simulation.
Besides the elastic anisotropy and the related consequences, which were observed in the experiments and FEA simulations, also a difference in the elastic-plastic strength of the examined material batches was observed. Calibration of the Ramberg-Osgood models returned cyclic strength coefficients with K c o a r s e / K f i n e 1.07 . At first sight, this contradicts the typically occurring hardening effects of grain refinement, known as Hall-Petch relationship [44]. However, the difference in average grain size ( d c o a r s e = 3   mm , d f i n e = 1.3   mm ) is not significant for such effects and the grain orientation distribution is more likely to play a role, similarly as for the elasticity properties. The onset of plastic deformation is largely determined by the critical resolved shear stress τ c r s s . Nitz [46] and Österle [47] presented orientation dependent values for τ c r s s of Ni-base superalloys at high temperature but the investigated materials were not sufficiently comparable to René80. Therefore, no simulation study using an orientation-dependent elastic-plastic material model could be conducted equivalently to the procedure presented for the elastic mechanical behavior.

4.2. Influence of Grain Orientation Distribution on the Fatigue Behavior

All Schmid factor distributions shown Figure 13 have non-zero likelihood values m ˜ > 0.5 , even for the simulation of a single grain under uniaxial stress. The reason for that is definition (2) identifying the maximum resolved shear stress at the slip systems as Schmid factor combined with anisotropic elasticity. Uniaxial external stresses can then translate into multiaxial stress states in the crystal leading to quotients τ i , j / σ v M > 0.5 . Note, that σ v M is always calculated from the external stress tensor. Consider the following example case:
φ 1 = 304.9 ° ,   φ 2 = 341.6 ° ,   ϑ = 112.0 °   and   σ e x t = ( 1 , 0 , 0 , 0 , 0 , 0 ) T   in   Voigt   notation
In the case of isotropic elasticity, the rotated stress tensor deviator σ _ _ i s o ( U ) results to
σ i s o ( U ) = ( 0.076 , 0.172 , 0.248 , 0.208 , 0.187 , 0.454 ) T   ( Voigt   notation )
σ i s o ( U ) is the deviator of a uniaxial stress state ( κ = 0 ) and leads to m ˜ = 0.43 . Considering the anisotropic elasticity of IN738 LC at 850 °C however yields to the multiaxial stress state deviator
σ a n i s o ( U ) = ( 0.044 , 0.099 , 0.143 , 0.368 , 0.331 , 0.805 ) T   with   κ = 0.364
The multiaxial stress state σ a n i s o ( U ) in the material yields a Schmid factor m ˜ = 0.56 . In both cases, the same slip system (1–11) [011] is activated. Furthermore the Schmid factor distributions shown in Figure 13 differ significantly for the two modeling approaches polycrystalline FEA and single grain Monte-Carlo simulation (MCS). The higher dispersion of the distributions F S F ( m ˜ m o d ) calculated from nodal FEA stress tensors is attributed to the effect of grain interactions. The thereof created multiaxial stress states create the observed, broadened Schmid factor distributions. The major difference to those created from single grain MCS, the shallow, not steeply descending right tail, is consistent with the studies of Moch [30]. There, it was shown that the steep right tail of the Schmid factor distribution for a single grain under uniaxial load decreases and flattens with increasing stress multiaxiality. The steep right tail of F S F ( m ˜ ) leads to a steep left tail of F N ( n ( m ˜ ) ) since F N ( n ( m ˜ ) ) = 1 F S F ( m ˜ ) due to the inverse proportionality of shear stresses and life cycles (compare Figure 13 and Table 5).
Furthermore, the inhomogeneous resolved shear stress distributions exemplarily shown in Figure 11 and Figure 12 lead to different probabilities of crack initiation within the grains in a polycrystal compound. Hence, the polycrystalline FEA based modelling approach even indicates the location within a grain while the E∙m model only determines which grain shows the highest shear stresses under a given stress condition.
Even more important, the determined grain alignment in the fine-grained batch (preferential orientation distribution) also aligns the slip systems such that lower median values result for the distributions F S F ( m ˜ m o d ) and F S F ( m ˜ ) . Therefore, higher local stresses or more load cycles are in average required to trigger shear glide with the same intensity as for random grain orientation. Additionally, it was explained how the observed preferential grain orientation also lead to lower global Young’s moduli. That again decreases the resolved shear stress at the slip systems and retards shear glide and PSB cracking. Both effects are combined in the case of strain-controlled LCF testing and the subsequent strain-life Wöhler curve representation of the data points. In a stress-life representation only the decreased probability of high Schmid factors obviously takes effect. An example is shown in Section 4.3. The grain size does not have an influence on the Schmid factor F S F ( m ˜ m o d ) distribution and the thereof derived life distribution.
As already mentioned in Section 4.1, the simulated grain orientation distributions are approximations motivated by metallographic analyses of few specimen cuts. Both, isotropic distribution of orientations as well as the full texturing with fixed Euler angle ϑ = 25 ° are rather special cases of a real material.

4.3. Comparison of Fit and Prediction Quality of Probabilistic Models

Table 6 shows the average negative Log-Likelihood ( n L L ) per test point for all probabilistic models. The n L L was chosen as an appropriate coefficient of determination since the fitted relationship is non-linear and the residual distribution is not normal.
Since low negative Log-Likelihood values in Table 6 indicate good accordance of the test data with the estimated distribution it becomes apparent that the Weibull distribution is not well suited to describe the statistical behavior of the tested LCF lives compared to the microstructure-based approaches. Out of those, the modified Schmid factor-corrected life distribution performs significantly better in predicting the LCF test points of the fine grain material batch. The comparison of the n L L values supports the visual impression of Figure 16 where the prediction curve goes through the test point cloud splitting it approximately into halves.
It was not expected that this could be achieved using the single grain Schmid factor-corrected life distribution F N ( n ( m ˜ ) ) since the underlying simulation comprises the strong simplification of no grain interaction and the same homogeneous stress state at all grains. Although the calibration curve for this case has low n L L , Figure 15 shows that its position is dominated by the position of the far-left curve point at Δ ε a = 0.5 % . The reason for that is the sharp left flank of the distribution density which is zero, allowing no point before the first visible ascent. But not only the missing consideration of grain interaction in F N ( n ( m ˜ ) ) is a simplification. F S F ( m ˜ ) is the cumulative distribution function for the probability P ( S F m ˜ ) of for a single grain. However, there are many grains in the gauge section of the specimen in between the extensometer tips. Hence, the maximum value distribution for m ˜ in the observed section would have to be calculated. It combines the probabilities of all grains for reaching a Schmid factor S F m ˜ . Gottschalk et al. [28] have shown that such an approach assuming independently distributed grain orientations at uniaxial stress leads to distributions with unrealistically small scatter bands. If such an approach would be followed, the n L L values would be for the given data set. That is why further grain interaction and dependencies have to be taken into account, e.g., with a crack percolation model [28,30]. The modified Schmid factor distribution from polycrystalline FEA solutions is a step towards that as it considers the intergranular dependencies of the local stress states but is also computationally expensive.
Comparing the Weibull LCF life distribution and the modified Schmid factor based LCF life distribution it becomes apparent that both are very different. Specifically, the lower probability tails which are important for reliable design of components, e.g., hot gas parts of gas turbines in the case of René80, differ largely. The modified Schmid factor based N i distribution implicates that there is a safe life cycle range with zero probability of crack initiation from PSB formation. Of course, care must be taken, and further evaluations and tests must be conducted before transferring such outcomes to component design. Note in this context that considerable efforts are necessary to achieve a sufficiently high number of LCF tests to verify the distribution tail shape. Additionally, LCF tests are always subject to experimental uncertainties, such as limited crack initiation detection accuracy [49].
All in all, the microstructure-based modeling approach shows that there is potential for increasing a parts time in service at the same risk for crack initiation at persistent slip bands. Note, that the approach presented here is not suitable for quantitative design assessments since it does not utilize the local approach for LCF life evaluation and therefore does not consider the statistical size effect such as the local probabilistic model for LCF which is presented and validated in [19,20,22,23].
Furthermore, it was observed that a preferential direction in the polycrystal grain orientation has a beneficial impact on the LCF life. The previously shown E-N-plots visualize two root causes. On the one hand, the material with preferential grain orientation has a lower stiffness and therefore, the total stress at the grains and hence slip systems is lower compared to the material with random grain orientation. On the other hand, also the distribution of the Schmid factors has a lower expectation value than in the case of randomly oriented grains. That itself, again results in lower resolved shear stresses at the slip systems in average for the material with preferential grain orientation. Both effects are present in strain controlled LCF experiments but only the latter plays a role for engineering components which are typically under a certain force load. Figure 18 shows the stress Wöhler curve predictions for both material batches using the modified Schmid factor concept.

5. Conclusions

Probabilistic LCF life models for the high temperature fatigue behavior of the Ni-base superalloy René80 (CC) were derived. The models are based on the statistical distributions of resulting shear stress, respectively Schmid factors, depending on the grain orientation distribution. One the one hand geometrical concepts, Monte-Carlo sampling of a single crystal orientations under uniaxial load and resolved shear stress evaluations were carried out. One the other hand polycrystalline FEA models were computed for different grain morphologies, i.e., randomly oriented coarse and preferentially oriented fine grains. It turned out that grain interaction has a crucial influence on the local stress and strain states and thus the shear stresses in the slip systems. The fine-grained material batch with a preferential grain orientation showed higher crack initiation life in the experiment. The respective simulations revealed lower Schmid factors and lower Young’s modulus in average. Both effects combined lead to higher crack initiation life in the strain-controlled tests compared to the coarse-grained material with random grain orientation. The Schmid factor based LCF life model was calibrated with test data from a batch with isotropic grain orientation distribution (random) using a Maximum-Likelihood approach. The thus calibrated model was then used to predict the LCF life for the other material batch with the preferential grain orientation. The LCF life predictions based on the Schmid factor distributions derived from FEA show the best coincidence with the experimentally determined lifetimes and is superior to the well-established Weibull-approach and the Schmid factor distributions calculated from geometric considerations. However, it has the drawback of not covering the statistical size effect and being computationally expensive. That makes it difficult for direct fatigue-risk assessment tool integration, e.g., as an FEA post-processor.
While the conducted studies shed light on the elasticity anisotropy of René80 and comparable materials like IN 738 LC, no anisotropic plasticity models were available in the literature. Hence, the lower yield strength of the preferentially oriented material batch could not be explained.
The presented work covers two cases of grain orientation distribution. It is favorable to conduct validation studies with further, different, more precisely determined orientation distributions. But it is already possible to draw conclusions from few polycrystalline FEA simulations and in certain cases extrapolate the influence of preferential grain orientations on the fatigue behavior. It is of course also desirable to study more component relevant geometry and loading conditions and their effect on the modified Schmid factor distribution such as notches or torsional loads.

Author Contributions

B.E. and L.M. wrote the present paper, and did the experimental work as well as the simulation and lifetime modeling under the supervision and support of H.G. and T.B. P.L. and N.M. have supported the results of the paper with their work.

Funding

The investigations were conducted as part of the joint research program COOREFLEX TURBO in the frame of AG Turbo. The work was supported by the Federal Ministry for Economic Affairs and Energy as per resolution of the German Federal Parliament under grant number 03ET7041K. N.M. acknowledges financial support under the same scheme with the grant number 03ET7041J. H.G. acknowledges partial financial support from the Federal Ministry of Education under the Grant-Nr. 05M18PXA.

Acknowledgments

The authors gratefully acknowledge AG Turbo and Siemens AG for their support and permission to publish this paper. The responsibility for the content lies solely with its authors.

Conflicts of Interest

The authors declare no conflict of interest.

References

  1. Bussac, A.; Lautridou, J. A probabilistic model for prediction of lcf surface crack initiation in pm alloys. Fatigue Fract. Eng. Mater. Struct. 1993, 16, 861–874. [Google Scholar] [CrossRef]
  2. Grison, J.; Remy, L. Fatigue failure probability in a powder metallurgy Ni-base superalloy. Eng. Fract. Mech. 1997, 57, 41–55. [Google Scholar] [CrossRef]
  3. Brückner-Foit, A.; Jäckels, H.; Quadfasel, U. Prediction of the lifetime distribution of high-strength components subjected to fatigue loading. Fatigue Fract. Eng. Mater. Struct. 1993, 16, 891–908. [Google Scholar] [CrossRef]
  4. Pineau, A.; Antolovich, S.D. Probabilistic approaches to fatigue with special emphasis on initiation from inclusions. Int. J. Fatigue 2016, 93, 422–434. [Google Scholar] [CrossRef]
  5. Böhm, J.; Heckel, K. Die Vorhersage der Dauerschwingfestigkeit unter Berücksichtigung des statistischen Größeneinflusses. Materialwissenschaft und Werkstofftechnik 1982, 13, 120–128. [Google Scholar] [CrossRef]
  6. Zheng, X.-L.; Lü, B.; Jiang, H. Determination of probability distribution of fatigue strength and expressions of P-S-N curves. Eng. Fract. Mech. 1995, 50, 483–491. [Google Scholar] [CrossRef]
  7. Hertel, O.; Vormwald, M. Statistical and geometrical size effects in notched members based on weakest-link and short-crack modelling. Eng. Fract. Mech. 2012, 95, 72–83. [Google Scholar] [CrossRef]
  8. Okeyoyin, O.A.; Owolabi, G.M. Application of Weakest Link Probabilistic Framework for Fatigue Notch Factor to Turbine Engine Materials. World J. Mech. 2013, 03, 237–244. [Google Scholar] [CrossRef] [Green Version]
  9. Zok, F.W. On weakest link theory and Weibull statistics. J. Am. Ceram. Soc. 2017, 100, 1265–1268. [Google Scholar] [CrossRef]
  10. Weibull, W. A Statistical Theory of the Strength of Materials; Generalstabens Litografiska Anstalts Foìrlag: Stockholm, Sweden, 1939. [Google Scholar]
  11. Schijve, J. A normal distribution or a weibull distribution for fatigue lives. Fatigue Fract. Eng. Mater. Struct. 1993, 16, 851–859. [Google Scholar] [CrossRef]
  12. Schijve, J. Fatigue predictions and scatter. Fatigue Fract. Eng. Mater. Struct. 1994, 17, 381–396. [Google Scholar] [CrossRef]
  13. Xiulin, Z. Prediction of probability distribution of fatigue life of 15MnVN steel notched elements under variable-amplitude loading. Int. J. Fatigue 1996, 18, 81–86. [Google Scholar] [CrossRef]
  14. Schijve, J. Statistical distribution functions and fatigue of structures. Int. J. Fatigue 2005, 27, 1031–1039. [Google Scholar] [CrossRef]
  15. Karolczuk, A.; Palin-Luc, T. Modelling of stress gradient effect on fatigue life using weibull based distribution function. J. Theor. Appl. Mech. 2013, 51, 297–311. [Google Scholar]
  16. Rechnerischer Festigkeitsnachweis für Maschinenbauteile aus Stahl, Eisenguss-Und Aluminiumwerkstoffen, 6th ed.; Rennert, R. (Ed.) VDMA-Verlag: Frankfurt am Main, Germany, 2012; ISBN 9783816306054. [Google Scholar]
  17. Fiedler, M.; Varfolomeev, I. Rechnerischer Festigkeitsnachweis unter Expliziter Erfassung Nichtlinearen Werkstoff-Verformungsverhaltens, Final Report; VDMA-Verlag: Frankfurt am Main, Germany, 2015. [Google Scholar]
  18. Fiedler, M.; Wächter, M.; Varfolomeev, I.; Vormwald, M.; Esderts, A. Richtlinie Nichtlinear. Rechnerischer Festigkeitsnachweis unter Expliziter Erfassung Nichtlinearen Werkstoffverformungsverhaltens; für Bauteile aus Stahl, Stahlguss und Aluminiumknetlegierungen, 1. Auflage; VDMA Verlag GmbH: Frankfurt am Main, Germany, 2019; ISBN 3816307299. [Google Scholar]
  19. Schmitz, S.; Seibel, T.; Beck, T.; Rollmann, G.; Krause, R.; Gottschalk, H. A probabilistic model for LCF. Comput. Mater. Sci. 2013, 79, 584–590. [Google Scholar] [CrossRef] [Green Version]
  20. Schmitz, S.; Gottschalk, H.; Rollmann, G.; Krause, R. Risk Estimation for LCF Crack Initiation. In Proceedings of the ASME Turbo Expo 2013: Turbine Technical Conference and Exposition, San Antonio, TX, USA, 3 June 2013; ASME: New York, NY, USA, 2013; p. V07AT27A007, ISBN 978-0-7918-5526-3. [Google Scholar]
  21. Hell, M.; Wagener, R.; Kaufmann, H.; Melz, T. Fatigue Design with Respect to Component Related Cyclic Material Behaviour and Considerations of Size Effects. Procedia Eng. 2015, 133, 389–398. [Google Scholar] [CrossRef] [Green Version]
  22. Mäde, L.; Schmitz, S.; Gottschalk, H.; Beck, T. Combined Notch and Size Effect Modeling in a Local Probabilistic Approach for LCF. Comput. Mater. Sci. 2017, 142, 377–388. [Google Scholar] [CrossRef]
  23. Maede, L.; Kumar, K. Evaluation of component-similar rotor steel specimens with a local probabilistic approach for LCF.—Under Review. Comput. Mater. Sci. 2019. [Google Scholar]
  24. Siebörger, D.; Knake, H.; Glatzel, U. Temperature dependence of the elastic moduli of the nickel-base superalloy CMSX-4 and its isolated phases. Mater. Sci. Eng. A 2001, 298, 26–33. [Google Scholar] [CrossRef]
  25. Engel, B.; Beck, T.; Moch, N.; Gottschalk, H.; Schmitz, S. Effect of local anisotropy on fatigue crack initiation in a coarse grained nickel-base superalloy. MATEC Web Conf. 2018, 165, 4004. [Google Scholar] [CrossRef]
  26. Hermann, W.; Sockel, H.G.; Bertram, A. Elastic Properties and Determination of elastic Constants of Nickel-base Superalloy by Free-Free Beam Technique. In Proceedings of the 11th International Symposium on Superalloys, Champion, PA, USA, 22–26 September 1996; p. 229. [Google Scholar] [CrossRef]
  27. Schmid, E.; Boas, W. Plasticity of Crystals. With Special Reference to Metals; Chapman & Hall: London, UK, 1968. [Google Scholar]
  28. Gottschalk, H.; Schmitz, S.; Seibel, T.; Rollmann, G.; Krause, R.; Beck, T. Probabilistic Schmid factors and scatter of low cycle fatigue (LCF) life. Materialwissenschaft und Werkstofftechnik 2015, 46, 156–164. [Google Scholar] [CrossRef]
  29. Seibel, T. Einfluss der Probengröße und der Kornorientierung auf die Lebensdauer Einer Polykristallinen Ni-Basislegierung bei LCF- Beanspruchung. Ph.D. Thesis, Forschungszentrum Jülich, Jülich, Germany, 2014. [Google Scholar]
  30. Moch, N. From Microscopic Models of Damage Accumulation to Probability of Failure of Gas Turbines. Ph.D. Thesis, Bergische Universität Wuppertal, Wuppertal, Germany, 2018. [Google Scholar]
  31. Engel, B. Einfluss der Lokalen Kornorientierung und der Korngröße auf das Verformungs- und Ermüdungsverhalten von Nickelbasis Superlegierungen. Ph.D. Thesis, Technische Universität Kaiserslautern, Kaiserslautern, Germany, 2018. [Google Scholar]
  32. Quey, R.; Dawson, P.R.; Barbe, F. Large-scale 3D random polycrystals for the finite element method: Generation, meshing and remeshing. Computer Methods Appl. Mech. Eng. 2011, 200, 1729–1745. [Google Scholar] [CrossRef] [Green Version]
  33. Ghazvinian, E.; Diederichs, M.S.; Quey, R. 3D random Voronoi grain-based models for simulation of brittle rock damage and fabric-guided micro-fracturing. J. Rock Mech. Geotech. Eng. 2014, 6, 506–521. [Google Scholar] [CrossRef] [Green Version]
  34. Quey, R.; Renversade, L. Optimal polyhedral description of 3D polycrystals: Method and application to statistical and synchrotron X-ray diffraction data. Comput. Methods Appl. Mech. Eng. 2018, 330, 308–333. [Google Scholar] [CrossRef] [Green Version]
  35. Aghaie-Khafri, M.; Farahany, S. Creep Life Prediction of Thermally Exposed Rene 80 Superalloy. J. Mater. Eng. Perform. 2010, 19, 1065–1070. [Google Scholar] [CrossRef]
  36. Antolovich, S.D.; Liu, S.; Baur, R. Low cycle fatigue behavior of René 80 at elevated temperature. Met. Trans. A 1981, 12, 473–481. [Google Scholar] [CrossRef]
  37. Buchholz, B. Entwicklung eines Werkstoffmodells für Isotherme und Anisotherme Ermüdung der Nickelbasislegierung René80. Ph.D. Thesis, TU Dresden, Dresden, Deutschland, 2012. [Google Scholar]
  38. Neidel, A.; Riesenbeck, S.; Ullrich, T.; Völker, J.; Yao, C. Hot cracking in the HAZ of laser-drilled turbine blades made from René 80. Mater. Test. 2005, 47, 553–559. [Google Scholar] [CrossRef]
  39. Österle, W.; Krause, S.; Moelders, T.; Neidel, A.; Oder, G.; Völker, J. Influence of heat treatment on microstructure and hot crack susceptibility of laser-drilled turbine blades made from René 80. Mater. Charact. 2008, 59, 1564–1571. [Google Scholar] [CrossRef]
  40. Voronoi, G. Nouvelles applications des paramètres continus à la théorie des formes quadratiques. Deuxième mémoire. Recherches sur les parallélloèdres primitifs. J. für die reine und angewandte Mathematik (Crelle’s J.) 1908, 134, 198–287. [Google Scholar] [CrossRef]
  41. Delaunay, B. Sur la sphère vide. A la mémoire de Georges Voronoï. Bulletin de l’Académie des Sciences de l’URSS. Classe Des Sciences Mathématiques Et Na 1934, 6, 793–800. [Google Scholar]
  42. León, C.A.; Massé, J.-C.; Rivest, L.-P. A statistical model for random rotations. J. Multivar. Anal. 2006, 97, 412–430. [Google Scholar] [CrossRef] [Green Version]
  43. Engel, B.; Beck, T.; Schmitz, S. (Eds.) LCF 8; High Temperature Low-Cycle-Fatigue of the Ni-Base Superalloy René80; Dresden, Deutschland, 2017. [Google Scholar]
  44. Rösler, J.; Harders, H.; Bäker, M. Mechanisches Verhalten der Werkstoffe, 5th ed.; Springer Vieweg: Wiesbaden, Germany, 2016; ISBN 978-3-8348-2241-3. [Google Scholar]
  45. Siredey, N.; Denis, S.; Lacaze, J. Dendritic growth and crystalline quality of nickel-base single grains. J. Cryst. Growth 1993, 130, 132–146. [Google Scholar] [CrossRef]
  46. Nitz, A.; Nembach, E. The critical resolved shear stress of a superalloy as a combination of those of its γ matrix and γ′ precipitates. Met. Mater. Trans. A 1998, 29, 799–807. [Google Scholar] [CrossRef]
  47. Österle, W.; Bettge, D.; Fedelich, B.; Klingelhöffer, H. Modelling the orientation and direction dependence of the critical resolved shear stress of nickel-base superalloy single crystals. Acta Mater. 2000, 48, 689–700. [Google Scholar] [CrossRef]
  48. Jöchen, K. Homogenization of the Linear and Non-Linear Mechanical Behavior of Polycrystals. Ph.D. Thesis, KIT, Karlsruhe, Deutschland, 2013. [Google Scholar]
  49. Gollmer, M. Schadensakkumulationsverhalten der Superlegierung René 80 unter Zweistufiger Low Cycle Fatigue Beanspruchung. Ph.D. Thesis, Technische Universität Kaiserslautern, Kaiserslautern, Germany, 2018. [Google Scholar]
Figure 1. Specimen geometry. Only the cylindrical gauge section is considered in Finite Element Analysis (FEA) simulations.
Metals 09 00813 g001
Figure 2. Polycrystalline model for the cylindrical gauge section with 49 and 500 grains.
Metals 09 00813 g002
Figure 3. (a) Scanning electron microscope (SEM) image of the γ,γ′microstructure; (b) light microscope image of cross section shows dendritic grain growth.
Metals 09 00813 g003
Figure 4. Light microscopy image of the vertical cross section of a 20   mm bar of René80. Coarse grains with random orientation solidified in the center of the gauge section but also fine, dendritically solidified grains are also visible in the edge area. The right-hand side shows the section that remained after specimen machining.
Metals 09 00813 g004
Figure 5. Light microscopy image of the vertical cross section of a 12   mm bar of René80. A preferential orientation of the grains was likely caused by the temperature gradients in the mold during solidification.
Metals 09 00813 g005
Figure 6. Stabilized cyclic stress response data and respective Ramberg-Osgood calibration curve for coarse grain batch and fine grain batch.
Metals 09 00813 g006
Figure 7. Stress and strain distribution in loading direction for a specimen with 49 grains and random orientation at 0.25% total strain. An anisotropic elasticity model of IN 738 LC at 850 °C was applied.
Metals 09 00813 g007
Figure 8. Stress and strain distribution in loading direction of a free cut grain from the specimen model with 49 grains at 0.25% total strain and 850 °C.
Metals 09 00813 g008
Figure 9. Frequency distribution of the parameter κ to evaluate the stress state on every simulated node of both specimen models.
Metals 09 00813 g009
Figure 10. Stress and strain distribution in loading direction for the specimen model with 500 grains and directed orientation distribution at 0.25% total strain. An anisotropic elasticity model of IN 738 LC at 850 °C was applied.
Metals 09 00813 g010
Figure 11. Distribution of maximum resulting shear stress in the <111>{110} slip systems at total strain of 0.25%. Coarse grain morphology and random orientation to the left and fine grain morphology with preferential orientation ( ϑ = 25 ° ) to the right.
Metals 09 00813 g011
Figure 12. Distribution of maximum resolved shear stress at free cut grains in the [111] (110) slip systems for globally applied strain of 0.25%.
Metals 09 00813 g012
Figure 13. Comparison of the Schmid factor distribution density functions for a single crystal f S F ( m ˜ ) and a polycrystal f S F ( m ˜ m o d ) (from FEA). The random Euler angle ϑ (coarse grain batch) refers to isotropically and ϑ = 25 ° (fine grain batch) refers to preferentially distributed grain orientations. A uniaxial stress was applied to all models. Vertical lines indicate the median values.
Metals 09 00813 g013
Figure 14. Fit and prediction curve for the model: Weibull-distributed Coffin-Manson-Basquin life.
Metals 09 00813 g014
Figure 15. Fit and prediction curve for the CMB with single grain Schmid factor distribution model.
Metals 09 00813 g015
Figure 16. Fit and prediction curve for the CMB with modified Schmid factor distribution model.
Metals 09 00813 g016
Figure 17. Orientation distribution functions and resulting local stiffness distributions (z-direction). (a) Isotropically distributed grain orientation: Resulting local stiffness distribution from a single crystal Monte-Carlo simulation ( E s g , cyan) and from polycrystalline FEA results ( E F E A , violet). (b) Preferential grain orientations: Resulting local stiffness distribution from a single crystal Monte-Carlo simulation ( E s g , gray) and from polycrystalline FEA results ( E F E A , green).
Metals 09 00813 g017
Figure 18. Stress-life plot of test data and fit and prediction curves for the modified Schmid factor distribution model.
Metals 09 00813 g018
Table 1. Chemical composition of René80 and IN 738 LC (taken from Hermann, W. (2014) [26]) in wt.%.
ElementNiCrCoTiMoWAlCBZrTa NbFe
René80Bal.14.049.485.084.034.022.930.170.0150.011---
IN 738 LC Bal.168.38.73.41.82.73.40.11-1.90.90.1
Table 2. Overview of Schmid factor distribution generation.
DistributionModeling Approach
F S F ( m ˜ ) Monte-Carlo sampling of statistically distributed orientations of a single crystal, i.e., single grain. Maximum normalized resolved shear stresses calculated at global uniaxial stress state. Explicit consideration of elastic stiffness anisotropy.
F S F ( m ˜ m o d ) Monte-Carlo sampling of statistically distributed orientations of single crystals in polycrystalline FEA simulations. Maximum normalized resolved shear stresses calculated at all FEA nodes from local (multiaxial) stress states. Explicit consideration of elastic stiffness anisotropy.
Table 3. Comparison of the determined global Young’s moduli from polycrystalline Finite Element Analysis (FEA).
ValueRandom Orientation
ϑ = r a n d .
Preferential Orientation
ϑ = 25 °
Shift
E g l o b a l 160 GPa142 GPa 11 %
Standard deviation±1.5 GPa±0.3 GPa-
Table 4. Comparison of the median values of the Schmid factor distributions f S F ( m ˜ ) (geometric approach) and f S F ( m ˜ m o d ) (from FEA).
Schmid FactorRandom Orientation
ϑ = r a n d o m
Preferential Orientation
ϑ = 25 °
Shift
m ˜ 50 % 0.512 0.493 4 %
m ˜ m o d 50 % 0.468 0.431 8 %
Table 5. Comparison of crack initiation life distribution densities for the applied probabilistic crack initiation model approaches.
Model Nr.Distribution ApproachDistribution Density Visualization
1Weibull distributed life f N ( n | η , m ) Metals 09 00813 i001
2Life distribution from τ R S S (Schmid factors) in single grain, f N ( n ( m ˜ ) ) Metals 09 00813 i002
3Life distribution from τ R S S (Schmid factors) in polycrystalline FEA, f N ( n ( m ˜ m o d ) ) Metals 09 00813 i003
Table 6. Values of negative Log-Likelihood for the different distribution approaches.
Model Combination:
Scale Model + Life Distribution
Neg. Log-Likelihood per Data Point at CalibrationNeg. Log-Likelihood per Data Point at Prediction
CMB + Weibull distribution10.78.7
CMB + Schmid factor-corrected life distribution0.8712.38
CMB + modified Schmid factor-corrected life distribution0.570.61

