Calcium Doped Flash-PEO Coatings for Corrosion Protection of Mg Alloy


Departamento de Ingeniería Química y de Materiales, Facultad de Ciencias Químicas, Universidad Complutense, 28040 Madrid, Spain
*
Author to whom correspondence should be addressed.
Metals 2020, 10(7), 916; https://doi.org/10.3390/met10070916
Submission received: 8 June 2020
/
Revised: 1 July 2020
/
Accepted: 7 July 2020
/
Published: 9 July 2020
(This article belongs to the Special Issue Corrosion and Inhibition Processes)
Abstract
:This study demonstrates a significant improvement of the corrosion resistance of an AZ31B magnesium alloy achieved by the application of 1 μm-thin coatings generated by an environmentally friendly flash plasma electrolytic oxidation (FPEO) process in Ca-containing electrolytes. Two compounds with different solubility, calcium oxide (CaO) or calcium glycerophosphate (CaGlyP), were used as sources of Ca in the electrolyte. Very short durations (20–45 s) of the FPEO process were employed with the aim of limiting the energy consumption. The corrosion performance of the developed coatings was compared with that of a commercial conversion coating (CC) of similar thickness. The viability of the coatings in a full system protection approach, consisting of FPEO combined with an inhibitor-free epoxy primer, was verified in neutral salt spray and paint adhesion tests. The superior corrosion performance of the FPEO_CaGlyP coating, both as a stand-alone coating and as a full system, was attributed to the formation of a greater complexity of Ca2+ bonds with SiO2 and PO43− species within the MgO ceramic network during the in situ incorporation of Ca into the coating from a double chelated electrolyte and the resultant difficulties with the hydrolysis of such a network. The deterioration of the FPEO_CaGlyP coating during immersion was found over ten times slower compared with Ca-free flash-PEO coating.
1. Introduction
Mg alloys are lightweight materials that ought to become very commonly used in the transport industry because of their unique physical and chemical properties, e.g., Mg (1.74 g/cm3) is 35% lighter than aluminum (2.7 g/cm3) and about four times lighter than steel (7.86 g/cm3). However, being a very active metal (E = −2.37 VSHE), Mg shows low corrosion resistance in many environments and it is highly susceptible to microgalvanic corrosion in the presence of intermetallic compounds and impurities in its alloys [1].
Plasma electrolytic oxidation or PEO is an advanced form of anodizing under high voltages (above the dielectric breakdown potential), where discrete plasma microdischarges allow for an efficient introduction of electrolyte species into the coating [2]. These incorporated species consolidate into corrosion-resistant phases and enhance the protection provided by the MgO layer which otherwise would not be that high, considering the low Pilling–Bedworth ratio (Vox/Vm = 0.81) of MgO and its relatively high solubility in non-alkaline aqueous environments. It is worth mentioning that some cationic and anionic inorganic species may provide active corrosion-inhibiting properties [3,4], although species incorporation is usually achieved via a post-treatment. As a result, PEO is one of the most successful approaches for providing an enhanced corrosion protection of Mg components.
Ca is sometimes used in protective coatings produced by anodizing [5,6,7,8,9,10,11,12,13,14,15,16,17], electrodeposition [18,19,20], conversion [21,22] or by mixed strategies (e.g., PEO with electrophoretic deposition [23] or hydrothermal treatment [24]); the formation of calcium phosphates, hydroxyapatite and other Ca-rich compounds typically leads to an improvement in the corrosion resistance of coated Mg alloys. The current literature considers PEO coatings that contain Ca species mostly for biological implant applications due to their great biocompatibility, especially in terms of hydroxyapatite-forming ability [25]. Examples of treatment conditions for generation of Ca-containing PEO coatings on Mg and their effect on anticorrosive properties are presented in Table 1.
Previously reported studies on Ca-containing PEO coatings typically use high voltages (between 400 and 500 V) and long treatment times (5 to 30 min), resulting in thick coatings (up to 70–90 µm). The data comparison clearly shows that the incorporation of Ca into the coatings is beneficial for corrosion protection, leading to an increase in corrosion potential and corrosion resistance as well as a reduction in corrosion current.
This work considers two compounds as a source of calcium for PEO coatings on Mg; calcium oxide (CaO) and calcium glycerophosphate (C3H7CaO6P, CaGlyP). CaO solubility is quite limited (approximately 1.18 g/L at 30 °C, pH 7.0 [26]), and further decreases with the increasing pH of the solution, which is the typical condition for PEO treatments. This leads to difficulties with maintaining stable suspensions of CaO particles. Therefore, the present study also explores the viability of CaGlyP which shows a higher general solubility 5.7 g/L (pH 7.5) [21]. The number of studies on the use of CaGlyP for corrosion protection are rather limited [8] and its impact on coating properties is not clearly justified.
It also needs to be considered that the biggest constraint for the PEO coatings commercialization is their considerable energy consumption. To overcome this limitation, this work presents the strategy of a thin coating formation by flash-PEO (FPEO) with a much lower energy input (about 10 times lower) compared with typical PEO procedures. Thin PEO coatings obtained under such conditions can be a promising replacement for thin chemical CC due to their compact and resistive ceramic-like structure. Some examples of thin PEO coatings reported in the literature [27,28,29,30,31,32,33,34] are presented in Table 2.
In the present work, the FPEO process parameters were optimized in order to reduce the treatment time and the applied voltage to a minimum, ensuring at the same time the best possible corrosion protection. The obtained coatings are thinner (~1 μm) in comparison to the previously reported studies.
Another aim of the present work is to propose an alternative to thin CC treatments for industrial automobile or aircraft applications that would provide a superior corrosion protection. For such treatments, an excellent paint adhesion is obligatory. Therefore, special importance in this study is given to the evaluation of anticorrosion performance of the full system (FPEO pretreatment combined with epoxy primer layer) in neutral salt spray (NSST) and the paintability tests performed in accordance with ISO 17872 and ASTM D 1654 standards. Full system coating properties were compared with those for the untreated Mg AZ31B substrate and a commercially available CC product with similar coating thickness.
2. Materials and Methods
2.1. PEO and CC Coatings Fabrication
Magnesium alloy AZ31B (Magnesium Elektron) was used for surface FPEO and Bonderite CC treatment. A commercial two-step procedure was used to pre-treat the specimens. The first step consisted of 15 min of cleaning in alkaline surfactant solution (Bonderite C-AK 4181 L, 90 g/L) at 80–90 °C; the second step included acidic etching in H2SO4-based solution during 4 min at room temperature (Bonderite C-IC 3610, 10 g/L). The etching rate of Mg substrate was kept above the required limit of 10 g/m2.
The PEO treatment was carried out using a computer-controlled DC power supply (Delta Elektronika SM400-AR-8) equipped with a data acquisition system that enabled the regulation of the process conditions and registration of current-time and voltage-time signals. In order to maintain a low energy consumption, the PEO electrical parameters were optimized and kept as low as possible, simultaneously maintaining the shortest possible treatment times. The base electrolyte contained potassium hydroxide (KOH), sodium silicate (Na2SiO3), sodium phosphate (Na3PO4) and potassium fluoride (KF). Electrolytes containing calcium oxide (CaO) and calcium glycerophosphate (CaGlyP) also included di-sodium ethylenediaminetetraacetate (Na2EDTA) as complexing agent. The concentration of Ca ions was the same for both electrolytes. Detailed electrolyte compositions, pH and conductivities and treatment durations are summarized in Table 3.
Anodizing was carried out at (20 ± 1) °C in a 2 L double-jacket glass cell with continuous stirring, applying a constant current density of 100 mA/cm2 and a voltage limitation of 200 V. AISI 316L stainless steel was used as a counter electrode. The time for reaching the final voltage was different for each electrolyte and therefore there were different treatment durations between 20 and 45 s. Nevertheless, similar coatings thicknesses were obtained which allowed for a direct comparison between coatings.
Commercially available products (Bonderite M-NT 160 (13 g/L) and Bonderite M-NT 161 (15 g/L) containing permanganate and hexafluorozirconate anions were used for the CC formation by a simple 3 min immersion at 35 °C.
After every step of the treatments, the samples were rinsed with deionized water followed by isopropyl alcohol and dried in warm air.
2.2. Coating Characterization and Corrosion
The coating morphologies were examined using scanning electron microscopy (SEM, JEOL JSM-6400, JEOL Ltd., Tokyo, Japan) equipped with energy dispersive X-ray (EDS) microanalysis facility. The surface analyses were conducted in three different areas for each sample. The coating thicknesses were evaluated using SEM. The cross-sections of the coated materials were prepared by embedding the specimens in an epoxy resin and grinding through successive grades of SiC abrasive paper, from P120 to P1200 followed by polishing to 0.1 μm diamond paste. A Philips X’Pert X-ray diffractometer (Malvern Panalytical Ltd, Malvern, United Kingdom) (Cu Kα = 1.54056 Å) was used for the phase composition analysis (0.5° incidence angle, 2θ range 10°–90°, 0.04° 2θ/step, 1 s/step).
The electrochemical impedance spectroscopy (EIS) measurements were performed in duplicate specimens using a computer-controlled GillAC (ACM Instruments) potentiostat and a three-electrode cell filled with 0.5 wt% naturally-aerated NaCl solution. The working area of the specimens was defined as 1 cm2; the counter and reference electrodes were graphite and silver/silver chloride (Ag/AgCl in 3 M KCl), respectively. Before the measurements, the specimens were immersed for 15 min to establish the open circuit potential (OCP). In order to evaluate an effect of longer exposure to corrosive media, 24 h immersion was conducted before EIS. The measurements were carried out over a frequency range from 30 kHz to 10 mHz, using a 10 mV amplitude sinusoidal signal. The spectra were fitted using ZView software (Scribner Associates Inc., Southern Pines, NC, USA).
The surface texture was studied using a focus variation optical profilometer, a ×50 magnification Alicona InfiniteFocusSL (Alicona Imaging GmbH, Raaba/Graz, Austria).
The MicroRaman analysis was performed using a NT-MDT NTEGRA Spectra spectrometer (NT-MDT SI, Moscow, Russia), equipped with a Solar TII MS5004i monochromator (SOL instruments Ltd., Minsk, Belarus), a CCD Andor iDUS DU-420 detector (1024 × 128 pixels) (Oxford Instruments, Abingdon, UK) and an Olympus modular BX-100 microscope (Olympus Corporation, Tokyo, Japan). The measurements were performed inside the pores of the coatings using an Olympus MPlanFL 20×/0.45NA objective (Olympus Corporation, Tokyo, Japan). A 532 nm wavelength, 20 mW solid state laser (with a 0.1% ND filter attenuation) was used as an excitation source. Grating of 600 L/mm and acquisition times of 300–600 s were used.
Fourier transform infrared spectroscopy (FTIR) analysis was performed using a Nicolet iS50 instrument (Thermo Fisher Scientific, Waltham, MA, USA) equipped with a KBr beam splitter and a DTSG-KBr detector. ATR SpectraTech Performer (Thermo Electron Corporation, Waltham, MA, USA) with a diamond crystal was utilized. The measurements were performed using 128 scans at 4 cm−1 resolution. Additionally, MicroFTIR analysis was carried out using a Nicolet iMX10 spectrophotometer (Thermo Fisher Scientific, Waltham, MA, USA) with KBr beam splitter and MCT/A detector refrigerated with liquid nitrogen. Measurements were performed with a germanium crystal MicroATR accessory, 256 scans and 8 cm−1 resolution.
A 3-component epoxy primer (276:87:85 g of Epoxy Primer 37076: Hardener 92133: Thinner C25/90S) was applied with a drawbar in order to produce a ~25 µm-thick layer. The paint was cured during 1 h at 80 °C. The samples were painted only on one side.
The paint adhesion tests were carried out right after the curing of the paint. The tests were carried out in accordance with EN ISO 2409 by a 6 line cross-cut with a 1 mm spacing applied using certified tools dedicated for this test. All coatings (FPEO and CC) were prepared, painted and cured on the same day. For all the coatings, the tests were repeated using three specimens and the rating was calculated as an average result. The dry paint adhesion tests were performed on as-prepared samples on the same day; the so-called wet paint adhesion was performed on specimens after 7 days of immersion in distilled water.
NSST was conducted on painted and scratched specimens according to ASTM B117 standard using a 400 L salt spray chamber (CCM-MX, CCI-Sociedad Española para el Control de Calidad e Instrumentación, S.L., Mataro) with a 5% NaCl fog. The rating numbers were defined according to ASTM D 1654 standard. The unpainted bottom and edges of each specimen were masked before the salt spray testing. The scratched specimens were prepared with a scratching tool (ISO 17872) with a 0.5 mm tungsten carbide tip. The length of the scratch was approximately 1.5 cm and it was made in the center of the samples. The corroded surface area of the scratched specimens was measured by image analysis (ImageJ software (NIH, Bethesda, MD, USA)). The rating numbers of the scratched specimens were defined according to ASTM D 1654 standard. Before the measurement, the corrosion products from the top of the scratch were gently removed with abrasive paper P1200 grit. The measured corroded distance was defined as “one sided” scribe creepage from the original scribe line to the creepage front. The corroded surface areas of the samples were calculated excluding the surface of the original scratch. For all the salt spray tests, triplicate samples were used.
3. Results and Discussion
3.1. Electrical Response of Flash-PEO
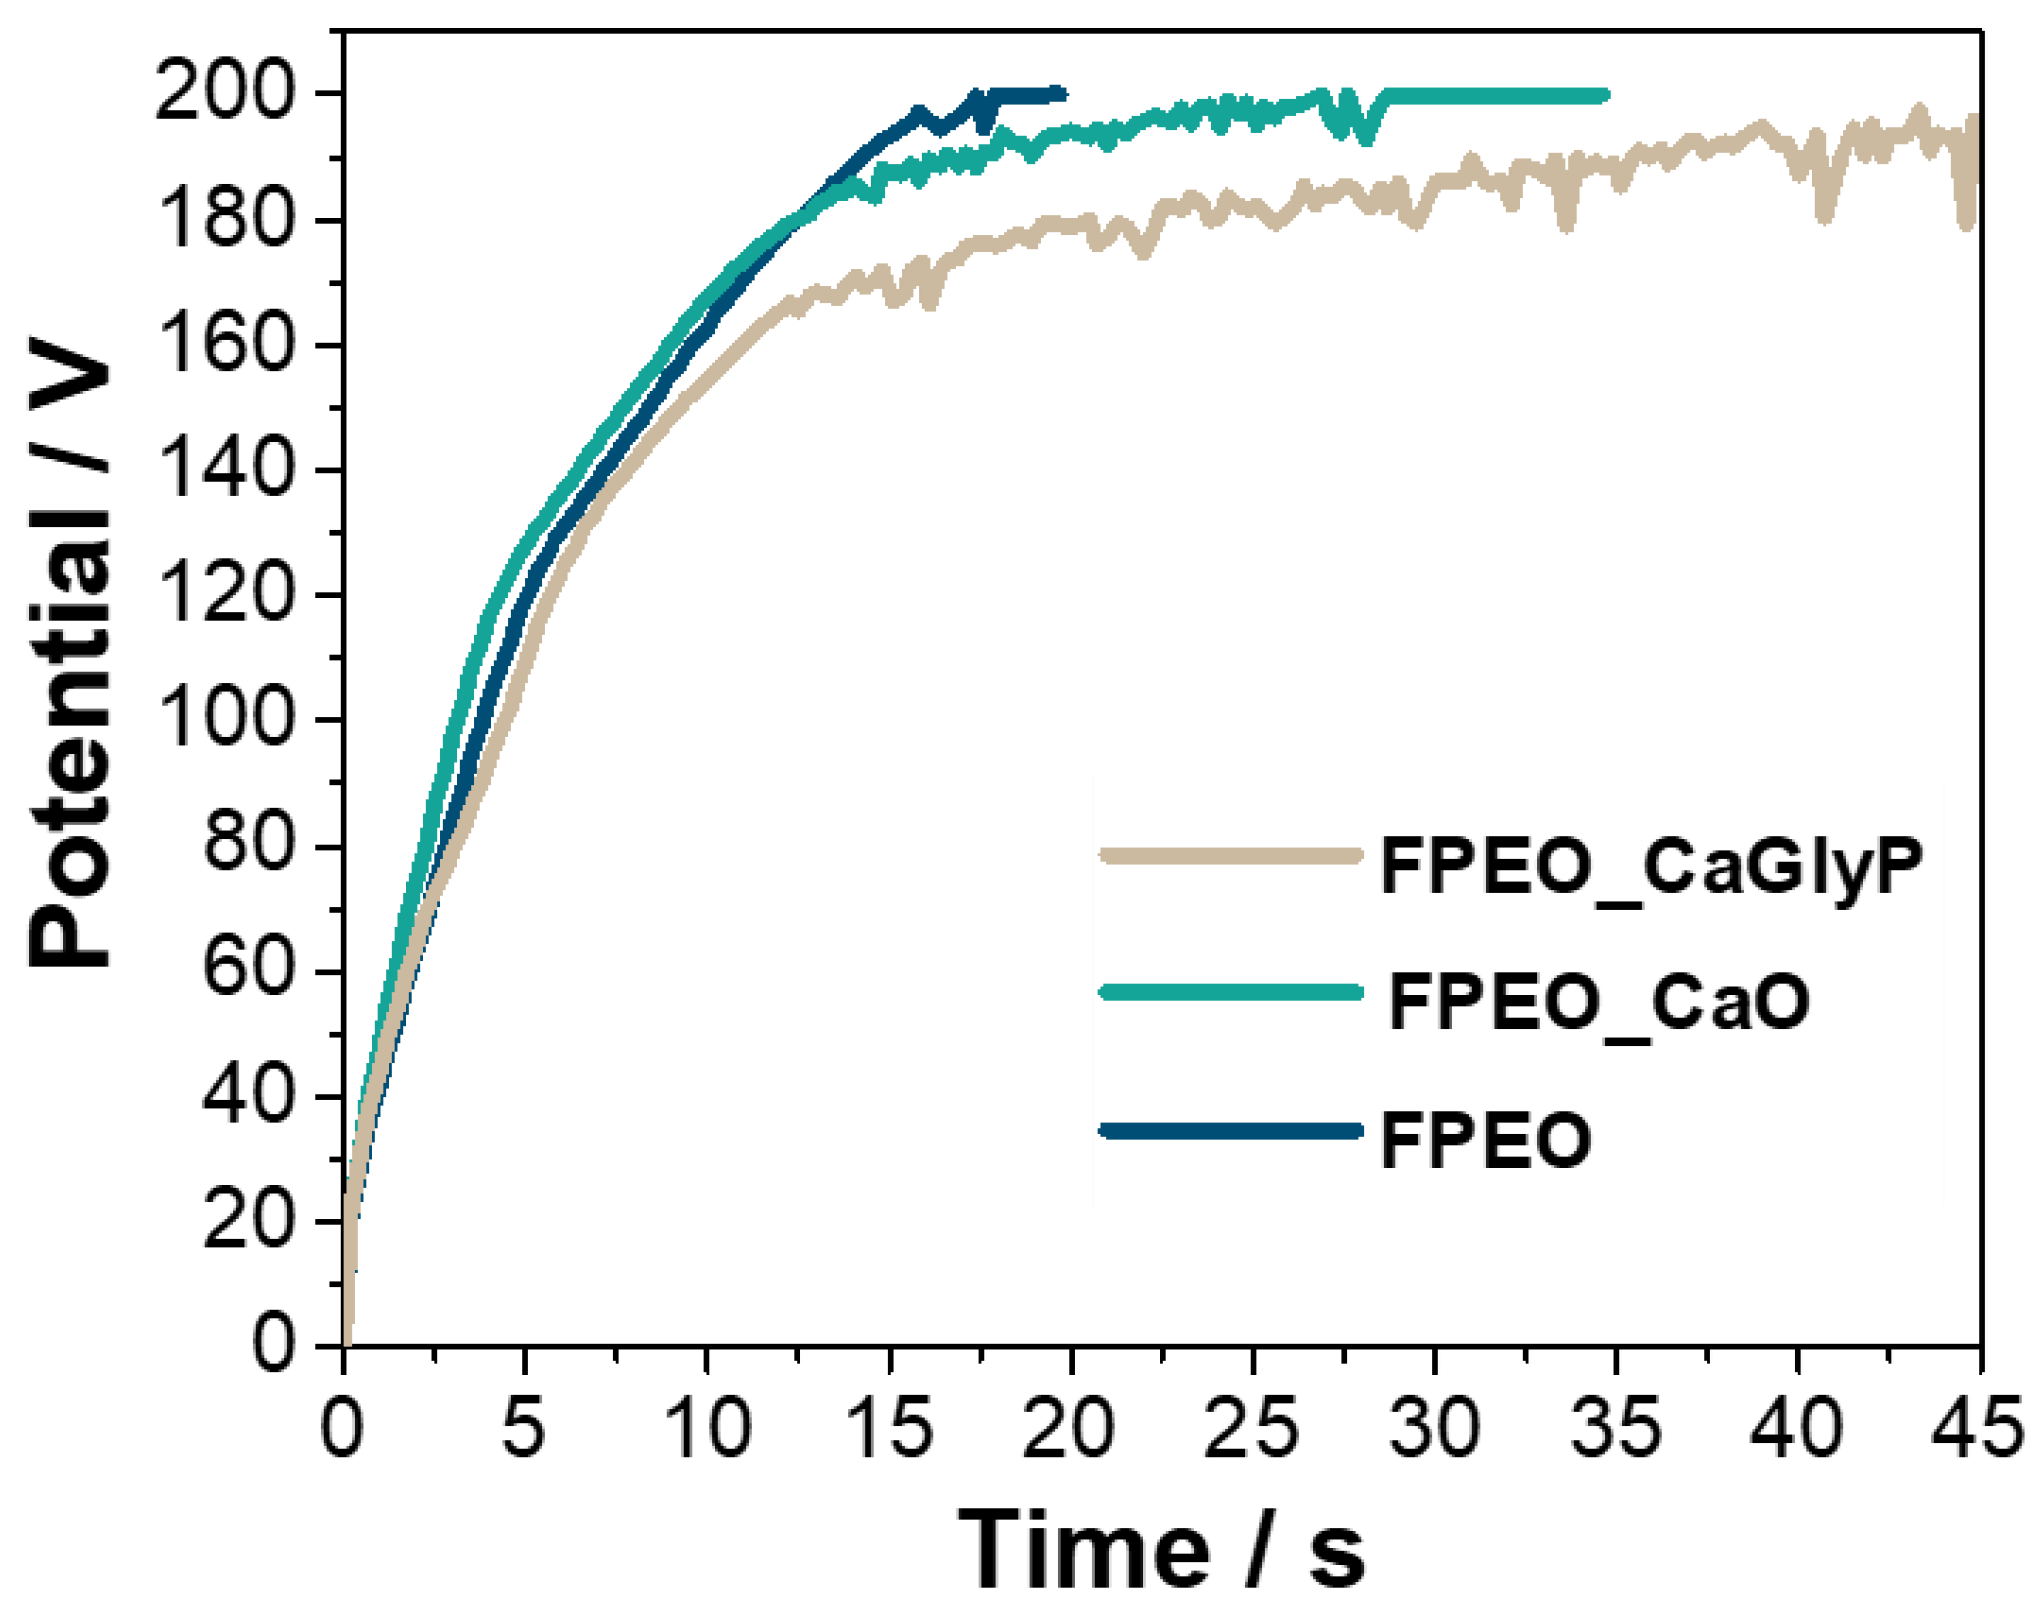
The voltage–time curves acquired during the studied FPEO processes are presented in Figure 1. The curves exhibit shapes characteristic of galvanostatic anodizing conditions with an initial fast voltage increase corresponding to the growth of a barrier MgO layer and the subsequent voltage oscillations at a reduced slope associated with the initiation of plasma microdischarges until the finale set voltage was reached. Despite the fact that the pH and the conductivities of all the electrolytes were very similar (Table 3) the FPEO in base Ca-free electrolyte reached the top limiting potential (200 V) after only 20 s; the respective times were extended to 35 and 45 s in the electrolytes with CaO and CaGlyP, respectively. It should be remembered that both electrolytes contain Na2EDTA, and both GlyP and EDTA are strong chelating agents not only with respect to Ca but with respect to Mg as well, which means that in their presence in the electrolyte Mg surface passivates with more difficulty, as a dissolution of Mg (through the formation of MgGlyP and MgEDTA complexes) competes with the formation of MgO. Consequently, this leads to a slower growth of the MgO layer and to the delay of the onset of microdischarges, more pronounced in a heavier chelated electrolyte. This also affects the energy consumption of the processes, which varied from 0.8 kWh/m2 for an Ca-free electrolyte to 2.04 kWh/m2 for CaGlyP (Table 3). Nevertheless, all three PEO processes can be considered as extremely short and therefore, beneficial from the energy consumption point of view. For instance, the energy consumption of a typical 30 min PEO treatment is about 18 kWh/(m2μm) [35].
3.2. Coating Morphology and Composition
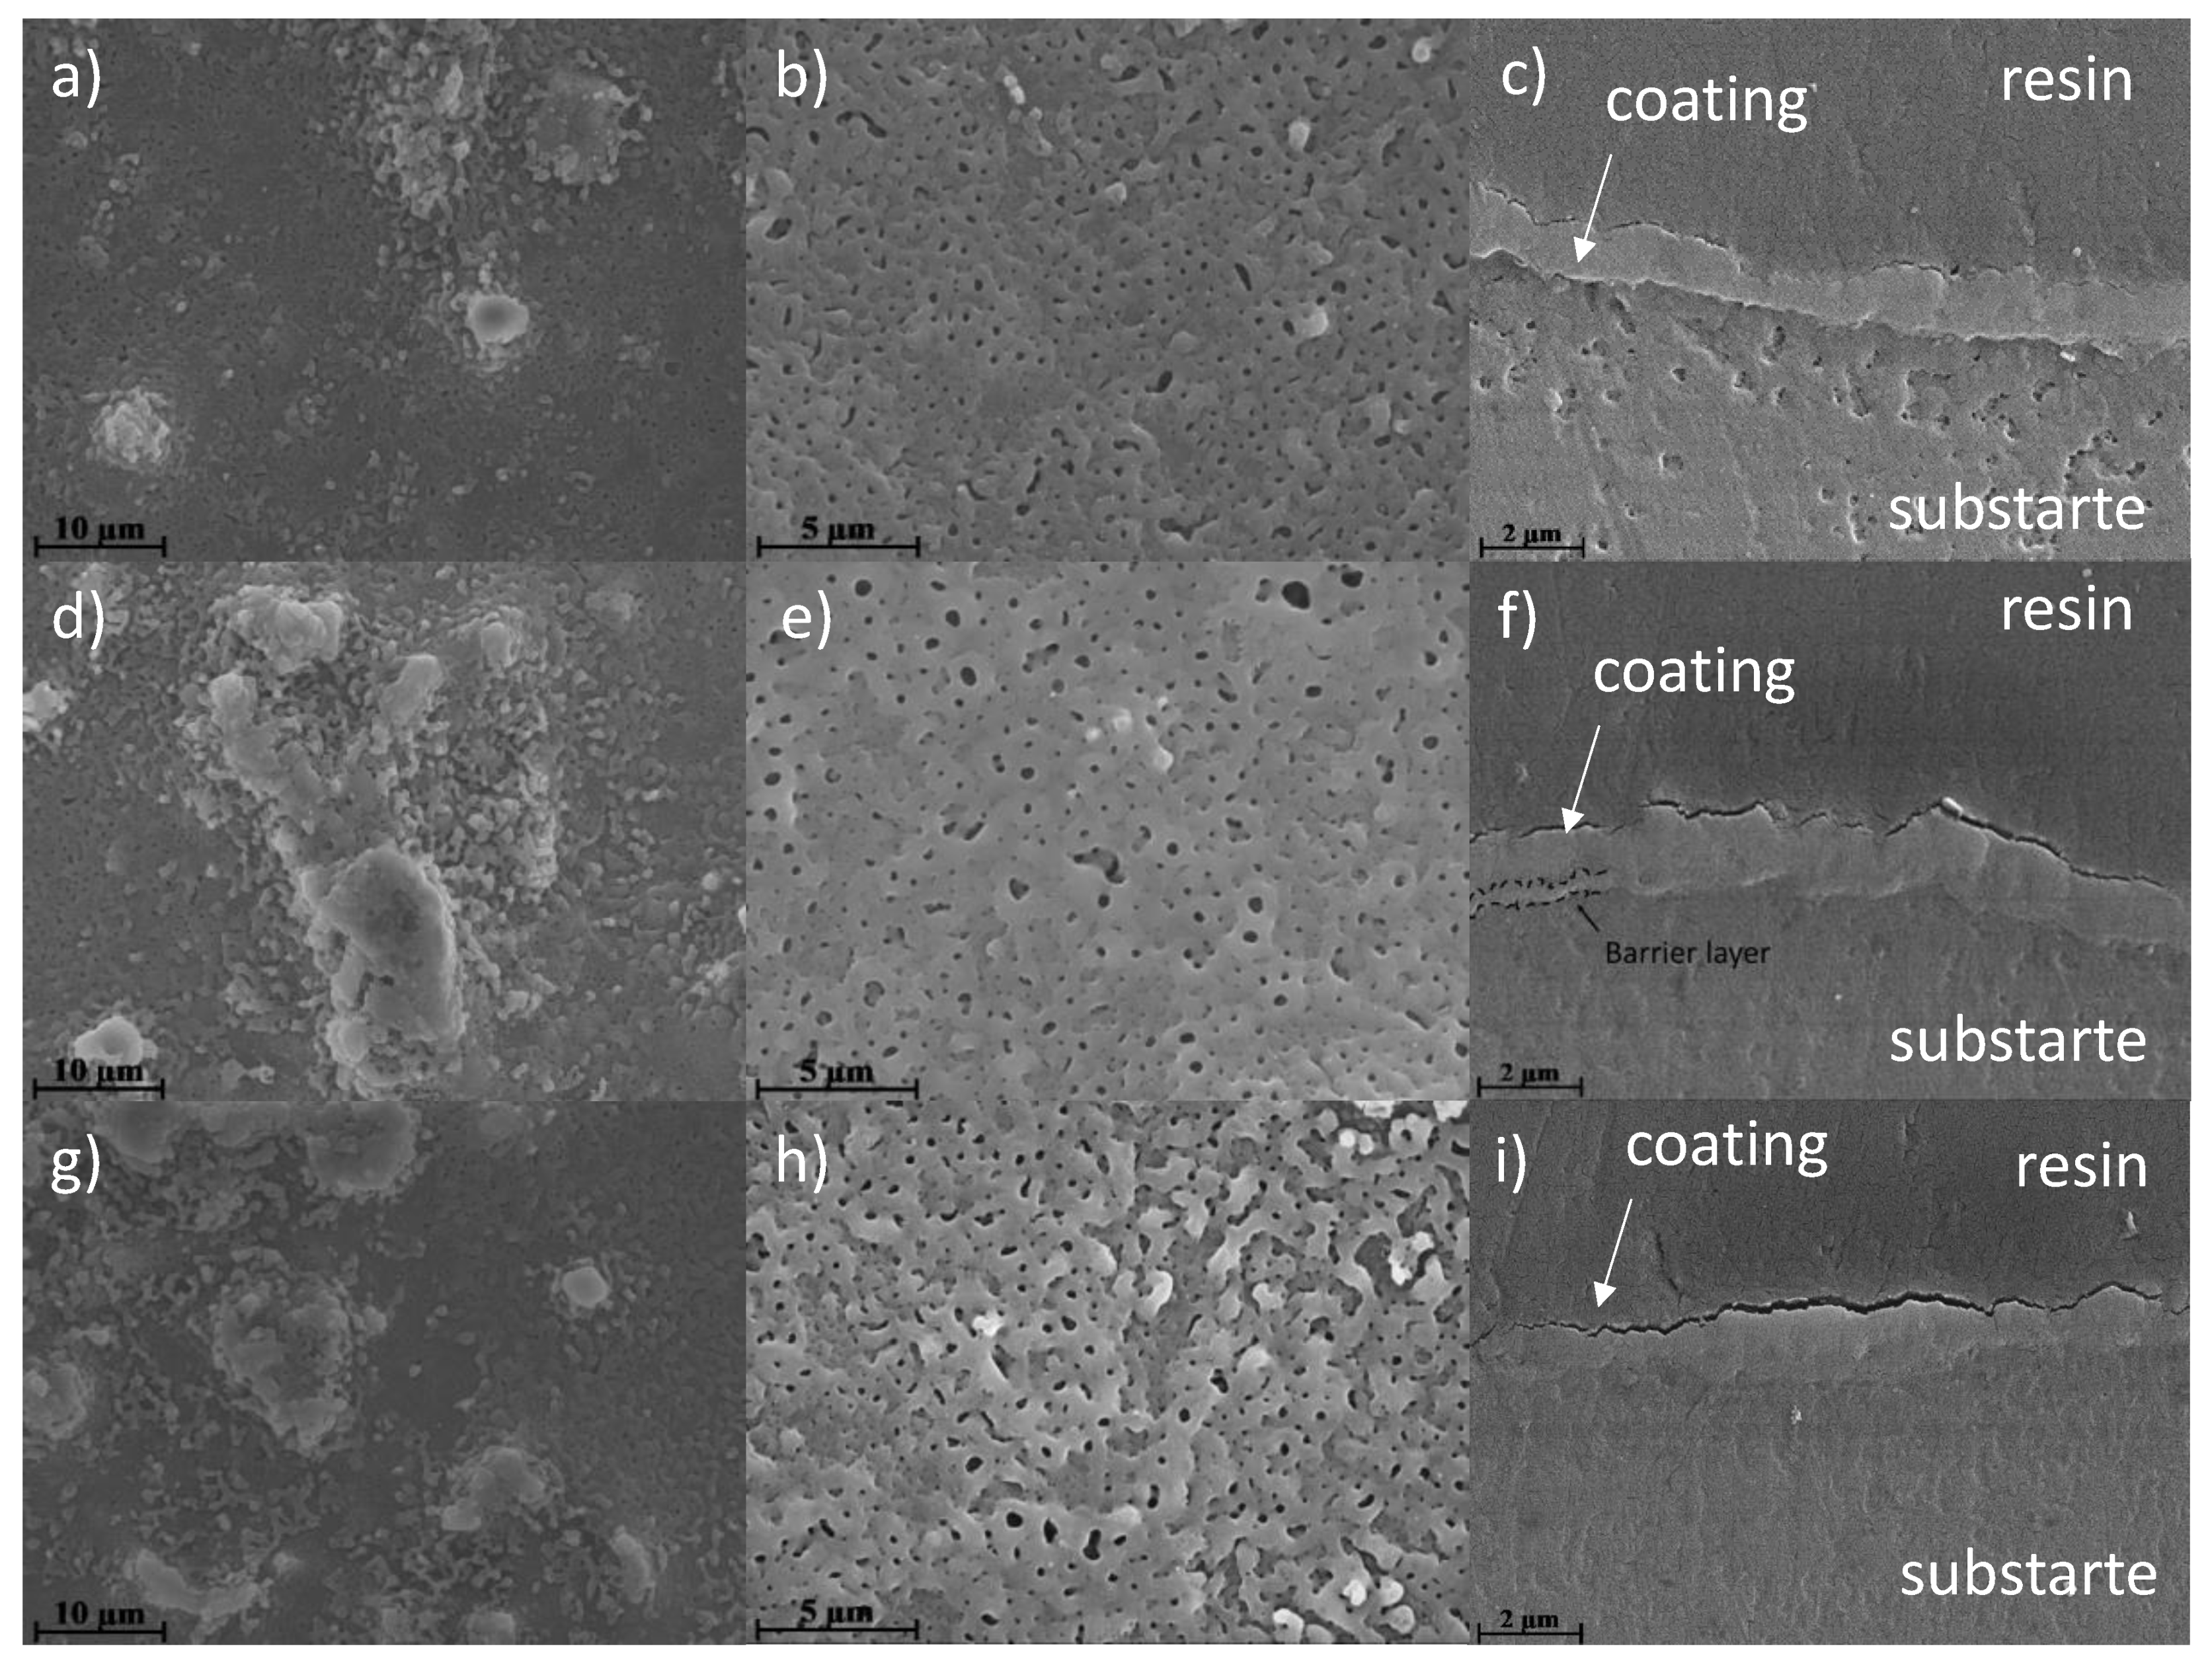
The plan-view electron-optic examination of the coatings did not reveal any significant differences in the surface morphologies (Figure 2). Lower magnification images (Figure 2a,d,g) disclose flat regions with protruding irregularities which formed over the intermetallic inclusions; the latter are also observed in the AZ31B substrate, with and without commercial CC (Figure S1).
An EDS analysis of the pretreated samples confirmed that these inclusions increased the content of Al, Mn and Fe (16.5 ± 2.4, 4.8 ± 0.2, 0.1 ± 0.05 at.%, respectively). After the FPEO process, these inclusions were also covered with a passive layer. The flat regions of the surface disclose typical numerous sub-micron size pores with a uniform distribution for all FPEO coatings (Figure 2b,e,h). The porosity of the two Ca-doped coatings was found to be similar and about ~30% reduced both with respect to the average pore size and pore population density of the base FPEO coating (Table 3), due to the delayed onset of microdischarges. It is well known that the size and duration of the microdischarges tends to increase with the PEO processing time, producing larger pores [36], which did not have a chance to happen in the case of the present “flash” treatments. The chelating effect of EDTA on Mg, mentioned previously, facilitates the substrate dissolution making the growth of the passive layer slower: therefore the dielectric breakdown of the latter and the initiation of the microdischarges occurs later and the number of the microdischarges, and hence pores, may be fewer too. From the corrosion resistance point of view, reduced porosity is expected to be positive factor.
Cross-sectional images (Figure 2c,f,i) exhibited a two-layered structure of the coatings: a thin barrier layer at the bottom and a relatively compact top layer; very few pores are discerned as a residue of microdischarge channels. This may be related to the small size of the discharges and their short life-time, both expected for a treatment of such a short duration [36]. Typically, prolonged PEO treatments of Mg alloys in DC and DC-pulsed regimes result in the formation of a so-called pore band that is located at the interface of the barrier and outer layer of the coating [37]. In the present case, this feature, predictably, is underdeveloped. All three FPEO coatings were of similar compactness and thickness (close to 1 µm). In comparison, the commercial CC (Figure S1a) disclosed a uniformly cracked surface morphology; these kinds of cracks are known to be deeply penetrating throughout the CC thickness and negatively affecting the CC anticorrosive properties.
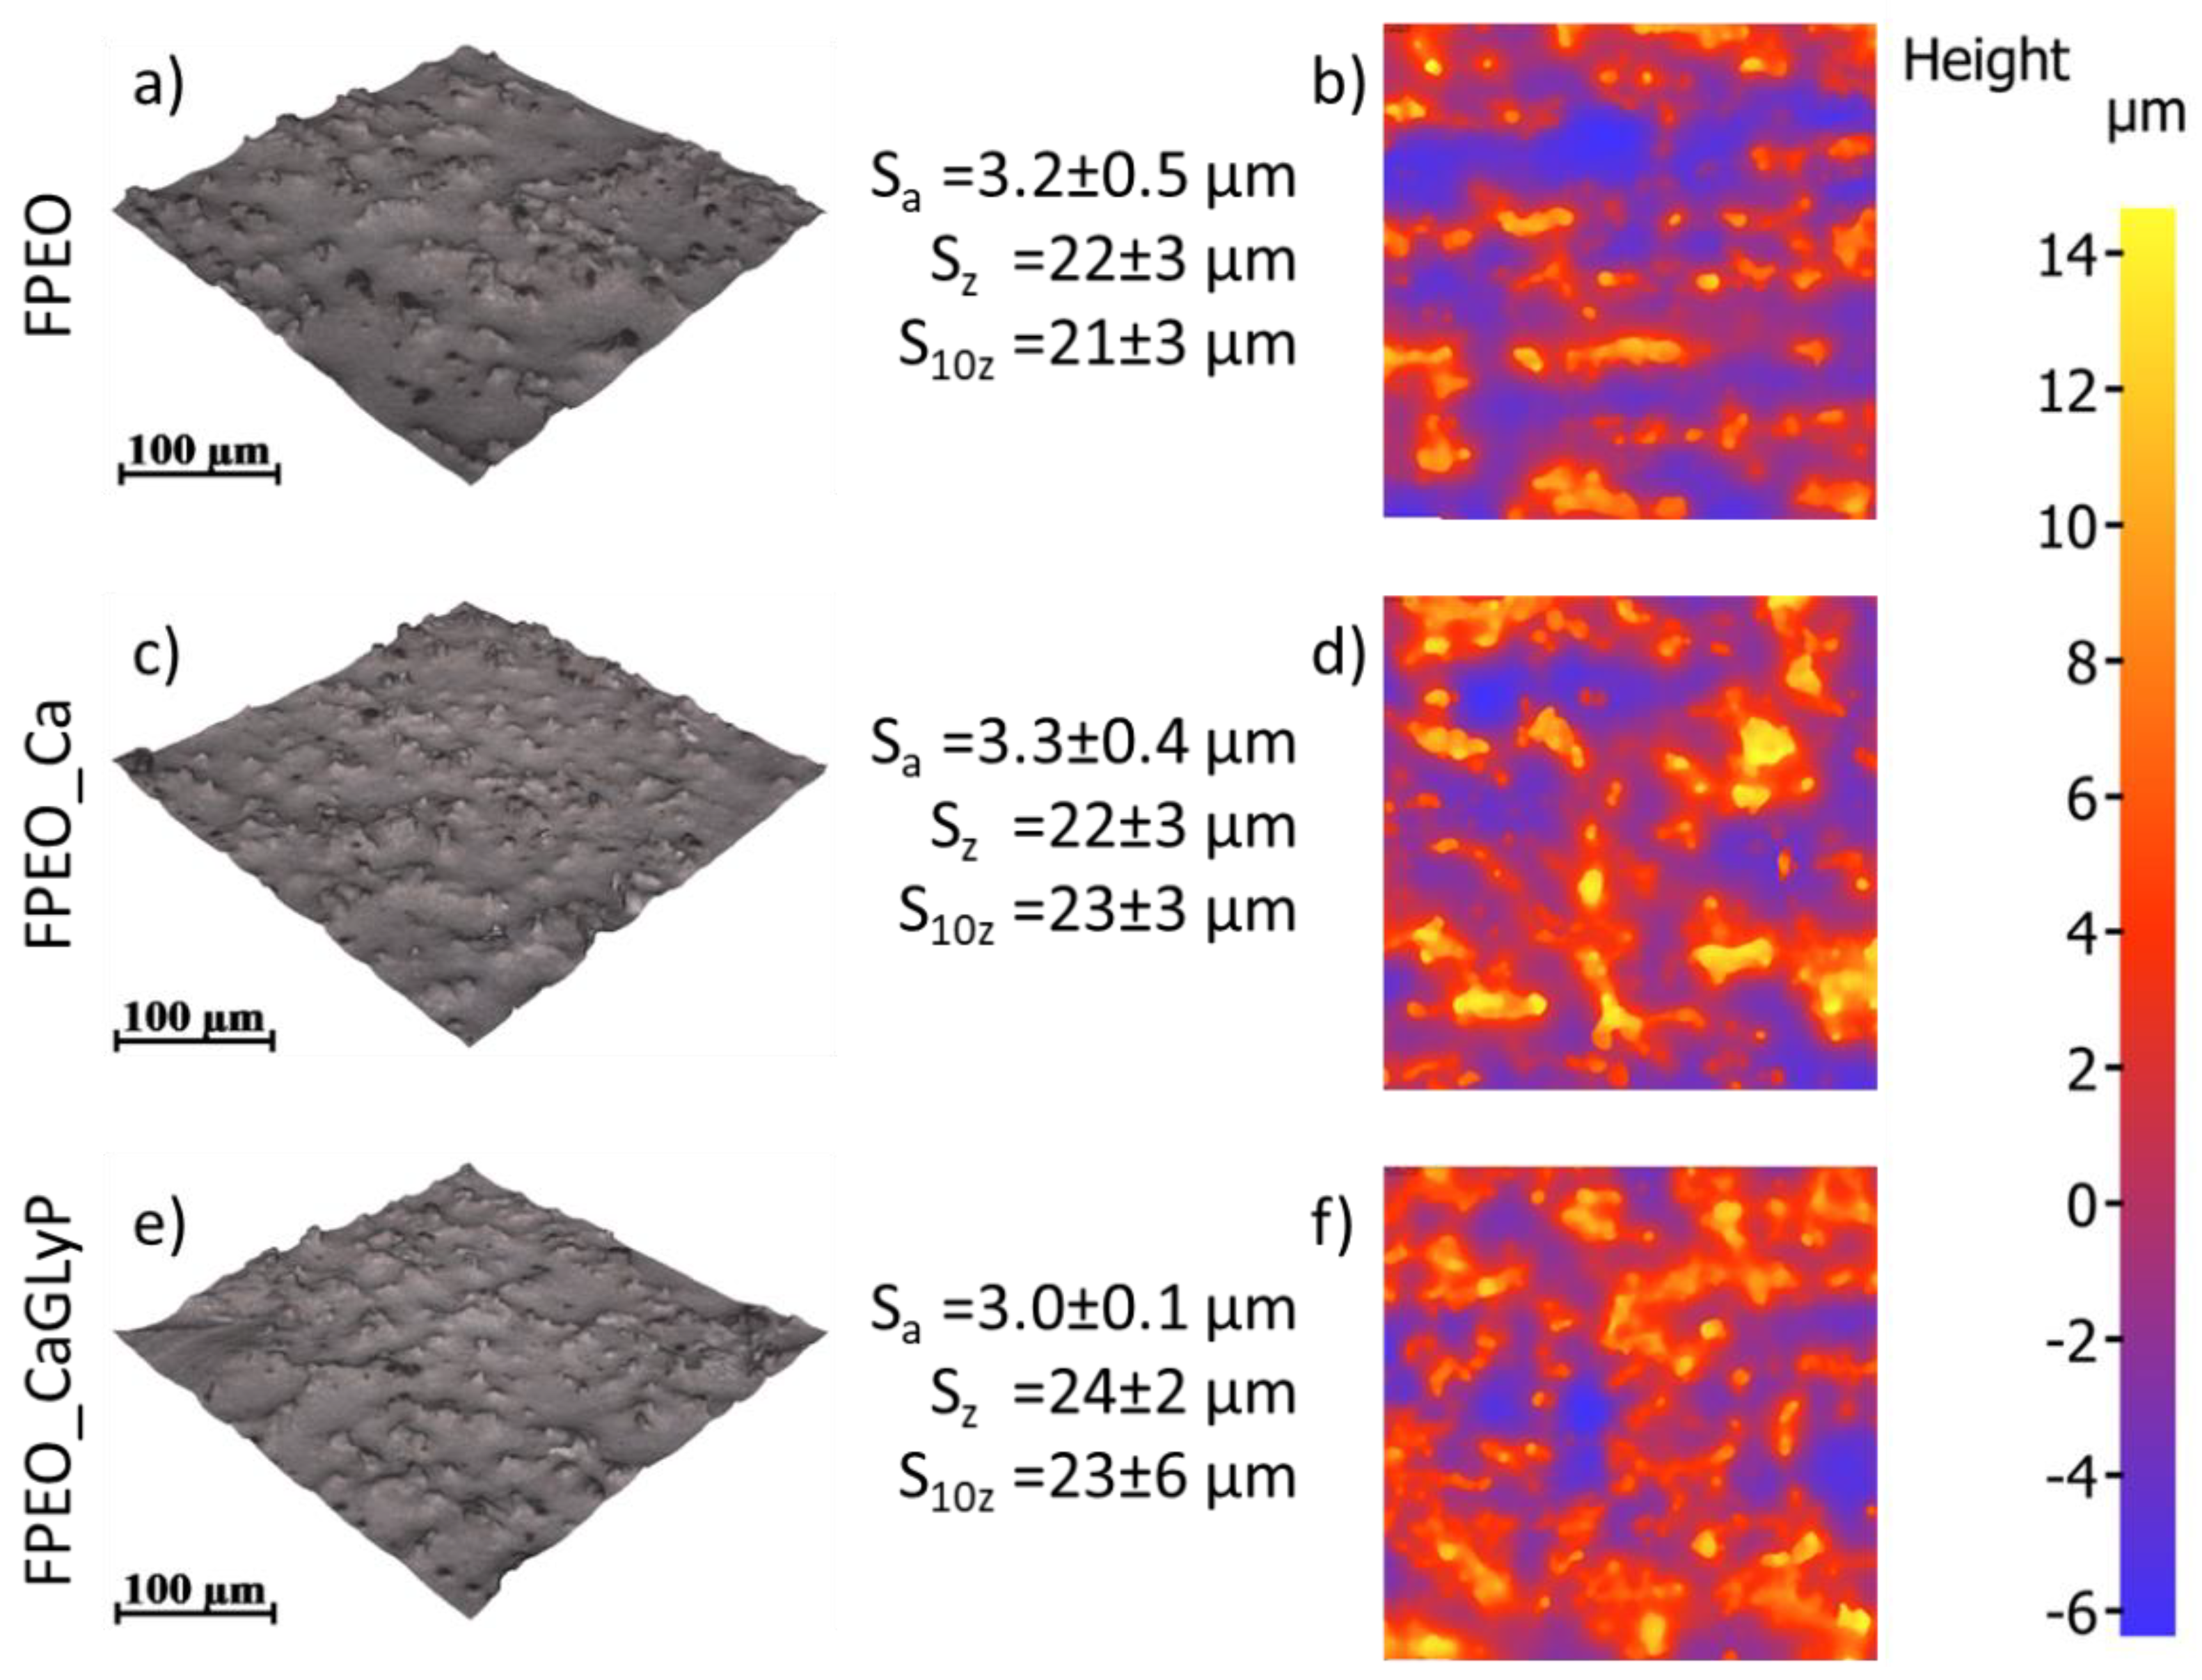
Surface texture is known to have a strong influence on the corrosion properties as well as on the paint adhesion to the coating. The three FPEO coatings exhibited very similar surface roughness parameters, with Sa and S10z, between ~3.0–3.3 µm and ~21–23 µm, respectively (Figure 3). The intermetallic alloy inclusions are clearly visible on the 3D images of the surfaces and can be recognized as bright orange color islands on the 2D maps.
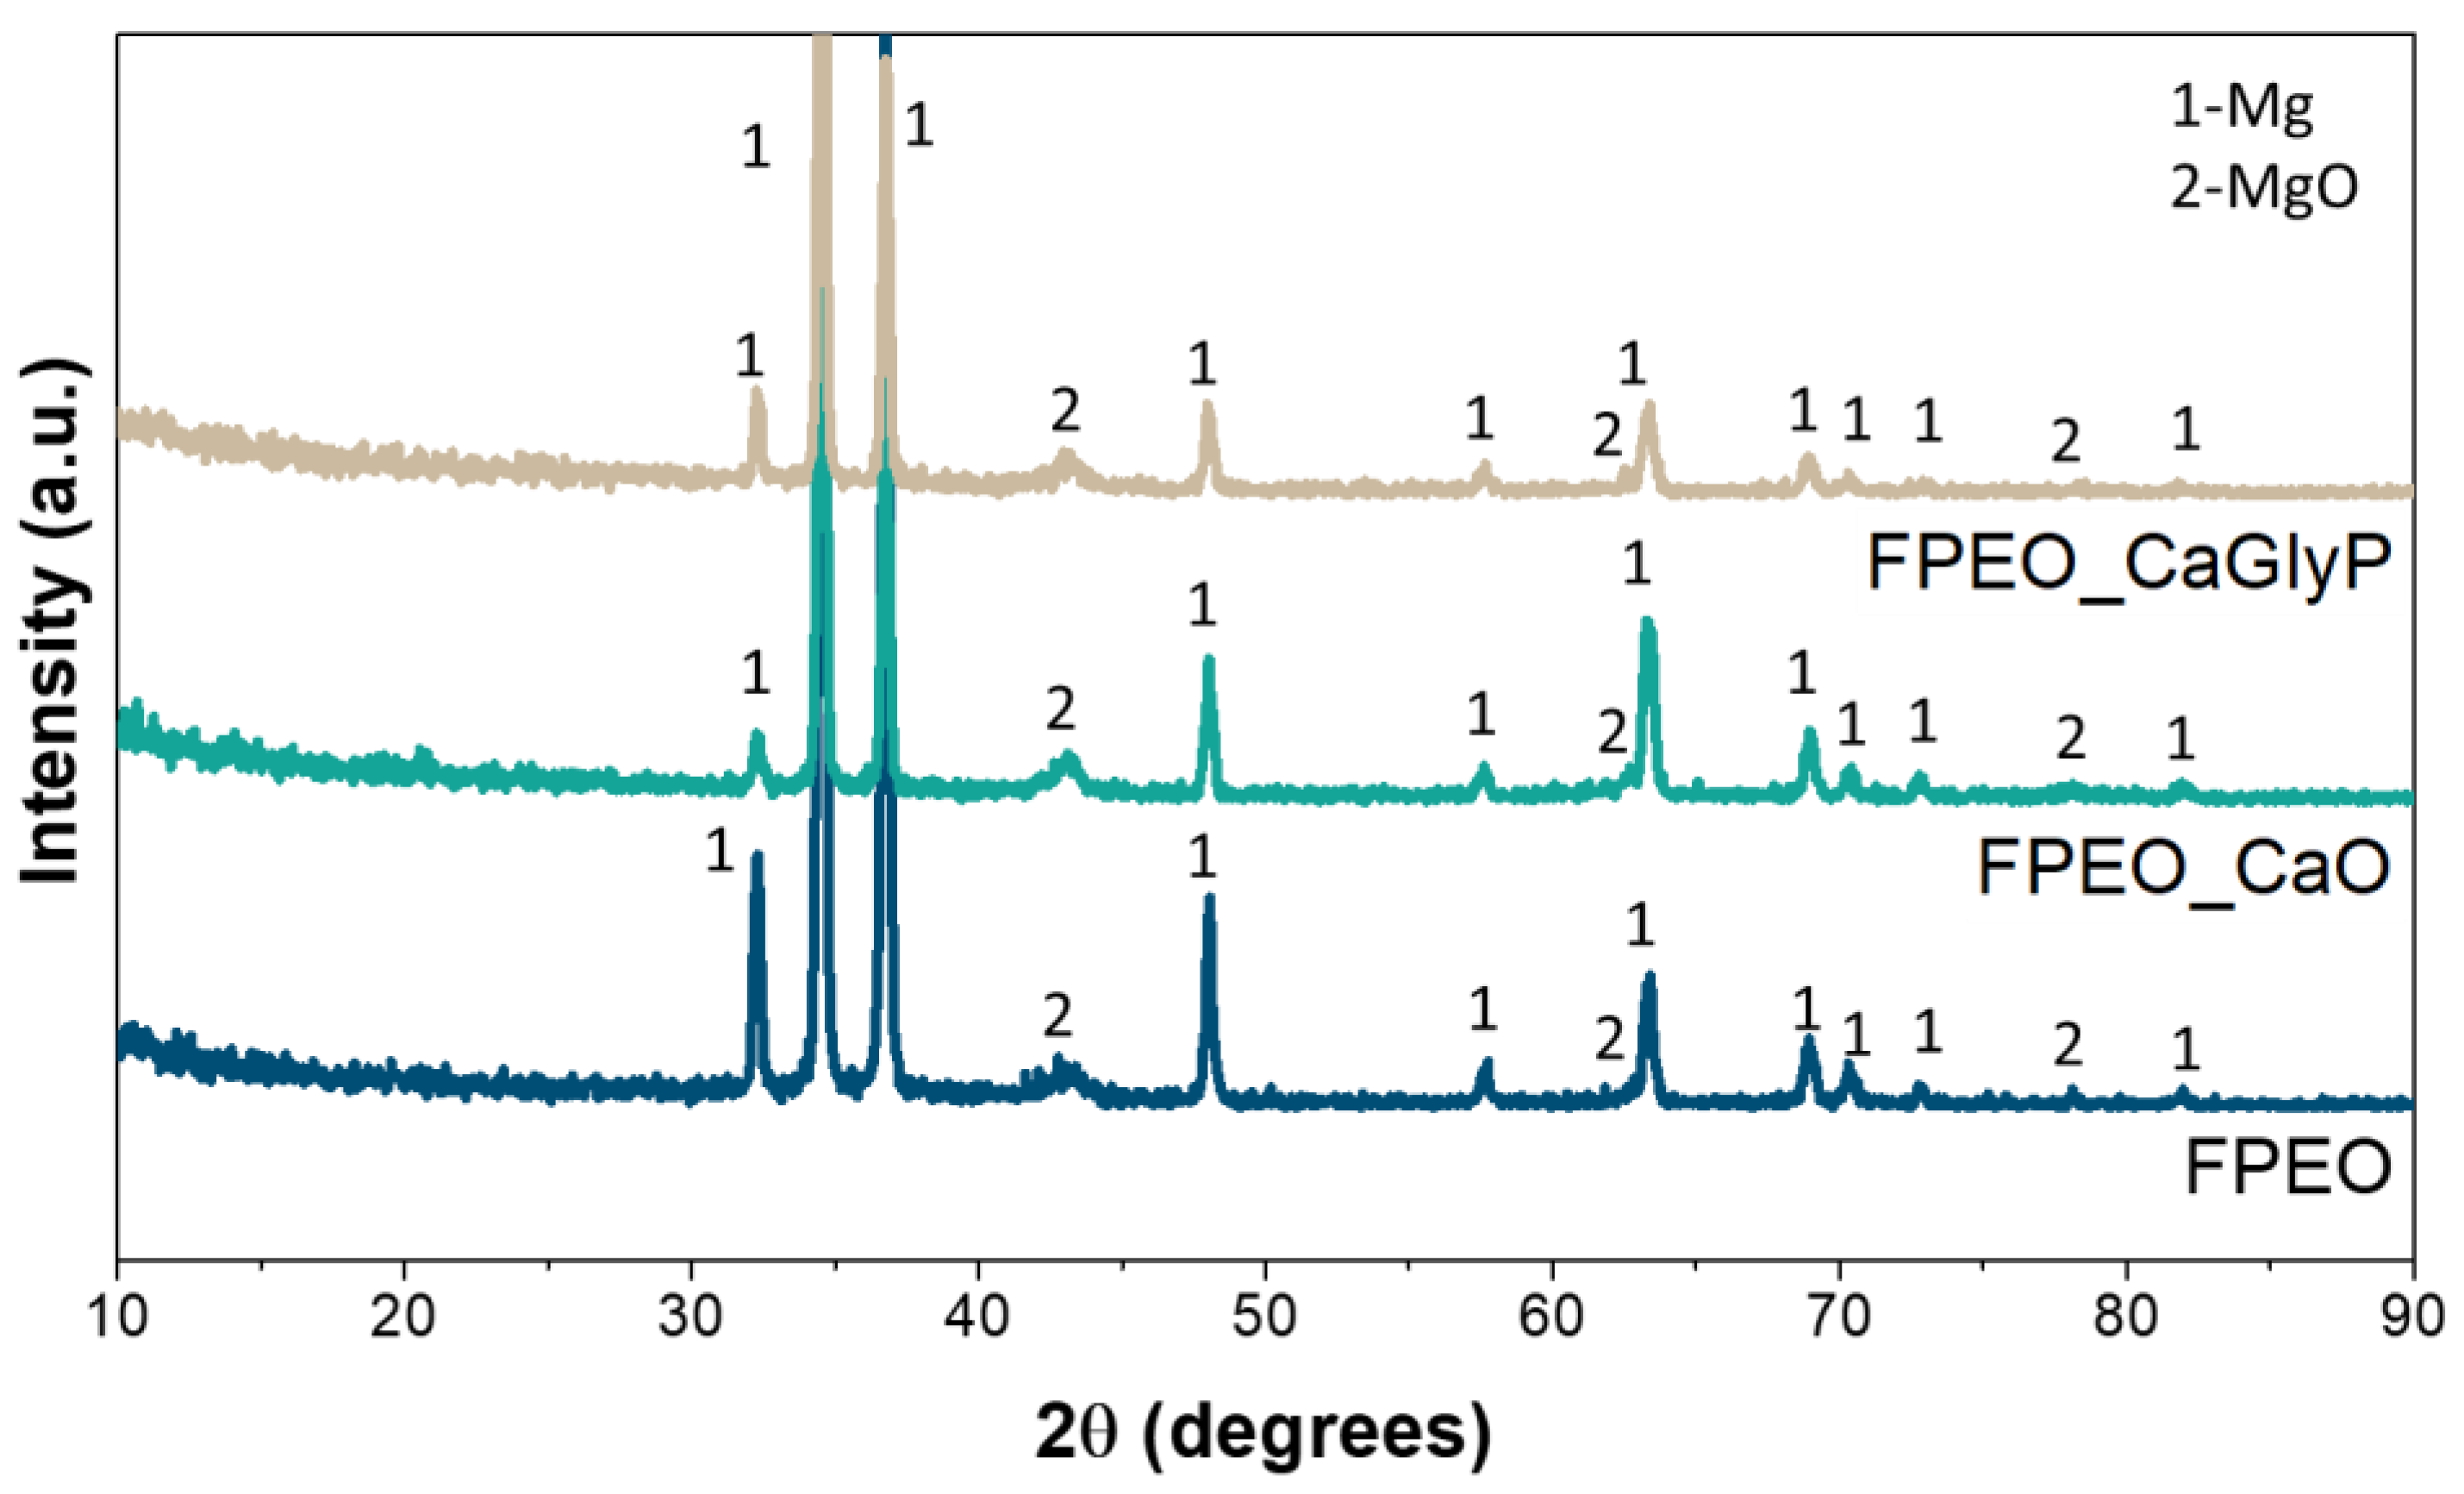
The chemical compositions of all three FPEO coatings investigated by EDS were found to be relatively similar (Table 4) with regards to the incorporation of elements from the substrate (Al) and electrolyte (Si, P, F and Ca); the incorporation of Ca into the coatings from both electrolytes was equally small and non-uniform (Ca content varied from zero in some locations to 0.1 at.% in others). Grazing angle XRD detected MgO as the only crystalline phase (Figure 4). The short PEO treatment time does not enable the evolution of longer lasting microdischarges with high enough plasma and gas temperature which could draw enough Ca species into the discharge channels and form crystalline Ca-containing phases. CaO was introduced into the electrolyte as a powder dissolves in the presence of EDTA and forms EDTA complexes which decompose and liberate Ca2+. Given sufficiently long PEO treatment time, it would be reasonable to expect the formation of calcium phosphates, calcium fluoride or hydroxyapatite.
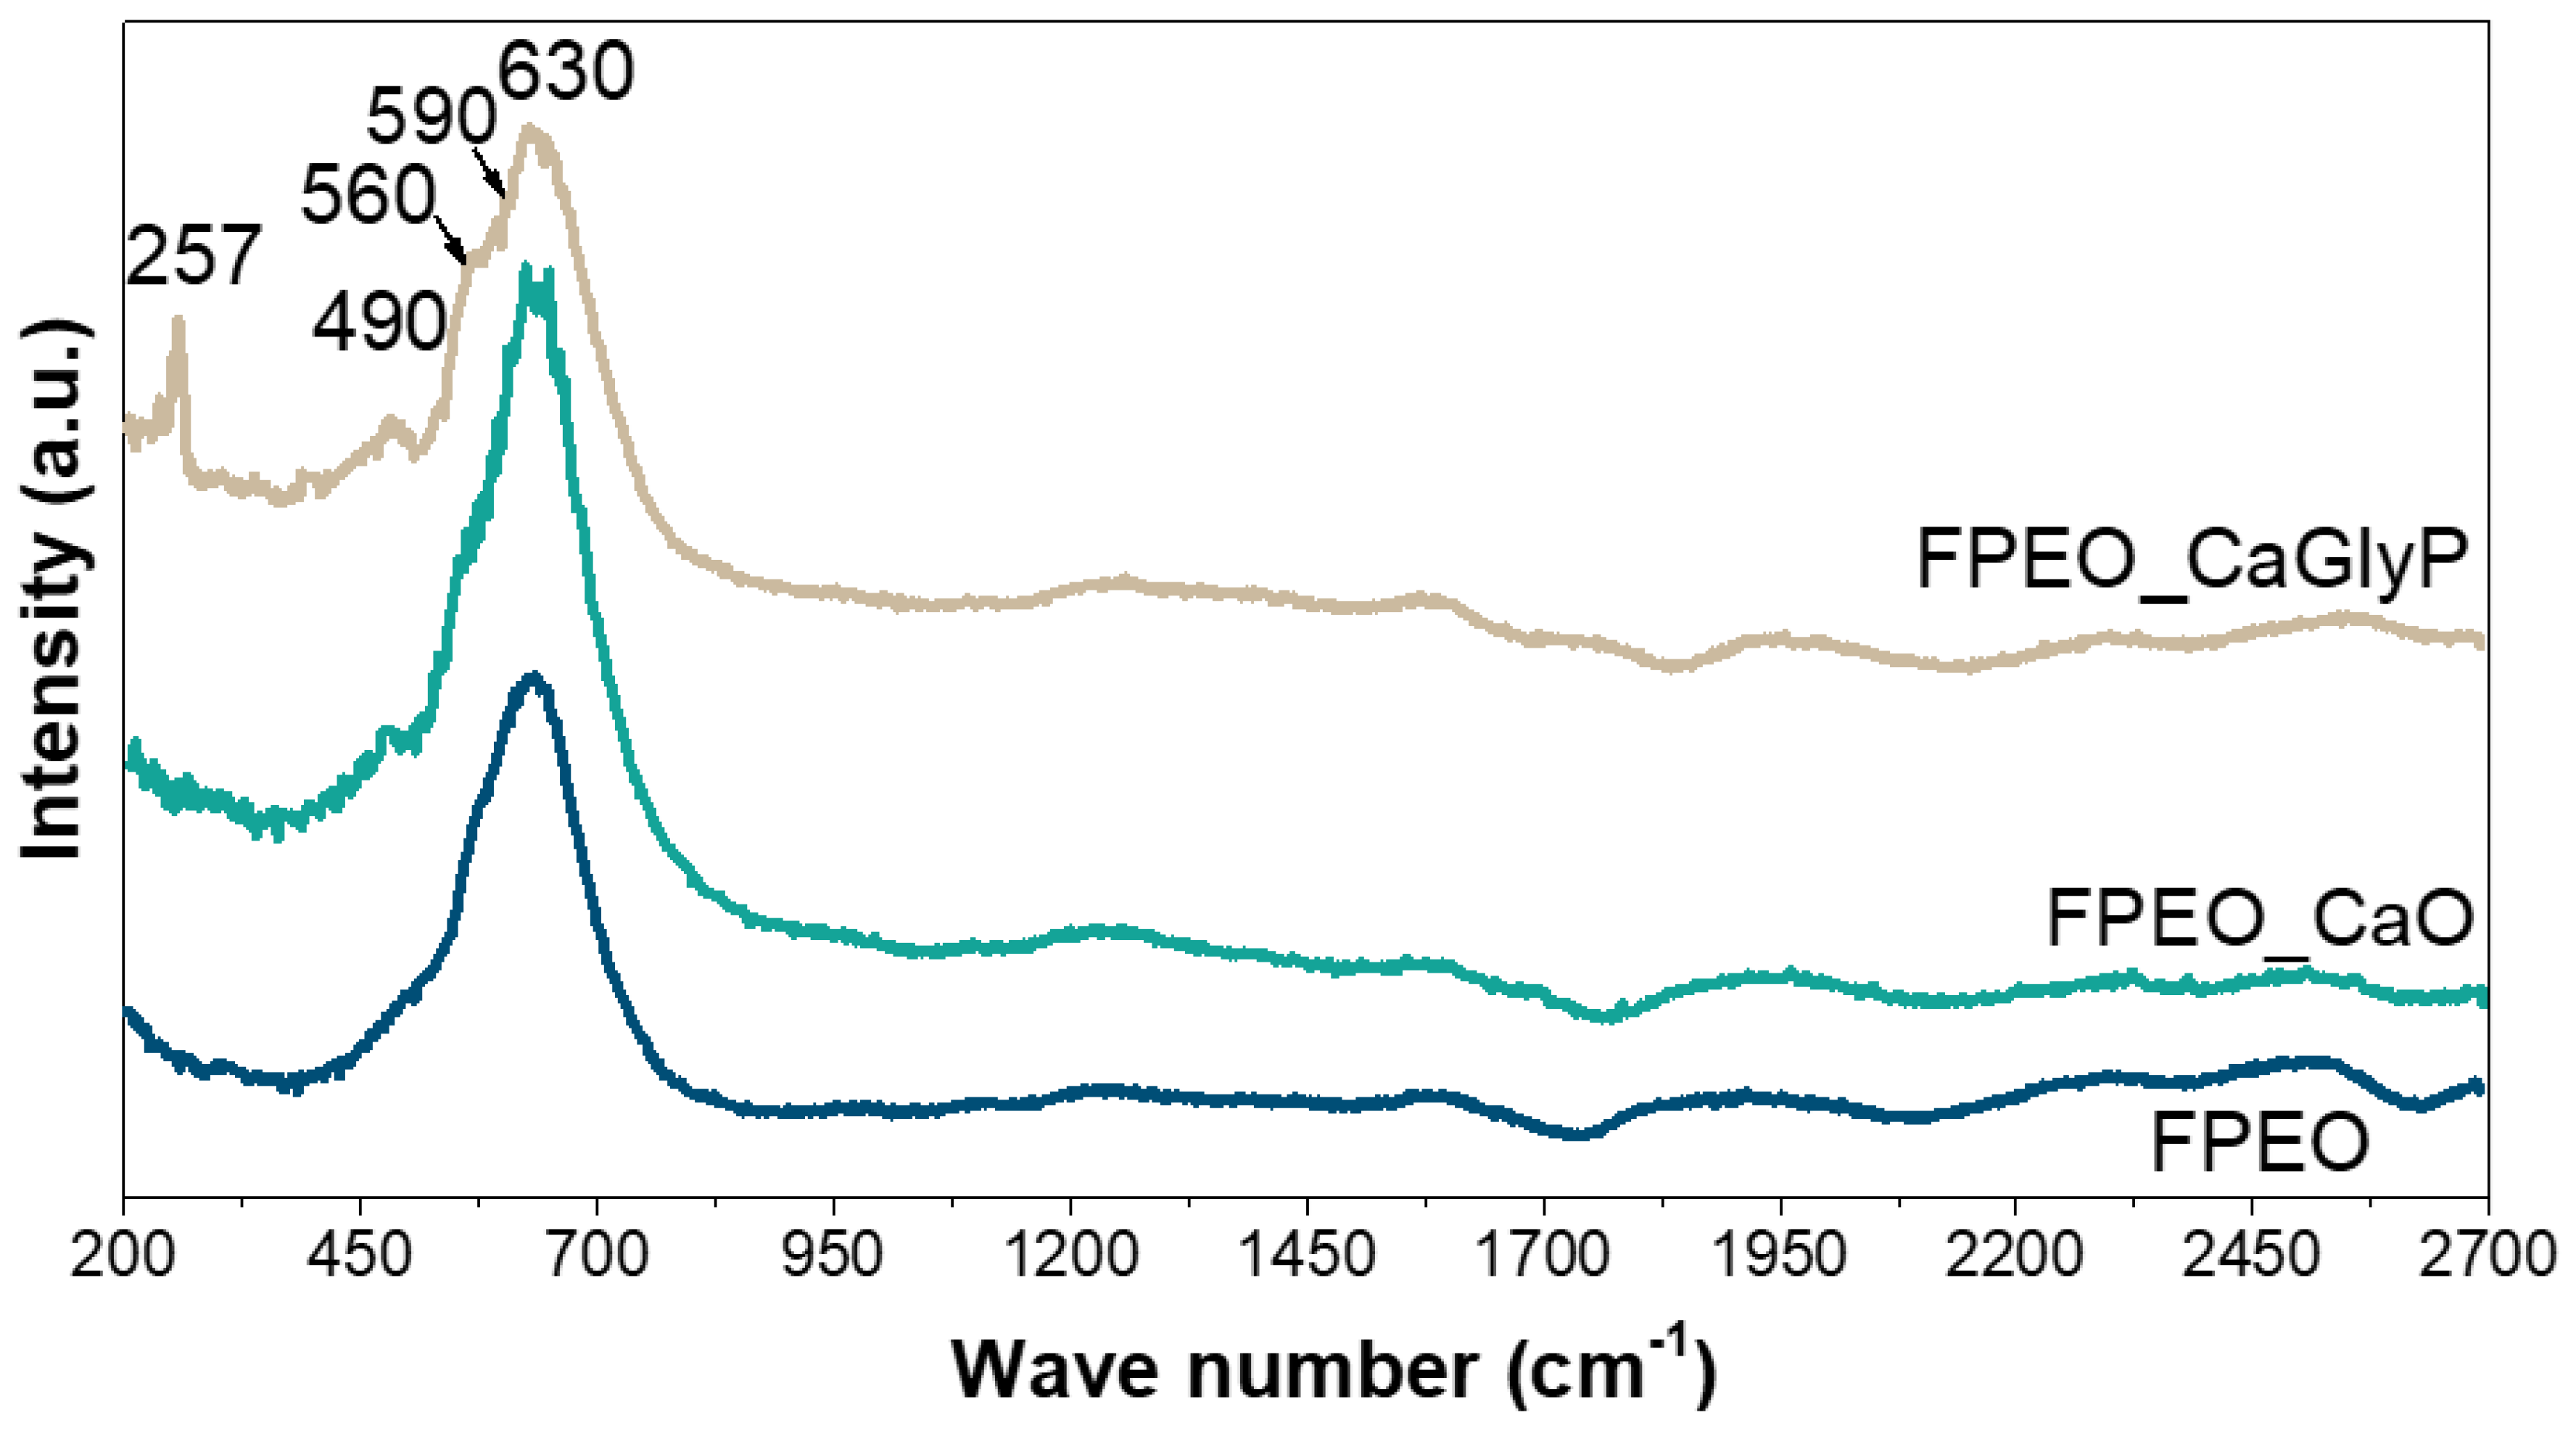
Raman spectra, measured in order to confirm the presence of possible amorphous compounds, disclosed a dominant broad peak at ~630 cm−1 in all three coatings (Figure 5); additionally, the Ca-containing coatings disclosed a broad band envelope with a peak at ~490 cm−1 and a weak intensity shoulder at about ~560–590 cm−1, both of which were better defined in the case of the FPEO_CaGlyP coating. All these bands are typically found, for instance, in phosphate glasses with high CaO, SiO2 and MgO content [38,39,40] and are associated with silicate and orthophosphate groups. Specifically, broad bands in the 520–660 cm−1 range are commonly attributed to rocking the motion of Si–O–Si bonds in pure SiO2 tetrahedra (Q4 unit) [41]. Symmetric bending of SiO2 tetrahedra, modified with Ca2+ or Mg2+ (Q3 unit with non-bridging oxygen (NBO)), is registered at a more narrow frequency range of 600–630 cm−1 [42], which is particularly consistent with the dominant 630 cm−1 peak in Figure 5. The orthophosphate (Q0) group is represented by a 590 cm−1 band for the symmetric stretching of the P–O bonds [39]. Evidently, all three coatings contain Si, Mg, as well as P, and therefore the modification of SiO2 tetrahedra with these elements is expected; however, this modification appears to happen to a lesser extent in the FPEO coating (which was formed in the electrolyte, free of complexing agents and Ca) since a 560–630 cm−1 shoulder is much less pronounced.
Another important feature of the Ca-containing coatings spectra is the clearly increasing presence of the 490 cm−1 peak, which is missing in FPEO spectrum. The 400−490 and 570−625 cm−1 frequency regions are typically present in synthetic hydroxyapatite [43,44,45] and are associated with the internal deformation modes of PO43− tetrahedra [46]. It appears that, despite the low amount of Ca in the coatings (0.1 at%), the increasing presence of chelating agents (EDTA alone or EDTA and glycerophosphate) facilitates the hydroxyapatite-like arrangements of phosphate groups in the coatings. Remarkably, only the Raman spectrum for the coating generated in the CaGlyP-doped electrolyte features a well defined narrow peak at 257 cm−1. The frequency regions at <280 cm−1 in Ca–Si–O systems are associated with complex vibrations involving Ca–O polyhedra [42]. Therefore, the prominent 257 cm−1 peak, considered together with the 490 cm−1 peak, is a likely evidence of the Ca–O bonds formed within the MgO, PO43− and SiO2 matrix of the coating. Indeed, it stands to reason that a double-chelated Ca, in the form of a negatively charged mixture of GlyP- and EDTA complexes, (CaPO4CH2-HCO-H2CO)2− and (Ca(OOC)2(CH2)2N(CH2)2N(CH2)2(COO)2)2−, should be easier drawn to the anode and into the plasma microdischarge channel than a single chelated CaEDTA2−, where during plasma-chemical transformations it is incorporated into the MgO structure.
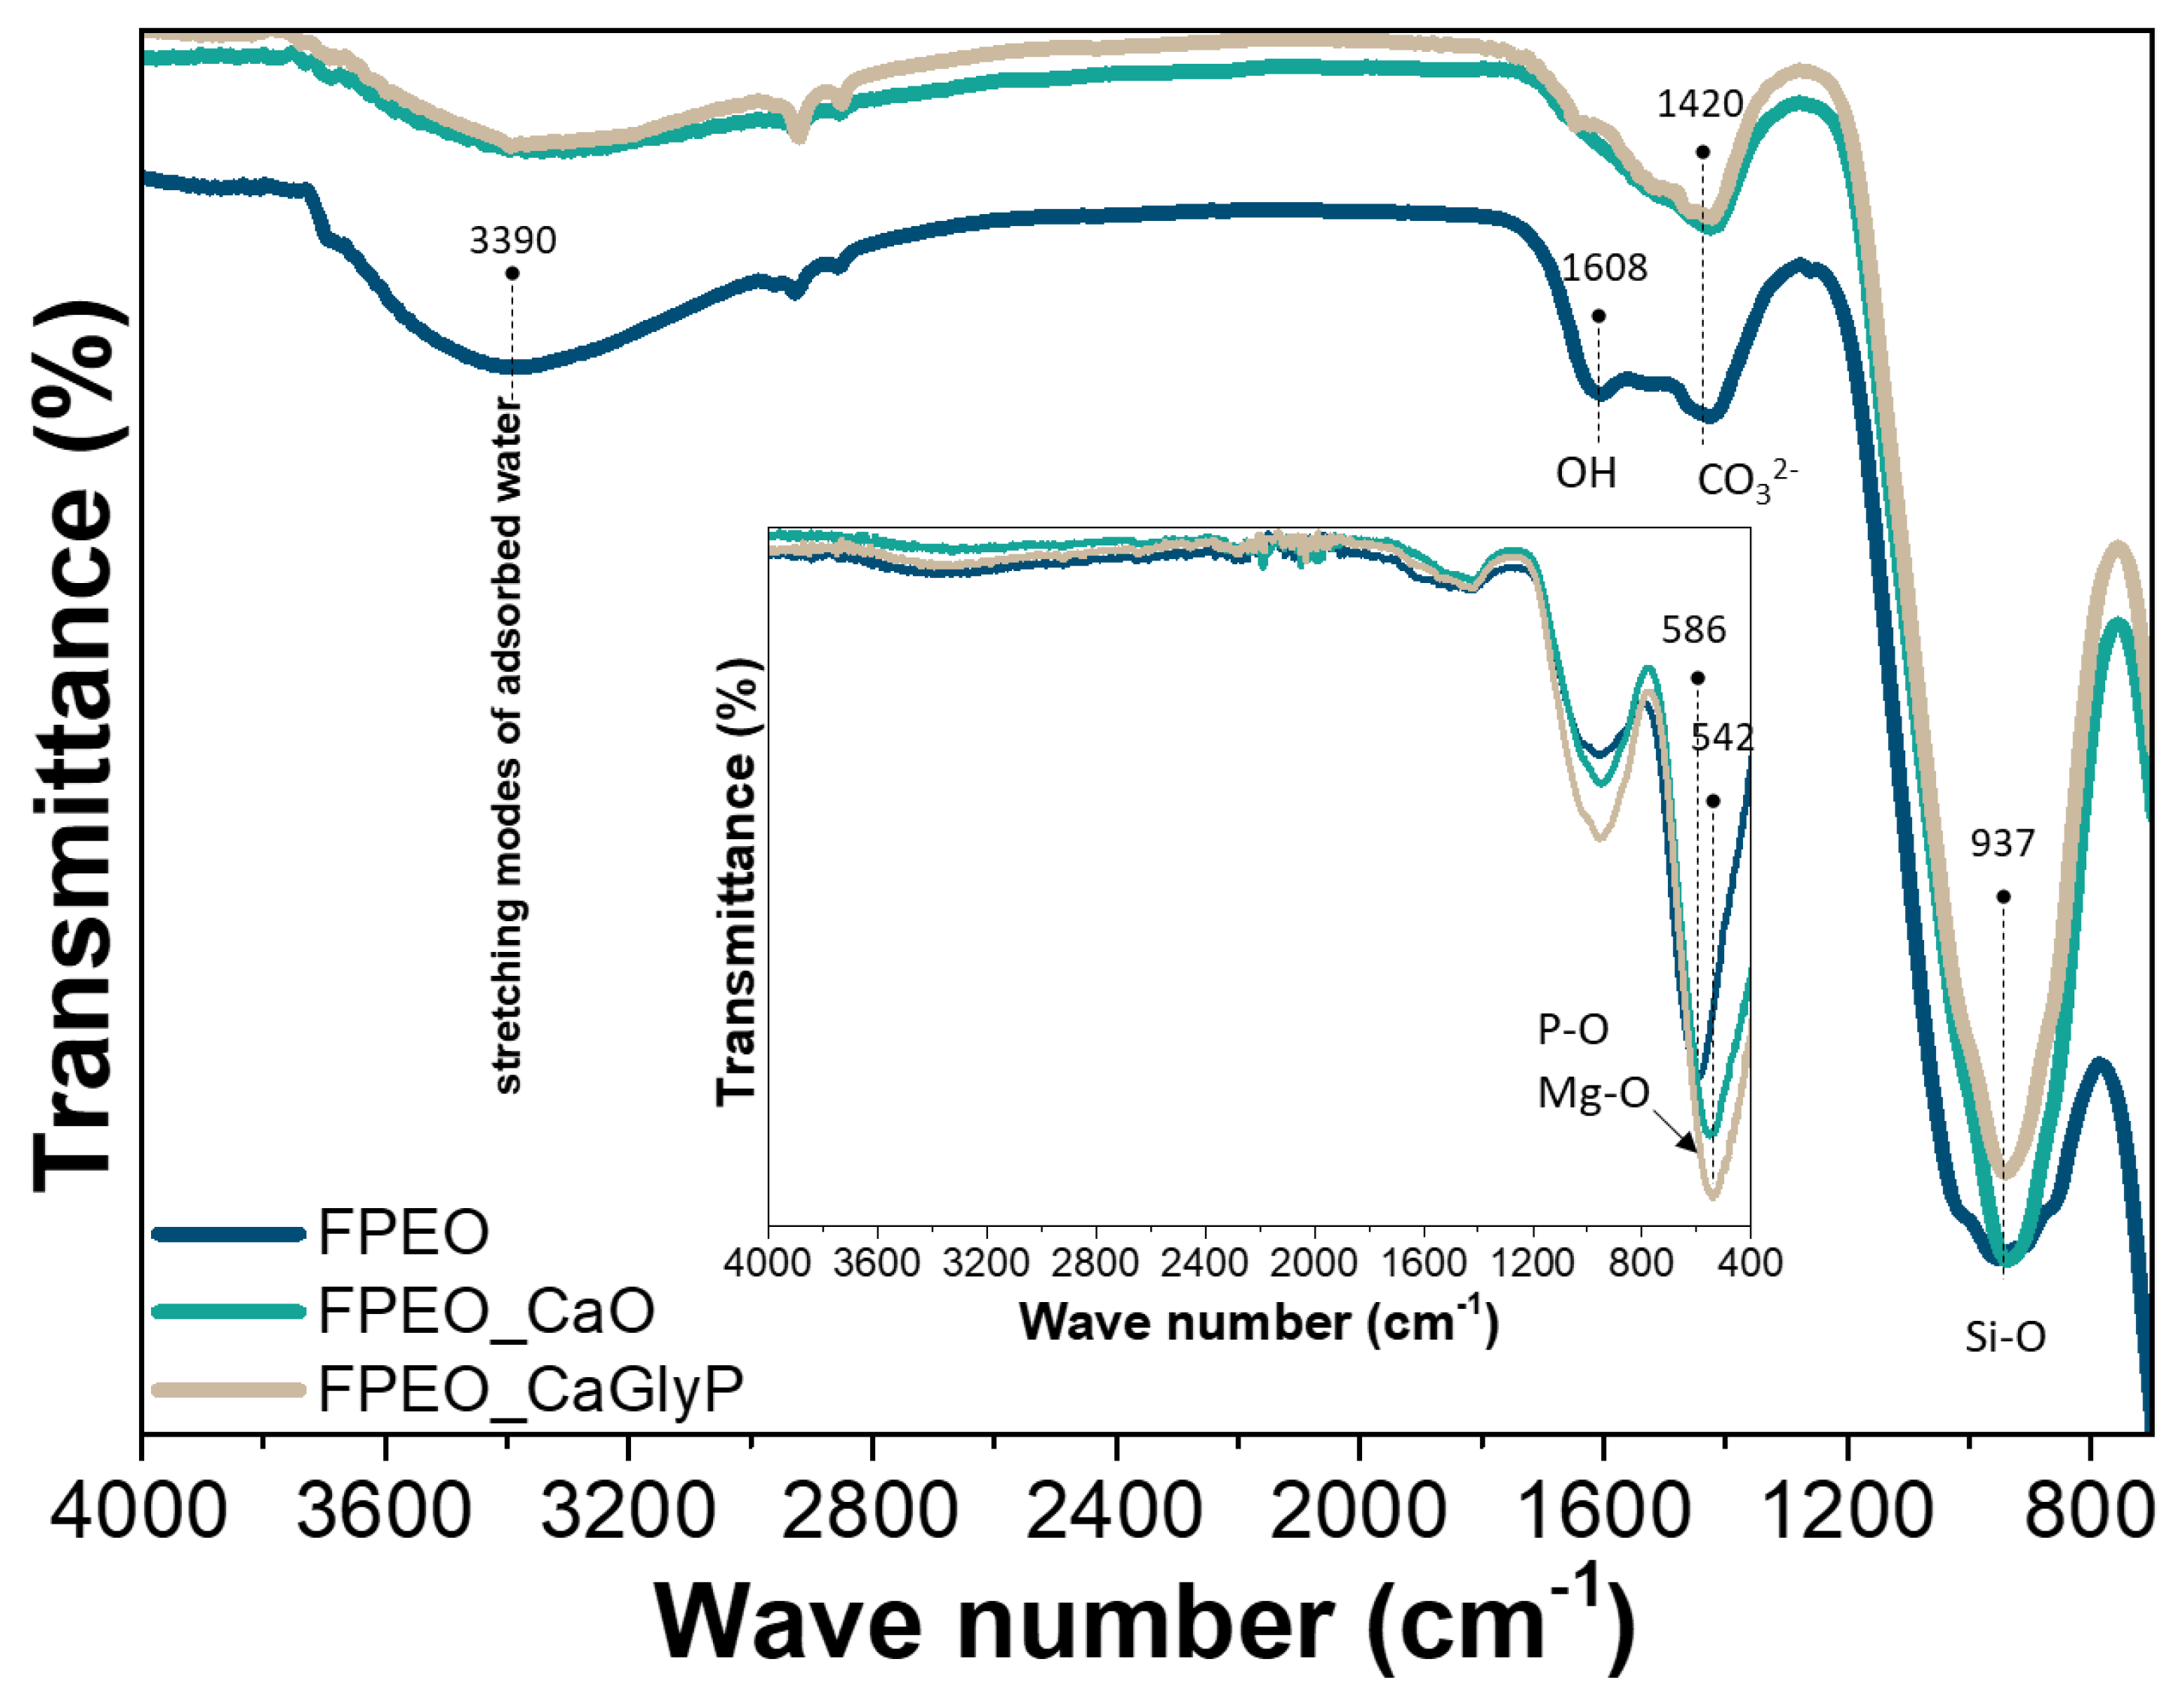
Complementary FTIR spectra (Figure 6) revealed a broad band at around a 937 cm−1 frequency corresponding to the stretching of Si–O–NBO bonds in Q1 and Q2 type terahedra (with three and two non-bridging oxygen atoms, respectively) of the silica depolymerized with dopant cations [47], which in the present case would be Mg2+ and Ca2+. The broad band at 3390 cm−1 and 1608 cm−1 correspond to the -OH groups, commonly reported in the PEO-coatings on Mg [48,49,50] and originating from adsorbed water, due to the hydrophilic nature of MgO. The peak at 586 cm−1 in the FPEO coating can be attributed to Mg-O stretching vibrations; notably, it is further shifted to lower wavenumbers in Ca-doped coatings, which is not uncommon for O–Mg–O bonds in silica-modified MgO coatings [49,51]. It is likely that the shift of this peak is the result of the overlapping of O–Mg–O and P–O bond vibrations, as PO43− antisymmetric bending is observed in the range of 570–600 cm−1 in crystalline MgO surroundings [52,53]. The weak peak at 1420 cm−1 can be associated with CO32−; it is well known that hydroxilated MgO reacts with CO2 from the atmosphere, forming magnesium hydroxyl carbonate [53,54].
3.3. Electrochemical Impedance Response
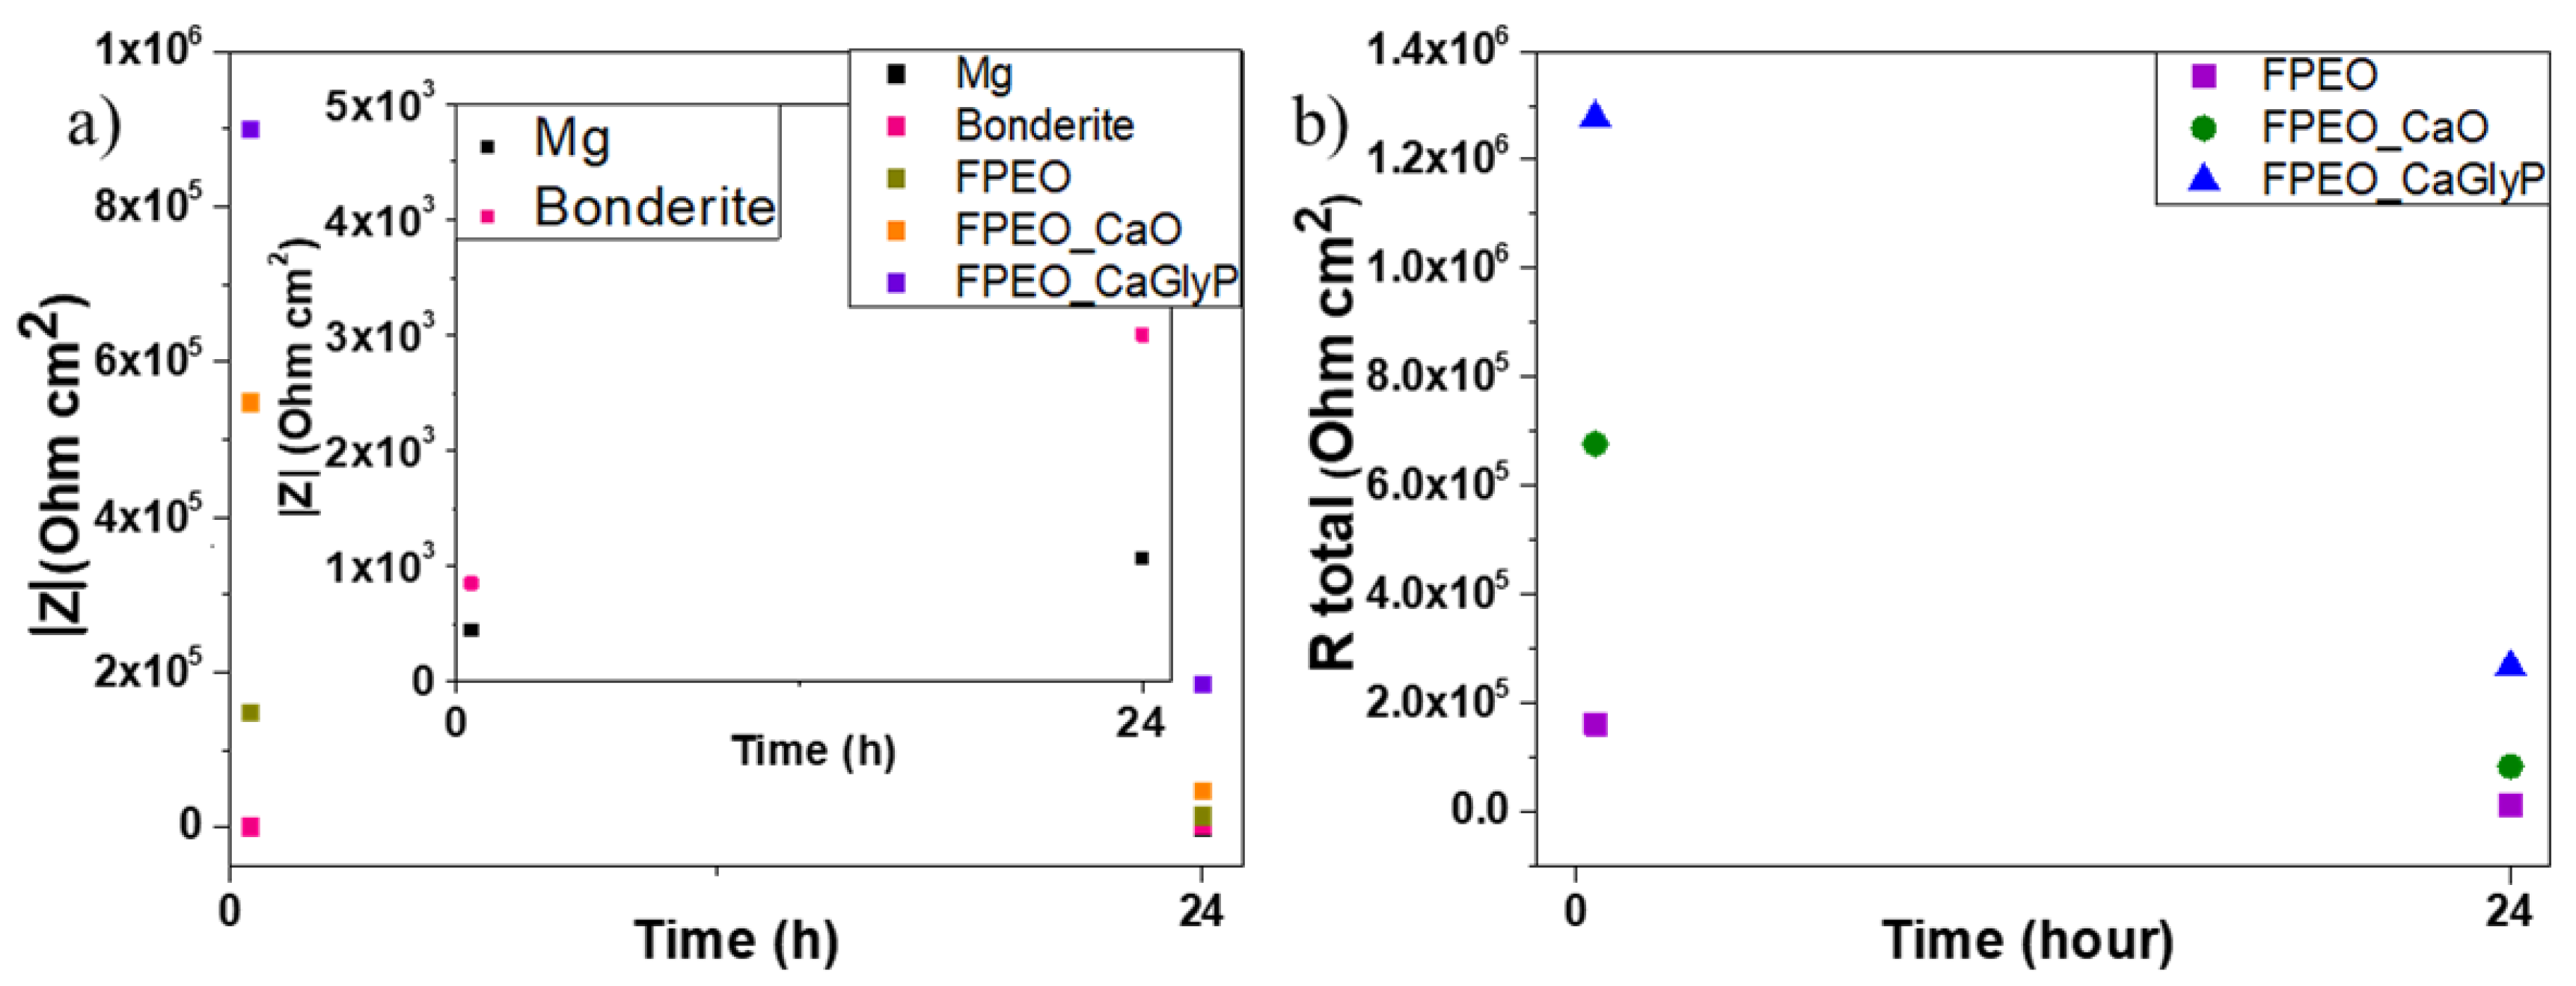
Figure 7a depicts the values of total impedance modulus at low frequencies (0.01 Hz) after 30 min and 24 h of immersion in a 0.5 wt.% NaCl aqueous solution. This type of analysis is well known to be a strong indicator of the general corrosion resistance of systems and for the studied materials, and the main observations can be summarized as follows:
- (i)
- PEO coatings enhance the corrosion performance of the bulk material for both immersion times showing higher values of the total impedance modulus up to two orders of magnitude for early immersion time.
- (ii)
- A considerable decrease in the impedance modulus is observed after 24 h of immersion for the coated specimens. This reduction of protective properties is associated with the penetration of the electrolyte through the cracks and pores of the oxide layer, leading to its chemical degradation.
- (iii)
- FPEO–CaGlyP coating reveals superior anticorrosion properties among the PEO coatings followed by FPEO–CaO and FPEO.
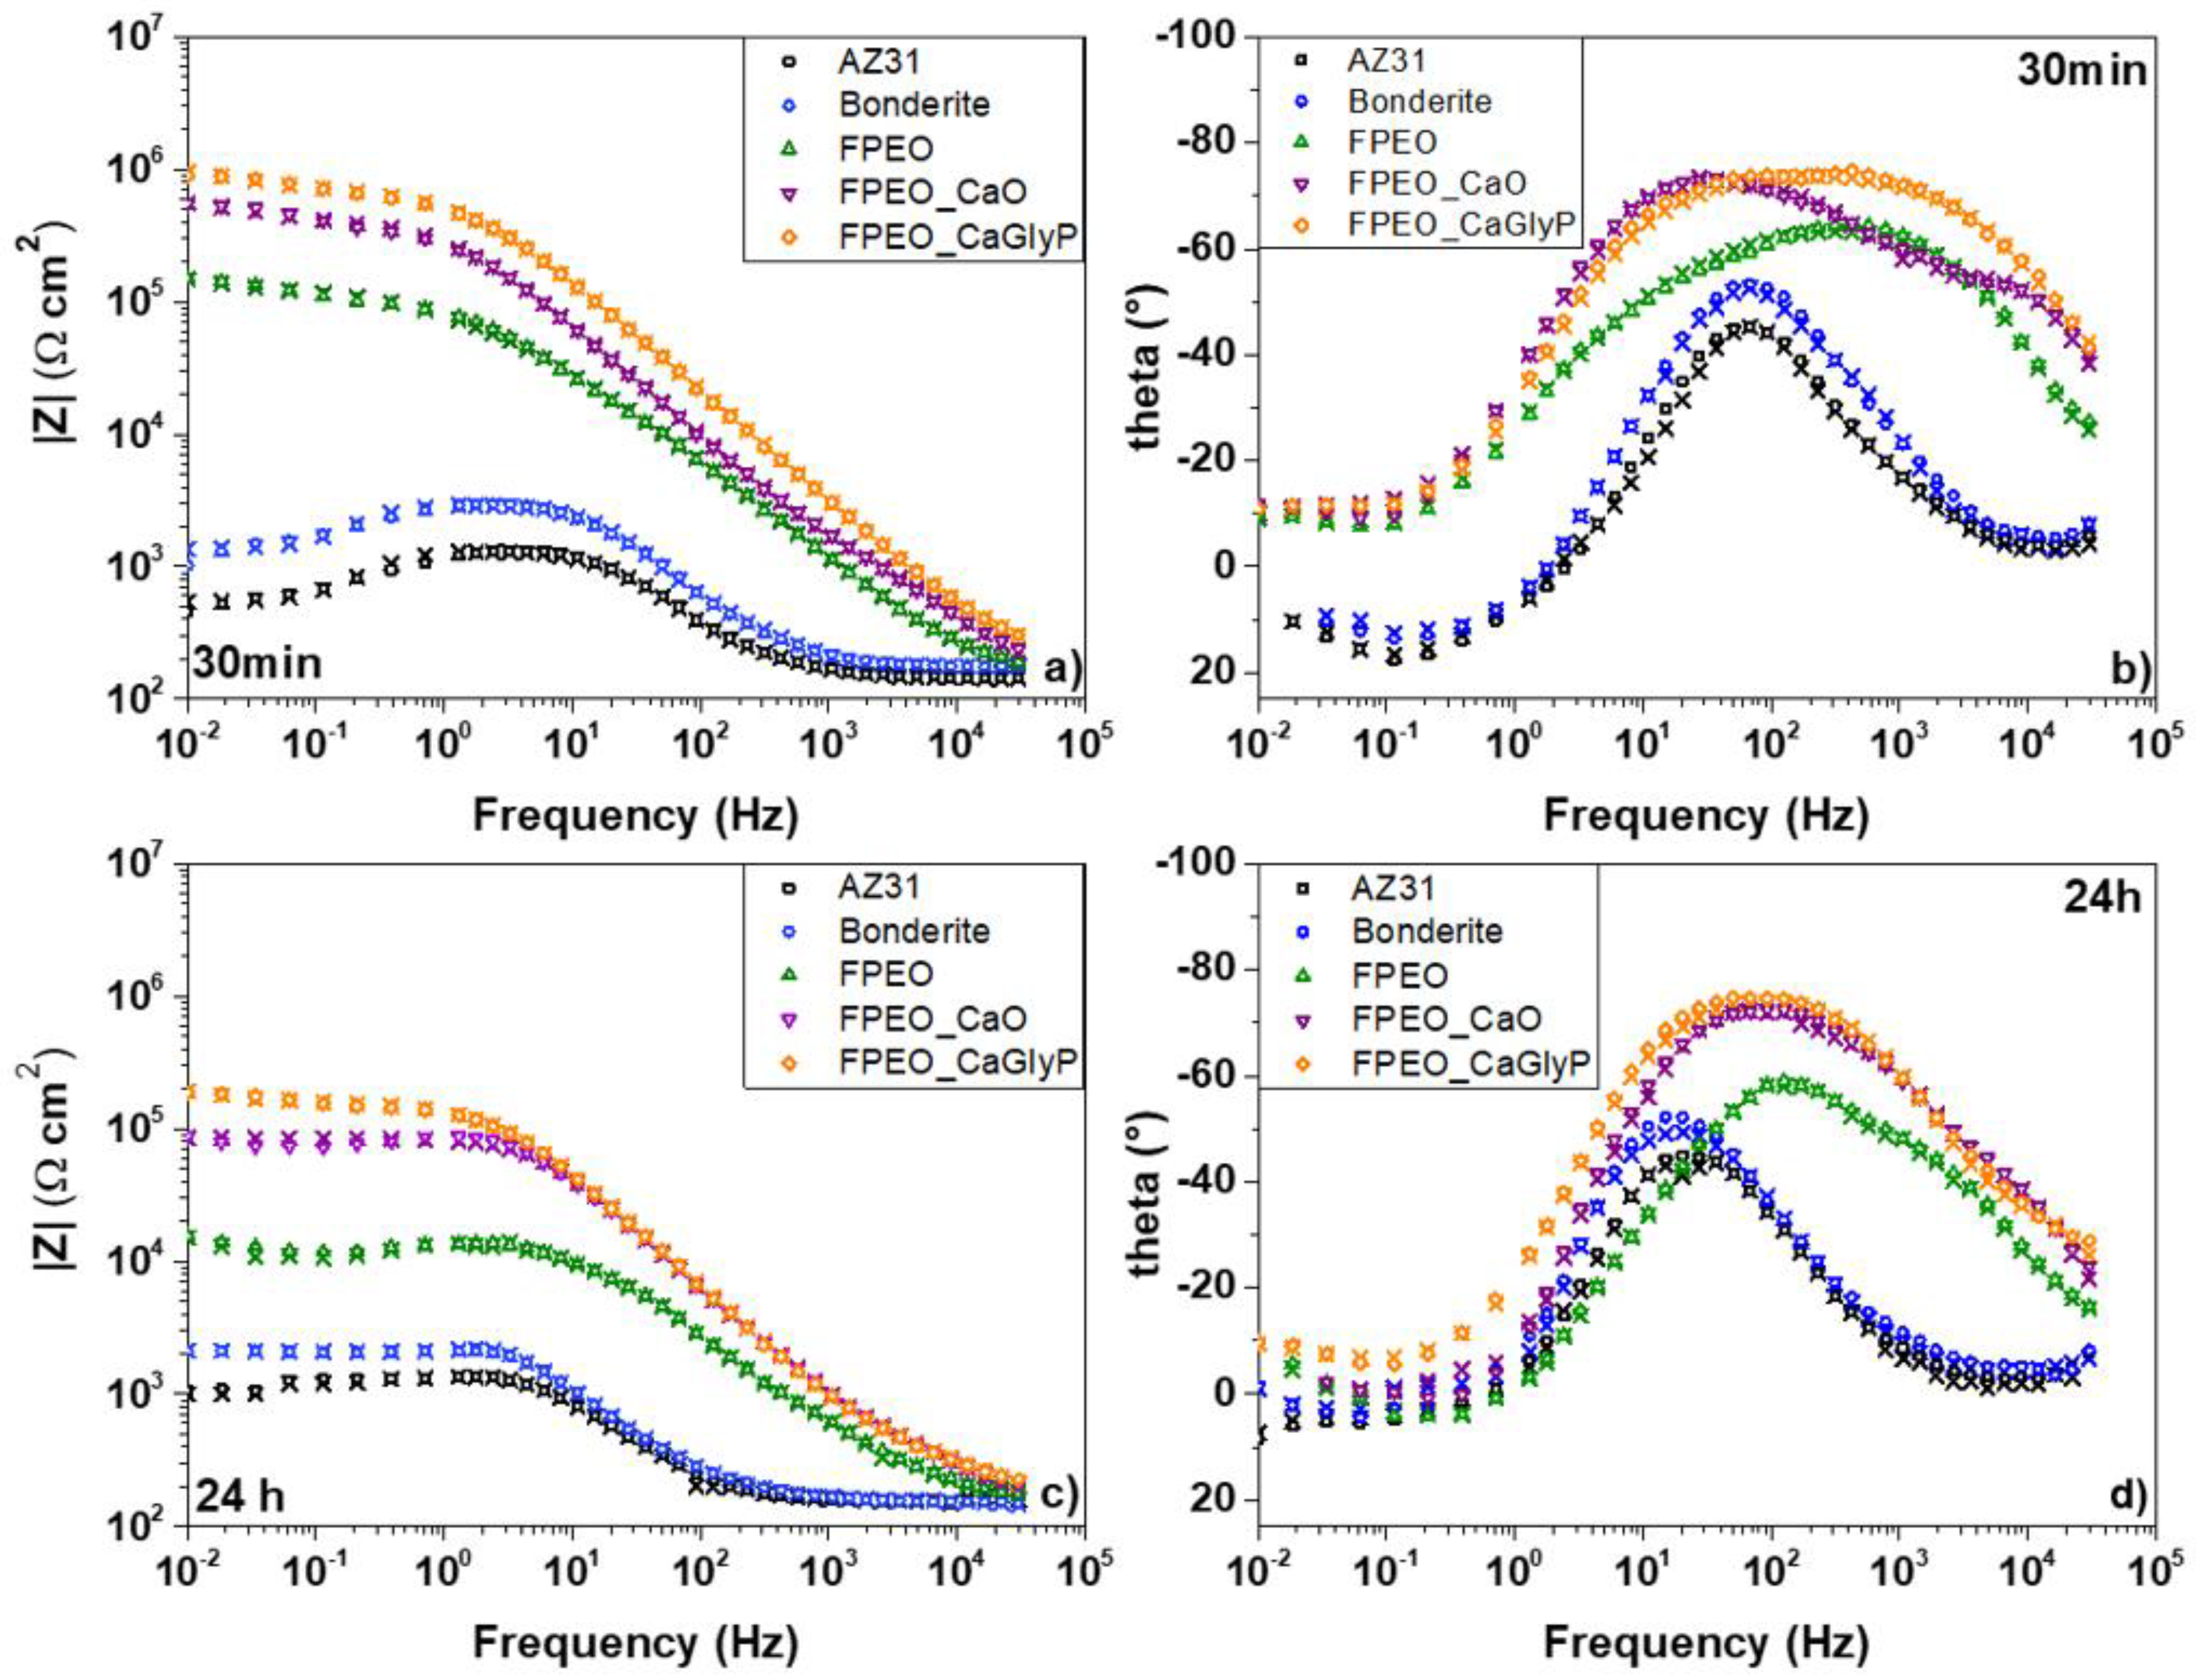
A more detailed evaluation of the corrosion properties involved the equivalent circuit analysis of the impedance spectra and their correlation with the physical phenomena occurring in the coatings and substrate. The frequency dependent impedance response of the bare and coated materials after 30 min and 24 h of immersion in a 0.5 wt.% aqueous solution of NaCl is presented in Figure 8.
At early stages of immersion, the bare substrate reveals three relaxation processes defined by two capacitive responses (positive phase shift angles in Bode diagrams) at high and medium frequencies and an inductive response (negative phase shift angles) in the low frequency range. The time constants at high and medium frequencies present strong overlapping. The capacitive behavior was ascribed to the charge transfer resistance and mass transport activities whereas the inductive response was related to the processes of adsorbed species [55].
After 24 h of immersion, there is a change in the impedance response of the bare material, mainly due to the formation of a corrosion product layer and the consequent variation of the free surface area (Figure 8b). Two relaxation processes associated with the presence of the corrosion products formed during immersion and the electrochemical activities in the substrate/electrolyte interface can be observed.
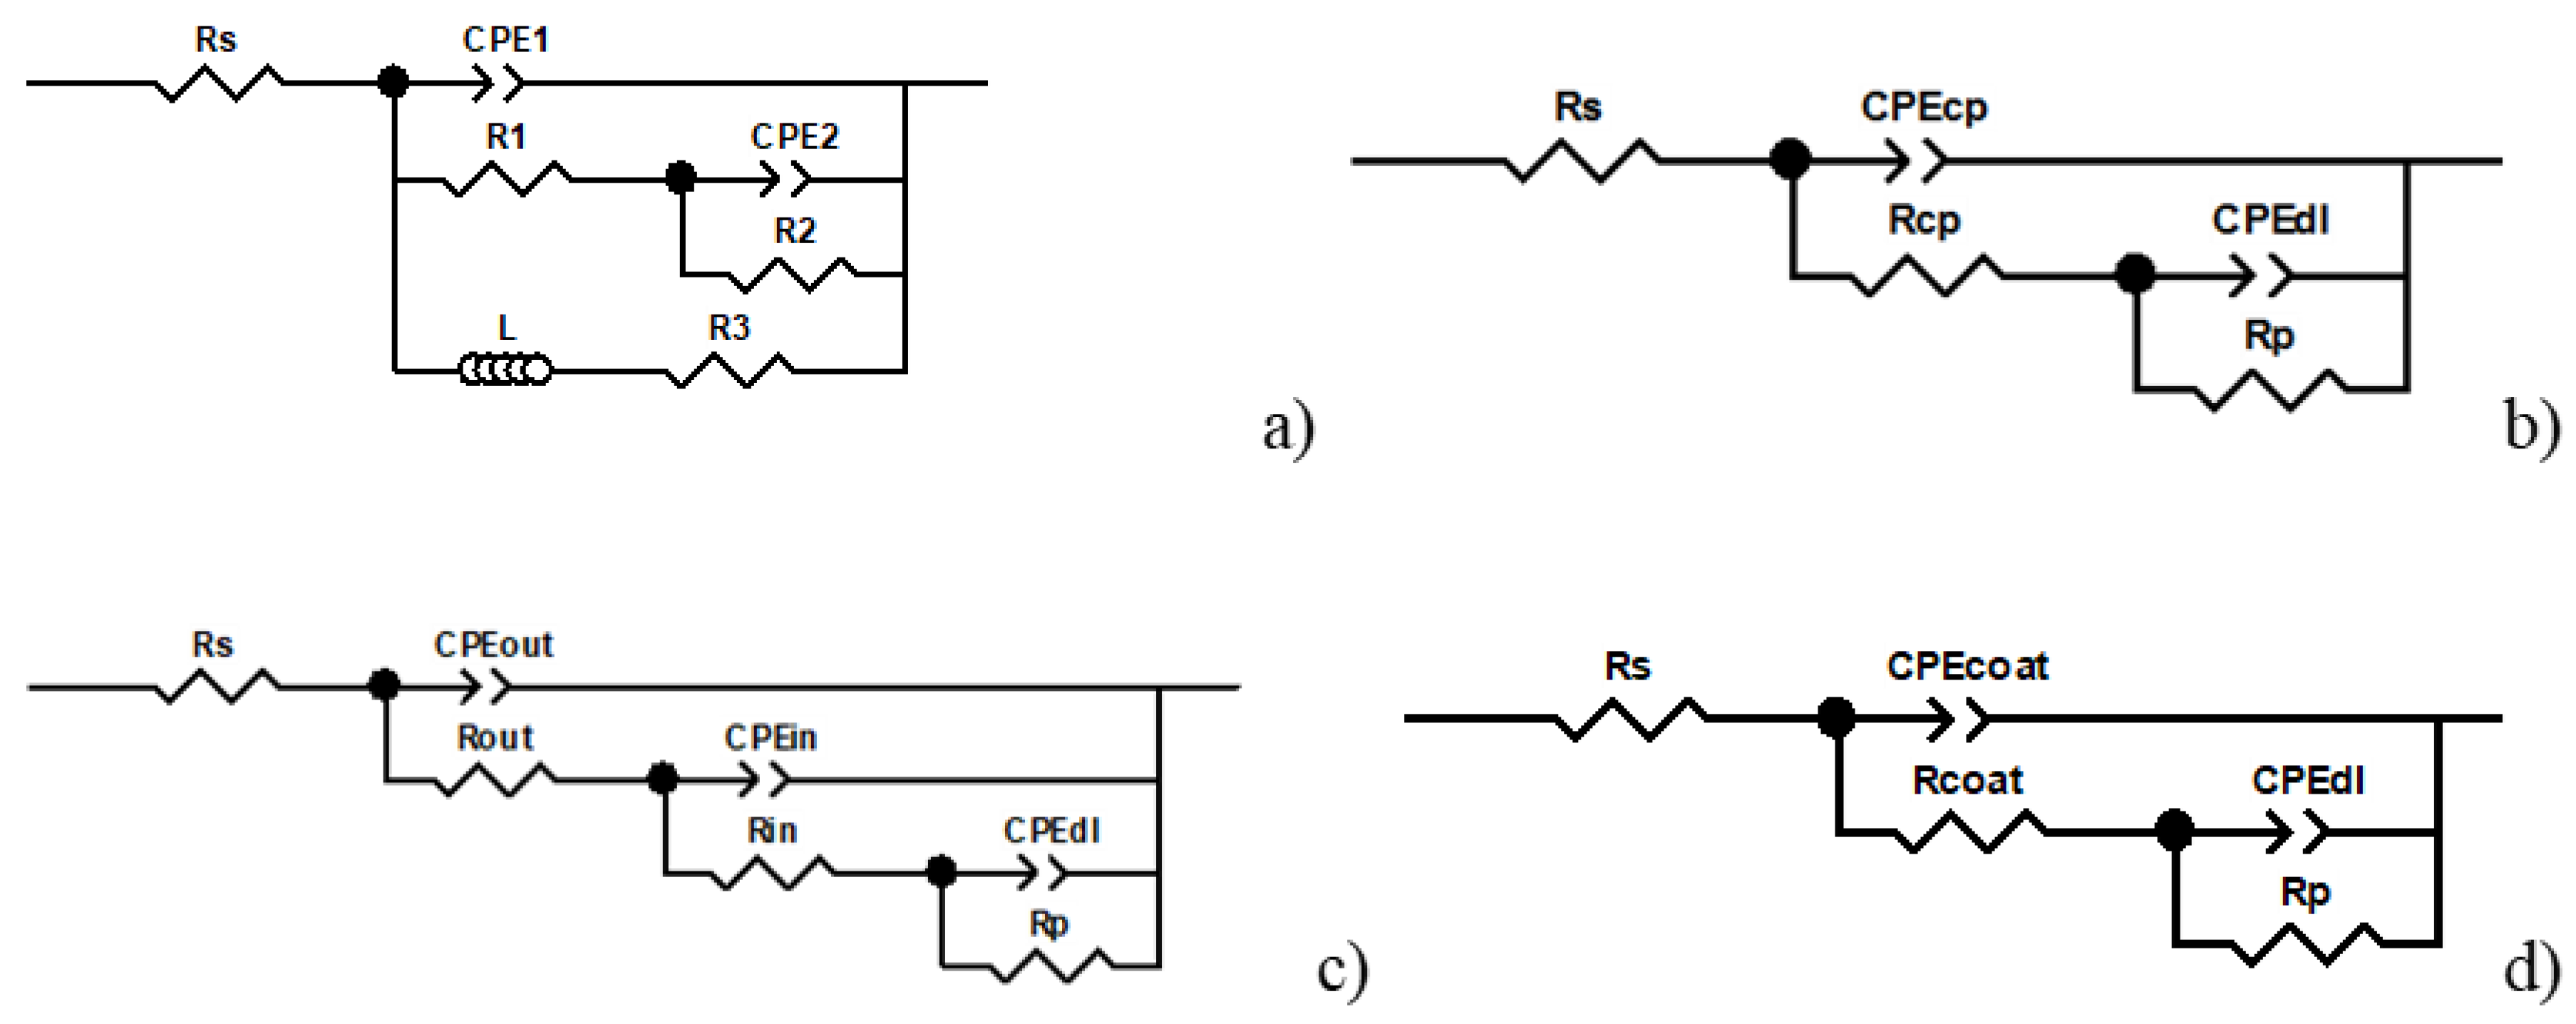
In order to take into account the different physical processes discussed above, two equivalent circuits were used to fit the experimental data, depending on the exposure time (Figure 9); their corresponding electrochemical parameters are presented in Table 5, Table 6, Table 7 and Table 8. In all the circuits, Rs accounts for the resistance of the electrolyte; constant phase elements (CPE) were used instead of capacitances in order to account for the non-ideal behavior of the system. Good fits of the experimental data were obtained with the chi-squared values in the range of 0.001–0.0001.
The corresponding elements of the equivalent electrical circuit at early immersion time are CPE1/R1 and CPE2/R2, associated with the capacitive and resistive behavior of the response at high and medium frequencies, respectively; L/R3 describe the inductive behavior at low frequencies. According to A.D. King et al. [56] the polarization resistance for this type of system can be estimated by equation (1):
The calculated Rp values are given in Table 5 and indicate the protective effect of Bonderite CC. For a longer immersion time, the fitted equivalent circuit shows the resistance and the capacitive behavior of the corrosion products formed on the alloy surface (Rcp/CPEcp) and the electrochemical activities in the substrate/electrolyte interface represented by the capacitance of the double layer and the polarization resistance (Rct/CPEp).
Specimens treated with Bonderite CC showed relaxation processes and their evolution was similar to those of bare substrate, indicating the lack of protection of the conversion layer. Therefore, the same equivalent circuits (Figure 9a,b) were used to fit the experimental data as the electrochemical response was mainly controlled by the substrate and corrosion products layer. A slight increase in the total impedance values after 24 h of immersion in Bonderite CC treatment and bare substrate are attributed to the protective effect of the corrosion product layer (Table 6), given that the Rp values with and without Bonderite CC became very close.
For the PEO-coated specimens, the relaxation processes observed at the early immersion time can be ascribed to the response of the outer porous part of the oxide layer at high frequencies, the contribution of the inner barrier at medium frequencies and the initiation of the electrochemical activities on the alloy surface at low frequencies, hence the three time constant equivalent circuit was used (Figure 9c). The corrosion processes can be described by the double layer capacitance on the electrolyte/metal interface and the polarization resistance. In fact, these two components are hard to distinguish at the early immersion stage because of the strong overlapping. The inner barrier layer dominates the response of the system in this situation, as can be seen from high Rin values (Table 7).
After 24 h of immersion, the time constant at high frequencies corresponding to the outer porous layer of the PEO coating has almost disappeared (Figure 8d). This indicates that the electrolyte can easily penetrate through the outer part of the PEO coating, and a chemical degradation of the coating (e.g., as result of species lixiviation and the hydration of the oxide) occurs to a certain degree, leading to the loss of the barrier properties of the outer layer. Since it became impossible to discriminate between the inner and outer coating part responses, a two time constant equivalent circuit was employed to fit the experimental data obtained after 24 h exposure time, where the general coating response was represented by the CPEcoat/Rcoat unit. (Figure 9d).
In order to evaluate the degradation behavior of the coated specimens, the changes in the total resistance (Rtotal = Rout + Rin + Rp) with immersion time are shown in Figure 7b. The FPEO_CaGlyP coating showed the best corrosion performance, followed by the FPEO_CaO and FPEO, and maintained this tendency with the immersion time. The improved resistance of Ca-doped coatings can be partly caused by their reduced pore size and pore population density (Table 3). Notably, the resistance of the FPEO_CaGlyP coating as a whole after 24 h immersion (Rcoat = 154 kΩ cm2) deteriorated considerably less (Rin + Rout = ~679 kΩ cm2 after 30 min of immersion), compared with the other two coatings whose resistance deteriorated by two orders of magnitude (Table 7 and Table 8).
3.4. NSST and Paint Adhesion Test
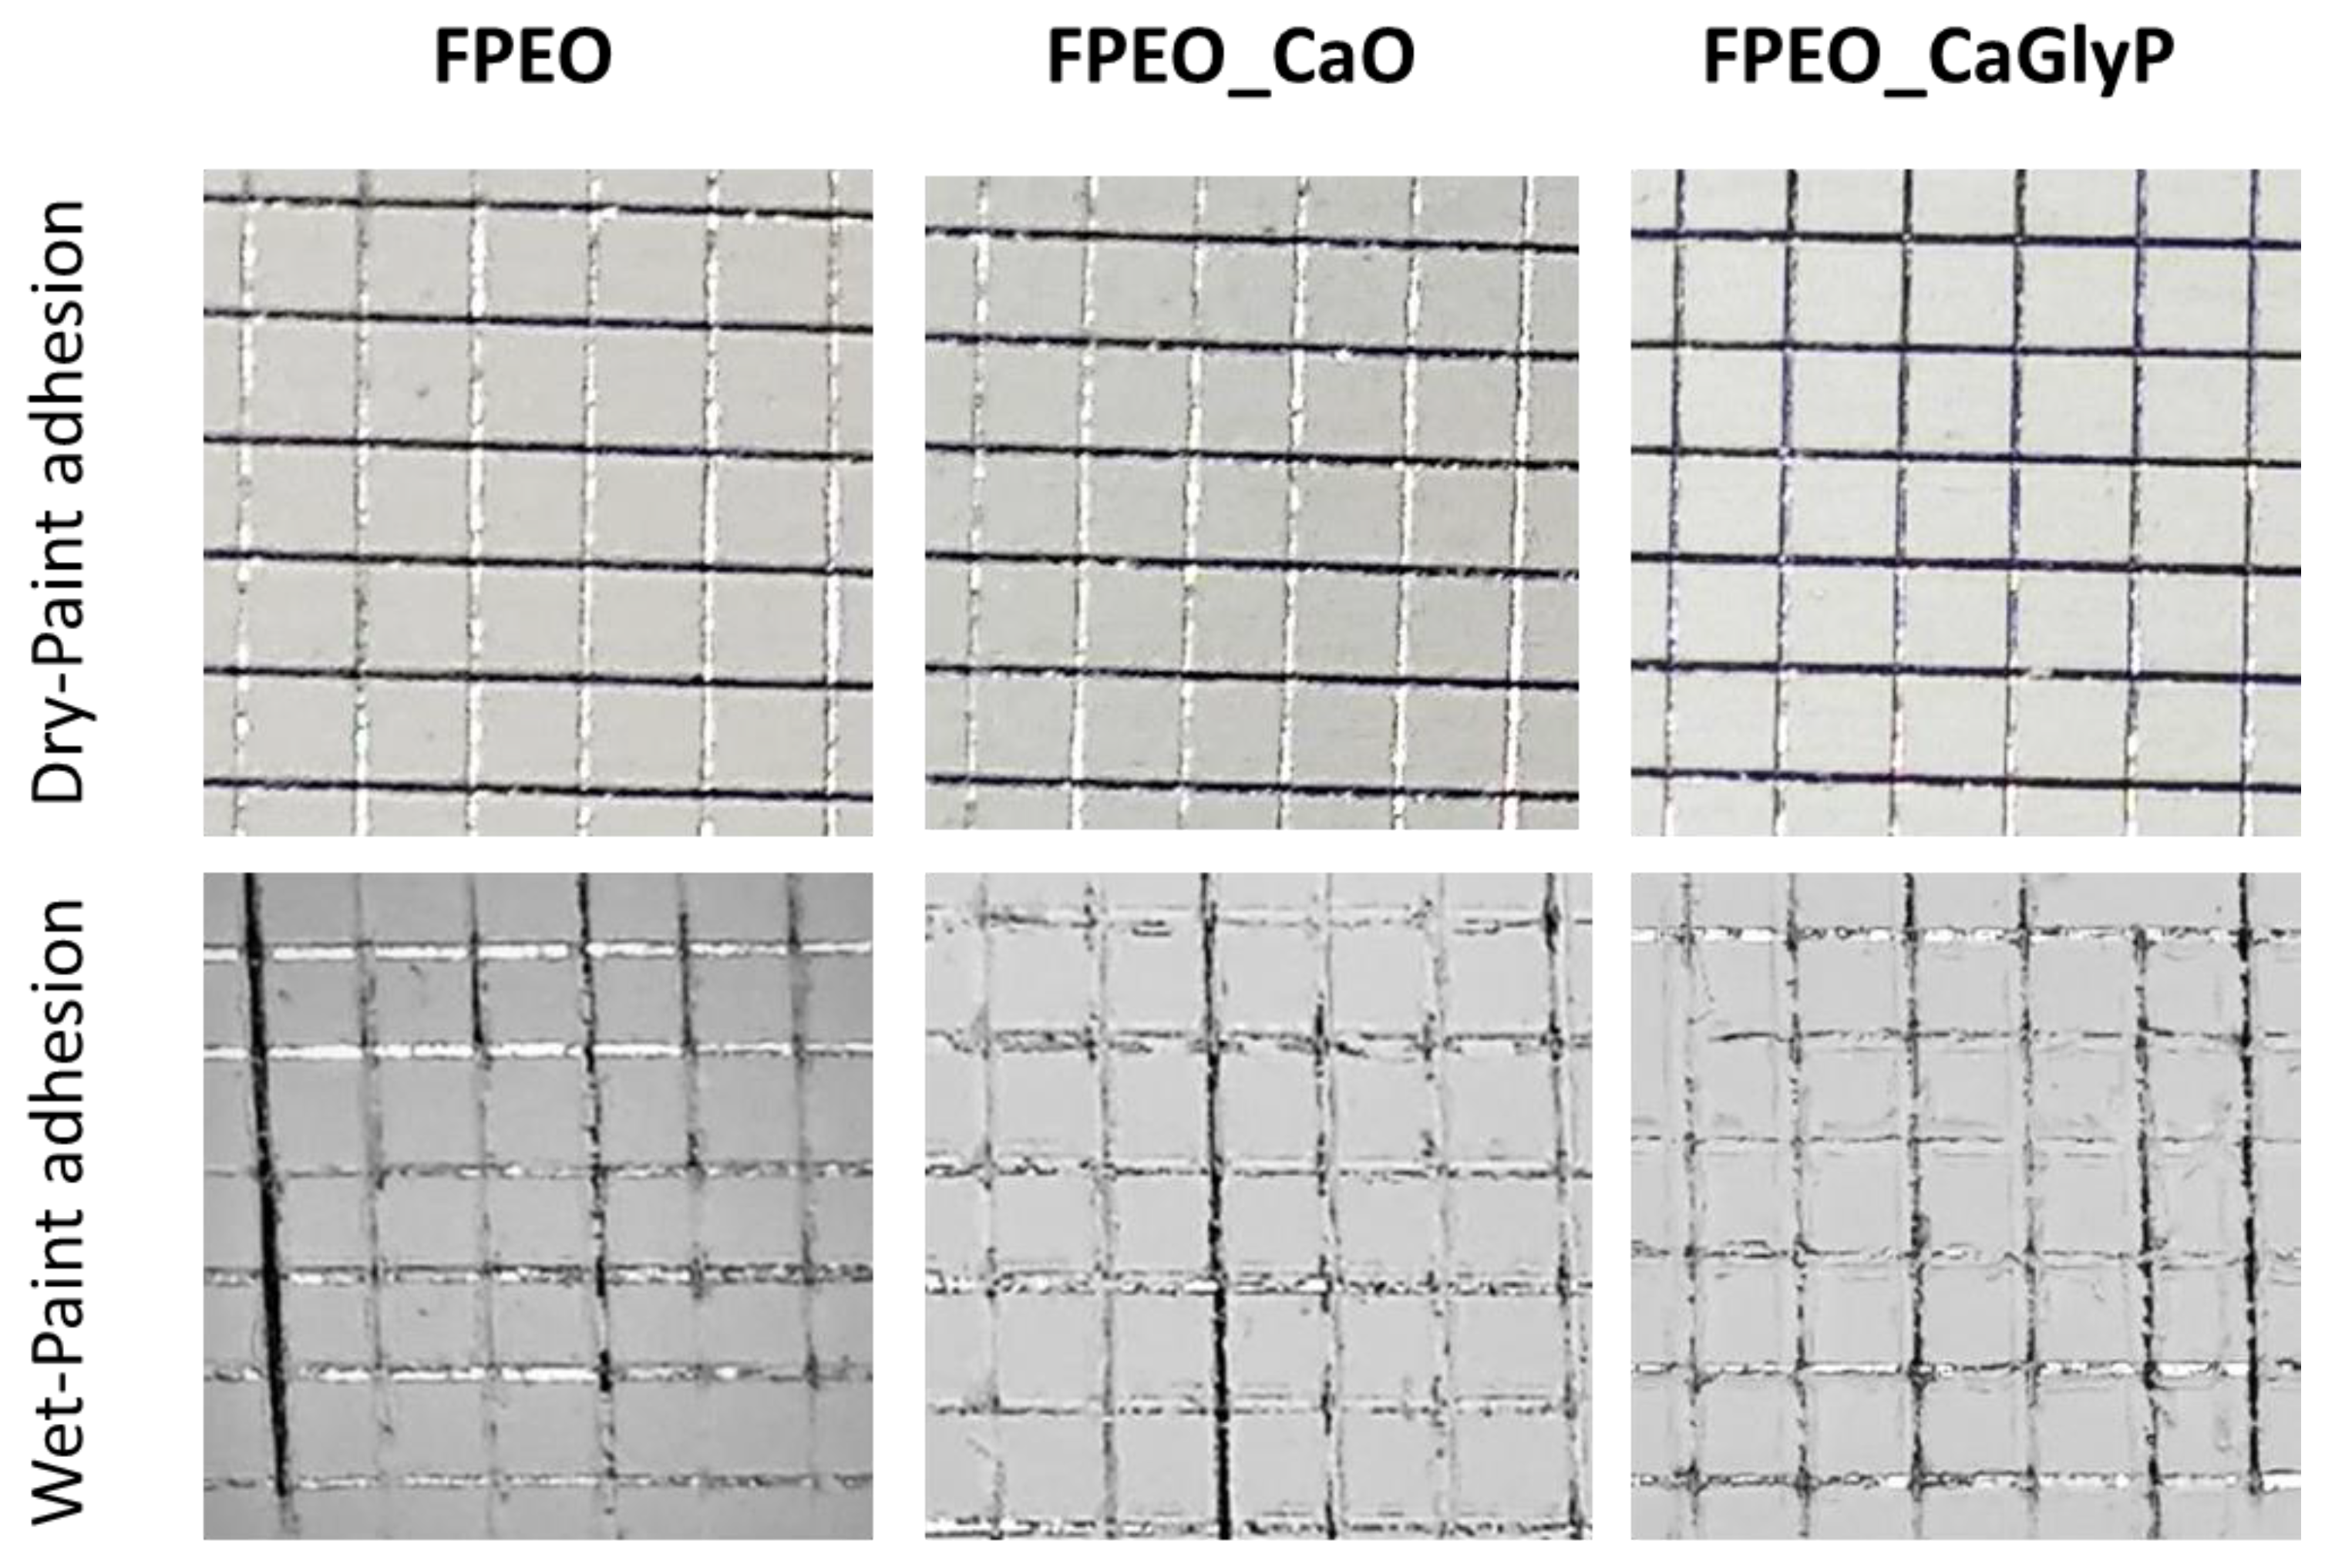
The results of the cross-cut paint adhesion test (Figure 10) on all three flash-PEO coatings corresponded to the rating 0 in accordance with EN ISO 2409 both in dry and wet testing conditions, as no paint pull-off occurred along the cross-cut lines. This is expected, since the inherent porosity of PEO coatings presents an excellent paint-absorbing base. Lower porosity and smaller pore size of Ca-doped coatings compared with base FPEO coating (Table 3) did not affect the paintability of the coatings.
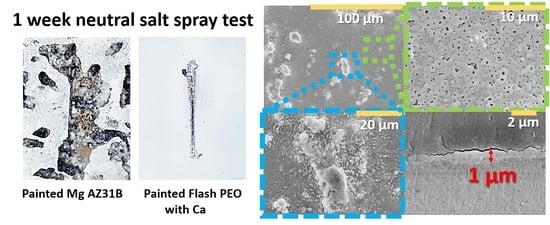
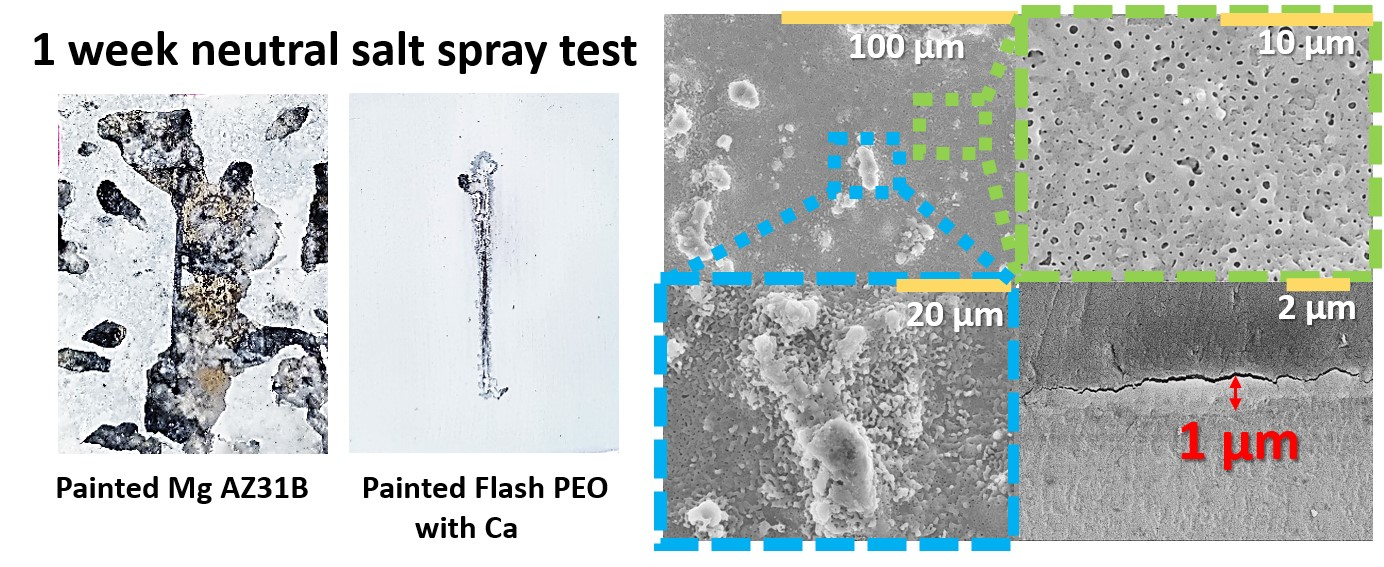
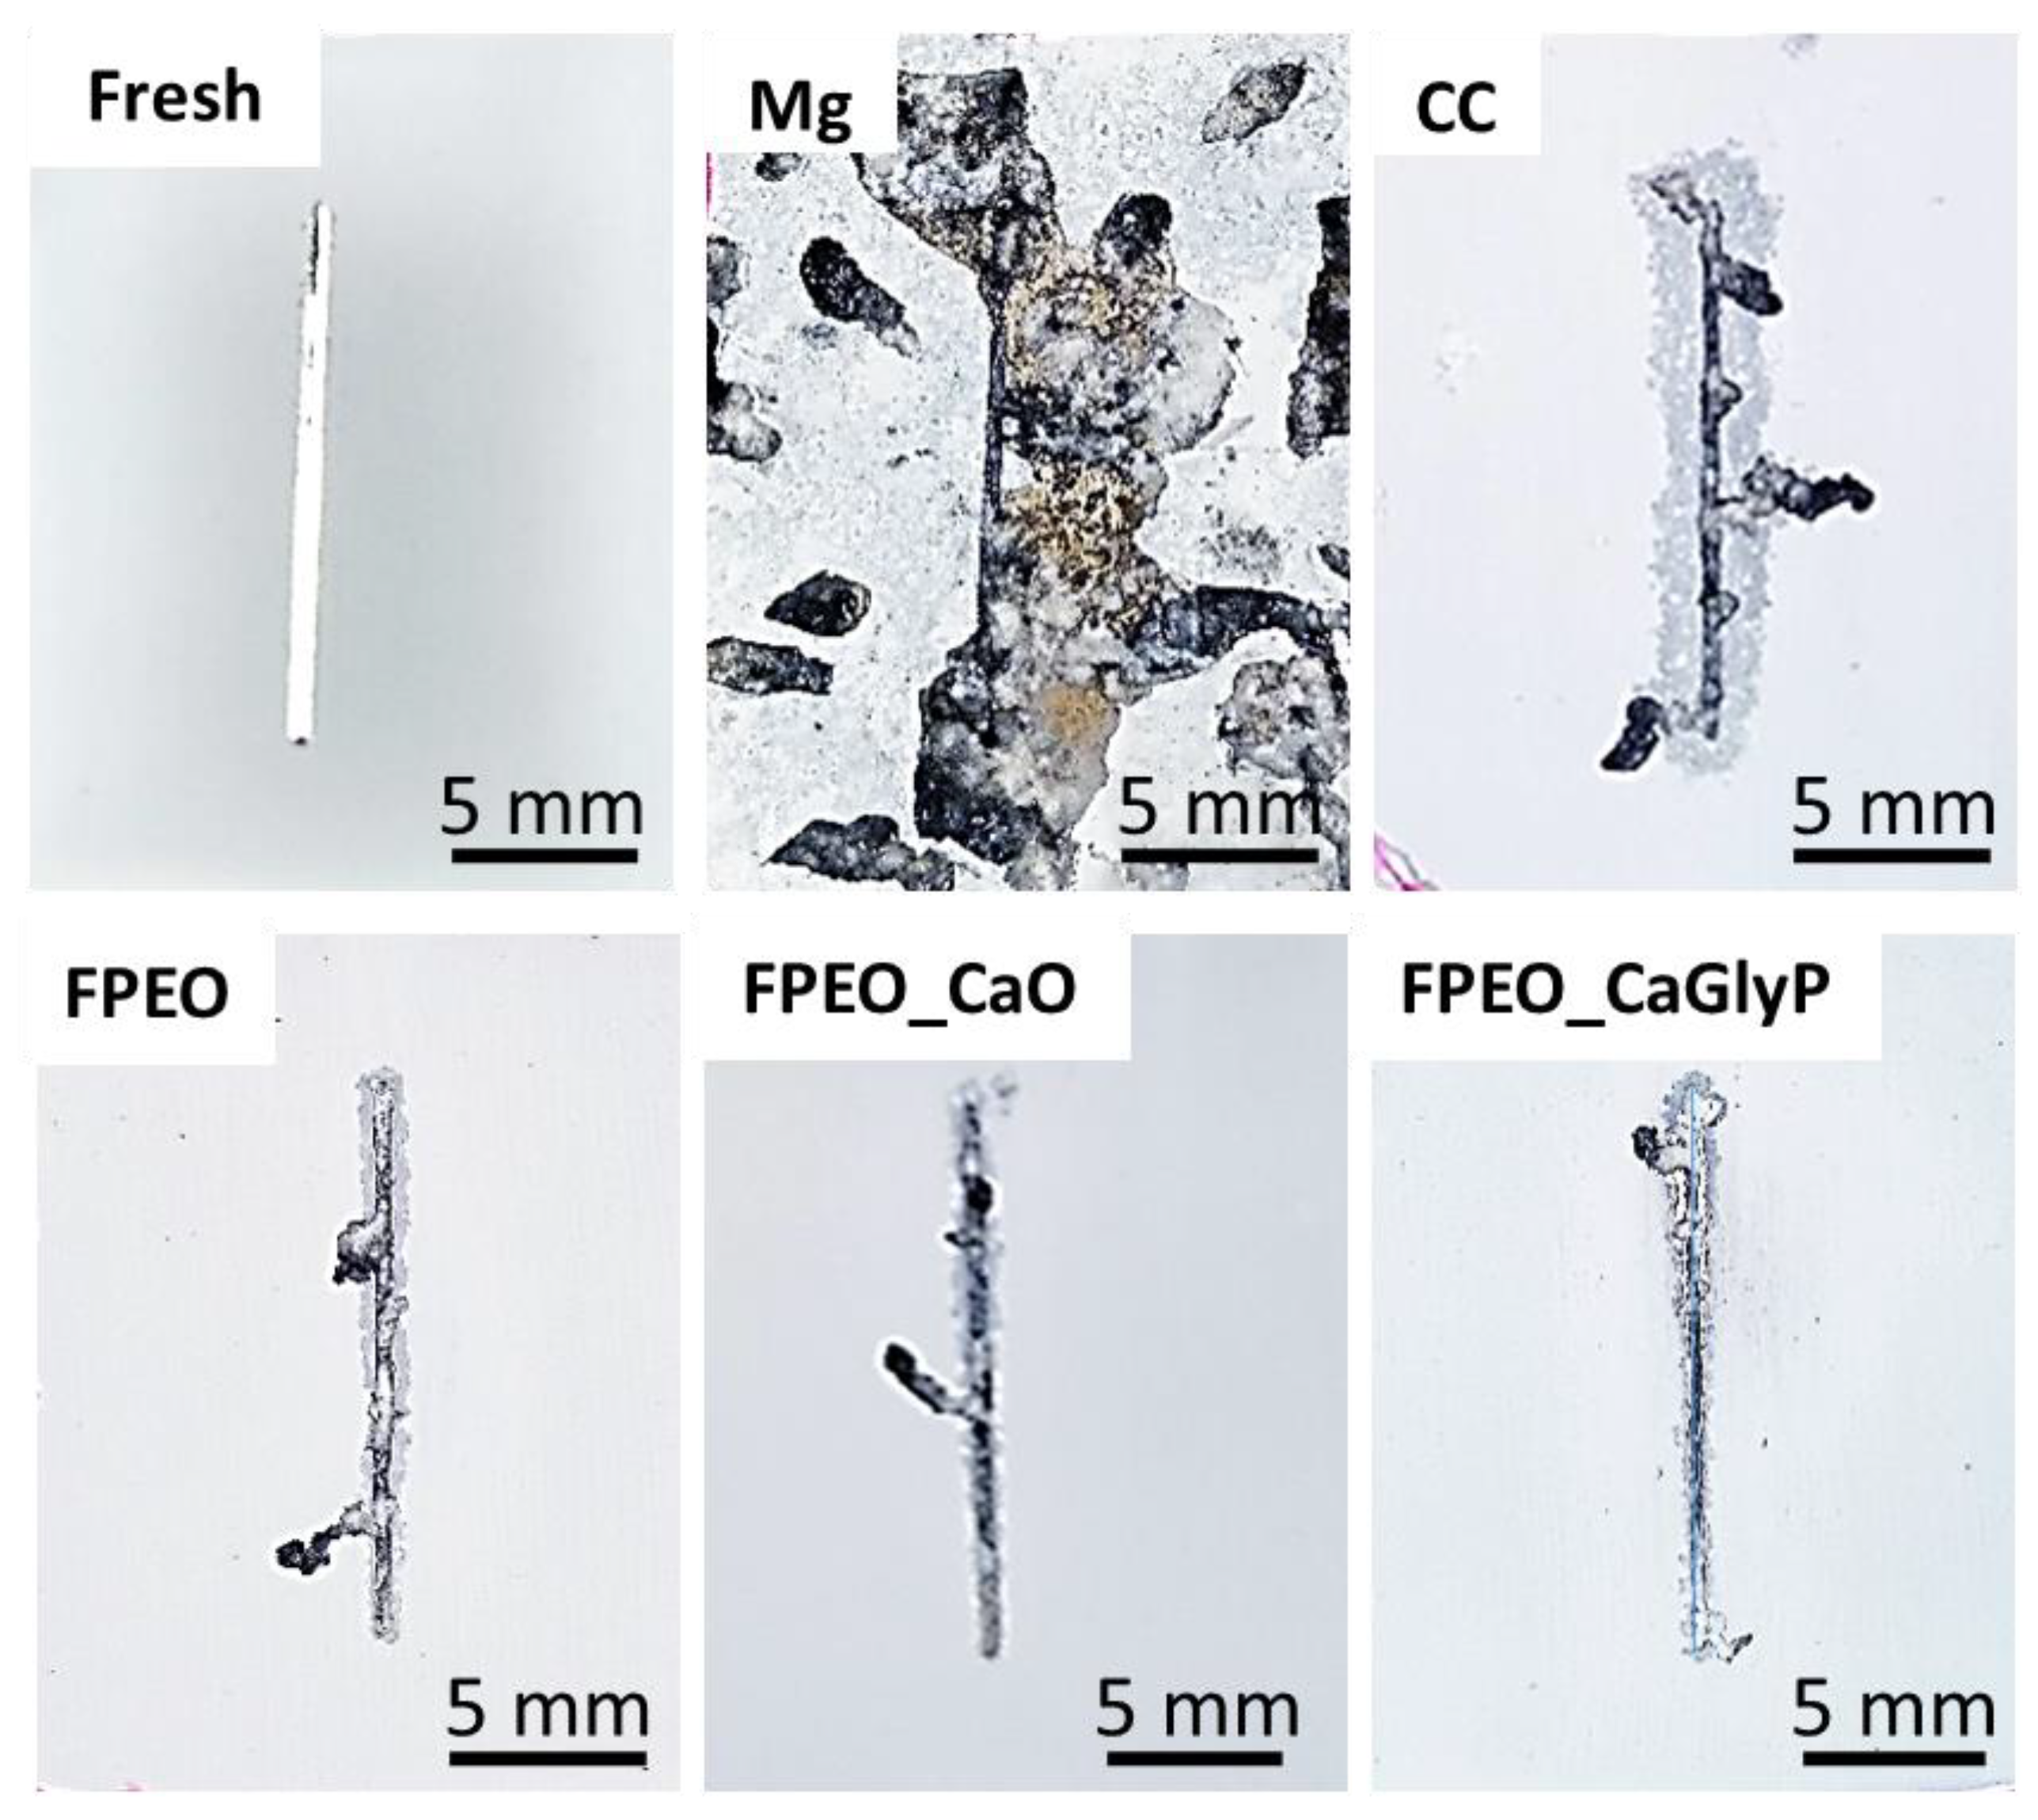
Macro-views of the corroded surface area of the painted and scribed specimens after NSST are shown in Figure 11, which also include an example of freshly scribed specimens before the exposure to salt fog. The related ratings of the creepage are summarized in Table 9.
All the coatings revealed a clear improvement in the corrosion resistance compared with the untreated Mg substrate, which was heavily corroded, not only around the original scratch, but on the whole surface. According to the ASTM D 1654 standard, the rating related to the length of filiform corrosion filament (i.e., creepage) formed from the original scratch ranked the materials in the following order: Mg substrate < CC < FPEO < FPEO_CaO < FPEO_CaGly. All the FPEO coatings suffered a smaller average corroded surface area and exhibited greater corrosion resistance than Bonderite CC (rating of 5). The FPEO–CaGlyP coating disclosed the highest rating of 7 (lowest creepage and corroded surface area) among the investigated flash-PEO coatings, which was in line with the EIS results.
These findings suggest that the presence of even a slight amount of Ca (0.1 at.%) in a flash-PEO coating may be beneficial for improvement in protective properties. However, the source of Ca appears to be an important point affecting the corrosion resistance. Ca species in CaGlyP-doped electrolyte are chelated to a greater extent and although, semi-quantitatively, Ca content was found to be the same in both Ca-doped coatings, Ca–O bonds were detected in the FPEO_CaGlyP but not in the FPEO_CaO coating, according to the Raman analysis (Figure 5). Likewise, the FPEO_CaGlyP coating exhibited a more pronounced band around 490 cm−1 and 570 cm−1, usually associated with PO43− phosphate in a hydroxyapatite. It is evident, therefore, that Ca species formed more bonds (in terms of their type and complexity) with SiO2 and PO43− species within the MgO ceramic network during their in situ incorporation from a double chelated electrolyte. That extended bonding network makes the hydrolysis of MgO and the hydration of the coating more difficult. Furthermore, the leaching of alkaline cations such as Ca during immersion modifies the SiO2 network, giving rise to hydrolysis and the formation of Si(OH)4 gel that seals the pores [51,57,58]. It is feasible that these phenomena may have led to the overall lesser resistance loss of FPEO_CaGlyP coating during immersion (Rcoat = 154 kΩ cm2) compared with the other two flash-PEO coatings.
4. Conclusions
- DC flash-PEO 1 µm-thick coatings were developed from dilute alkaline electrolytes without and with added Ca species stabilized in the solution with glycerophosphate and EDTA chelating agents.
- Chelating agents delayed the onset of plasma microdischarges and the attainment of the set limiting voltage, which reduced the coating porosity but did not significantly alter the coating thickness.
- The coating obtained from the electrolyte doped with Ca in a highly soluble form of CaGlyP disclosed one and two orders of magnitude improvement in corrosion protection over 24 h of immersion in 0.5 wt% NaCl compared with the coating generated from the CaO-doped and Ca-free electrolytes, respectively.
- All three flash-PEO coatings exhibited a rating of 0 in a cross-cut dry and wait paint adhesion test.
- Full system evaluation of the coatings in NSST for 7 days yielded ASTM D 1654 ratings 7 and 5 for FPEO_CaGlyP and commercial CC coatings, respectively.
- The enhanced corrosion resistance of FPEO–CaGlyP coating is attributed to the greater formation of covalent Si–O and P–O and ionic Ca–O bonds within the MgO ceramic network, which may have promoted the sealing of the flash-PEO coating pores with the hydrolysis products of SiO2.
Supplementary Materials
The following are available online at https://www.mdpi.com/2075-4701/10/7/916/s1, Figure S1: Secondary electron micrographs of surface morphologies of AZ31B substrate without (a) and with commercial CC (b).
Author Contributions
Data curation, E.W., B.P. and M.M.; formal analysis, E.W., B.P., M.M. and R.A.; funding acquisition, E.M.; investigation, E.W.; methodology, E.W.; project administration, R.A. and E.M.; supervision, E.M.; writing—original draft, E.W., B.P. and M.M.; writing—review and editing, R.A. and E.M. All authors have read and agreed to the published version of the manuscript.
Funding
This research was funded by European Commission: 755515, European Regional Development Fund: RTI2018-096391-B-C33, ADITIMAT-CM (S2018/NMT-4411) and Ministerio de Ciencia, Innovación y Universidades: RYC-2017-21843.
Acknowledgments
The authors gratefully acknowledge the support of the ALMAGIC project (H2020 Clean Sky 2, Grant agreement No 755515), RTI2018-096391-B-C33 (MCIU/AEI/FEDER, UE) and S2018/NMT-4411 (Regional Government of Madrid and EU Structural and Social Funds). M. Mohedano is grateful for the support of RYC-2017-21843 (MCIU).
Conflicts of Interest
The authors declare no conflict of interest.
References
- Makar, G.L.; Kruger, J. Corrosion of Magnesium. Int. Mater. Rev. 1993, 38, 138–153. [Google Scholar] [CrossRef]
- Arrabal, R.; Matykina, E.; Skeldon, P.; Thompson, G.E.; Pardo, A. Transport of Species during Plasma Electrolytic Oxidation of WE43-T6 Magnesium Alloy. J. Electrochem. Soc. 2008, 155, C101. [Google Scholar] [CrossRef]
- Zhang, G.; Wu, L.; Tang, A.; Ding, X.; Jiang, B.; Atrens, A.; Pan, F. Smart epoxy coating containing zeolites loaded with Ce on a plasma electrolytic oxidation coating on Mg alloy AZ31 for active corrosion protection. Prog. Org. Coat. 2019, 132, 144–147. [Google Scholar] [CrossRef]
- Zhang, G.; Wu, L.; Tang, A.; Ma, Y.; Song, G.; Zheng, D.; Jiang, B.; Atrens, A.; Pan, F. Active corrosion protection by a smart coating based on a MgAl-layered double hydroxide on a cerium-modified plasma electrolytic oxidation coating on Mg alloy AZ31. Corros. Sci. 2018, 139, 370–382. [Google Scholar] [CrossRef] [Green Version]
- Srinivasan, P.B.; Liang, J.; Blawert, C.; Stormer, M.; Dietzel, W. Characterization of calcium containing plasma electrolytic oxidation coatings on AM50 magnesium alloy. Appl. Surf. Sci. 2010, 256, 4017–4022. [Google Scholar] [CrossRef] [Green Version]
- Dou, J.; Zhao, Y.; Lu, L.; Gu, G.; Yu, H.; Chen, C. Effect of the Second-Step Voltages on the Structural and Corrosion Properties of Silicon-Calcium-Phosphate ( Si-CaP ) Coatings on Mg–Zn–Ca Alloy. R. Soc. Open Sci. 2018, 5, 172410. [Google Scholar] [CrossRef] [PubMed] [Green Version]
- Bordbar-Khiabani, A.; Ghanbari, A.; Yarmand, B.; Zamanian, A.; Mozafari, M. Improving corrosion behavior and in vitro bioactivity of plasma electrolytic oxidized AZ91 magnesium alloy using calcium fluoride containing electrolyte. Mater. Lett. 2018, 212, 98–102. [Google Scholar] [CrossRef]
- Tang, H.; Gao, Y. Preparation and characterization of hydroxyapatite containing coating on AZ31 magnesium alloy by micro-arc oxidation. J. Alloys Compd. 2016, 688, 699–708. [Google Scholar] [CrossRef]
- Chen, L.; Gu, Y.; Liu, L.; Liu, S.; Hou, B.; Liu, Q.; Ding, H. Effect of Ultrasonic Cold Forging Technology as the Pretreatment on the Corrosion Resistance of MAO Ca/P Coating on AZ31B Mg Alloy. J. Alloys Compd. 2015, 635, 278–288. [Google Scholar] [CrossRef]
- Pan, Y.K.; Chen, C.Z.; Wang, D.G.; Zhao, T.G. Colloids and Surfaces B: Biointerfaces Effects of Phosphates on Microstructure and Bioactivity of Micro-Arc Oxidized Calcium Phosphate Coatings on Mg–Zn–Zr Magnesium Alloy. Colloids Surf. B Biointerfaces 2013, 109, 1–9. [Google Scholar] [CrossRef]
- Gao, Y.; Yerokhin, A.; Parfenov, E.V.; Matthews, A. Application of Voltage Pulse Transient Analysis during Plasma Electrolytic Oxidation for Assessment of Characteristics and Corrosion Behaviour of Ca- and P-containing Coatings on Magnesium. Electrochimica. Acta 2014, 149, 218–230. [Google Scholar] [CrossRef]
- Yang, J.; Lu, X.; Blawert, C.; Di, S.; Zheludkevich, M.L. Microstructure and Corrosion Behavior of Ca/P Coatings Prepared on Magnesium by Plasma Electrolytic Oxidation. Surf. Coat. Technol. 2017, 319, 359–369. [Google Scholar] [CrossRef]
- Pan, Y.; Chen, C.; Wang, D.; Lin, Z. Preparation and bioactivity of micro-arc oxidized calcium phosphate coatings. Mater. Chem. Phys. 2013, 141, 842–849. [Google Scholar] [CrossRef]
- Pan, Y.K.; Chen, C.Z.; Wang, D.; Yu, X. Microstructure and biological properties of micro-arc oxidation coatings on ZK60 magnesium alloy. J. Biomed. Mater. Res. Part B Appl. Biomater. 2012, 100, 1574–1586. [Google Scholar] [CrossRef]
- Srinivasan, P.B.; Liang, J.; Blawert, C.; Stormer, M.; Dietzel, W. A preliminary study of calcium containing plasma electrolytic oxidation coatings on AM50 magnesium alloy. J. Mater. Sci. 2009, 45, 1406–1410. [Google Scholar] [CrossRef] [Green Version]
- Gao, Y.; Yerokhin, A.; Matthews, A. Effect of current mode on PEO treatment of magnesium in Ca- and P-containing electrolyte and resulting coatings. Appl. Surf. Sci. 2014, 316, 558–567. [Google Scholar] [CrossRef]
- Gnedenkov, S.V.; Gnedenkov, S.; Khrisanfova, O.A.; Zavidnaya, A.G.; Egorkin, V.; Puz’, A.V.; Sergienko, V.I. Formation of bioactive anticorrosion coatings on resorbable implants by plasma electrolytic oxidation. Prot. Met. Phys. Chem. Surf. 2013, 49, 874–879. [Google Scholar] [CrossRef]
- Kuo, M.; Yen, S. The process of electrochemical deposited hydroxyapatite coatings on biomedical titanium at room temperature. Mater. Sci. Eng. C 2002, 20, 153–160. [Google Scholar] [CrossRef]
- Zhang, C.; Zeng, R.; Liu, C.; Gao, J. Comparison of calcium phosphate coatings on Mg–Al and Mg–Ca alloys and their corrosion behavior in Hank’s solution. Surf. Coat. Technol. 2010, 204, 3636–3640. [Google Scholar] [CrossRef]
- Wen, C.; Guan, S.-K.; Peng, L.; Ren, C.; Wang, X.; Hu, Z. Characterization and degradation behavior of AZ31 alloy surface modified by bone-like hydroxyapatite for implant applications. Appl. Surf. Sci. 2009, 255, 6433–6438. [Google Scholar] [CrossRef]
- Goss, S.L.; Lemons, K.A.; Kerstetter, J.E.; Bogner, R.H. Determination of calcium salt solubility with changes in pH and PCO2, simulating varying gastrointestinal environments. J. Pharm. Pharmacol. 2007, 59, 1485–1492. [Google Scholar] [CrossRef] [PubMed]
- Zeng, R.; Zhang, F.; Lan, Z.; Cui, H.; Han, E. Corrosion Resistance of Calcium-Modified Zinc Phosphate Conversion Coatings on Magnesium—Aluminium Alloys. Corros. Sci. 2014, 88, 452–459. [Google Scholar] [CrossRef]
- Sreekanth, D.; Rameshbabu, N. Development and Characterization of MgO/Hydroxyapatite Composite Coating on AZ31 Magnesium Alloy by Plasma Electrolytic Oxidation Coupled with Electrophoretic Deposition. Mater. Lett. 2012, 68, 439–442. [Google Scholar] [CrossRef]
- Chang, L.; Tian, L.; Liu, W.; Duan, X. Corrosion Sc Ience Formation of Dicalcium Phosphate Dihydrate on Magnesium Alloy by Micro-Arc Oxidation Coupled with Hydrothermal Treatment. Corros. Sci. 2013, 72, 118–124. [Google Scholar] [CrossRef]
- Dorozhkin, S. Calcium orthophosphate coatings on magnesium and its biodegradable alloys. Acta Biomater. 2014, 10, 2919–2934. [Google Scholar] [CrossRef] [PubMed]
- Miller, L.B.; Witt, J.C. Solubility of Calcium Hydroxide. J. Phys. Chem. 1929, 33, 285–289. [Google Scholar] [CrossRef]
- Laleh, M.; Kargar, F.; Aghdam, A.S.R. Formation of a compact oxide layer on AZ91D magnesium alloy by microarc oxidation via addition of cerium chloride into the MAO electrolyte. J. Coat. Technol. Res. 2011, 8, 765–771. [Google Scholar] [CrossRef]
- Barchiche, C.-E.; Rocca, E.; Hazan, J. Corrosion behaviour of Sn-containing oxide layer on AZ91D alloy formed by plasma electrolytic oxidation. Surf. Coat. Technol. 2008, 202, 4145–4152. [Google Scholar] [CrossRef]
- Pezzato, L.; Brunelli, K.; Napolitani, E.; Magrini, M.; Dabalà, M. Surface properties of AZ91 magnesium alloy after PEO treatment using molybdate salts and low current densities. Appl. Surf. Sci. 2015, 357, 1031–1039. [Google Scholar] [CrossRef]
- Zhao, F.; Liao, A.-D.; Zhang, R.; Zhang, S.-F.; Wang, H.-X.; Shi, X.-M.; Li, M.-J.; He, X.-M. Effects of sodium tungstate on properties of micro-arc coatings on magnesium alloys. Trans. Nonferrous Met. Soc. China 2010, 20, s683–s687. [Google Scholar] [CrossRef]
- Cui, X.-J.; Liu, C.-H.; Yang, R.; Li, M.-T.; Lin, X.-Z. Self-sealing micro-arc oxidation coating on AZ91D Mg alloy and its formation mechanism. Surf. Coat. Technol. 2015, 269, 228–237. [Google Scholar] [CrossRef]
- Hwang, D.Y.; Cho, J.Y.; Lee, N.H.; Yoo, B.Y.; Shin, D.H. Plasma Electrolytic Oxidation of AZ91 Mg Alloy in the Sodium Stannate Electrolyte. Mater. Trans. 2008, 49, 1600–1605. [Google Scholar] [CrossRef] [Green Version]
- Ko, Y.; Namgung, S.; Shin, D.H. Correlation between KOH concentration and surface properties of AZ91 magnesium alloy coated by plasma electrolytic oxidation. Surf. Coat. Technol. 2010, 205, 2525–2531. [Google Scholar] [CrossRef]
- Ghasemi, A.; Raja, V.; Blawert, C.; Dietzel, W.; Kainer, K. The role of anions in the formation and corrosion resistance of the plasma electrolytic oxidation coatings. Surf. Coat. Technol. 2010, 204, 1469–1478. [Google Scholar] [CrossRef] [Green Version]
- Srinivasan, P.B.; Liang, J.; Balajeee, R.; Blawert, C.; Stormer, M.; Dietzel, W. Effect of pulse frequency on the microstructure, phase composition and corrosion performance of a phosphate-based plasma electrolytic oxidation coated AM50 magnesium alloy. Appl. Surf. Sci. 2010, 256, 3928–3935. [Google Scholar] [CrossRef] [Green Version]
- Clyne, T.; Troughton, S. A review of recent work on discharge characteristics during plasma electrolytic oxidation of various metals. Int. Mater. Rev. 2018, 64, 127–162. [Google Scholar] [CrossRef] [Green Version]
- Lu, X.; Sah, S.P.; Scharnagl, N.; Störmer, M.; Starykevich, M.; Mohedano, M.; Blawert, C.; Zheludkevich, M.L.; Kainer, K.U. Degradation behavior of PEO coating on AM50 magnesium alloy produced from electrolytes with clay particle addition. Surf. Coat. Technol. 2015, 269, 155–169. [Google Scholar] [CrossRef]
- Lee, S.; Ueda, K.; Narushima, T.; Nakano, T.; Kasuga, T. Preparation of orthophosphate glasses in the MgO–CaO–SiO2–Nb2O5–P2O5 system. Bio-Med. Mater. Eng. 2017, 28, 23–30. [Google Scholar] [CrossRef]
- Karakassides, M.; Saranti, A.; Koutselas, I. Preparation and structural study of binary phosphate glasses with high calcium and/or magnesium content. J. Non-Cryst. Solids 2004, 347, 69–79. [Google Scholar] [CrossRef]
- Lee, S.; Nakano, T.; Kasuga, T. Formation and Structural Analysis of 15MgO–15CaO–8P2O5–4SiO2 Glass. J. Non-Cryst. Solids 2017, 457, 73–76. [Google Scholar] [CrossRef]
- Cheng, J.-S.; Deng, W.; Wang, M. Structure of Na2O·MO·SiO2·CaF2 (M=Mg, Ca) oxyfluoride glasses. Phys. B Condens. Matter 2012, 407, 2778–2783. [Google Scholar] [CrossRef]
- Kirkpatrick, R.J.; Yarger, J.; McMillan, P.F.; Ping, Y.; Cong, X. Raman spectroscopy of C-S-H, tobermorite, and jennite. Adv. Cem. Based Mater. 1997, 5, 93–99. [Google Scholar] [CrossRef]
- Agathopoulos, S.; Tulyaganov, D.; Ventura, J.M.; Kannan, S.; Karakassides, M.; Ferreira, J.M.F. Formation of hydroxyapatite onto glasses of the CaO–MgO–SiO2 system with B2O3, Na2O, CaF2 and P2O5 additives. Biomaterials 2006, 27, 1832–1840. [Google Scholar] [CrossRef]
- De Aza, P.N.; Guitian, F.; Santos, C.; De Aza, S.; Cuscó, R.; Artús, L. Vibrational Properties of Calcium Phosphate Compounds. 2. Comparison between Hydroxyapatite and β-Tricalcium Phosphate. Chem. Mater. 1997, 9, 916–922. [Google Scholar] [CrossRef]
- Huelin, S.D.; Baker, H.R.; Merschrod, S.E.F.; Poduska, K.M. Phase-Selective Electroprecipitation of Calcium Phosphate Thin Films at Physiological Temperatures. Cryst. Growth Des. 2006, 6, 2634–2636. [Google Scholar] [CrossRef]
- Iqbal, Z.; Tomaselli, V.P.; Fahrenfeld, O.; Möller, K.D.; Ruszala, F.A.; Kostiner, E. Polarized Raman Scattering and Low Frequency Infrared Study of Hydroxyapatite. J. Phys. Chem. Solids 1977, 38, 923–927. [Google Scholar] [CrossRef]
- Agathopoulos, S.; Tulyaganov, D.; Ventura, J.; Kannan, S.; Saranti, A.; Karakassides, M.; Ferreira, J.M.F. Structural analysis and devitrification of glasses based on the CaO–MgO–SiO2 system with B2O3, Na2O, CaF2 and P2O5 additives. J. Non-Cryst. Solids 2006, 352, 322–328. [Google Scholar] [CrossRef]
- Yu, H.; Dong, Q.; Dou, J.; Pan, Y.; Chen, C.Z. Structure and in vitro bioactivity of ceramic coatings on magnesium alloys by microarc oxidation. Appl. Surf. Sci. 2016, 388, 114–119. [Google Scholar] [CrossRef]
- Gao, H.; Zhang, M.; Yang, X.; Huang, P.; Xu, K. Effect of Na 2 SiO 3 solution concentration of micro-arc oxidation process on lap-shear strength of adhesive-bonded magnesium alloys. Appl. Surf. Sci. 2014, 314, 447–452. [Google Scholar] [CrossRef]
- Cui, L.-Y.; Gao, S.-D.; Li, P.-P.; Zeng, R.; Zhang, F.; Zeng, R.-C.; Han, E.-H. Corrosion resistance of a self-healing micro-arc oxidation/polymethyltrimethoxysilane composite coating on magnesium alloy AZ31. Corros. Sci. 2017, 118, 84–95. [Google Scholar] [CrossRef]
- Li, M.; Liu, J.; Li, J.; Li, Y.; Lu, S.; Yuan, Y. The enhanced corrosion resistance of UMAO coatings on Mg by silane treatment. Prog. Nat. Sci. 2014, 24, 486–491. [Google Scholar] [CrossRef] [Green Version]
- Aguiar, H.; Solla, E.; Serra, J.; González, P.; León, B.; Almeida, N.; Cachinho, S.; Davim, E.; Correia, R.; Oliveira, J.; et al. Orthophosphate nanostructures in SiO2–P2O5–CaO–Na2O–MgO bioactive glasses. J. Non-Cryst. Solids 2008, 354, 4075–4080. [Google Scholar] [CrossRef]
- Bakhsheshi-Rad, H.; Hamzah, E.; Daroonparvar, M.; Yajid, M.; Medraj, M. Fabrication and corrosion behavior of Si/HA nano-composite coatings on biodegradable Mg–Zn–Mn–Ca alloy. Surf. Coat. Technol. 2014, 258, 1090–1099. [Google Scholar] [CrossRef]
- Arrabal, R.; Matykina, E.; Pardo, A.; Merino, M.C.; Paucar, K.; Mohedano, M.; Casajús, P. Corrosion behaviour of AZ91D and AM50 magnesium alloys with Nd and Gd additions in humid environments. Corros. Sci. 2012, 55, 351–362. [Google Scholar] [CrossRef]
- Baril, G.; Galicia, G.; Deslouis, C.; Pébère, N.; Tribollet, B.; Vivier, V. An Impedance Investigation of the Mechanism of Pure Magnesium Corrosion in Sodium Sulfate Solutions. J. Electrochem. Soc. 2007, 154, C108–C113. [Google Scholar] [CrossRef] [Green Version]
- King, A.; Birbilis, N.; Scully, J. Accurate Electrochemical Measurement of Magnesium Corrosion Rates; a Combined Impedance, Mass-Loss and Hydrogen Collection Study. Electrochim. Acta 2014, 121, 394–406. [Google Scholar] [CrossRef]
- Giju, K.T. Effect of coordinated water on the mechanism of neutral hydrolysis of silicon dioxide in gas phase: A first principles study. J. Mol. Struct. THEOCHEM 2002, 592, 53–60. [Google Scholar] [CrossRef]
- Bakhsheshi-Rad, H.R.; Hamzah, E.; Ismail, A.; Aziz, M.; Najafinezhad, A.; Daroonparvar, M. Synthesis and in-vitro performance of nanostructured monticellite coating on magnesium alloy for biomedical applications. J. Alloys Compd. 2019, 773, 180–193. [Google Scholar] [CrossRef]
Figure 1.
Voltage–time curves registered during the FPEO processes in the basic electrolyte and electrolytes doped with CaO or CaGlyP.
Figure 1.
Voltage–time curves registered during the FPEO processes in the basic electrolyte and electrolytes doped with CaO or CaGlyP.

Figure 2.
Secondary electron micrographs of the coating plan views (a,b,d,e,g,h) and the cross-sections (c,f,i): (a–c) FPEO; (d–f) FPEO_CaO; (g–i) FPEO_CaGlyP. (b,e,h) are the magnification of flat regions in (a,d,g), respectively.
Figure 2.
Secondary electron micrographs of the coating plan views (a,b,d,e,g,h) and the cross-sections (c,f,i): (a–c) FPEO; (d–f) FPEO_CaO; (g–i) FPEO_CaGlyP. (b,e,h) are the magnification of flat regions in (a,d,g), respectively.

Figure 3.
Optical profilometry micrographs and surface roughness parameters of the FPEO coatings, including the 3D-rendered images (a,c,e), 2D topographical maps (b,d,f) and the corresponding calculated surface parameters. Sa, Sz and S10z are the average height, maximum height and ten-point height of the selected area, respectively.

Figure 4.
Grazing angle XRD patterns of the FPEO coatings.

Figure 5.
Raman spectra of the flash-PEO coatings.

Figure 6.
ATR FTIR microscopy spectra and the ATR FTIR spectra (inset) of the flash-PEO coatings.

Figure 7.
Evolution of the total impedance at 10 mHz (a) and a total coating resistance with immersion time (b). Inset in (a) shows the zoom-in on the difference between the bare substrate and the commercial Bonderite CC.
Figure 7.
Evolution of the total impedance at 10 mHz (a) and a total coating resistance with immersion time (b). Inset in (a) shows the zoom-in on the difference between the bare substrate and the commercial Bonderite CC.

Figure 8.
Bode plots of the EIS spectra for non-painted materials following 30 min (a,b) and 24 h (c,d) immersion in 0.5% NaCl. Empty symbols correspond to the experimental data, cross symbols correspond to the fitting.
Figure 8.
Bode plots of the EIS spectra for non-painted materials following 30 min (a,b) and 24 h (c,d) immersion in 0.5% NaCl. Empty symbols correspond to the experimental data, cross symbols correspond to the fitting.

Figure 9.
Equivalent electrical circuits used for fitting the EIS spectra of the AZ31B substrate and the Bonderite CC (a,b) and of the FPEO coatings (c,d) after 30 min (a,c) and 24 h (b,d) of immersion in 0.5 wt.% NaCl.
Figure 9.
Equivalent electrical circuits used for fitting the EIS spectra of the AZ31B substrate and the Bonderite CC (a,b) and of the FPEO coatings (c,d) after 30 min (a,c) and 24 h (b,d) of immersion in 0.5 wt.% NaCl.

Figure 10.
Cross-cut dry and wet paint adhesion test results on the flash-PEO coatings.

Figure 11.
Macrographs of the scribed area of the painted specimens before (“Fresh”) and after 7 days of NSST, showing the creepage extent.
Figure 11.
Macrographs of the scribed area of the painted specimens before (“Fresh”) and after 7 days of NSST, showing the creepage extent.


Table 1.
Plasma electrolytic oxidation (PEO) treatment conditions for the Mg alloys and the properties of the resulted coatings obtained from Ca-containing electrolytes.
Table 1.
Plasma electrolytic oxidation (PEO) treatment conditions for the Mg alloys and the properties of the resulted coatings obtained from Ca-containing electrolytes.
| Nº | Alloy/Source of Ca in Electrolyte | PEO Parameters | Coating Composition | Substrate/ Coating Thickness (µm) | Corrosion Data | Ref. | |
|---|---|---|---|---|---|---|---|
| Ecorr (V) | icorr (A/cm2) | ||||||
| 1 | AM50 | 30 mA/cm2, pulse on: 2 ms, off: 18 ms, Vmax 485 V, 15 min | MgO, Mg3(PO4)2, CaH(PO4)2, CaO2 | 0 | −1.452 | 1.8 × 10⁻⁵ | [5] |
| Ca(OH)2 | 18–23 | −1.52 | 2.3 × 10⁻⁷ | ||||
| 35–44 | −1.505 | 3.5 × 10⁻⁸ | |||||
| 57–69 | −1.495 | 5.2 × 10⁻⁸ | |||||
| 2 | Mg + Zn 1.74, Ca 0.55 wt %x 1st step: Ca-free 2nd step: (C3H7O6P)Ca | 600 Hz, positive/negative duty ratio 30/20%, C1: 400 V 5 min C2: 400 V C3: 450 V C4: 500 V 5 min | C1, C2: MgF2, MgSiO3, SiO2,Mg2SiO4 C3, C4: MgF2, MgSiO3, SiO2, Mg2SiO4, Ca3(PO4)2 | 0 | −1.731 | 4.29 × 10⁻⁴ | [6] |
| C1: 20 | −1.725 | 1.78 × 10⁻⁶ | |||||
| C2: 40 | −1.721 | 1.62 × 10⁻⁷ | |||||
| C3: 70–90 | −1.429 | 6.31 × 10⁻⁸ | |||||
| C4: 210–250 | −1.708 | 3.01 × 10⁻⁷ | |||||
| 3 | AZ91 CaF2 | 100 mA/cm2, duty cycle 25%, | - | 0 | −1.733 | 126.71 × 10⁻⁶ | [7] |
| ? | −1.609 | 98.66 × 10⁻⁶ | |||||
| ? | −1.348 | 0.93 × 10⁻⁶ | |||||
| 4 | AZ31 | 400 V/0 V, 100 Hz 10 min | MgO, HA | 0 | −1.47 | 1.05 × 10⁻⁵ | [8] |
| CaGlyP, NaOH (varied) | 7 | −1.01 | 3.62 × 10⁻⁶ | ||||
| 9.8 | −0.79 | 9.83 × 10⁻⁷ | |||||
| 14.7 | −0.72 | 1.27 × 10⁻⁶ | |||||
| 19.8 | −0.65 | 3.02 × 10⁻⁶ | |||||
| 5 | Mg (purity 99%) | 30 mA/cm2. Unipolar, 100 to 5000 Hz, duty cycle 10%, 10 min | MgO, Na4Ca(PO3)6. | >20 | −1.6 to −1.4 | - | [11] |
| Ca(OH)2 | |||||||
| 6 | hp-Mg | DC 50 mA/cm2, 200 Hz, duty cycle, 20%, 10 min | Mg3(PO4)2, MgO, HA, Na2CaMg7(PO4)6 | 43.9 ± 4.8 36.8 ± 1.2 36.8 ± 3.4 33.1 ± 2.7 | Improved corrosion resistance for Ca presence (EIS) | [12] | |
| HA | |||||||
| 7 | ZK60 | positive/negative 450/20V, 600 Hz, positive/negative duty ratio 30/20%, positive : Negative pulses 1:1, 30 min | MgO, MgF2, ZnF2, ZnO, CaO, CaF2, Ca3(PO4)2 | 0 | −1.5 | 7.65 × 10⁻⁵ | [14] |
| (C6H5O7)2Ca3∙4H2O | ~35–70 | −1.521 | 2.74 × 10⁻⁹ | ||||
| −1.508 | 2.17 × 10⁻⁶ | ||||||
| −1.377 | 5.57 × 10⁻⁶ | ||||||
| 8 | AM50 | DC 30 mA/cm2, ton:toff = 2:20 ms, 15 min | MgO and Mg3(PO3)2 + amorphous CaH(PO4), CaO | corrosion resistance (EIS) | [15] | ||
| Ca(OH)2 | 56 ± 6 | 6 × 10⁵ Ω cm2 (0.5 h) 5 × 10⁴ Ω cm2 (5–10 h) 5 × 10³ Ω cm2 (50 h) | |||||
| 38 ± 5 | 8 × 10⁵ Ω cm2 (0.5 h) 4 × 10⁵ Ω cm2 (5 h) 1.5 × 10⁵ Ω cm2 (50 h) 6 × 10⁴ Ω cm2 (150 h) | ||||||
| 9 | Commercially pure | pulsing frequency 3000 Hz: positive 30, negative 0 to 20 mA/cm2 duty cycles 10%, 10 min | MgO, Na4Ca(PO3)6 | 0 | −1.56 | 4.38 × 10⁻⁴ | [16] |
| Ca(OH)2 | Unipolar | −1.41 | 1. 45 × 10−5 | ||||
| Bipolar | −1.43 | 1.81 × 10⁻⁵ | |||||
| 10 | MA8 | Bipolar mode | MgO, Ca10(PO4)6(OH)2 | 0 | −1.564 | 5.10 × 10⁻⁵ | [17] |
| (C3H7O6P)Ca | - | −1.519 | 1.15 × 10⁻⁶ | ||||
Table 2.
Summary of the conditions and the properties of thin PEO coatings on Mg alloys.
| Nº | Alloy/Electrolyte | PEO Parameters | Coating Composition | Substrate/Coating Thickness (µm) | Corrosion Data | Ref | ||
|---|---|---|---|---|---|---|---|---|
| Ecorr (V) | icorr (A/cm2) | R Inner (Ω cm2) | ||||||
| 1 | AZ91D | - | - | 0 | −1.509 | 2.352 × 10⁻⁶ | - | [27] |
| NaAlO2, KOH | 25 mA/cm2, 25 min | - | 5 | −1.479 | 1.607 × 10⁻⁶ | 1866 | ||
| + CeCl3 | 5 | −1.607 | 0.179 × 10⁻⁶ | 52547 | ||||
| 2 | AZ91D | 0 | −1.4 | - | - | [28] | ||
| KOH, KF, Na3PO4, K2SnO3 | 10 mA/cm2, 10 min | MgSn(OH)6, amorphous MgO | 5–10 | −1.55 to −1.6 | - | |||
| 3 | AZ91 Na2SiO3, NaOH, diethyl-amine, Na2MoO4 | - | - | 0 | −1.55 | 1.5 × 10⁻⁵ | 1259 | [29] |
| 50 mA/cm2, 15 min | MgO, Mg2SiO4, | 40 | −1.39 | 3.5 × 10⁻⁵ | 800 | |||
| MoO3, MgMoO4 | 1 | −1.37 | 1 × 10⁻⁶ | 42721 | ||||
| 4 | AZ91HP NaOH, phytic acid, Na2WO4 | 0 | - | - | - | [30] | ||
| 40 mA/cm2, 2000 Hz | - | 4.9 | one small corrosion pit | |||||
| 4.6 | four corrosion pits, largest pit 8 mm × 6 mm | |||||||
| 5 | AZ91D Na2SiO3, NaF, NH4H2PO4, C6H5O7Na3, K2ZrF6 | 0 | - | - | - | |||
| 300 V, 480 Hz, duty cycle 30%, 45 °C, 10 min | MgO, MgF2, MgSiO3, amorphous phosphate | 5–8 | −1.503 | 6.57 × 10⁻⁶ | 1,290,000 | [31] | ||
| t-ZrO2 | −1.421 | 4.04 × 10⁻⁷ | 1,064,0000 | |||||
| 6 | AZ91 | 0 | - | - | - | [32] | ||
| KOH, KF, Na2SiO3 Na2SnO3 | 20 mA/cm2, 2–10 min | MgO, SnO, Mg2SiO4, MgF2 | 1.5 | −1.55 | 3.07 × 10⁻⁷ | - | ||
| 5 | −1.39 | 1.93 × 10⁻¹⁰ | - | |||||
| 7 | AZ91 | 0 | - | - | - | [33] | ||
| Na2SiO3, KF, KOH | 25 mA/cm2, 5 min | MgO, MgOH2 | ~1.4 | −1.45 | 1.32 × 10⁻⁸ | 396,000 | ||
| ~1.4 | −1.34 | 2.46 × 10⁻⁹ | 465,000 | |||||
| 8 | AM50 KOH, Na2SiO4 KOH, Na3PO4 KOH, NaAlO2 | 0 | - | - | - | [34] | ||
| 36.2 A/cm2 pulse ratio tmax:tmin = 4 ms:1 ms, 50 Hz, 5 min | MgO, Mg2SiO4 | 8 ± 0.7 | - | 3.2 × 10⁻⁶ | 5,640,000 | |||
| MgO, Mg3(PO4)2 | 4 ± 0.4 | -- | 9.5 × 10⁻⁴ | 310,000 | ||||
| MgO, MgAl2O4 | 1 ± 0.2 | - | 8.7 × 10⁻³ | 2300 | ||||
Table 3.
Flash-PEO (FPEO) process and coating parameters.
| Name | Electrolyte | pH/Conductivity (mS/cm) | Treatment Time (s) | Energy Consumption (kWh/m2) | Pore Population Density/Pore Diameter (µm−2)/(µm) |
|---|---|---|---|---|---|
| FPEO | 5 g/L Na2SiO3·5H2O, 5 g/L Na3PO4·12H2O, 14 g/L KOH, 3 g/L KF | 12.91/57.5 | 20 | 0.80 | 3.1 ± 0.5/(14 ± 2) × 10−3 |
| FPEO_CaO | 5 g/L Na2SiO3·5H2O, 5 g/L Na3PO4·12H2O, 14 g/L KOH, 3 g/L KF, 2 mM Na2EDTA, 1.5 mM CaO | 12.94/59.2 | 35 | 1.64 | 1.8 ± 0.3/(8 ± 3) × 10−3 |
| FPEO_CaGlyP | 5 g/L Na2SiO3·5H2O, 5 g/L Na3PO4·12H2O, 14 g/L KOH, 3 g/L KF, 2 mM Na2EDTA, 1.5 mM CaGlyP | 12.91/57.8 | 45 | 2.04 | 1.9 ± 0.8/(10 ± 4) × 10−3 |
Table 4.
Averaged results of the local EDS surface analysis of the coatings (at.%).
| Elements | FPEO | FPEO_CaO | FPEO_CaGlyP |
|---|---|---|---|
| Mg | 56.1 ± 1.2 | 50.6 ± 0.4 | 52.4 ± 1.1 |
| Al | 2.9 ± 0.5 | 3.2 ± 0.5 | 2.5 ± 0.4 |
| O | 36.4 ± 1.1 | 39.6 ± 0.3 | 39.6 ± 0.7 |
| F | 2.1 ± 0.4 | 3.5 ± 0.5 | 2.6 ± 0.5 |
| Si | 1.8 ± 0.1 | 2.3 ± 0.06 | 2.0 ± 0.2 |
| P | 0.7 ± 0.2 | 0.9 ± 0.03 | 0.7 ± 0.2 |
| Ca | - | 0.1 ± 0.04 | 0.1 ± 0.04 |
Table 5.
Fitted parameters of the EIS data for the Mg and Bonderite CC specimens after 30 min of immersion in 0.5 % wt. NaCl. (R given in Ω cm2; CPE given in S s−n cm−2; L given in Ω s cm2).
Table 5.
Fitted parameters of the EIS data for the Mg and Bonderite CC specimens after 30 min of immersion in 0.5 % wt. NaCl. (R given in Ω cm2; CPE given in S s−n cm−2; L given in Ω s cm2).
| Sample | Re | CPE1 | n | R1 | CPE2 | n | R2 | L | R3 | Rt | Rp |
|---|---|---|---|---|---|---|---|---|---|---|---|
| Mg | 142.3 | 8.37 × 10⁻⁶ | 0.87 | 320 | 1.7 × 10⁻⁶ | 0.90 | 856 | 836.22 | 603 | 1176 | 399 |
| Bonderite CC | 178.1 | 1.06 × 10⁻⁶ | 0.90 | 350 | 4.3 × 10⁻⁶ | 0.90 | 2400 | 2873 | 2060 | 2750 | 1178 |
Table 6.
Fitted parameters of the EIS data for the Mg and Bonderite specimens after 24 h of immersion in 0.5 % wt. NaCl. (R given in Ω cm2; CPE given in S s−n cm−2).
Table 6.
Fitted parameters of the EIS data for the Mg and Bonderite specimens after 24 h of immersion in 0.5 % wt. NaCl. (R given in Ω cm2; CPE given in S s−n cm−2).
| Sample | Re | CPEcp | n | Rcp | CPEdl | n | Rp |
|---|---|---|---|---|---|---|---|
| Mg | 152.2 | 1.41 × 10⁻⁵ | 0.90 | 120 | 6.37 × 10⁻⁶ | 0.90 | 1047 |
| Bonderite | 153.5 | 7.96 × 10⁻⁶ | 0.94 | 228 | 8.73 × 10⁻⁶ | 0.98 | 1173 |
Table 7.
Fitted parameters of the EIS data for the PEO coatings after 30 min of immersion in 0.5% wt. NaCl. (R given in Ω cm2; CPE given in S s−n cm−2).
Table 7.
Fitted parameters of the EIS data for the PEO coatings after 30 min of immersion in 0.5% wt. NaCl. (R given in Ω cm2; CPE given in S s−n cm−2).
| Sample | Re | CPEout | n | Rout | CPEin | n | Rin | CPEdl | n | Rp |
|---|---|---|---|---|---|---|---|---|---|---|
| FPEO | 140.7 | 4.5 × 10⁻⁷ | 0.83 | 70 | 1.46 × 10⁻⁶ | 0.60 | 1.25 × 10⁵ | 2.30 × 10⁻⁴ | 0.97 | 0.37 × 10⁵ |
| FPEO_CaO | 133.4 | 2.4 × 10⁻⁷ | 0.83 | 2553 | 1.85 × 10⁻⁷ | 0.86 | 4.02 × 10⁵ | 2.23 × 10⁻⁵ | 0.71 | 2.73 × 10⁵ |
| FPEO_CaGlyP | 161.8 | 1.65 × 10⁻⁷ | 0.84 | 2550 | 4.22 × 10⁻⁸ | 0.83 | 6.79 × 10⁵ | 1.06 × 10⁻⁵ | 0.61 | 5.98 × 10⁵ |
Table 8.
Fitted parameters of the EIS data for the PEO coatings after 24 h of immersion in 0.5 % wt. NaCl. (R given in Ω cm2; CPE given in S s−n cm−2).
Table 8.
Fitted parameters of the EIS data for the PEO coatings after 24 h of immersion in 0.5 % wt. NaCl. (R given in Ω cm2; CPE given in S s−n cm−2).
| Sample | Re | CPEcoat | n | Rcoat | CPEdl | n | Rp |
|---|---|---|---|---|---|---|---|
| FPEO | 154.1 | 1.74 × 10⁻⁶ | 0.77 | 2230 | 2.08 × 10⁻⁷ | 1 | 0.11 × 10⁵ |
| FPEO_CaO | 172.1 | 1.54 × 10⁻⁷ | 0.94 | 8464 | 1.44 × 10⁻⁷ | 0.92 | 0.76 × 10⁵ |
| FPEO_CaGlyP | 152.6 | 3.61 × 10⁻⁷ | 0.87 | 1.54 × 10⁵ | 1.13 × 10⁻⁵ | 0.68 | 1.14 × 10⁵ |
Table 9.
Creepage evaluation and the ASTM D 1654 rating of the painted materials following 7 days of exposure to neutral salt spray (NSST).
Table 9.
Creepage evaluation and the ASTM D 1654 rating of the painted materials following 7 days of exposure to neutral salt spray (NSST).
| Sample | Length of Corroded Point (mm) | Rating ASTM D 1654 | Corroded Surface Area (mm2) |
|---|---|---|---|
| Mg substrate | not applicable | 0 | 150 ± 41.11 |
| CC | 4.1 ± 0.14 | 5 | 11 ± 0.98 |
| FPEO | 2 ± 1.53 | 6 | 5 ± 2.1 |
| FPEO_CaO | 2.3 ± 0.49 | 6 | 4.1 ± 0.69 |
| FPEO_CaGlyP | 1.9 ± 0.28 | 7 | 2.2 ± 0.49 |
© 2020 by the authors. Licensee MDPI, Basel, Switzerland. This article is an open access article distributed under the terms and conditions of the Creative Commons Attribution (CC BY) license (http://creativecommons.org/licenses/by/4.0/).
Share and Cite
MDPI and ACS Style
Wierzbicka, E.; Pillado, B.; Mohedano, M.; Arrabal, R.; Matykina, E. Calcium Doped Flash-PEO Coatings for Corrosion Protection of Mg Alloy. Metals 2020, 10, 916. https://doi.org/10.3390/met10070916
AMA Style
Wierzbicka E, Pillado B, Mohedano M, Arrabal R, Matykina E. Calcium Doped Flash-PEO Coatings for Corrosion Protection of Mg Alloy. Metals. 2020; 10(7):916. https://doi.org/10.3390/met10070916
Chicago/Turabian StyleWierzbicka, Ewa, Borja Pillado, Marta Mohedano, Raul Arrabal, and Endzhe Matykina. 2020. "Calcium Doped Flash-PEO Coatings for Corrosion Protection of Mg Alloy" Metals 10, no. 7: 916. https://doi.org/10.3390/met10070916
Note that from the first issue of 2016, this journal uses article numbers instead of page numbers. See further details here.