

Influence of Oxidation and Dialysis of Phlorotannins on Bioactivity and Composition of Ultrasound-Assisted Extracts from Ascophyllum nodosum

Abstract
:
1. Introduction
2. Results and Discussion
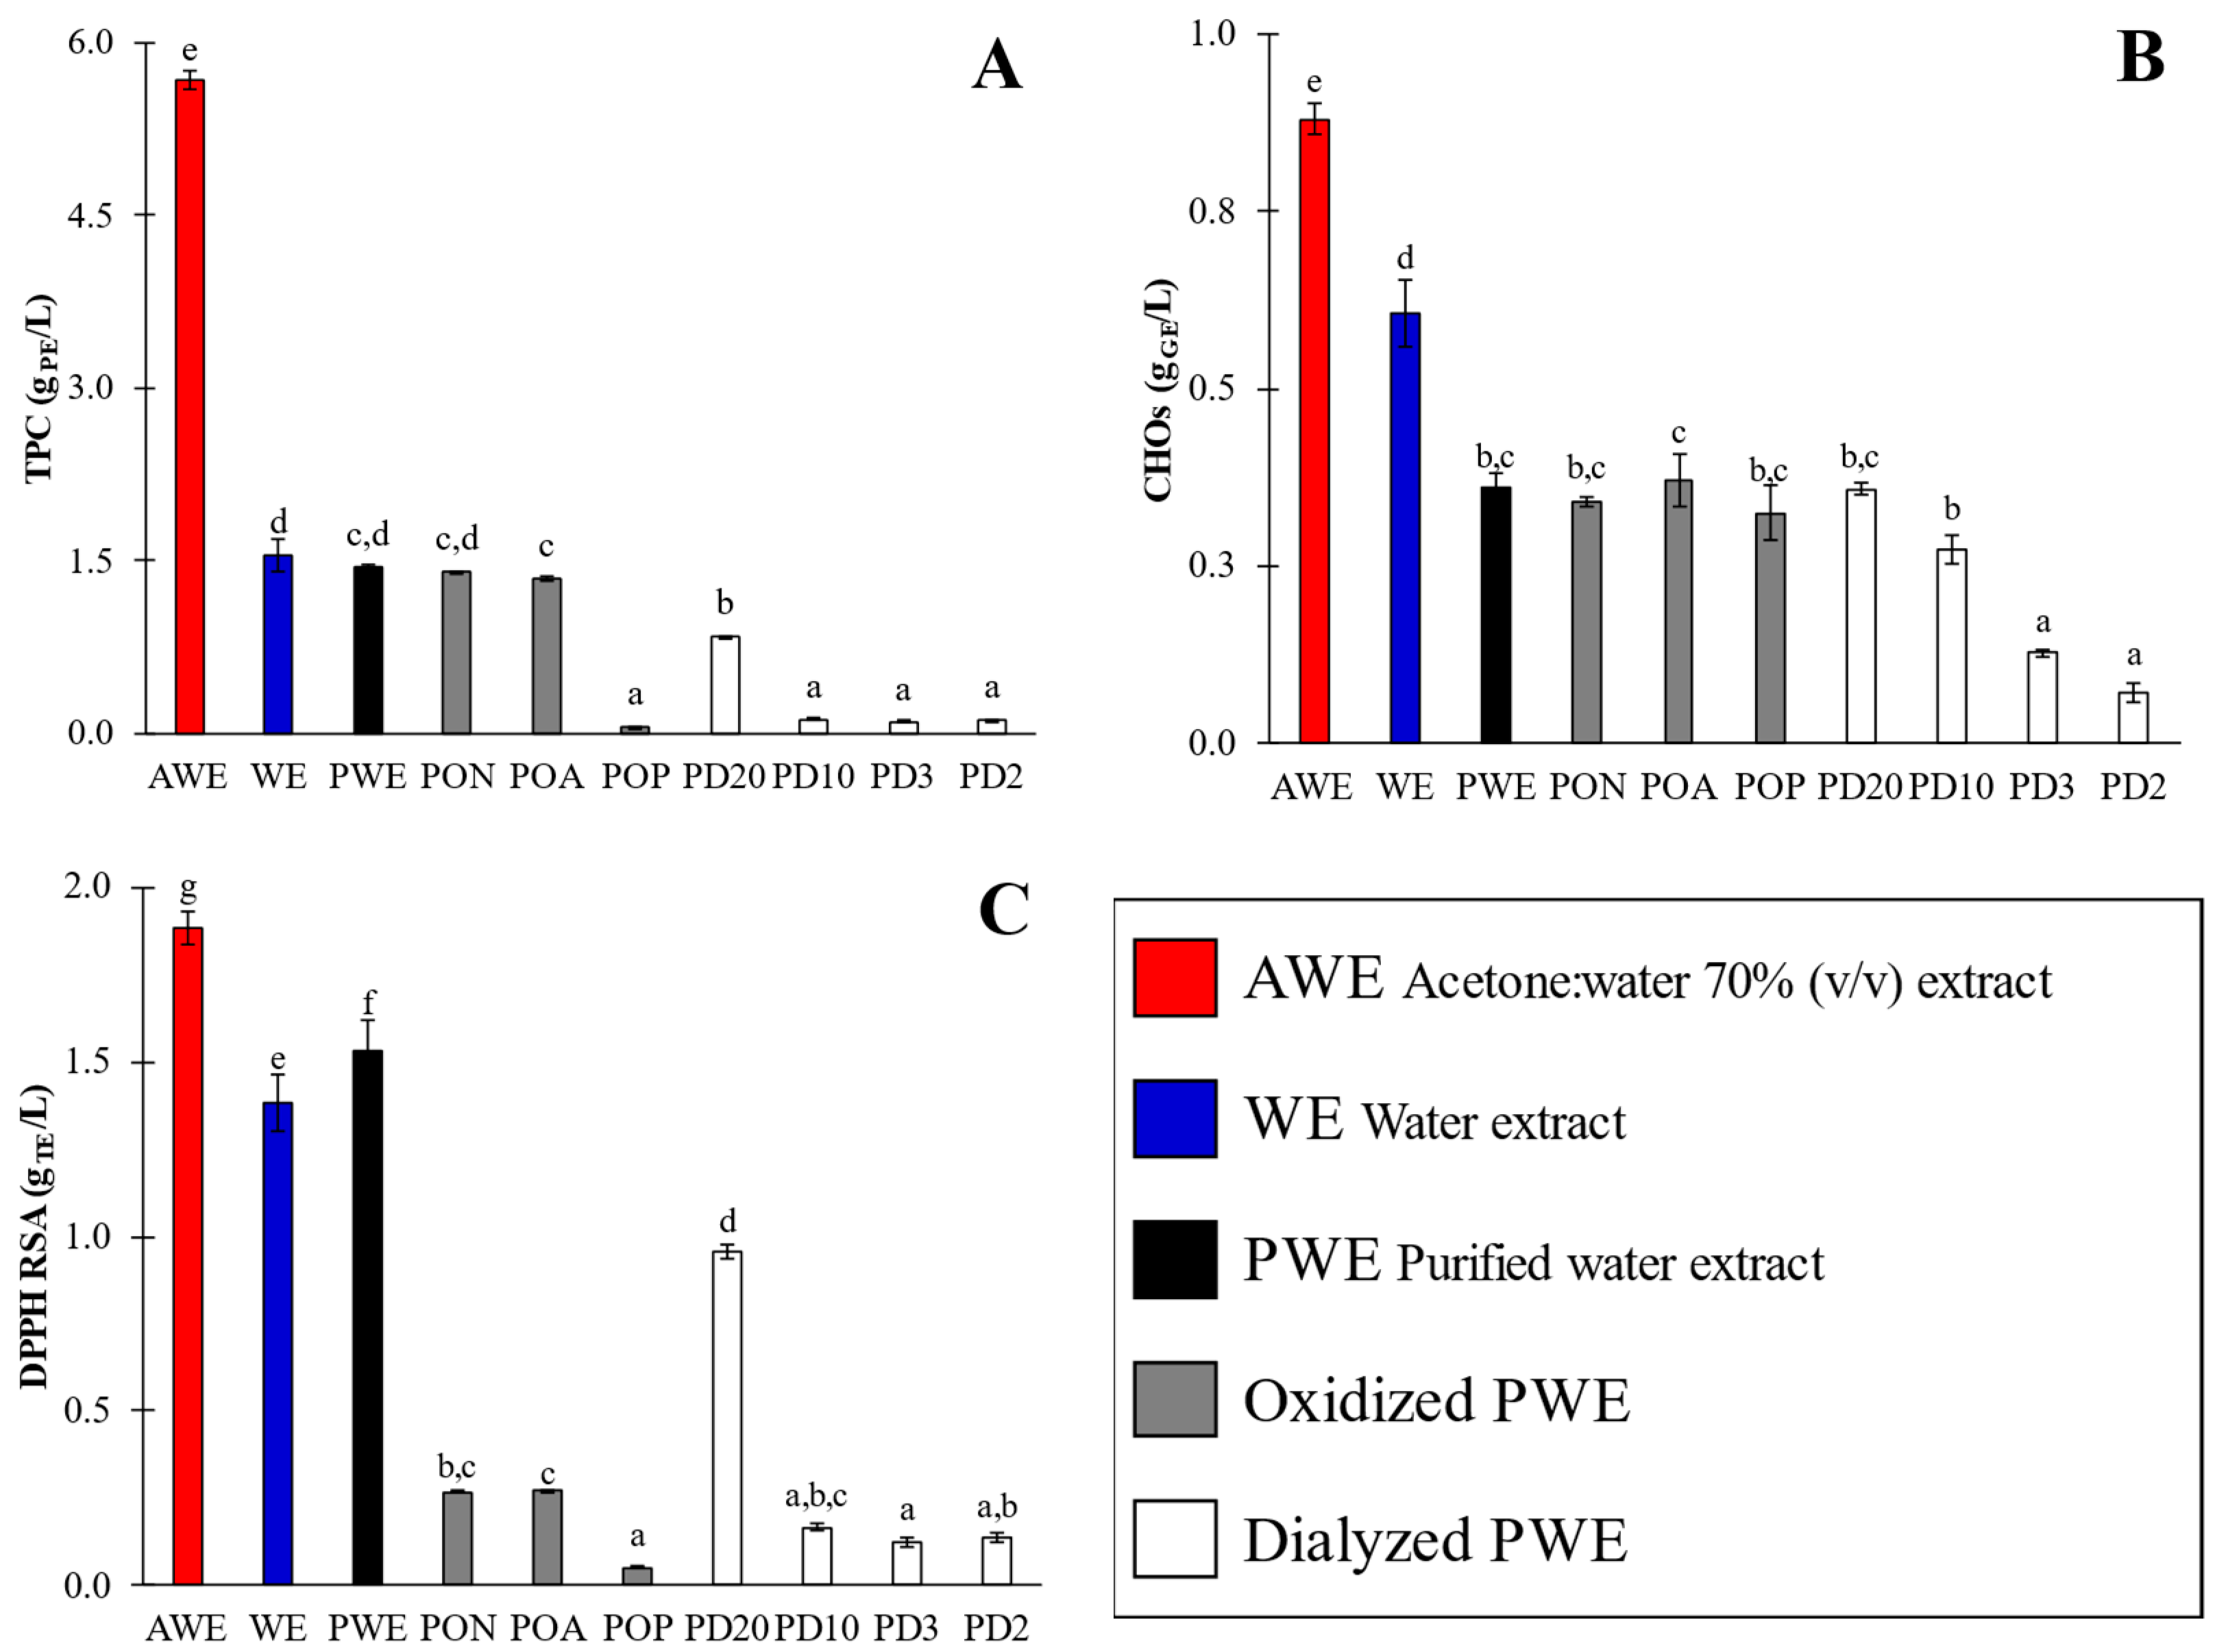
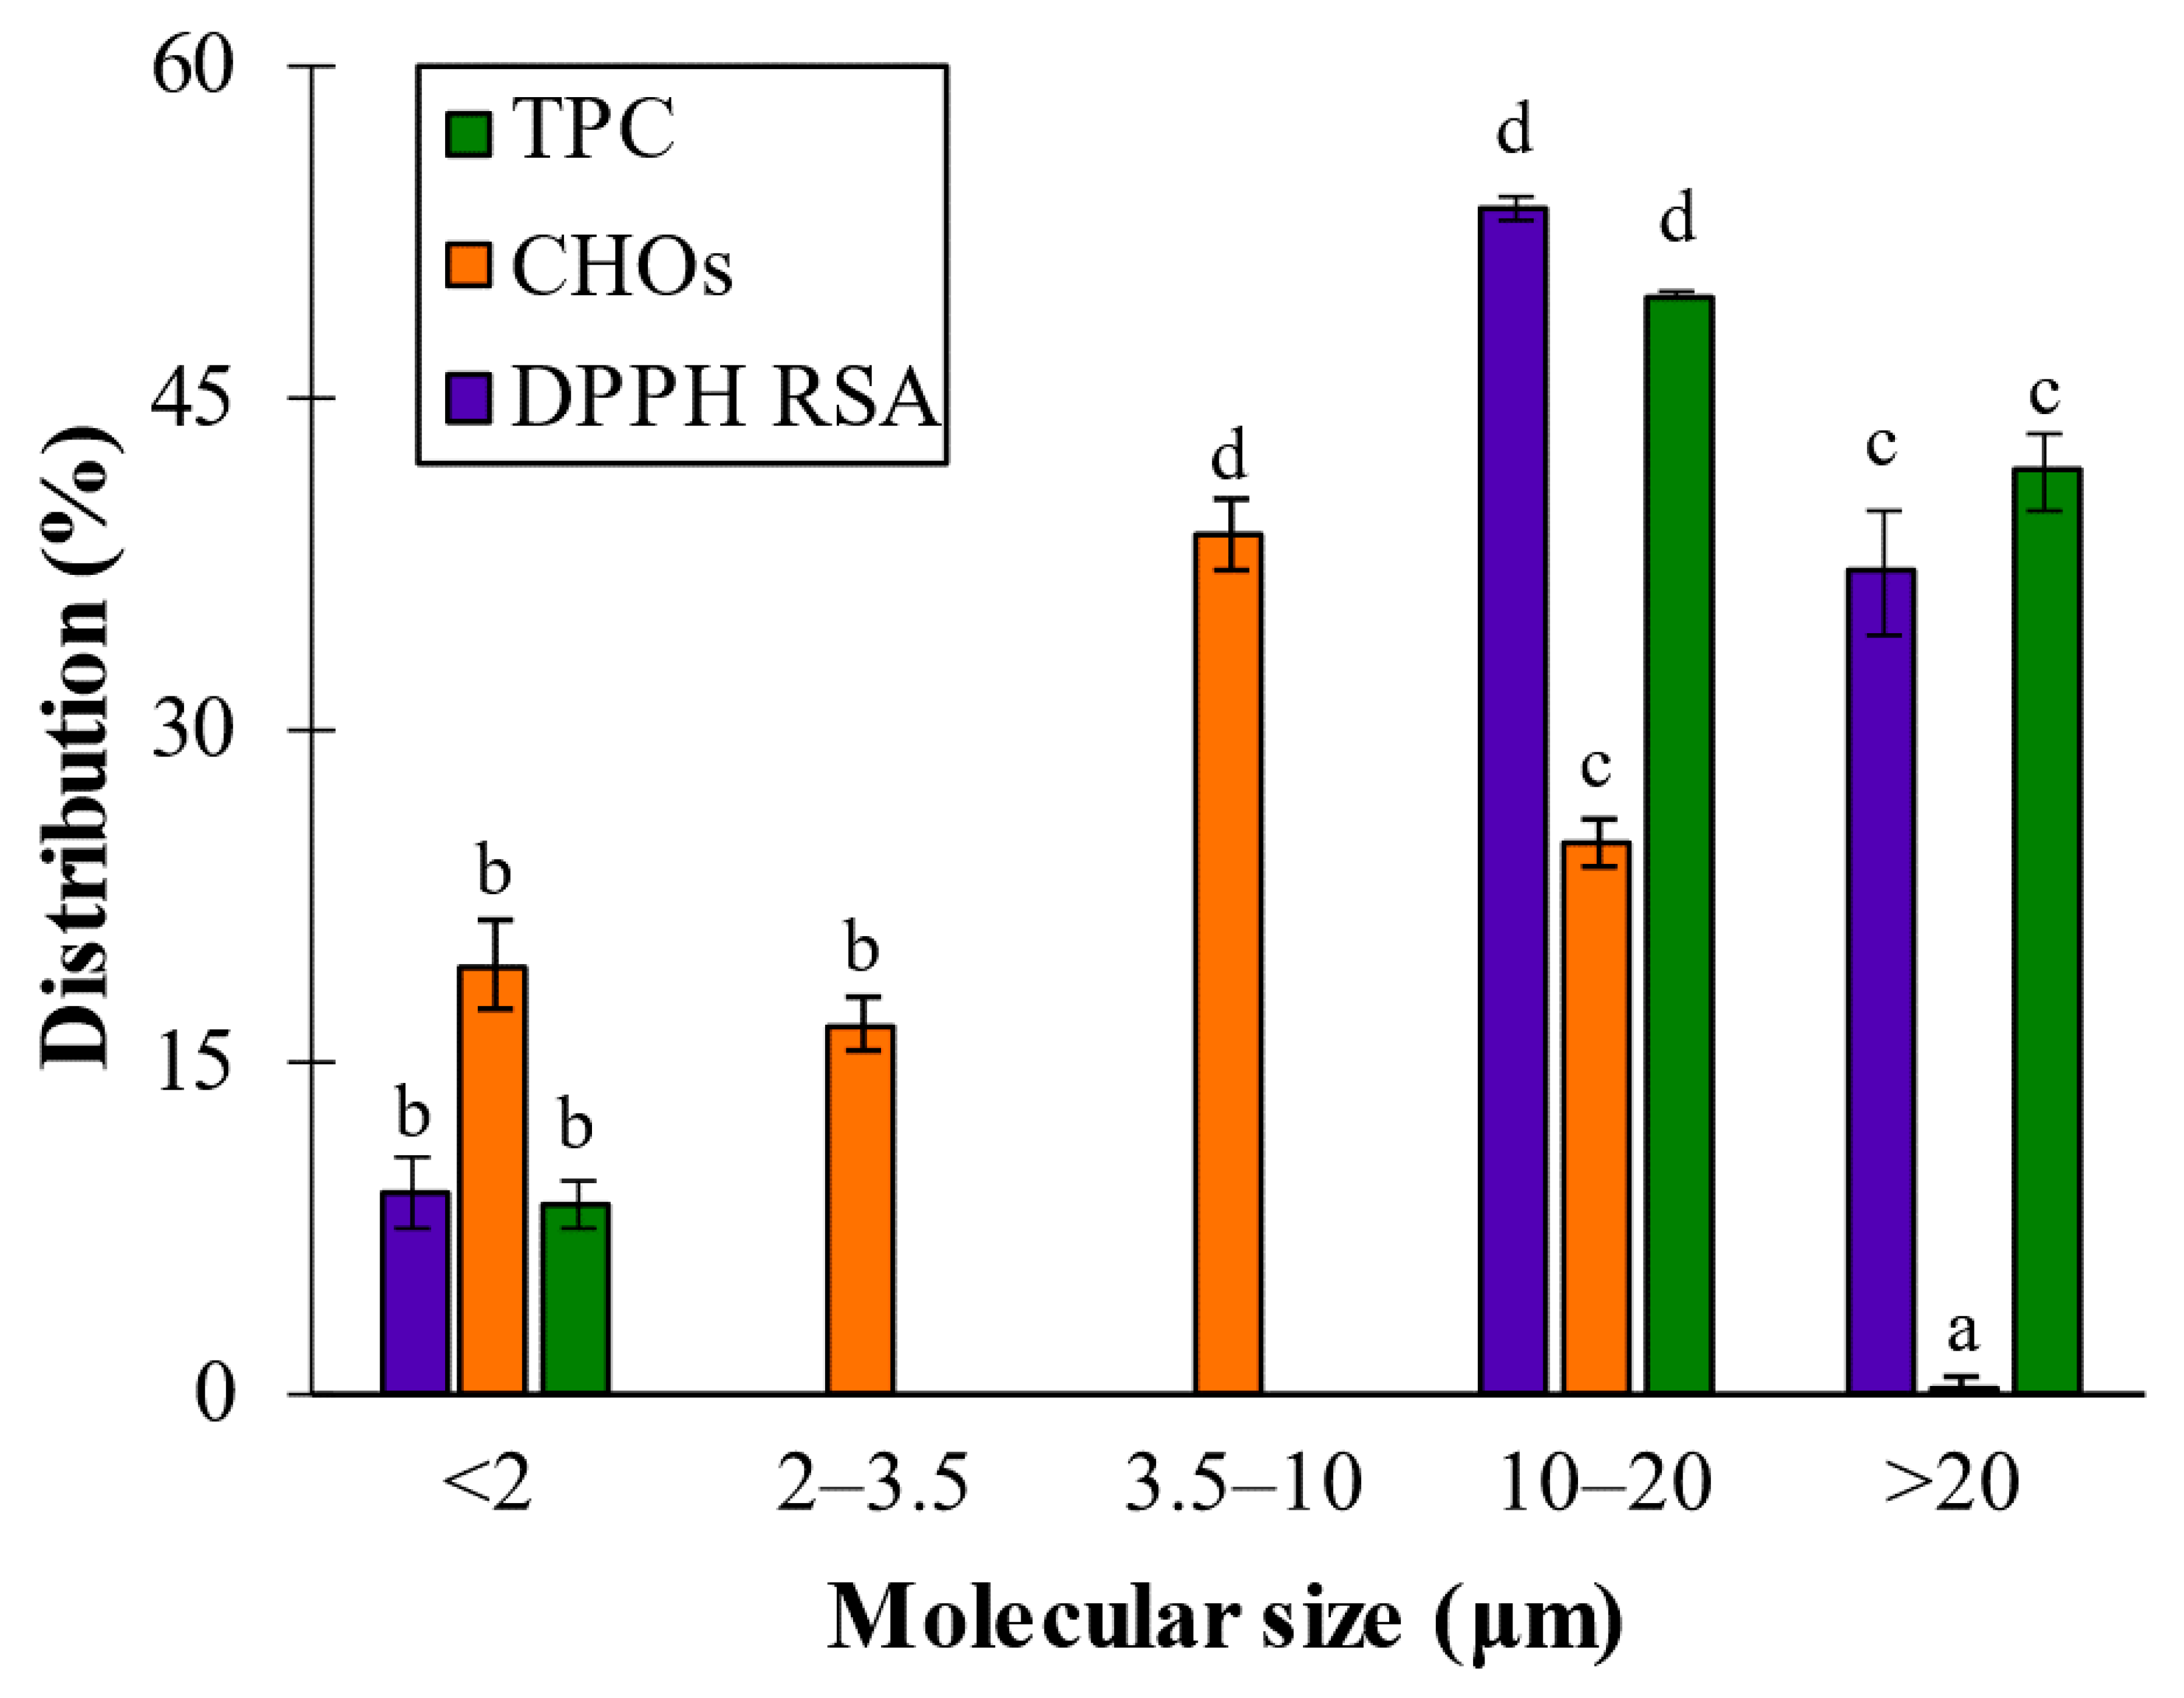
2.1. Bioactivity Characterization
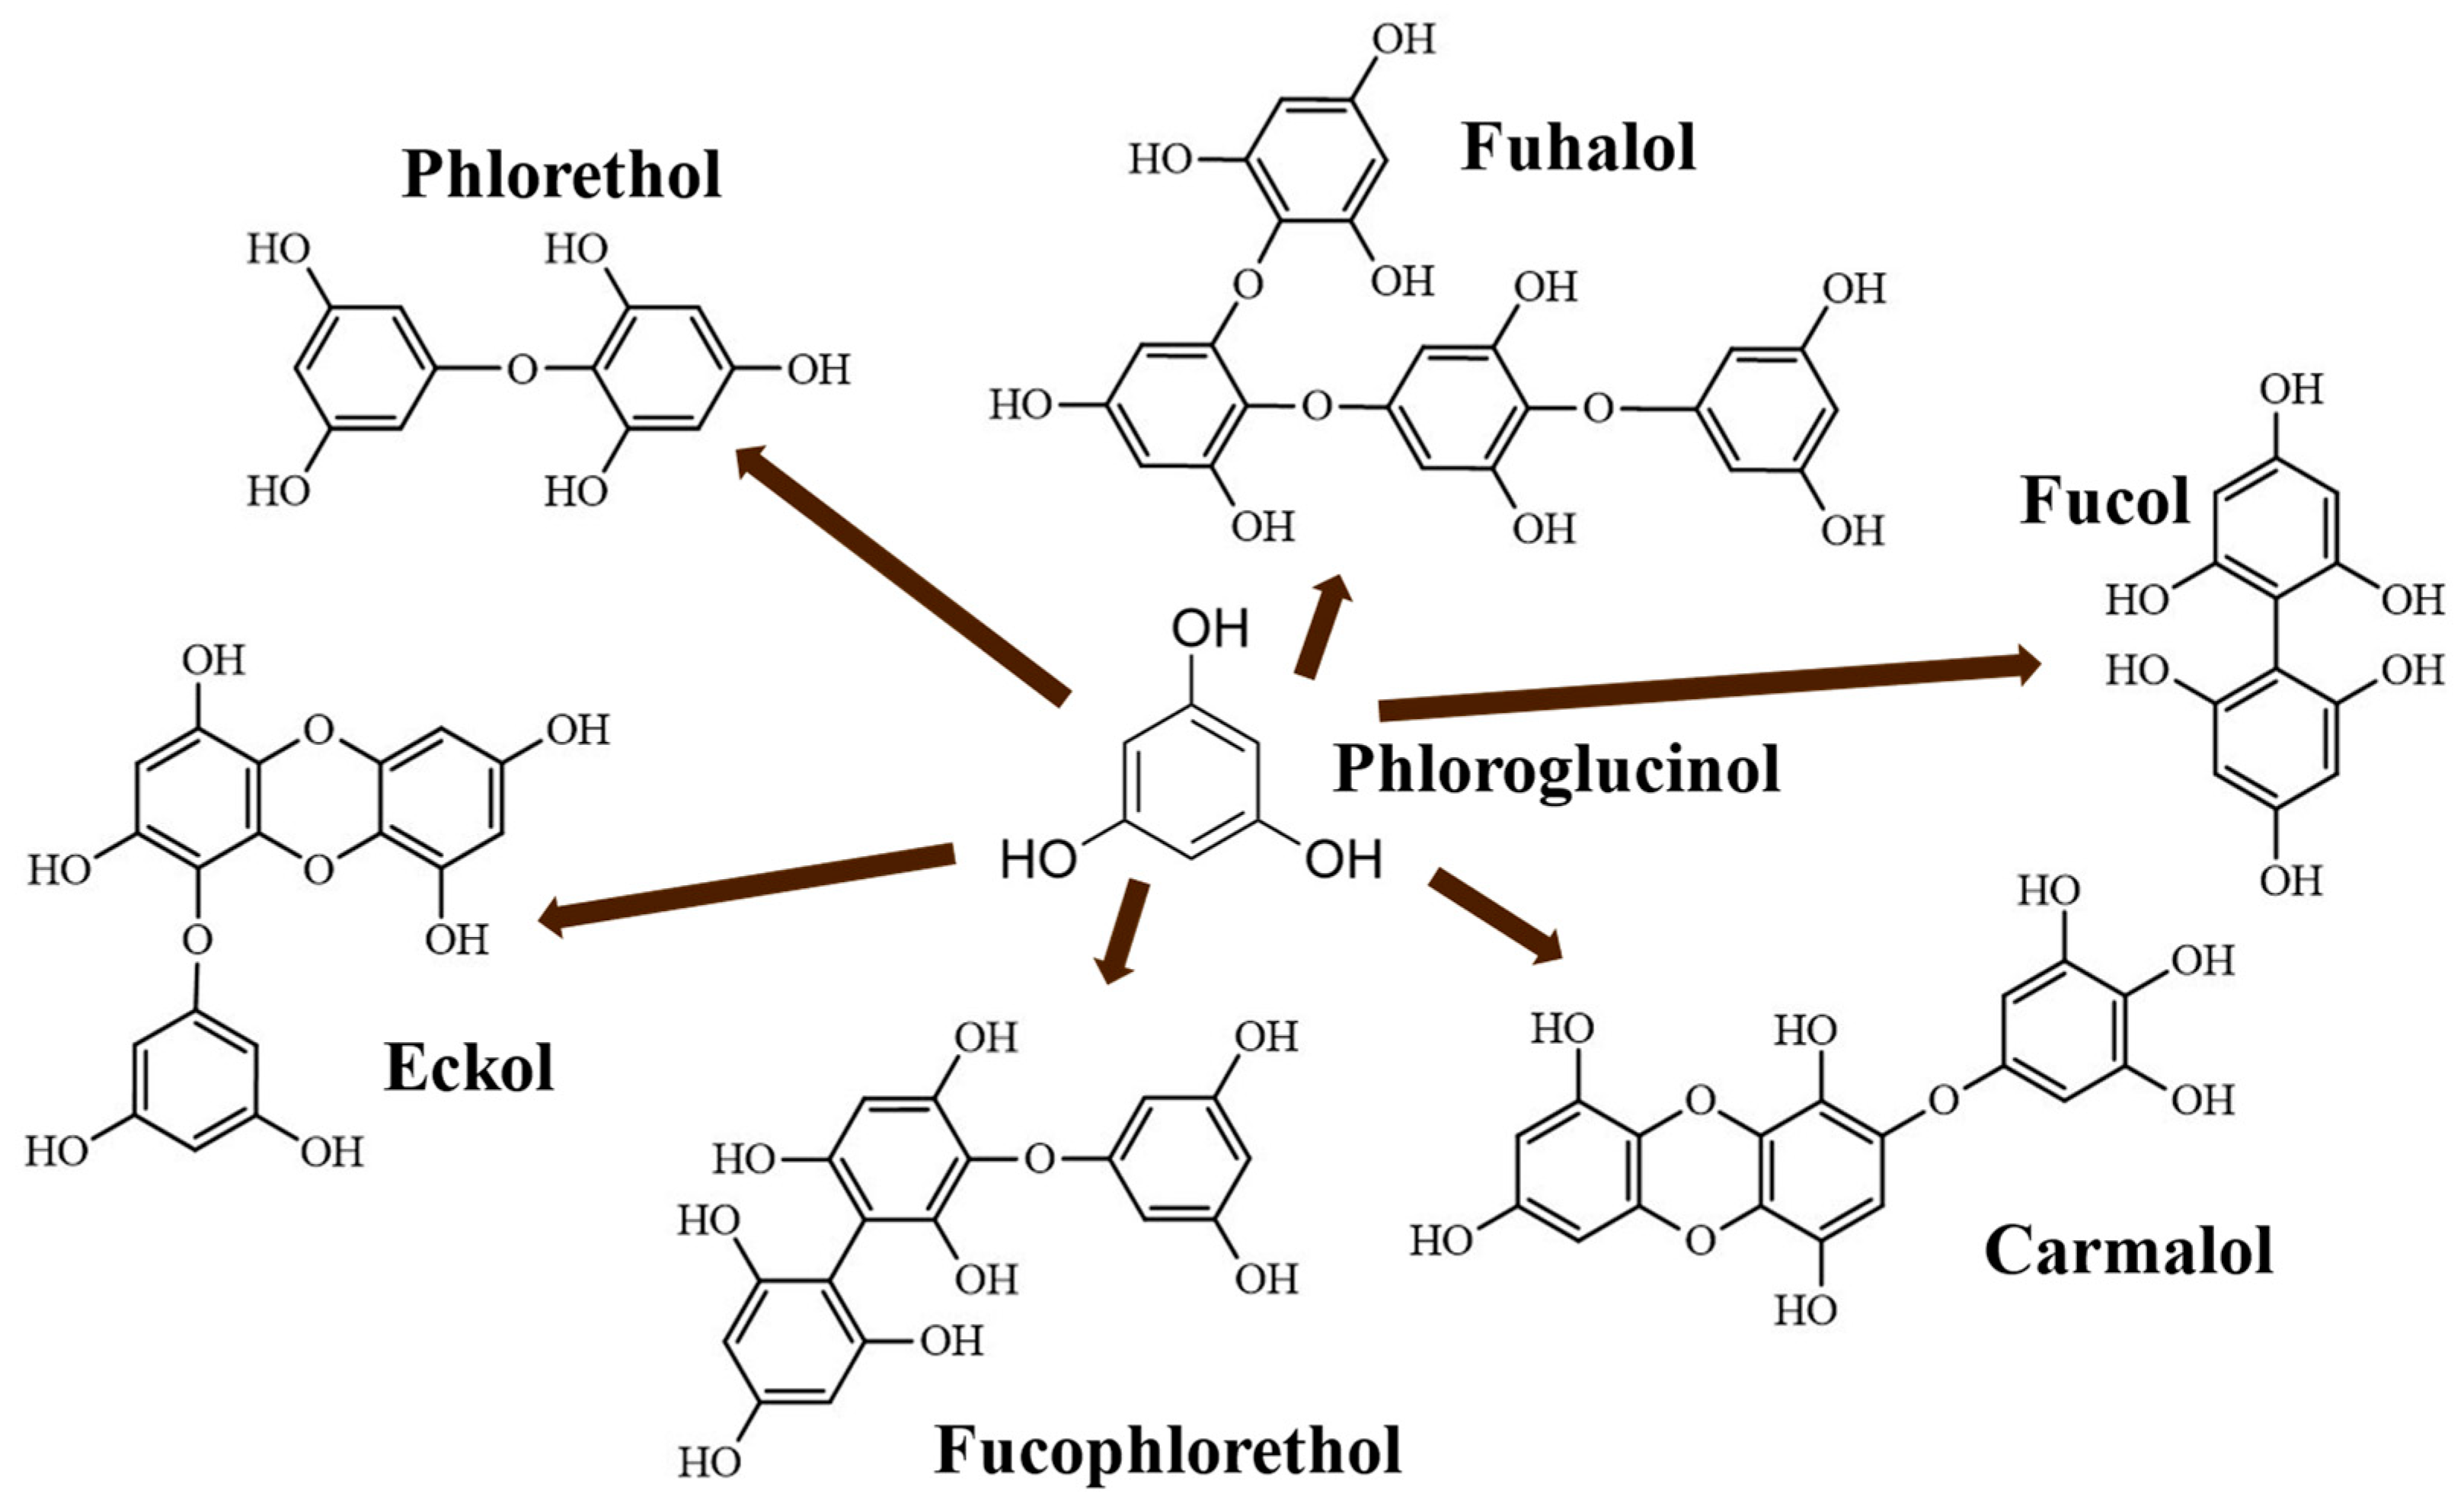
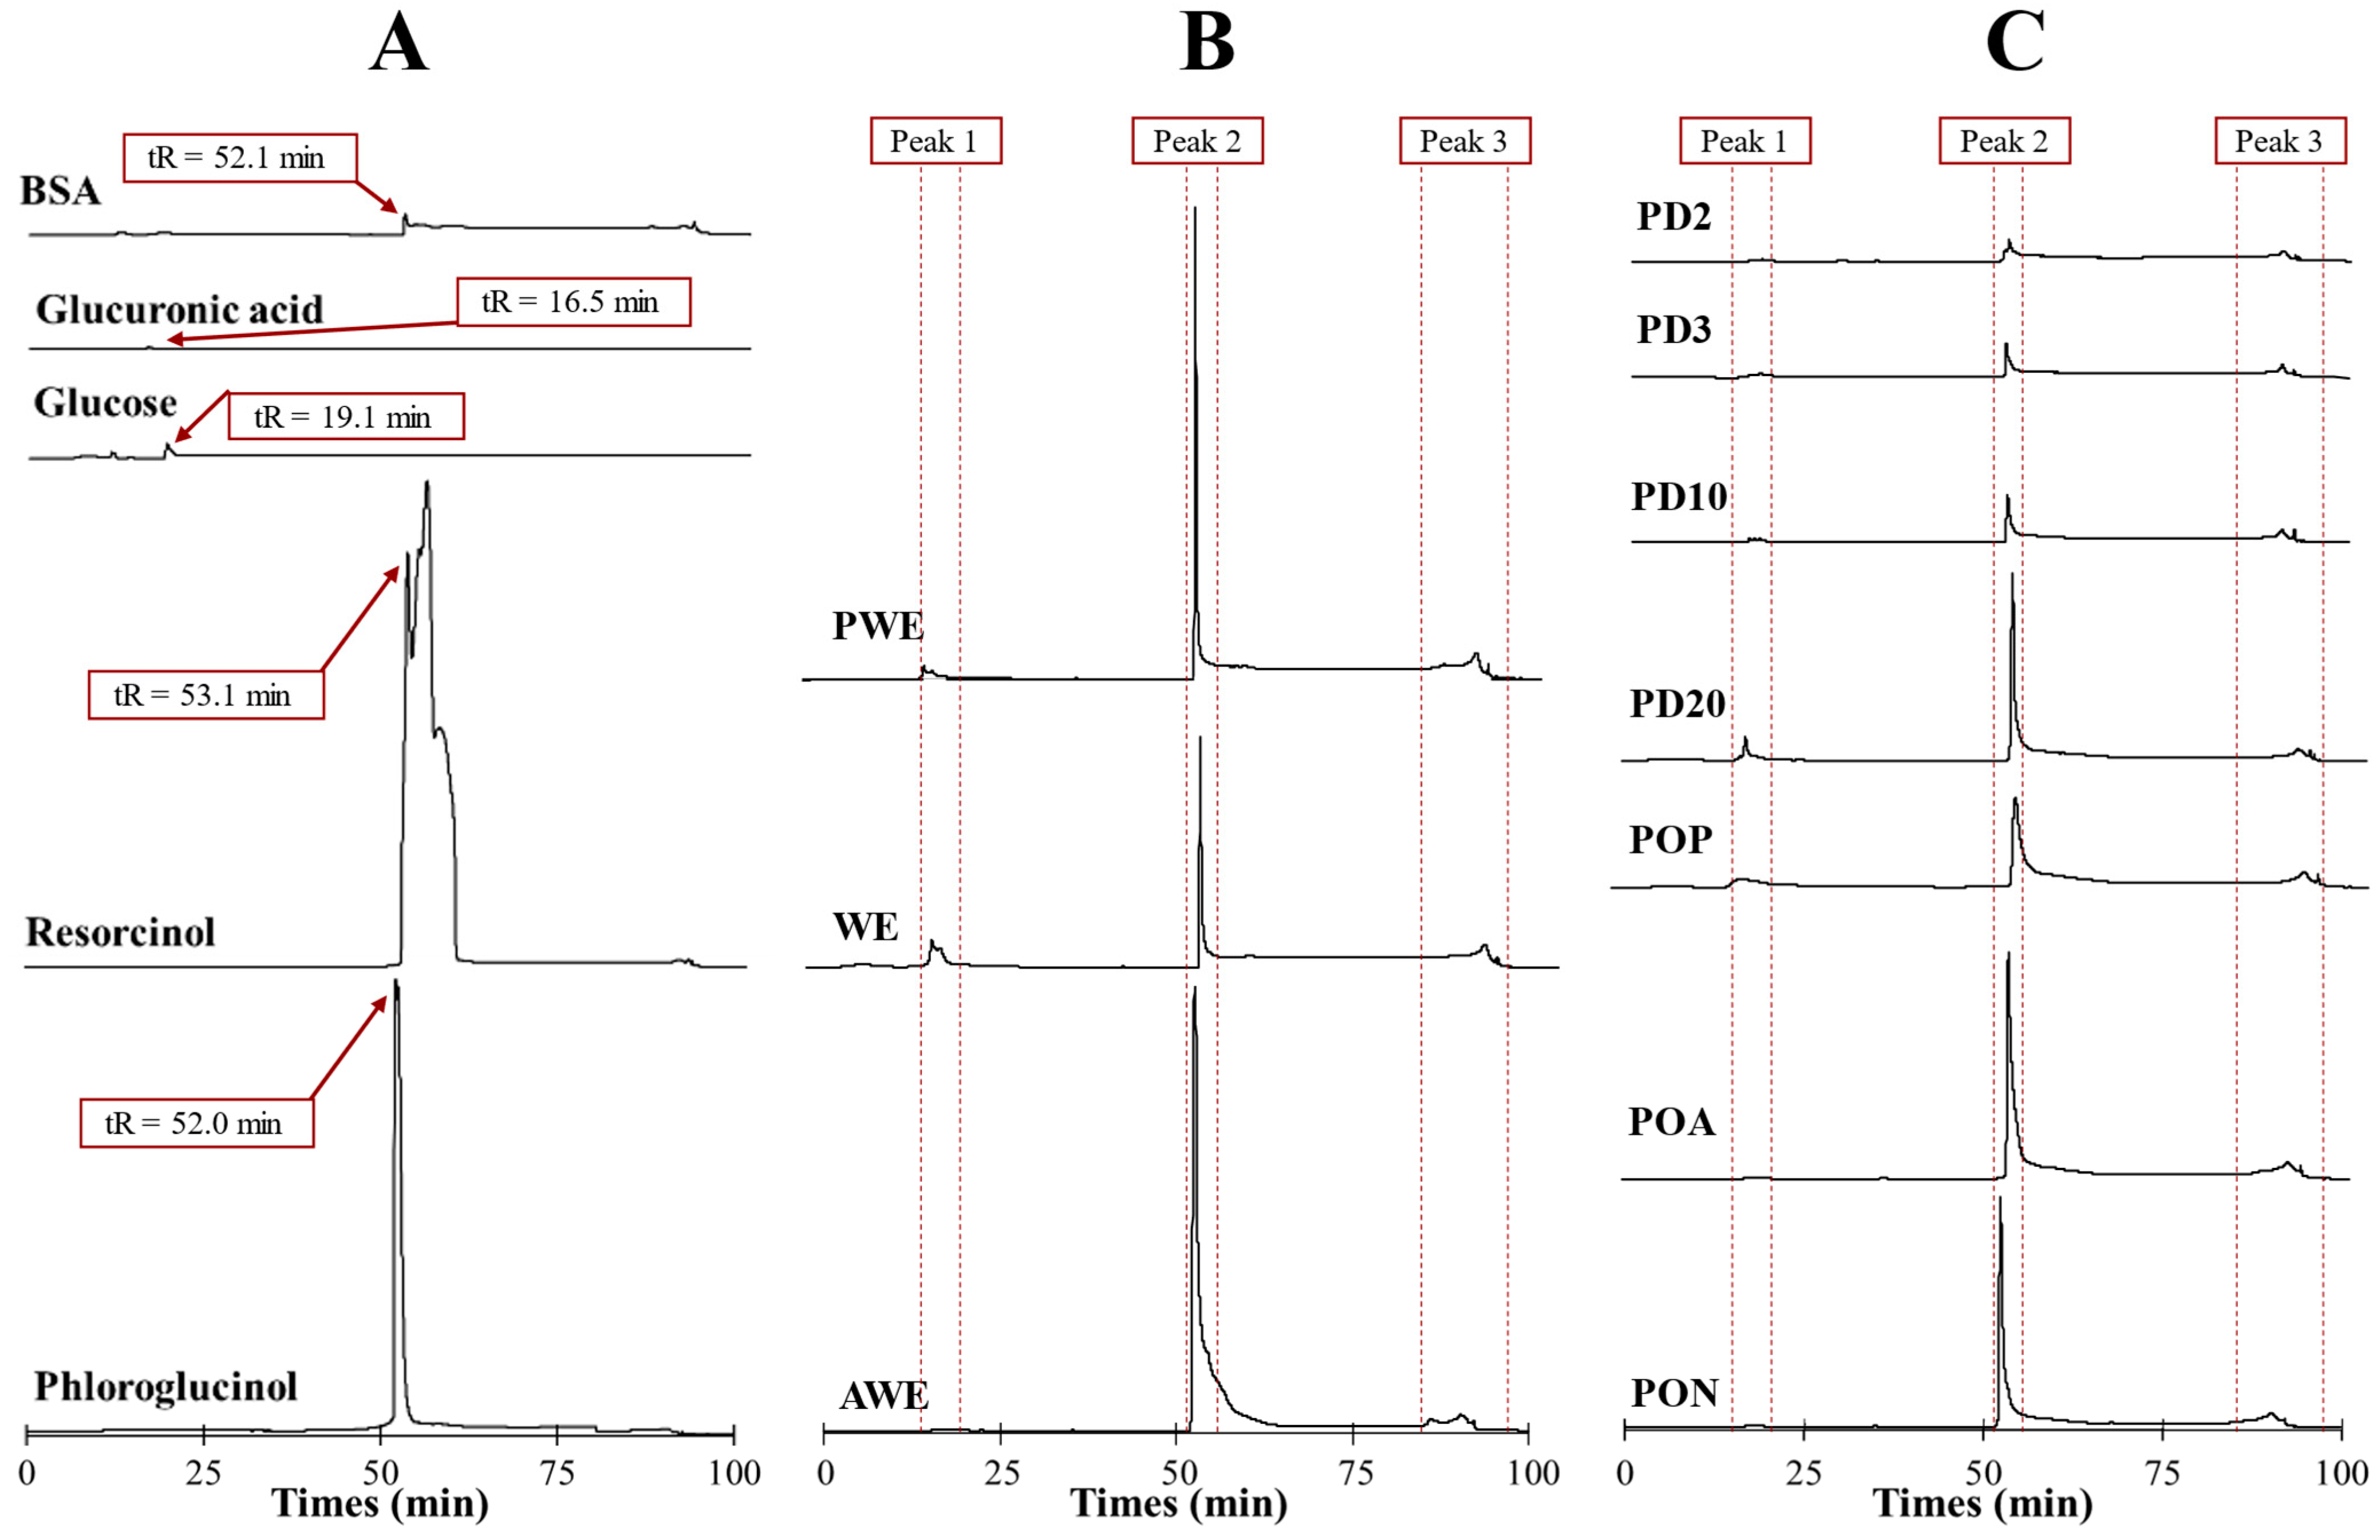
2.2. Chromatographic Characterization
2.3. Spectroscopic Characterization
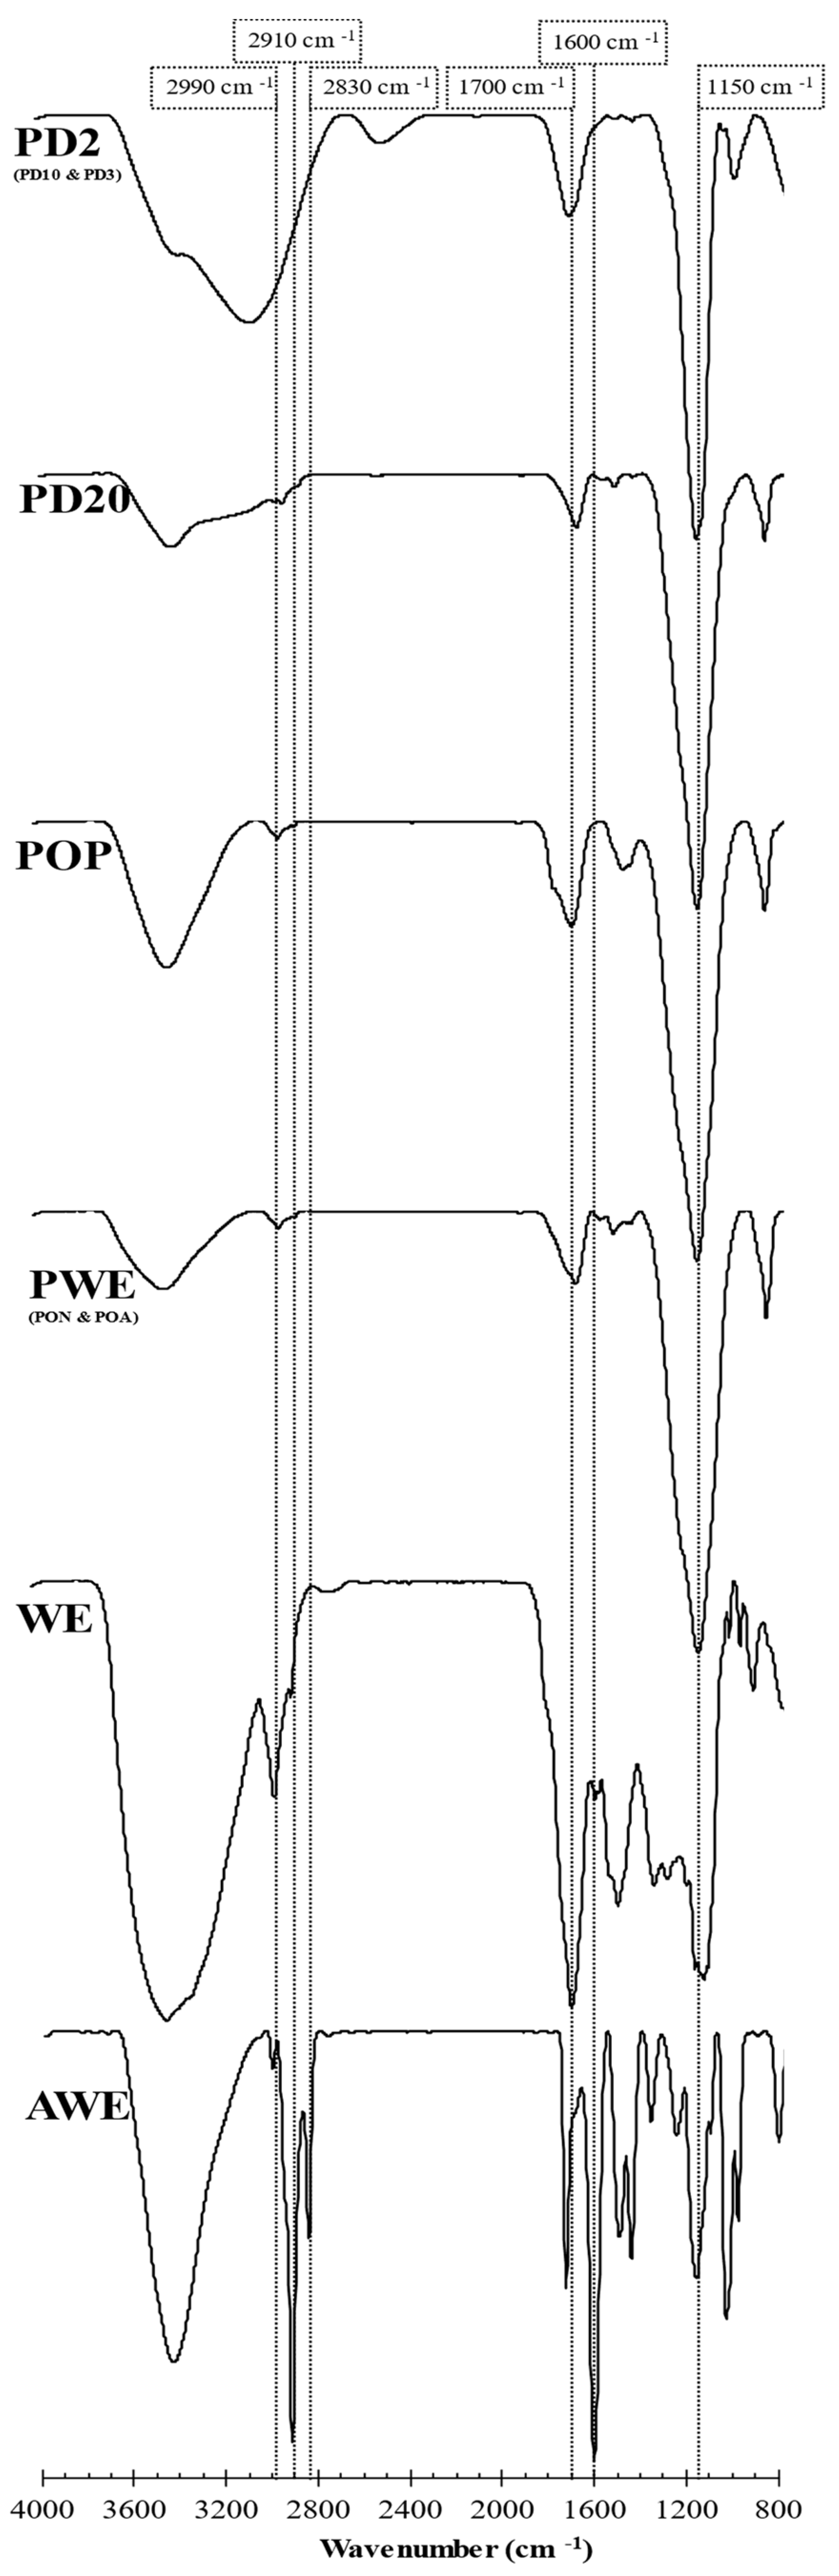
2.3.1. FTIR
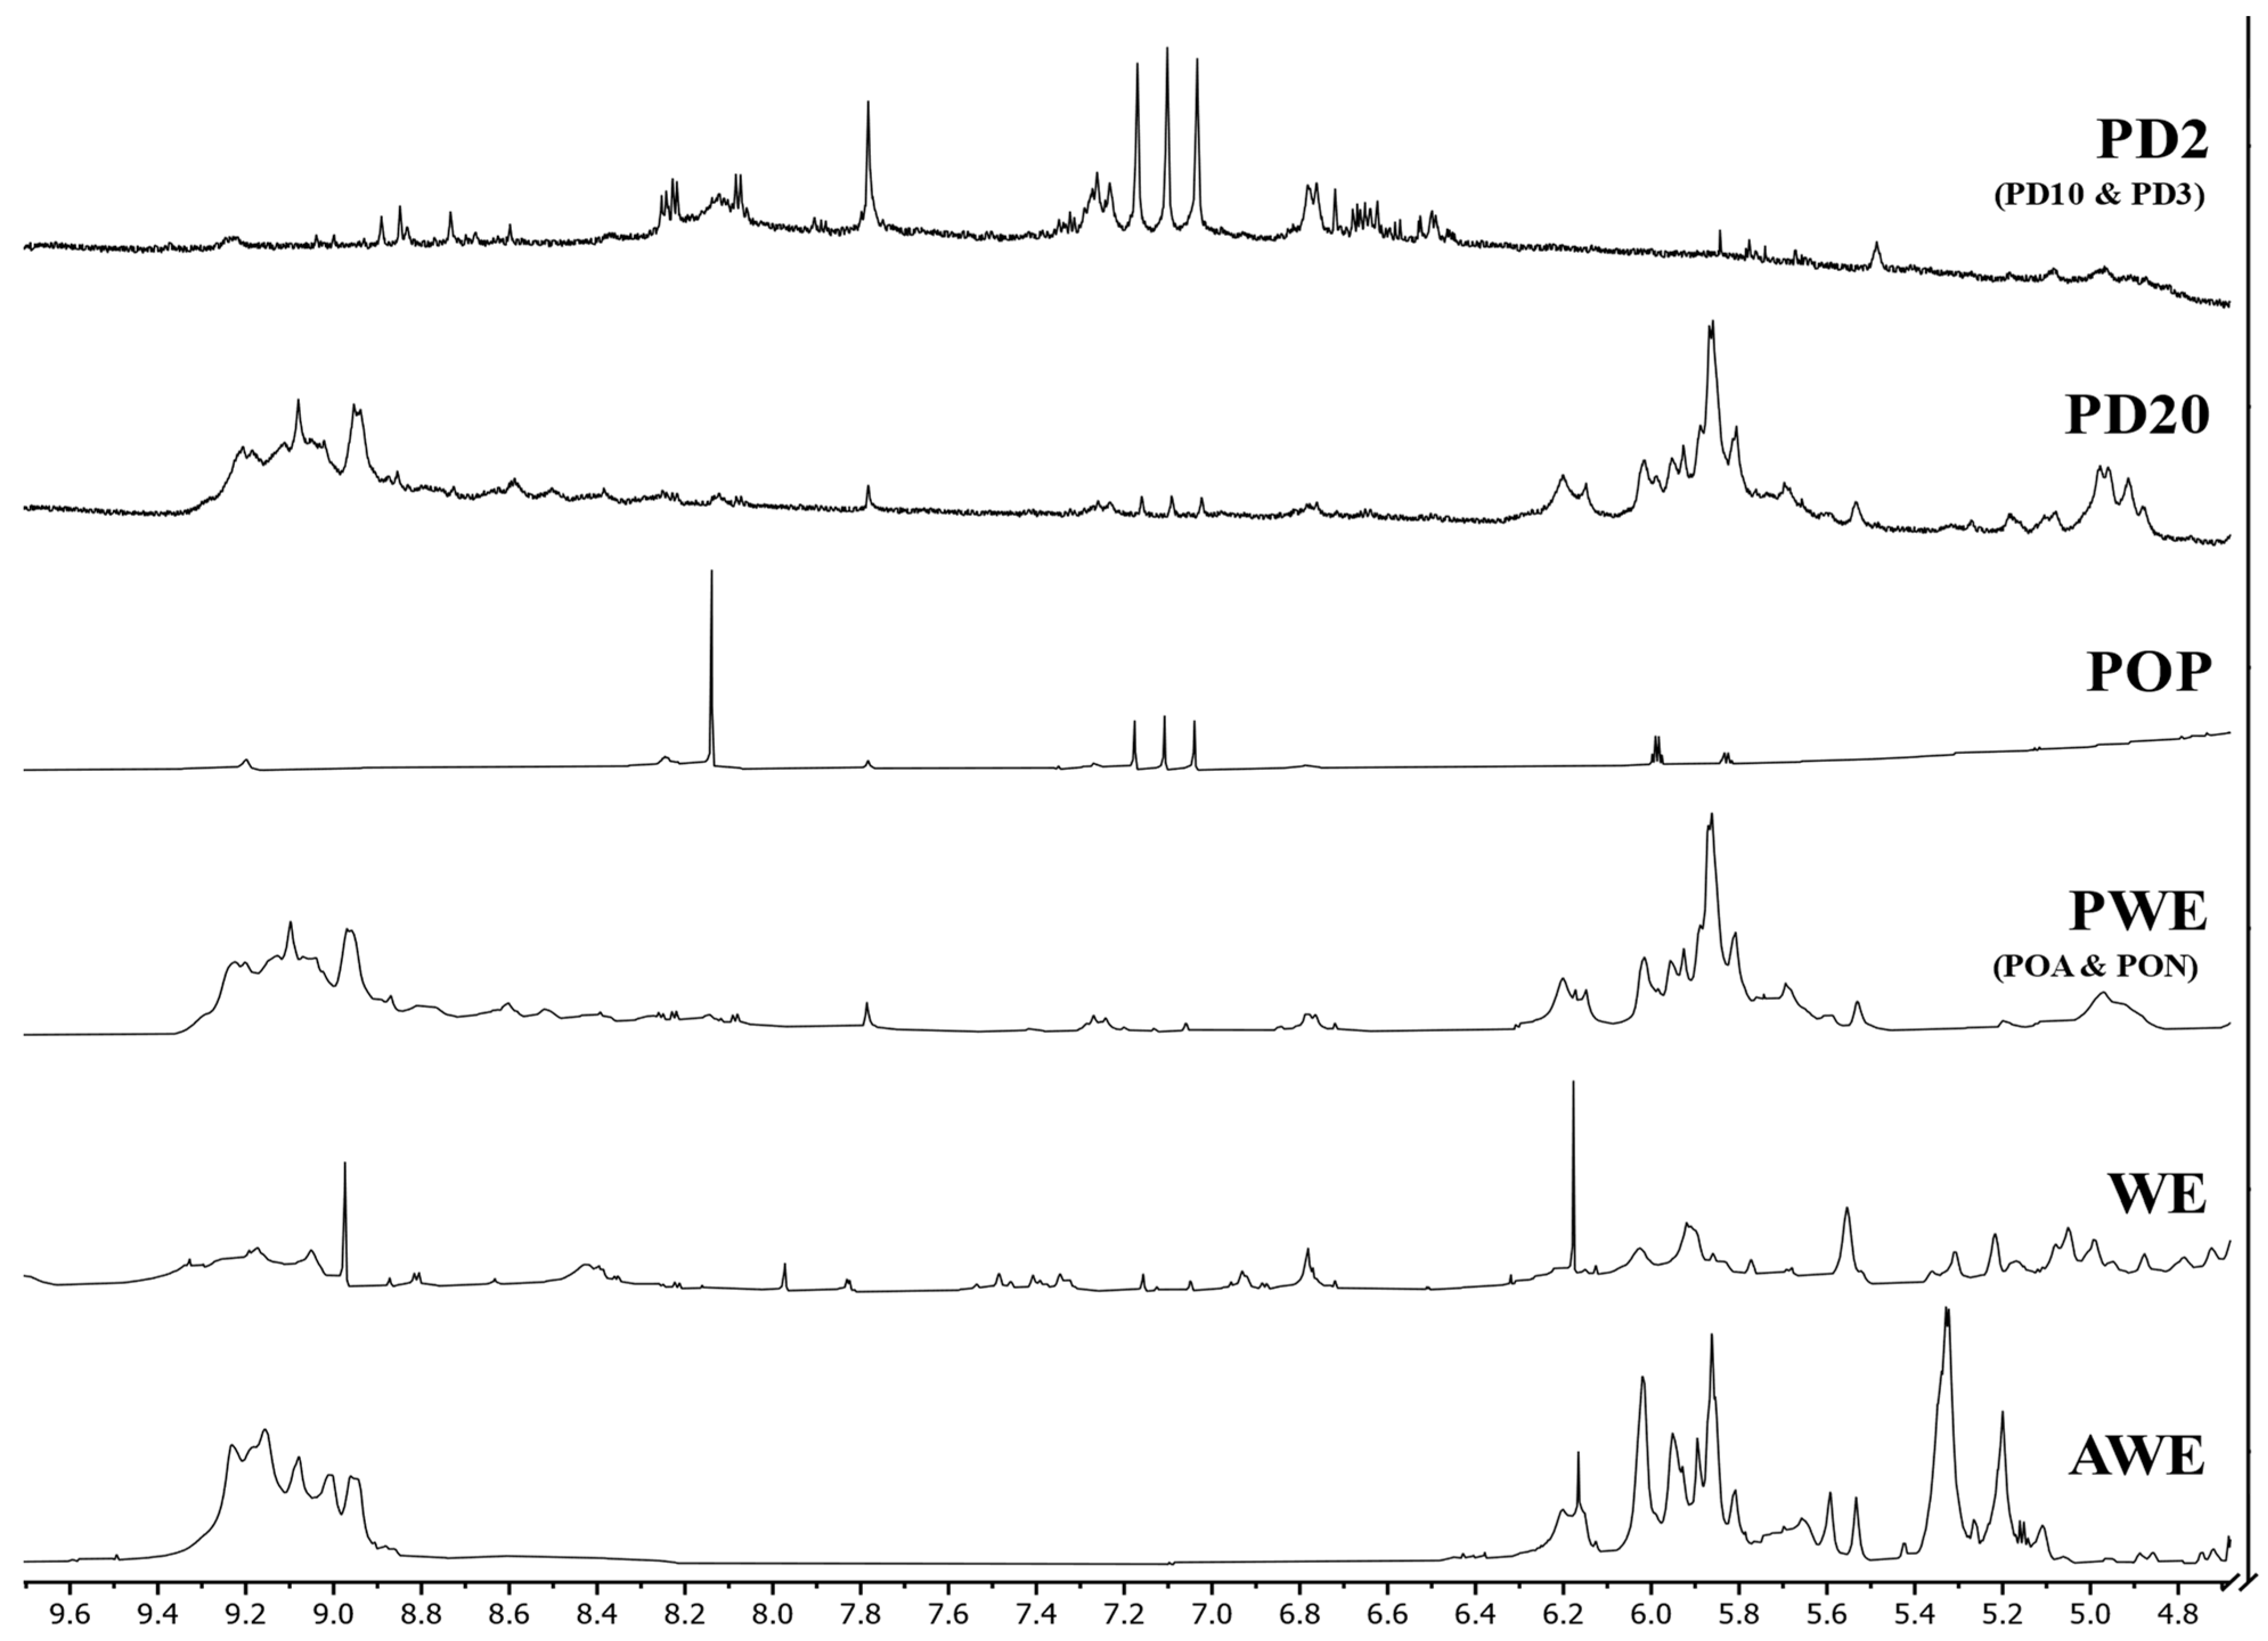
2.3.2. 1H-NMR
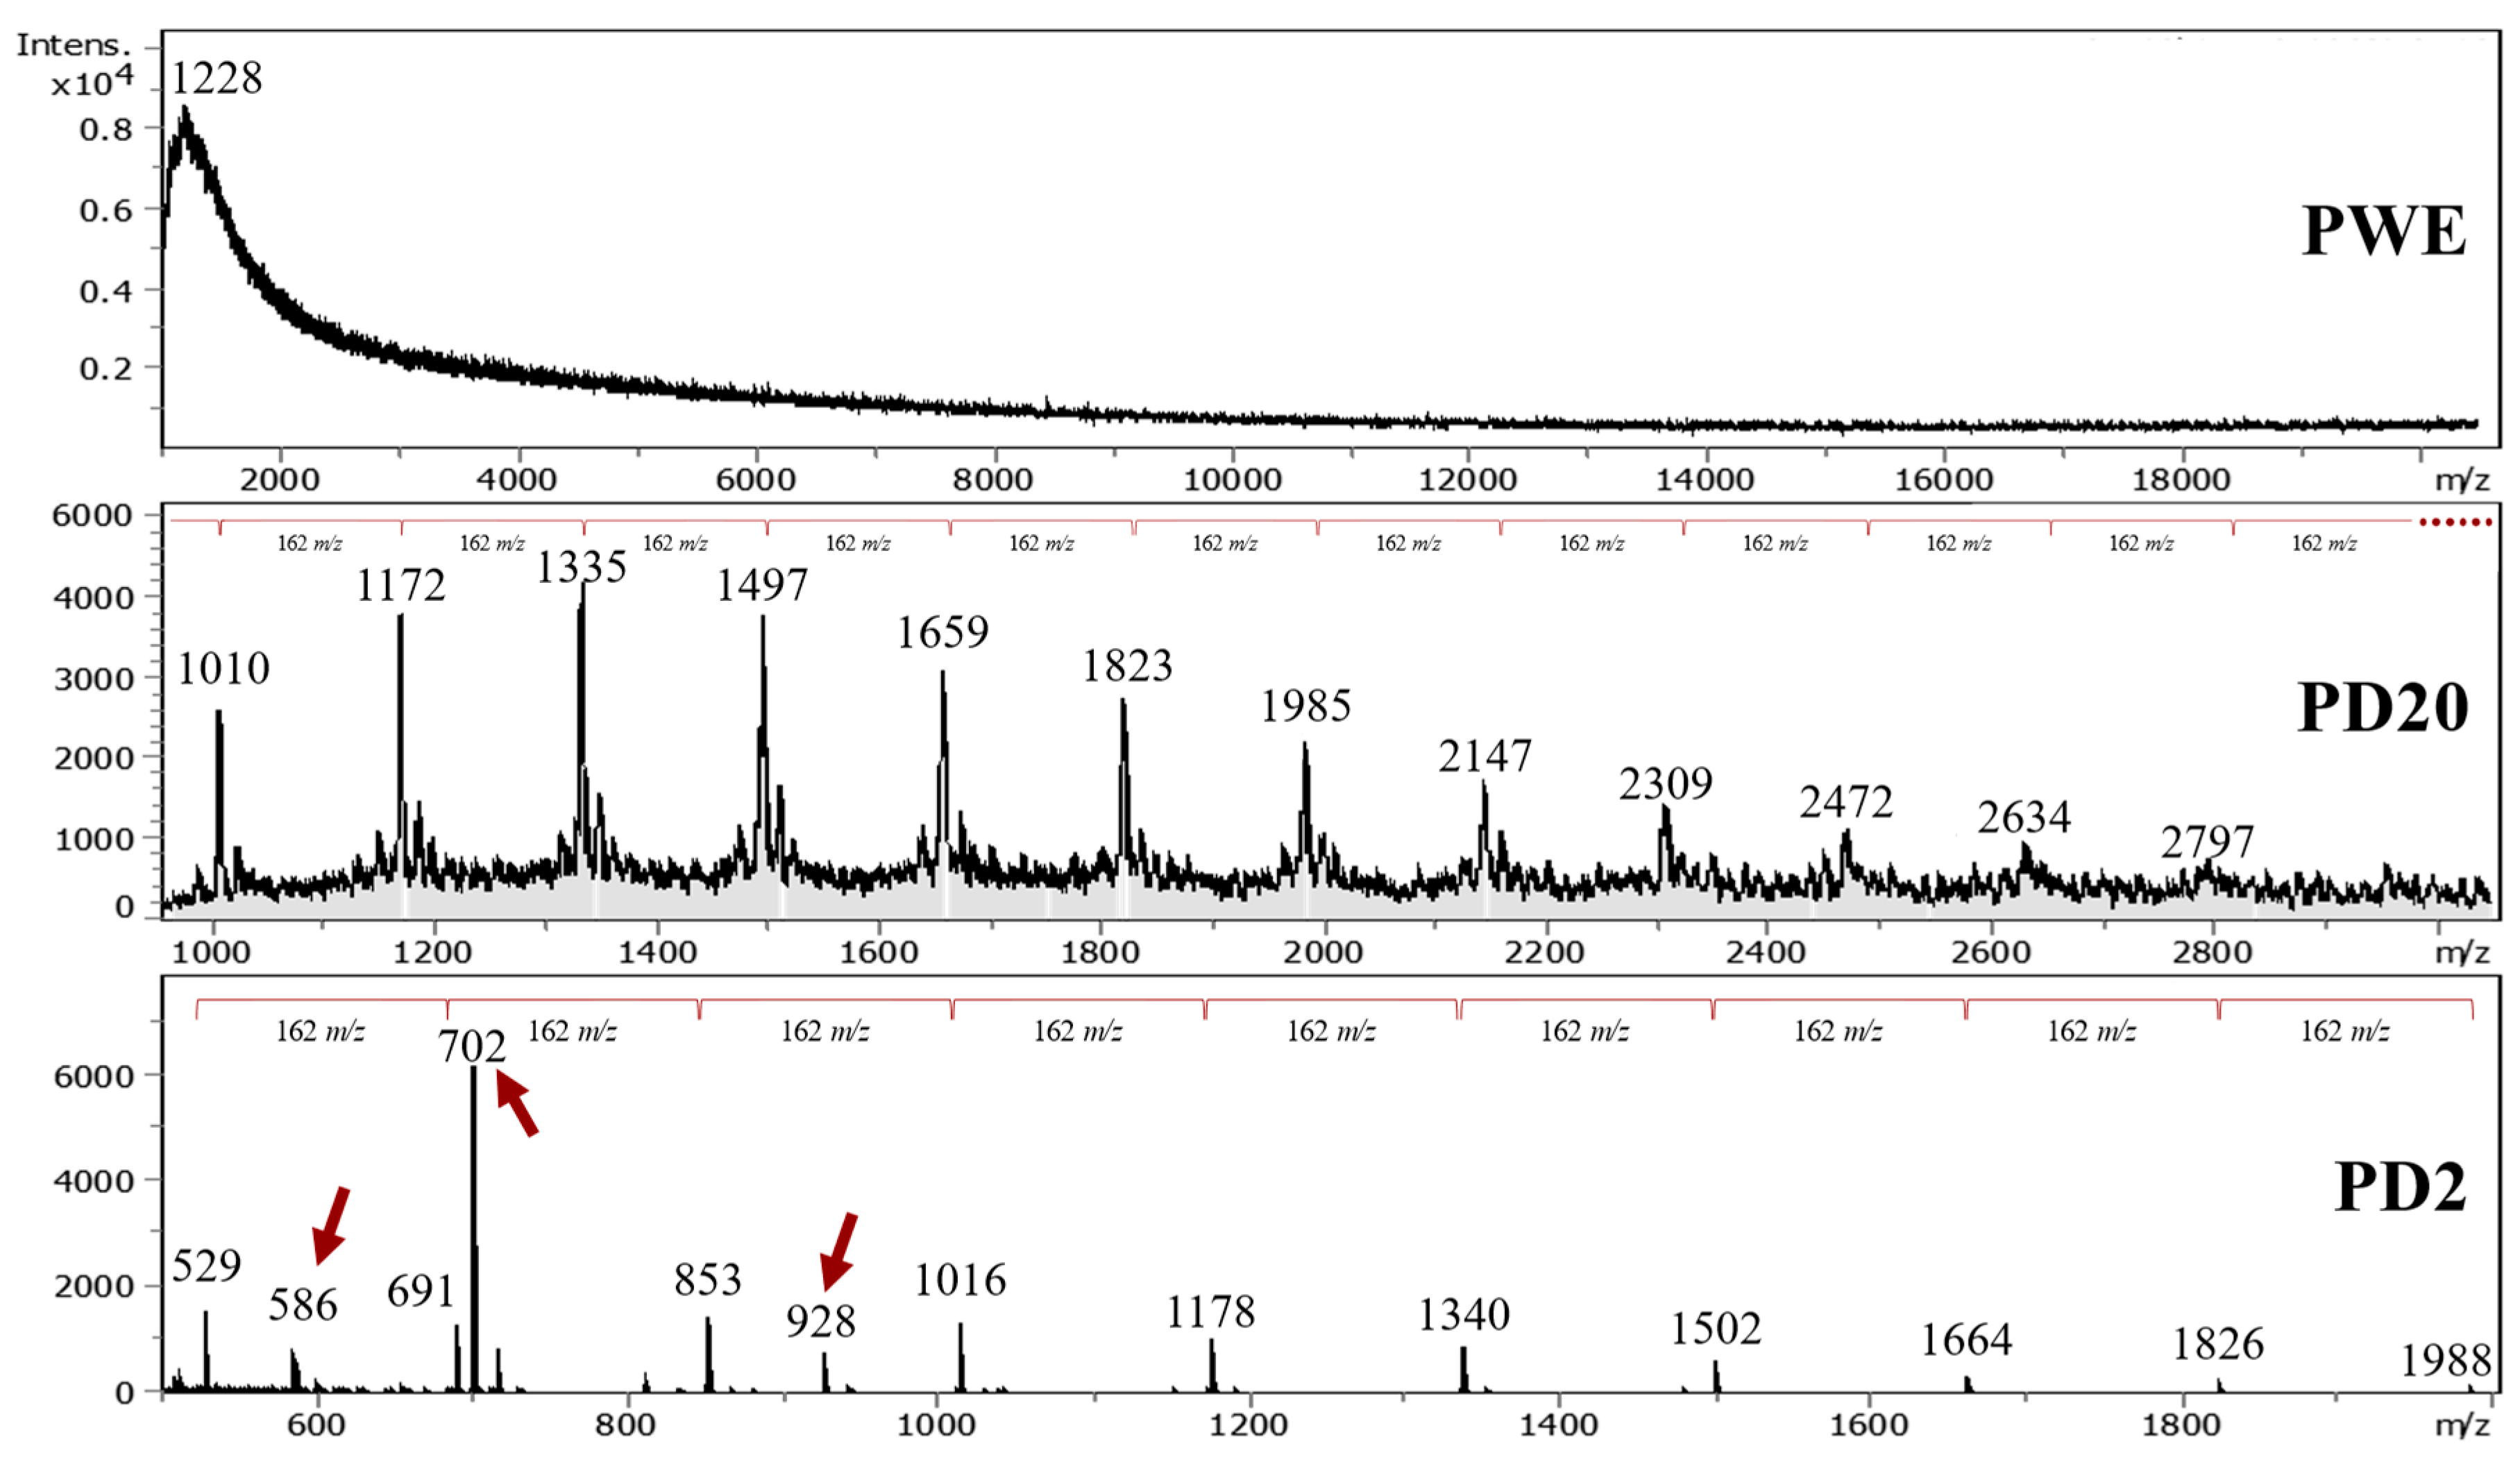
2.3.3. MALDI–TOF-MS
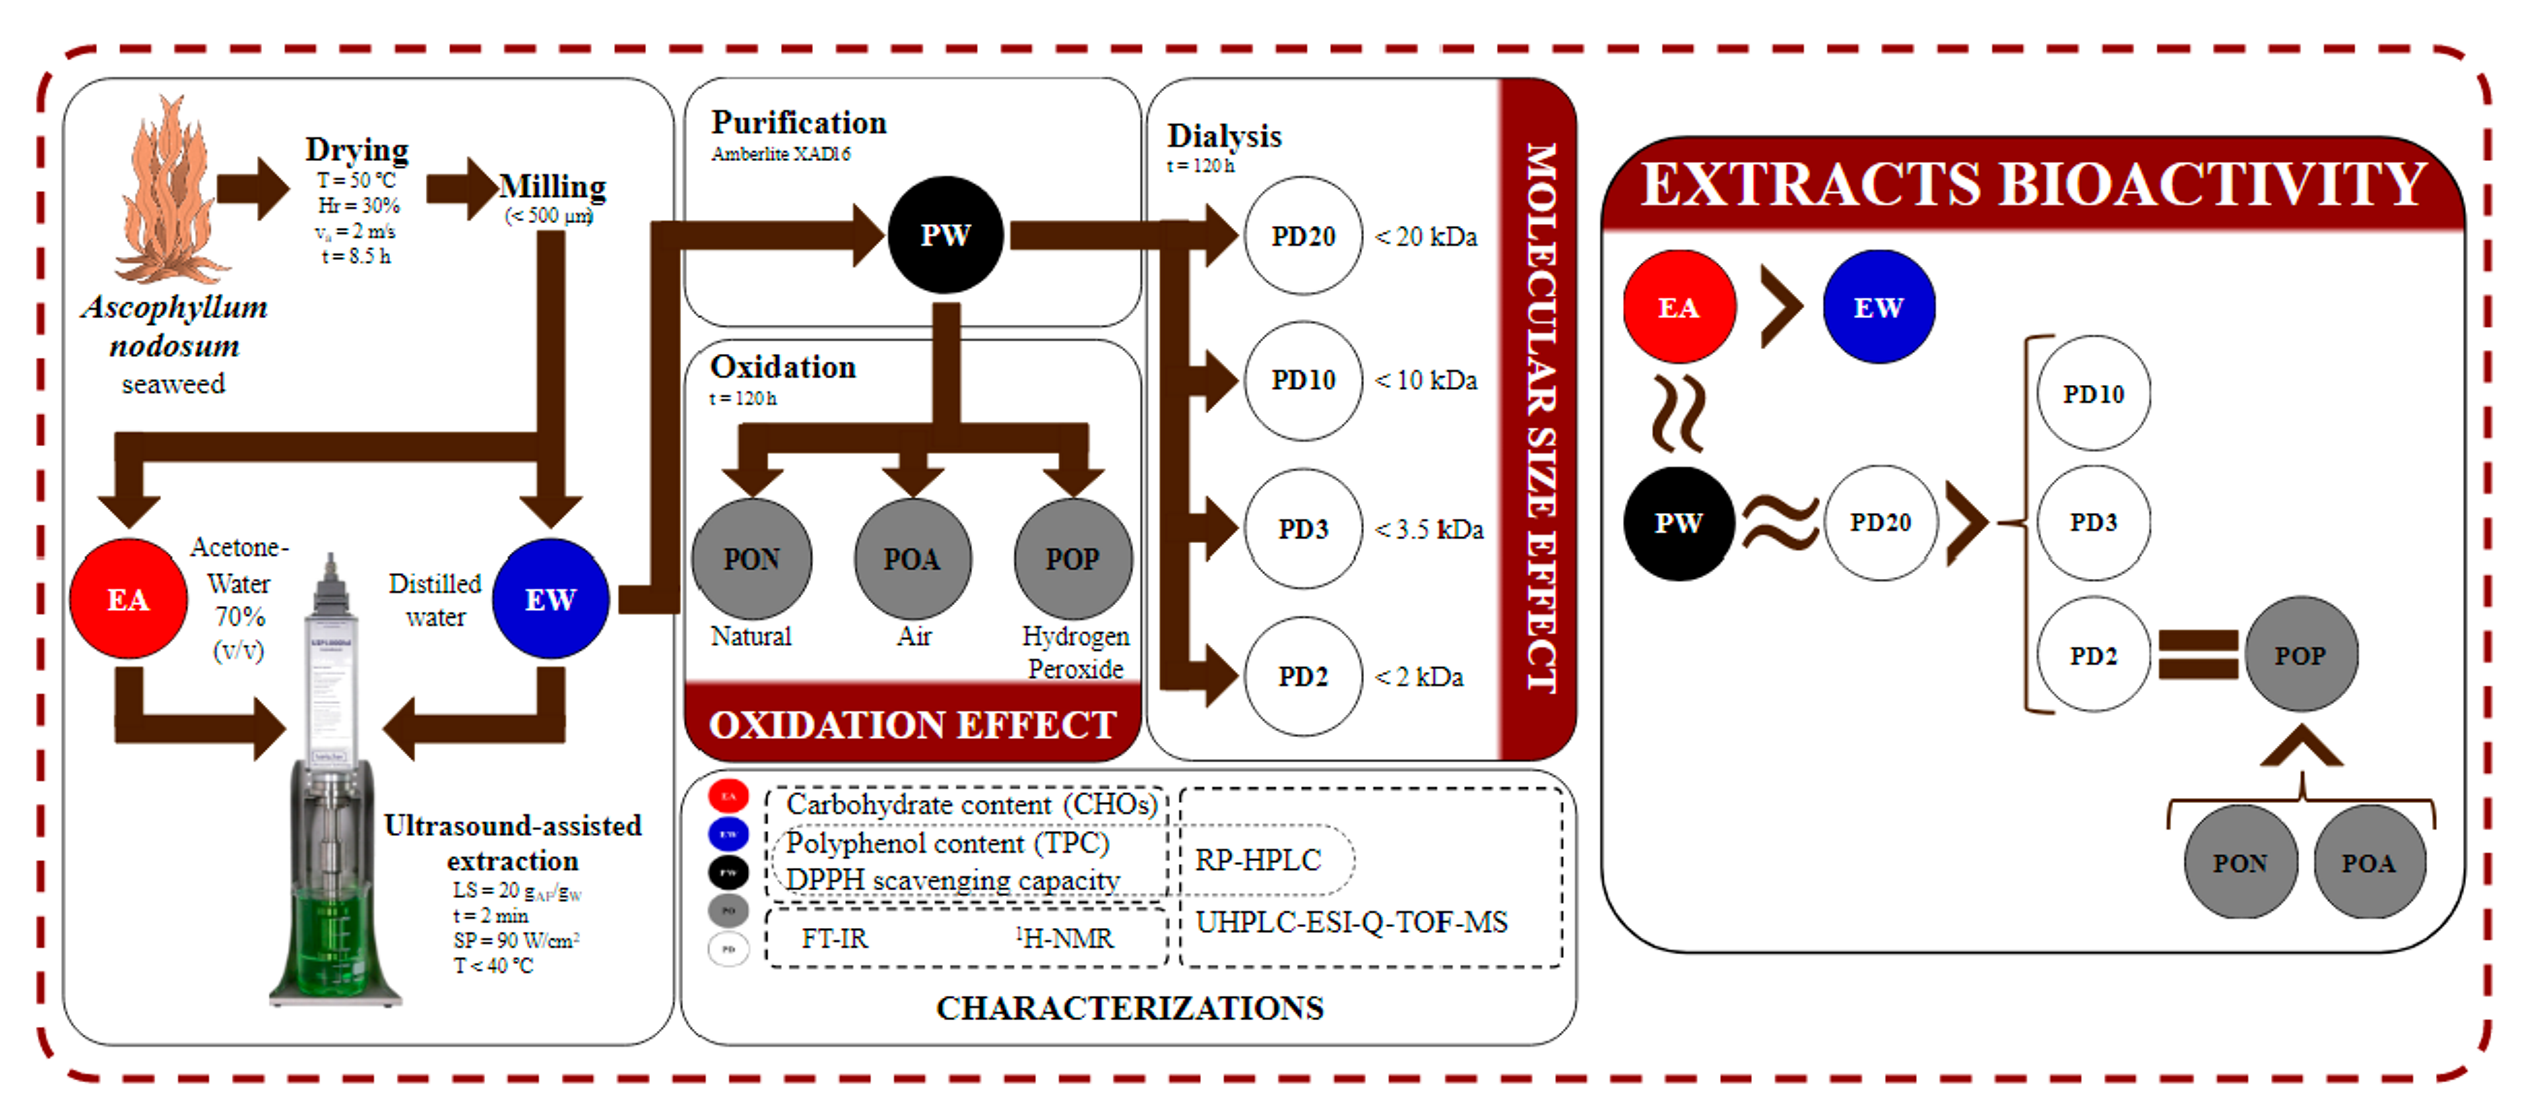
3. Materials and Methods
3.1. Chemicals
3.2. Raw Materials
3.3. Crude Extraction
3.4. Extract Purification
3.5. Extract Oxidation
3.6. Extract Dialysis
3.7. Phytochemical Characterization
3.8. RP-HPLC–UV
3.9. FTIR
3.10. 1H-NMR
3.11. MALDI–TOF-MS
3.12. Statistical Analysis
4. Conclusions
Supplementary Materials
Author Contributions
Funding
Data Availability Statement
Conflicts of Interest
References
- Koivikko, R.; Loponen, J.; Honkanen, T.; Jormalainen, V. Contents of soluble, cell–wall–bound, and exuded phlorotannins in the brown alga Fucus vesiculosus, with implications on their ecological functions. J. Chem. Ecol. 2005, 31, 195–212. [Google Scholar] [CrossRef] [PubMed] [Green Version]
- Ford, L.; Theodoridou, K.; Sheldrake, G.N.; Walsh, P.J. A critical review of analytical methods used for the chemical characterisation and quantification of phlorotannin compounds in brown seaweeds. Phytochem. Anal. 2019, 30, 587–599. [Google Scholar] [CrossRef] [PubMed]
- Tierney, M.S.; Smyth, T.J.; Rai, D.K.; Soler–Vila, A.; Croft, A.K.; Brunton, N. Enrichment of polyphenol contents and antioxidant activities of Irish brown macroalgae using food–friendly techniques based on polarity and molecular size. Food Chem. 2013, 139, 753–761. [Google Scholar] [CrossRef]
- Koivikko, R.; Loponen, J.; Honkanen, T.; Jormalainen, V. High–performance liquid chromatographic analysis of phlorotannins from the brown alga Fucus vesiculosus. Phytochem. Anal. 2007, 18, 326–332. [Google Scholar] [CrossRef]
- Parys, S.; Rosenbaum, A.; Kehraus, S.; Reher, G.; Glombitza, K.W.; König, G.M. Evaluation of quantitative methods for the determination of polyphenols in algal extracts. J. Nat. Prod. 2007, 70, 1865–1870. [Google Scholar] [CrossRef]
- Singh, I.; Bharate, S. Phlorogucinol compounds of natural origin. Nat. Prod. Rep. 2006, 23, 558–591. [Google Scholar] [CrossRef] [PubMed]
- Shibata, T.; Kawaguchi, S.; Hama, Y.; Inagaki, M.; Yamaguchi, K.; Nakamura, T. Local and chemical distribution of phlorotannins in brown algae. J. App. Phycol. 2004, 16, 291–296. [Google Scholar] [CrossRef]
- Steevensz, A.J.; MacKinnon, S.L.; Hankinson, R.; Craft, C.; Connan, S.; Stengel, D.B.; Melansona, J.E. Profiling phlorotannins in brown macroalgae by liquid chromatography–high resolution mass spectrometry. Phytochem. Anal. 2012, 23, 547–553. [Google Scholar] [CrossRef]
- Breton, F.; Cérantola, S.; Ar Gall, E. Distribution and radical scavenging activity of phenols in Ascophyllum nodosum (Phaeophyceae). J. Exp. Mar. Biol. Ecol. 2011, 399, 167–172. [Google Scholar] [CrossRef]
- Aleixandre, A.; Gisbert, M.; Sineiro, J.; Moreira, R.; Rosell, C.M. In vitro inhibition of starch digestive enzymes by ultrasound–assisted extracted polyphenols from Ascophyllum nodosum seaweeds. J. Food Sci. 2022, 87, 2405–2416. [Google Scholar] [CrossRef]
- Xu, L.; Li, Y.; Dai, Y.; Peng, J. Natural products for the treatment of type 2 diabetes mellitus: Pharmacology and mechanisms. Pharmacol. Res. 2018, 130, 451–465. [Google Scholar] [CrossRef] [PubMed]
- Lund, M.N. Reactions of plant polyphenols in foods: Impact of molecular structure. Trends Food Sci. Technol. 2021, 121, 241–251. [Google Scholar] [CrossRef]
- Zhang, D.; Wang, C.; Shen, L.; Shin, H.C.; Lee, K.B.; Jif, B. Comparative analysis of oxidative mechanisms of phloroglucinol and dieckol by electrochemical, spectroscopic, cellular and computational methods. RSC Adv. 2018, 8, 1963–1972. [Google Scholar] [CrossRef] [PubMed] [Green Version]
- Gisbert, M.; Barcala, M.; Rosell, C.M.; Sineiro, J.; Moreira, R. Aqueous extracts characteristics obtained by ultrasound–assisted extraction from Ascophyllum nodosum seaweeds: Effect of operation conditions. J. Appl. Phycol. 2021, 33, 3297–3308. [Google Scholar] [CrossRef]
- Obluchinskaya, E.D.; Pozharitskaya, O.N.; Zakharova, L.V.; Daurtseva, A.V.; Flisyuk, E.V.; Shikov, A.N. Efficacy of natural deep eutectic solvents for extraction of hydrophilic and lipophilic compounds from Fucus vesiculosus. Molecules 2021, 26, 4198. [Google Scholar] [CrossRef]
- Zhu, Z.; Wu, Q.; Di, X.; Li, S.; Barba, F.J.; Koubaa, M.; Roohinejad, S.; Xiong, X.; He, J. Multistage recovery process of seaweed pigments: Investigation of ultrasound–assisted extraction and ultra–filtration performances. Food Bioprod. Process 2017, 104, 40–47. [Google Scholar] [CrossRef]
- Kadam, S.U.; O’Donnell, C.P.; Rai, D.K.; Hossain, M.B.; Burgess, C.M.; Walsh, D.; Tiwari, B.K. Laminarin from Irish brown seaweeds Ascophyllum nodosum and Laminaria hyperborea: Ultrasound assisted extraction, characterisation, and bioactivity. Mar. Drugs 2015, 13, 4270–4280. [Google Scholar] [CrossRef] [Green Version]
- Catarino, M.D.; Silva, A.; Mateus, N.; Cardoso, S.M. Optimization of phlorotannins extraction from Fucus vesiculosus and evaluation of their potential to prevent metabolic disorders, Mar. Drugs 2019, 17, 162. [Google Scholar] [CrossRef] [Green Version]
- Wang, J.; Hu, S.; Nie, S.; Yu, Q.; Xie, M. Reviews on mechanisms of in vitro antioxidant activity of polysaccharides. Oxidative Med. Cell. Longev. 2016, 5692852. [Google Scholar] [CrossRef] [Green Version]
- Allwood, J.W.; Evans, H.; Austin, C.; McDougall, G.J. Extraction, enrichment, and LC–MSn–based characterization of phlorotannins and related phenolics from the brown seaweed, Ascophyllum nodosum. Mar. Drugs 2020, 18, 448. [Google Scholar] [CrossRef]
- Tierney, M.S.; Soler–Vila, A.; Rai, D.K.; Croft, A.K.; Brunton, N.P.; Smyth, T.J. UPLC–MS profiling of low molecular weight phlorotannin polymers in Ascophyllum nodosum, Pelvetia canaliculata and Fucus spiralis. Metabolomics 2014, 10, 524–535. [Google Scholar] [CrossRef]
- Wang, T.; Jonsdottir, R.; Olafsdottir, G. Total phenolic compounds, radical scavenging and metal chelation of extracts from Icelandic seaweeds. Food Chem. 2009, 116, 240–248. [Google Scholar] [CrossRef]
- Zhang, J.; Tiller, C.; Shen, J.; Wang, C.; Girouard, G.S.; Dennis, D.; Barrow, C.J.; Miao, M.; Stewart, H.S. Antidiabetic properties pf polysaccharide– polyphenolic– enriched fractions from the brown seaweed Ascophyllum nodosum. Can. J. Physiol. Pharm. 2007, 85, 1116–1127. [Google Scholar] [CrossRef] [PubMed] [Green Version]
- Ummat, V.; Tiwari, B.K.; Jaiswal, A.K.; Condon, K.; Garcia–Vaquero, M.; O’Doherty, J.; O’Donnell, C.; Rajauria, G. Optimization of ultrasound frequency, extraction time and solvent for the recovery of polyphenols, phlorotannins and associated antioxidant activity of brown seaweeds. Mar. Drugs 2020, 18, 250. [Google Scholar] [CrossRef]
- Hermund, D.B.; Plaza, M.; Turner, C.; Jónsdóttir, R.; Kristinsson, H.G.; Jacobsen, C.; Nielsen, K.F. Structure dependent antioxidant capacity of phlorotannins from Icelandic Fucus vesiculosus by UHPLC-DAD-ECD-QTOFMS. Food Chem. 2018, 240, 904–909. [Google Scholar] [CrossRef] [Green Version]
- Montes, L.; Gisbert, M.; Hinojosa, I.; Sineiro, J.; Moreira, R. Impact of drying on the sodium alginate obtained after polyphenols ultrasound–assisted extraction from Ascophyllum nodosum seaweeds. Carbohydr. Polym. 2021, 272, 118455. [Google Scholar] [CrossRef]
- Audibert, L.; Fauchon, M.; Blanc, N.; Hauchard, D.; Ar Gall, E. Phenolic compounds in the brown seaweed Ascophyllum nodosum: Distribution and radical–scavenging activities. Phytochem. Anal. 2010, 21, 399–405. [Google Scholar] [CrossRef]
- Connan, S.; Goulard, F.; Stiger, V.; Deslandes, E.; Ar Gall, E. Interspecific and temporal variation in phlorotannin levels in an assemblage of brown algae. Bot. Mar. 2004, 47, 410–416. [Google Scholar] [CrossRef]
- Kubanek, J.; Lester, S.E.; Fenical, W.; Hay, M.E. Ambiguous role of phlorotannins as chemical defenses in the brown alga Fucus vesiculosus. Mar. Ecol. Prog. Ser. 2004, 277, 79–93. [Google Scholar] [CrossRef]
- Paiva, L.; Lima, E.; Neto, A.I.; Baptista, J. Angiotensin I–Converting Enzyme (ACE) Inhibitory activity, antioxidant properties, phenolic content and amino acid profiles of Fucus spiralis L. protein hydrolysate fractions. Mar. Drugs 2017, 15, 311. [Google Scholar] [CrossRef]
- Bogolitsyn, K.; Dobrodeeva, L.; Druzhinina, A.; Ovchinnikov, D.; Parshina, A.; Shulgina, E. Biological activity of a phenolic complex of Artic brown algae. J. Appl. Phycol. 2019, 32, 4277–4287. [Google Scholar] [CrossRef]
- Ertani, A.; Francioso, O.; Tinti, A.; Schiavon, M.; Pizzeghello, D.; Nardi, S. Evaluation of seaweed extracts from Laminaria and Ascophyllum nodosum spp. as biostimulants in Zea mays L. using a combination of chemical, biochemical and morphological approaches. Front. Plant Sci. 2018, 9, 428. [Google Scholar] [CrossRef] [PubMed]
- Hesse, M.; Meier, H.; Zeeh, B. Infrared spectroscopie and Raman. In Spektroskopische Methoden in der Organischen, 7th ed.; Thieme Verlag: Stuttgart, Germany, 2005; pp. 50–82. [Google Scholar]
- Vissers, A.M.; Caligiani, A.; Sforza, S.; Vincken, J.P.; Gruppen, H. Phlorotannin composition of Laminaria digitata. Phytochem. Anal. 2017, 28, 487–495. [Google Scholar] [CrossRef] [Green Version]
- Zhang, Q.; Li, N.; Liu, X.; Zhao, Z.; Li, Z.; Xu, Z. The structure of a sulfated galactan from Porphyra haitanensis and its in vivo antioxidant activity. Carbohydr. Res. 2004, 339, 105–111. [Google Scholar] [CrossRef] [PubMed]
- Sardari, R.R.R.; Prothman, J.; Gregersen, O.; Turner, C.; Karlsson, E.N. Identification of phlorotannins in the brown algae, Saccharina latissima and Ascophyllum nodosum by ultra–high–performance liquid chromatography coupled to high–resolution tandem mass spectrometry. Molecules 2021, 26, 43. [Google Scholar] [CrossRef] [PubMed]
- Lopes, G.; Barbosa, M.; Vallejo, F.; Gil–Izquierdo, Á.; Andrade, P.B.; Valentão, P.; Pereira, D.M.; Ferreres, F. Profiling phlorotannins from Fucus spp. of the Northern Portuguese coastline: Chemical approach by HPLC–DAD–ESI/MSn and UPLC–ESI–QTOF/MS. Algal Res. 2018, 29, 113–120. [Google Scholar] [CrossRef]
- Heffernan, N.; Brunton, N.P.; FitzGerald, R.J.; Smyth, T.J. Profiling of the molecular weight and structural isomer abundance of macroalgae–derived phlorotannins. Mar. Drugs 2015, 13, 509–528. [Google Scholar] [CrossRef] [PubMed] [Green Version]
- Corona, G.; Ji, Y.; Anegboonlap, P.; Hotchkiss, S.; Gill, C.; Yaqoob, P.; Spencer, J.P.E.; Rowland, I. Gastrointestinal modifications and bioavailability of brown seaweed phlorotannins and effects on inflammatory markers. Br. J. Nutr. 2016, 115, 1240–1253. [Google Scholar] [CrossRef] [PubMed] [Green Version]
- Nwosu, F.; Morris, J.; Lund, V.A.; Stewart, D.; Ross, H.A.; McDougall, G.J. Anti–proliferative and potential anti–diabetic effects of phenolic–rich extracts from edible marine algae. Food Chem. 2011, 126, 1006–1012. [Google Scholar] [CrossRef]
- Gonçalves-Fernández, C.; Sineiro, J.; Moreira, R.; Gualillo, O. Extraction and characterization of phlorotannin-enriched fractions from the Atlantic seaweed Bifurcaria bifurcata and evaluation of their cytotoxic activity in murine cell line. J. App. Phycol. 2019, 31, 2573–2583. [Google Scholar] [CrossRef]


| Literature Reference | Seaweed spp. | Main DP Range |
|---|---|---|
| This study (PD2) | A. nodosum | 4–17 |
| Steevensz et al. [8] | A. nodosum | 4–39 |
| Allwood et al. [10] | A. nodosum | 11–18 |
| Kadam et al. [17] | A. nodosum | 4–12 |
| Tierney et al. [21] | A. nodosum | 6–11 |
| Sardari et al. [36] | A. nodosum | 3–6 |
| Catarino et al. [18] | Fucus vesiculosus | 5–10 |
| Bogolitsyn et al. [31] | Fucus vesiculosus | 3–8 |
| Lopes et al. [37] | Fucus vesiculosus | 3–6 |
| Hefferman et al. [38] | Fucus vesiculosus | 3–16 |
| Vissers et al. [34] | Laminaria digitata | 3–27 |
| Formula | Steevensz et al. [8] | [H2O] Loss | This Study (m/z) | DP |
|---|---|---|---|---|
| C30H22O15 | 621 | 5 | 529 a | 4 |
| 621 | 2 | 586 b | 4 | |
| C36H26O18 | 745 | 3 | 691 a | 5 |
| C84H58O42 | 868 | 1 | 853 a | 5 |
| C90H62O45 | 930 | 0 | 927 c | 6 |
| C150H102O75 | 1033 | 1 | 1015 a | 6 |
| C114H78O57 | 1178 | 0 | 1177 a | 7 |
| C264H178O132 | 1364 | 1 | 1339 a | 8 |
| C294H198O147 | 1519 | 1 | 1501 a | 9 |
Publisher’s Note: MDPI stays neutral with regard to jurisdictional claims in published maps and institutional affiliations. |
© 2022 by the authors. Licensee MDPI, Basel, Switzerland. This article is an open access article distributed under the terms and conditions of the Creative Commons Attribution (CC BY) license (https://creativecommons.org/licenses/by/4.0/).
Share and Cite
Gisbert, M.; Sineiro, J.; Moreira, R. Influence of Oxidation and Dialysis of Phlorotannins on Bioactivity and Composition of Ultrasound-Assisted Extracts from Ascophyllum nodosum. Mar. Drugs 2022, 20, 706. https://doi.org/10.3390/md20110706
Gisbert M, Sineiro J, Moreira R. Influence of Oxidation and Dialysis of Phlorotannins on Bioactivity and Composition of Ultrasound-Assisted Extracts from Ascophyllum nodosum. Marine Drugs. 2022; 20(11):706. https://doi.org/10.3390/md20110706
Chicago/Turabian StyleGisbert, Mauro, Jorge Sineiro, and Ramón Moreira. 2022. "Influence of Oxidation and Dialysis of Phlorotannins on Bioactivity and Composition of Ultrasound-Assisted Extracts from Ascophyllum nodosum" Marine Drugs 20, no. 11: 706. https://doi.org/10.3390/md20110706