
Uncovering the Bioactive Potential of a Cyanobacterial Natural Products Library Aided by Untargeted Metabolomics

 , ,
, ,  , , and
Abstract
:1. Introduction
2. Results and Discussion
2.1. Cyanobacterial Natural Products Library (LEGE-NPL)
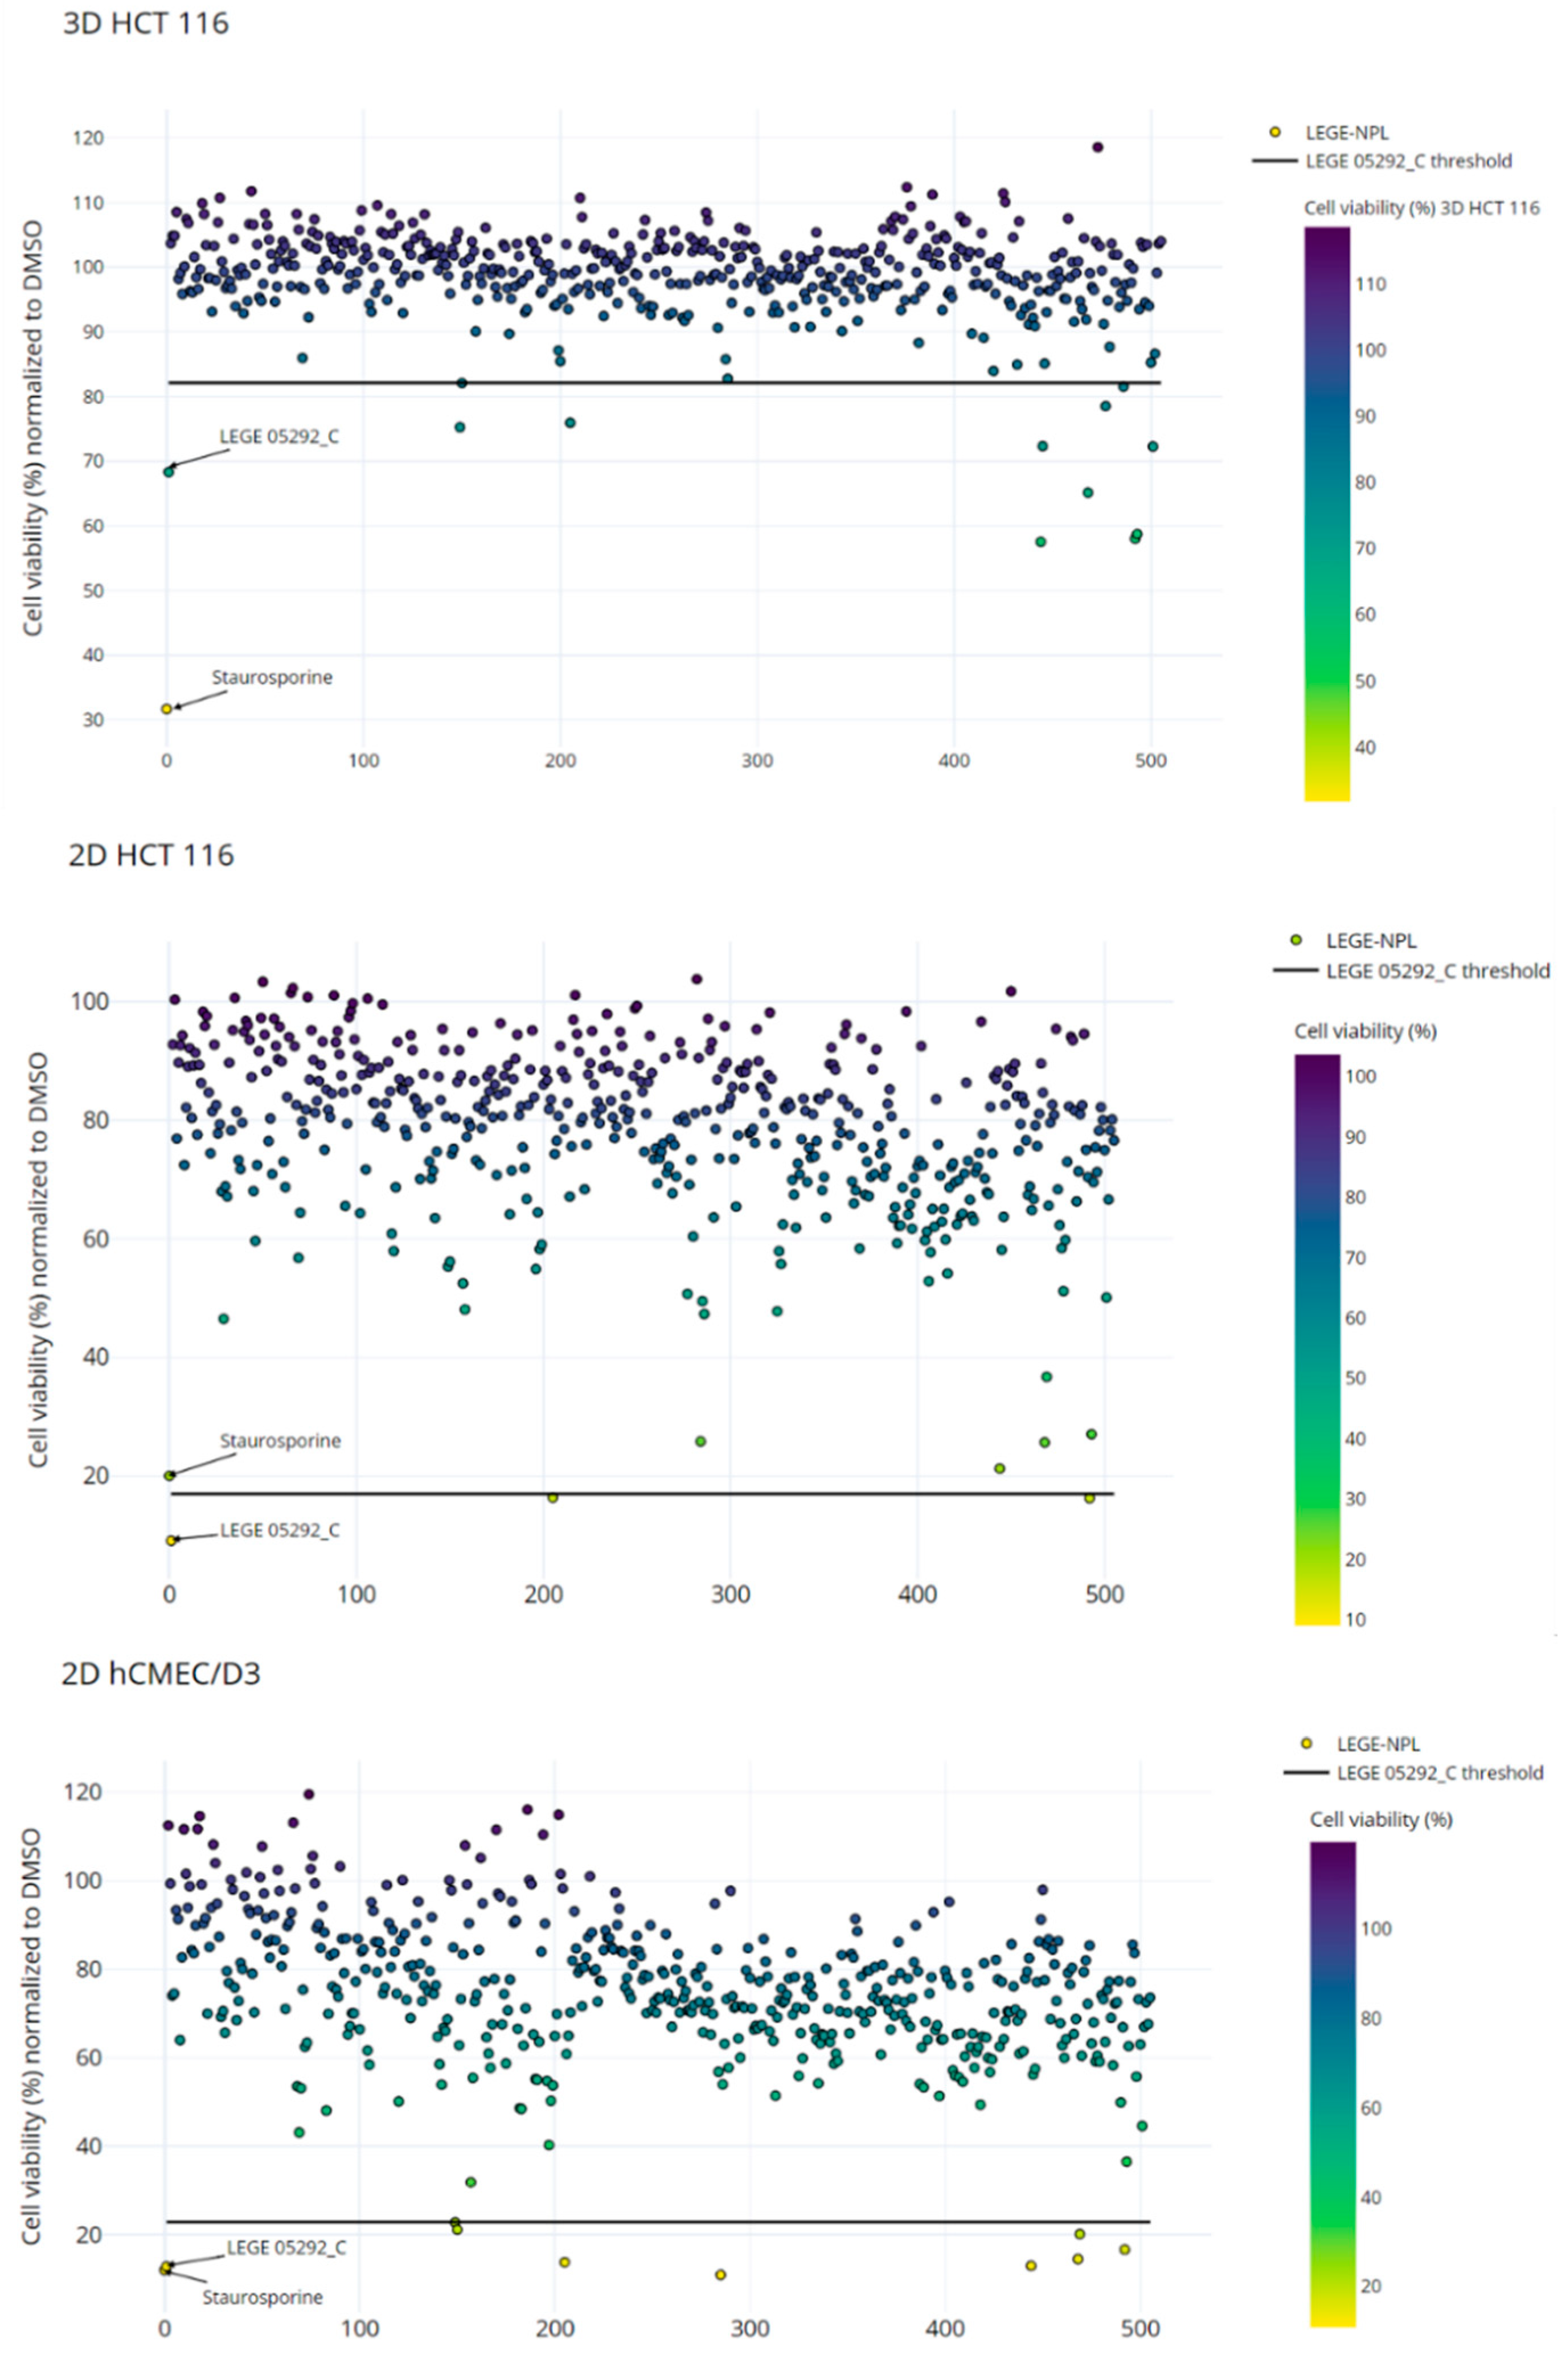
2.2. Bioactivity Screening
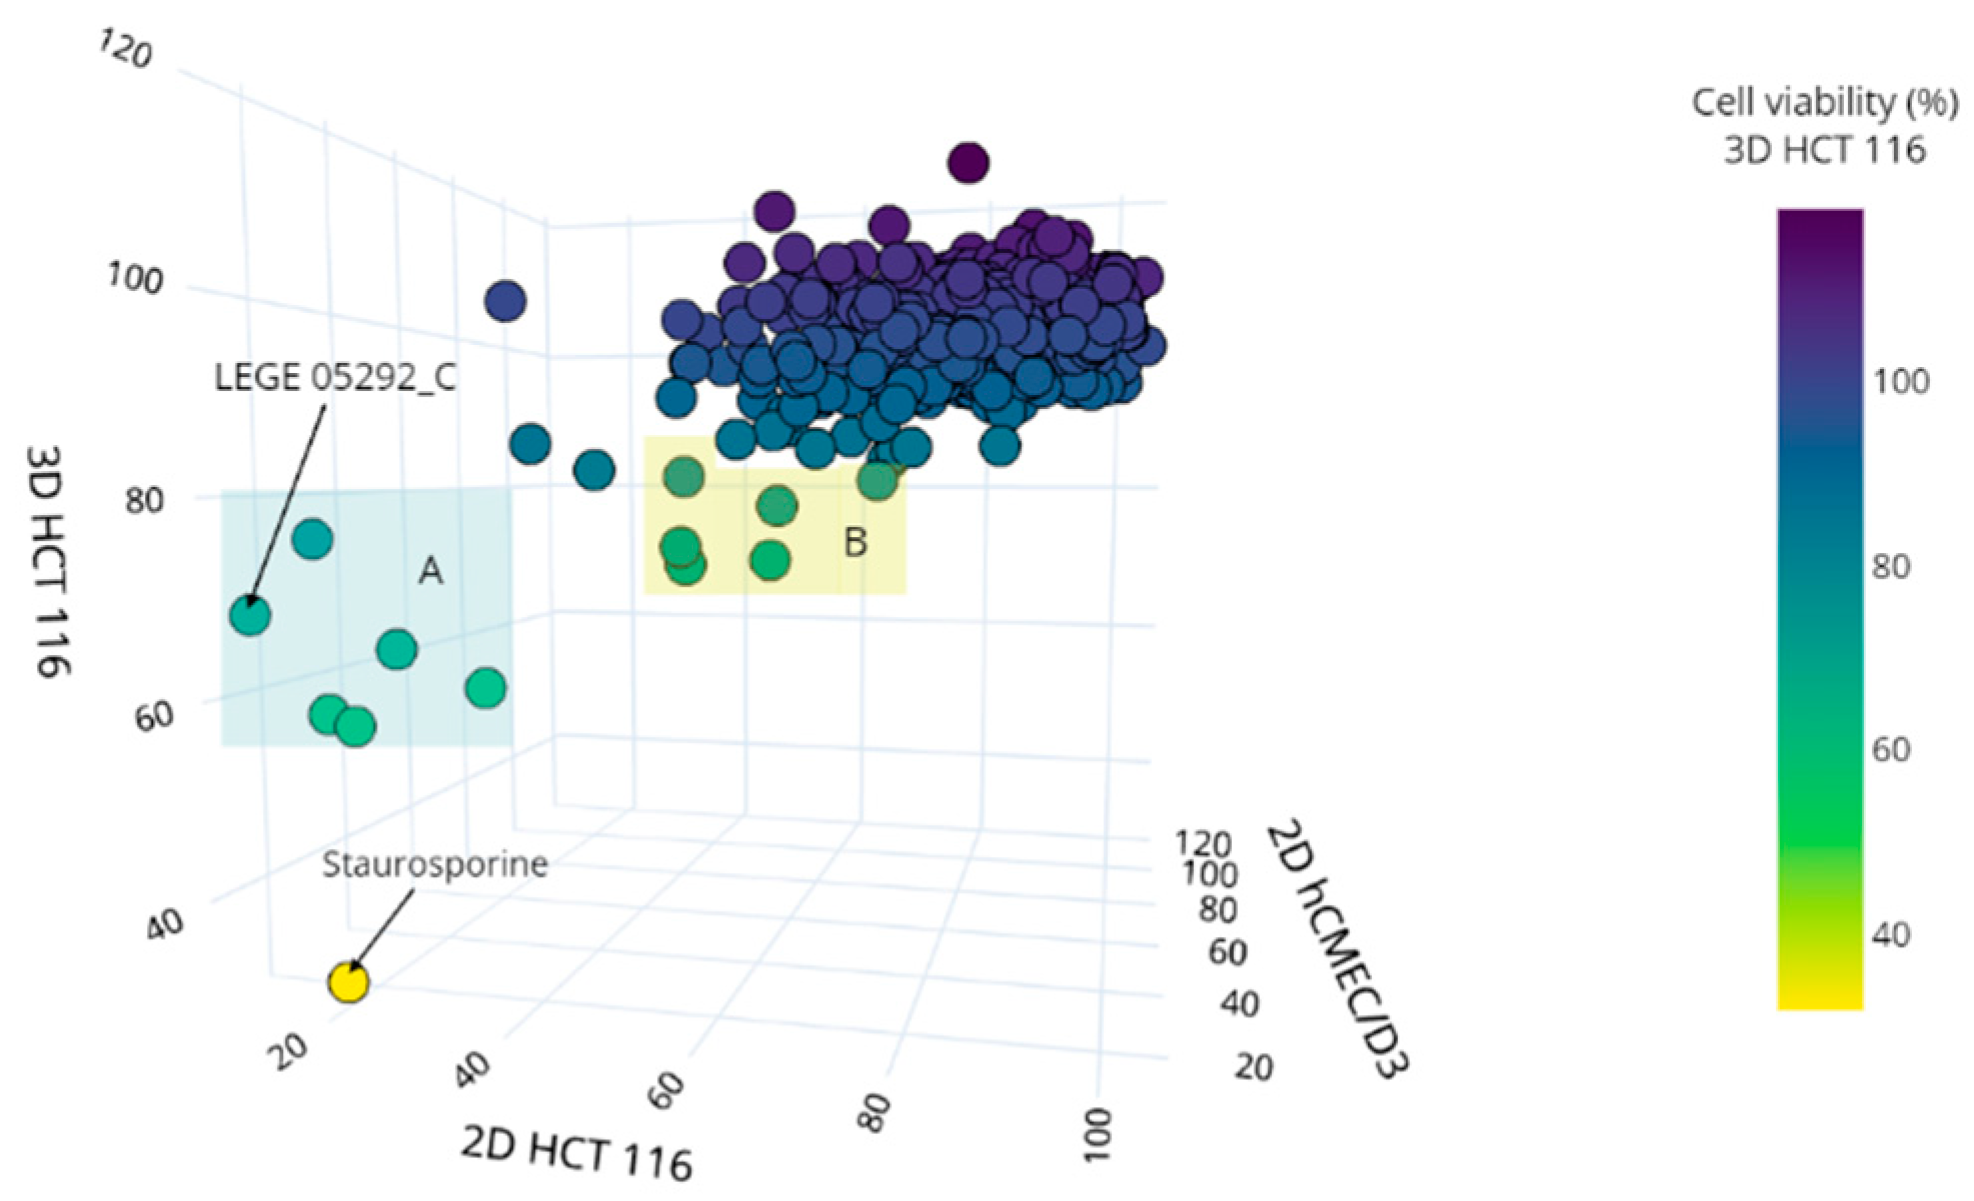
2.3. Group A: Metabolomics Analysis and Dereplication of the Putative Active Molecules
2.4. Group B: Metabolomics Analysis and Dereplication of the Putative Active Molecules
3. Materials and Methods
3.1. Cyanobacteria Culture Conditions
3.2. DNA Extraction, Amplification (PCR) and Sequencing
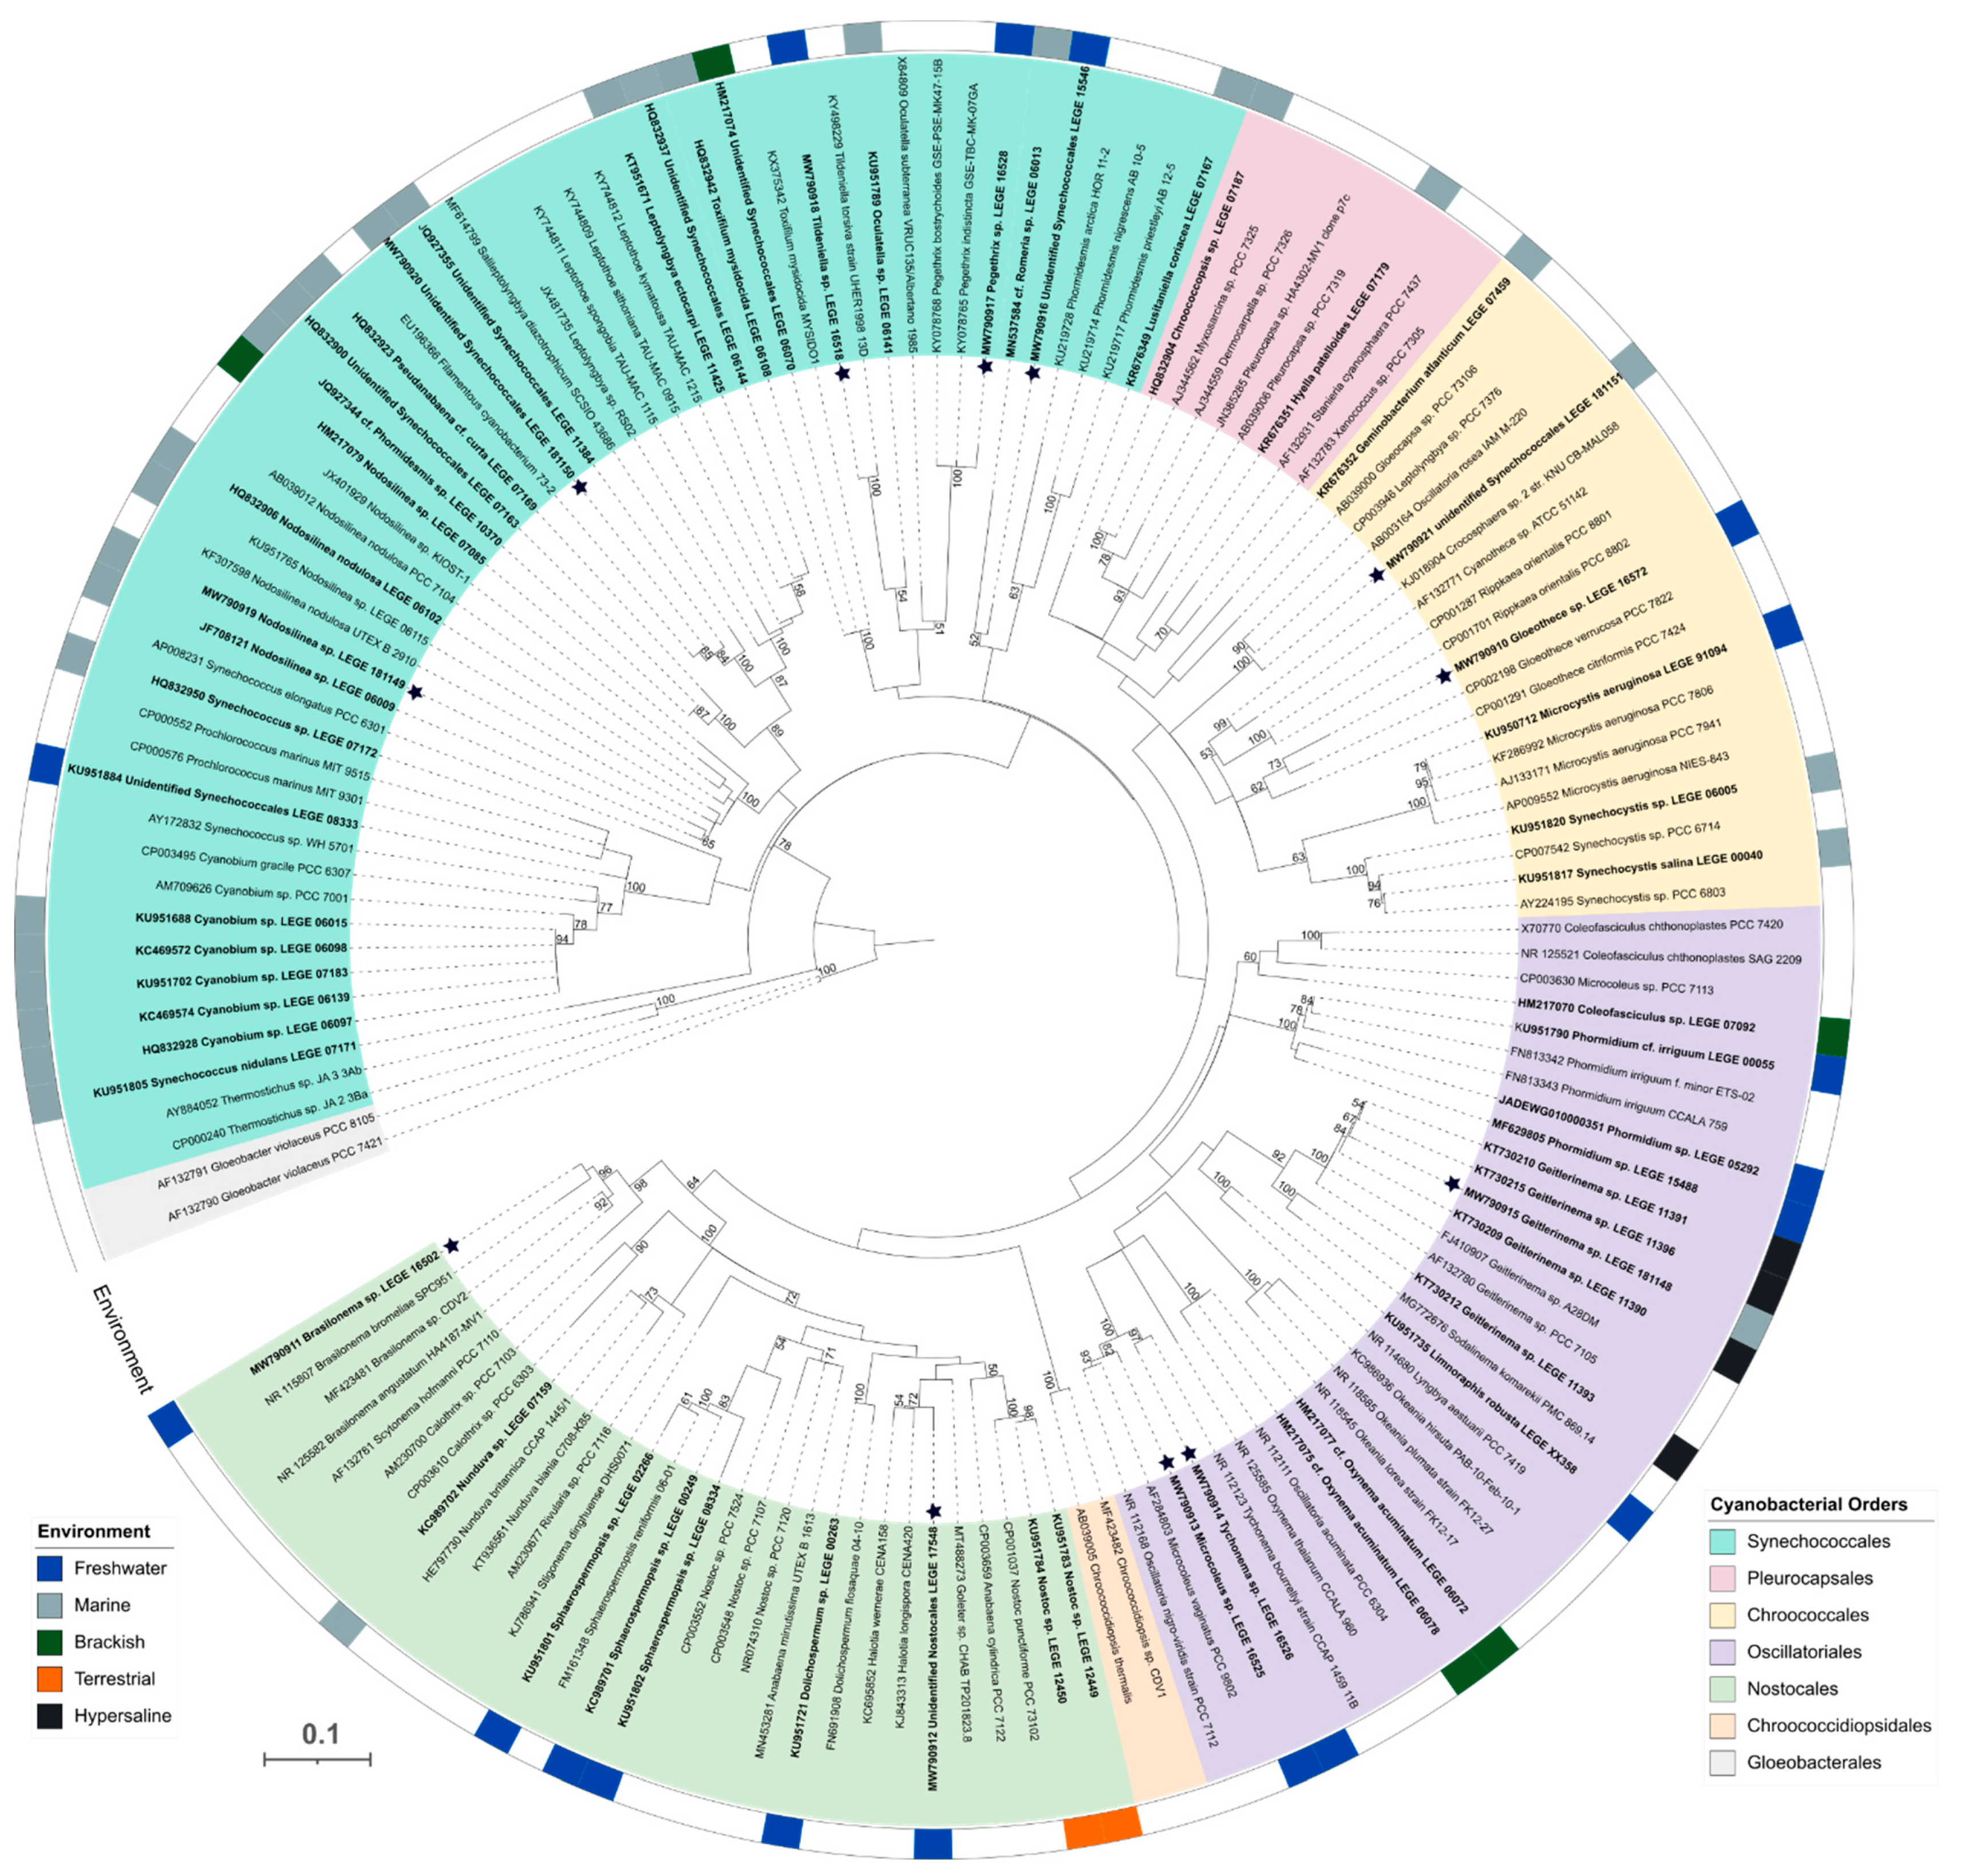
3.3. Phylogenetic Analysis
3.4. Cyanobacterial Natural Products Library
3.5. Cell Culture
3.6. Bioactivity Screening Using 2D Cell Models
3.7. Bioactivity Screening Using 3D Cell Models
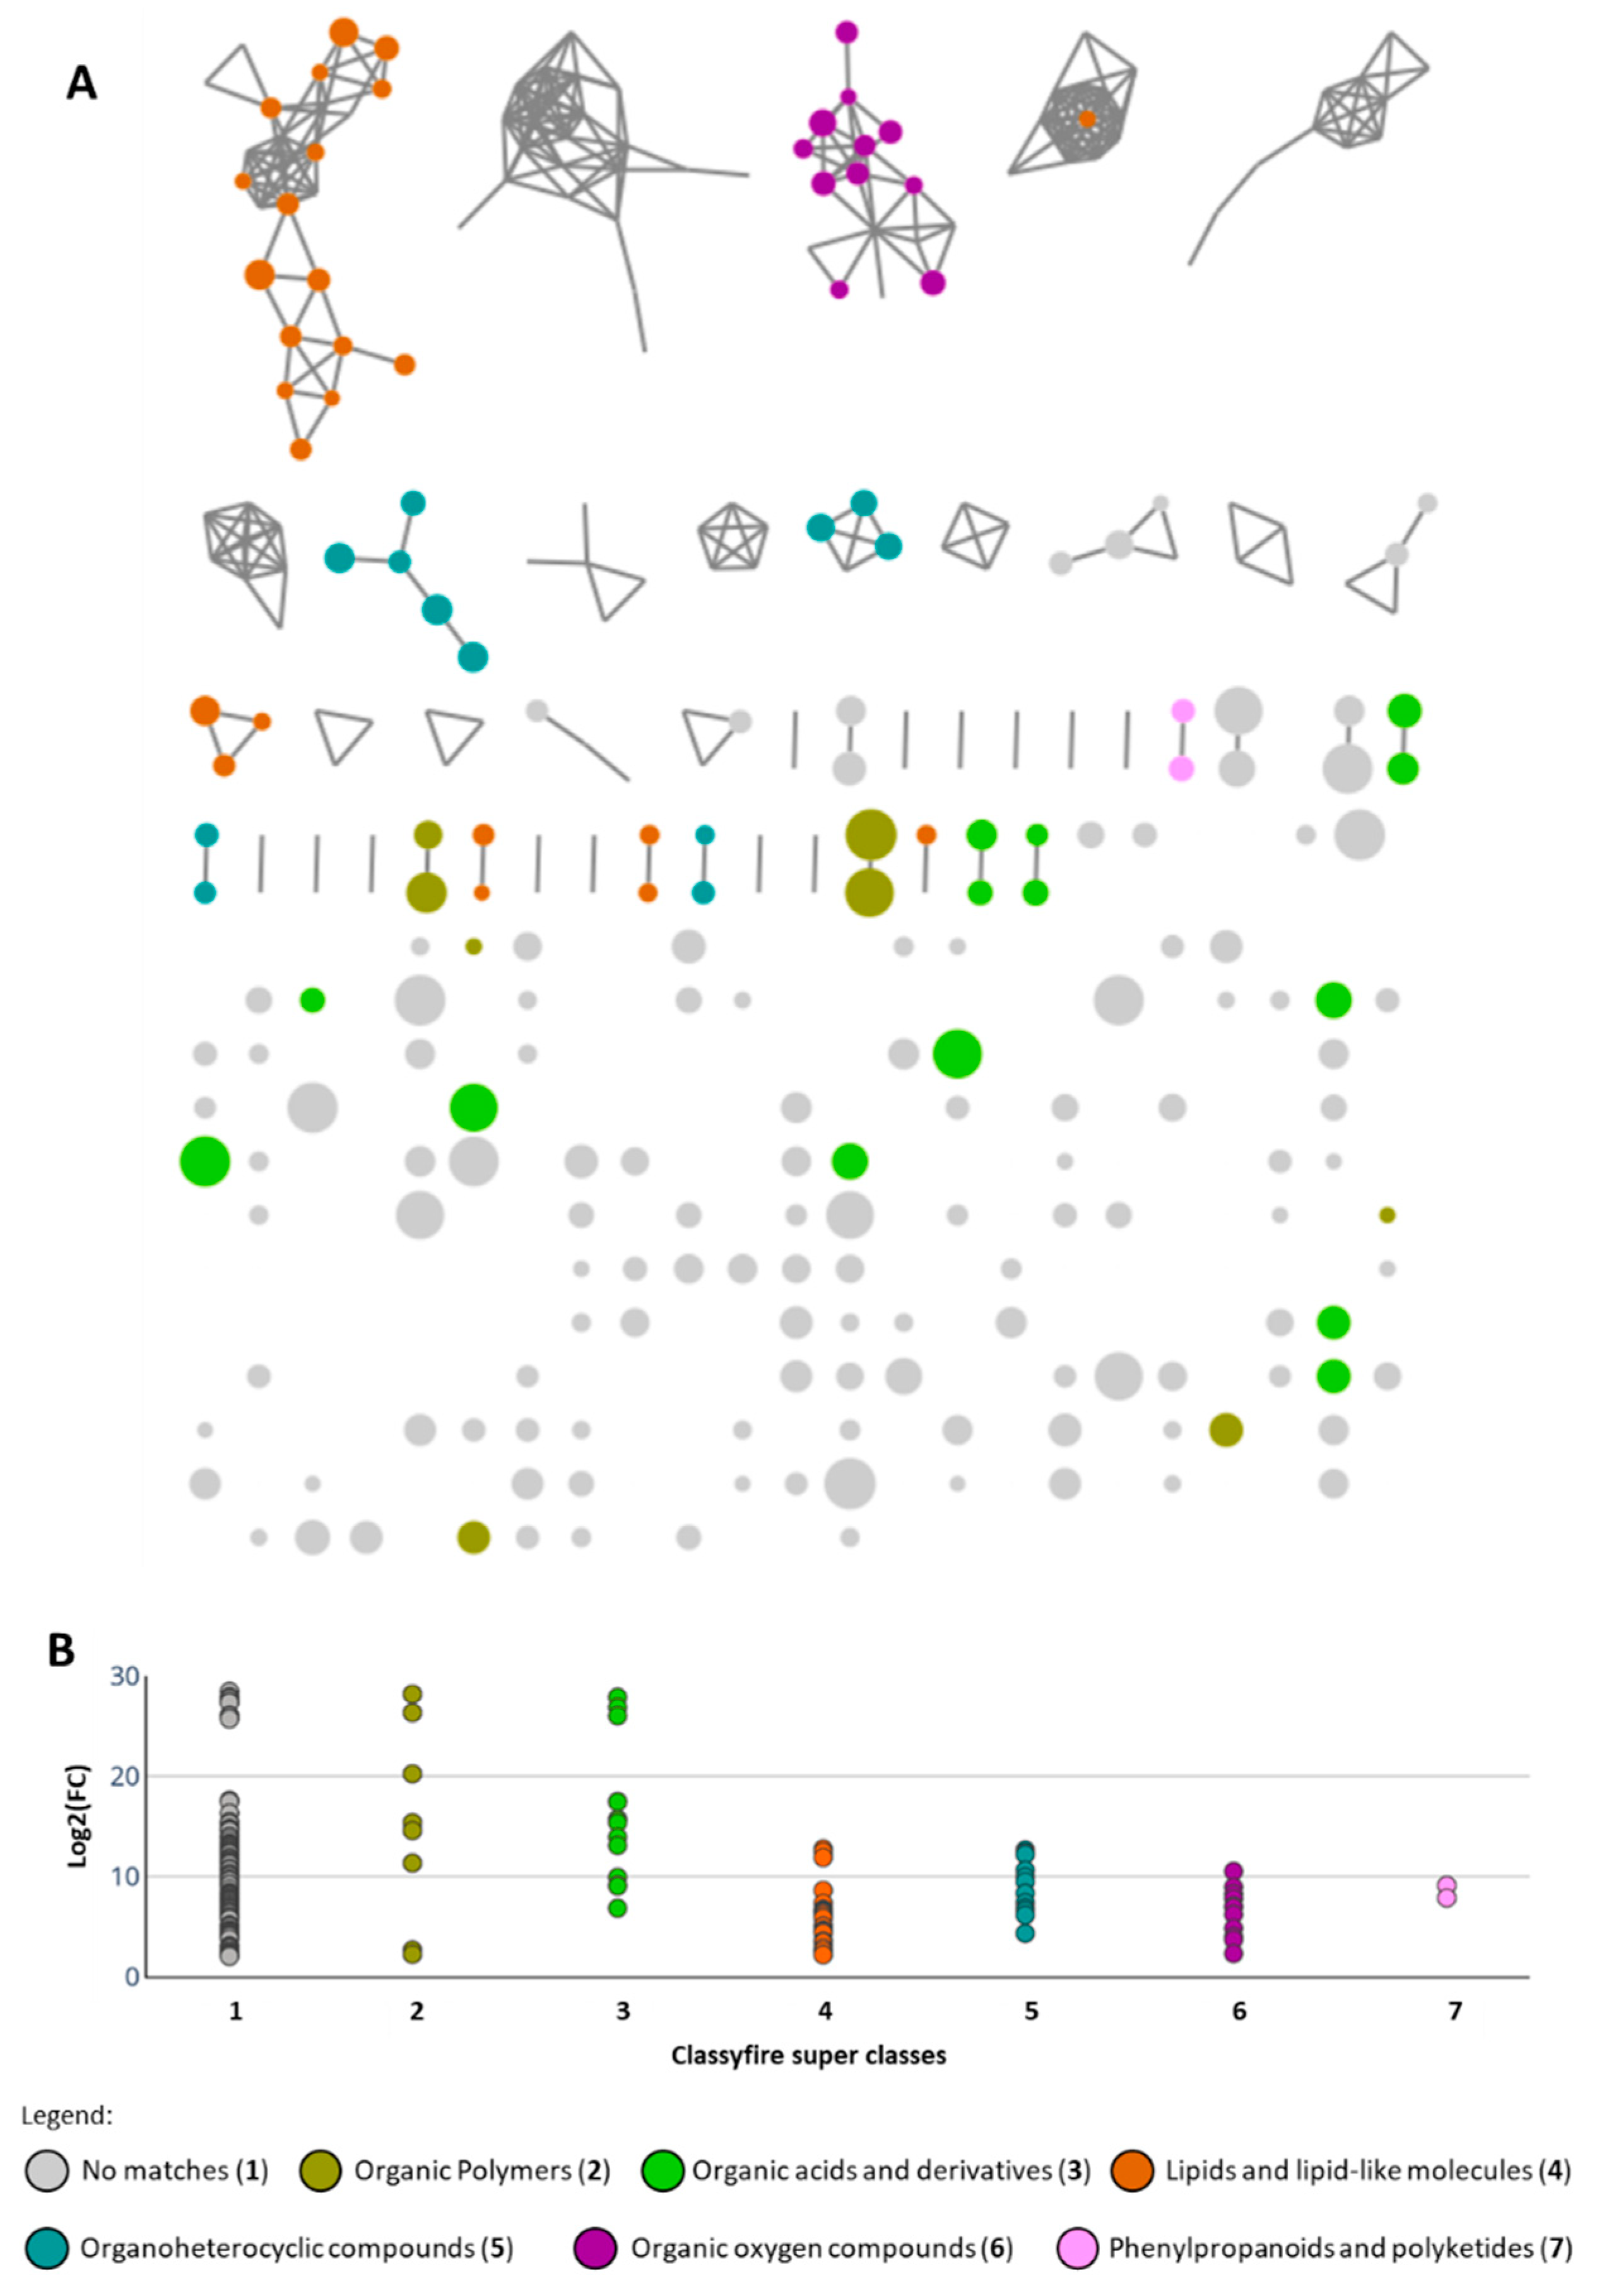
3.8. Untargeted Metabolomics Analysis
4. Conclusions
Supplementary Materials
Author Contributions
Funding
Institutional Review Board Statement
Informed Consent Statement
Data Availability Statement
Acknowledgments
Conflicts of Interest
References
- Newman, D.J.; Cragg, G.M. Natural Products as Sources of New Drugs over the Nearly Four Decades from 01/1981 to 09/2019. J. Nat. Prod. 2020, 83, 770–803. [Google Scholar] [CrossRef]
- Khalifa, S.A.M.; Shedid, E.S.; Saied, E.M.; Jassbi, A.R.; Jamebozorgi, F.H.; Rateb, M.E.; Du, M.; Abdel-Daim, M.M.; Kai, G.Y.; Al-Hammady, M.A.M.; et al. Cyanobacteria—from the Oceans to the Potential Biotechnological and Biomedical Applications. Mar. Drugs 2021, 19, 320. [Google Scholar] [CrossRef]
- Demay, J.; Bernard, C.; Reinhardt, A.; Marie, B. Natural Products from Cyanobacteria: Focus on Beneficial Activities. Mar. Drugs 2019, 17, 320. [Google Scholar] [CrossRef] [PubMed]
- Nandagopal, P.; Steven, A.N.; Chan, L.-W.; Rahmat, Z.; Jamaluddin, H.; Mohd Noh, N.I. Bioactive Metabolites Produced by Cyanobacteria for Growth Adaptation and Their Pharmacological Properties. Biology 2021, 10, 1061. [Google Scholar] [CrossRef] [PubMed]
- Tan, L.T.; Phyo, M.Y. Marine Cyanobacteria: A Source of Lead Compounds and Their Clinically-Relevant Molecular Targets. Molecules 2020, 25, 2197. [Google Scholar] [CrossRef]
- Dyshlovoy, S.A.; Honecker, F. Marine Compounds and Cancer: Updates 2020. Mar. Drugs 2020, 18, 643. [Google Scholar] [CrossRef]
- Ramos, V.; Morais, J.; Castelo-Branco, R.; Pinheiro, Â.; Martins, J.; Regueiras, A.; Pereira, A.L.; Lopes, V.R.; Frazão, B.; Gomes, D.; et al. Cyanobacterial Diversity Held in Microbial Biological Resource Centers as a Biotechnological Asset: The Case Study of the Newly Established LEGE Culture Collection. J. Appl. Phycol. 2018, 30, 1437–1451. [Google Scholar] [CrossRef] [PubMed]
- Gutiérrez-del-Río, I.; Brugerolle de Fraissinette, N.; Castelo-Branco, R.; Oliveira, F.; Morais, J.; Redondo-Blanco, S.; Villar, C.J.; Iglesias, M.J.; Soengas, R.; Cepas, V.; et al. Chlorosphaerolactylates A–D: Natural Lactylates of Chlorinated Fatty Acids Isolated from the Cyanobacterium Sphaerospermopsis sp. LEGE 00249. J. Nat. Prod. 2020, 83, 1885–1890. [Google Scholar] [CrossRef]
- Freitas, S.; Silva, N.G.; Sousa, M.L.; Ribeiro, T.; Rosa, F.; Leão, P.N.; Vasconcelos, V.; Reis, M.A.; Urbatzka, R. Chlorophyll Derivatives from Marine Cyanobacteria with Lipid-Reducing Activities. Mar. Drugs 2019, 17, 229. [Google Scholar] [CrossRef]
- Sousa, M.L.; Preto, M.; Vasconcelos, V.; Linder, S.; Urbatzka, R. Antiproliferative Effects of the Natural Oxadiazine Nocuolin a Are Associated with Impairment of Mitochondrial Oxidative Phosphorylation. Front. Oncol. 2019, 9, 224. [Google Scholar] [CrossRef]
- Freitas, S.; Martins, R.; Costa, M.; Leão, P.; Vitorino, R.; Vasconcelos, V.; Urbatzka, R. Hierridin B Isolated from a Marine Cyanobacterium Alters VDAC1, Mitochondrial Activity, and Cell Cycle Genes on HT-29 Colon Adenocarcinoma Cells. Mar. Drugs 2016, 14, 158. [Google Scholar] [CrossRef] [PubMed]
- Ribeiro, T.; Lemos, F.; Preto, M.; Azevedo, J.; Sousa, M.L.; Leão, P.N.; Campos, A.; Linder, S.; Vitorino, R.; Vasconcelos, V.; et al. Cytotoxicity of Portoamides in Human Cancer Cells and Analysis of the Molecular Mechanisms of Action. PLoS ONE 2017, 12, e0188817. [Google Scholar] [CrossRef] [PubMed]
- Antunes, J.; Pereira, S.; Ribeiro, T.; Plowman, J.E.; Thomas, A.; Clerens, S.; Campos, A.; Vasconcelos, V.; Almeida, J.R. A Multi-Bioassay Integrated Approach to Assess the Antifouling Potential of the Cyanobacterial Metabolites Portoamides. Mar. Drugs 2019, 17, 111. [Google Scholar] [CrossRef]
- Komárek, J. A Polyphasic Approach for the Taxonomy of Cyanobacteria: Principles and Applications. Eur. J. Phycol. 2016, 51, 346–353. [Google Scholar] [CrossRef]
- Gerwick, W.H.; Coates, R.C.; Engene, N.; Gerwick, L.; Grindberg, R.v.; Jones, A.C.; Sorrels, C.M. Giant Marine Cyanobacteria Produce Exciting Potential Pharmaceuticals. Microbe 2008, 3, 277–284. [Google Scholar] [CrossRef]
- Thornburg, C.C.; Britt, J.R.; Evans, J.R.; Akee, R.K.; Whitt, J.A.; Trinh, S.K.; Harris, M.J.; Thompson, J.R.; Ewing, T.L.; Shipley, S.M.; et al. NCI Program for Natural Product Discovery: A Publicly-Accessible Library of Natural Product Fractions for High-Throughput Screening. ACS Chem. Biol. 2018, 13, 2484–2497. [Google Scholar] [CrossRef] [PubMed]
- Belfiore, L.; Aghaei, B.; Law, A.M.K.; Dobrowolski, J.C.; Raftery, L.J.; Tjandra, A.D.; Yee, C.; Piloni, A.; Volkerling, A.; Ferris, C.J.; et al. Generation and Analysis of 3D Cell Culture Models for Drug Discovery. Eur. J. Pharm. Sci. 2021, 163, 105876. [Google Scholar] [CrossRef]
- Sousa, M.L.; Ribeiro, T.; Vasconcelos, V.; Linder, S.; Urbatzka, R. Portoamides A and B Are Mitochondrial Toxins and Induce Cytotoxicity on the Proliferative Cell Layer of in Vitro Microtumours. Toxicon 2020, 175, 49–56. [Google Scholar] [CrossRef] [PubMed]
- Kijanska, M.; Kelm, J. In Vitro 3D Spheroids and Microtissues: ATP-Based Cell Viability and Toxicity Assays. In Assay Guidance Manual [Internet]; Eli Lilly& Company and the National Center for Advancing Translational Sciences: Bethesda, MD, USA, 2016; pp. 1–13. [Google Scholar]
- Zhang, J.H.; Chung, T.D.Y.; Oldenburg, K.R. A Simple Statistical Parameter for Use in Evaluation and Validation of High Throughput Screening Assays. J. Biomol. Screen. 1999, 4, 67–73. [Google Scholar] [CrossRef]
- Nothias, L.F.; Petras, D.; Schmid, R.; Dührkop, K.; Rainer, J.; Sarvepalli, A.; Protsyuk, I.; Ernst, M.; Tsugawa, H.; Fleischauer, M.; et al. Feature-Based Molecular Networking in the GNPS Analysis Environment. Nat. Methods 2020, 17, 905–908. [Google Scholar] [CrossRef]
- Mohimani, H.; Gurevich, A.; Shlemov, A.; Mikheenko, A.; Korobeynikov, A.; Cao, L.; Shcherbin, E.; Nothias, L.F.; Dorrestein, P.C.; Pevzner, P.A. Dereplication of Microbial Metabolites through Database Search of Mass Spectra. Nat. Commun. 2018, 9, 4035. [Google Scholar] [CrossRef] [PubMed]
- Wandy, J.; Zhu, Y.; van der Hooft, J.J.J.; Daly, R.; Barrett, M.P.; Rogers, S. Ms2lda.Org: Web-Based Topic Modelling for Substructure Discovery in Mass Spectrometry. Bioinformatics 2018, 34, 317–318. [Google Scholar] [CrossRef]
- Da Silva, R.R.; Wang, M.; Nothias, L.F.; van der Hooft, J.J.J.; Caraballo-Rodríguez, A.M.; Fox, E.; Balunas, M.J.; Klassen, J.L.; Lopes, N.P.; Dorrestein, P.C. Propagating Annotations of Molecular Networks Using in Silico Fragmentation. PLoS Comput. Biol. 2018, 14, e1006089. [Google Scholar] [CrossRef] [PubMed]
- Ernst, M.; Kang, K.B.; Caraballo-Rodríguez, A.M.; Nothias, L.F.; Wandy, J.; Chen, C.; Wang, M.; Rogers, S.; Medema, M.H.; Dorrestein, P.C.; et al. Molnetenhancer: Enhanced Molecular Networks by Integrating Metabolome Mining and Annotation Tools. Metabolites 2019, 9, 144. [Google Scholar] [CrossRef]
- Djoumbou Feunang, Y.; Eisner, R.; Knox, C.; Chepelev, L.; Hastings, J.; Owen, G.; Fahy, E.; Steinbeck, C.; Subramanian, S.; Bolton, E.; et al. ClassyFire: Automated Chemical Classification with a Comprehensive, Computable Taxonomy. J. Cheminform. 2016, 8, 61. [Google Scholar] [CrossRef] [PubMed]
- Leao, P.N.; Pereira, A.R.; Liu, W.-T.; Ng, J.; Pevzner, P.a.; Dorrestein, P.C.; Konig, G.M.; Vasconcelos, V.M.; Gerwick, W.H. Synergistic Allelochemicals from a Freshwater Cyanobacterium. Proc. Natl. Acad. Sci. USA 2010, 107, 11183–11188. [Google Scholar] [CrossRef]
- Kang, H.S.; Krunic, A.; Shen, Q.; Swanson, S.M.; Orjala, J. Minutissamides A-D, Antiproliferative Cyclic Decapeptides from the Cultured Cyanobacterium Anabaena Minutissima. J. Nat. Prod. 2011, 74, 1597–1605. [Google Scholar] [CrossRef]
- Jones, M.R.; Pinto, E.; Torres, M.A.; Dörr, F.; Mazur-Marzec, H.; Szubert, K.; Tartaglione, L.; Dell’Aversano, C.; Miles, C.O.; Beach, D.G.; et al. CyanoMetDB, a Comprehensive Public Database of Secondary Metabolites from Cyanobacteria. Water Res. 2021, 196, 117017. [Google Scholar] [CrossRef]
- Vulpanovici, F.A. Biosynthesis, Production and Structural Studies of Secondary Metabolites in Cultured Marine Cyanobacteria. Ph.D. Thesis, Oregon State University, Corvallis, OR, USA, 2004. [Google Scholar]
- Thornburg, C.C. Investigation of Unique Marine Environments for Microbial Natural Products. Ph.D. Thesis, Oregon State University, Corvallis, OR, USA, 2013; pp. 1–276. [Google Scholar]
- Saide, A.; Lauritano, C.; Ianora, A. Pheophorbide A: State of the Art. Mar. Drugs 2020, 18, 257. [Google Scholar] [CrossRef]
- Lane, D.J. 16S/23S rRNA sequencing. In Nucleic Acid Techniques in Bacterial Systematics; John Wiley and Sons: Chichester, UK, 1991; pp. 115–175. [Google Scholar]
- Lepère, C.; Wilmotte, A.; Meyer, B. Molecular Diversity of Microcystis Strains (Cyanophyceae, Chroococcales) Based on 16S RDNA Sequences. Syst. Geogr. Plants 2000, 70, 275–283. [Google Scholar] [CrossRef]
- Nübel, U.; Garcia-Pichel, F.; Muyzer, G. PCR Primers to Amplify 16S RRNA Genes from Cyanobacteria. Appl. Environ. Microbiol. 1997, 63, 3327–3332. [Google Scholar] [CrossRef]
- Wright, E.S.; Yilmaz, L.S.; Noguera, D.R. DECIPHER, a Search-Based Approach to Chimera Identification for 16S RRNA Sequences. Appl. Environ. Microbiol. 2012, 78, 717–725. [Google Scholar] [CrossRef] [PubMed]
- Thompson, J.D.; Higgins, D.G.; Gibson, T.J. CLUSTAL W: Improving the Sensitivity of Progressive Multiple Sequence Alignment through Sequence Weighting, Position-Specific Gap Penalties and Weight Matrix Choice. Nucleic Acids Res. 1994, 22, 4673–4680. [Google Scholar] [CrossRef] [PubMed]
- Kumar, S.; Stecher, G.; Tamura, K. MEGA7: Molecular Evolutionary Genetics Analysis Version 7.0 for Bigger Datasets. Mol. Biol. Evol. 2016, 33, 1870–1874. [Google Scholar] [CrossRef] [PubMed]
- Letunic, I.; Bork, P. Interactive Tree of Life (ITOL): An Online Tool for Phylogenetic Tree Display and Annotation. Bioinformatics 2007, 23, W293–W296. [Google Scholar] [CrossRef] [PubMed]
- Carlsson, J.; Yuhas, J.M. Liquid-Overlay Culture of Cellular Spheroids. In Spheroids in Cancer Research; Springer: Berlin/Heidelberg, Germany, 1984; Volume 95, pp. 1–23. [Google Scholar]
- Plotly Technologies Inc. Collaborative Data Science. Available online: https://Chart-Studio.Plotly.Com/ (accessed on 18 March 2021).
- Girão, M.; Ribeiro, I.; Ribeiro, T.; Azevedo, I.C.; Pereira, F.; Urbatzka, R.; Leão, P.N.; Carvalho, M.F. Actinobacteria Isolated from Laminaria Ochroleuca: A Source of New Bioactive Compounds. Front. Microbiol. 2019, 10, 683. [Google Scholar] [CrossRef]
- Aron, A.T.; Gentry, E.C.; McPhail, K.L.; Nothias, L.F.; Nothias-Esposito, M.; Bouslimani, A.; Petras, D.; Gauglitz, J.M.; Sikora, N.; Vargas, F.; et al. Reproducible Molecular Networking of Untargeted Mass Spectrometry Data Using GNPS. Nat. Protoc. 2020, 15, 1954–1991. [Google Scholar] [CrossRef]


| Fractions | Cell Viability (%) | |||
|---|---|---|---|---|
| 3D HCT 116 | 2D HCT 116 | 2D hCMEC/D3 | ||
| Group A | LEGE 16572_C | 57.54 ± 20.74 | 21.30 ± 8.79 | 12.97 ± 5.14 |
| LEGE 17548_C | 58.05 ± 11.10 | 16.33 ± 8.50 | 16.67 ± 11.84 | |
| LEGE 17548_D | 58.74 ± 13.40 | 27.08 ± 17.23 | 36.52 ± 16.23 | |
| LEGE 15488_C | 65.16 ± 10.30 | 25.69 ± 21.02 | 14.51 ± 8.65 | |
| LEGE 181150_D | 75.95 ± 4.25 | 16.40 ± 3.26 | 13.80 ± 3.14 | |
| LEGE 05292_C | 68.32 ± 4.60 | 9.13 ± 2.64 | 12.83 ± 3.35 | |
| Group B | LEGE XX358_D | 72.28 ± 16.86 | 50.11 ± 20.43 | 44.60 ± 14.66 |
| LEGE 16572_D | 72.34 ± 6.05 | 58.15 ± 23.40 | 56.18 ± 19.94 | |
| JM1 Amb_D | 75.25 ± 7.14 | 55.30 ± 3.11 | 22.77 ± 5.59 | |
| LEGE 15546_D | 78.51 ± 7.16 | 58.44 ± 18.34 | 59.17 ± 15.65 | |
| LEGE 16502_E | 81.53 ± 13.30 | 71.38 ± 13.24 | 58.29 ± 7.41 | |
| JM1 Amb_E | 82.07 ± 3.02 | 56.16 ± 12.80 | 21.15 ± 5.76 | |
| Group C | JM5_amb_D | 90.07 ± 1.24 | 52.49 ± 5.34 | 31.85 ± 4.39 |
| JM5_amb_E | 94.92 ± 5.66 | 48.11 ± 12.12 | 55.44 ± 7.66 | |
| LEGE 06078_D | 99.29 ± 7.89 | 46.51 ± 12.42 | 69.21 ± 15.63 | |
| LEGE 07092_D | 94.96 ± 6.94 | 47.77 ± 3.62 | 55.86 ± 3.63 | |
| LEGE 07167_C | 85.76 ± 2.54 | 25.86 ± 1.36 | 56.83 ± 4.00 | |
| LEGE 07167_D | 82.74 ± 3.25 | 49.51 ± 1.90 | 10.93 ± 2.87 | |
| LEGE 07167_E | 99.70 ± 4.71 | 47.34 ± 1.59 | 53.96 ± 3.48 | |
| LEGE 08333_D | 106.90 ± 5.38 | 85.02 ± 1.57 | 80.56 ± 5.12 | |
| LEGE 15488_D | 99.09 ± 4.96 | 36.76 ± 23.26 | 20.17 ± 15.65 | |
| LEGE 181148_E | 93.04 ± 6.94 | 64.14 ± 14.46 | 48.58 ± 4.75 | |
| LEGE 181148_F | 93.49 ± 6.54 | 71.52 ± 20.38 | 48.44 ± 2.02 | |
| LEGE 181149_D | 94.01 ± 7.29 | 64.47 ± 22.29 | 40.25 ± 2.66 | |
| Selection threshold | LEGE 05292_C + 3σ | 82.12 | 17.03 | |
| Staurosporine | 31.67 ± 6.84 | 20.07 ± 4.40 | 12.05 ± 2.55 | |
| m/z | Isotope/ Fragments | Rt (min) | Log2(FC) | Super Class | Direct Parent | Molecular Framework | Putative Annotation |
|---|---|---|---|---|---|---|---|
| LEGE 05292_C | |||||||
| 1313.6991 [M+H]+ | 7.21 | 25.71 | 3 | 8 | 9 | Portoamide C C62H96N12O19 Δ 0.27 ppm | |
| 1532.7887 [M+H]+ | 7.51 | 28.18 | 2 | 10 | 9 | Portoamide A C74H109N13O22 Δ 0.27 ppm | |
| 1502.7780 [M+H]+ | 7.74 | 26.34 | 2 | 10 | 9 | Portoamide B C73H107N13O21 Δ 0.18 ppm | |
| LEGE 17548_C | |||||||
| 1154.6172 [M+Na]+ | 8.73 | 26.07 | - | - | - | [Minutissamide A + CH3] * C52H85N13O15 Δ −1.55 ppm | |
| 1118.6187 [M+H]+ | 8.76 | 26.86 | 3 | 8 | 11 | Minutissamide A C51H83N13O15 Δ −1.55 ppm | |
| LEGE 17548_C, LEGE 17548_D and LEGE 16572_C | |||||||
| 762.5468 [M+H]+ | 12.60 | 27.91 | - | - | - | - | |
| LEGE 16572_C | |||||||
| 703.5092 [M+H]+ | 12.31 | 27.33 | - | - | - | - | |
| LEGE 181150_D | |||||||
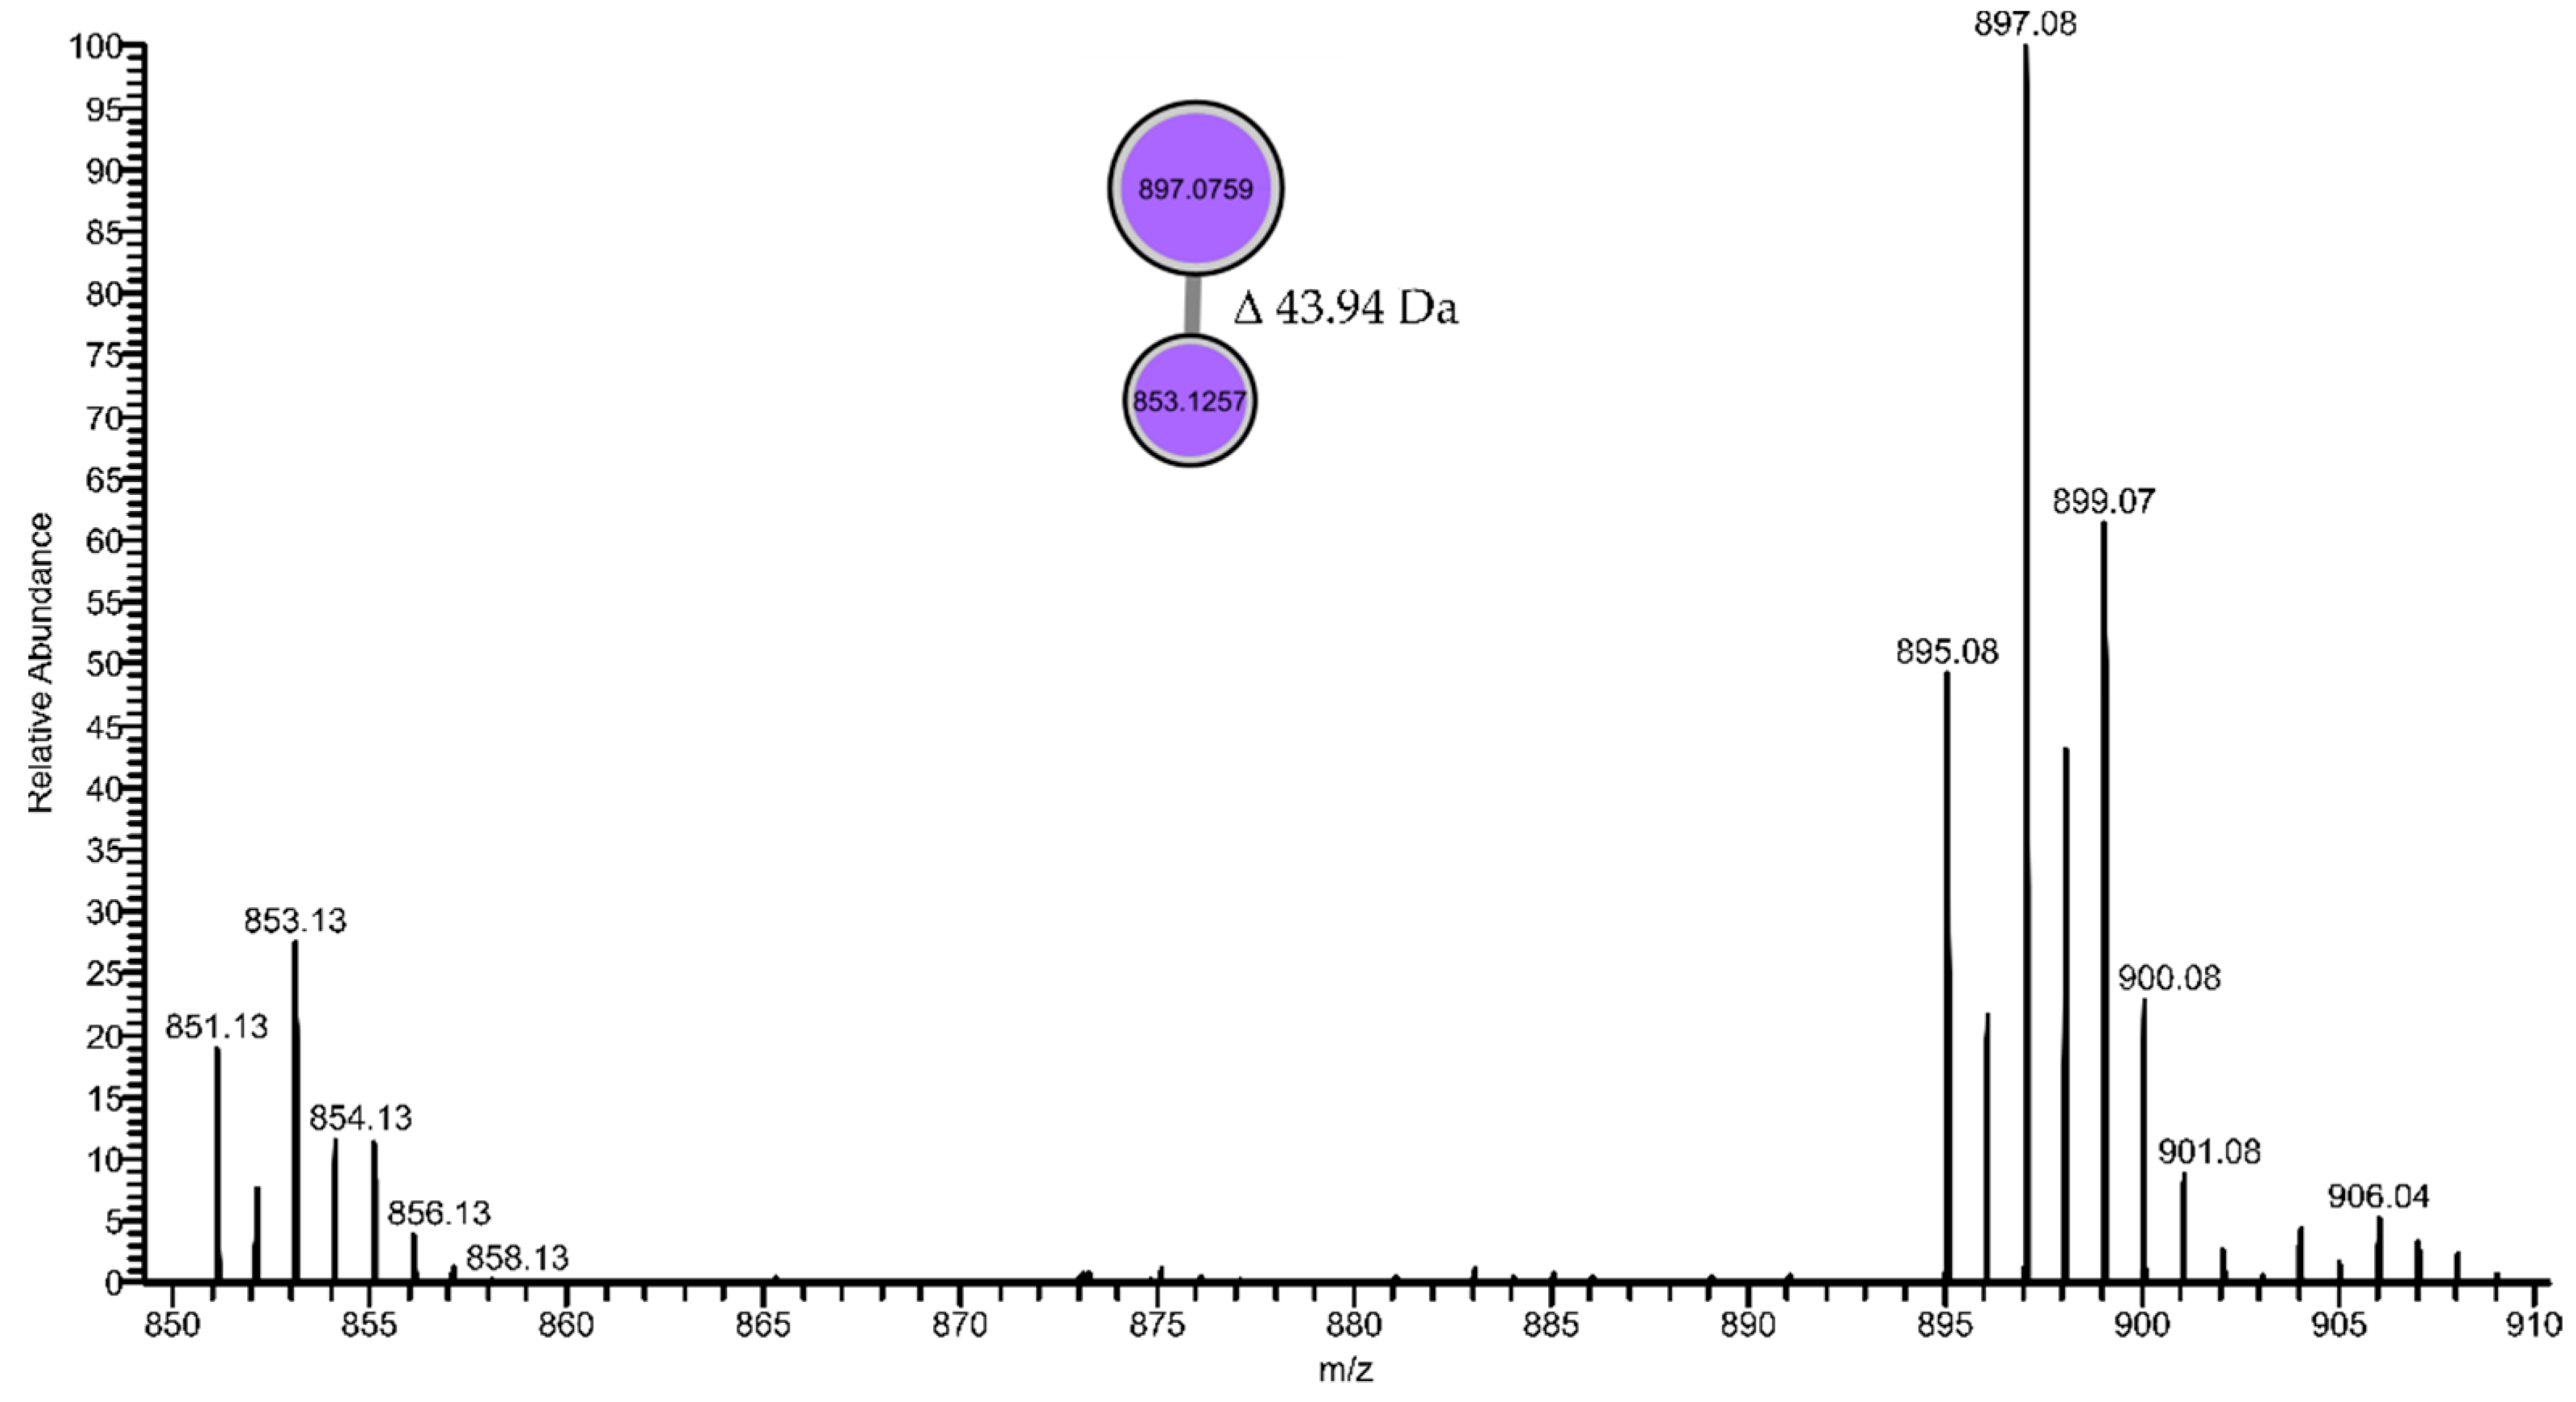
| 895.0778 | 897.0759 [M+2 isotope] | 7.92 | 25.98 | - | - | - | Leptochelin |
| 851.1284 | 853.1257 [M+2 isotope] | 7.81 | 17.43 | - | - | - | Leptochelin-like * |
| 1011.8493 | 14.57 | 27.92 | - | - | - | - | |
| LEGE 15488_C | |||||||
| 655.3808 [M+H]+ | 5.73 | 8.27 | - | - | - | - | |
| 858.5795 [M+H]+ | 7.29 | 8.10 | - | - | - | - | |
| 331.2010 | 7.28 | 8.15 | - | - | - | - | |
| 528.3863 | 7.28 | 9.05 | 3 | 12 | 11 | - | |
| 1520.7861 [M+H]+ | 7.87 | 5.07 | 2 | 10 | 9 | Portoamide-like * C73H109N13O22 Δ −1.44 ppm | |
| m/z | Rt (min) | Log2(FC) | Super Class | Precursor Intensity | Tentative Identification |
|---|---|---|---|---|---|
| LEGE 16572_D, LEGE 15546_D and LEGE xx358_D | |||||
| 653.2971 [M+H]+ | 12.12 | 7.72 | 1 | 1.19 × 10¹⁰ | 151-hydroxy-lactone-pheophorbide a ethyl ester C37H40N4O7 Δ 0.19 ppm |
| 623.2865 [M+H]+ | 11.68 | 7.54 | 1 | 2.55 × 10¹⁰ | 132-hydroxy-phaeophorbide a methyl ester C36H38N4O6 Δ 0.14 ppm |
| 639.2813 [M+H]+ | 11.88 | 5.99 | 2 | 2.44 × 10⁹ | 151-hydroxy-lactone-pheophorbide a methyl ester C36H38N4O7Δ −0.04 ppm |
| LEGE 16502_E, JM1_amb_E | |||||
| 593.2759 [M+H]+ | 11.77 | 6.99 | 2 | 2.97 × 10¹⁰ | pheophorbide a C35H36N4O5 Δ 0.09 ppm |
| 535.2704 [M+H]+ | 12.24 | 4.18 | 2 | 3.85 × 10⁹ | pyrophaeophorbide a C33H34N4O3Δ 0.06 ppm |
| 609.2706 [M+H]+ | 11.29 | 3.90 | 1 | 5.22 × 10⁸ | 132-hydroxy-phaeophorbide a C35H36N4O6 Δ −0.26 ppm |
| All samples | |||||
| 903.5618 [M+H]+ | 14.41 | 4.58 | 2 | 1.47 × 10¹⁰ | 151-hydroxy-lactone-phaeophytin a C55H74N4O7Δ −1.36 ppm |
| 887.5664 [M+H]+ | 14.30 | 3.67 | 4.80 × 10¹⁰ | 132-hydroxy-pheophytin a C55H74N4O6Δ −1.93 ppm | |
| JM1_amb_D, JM1_amb_E, LEGE 16502_E | |||||
| 917.5777 [M+H]+ | 14.70 | 2.16 | 2 | 2.02 × 10⁹ | 13-methyldioxy-phaeophytin a/ ficusmicrochlorin B C56H76N4O7 Δ −1.07 ppm |
| Time (min) | Flow (mL·min−1) | MeCN (%) | H2O (%) | Collection Time (min) | Fraction |
|---|---|---|---|---|---|
| 0.0 | 3.0 | 10 | 90 | 1.00–2.30 | A |
| 2.0 | 3.0 | 80 | 20 | 2.30–3.60 | B |
| 3.0 | 3.0 | 80 | 20 | 3.60–4.90 | C |
| 4.0 | 3.0 | 100 | 0 | 4.90–6.20 | D |
| 8.9 | 3.0 | 100 | 0 | 6.20–7.50 | E |
| 9.2 | 3.5 | 100 | 0 | 7.50–8.80 | F |
| 12.0 | 3.5 | 100 | 0 | 8.80–10.36 | G |
| 12.3 | 3.0 | 100 | 0 | 10.36–11.50 | H |
| 14.0 | 3.0 | 100 | 0 | ||
| 15.0 | 3.0 | 10 | 90 | ||
| 18.0 | 3.0 | 10 | 90 |
Publisher’s Note: MDPI stays neutral with regard to jurisdictional claims in published maps and institutional affiliations. |
© 2021 by the authors. Licensee MDPI, Basel, Switzerland. This article is an open access article distributed under the terms and conditions of the Creative Commons Attribution (CC BY) license (https://creativecommons.org/licenses/by/4.0/).
Share and Cite
Ferreira, L.; Morais, J.; Preto, M.; Silva, R.; Urbatzka, R.; Vasconcelos, V.; Reis, M. Uncovering the Bioactive Potential of a Cyanobacterial Natural Products Library Aided by Untargeted Metabolomics. Mar. Drugs 2021, 19, 633. https://doi.org/10.3390/md19110633
Ferreira L, Morais J, Preto M, Silva R, Urbatzka R, Vasconcelos V, Reis M. Uncovering the Bioactive Potential of a Cyanobacterial Natural Products Library Aided by Untargeted Metabolomics. Marine Drugs. 2021; 19(11):633. https://doi.org/10.3390/md19110633
Chicago/Turabian StyleFerreira, Leonor, João Morais, Marco Preto, Raquel Silva, Ralph Urbatzka, Vitor Vasconcelos, and Mariana Reis. 2021. "Uncovering the Bioactive Potential of a Cyanobacterial Natural Products Library Aided by Untargeted Metabolomics" Marine Drugs 19, no. 11: 633. https://doi.org/10.3390/md19110633