
Numerical Study on the Mooring Force in an Offshore Fish Cage Array

Centre for Marine Technology and Ocean Engineering (CENTEC), Instituto Superior Técnico, Universidade de Lisboa, Av. Rovisco Pais, 1049-001 Lisboa, Portugal
*
Author to whom correspondence should be addressed.
J. Mar. Sci. Eng. 2022, 10(3), 331; https://doi.org/10.3390/jmse10030331
Submission received: 14 February 2022
/
Accepted: 18 February 2022
/
Published: 26 February 2022
(This article belongs to the Special Issue Hydrodynamics and Mooring Analysis of Floating Structures)
Abstract
:The mooring force in a fish cage array subjected to currents and waves is investigated using the finite element method. Firstly, the numerical model of a fish cage array with six gravity cages is built by Ansys/APDL. Collars and bottom rings are simulated with pipe and beam elements while the rest structure is simulated with link elements, including the net and mooring cables. Thus, the weight and hydrodynamic load on the cables can be considered. The initial shape of the mooring ropes is calculated based on mooring dynamics. Since each component is a slender structure in the cage array, the Morison equation is used to calculate the hydrodynamic load. Secondly, the mooring forces are assessed for the system in different sea states. The locations of the maximum mooring force on different parts in the mooring system are found. The mean values and amplitudes of maximum mooring forces on different parts are calculated. The main ropes have the maximum mooring forces under all sea states. The mean values of the maximum mooring forces increase with the current velocity and wave height. When the attack angle is 0° and 90°, the two adjacent bridle ropes do not play the role of pulling the cage together. One is pulled tight and the other one is slack.
1. Introduction
Aquaculture plays a critical role in supplying food and bioenergy to the world’s growing population. According to The State of World Fisheries and Aquaculture 2018, aquaculture production reached 53% of total food uses in 2016 [1]. Due to environmental pollution and overfishing, the production of traditional capture fishery has not increased since the 1990s, while the production of aquaculture has increased more than five times from 1990 to 2016. To meet the demand for higher quality and larger quantities, more offshore fish farms have been established for high water quality, rapid transport and dilution of waste production, stable temperatures, high levels of oxygen, and less influence from terrestrial runoff [2,3]. On the other hand, the harsh environment of the offshore area is a big challenge to the safety of the fish farming equipment.
Aquaculture cages can be classified into four primary groups: fixed, floating, submersible and submerged [4]. The floating gravity type cage is the most widely used fish cage worldwide, for its large culturing volume and simple and visual operating process. A floating gravity fish cage is usually composed of four parts. Floating collars provide buoyancy and working space. Flexible nets are hung onto the collar and connected to sinkers at the bottom. The net is stretched by the collar and sinkers to provide enough volume for the fish inside. The mooring system is used to fix the cage. Usually, a fish farm contains several or even dozens of fish cages.
Due to the large projected area, the hydrodynamic load on the gravity fish cage is very heavy, which results in large mooring forces and rapid cage volume reduction. Many publications studied the hydrodynamic characteristics of gravity fish cages. Føre et al. [5] performed a drag test to measure the drag coefficients of net panels and derived the relationship between the coefficients and Reynolds number. Dong et al. [6] built an experimental model to study the hydrodynamic characteristics of a flexible net cage under uniform flow, including the drag force, remained cage volumes and the flow field inside and outside the net cage. A strong negative correlation between the drag force and cage volumes was found from their results. Hou et al. [7] studied the annual fatigue damage of mooring lines in an offshore fish farm system by the generalized probability density evolution method and a virtual stochastic process. Fredriksson et al. [8] predicted the structural integrity of the HDPE floating collar and investigated the maximum loading conditions at estimated yield values for the material. Moe et al. [9] reduced the risk of tearing of the net and escape of cultured fish by inclining the cross ropes and bottom ropes on the net.
Endresen et al. [10] calculated the wake effect between twines nearby and the upstream twines to downstream twines and applied the result in their numerical models. Bai et al. [11] used shell elements to simulate the collar and calculated the stress concentration in the connecting area between the collar and the cables. They used the results to evaluate the fatigue life of the collar based on the S–N curve and Palmgren–Miner rule. Zhao et al. [12] performed experiments to measure the mooring forces and the velocity reduction in a series of net cages in a steady current. Fu et al. [13] carried out a forced oscillation test to simulate the motion of a floating cylinder in oscillatory and steady flows and derived the hydrodynamic coefficients. Berstad and Tronstad [14] used membrane elements to model the net and computed the mooring forces of a fish farm under both current and regular and irregular waves. Lee et al. [15] used the mass-spring model to build a computation model of a fish cage and a pound net.
Li et al. [16,17] used the buoyancy distribution method to simulate the partly immersed collar and built a numerical model of an entire fish cage to study the dynamic response of a fish cage under both regular and irregular waves. Decew et al. [18] used acoustic sensors to measure the deformation of a full-scale fish cage. Gansel et al. [19] towed a full-scale fish cage at a constant speed and measured the drag force and volume reduction. Guo et al. [20] provided a more extensive and detailed review of the theoretical, numerical, and experimental progress made in the application of porous membranes and net-type structures to fish cages. Dong et al. [21] reviewed existing numerical and experimental models and estimated the model uncertainty in hydrodynamic characteristics of the aquaculture plant and its mooring system. The result showed that it is very significant to consider the model uncertainty in reliability analysis for aquaculture structures.
Bernardo and Guedes Soares [22] reviewed the current procedures for computing the loads on the net structure. They used a commercially available numerical tool, SIMA, to simulate the motion of a gravity cage subjected to currents and waves. Mohapatra et al. [23] calculated the hydrodynamic load on a moored flexible cylindrical net cage subjected to waves by both numerical and analytical methods, and they obtained a good agreement. Zhang et al. [24] built a numerical model of 6 × 6 semi-rigid fish cages by the lumped mass method. The mooring forces were calculated and the effect of waves was studied.
The mooring system keeps the fish cages in place. As one of the components of a floating fishing cage, the mooring cables should also be considered in the design. Commonly, the mooring system is a catenary, where the cable provides the restoring force to the top floating structure by the weight of the suspended segment. The length of the suspended line varies with the dynamic motion responses of the top floating structure, which indicates that the segment laid on the seafloor should be long enough to prevent it from being fully lifted up. Consequently, the catenary mooring lines are very long, and the system footprint is relatively large.
A review of existing mooring systems for deep and shallow water can be found in [25]. Advances in mooring designs for renewable energy devices, which operate also in shallow water, could be applicable to fish cages by using taut moorings, in which the restoring force is provided through axial stretching and the bottom footprint is much smaller. The mooring lines of a fish cage must perform two functions: withstand and transmit forces. The loads imposed on a cage mooring system are usually dynamic. It is important that mooring lines have a high breaking strength and can absorb much of the kinetic energy of rapidly changing forces. Steel cables, although very strong, are expensive and heavy, especially for a catenary configuration where the total length of the chain must be very long. The use of synthetic fibre ropes has resulted in significant improvements in safety, performance and economical aspects, due to the lower submerged mass per unit length, a lower cost per unit length and the potential to reduce peak loadings [26]. In addition, synthetic ropes generally have a better tension fatigue performance in water and fewer corrosion problems [27]. Therefore, the application of multi-components with chain or wire ropes in conjunction with synthetic fibre rope is a good choice.
Among the synthetic fibre ropes, HMPE, aramid, polyester and nylon are the most used mooring ropes. HMPE and aramid have higher strength but lower elasticity. Polyester and nylon are more compliant and cost-efficient. Although polyester has previously been employed in taut mooring systems [28], nylon has higher compliance than polyester, leading to a smaller mooring footprint and thus higher array density, again making it more economically attractive for fishing cage farms. Berstad and Tronstad [14] have considered the typical use of polyethene in fish farms. The nonlinear load-elongation properties of the fibre ropes make the fluid–structure interaction of the system more complicated and require a clear characterization of the mechanical behaviours of the mooring ropes. Experimental studies on identifying the effects and properties of synthetic ropes can be found in [29,30,31].
In the previous study, spring elements were used to fix a single cage model [32,33]. Thus, the relationship between the displacement of the cage and the mooring force is simplified into a linear relationship. In this work, a complete mooring system is built for a fish cage array by link elements. The dynamic load and weight of the mooring ropes are considered in the system and a multi-component of wire ropes and synthetic fibre rope is applied. The maximum mooring forces and their locations are calculated and the effect of the current velocity and wave height is studied. The results of this paper can be used in the study of the connection of mooring ropes, stress concentration of collars and fatigue analysis of the mooring material.
In the present paper, a numerical model of a fish cage array with six gravity cages is built by Ansys/APDL. Pipe and beam elements are used to model the collar and the bottom ring while the flexible net and mooring cables are modelled by link elements. The Morison equation is applied to calculate the hydrodynamic load. More details of the numerical model can be found introduced in Section 2. The mooring forces are assessed for the system in different sea states. The main ropes have the largest mooring force under all sea states. The mean value of the maximum mooring force increases with the current velocity and wave height. More detailed calculation results are shown in Section 3. The locations of the maximum forces and the application method of current velocity reduction and its limitation are discussed in Section 4. At last, a conclusion is drawn in Section 5.
2. Numerical Model
The numerical model of the fish farm is composed of six gravity fish cages and the surrounding mooring system. The transient analysis is carried out by Ansys/APDL and the computing time is from 100 s to 150 s to ensure that for each case, the structure has moved around its stable position for at least two periods. A gravity fish cage includes three components: the floating collar, the net and the bottom ring. The floating collar is modelled with pipe elements, which are slender elements with a hollow cross-section. The bottom ring is modelled with beam elements. Each pipe element and the beam element have two nodes and each node has six degrees of freedom, the translations in the x, y and z directions and rotations about the x, y and z directions. The cross-sections of pipe and beam elements are different. The cross-section of pipe elements is a ring while the cross-section of beam elements is circular.
The net has a large projected area subjected to currents and waves, which is the main source of the hydrodynamic loads on cages. In ANSYS/APDL, Link 180 is a 3-D spar element that can be used to model trusses and cables. It is a uniaxial tension–compression element with three degrees of freedom at each node: translations in the nodal x, y and z-direction. No bending of the element is considered.
The solidity, which is defined as the ratio between the projected area of the twines and the total area of a net mesh, is an important parameter and determines the projected area and hydrodynamic load on the structure. The solidity for square knotless nets is given by
where Sn is the solidity of the net, d is the thickness of one twine, and L is the length of the mesh bar. Due to the lack of data on the wake effect of currents and waves, the current velocity reduction after each cage is assumed as 15% from the experiment under uniform flow [5].
If the link elements have the same diameter as the real net, which is between 1.5 mm to 2 mm, as usual, the model will include too many elements to calculate. Thus, the net structure is simplified into horizontal and vertical lines. The distance between the horizontal lines is 1 m and there are a total of 20 vertical lines distributed evenly along the diameter of the cage. Link elements are used to mesh these lines. The total section area of the adjusted structure is the same as the original structure. To keep the same weight and tensile stiffness of the adjusted structure as the original one, the density and Young’s modulus of the material are consistent with the original structure. However, it results in a smaller projected area. To ensure that the hydrodynamic force is consistent with the original structure, the drag and inertial coefficients increases according to the ratio of the projected area of the adjusted structure to the original structure. The drag coefficients are collected from the experiment in [5], which are 0.8 to 0.9 in this work. The mass coefficient is 2. More details can be found in a previous study [32]. Table 1 shows the main parameters of the adjusted structure and original structure.
In addition, flat-bottom panels and rope structures have a limited effect on flow, loads and net shape due to a relatively small projected area compared to the large vertical netting material area, so they are not considered in the numerical model [34]. The result of the single cage model was compared and validated with the experimental and theoretical models in our previous study [32,33]. The differences between the calculated displacements of the collar from the numerical model and the theoretical model are less than 3% [32]. The differences between the volume reduction ratio of the numerical model and other published results are also less than 5.5% [33].
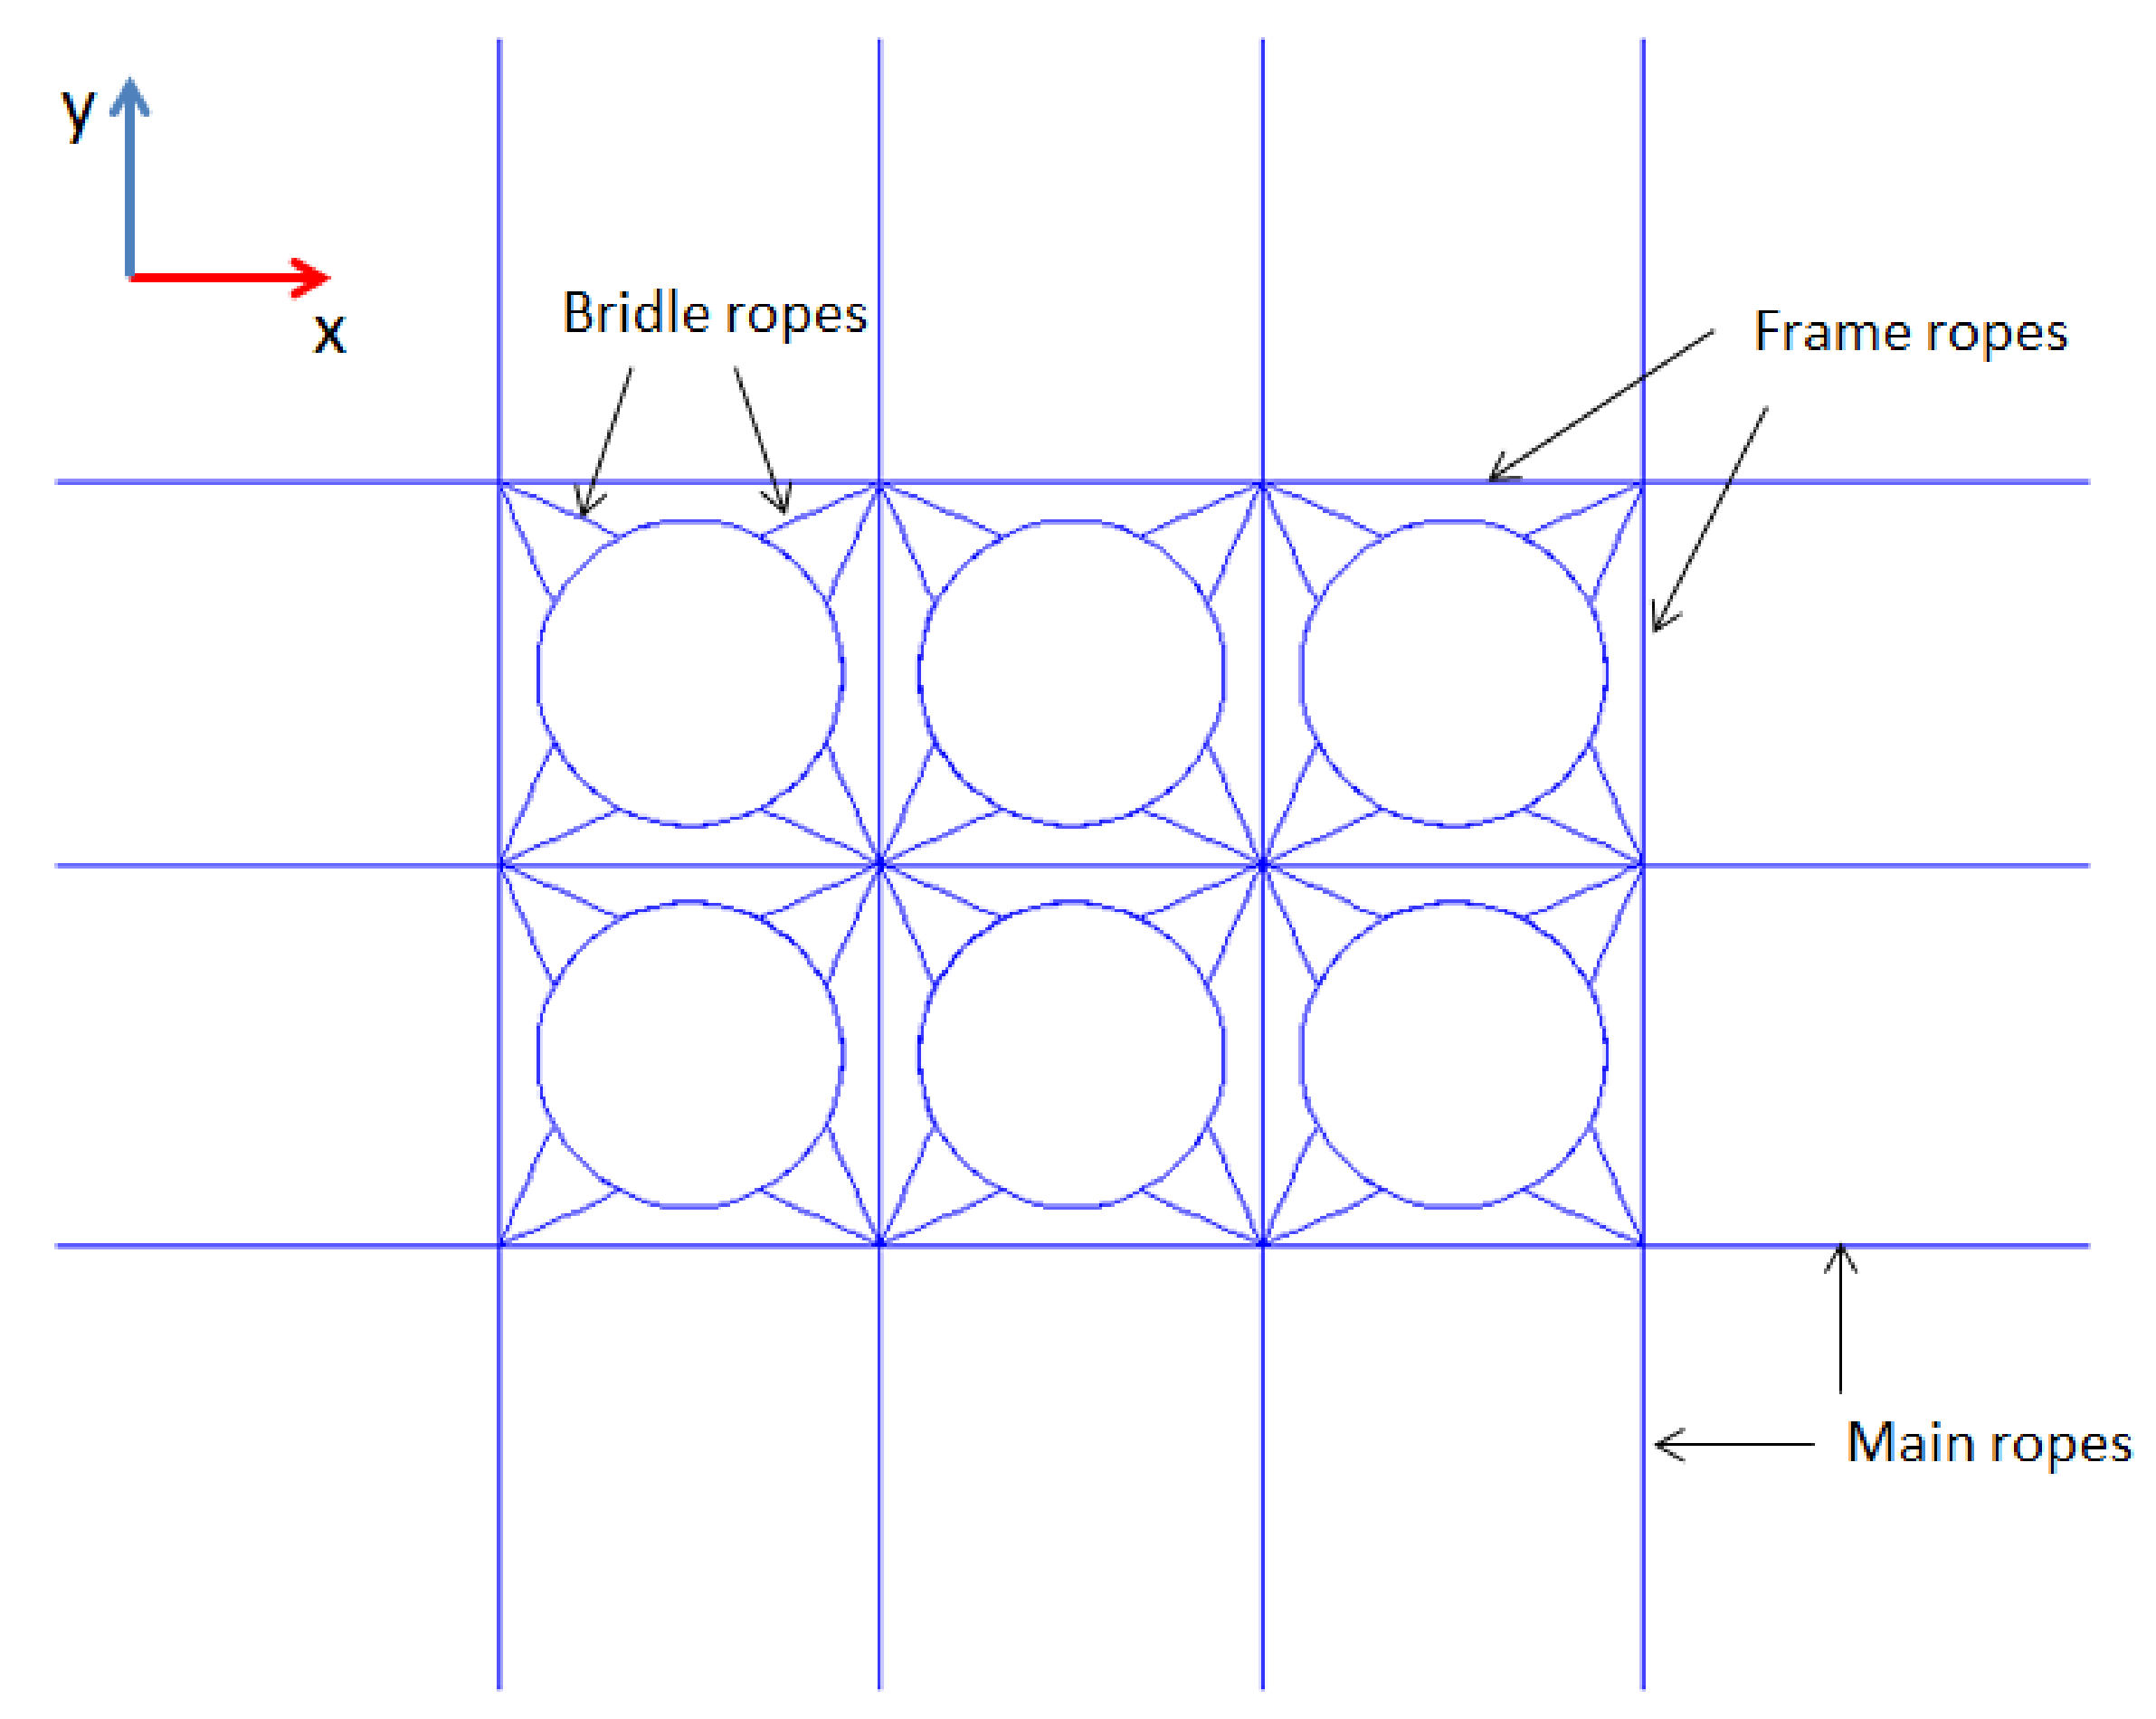
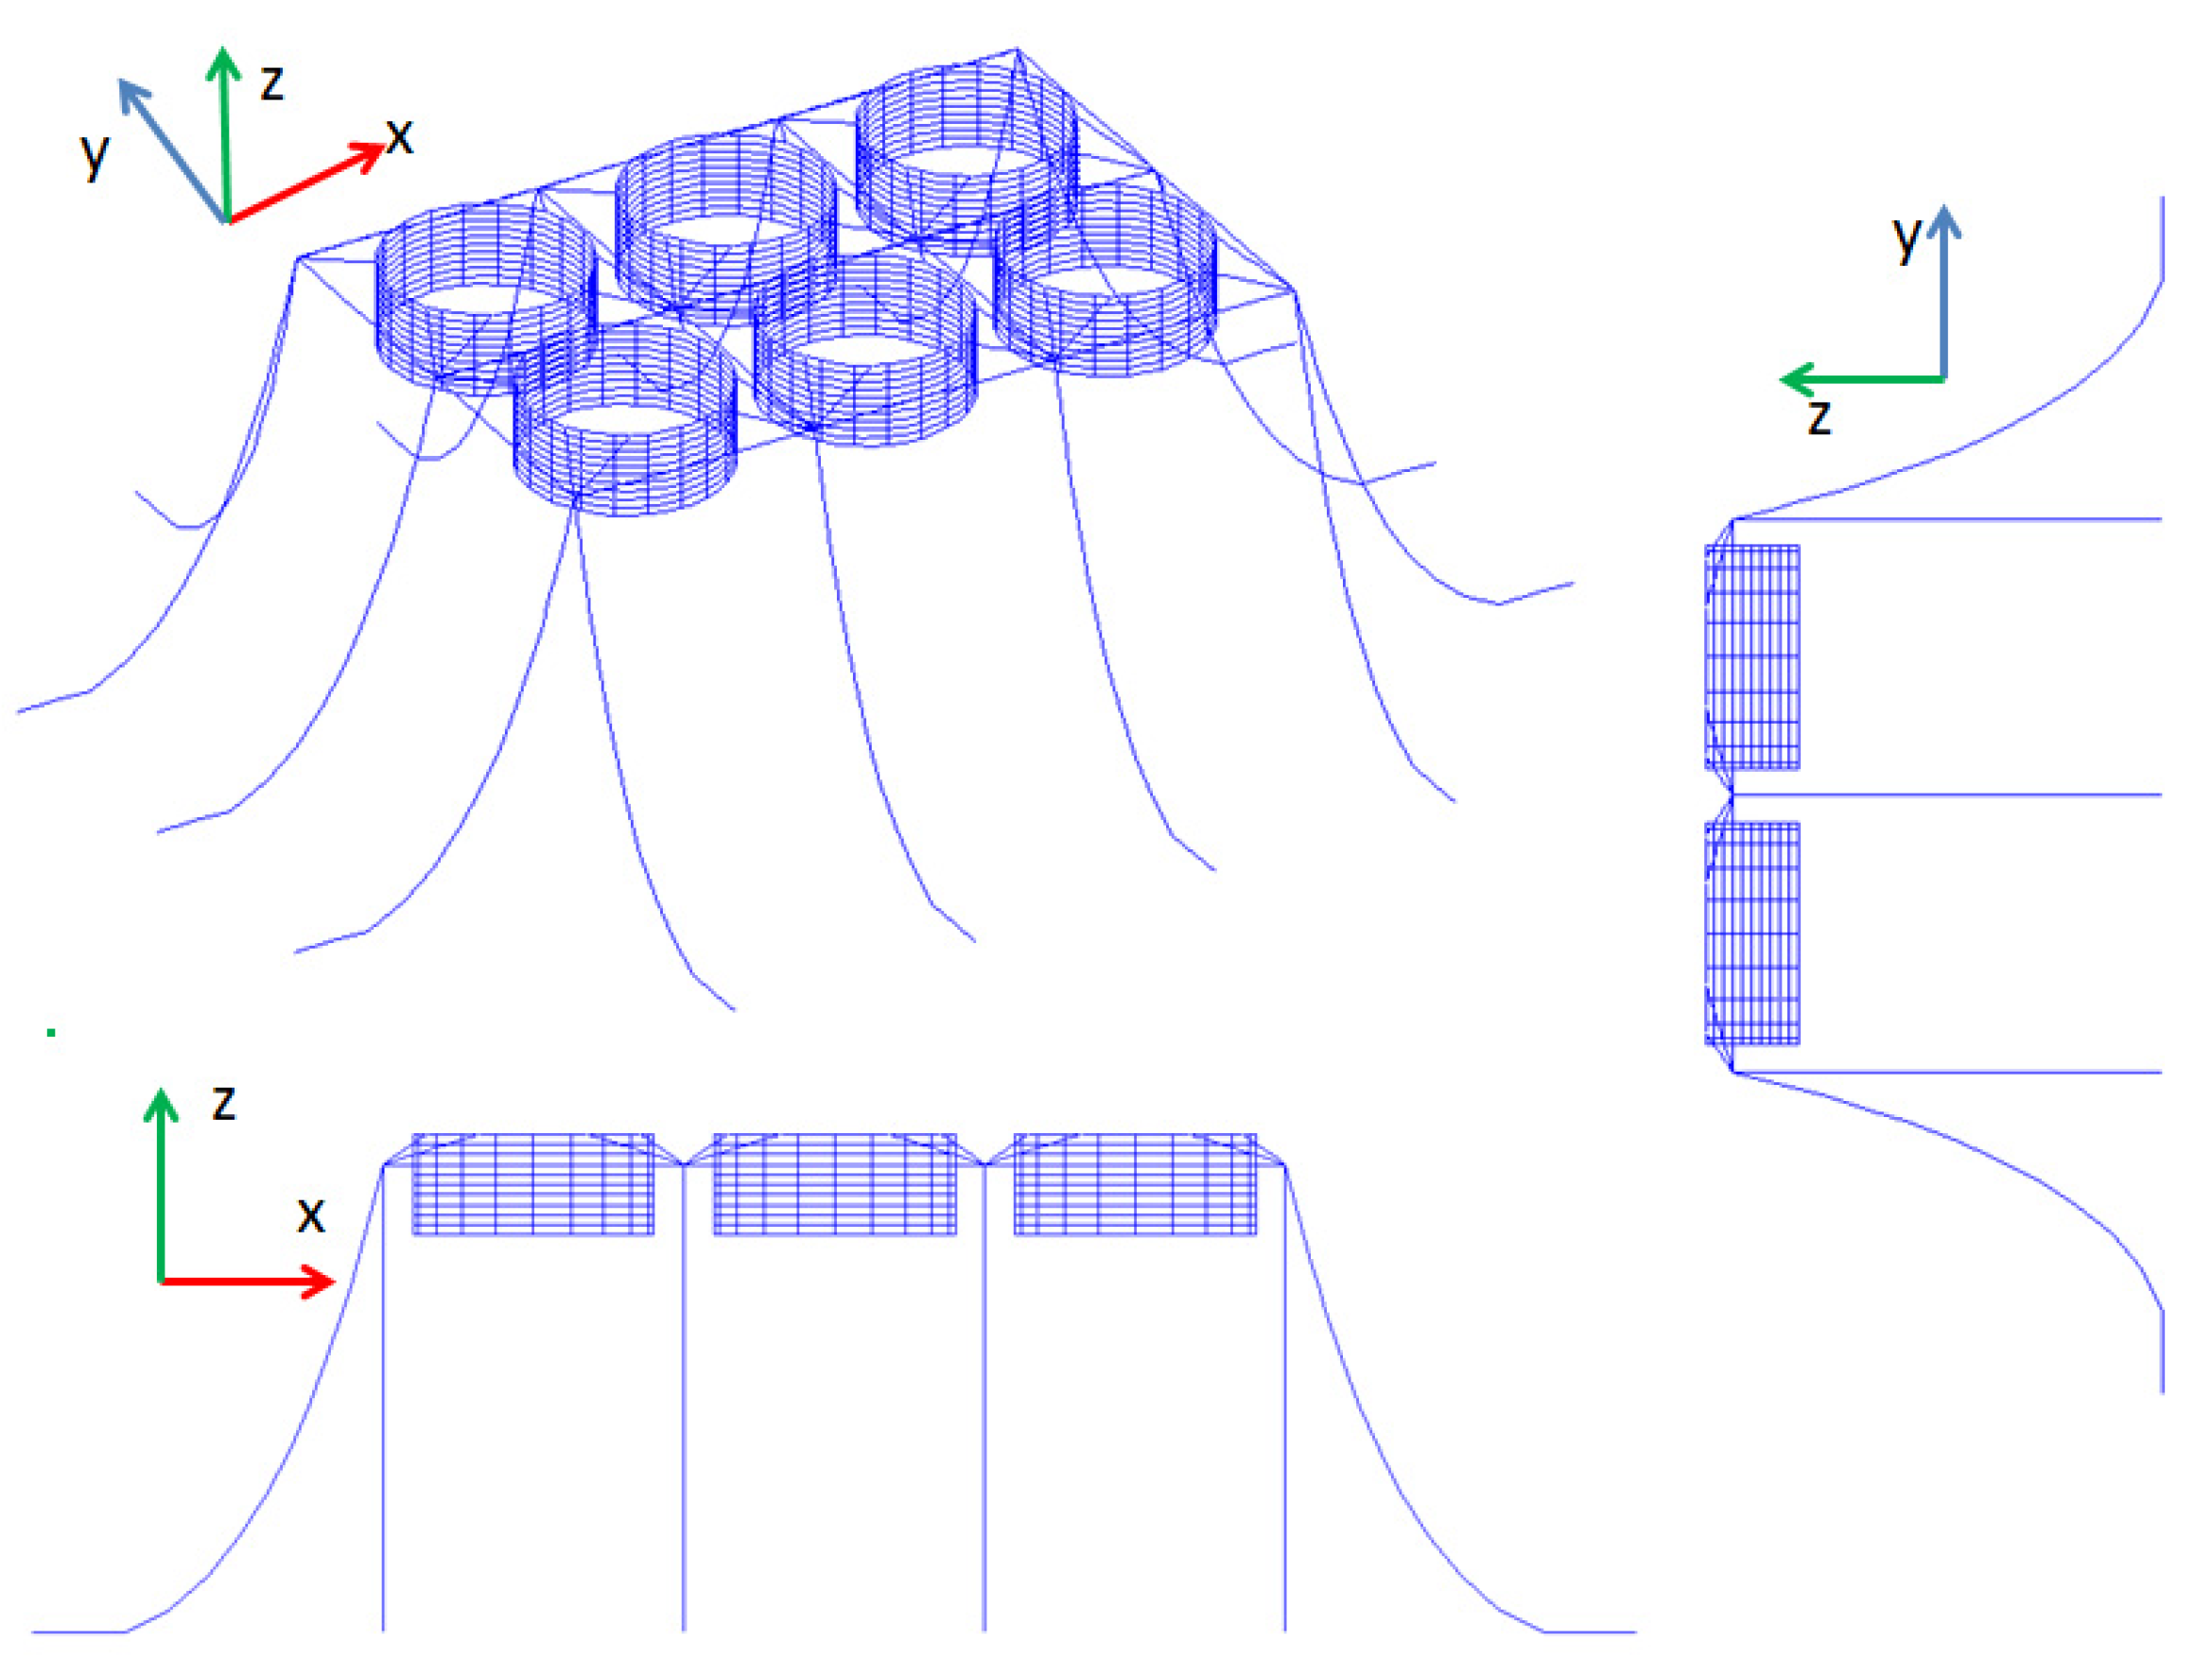
According to [7,35,36], the surrounding mooring system is composed of bridle ropes, frame ropes and the main ropes. Buoys are located at the junctions of bridle ropes and the frame ropes and are used to keep the mooring frame at its designated depth [36]. In the numerical model, the buoyancy generated by the buoys acts on their positions but the hydrodynamic loads on the buoys are neglected. As shown in Figure 1, the bridle ropes connect the collars to the frame ropes and the main ropes connect the frame ropes to the anchors. Figure 2 shows the entire numerical model viewed from different perspectives. The type of bridle and frame ropes is high modulus polyethene (HMPE) fibre rope, and the main ropes are six-strand wire ropes. The data of mooring ropes are collected from [28,37]. The main dimensions and material parameters are listed in Table 2.
Linear wave theory is used in this work. The velocity potential and dispersion relationship were expressed as
where k is the wavenumber, H1 is wave height, h is the depth of the fluid, ω is the angular frequency of the wave, x and z are coordinates of the point.
The Morison equation is used to calculate the hydrodynamic force. To take the relative motion between the structure and water particles into account, a modified Morison equation is expressed as [38].
where f is the hydrodynamic force per length, CM is the mass coefficient, Cd is drag coefficient, is the density of seawater, D is the diameter of the slender structure, u and are the velocity and acceleration of the water particle, and are the velocity and acceleration of the structure element.
Different from previous studies [33,35], the mooring force is the main research content of this work. Thus, link elements replaced the spring element to model mooring cables to consider the load on mooring cables and the mooring dynamic in the numerical model.
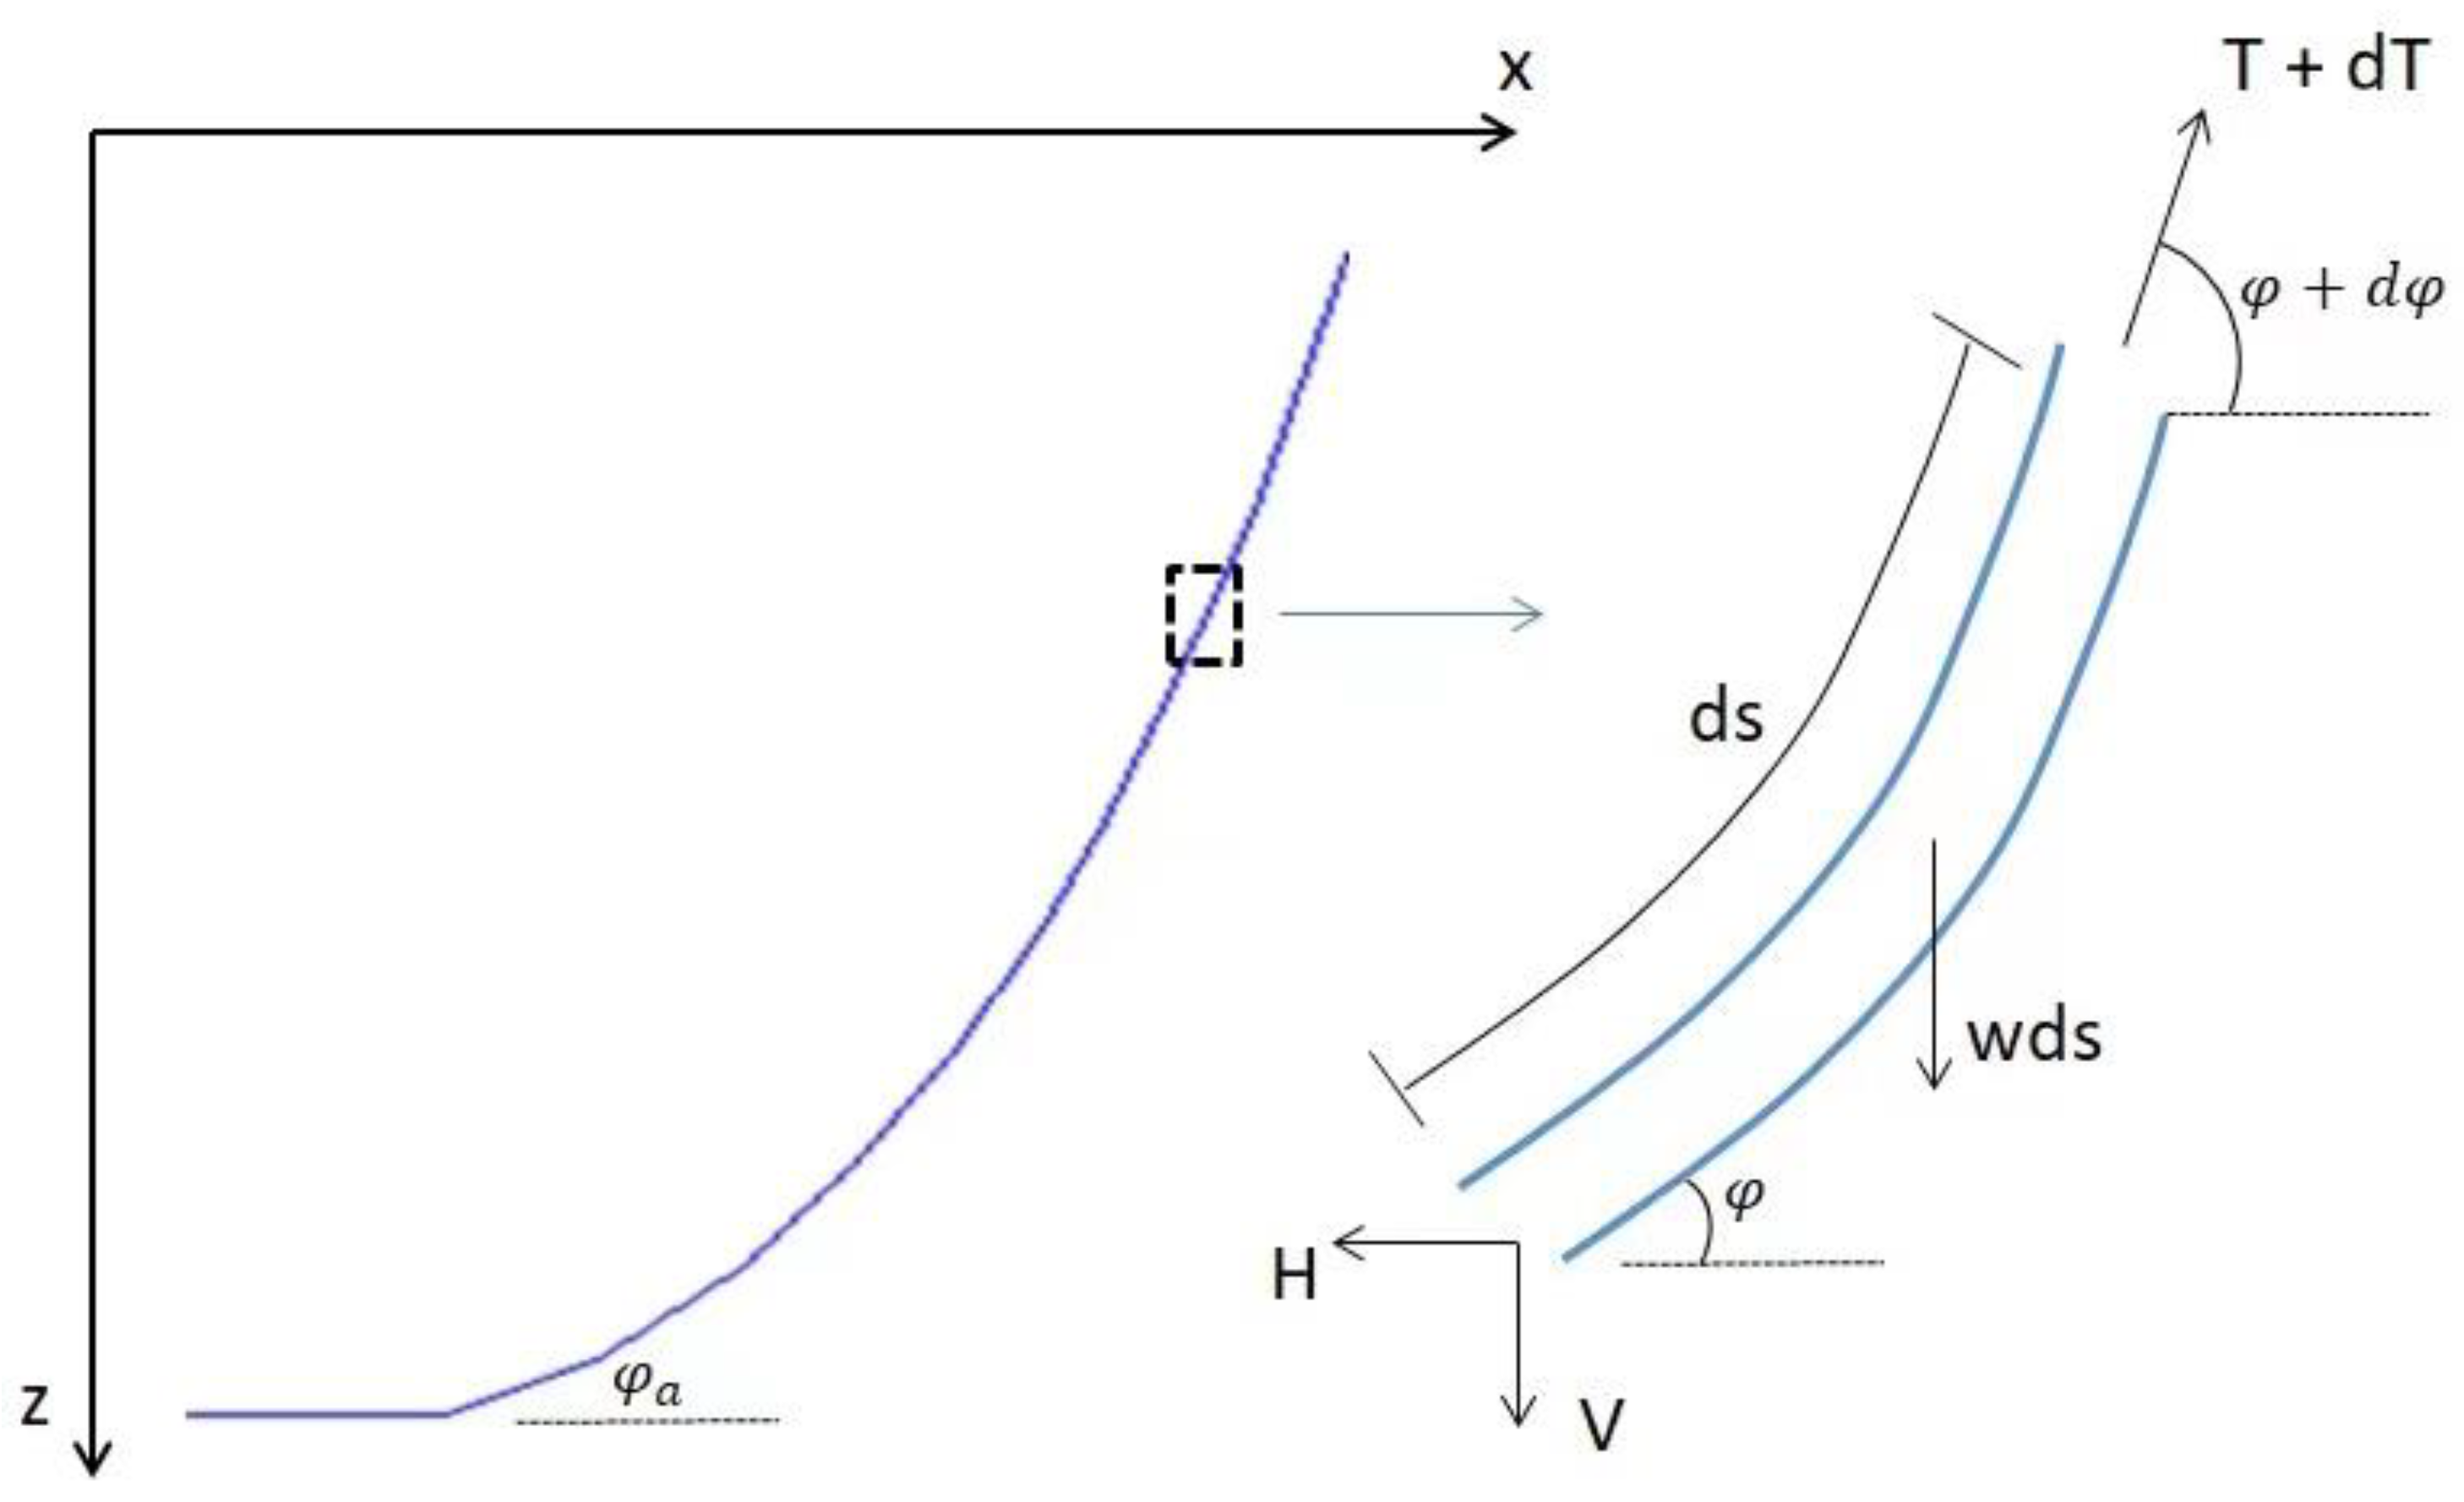
To establish the initial configuration of the mooring cables, a static design is performed using catenary equations and neglecting the bending stiffness and the dynamic effects in the line. As seen in Figure 3, a horizontal seabed is assumed. The cable is in a vertical plane coinciding with x-z-plane. The cable line has a constant weight, w, per unit length in the water.
For the small segment in Figure 3, ds is the upstretched length, T is the tension and replaced by its vertical and horizontal components (V and H) at the left end of the segment, and w is the submerged weight per unit length. In the numerical model, a part of the mooring line is assumed to be lying on the seabed, thus φa is assumed to be 0. The pretension is set as 1 kN. The location of the mooring line (x, z) as a function of s can be expressed as [39]:
Implicit transient analysis is used to solve the following structural dynamic equilibrium equation. The time step is from 0.0001 s to 0.1 s. Geometric nonlinearities are considered due to the large deformation of the net. The structural dynamic equilibrium equation can be expressed as [16,32]:
where [M], [C] and [K] are the mass matrix, the damping matrix and the stiffness matrix, respectively, and G, fb and fH are the load including gravity, buoyancy and hydrodynamic load from currents and waves, respectively.
3. Results
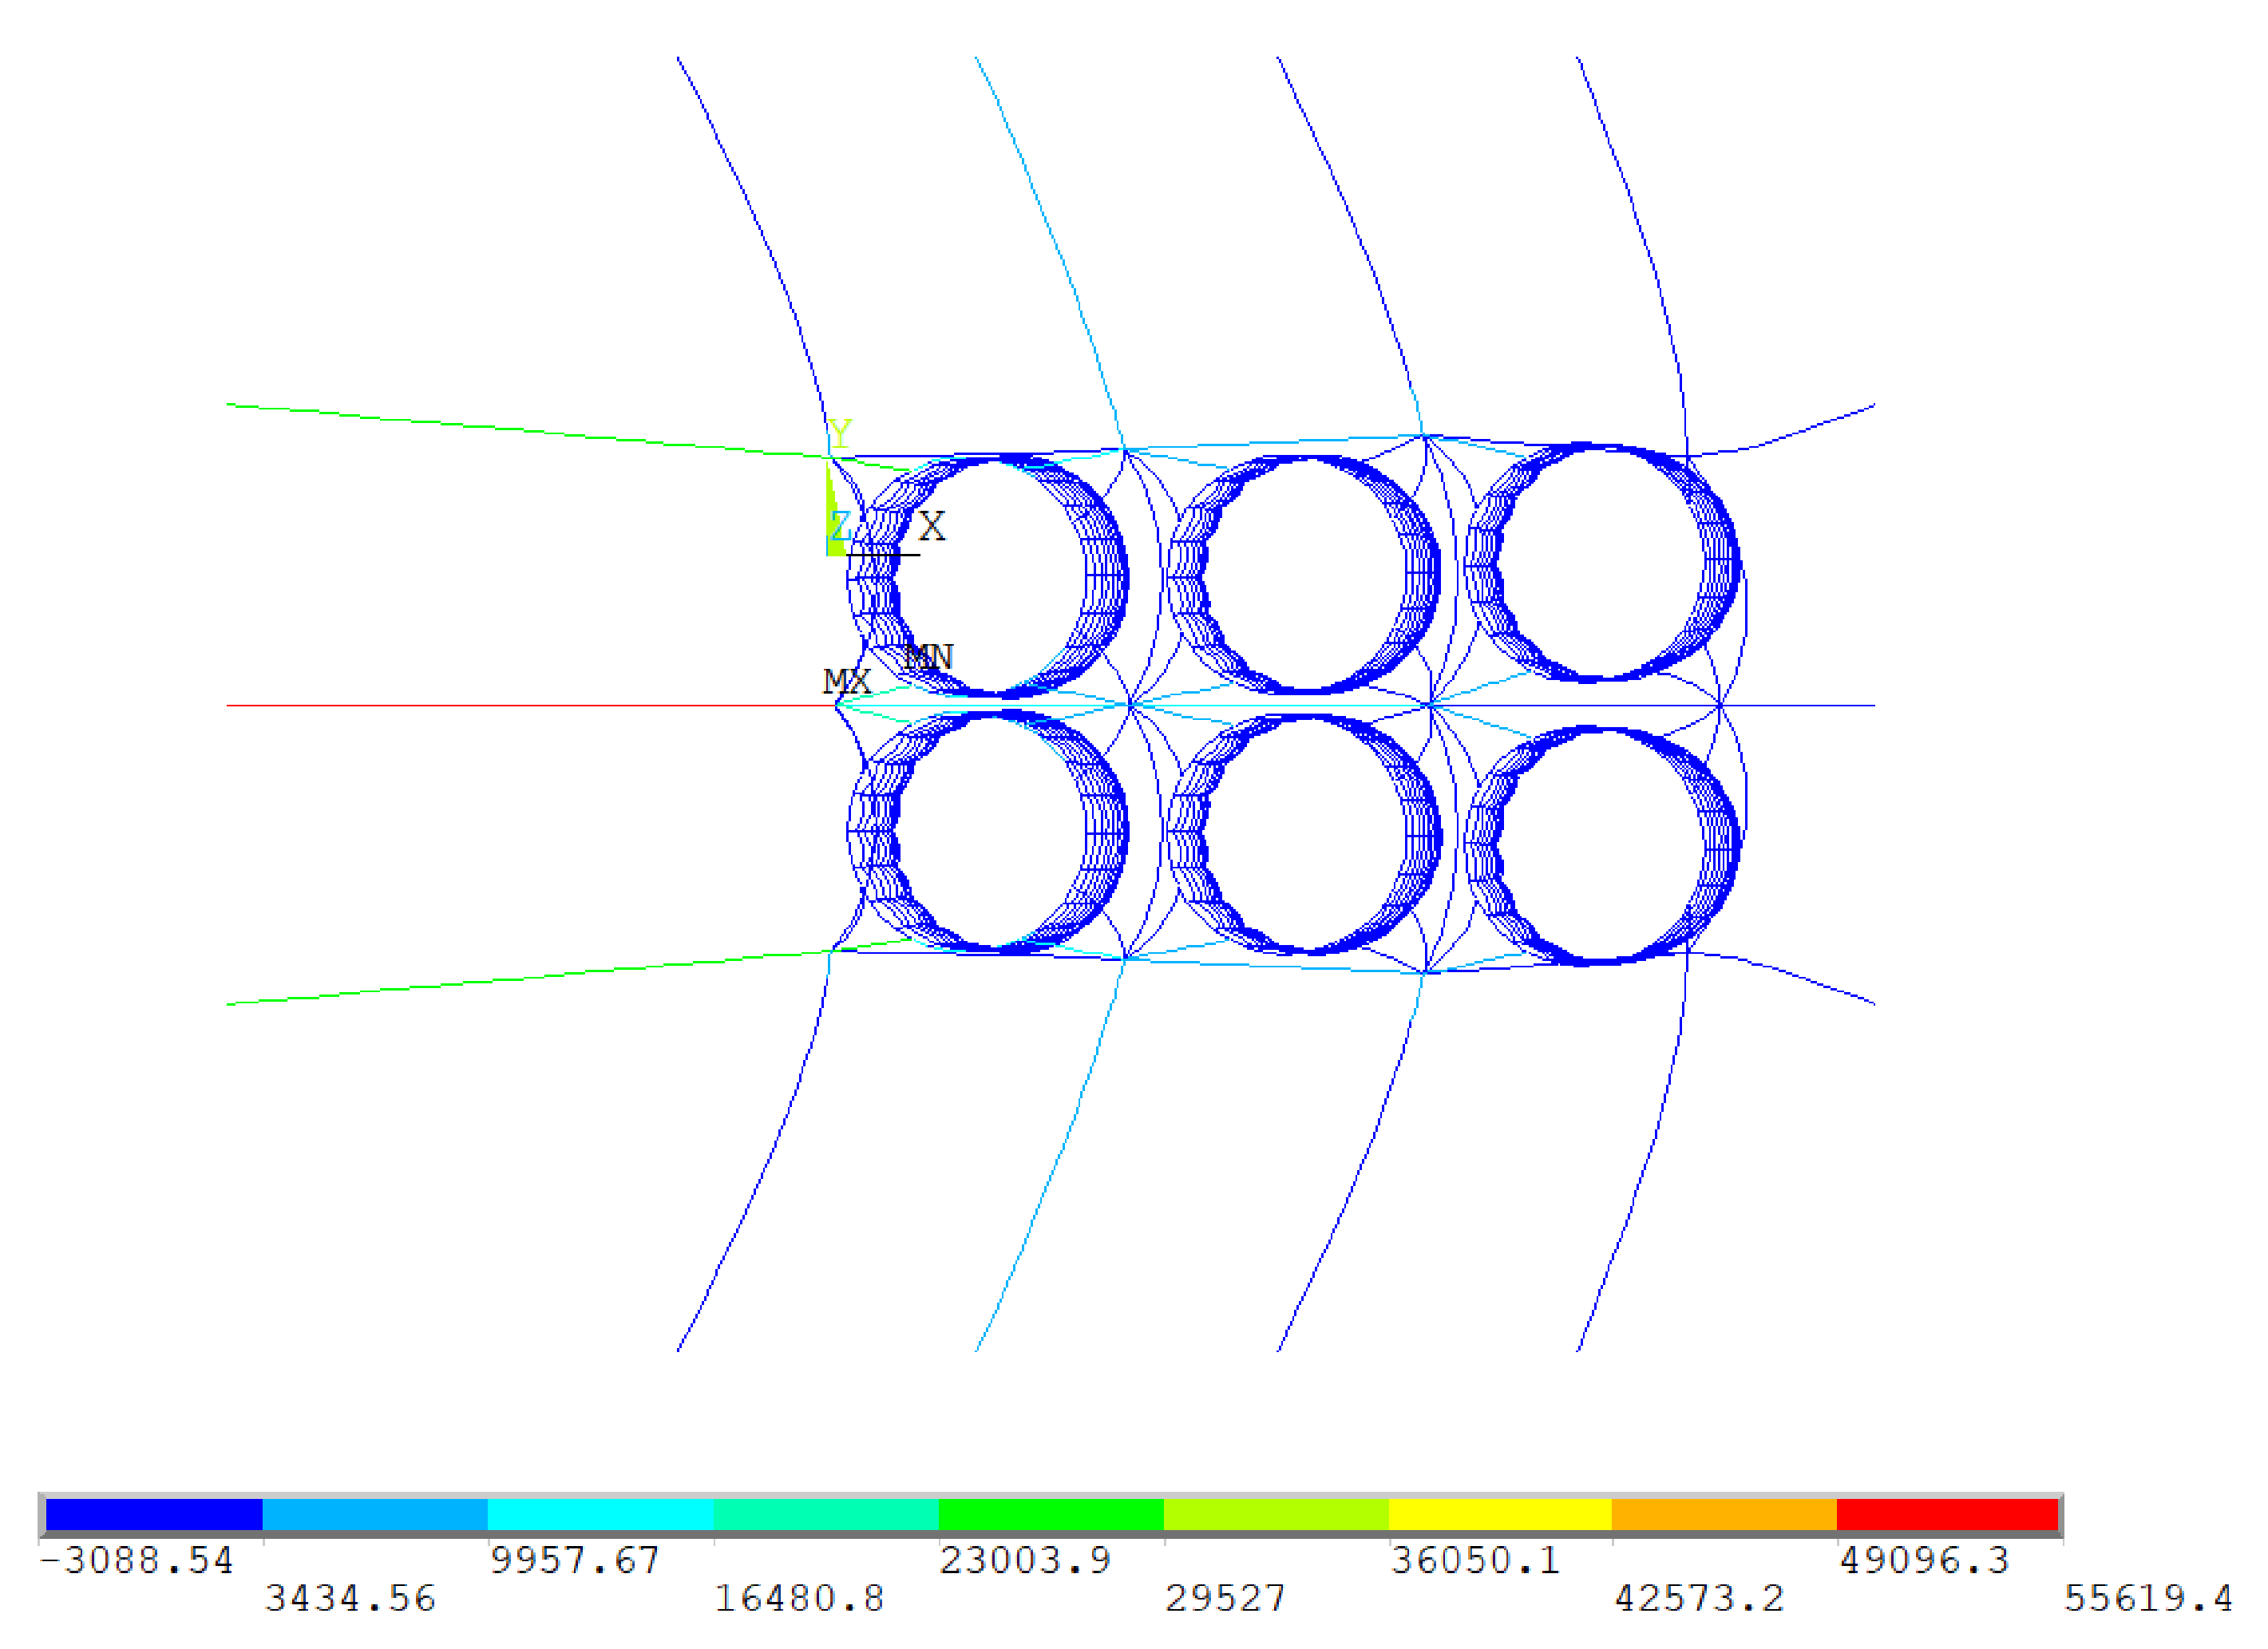
The results of the mooring forces in different sea states are shown in this section. The parameters of waves are consistent in Section 3.1 to study the effect of current velocity, while the current velocity in Section 3.2 is set as 0.5 m/s to study the effect of waves with different heights. At last, current and waves attack at different angles in Section 3.3. Figure 4 shows the example of the instantaneous axial force distribution.
Figure 4.
The instantaneous axial force distribution, unit: N. (current velocity = 0.5 m/s, wave height = 1 m, wave period = 10 s, time = 120 s).
Figure 4.
The instantaneous axial force distribution, unit: N. (current velocity = 0.5 m/s, wave height = 1 m, wave period = 10 s, time = 120 s).

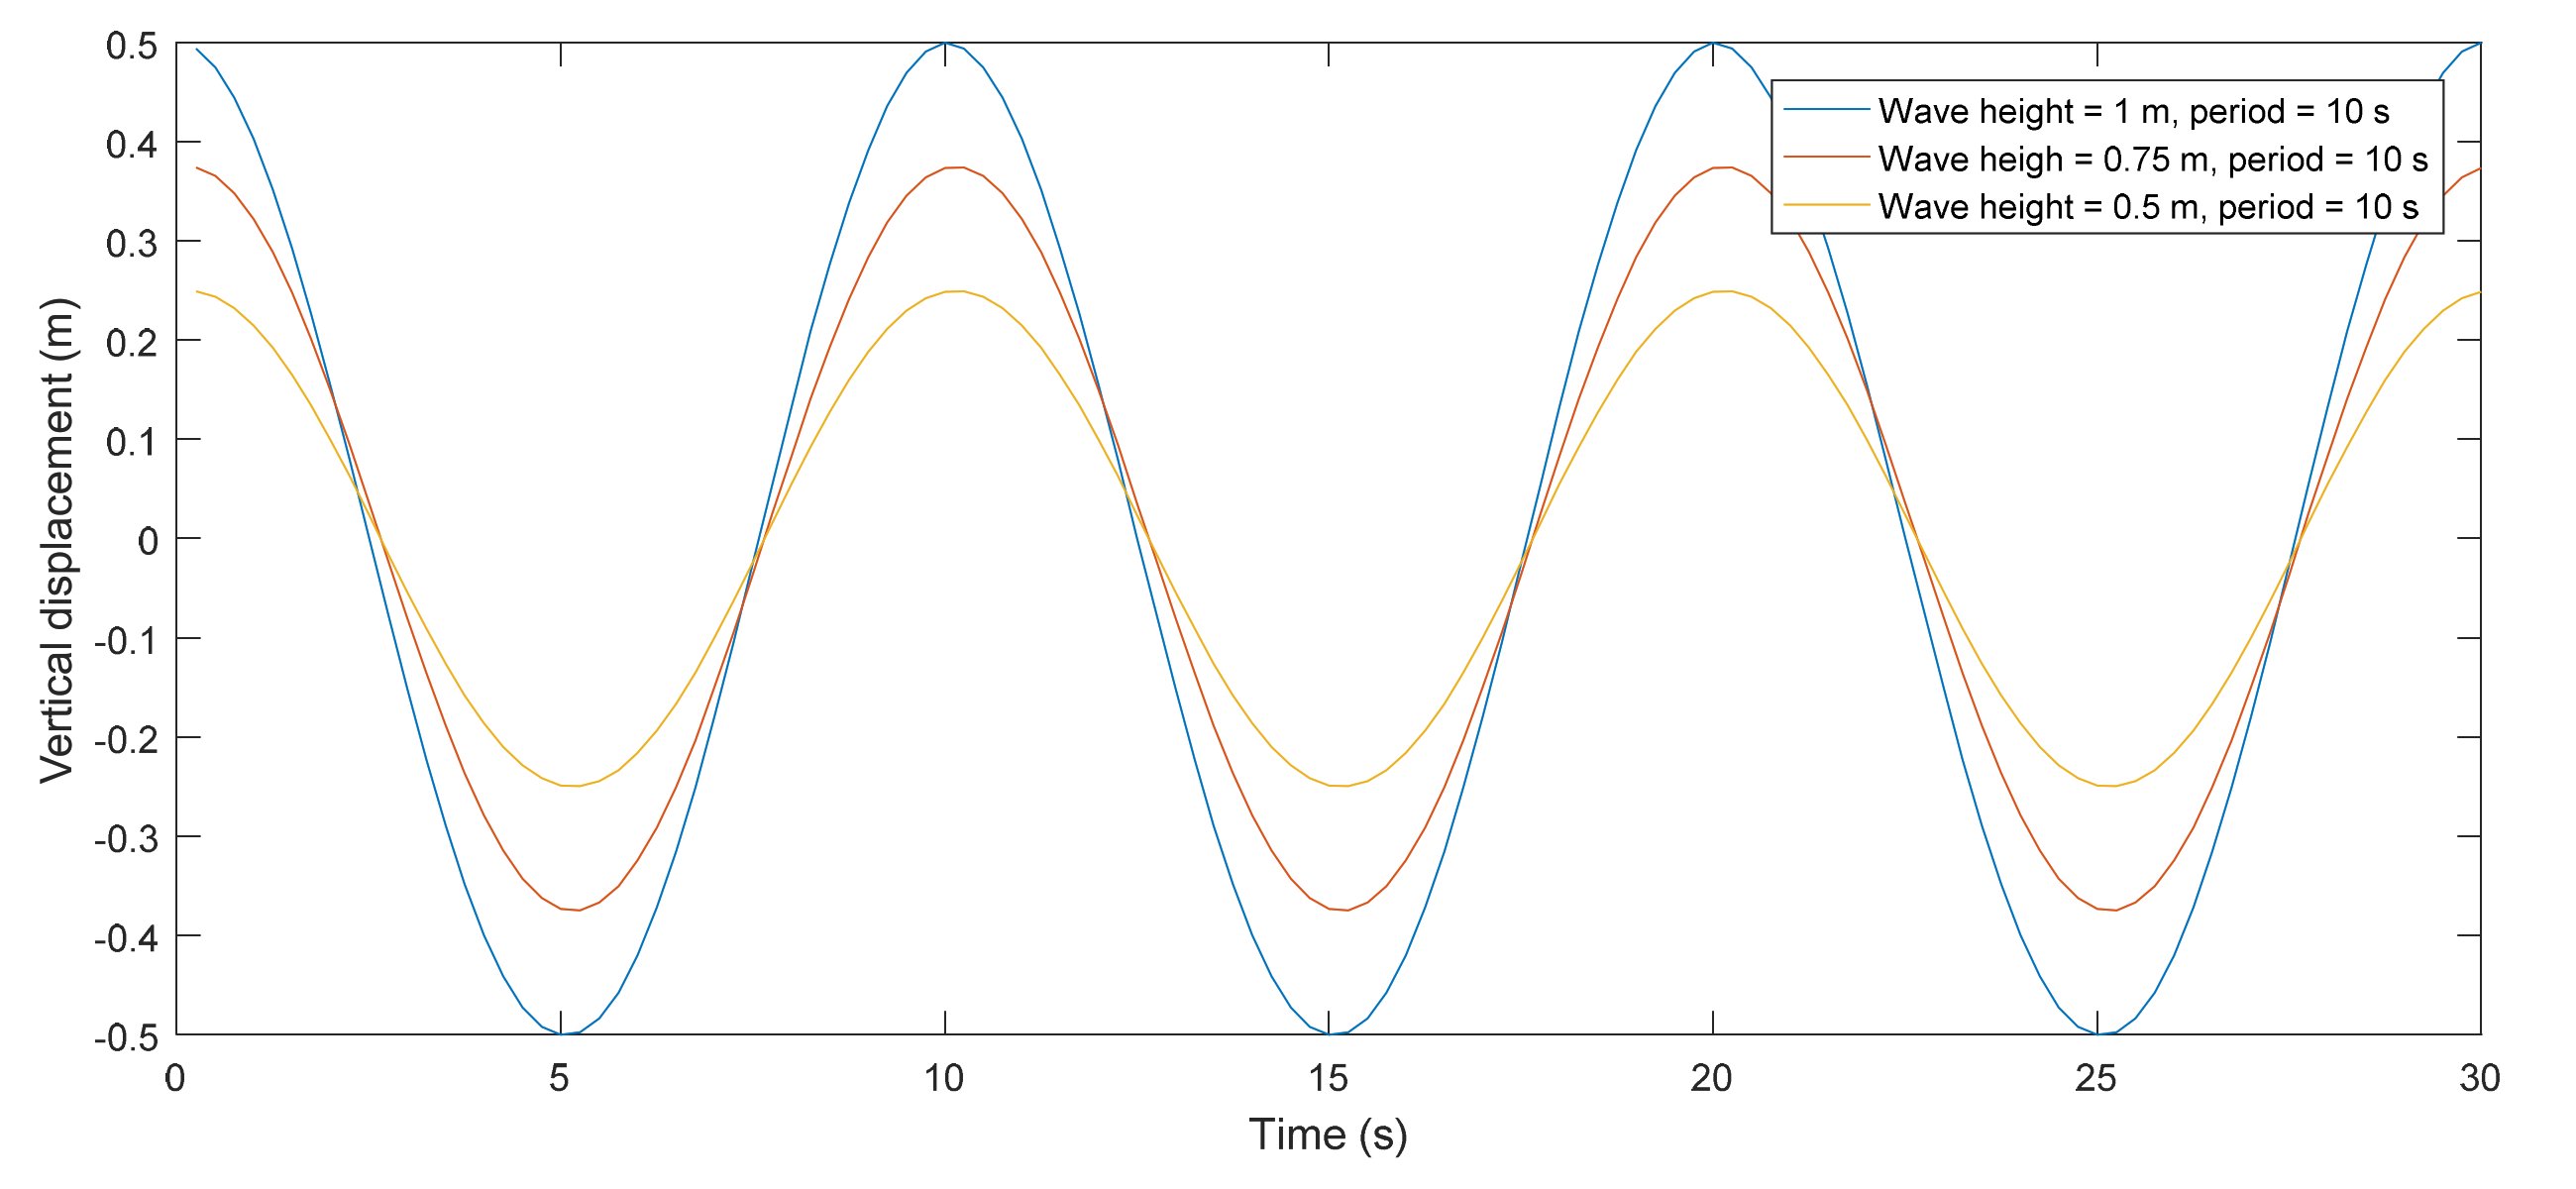
In addition to the mooring forces, it is found that the vertical displacements of collars are close to the wave height. Because the vertical displacements of different collars are almost the same, as they are subjected to the same sea states, the results of the upstream collar are used as an instance. Figure 5 shows the vertical displacements of the left node on the upstream collar under waves with different heights. The initial time of the motion in Figure 5 is when the cage already moves around its stable position.
3.1. Numerical Model Subjected to Different Current Velocities
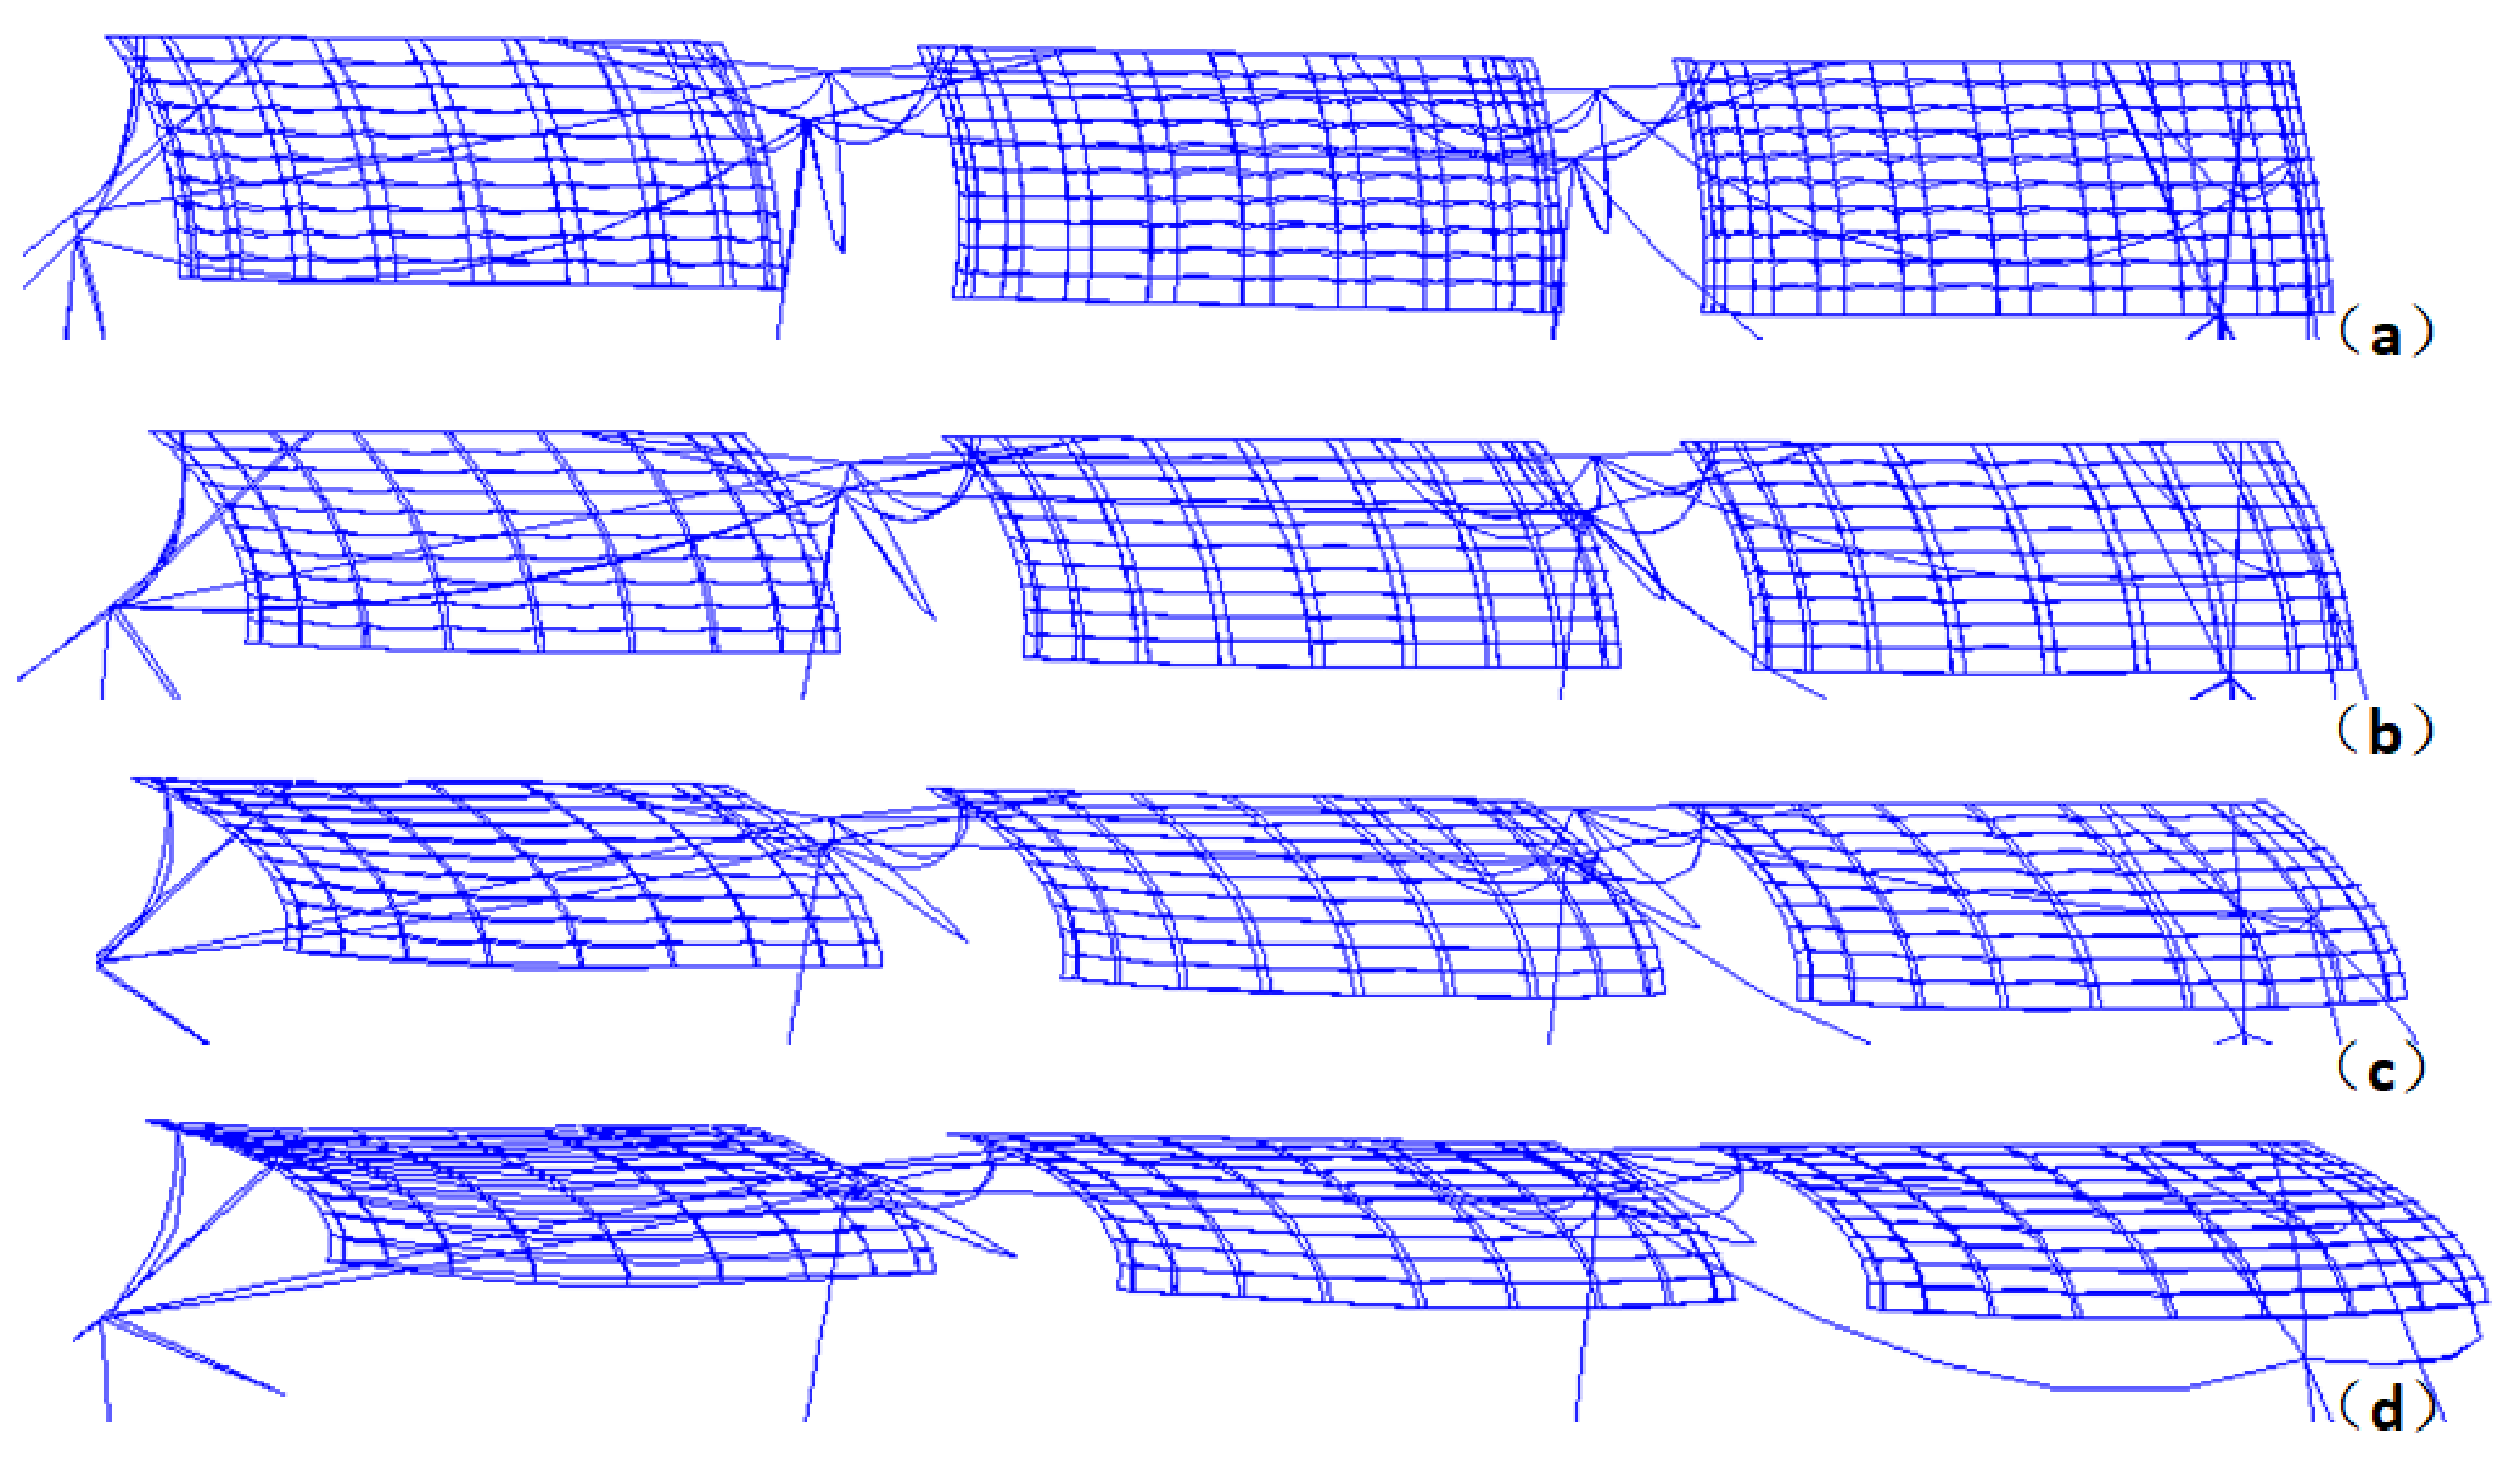
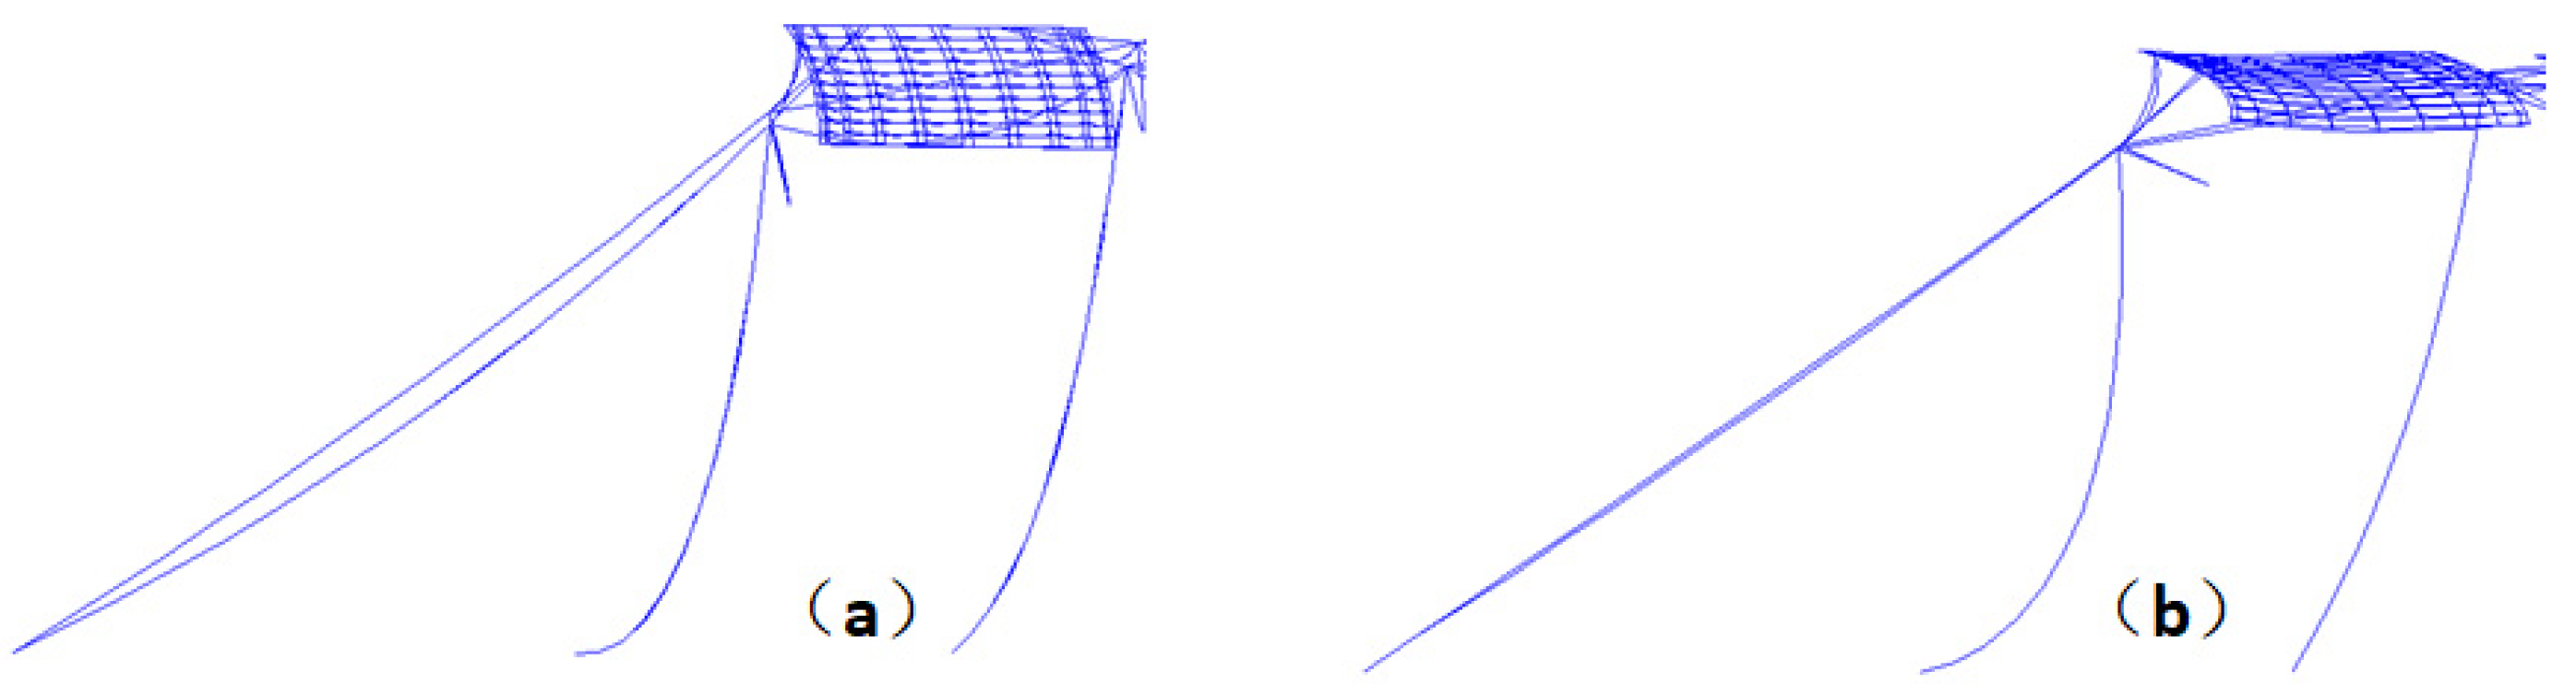
The mooring forces are assessed for the cage array in different sea states. Firstly, to study the effect of the current velocity, the numerical model is assumed to be under waves with a period of 10 s and a height of 1 m, but with different current velocities, varying from 0.25 m/s to 1 m/s. Figure 6 shows the deformation of the model under different current velocities. With the increase of current velocities, the cages deform more and move further away from their initial position. The cages downstream are less deformed than the cages upstream. Shapes of the upstream mooring cables under the current velocity of 0.25 m/s and 1 m/s are compared in Figure 7. When the current velocity is small, the mooring cables are bent due to their weight. However, when the current velocity increases to 1 m/s, the mooring cables are almost straight because of the large horizontal hydrodynamic load.
The mean values and amplitudes of the maximum mooring forces in different parts of the mooring system are listed in Table 3.
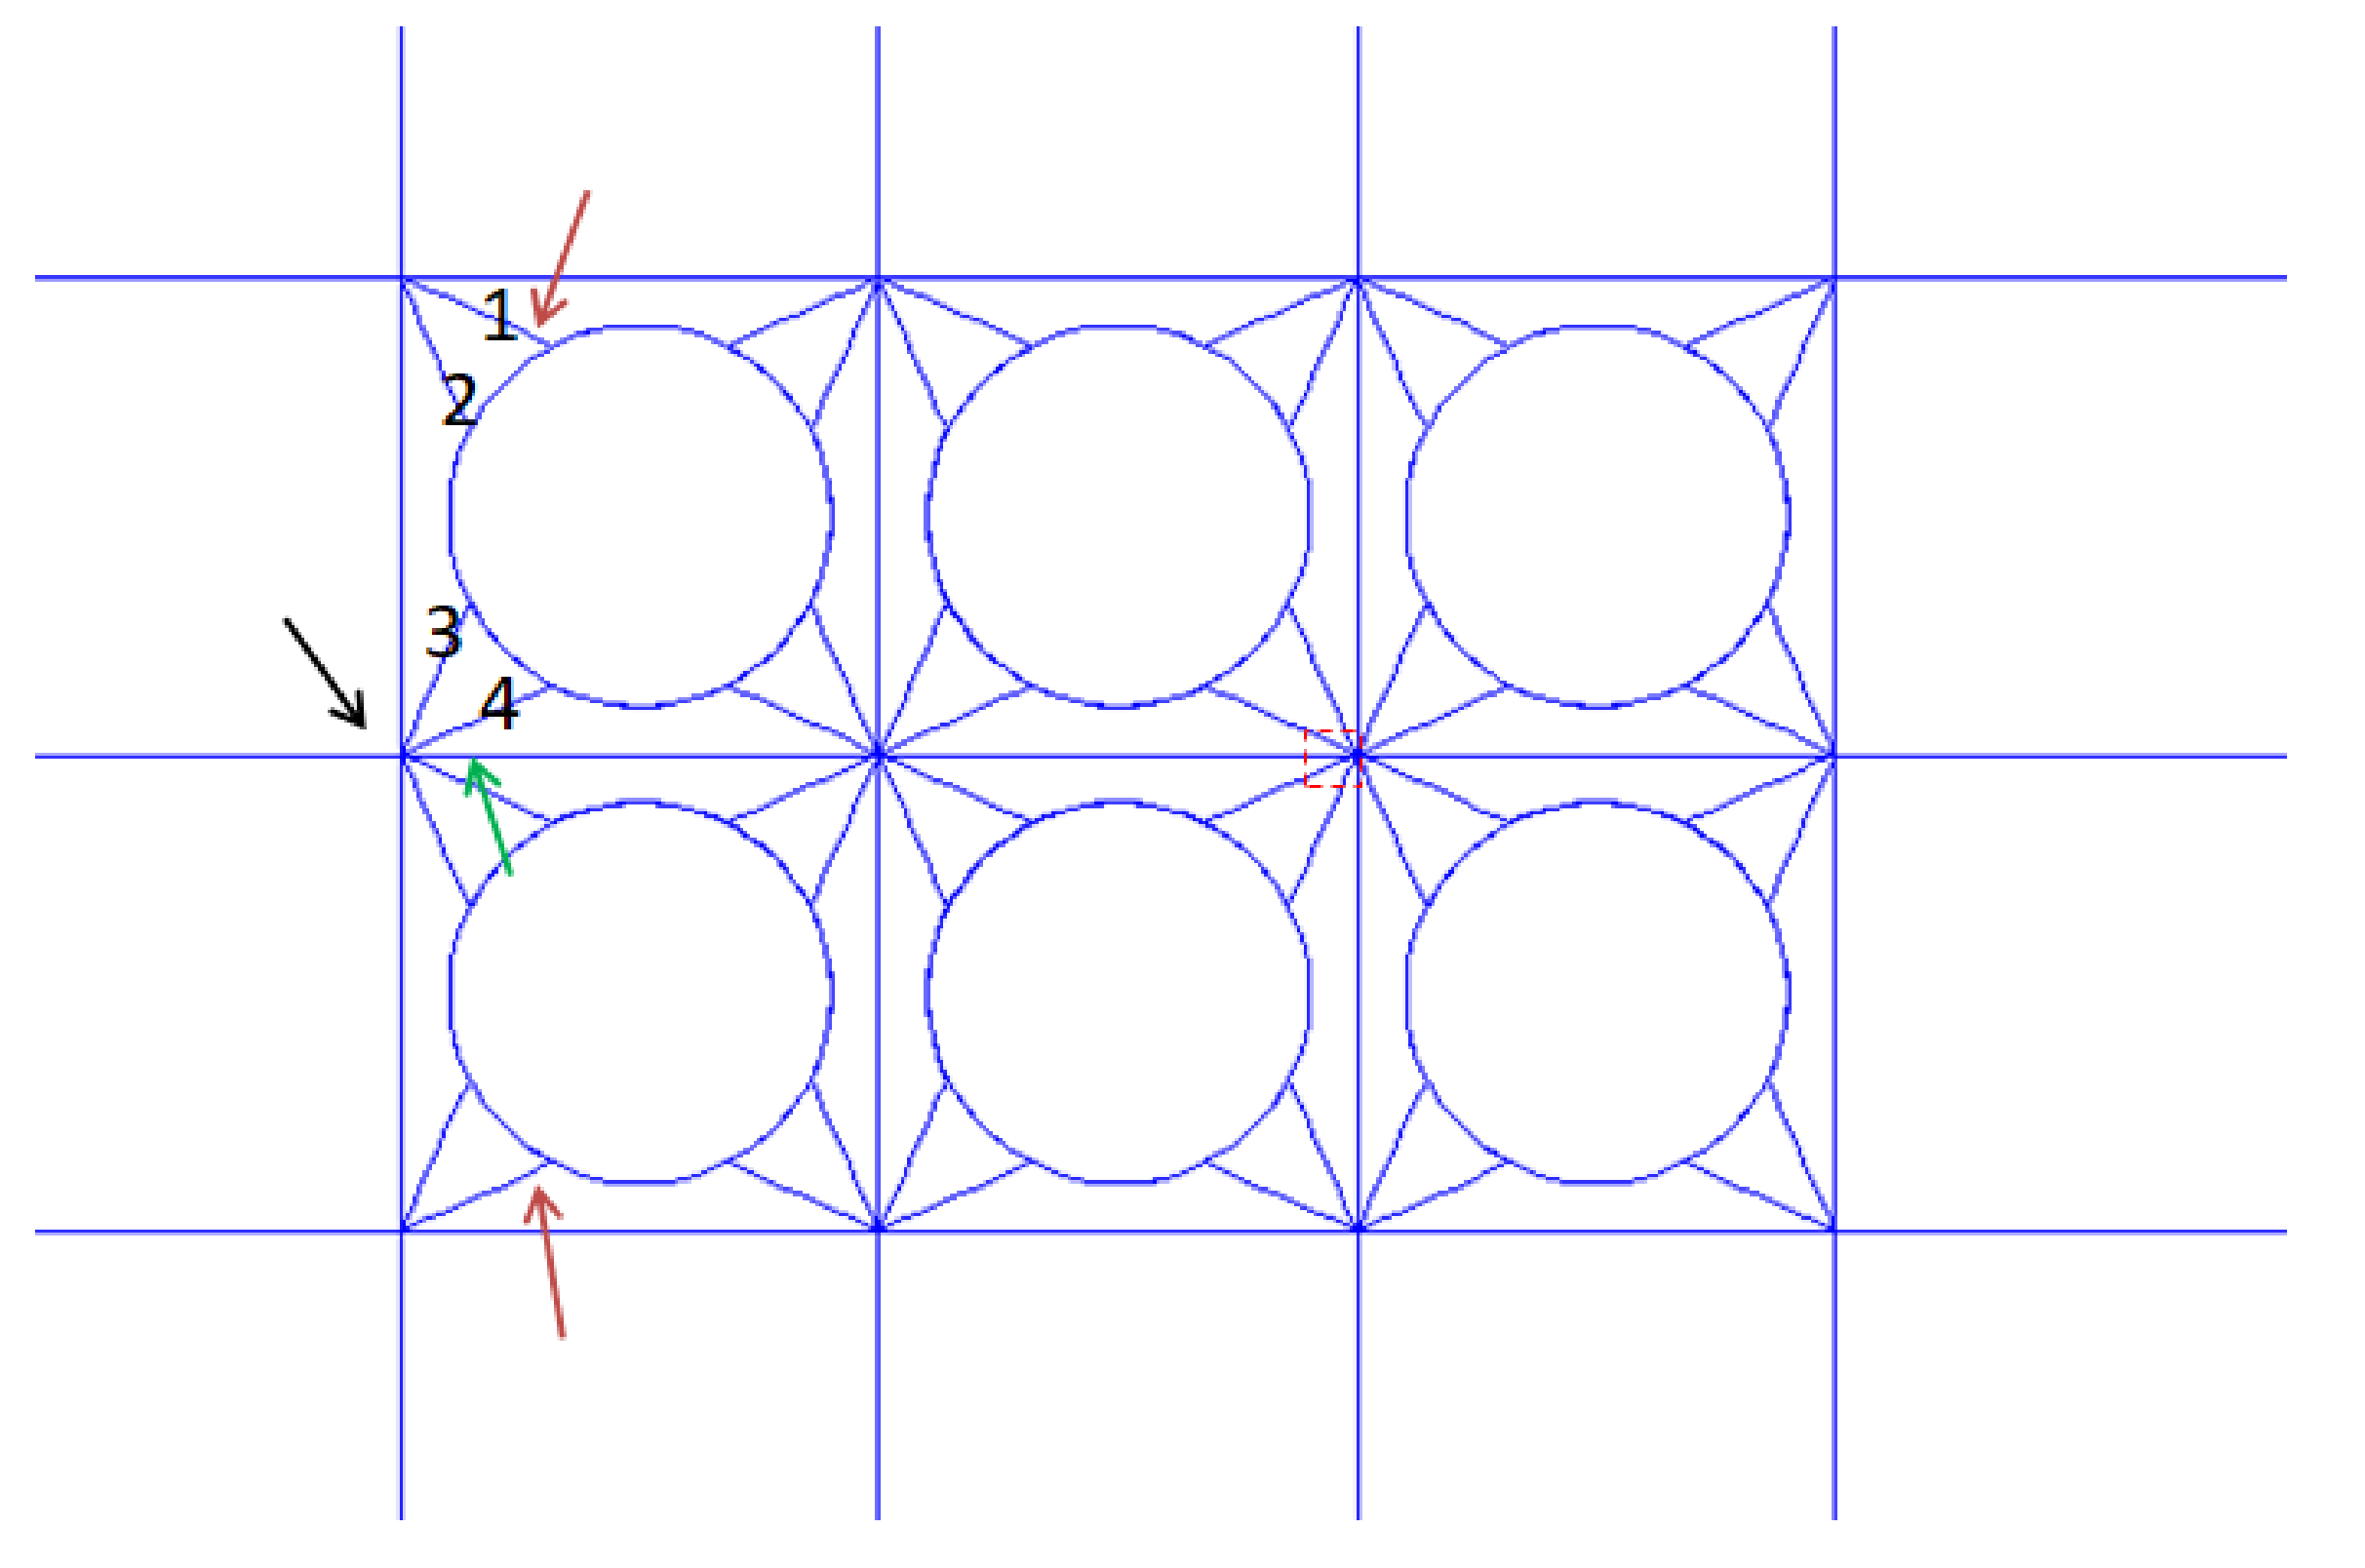
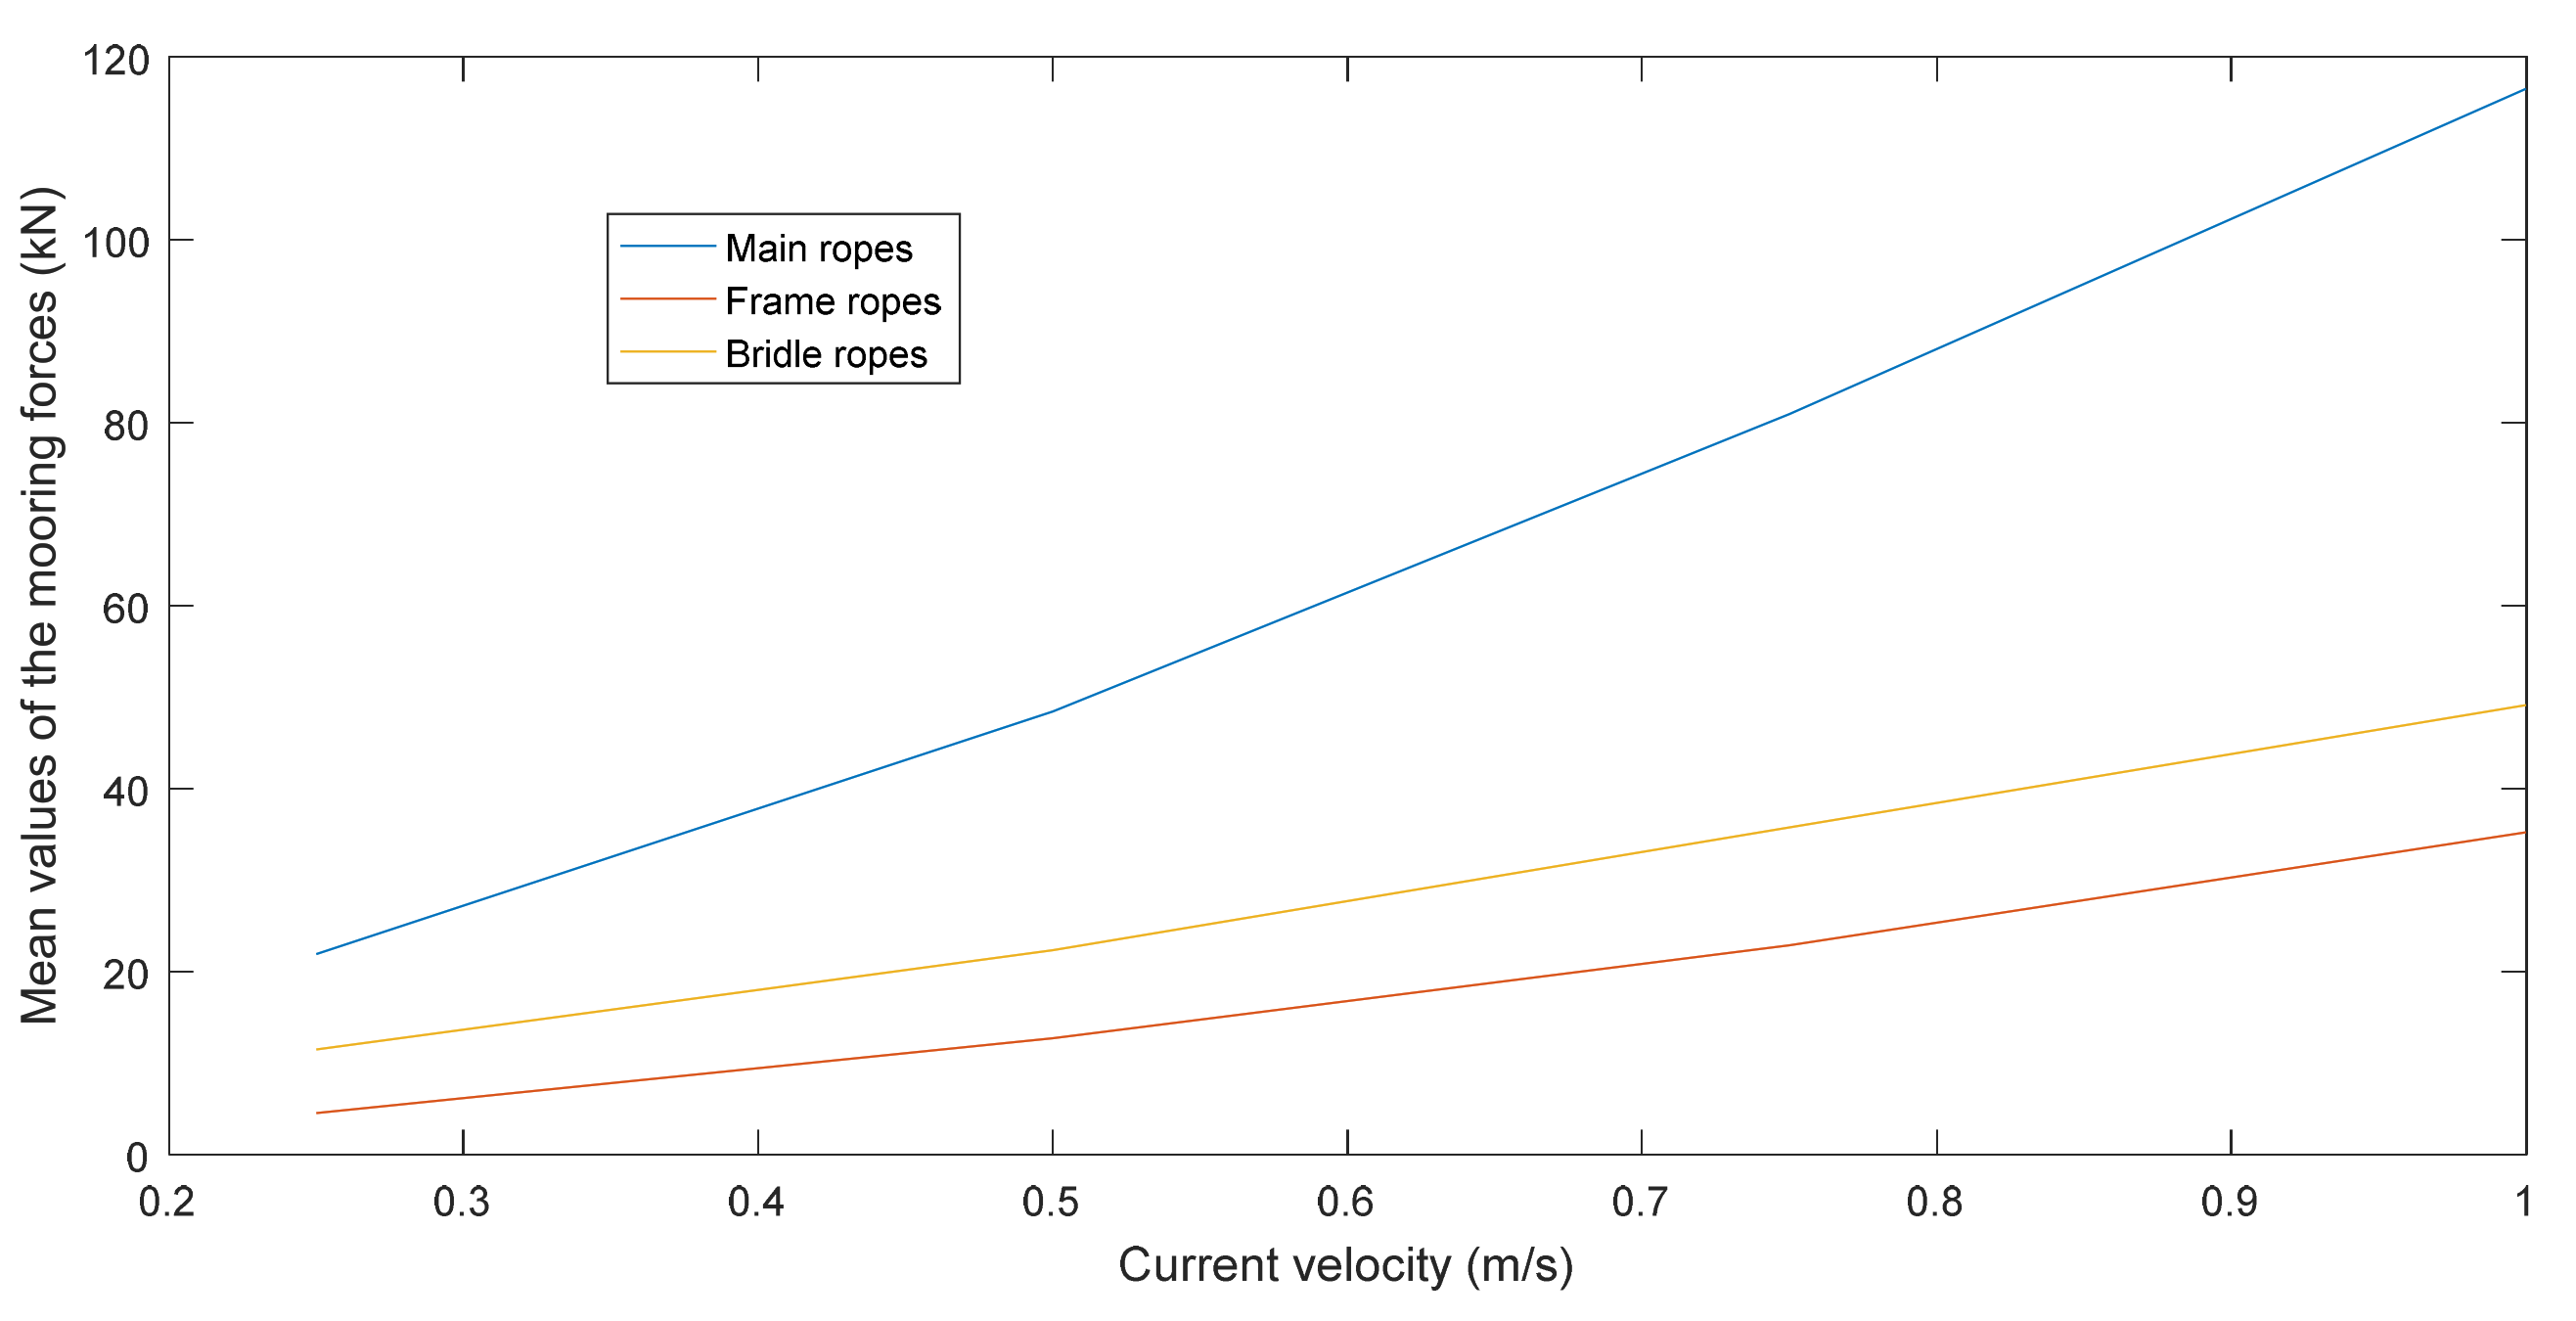
The mean values of all three parts increase with the current velocity. The maximum mean mooring force on the main cable is greatest and reaches 116.52 kN at a current velocity of 1 m/s, while the maximum mean mooring force on the bridle ropes is 49.1 kN and the maximum mean mooring force on the frame ropes is 35.23 kN. The location of the maximum mooring force is at the top of the middle upstream main rope, as indicated in Figure 8. The two outer bridle ropes in the upstream area have the largest mooring force among all the bridle ropes. The middle frame rope has the largest mooring force among all the frame ropes. From the plotting in Figure 9, the increase in the maximum mooring force on the main rope is much larger than the rest ropes.
In addition, the mooring forces on the two adjacent bridle ropes are not close. One is pulled tight and the other one is slack. For instance, Table 4 lists the mooring forces of the force bridle ropes that connect the cage in the upper left corner in Figure 8.
The mooring forces of Bridle rope 1 are greater than the ones of Bridle rope 4 under all current velocities. However, the values are close and much greater than the mooring forces of Bridle ropes 2 and 3. Even under the largest current velocity, 1 m/s, the maximum mean mooring forces of Bridle ropes 2 and 3 are only 0.28 kN and 0.50 kN, respectively, which shows that they do not play a role in pulling the cage when the current direction is the positive direction of the x-axis.
On the other hand, the variation of amplitudes of mooring forces in different parts is not as consistent as the one of mean values. The maximum amplitude of the mooring forces is 14.36 kN on the middle upstream main rope. As seen in Table 3, the amplitude of the maximum mooring forces on the main rope increases with the current velocity, which is the same as the mean value. However, the amplitude of the maximum mooring force on bridle ropes increases obviously with the current velocity until it reaches 0.75 m/s. The amplitude at a current velocity of 1 m/s is 6.73 kN, which is only 0.67% larger than the one at a current velocity of 0.75 m/s. Furthermore, there is no obvious relationship between the amplitude of the maximum mooring force on frame ropes and the current velocity. It might be because the rope is not tight when the current velocity is 0.25 m/s. Thus, the amplitude at a current velocity of 0.25 m/s is larger than the ones at a current velocity of 0.5 m/s and 0.75 m/s.
3.2. Numerical Model Subjected to Waves of Different Heights
The influence of wave height on the mooring force is studied in this section. Table 5 lists the mean values and amplitudes of the maximum mooring forces in different parts of the mooring system under a current velocity of 0.5 m/s and a wave period of 10 s but with different wave heights. The position of the maximum mooring force does not change with the wave height, which is the same as Figure 6. The mean values of the maximum mooring force increase slightly with the increase of wave height. For instance, when the wave height is 0.5 m, the mean value of the maximum mooring force on main ropes is 44.73 kN, which is 92.19% of the mean value when the wave height increases to 1 m. On the other hand, the influence of wave height on the amplitude is obvious. When the wave height is 0.5 m, the amplitudes of the maximum mooring forces on main ropes and bridle ropes are 3.4 kN and 2.11 kN, respectively, which are only 46.83% and 49.53% of the ones under wave height of 1 m.
3.3. Numerical Model Subjected to Different Attack Angles
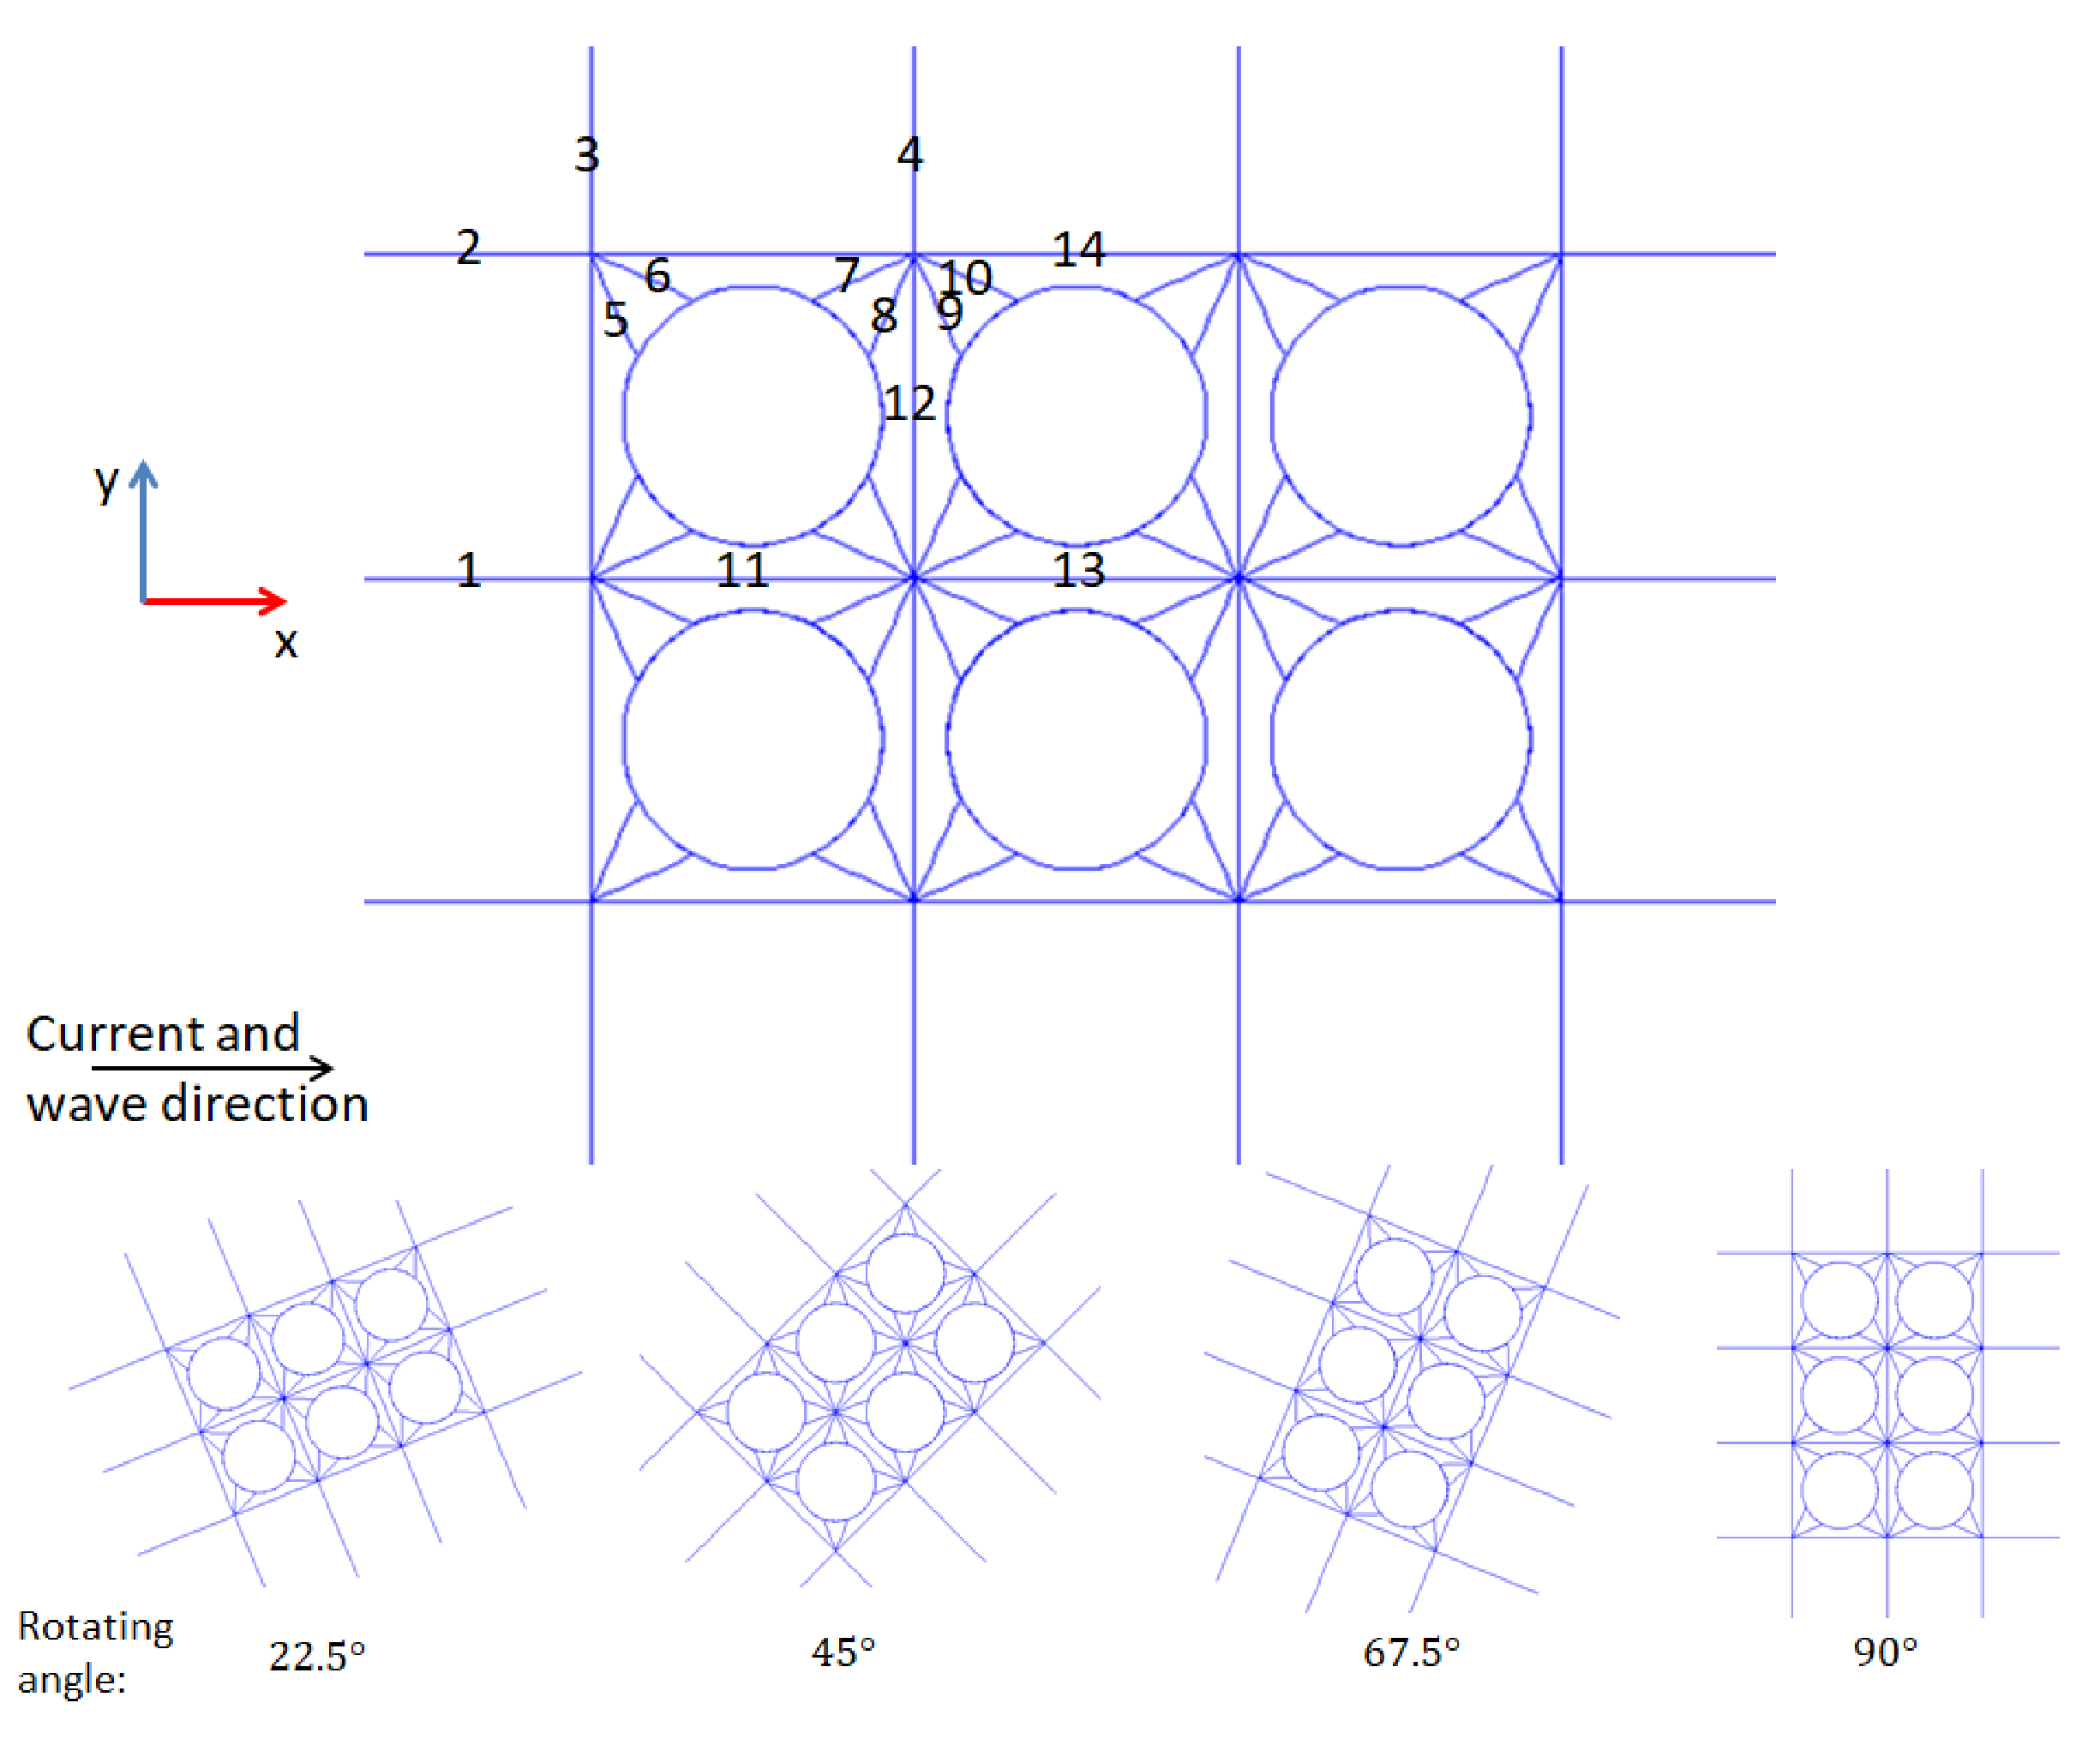
The influence of the attack angle is studied in this section. The current and wave direction are kept in the positive direction of the x-axis. The whole structure is rotated 22.5°, 45°, 67.5° and 90° around the z-axis and towards the positive y-axis, as shown in Figure 10. The mooring ropes are also numbered in Figure 10 to show the location of the maximum mooring force. The current velocity, wave height and wave period are kept as 0.5 m/s, 1 m and 10 s. The mooring forces of the numbered ropes are listed in Table 6, Table 7 and Table 8. The rest ropes are symmetrical to them or have much smaller mooring forces.
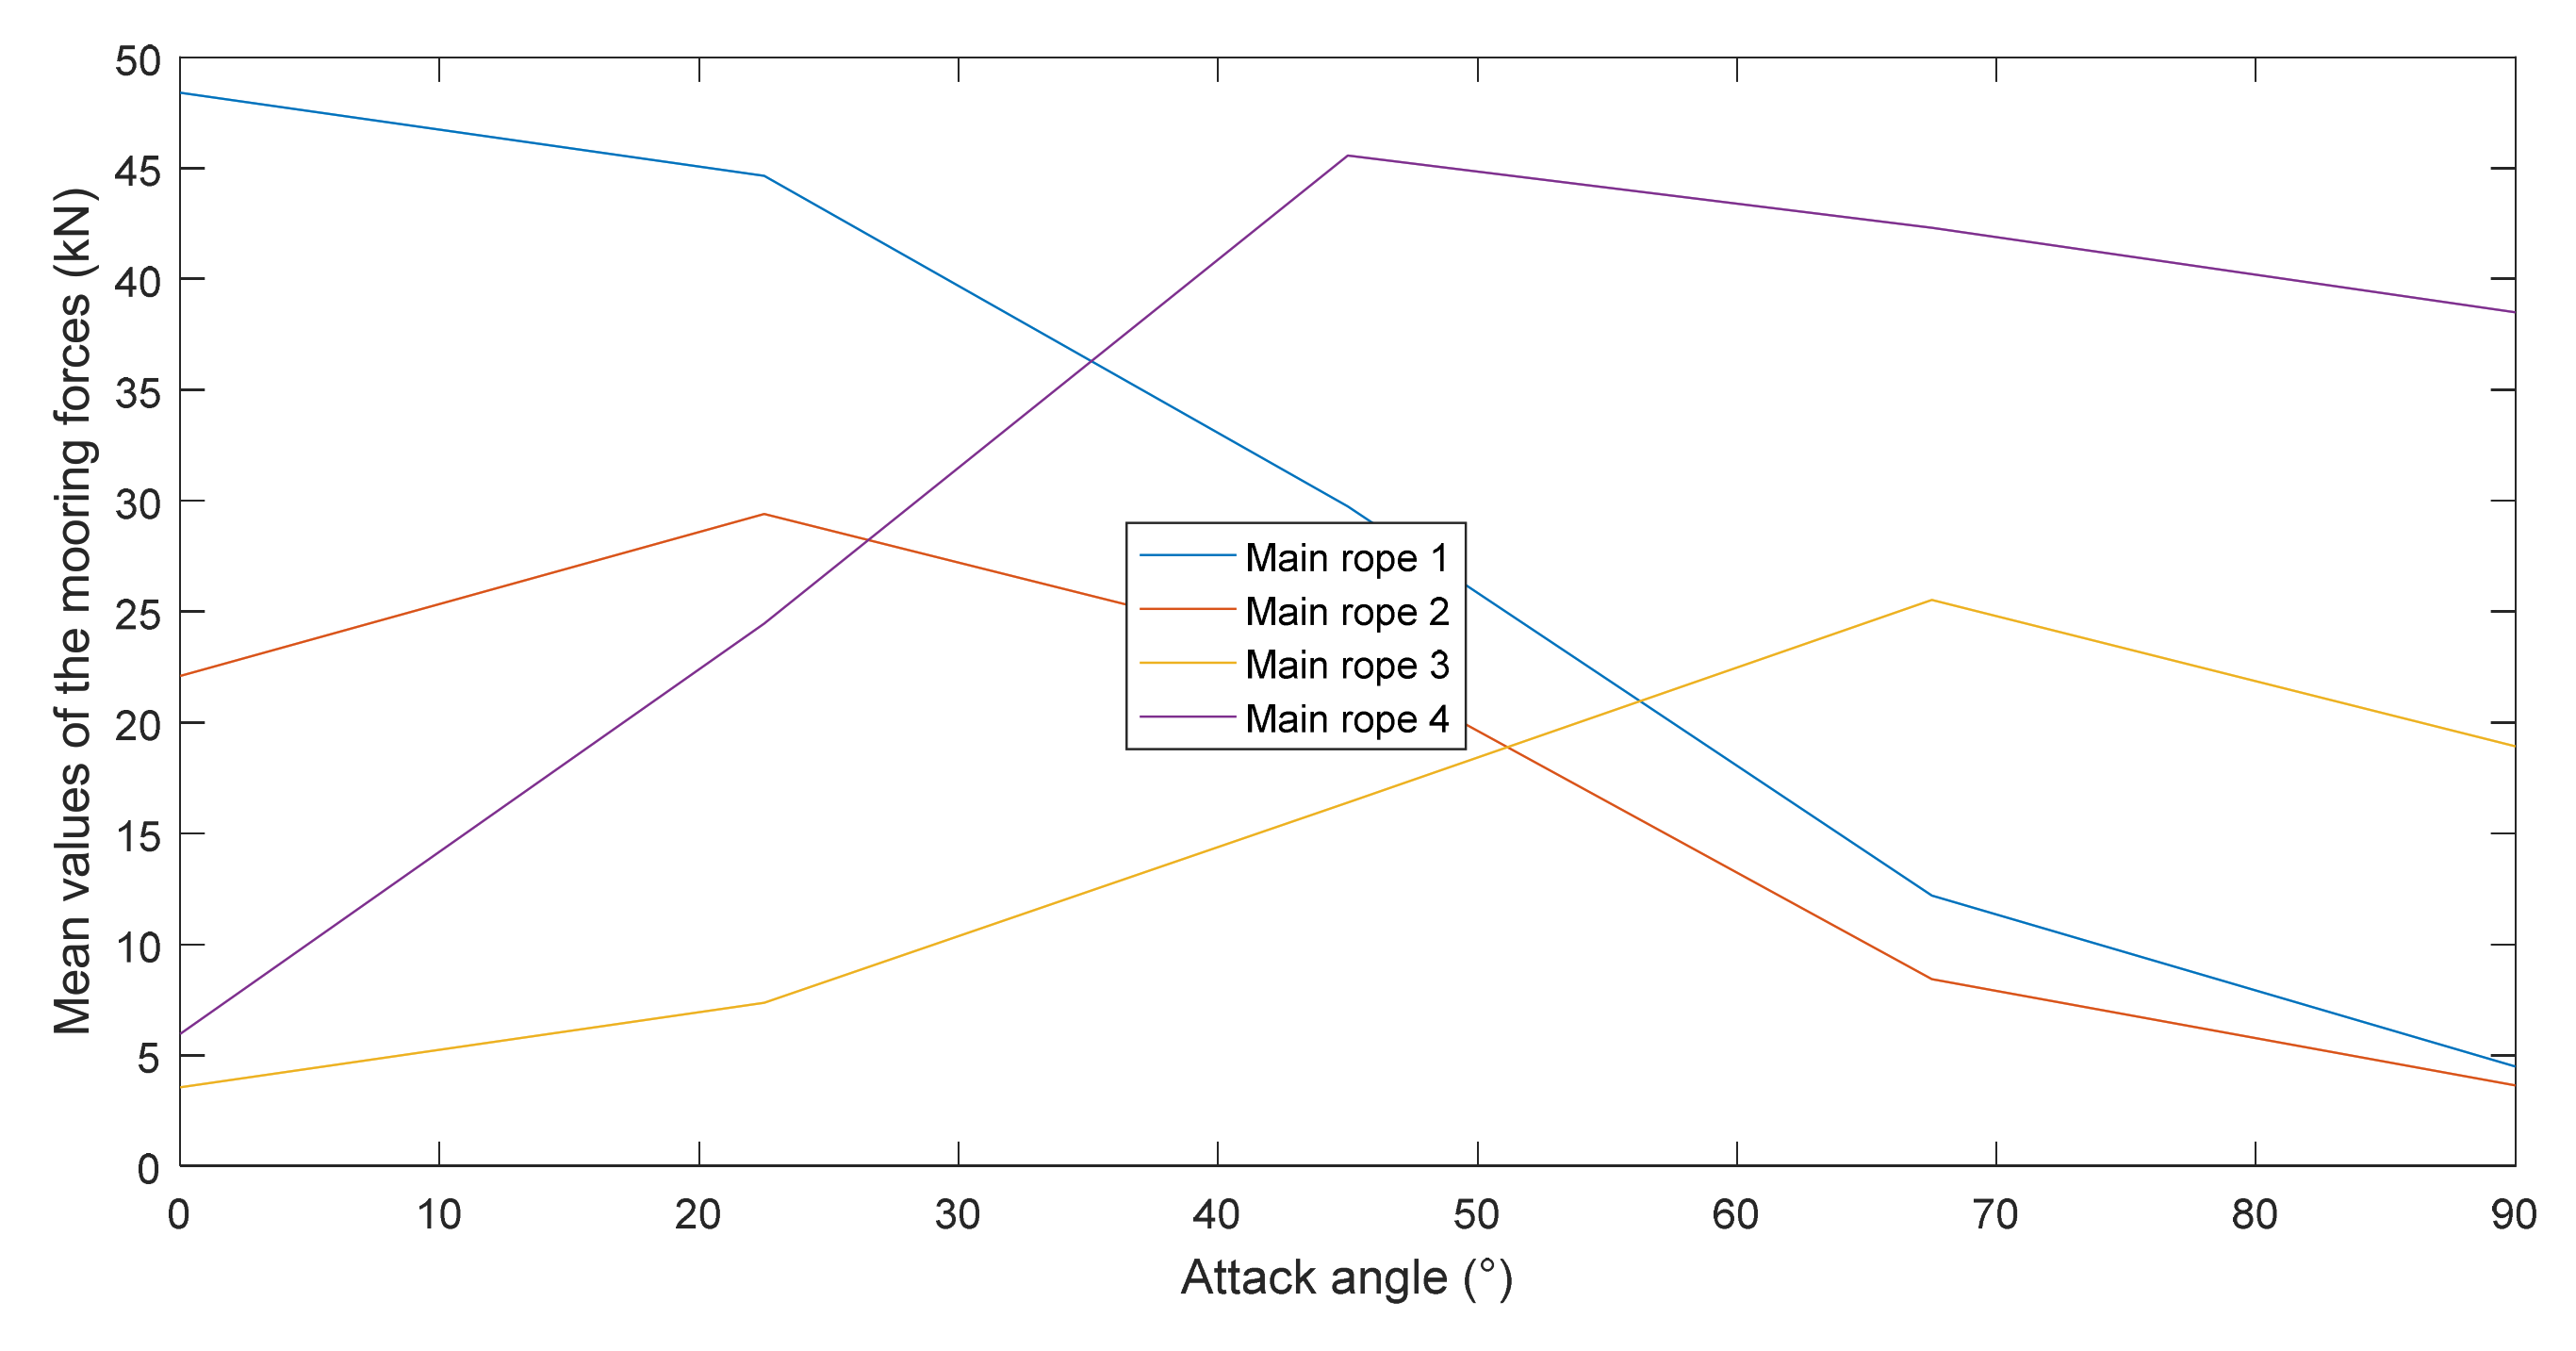
Table 6 lists the mean values and amplitudes of Main ropes 1 to 4 under different attack angles. The maximum mean value is 46.41 kN on Rope 1 when the attack angle is 0°. Rope 1 has the maximum mooring force when the attack angle is 0° and 22.5°. The location of maximum mooring force moves to Rope 4 since the attack angle changes to 45°. Among all the five working conditions, the smallest maximum mooring force is 38.49 kN at an attack angle of 90°. In addition, mean values of mooring forces for the four main ropes are plotted in Figure 11. The mooring force of Rope 1 decreases with the increase of the attack angle and reduces to 4.49 kN under an attack angle of 90°. The mooring forces of Ropes 2 and 3 reach their peak value of 29.41 kN and 25.52 kN under attack angles of 22.5° and 67.5°, respectively. The mooring force of Rope 4 reaches its peak value of 45.56 kN under an attack angle of 45° and remains at a high value when the attack angle is larger than 45°.
Table 7 lists the mean values and amplitudes of Bridle ropes 5 to 10 under different attack angles. It is assumed that the mooring force is mainly generated by its weight and the hydrodynamic load on it when the mooring force is less than 0.5 kN. The rope does not pull the cages and the mooring force on it is very small compared with others. Thus, the mean mooring forces under 0.5 kN are not listed in Table 7 and they are assumed to be slack. Under an attack angle of 0°, Ropes 5, 8 and 9 are slack, while the three rest ropes are slack under an attack angle of 90°. For the rest cases, all the numbered bridles are pulled tight except Rope 8 under an attack angle of 22.5°. The maximum mean value is 31.59 kN on Rope 7 under an attack angle of 22.5°. Rope 6 has the largest mooring force when the attack angle is smaller or equal to 45°, while the mooring force on Rope 5 is the largest if the attack angle is larger than 45°.
Under all the attack angles, the mooring forces on most frame ropes are very small and less than 0.5 kN. Thus, they are considered as slack, and the mooring forces on the rest numbered frame ropes are listed in Table 8. The maximum mean value is 12.68 kN on Rope 11 under an attack angle of 0°. When the attack angle is 45°, the maximum mean value is only 2.77 kN. If the attack angle is larger than 45°, all the frame ropes are slack except Rope 12 and its symmetrical rope.
4. Discussion
4.1. Mooring Force Distribution
The sea states in Section 3.1 and Section 3.2 include different current velocities and wave heights. Even though they have varying degrees of influence on the mean and amplitude of the maximum mooring forces, they do not change the position of the maximum mooring forces, which is at the top of the middle upstream main ropes. However, with the varying of the attack angle, the location of the maximum mooring force moves to other main ropes. The mooring forces on the upstream main ropes are much larger than the ones on other components under all the sea states. In addition, the location of the maximum mooring force is the connection of the multi-components, where the failure of the mooring system always occurs. Therefore, the connection of the upstream main ropes with frame and bridle ropes should be the most concerned location for future research.
On the other hand, from the axial force distributions and Table 8, except for several frame ropes which are connected to the main ropes, the rest are slack. Especially when the attack angle is not parallel or perpendicular to the frame ropes (22.5°, 45° and 67.5°), the mooring forces are transmitted mainly through the bride ropes but not frame ropes. The frame ropes have the smallest mooring forces under all the sea states. If the current direction of the working environment of the fish cage array keeps within a certain range all year round, some parts, especially the downstream part of the frame ropes, can be removed to save costs.
Two adjacent bridle ropes are applied to reduce the mooring force and the stress concentration on the connection between the bridle ropes and the collar. However, from the results in Table 4 and Table 7, most bridle ropes do not pull the cage together. In some cases, one of the bridle ropes is pulled tight and the other one is slack. Even when the two ropes are both tight, the mooring forces of one rope are usually much larger than that of the other one. Thus, the effectiveness of two ropes in reducing the stress concentration is questionable. Whether it can be solved by adding large pretension or adjusting angles between the bridle ropes need to be further studied.
4.2. Approximation of Wake Flow in APDL
In Section 2, it is mentioned that the current velocity reduction after each cage is assumed as 15% in the numerical model. It means that the current velocity subjected to each cage is constant and it is assumed that the cages have little effect on the wave orbital velocity. Thus, the ideal solution is to directly reduce the current velocity in the setting of the flow field. However, in Ansys/APDL, the current velocity cannot be changed in the direction of the current. The only approach to apply the wake flow is to adjust the drag coefficient to reduce the drag force directly.
In Equation (4), the velocity of water particle, u, can be divided into current velocity, C, which is a constant, and wave orbital velocity, u0. The drag force in the Morison equation can be expressed as:
where is the drag coefficient, C is the current velocity and is the relative velocity of the water particle to the structure.
From the present calculations, the value of is relatively small compared with the current velocity. For instance, when the current velocity is 0.5 m/s, the wave period is 10 s and wave height is 1 m, and the average value of is only 0.075 m/s for the net close to the water surface of the upstream cage. Thus, instead of adjusting the current velocity, which is not applicable in Ansys/APDL, the drag coefficient is reduced to consider the wake flow in our model. This approach is used to simulate the structures subjected to uniform flow or long waves, when equals a small value or 0. However, when the relative motion of the structure to the water particle is close to the current velocity, for instance, when the current velocity is very small, it may cause a large error to reduce the drag coefficient.
5. Conclusions
In the present paper, the mooring forces in a fish cage array subjected to currents and waves are investigated using the finite element method. The fish cage array model includes six gravity cages, and the mooring system is modelled by Ansys/APDL. The mooring forces are assessed for the system in different sea states. It was concluded that:
- The cages deform more and move further away from their initial position with the increase of the current velocity.
- Both the mean values and the amplitudes of mooring forces increase with the current velocity and wave height. The tops of the upstream main ropes have the maximum mooring force under all sea states, which is also the connection location of multi-components. It should be the most concerned location for future research.
- The mooring forces on the frame ropes are the smallest while most frame ropes are slack. The downstream frame ropes do not play a structural role and can be removed.
- In most cases, the two adjacent bridle ropes do not pull the cage together, as the mooring force on one bridle rope is usually much larger than the other one. Thus, the two adjacent ropes do not always effectively reduce the stress concentration.
Author Contributions
The concept of the problem is developed by Z.L., S.W. and C.G.S. The FEA analysis is performed by Z.L. The writing of the original draft manuscript is done by Z.L, S.W. and C.G.S. All authors have read and agreed to the published version of the manuscript.
Funding
This work was performed within the project HYDROELASTWEB—Hydroelastic behaviour of horizontal flexible floating structures for applications to Floating Breakwaters and Wave Energy Converters, which was funded by the Portuguese Foundation for Science and Technology (Fundação para a Ciência e a Tecnologia—FCT) under contract 031488_770 (PTDC/ECI-EGC/31488/2017). The first author is funded by the Portuguese Foundation for Science and Technology (Fundação para a Ciência e a Tecnologia-FCT), through a doctoral fellowship under the contract no. SFRH/BD/147178/2019. This work contributes to the Strategic Research Plan of the Centre for Marine Technology and Ocean Engineering (CENTEC), which is financed by the Portuguese Foundation for Science and Technology (Fundação para a Ciência e Tecnologia—FCT) under contract UIDB/UIDP/00134/2020.
Conflicts of Interest
The authors declare no conflict of interest.
References
- FAO. The State of World Fisheries and Aquaculture; Publishing Policy and Support Branch, Office of Knowledge Exchange, Research and Extension; Fisheries and Aquaculture Department, Food and Agriculture Organization of the United Nations: Rome, Italy, 2018. [Google Scholar]
- Holmer, M. Environmental issues of fish farming in offshore waters: Perspectives, concerns and research needs. Aquac. Environ. Interact. 2010, 1, 57–70. [Google Scholar] [CrossRef] [Green Version]
- Benetti, D.D.; Benetti, G.I.; Rivera, J.A.; Sardenberg, B.; O’Hanlon, B. Site Selection Criteria for Open Ocean Aquaculture. Mar. Technol. Soc. J. 2010, 44, 22–35. [Google Scholar] [CrossRef]
- Xu, Z.; Qin, H. Fluid-structure interactions of cage based aquaculture: From structures to organisms. Ocean Eng. 2020, 217, 107961. [Google Scholar] [CrossRef]
- Føre, H.M.; Endresen, P.C.; Bjelland, H.V. Load Coefficients and Dimensions of Raschel Knitted Netting Materials in Fish Farms. In Proceedings of the ASME 2021 40th International Conference on Ocean, Offshore and Arctic Engineering, Online, 21–30 June 2021; Volume 6: Ocean Engineering, p. V006T06A044. [Google Scholar] [CrossRef]
- Dong, S.; You, X.; Hu, F. Experimental investigation on the fluid–structure interaction of a flexible net cage used to farm Pacific bluefin tuna (Thunnus orientalis). Ocean Eng. 2021, 226, 108872. [Google Scholar] [CrossRef]
- Hou, H.-M.; Dong, G.-H.; Xu, T.-J. Analysis of probabilistic fatigue damage of mooring system for offshore fish cage considering long-term stochastic wave conditions. Ships Offshore Struct. 2020, 1–12. [Google Scholar] [CrossRef]
- Fredriksson, D.W.; DeCew, J.C.; Tsukrov, I. Development of structural modeling techniques for evaluating HDPE plastic net pens used in marine aquaculture. Ocean Eng. 2007, 34, 2124–2137. [Google Scholar] [CrossRef]
- Moe, H.; Fredheim, A.; Heide, M.A. New net cage de-signs to prevent tearing during handling. In Maritime Transportation and Exploitation of Ocean and Coastal Resources; Guedes Soares, C., Garbatov, Y., Fonseca, N., Eds.; Taylor & Francis Group: London, UK, 2005; pp. 1265–1272. [Google Scholar]
- Endresen, P.C.; Føre, M.; Fredheim, A.; Kristiansen, D.; Enerhaug, B. Numerical Modeling of Wake Effect on Aquaculture Nets. In Proceedings of the ASME 2013 32nd International Conference on Ocean, Offshore and Arctic Engineering, Nantes, France, 9–14 June 2013; Volume 3: Materials Technology, Ocean Space Utilization. p. V003T05A027. [Google Scholar]
- Bai, X.-D.; Xu, T.-J.; Zhao, Y.-P.; Dong, G.-H.; Bi, C.-W. Fatigue assessment for the floating collar of a fish cage using the deterministic method in waves. Aquac. Eng. 2016, 74, 131–142. [Google Scholar] [CrossRef]
- Zhao, Y.-P.; Bi, C.-W.; Chen, C.-P.; Li, Y.-C.; Dong, G. Experimental study on flow velocity and mooring loads for multiple net cages in steady current. Aquac. Eng. 2015, 67, 24–31. [Google Scholar] [CrossRef]
- Fu, S.; Xu, Y.; Hu, K.; Zhang, Y. Experimental investigation on hydrodynamics of floating cylinder in oscillatory and steady flows by forced oscillation test. Mar. Struct. 2013, 34, 41–55. [Google Scholar] [CrossRef]
- Berstad, A.J.; Tronstad, H. Response from current and regular/irregular waves on a typical polyethylene fish farm. In Maritime Transportation and Exploitation of Ocean and Coastal Resources; Guedes Soares, C., Garbatov, Y., Fonseca, N., Eds.; Taylor & Francis Group: London, UK, 2005; pp. 1189–1196. [Google Scholar]
- Lee, C.W.; Kim, H.S.; Lee, G.H.; Koo, K.Y.; Choe, M.Y.; Cha, B.J.; Jeong, S.J. Computation modeling of the moored flexible structures. In Maritime Transportation and Exploitation of Ocean and Coastal Resources; Guedes Soares, C., Garbatov, Y., Fonseca, N., Eds.; Taylor & Francis Group: London, UK, 2005; pp. 1239–1243. [Google Scholar]
- Li, L.; Fu, S.; Xu, Y.; Wang, J.; Yang, J. Dynamic responses of floating fish cage in waves and current. Ocean Eng. 2013, 72, 297–303. [Google Scholar] [CrossRef]
- Li, L.; Fu, S.; Xu, Y. Nonlinear hydroelastic analysis of an aquaculture fish cage in irregular waves. Mar. Struct. 2013, 34, 56–73. [Google Scholar] [CrossRef]
- DeCew, J.; Fredriksson, D.; Lader, P.; Chambers, M.; Howell, W.; Osienki, M.; Celikkol, B.; Frank, K.; Høy, E. Field measurements of cage deformation using acoustic sensors. Aquac. Eng. 2013, 57, 114–125. [Google Scholar] [CrossRef]
- Gansel, L.C.; Oppedal, F.; Birkevold, J.; Tuene, S.A. Drag forces and deformation of aquaculture cages—Full-scale towing tests in the field. Aquac. Eng. 2018, 81, 46–56. [Google Scholar] [CrossRef]
- Guo, Y.; Mohapatra, S.; Guedes Soares, C. Review of developments in porous membranes and net-type structures for breakwaters and fish cages. Ocean Eng. 2020, 200, 107027. [Google Scholar] [CrossRef]
- Dong, G.-H.; Hou, H.-M.; Xu, T.-J. Model uncertainty in hydrodynamic characteristics by numerical models for aquaculture plant and mooring system. Ocean Eng. 2021, 219, 108383. [Google Scholar] [CrossRef]
- Bernardo, T.; Guedes Soares, C. Validation of tools for the analysis of offshore aquaculture installations. In Developments in Maritime Technology and Engineering; Guedes Soares, C., Santos, T.A., Eds.; Taylor and Francis: London, UK, 2021; Volume 2, pp. 685–692. [Google Scholar] [CrossRef]
- Mohapatra, S.; Bernardo, T.; Guedes Soares, C. Dynamic wave induced loads on a moored flexible cylindrical net cage with analytical and numerical model simulations. Appl. Ocean Res. 2021, 110, 102591. [Google Scholar] [CrossRef]
- Zhang, D.P.; Bai, Y.; Guedes Soares, C. Dynamic Analysis of an Array of Semi-rigid “Sea Station” Fish Cages subjected to waves. Aquac. Eng. 2021, 94, 102172. [Google Scholar] [CrossRef]
- Xu, S.; Wang, S.; Guedes Soares, C. Review of mooring design for floating wave energy converters. Renew. Sustain. Energy Rev. 2019, 111, 595–621. [Google Scholar] [CrossRef]
- Weller, S.; Johanning, L.; Davies, P.; Banfield, S. Synthetic mooring ropes for marine renewable energy applications. Renew. Energy 2015, 83, 1268–1278. [Google Scholar] [CrossRef] [Green Version]
- Thomsen, J.B.; Kofoed, J.P.; Delaney, M.; Banfield, S. Initial Assessment of Mooring Solutions for Floating Wave Energy Converters. In Proceedings of the Twenty-Sixth (2016) International Ocean and Polar Engineering Conference, Rhodes, Greece, 26 June–2 July 2016; pp. 590–596. [Google Scholar]
- Wang, S.; Xu, S.; Xiang, G.; Guedes Soares, C. An overview of synthetic mooring cables in marine application. In Advances in Renewable Energies Offshore; Guedes Soares, C., Ed.; Taylor and Francis Group: London, UK, 2019; pp. 853–863. [Google Scholar]
- Lian, Y.; Liu, H.; Li, L.; Zhang, Y. An experimental investigation on the bedding-in behavior of synthetic fiber ropes. Ocean Eng. 2018, 160, 368–381. [Google Scholar] [CrossRef]
- Xu, S.; Wang, S.; Guedes Soares, C. Experimental investigation on hybrid mooring systems for wave energy converters. Renew. Energy 2020, 158, 130–153. [Google Scholar] [CrossRef]
- Wang, S.; Xu, S.; Guedes Soares, C.; Zhang, Y.; Liu, H.; Li, L. Experimental study of nonlinear behavior of a nylon mooring rope at different scales. In Developments in Renewable Energies Offshore; Guedes Soares, C., Ed.; Taylor and Francis: London, UK, 2020; pp. 690–697. [Google Scholar] [CrossRef]
- Liu, Z.; Mohapatra, S.; Guedes Soares, C. Finite Element Analysis of the Effect of Currents on the Dynamics of a Moored Flexible Cylindrical Net Cage. J. Mar. Sci. Eng. 2021, 9, 159. [Google Scholar] [CrossRef]
- Liu, Z.; Garbatov, Y.; Guedes Soares, C. Numerical modelling of full-scale aquaculture cages under uniform flow. In Developments in Maritime Technology and Engineering; Guedes Soares, C., Santos, T.A., Eds.; Taylor and Francis: London, UK, 2021; Volume 2, pp. 705–712. [Google Scholar] [CrossRef]
- Moe-Føre, H.; Lader, P.; Lien, E.; Hopperstad, O. Structural response of high solidity net cage models in uniform flow. J. Fluids Struct. 2016, 65, 180–195. [Google Scholar] [CrossRef]
- Huang, C.-C.; Tang, H.-J.; Liu, J.-Y. Effects of waves and currents on gravity-type cages in the open sea. Aquac. Eng. 2008, 38, 105–116. [Google Scholar] [CrossRef]
- Endresen, P.C.; Birkevold, J.; Føre, M.; Fredheim, A.; Kristiansen, D.; Lader, P. Simulation and Validation of a Numerical Model of a Full Aquaculture Net-Cage System. In Proceedings of the ASME 2014 33rd International Conference on Ocean, Offshore and Arctic Engineering, San Francisco, CA, USA, 8–13 June 2014; Professor Emeritus, J. Randolph Paulling Honoring Symposium on Ocean Technology. Volume 7: Ocean Space Utilization, p. V007T05A006. [Google Scholar]
- Chakrabarti, S.K. Handbook of Offshore Engineering; Elsevier: Amsterdam, The Netherlands, 2005. [Google Scholar]
- Faltinsen, O.M. Viscous Wave Loads and Damping. In Sea Loads on Ships and Offshore Structures; Cambridge University Press: Cambridge, UK, 1990; pp. 223–226. [Google Scholar]
- Faltinsen, O.M. Stationkeeping. In Sea Loads on Ships and Offshore Structures; Cambridge University Press: Cambridge, UK, 1990; pp. 257–270. [Google Scholar]
Figure 1.
The schematic diagram of the mooring system.

Figure 2.
The schematic diagram of the entire numerical model.

Figure 3.
Free body diagram of a mooring cable segment.

Figure 5.
Vertical displacement of the upstream collar under waves with different heights.

Figure 6.
Deformation of fish cages under waves with a period of 10 s and a height of 1 m and different current velocities: (a) current velocity = 0.25 m/s, (b) current velocity = 0.5 m/s, (c) current velocity = 0.75 m/s, (d) current velocity = 1 m/s.
Figure 6.
Deformation of fish cages under waves with a period of 10 s and a height of 1 m and different current velocities: (a) current velocity = 0.25 m/s, (b) current velocity = 0.5 m/s, (c) current velocity = 0.75 m/s, (d) current velocity = 1 m/s.

Figure 7.
Deformation of upstream mooring cables: (a) under current velocity of 0.25 m/s, (b) under current velocity of 1 m/s).
Figure 7.
Deformation of upstream mooring cables: (a) under current velocity of 0.25 m/s, (b) under current velocity of 1 m/s).

Figure 8.
Locations of the maximum mooring force (black: on main ropes, red: on bridle ropes, green: on frame ropes).
Figure 8.
Locations of the maximum mooring force (black: on main ropes, red: on bridle ropes, green: on frame ropes).

Figure 9.
Mean values of the maximum mooring forces under different current velocities.

Figure 10.
The schematic diagram of rope numbers and attack angles.

Figure 11.
Mean values of mooring forces for Main ropes 1–4.


Table 1.
Parameters of the adjusted structure and original structure.
| Parameters | Original Structure | Adjusted Structure |
|---|---|---|
| Density (kg/m3) | 1140 | 1140 |
| Young’s modulus (GPa) | 1.4 | 1.4 |
| Twine diameter (mm) | 2.7 | N.A. |
| Length of the mesh bar (mm) | 24 | N.A. |
| Total Number of horizontal lines | 417 | 9 |
| Total Number of vertical lines | 3140 | 20 |
| Cross-section of each mesh bar (mm2) | 5.73 | 265.07 (Horizontal lines) 899.37 (Vertical lines) |
Table 2.
The main dimensions and material parameters of the numerical model.
| Component | Dimension/Parameter | Value |
|---|---|---|
| Collar | Material type | HDPE |
| Young’s modulus (GPa) | 0.65 | |
| Diameter (m) | 24 | |
| Cross-section diameter (m) | 0.5 | |
| Thickness (mm) | 50 | |
| Net | Material type | Nylon |
| Young’s modulus (GPa) | 1.4 | |
| Twine thickness (mm) | 2 | |
| Solidity | 0.21 | |
| Density (kg/m3) | 1140 | |
| Bottom ring | Material type | HDPE |
| Young’s modulus (GPa) | 0.65 | |
| Weight/length (kg/m) | 32 | |
| Buoy | Buoyancy (kN) | 3 |
| Bridle/frame rope | Material type | HMPE |
| Stiffness, AE (N) | 1.25 × 10⁸ | |
| Frame rope depth (m) | 3 | |
| Distance between cages (m) | 6 | |
| Submerged weight/length (N/m) | 9.92 | |
| Breaking strength (kN) | 920 | |
| Main rope | Material type | Six-strand wire rope (IWRC) HMPE |
| Stiffness, AE (N) | 7.2 × 10⁷ | |
| Anchor depth (m) | 50 | |
| Submerged weight/length (N/m) | 54.4 | |
| Breaking strength (kN) | 840 |
Table 3.
The mean values and amplitudes of the maximum mooring forces in different parts of the mooring system under different current velocities.
Table 3.
The mean values and amplitudes of the maximum mooring forces in different parts of the mooring system under different current velocities.
| Current Velocity (m/s) | 0.25 | 0.5 | 0.75 | 1 |
|---|---|---|---|---|
| Mean value_Main ropes (kN) | 21.88 | 48.41 | 80.97 | 116.52 |
| Amplitude_Main ropes (kN) | 5.08 | 7.26 | 11.39 | 14.36 |
| Mean value_Frame ropes (kN) | 4.50 | 12.68 | 22.86 | 35.23 |
| Amplitude_Frame ropes (kN) | 1.83 | 1.20 | 1.02 | 2.42 |
| Mean value_Bridle ropes kN) | 11.44 | 22.30 | 35.72 | 49.10 |
| Amplitude_Bridle ropes (kN) | 2.13 | 4.26 | 6.69 | 6.73 |
Table 4.
Mean values of the maximum mooring force on different bridle ropes.
| Current Velocity (m/s) | 0.5 | 0.75 | 1 |
|---|---|---|---|
| Mean value_Bridle rope 1 (kN) | 22.29 | 35.73 | 49.10 |
| Mean value_Bridle rope 2 (kN) | 0.15 | 0.18 | 0.28 |
| Mean value_Bridle rope 3 (kN) | 0.18 | 0.26 | 0.50 |
| Mean value_Bridle rope 4 (kN) | 17.89 | 29.55 | 42.02 |
Table 5.
Mean values and amplitudes of the maximum mooring forces in different parts of the mooring system under different wave heights.
Table 5.
Mean values and amplitudes of the maximum mooring forces in different parts of the mooring system under different wave heights.
| Wave Height (m/s) | 0.5 | 0.75 | 1 |
|---|---|---|---|
| Mean value_Main ropes (kN) | 44.73 | 45.97 | 48.41 |
| Amplitude_Main ropes (kN) | 3.40 | 5.10 | 7.26 |
| Mean value_Frame ropes (kN) | 11.91 | 12.12 | 12.68 |
| Amplitude_Frame ropes (kN) | 0.83 | 0.95 | 1.2 |
| Mean value_Bridle ropes kN) | 20.49 | 21.09 | 22.30 |
| Amplitude_Bridle ropes (kN) | 2.11 | 3.07 | 4.26 |
Table 6.
Mean values and amplitudes of the mooring forces on main ropes under different attack angles.
Table 6.
Mean values and amplitudes of the mooring forces on main ropes under different attack angles.
| Attack Angle (°) | 0 | 22.5 | 45 | 67.5 | 90 |
|---|---|---|---|---|---|
| Mean value_Main rope 1 (kN) | 48.41 | 44.65 | 29.74 | 12.20 | 4.49 |
| Amplitude_Main rope 1 (kN) | 7.26 | 8.19 | 11.6 | 3.12 | 0.38 |
| Mean value_Main cable 2 (kN) | 22.09 | 29.41 | 22.83 | 8.43 | 3.63 |
| Amplitude_Main rope 2 (kN) | 4.18 | 7.03 | 5.90 | 1.96 | 0.31 |
| Mean value_Main cable 3 (kN) | 3.55 | 7.36 | 16.38 | 25.52 | 18.92 |
| Amplitude_Main cable 3 (kN) | 0.31 | 1.86 | 7.57 | 8.5 | 5.43 |
| Mean value_Main cable 4 (kN) | 5.95 | 24.46 | 45.56 | 42.32 | 38.49 |
| Amplitude_Main cable 4 (kN) | 0.71 | 7.08 | 14.33 | 12.2 | 10.86 |
| Location of max force | 1 | 1 | 4 | 4 | 4 |
Table 7.
Mean values and amplitudes of the mooring forces on bridle ropes under different attack angles.
Table 7.
Mean values and amplitudes of the mooring forces on bridle ropes under different attack angles.
| Attack Angle (°) | 0 | 22.5 | 45 | 67.5 | 90 |
|---|---|---|---|---|---|
| Mean value_Bridle rope 5 (kN) | - | 2.06 | 11.07 | 22.22 | 19.18 |
| Amplitude_Bridle rope 5 (kN) | - | 1.76 | 6.70 | 7.39 | 5.42 |
| Mean value_Bridle rope 6 (kN) | 22.29 | 31.59 | 25.25 | 9.82 | - |
| Amplitude_Bridle rope 6 (kN) | 4.26 | 7.19 | 6.54 | 3.31 | - |
| Mean value_Bridle rope 7 (kN) | 9.62 | 18.31 | 15.79 | 1.50 | - |
| Amplitude_Bridle rope 7 (kN) | 0.72 | 3.82 | 2.99 | 1.29 | - |
| Mean value_Bridle rope 8 (kN) | - | - | 8.09 | 16.21 | 15.47 |
| Amplitude_Bridle rope 8 (kN) | - | - | 7.82 | 5.05 | 5.30 |
| Mean value_Bridle rope 9 (kN) | - | 5.65 | 11.28 | 13.44 | 18.62 |
| Amplitude_Bridle rope 9 (kN) | - | 2.59 | 2.66 | 5.07 | 6.18 |
| Mean value_Bridle rope 10 (kN) | 6.00 | 15.98 | 25.06 | 12.05 | - |
| Amplitude_Bridle rope 10 (kN) | 1.40 | 7.06 | 7.01 | 3.52 | - |
| Location of max force | 6 | 6 | 6 | 5 | 5 |
Table 8.
Mean values and amplitudes of the mooring forces on frame ropes under different attack angles.
Table 8.
Mean values and amplitudes of the mooring forces on frame ropes under different attack angles.
| Attack Angle (°) | 0 | 22.5 | 45 | 67.5 | 90 |
|---|---|---|---|---|---|
| Mean value_Frame rope 11(kN) | 12.68 | 9.32 | 2.77 | - | - |
| Amplitude_Frame rope 11(kN) | 1.2 | 1.58 | 0.72 | - | - |
| Mean value_Frame rope 12 (kN) | - | - | 1.97 | 4.16 | 3.38 |
| Amplitude_Frame rope 12 (kN) | - | - | 1.03 | 1.35 | 0.94 |
| Mean value_Frame rope 13 (kN) | 12.31 | 10.48 | - | - | - |
| Amplitude_Frame rope 13 (kN) | 1.88 | 1.36 | - | - | - |
| Mean value_Frame rope 14 (kN) | - | 4.29 | - | - | - |
| Amplitude_Frame rope 14 (kN) | - | 3.23 | - | - | - |
| Location of max force | 11 | 13 | 11 | 12 | 12 |
Publisher’s Note: MDPI stays neutral with regard to jurisdictional claims in published maps and institutional affiliations. |
© 2022 by the authors. Licensee MDPI, Basel, Switzerland. This article is an open access article distributed under the terms and conditions of the Creative Commons Attribution (CC BY) license (https://creativecommons.org/licenses/by/4.0/).
Share and Cite
MDPI and ACS Style
Liu, Z.; Wang, S.; Guedes Soares, C. Numerical Study on the Mooring Force in an Offshore Fish Cage Array. J. Mar. Sci. Eng. 2022, 10, 331. https://doi.org/10.3390/jmse10030331
AMA Style
Liu Z, Wang S, Guedes Soares C. Numerical Study on the Mooring Force in an Offshore Fish Cage Array. Journal of Marine Science and Engineering. 2022; 10(3):331. https://doi.org/10.3390/jmse10030331
Chicago/Turabian StyleLiu, Zhongchi, Shan Wang, and C. Guedes Soares. 2022. "Numerical Study on the Mooring Force in an Offshore Fish Cage Array" Journal of Marine Science and Engineering 10, no. 3: 331. https://doi.org/10.3390/jmse10030331
Note that from the first issue of 2016, this journal uses article numbers instead of page numbers. See further details here.