
Steady-State and Transient Electrical Properties of Liquid Crystal Cells †


Department of Physics and Engineering Physics, Central Connecticut State University, New Britain, CT 06050, USA
*
Author to whom correspondence should be addressed.
†
Presented at the 3rd International Online Conference on Crystals, 15–30 January 2022; Available online: https://iocc_2022.sciforum.net/ .
Chem. Proc. 2022, 9(1), 15; https://doi.org/10.3390/IOCC_2022-12147
Published: 12 January 2022
(This article belongs to the Proceedings of The 3rd International Online Conference on Crystals)
Abstract
:Rapidly expanding and new applications of liquid crystal materials cover a wide range of technology products. A very incomplete list includes conventional and miniature high-resolution displays, AR/VR glasses, smart windows, dynamic lenses, tunable filters and retarders, electrically controlled sensors, reconfigurable antennas for wireless and space communications, and many other commercially available devices. The aforementioned devices are enabled by the collective reorientation of thermotropic molecular liquid crystals under the action of applied electric fields. The reorientation effects in liquid crystals can be altered by ionic contaminants typically present in mesogenic materials in small quantities. Therefore, information about ions in liquid crystals is very important because it allows for a proper selection of liquid crystal materials and uncompromised performance of liquid crystal devices. This information can be obtained by performing electrical measurements of liquid crystal materials. Measurements of basic electrical parameters (DC conductivity, charge mobility, and ion density) are carried out using sandwich-like liquid crystal cells of finite thickness. Once a cell is filled with liquid crystal materials, interactions between ions and the cell substrates will result in the time dependence of the ion density and DC electrical conductivity until a steady state is reached. In this paper, we show how complementary information about ionic processes in liquid crystal cells can be obtained by analyzing their transient and steady-state electrical properties.
1. Introduction
Contemporary applications of thermotropic liquid crystals are rapidly expanding. In addition to conventional liquid crystal displays (LCDs) [1,2], liquid crystal technologies are very promising for the development of augmented reality (AR) and virtual reality (VR) systems [3,4,5]. Numerous photonic and biomedical devices (filters [6], retarders and spatial light modulators [7], lenses [8], electrically controlled sensors [9], diffractive optics [10], and beam-steering devices [11,12]) rely on tunable optical elements made of liquid crystals. An emerging field of flat optics [13] along with the reconfigurability of plasmonic [14] and meta-devices [15] can also benefit from the tunability of liquid crystal materials. This tunability of liquid crystals enabled a wide range of microwave devices such as resonators, antennas, and phase shifters [16,17]. It should be noted that classical applications of liquid crystals such as switchable smart windows [18,19] and light shutters [20,21,22] are also constantly growing and evolving [23].
The reorientation of liquid crystals under the action of applied electric fields results in the tunability of their physical properties and enables their numerous applications [7]. An electric-field-induced reorientation of liquid crystals can be altered by ions that are always present in thermotropic liquid crystals [24,25]. Ions in liquid crystals can compromise the performance of liquid crystal devices. A well-known screening effect in LCD can lead to image sticking, image flickering, a reduced voltage holding ratio, and an overall slow response [24,25]. Under certain conditions, ions in liquid crystals can give rise to electrohydrodynamic instabilities [26], resulting in strong light scattering and enabling applications such as light shutters and smart windows [18,19,20,21,22].
Regardless the type of application, information about ions in thermotropic liquid crystals is very important. This information can be obtained by performing electrical characterization of liquid crystal materials ([27,28,29], and references therein). The obtained experimental results can be used to evaluate DC electrical conductivity, ion mobility, and ion concentration in liquid crystals [30,31,32].
As a rule, electrical measurements of thermotropic liquid crystals are carried out using sandwich-like cells of a fixed thickness. At the same time, interactions between ions and substrates of a liquid crystal cell can result in dependence of the measured electrical conductivity on the cell thickness [32,33]. Even though the importance of considering interactions between ions and substrates of a liquid crystal cell for a proper interpretation of electrical measurements was emphasized many times ([28], and references therein), only a very limited number of experimental reports can be found [34,35,36]. The experimental results reported in [34,35,36] unambiguously point to the necessity to consider the dependence of the measured electrical conductivity of thermotropic liquid crystals on the cell thickness. A general analysis of such dependence performed recently shows a very rich behavior with the possibility of both monotonous and non-monotonous dependence of DC electrical conductivity on the cell thickness [33]. Both experiments [34,35,36] and modeling [33] assume a steady state. The consideration of time dependence of DC electrical conductivity can reveal transient ionic processes in liquid crystal cells caused by interactions between ions and substrates of the cell. This time dependence is analyzed in the present paper assuming liquid crystal cells of varying thickness.
2. Model
The DC electrical conductivity of molecular liquid crystals caused by ionic contaminants is given by Equation (1):
where is the volume concentration of ions, is the mobility of the -th ion, and is the charge of the -th ion [24,25]. Assuming two types of fully dissociated symmetric monovalent ions (, , , , ), Equation (1) can be rewritten as Equation (2)
Existing experimental and theoretical results [28,37,38,39,40,41] were used in the development of an elementary model [42,43] for the computation of the bulk concentration of ions in liquid crystal cells. The model considers two ionic processes in liquid crystal cells, namely the capturing of ions by substrates of the cell (the first term of the right-hand side of Equation (3)) and the ion-releasing process when substrates release trapped ions (the second term of the right-hand side of Equation (3)):
Parameters and describe the time rate of ion-capturing and ion-releasing processes, respectively. Quantities describe the fractional surface coverage of substrates by the i-th ions (i = 1, 2), stands for the surface density of all surface sites of the liquid crystal substrates, and is the cell thickness.
The conservation of the total number of ions of the i-th type is given by Equation (4):
where is the contamination factor of substrates and is the cell thickness [42,43]. Additional details can be found in [33,42,43]. It should be noted that a perfect alignment of liquid crystal samples is assumed (either planar or homeotropic). To account for the anisotropy of the electrical conductivity of liquid crystals, different values of physical parameters, appropriate for a given alignment, can be used.
3. Results: DC Electrical Conductivity of Liquid Crystal Cells
The DC electrical conductivity of liquid crystal cells can be computed by solving Equations (2)–(4). The most common scenario involves a sandwich-like cell contaminated with ions of one type prior to filling it with liquid crystals that contain ions of another type. Once an empty cell is filled with liquid crystals, some fraction of ions already present in a liquid crystal bulk will be captured by the substrates of the liquid crystal cell. Some ions captured by the substrates can also be released back into the liquid crystal bulk. These ion-capturing/ion-releasing processes will continue until a steady state is reached when the number of ions per unit time captured by substrates is equal to the number of ions per unit time released by the substrates. At the same time, ionic contaminants already present on the substrates of the empty cell will enrich liquid crystals via the ion-releasing process. Some released ions will also be captured by the substrates. These ionic processes will also continue until a steady state is reached. In our recent paper [33], we modeled the DC conductivity of liquid crystal cells as a function of the cell thickness assuming a steady state. Because the present paper is a logical continuation of [33], we use similar physical parameters, as listed in Table 1.
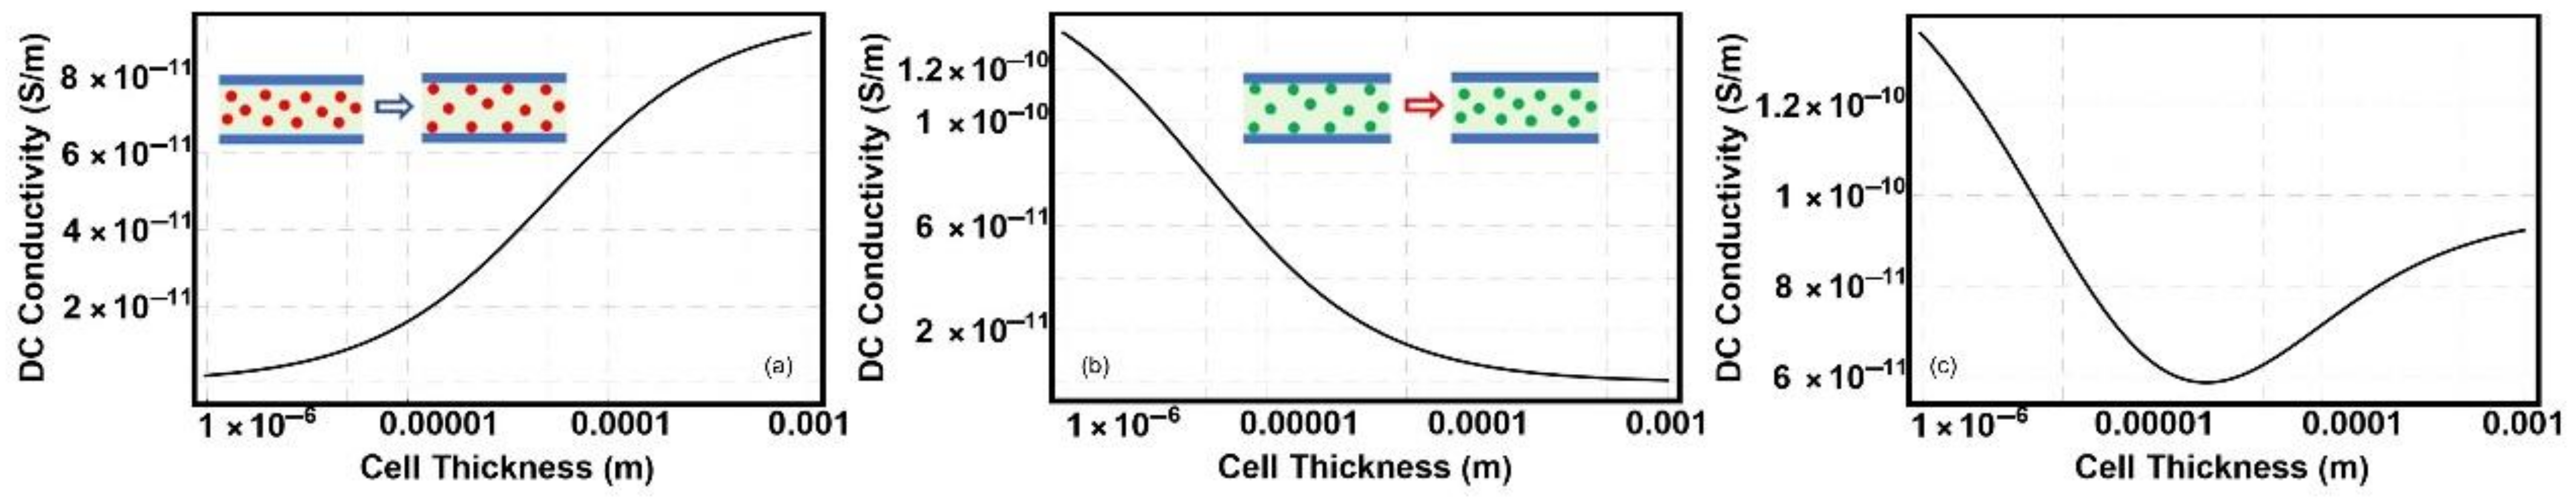
We have already analyzed a steady-state solution in our previous paper [33]. Given a great variety of possible outcomes (the steady-state DC conductivity can depend on the cell thickness in monotonous (either increase or decrease) and non-monotonous (with maximum or minimum) ways), let us consider a non-trivial case of non-monotonous dependence of DC electrical conductivity on the cell thickness shown in Figure 1. According to Figure 1, a fraction of ions already present in liquid crystals prior to filling an empty cell are captured by the substrates (Figure 1a). At the same time, because substrates of the cell were contaminated with other ions, once the cell is filled with liquid crystals, these ions can be released into the liquid crystal bulk, as shown in Figure 1b. The combination of these ionic processes results in a non-monotonous dependence of steady-state DC electrical conductivity on the cell thickness (Figure 1c).
It is interesting to explore the time dependence of the ion-capturing and ion-releasing processes shown in Figure 1. This time dependence can be obtained by solving Equations (2)–(4). The results are shown in Figure 2, Figure 3 and Figure 4.
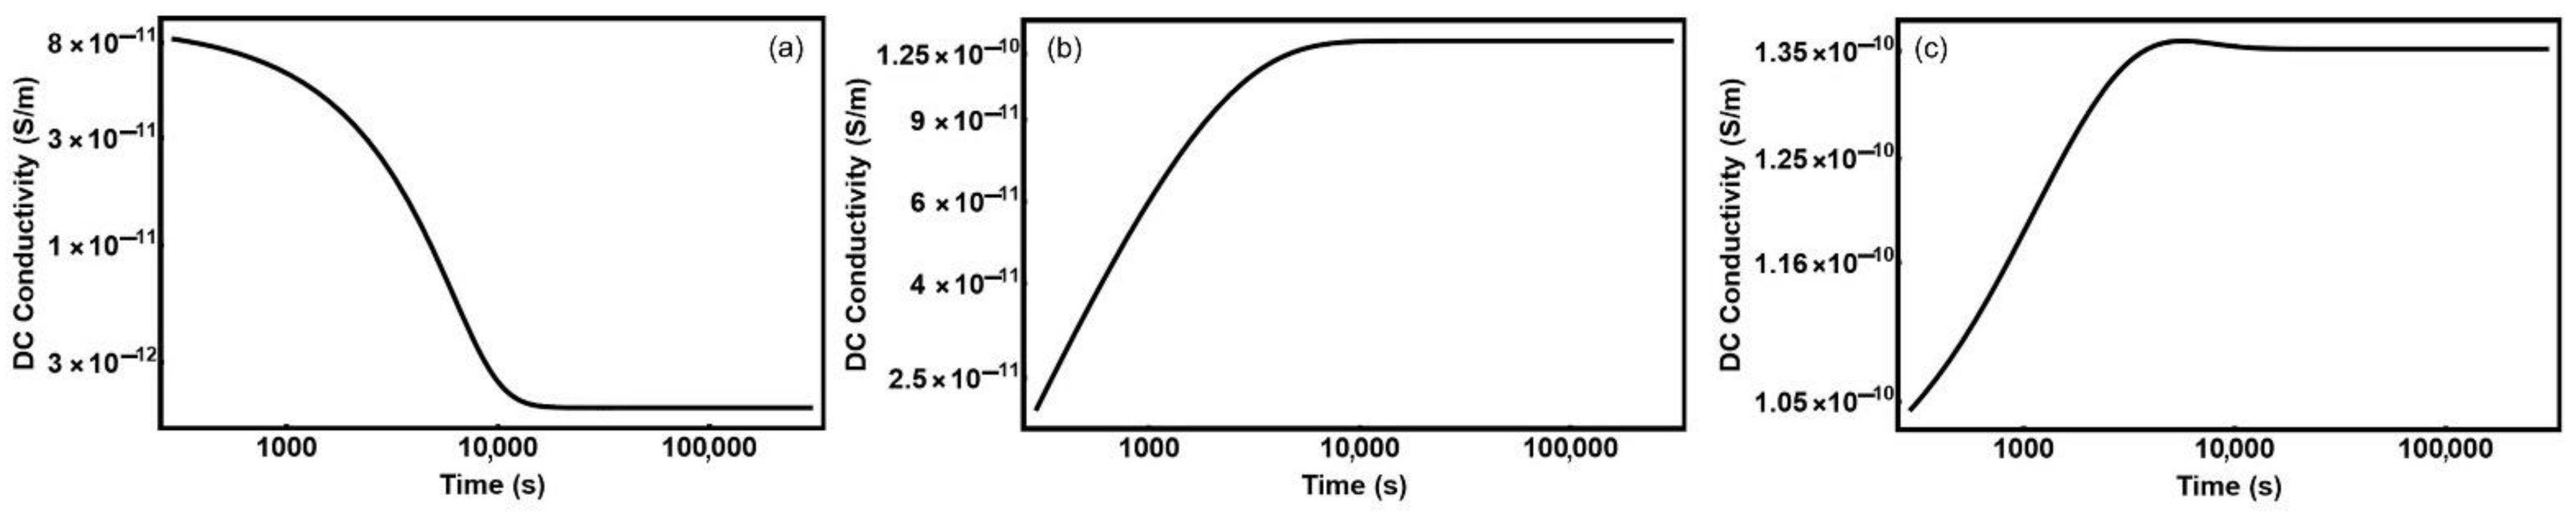
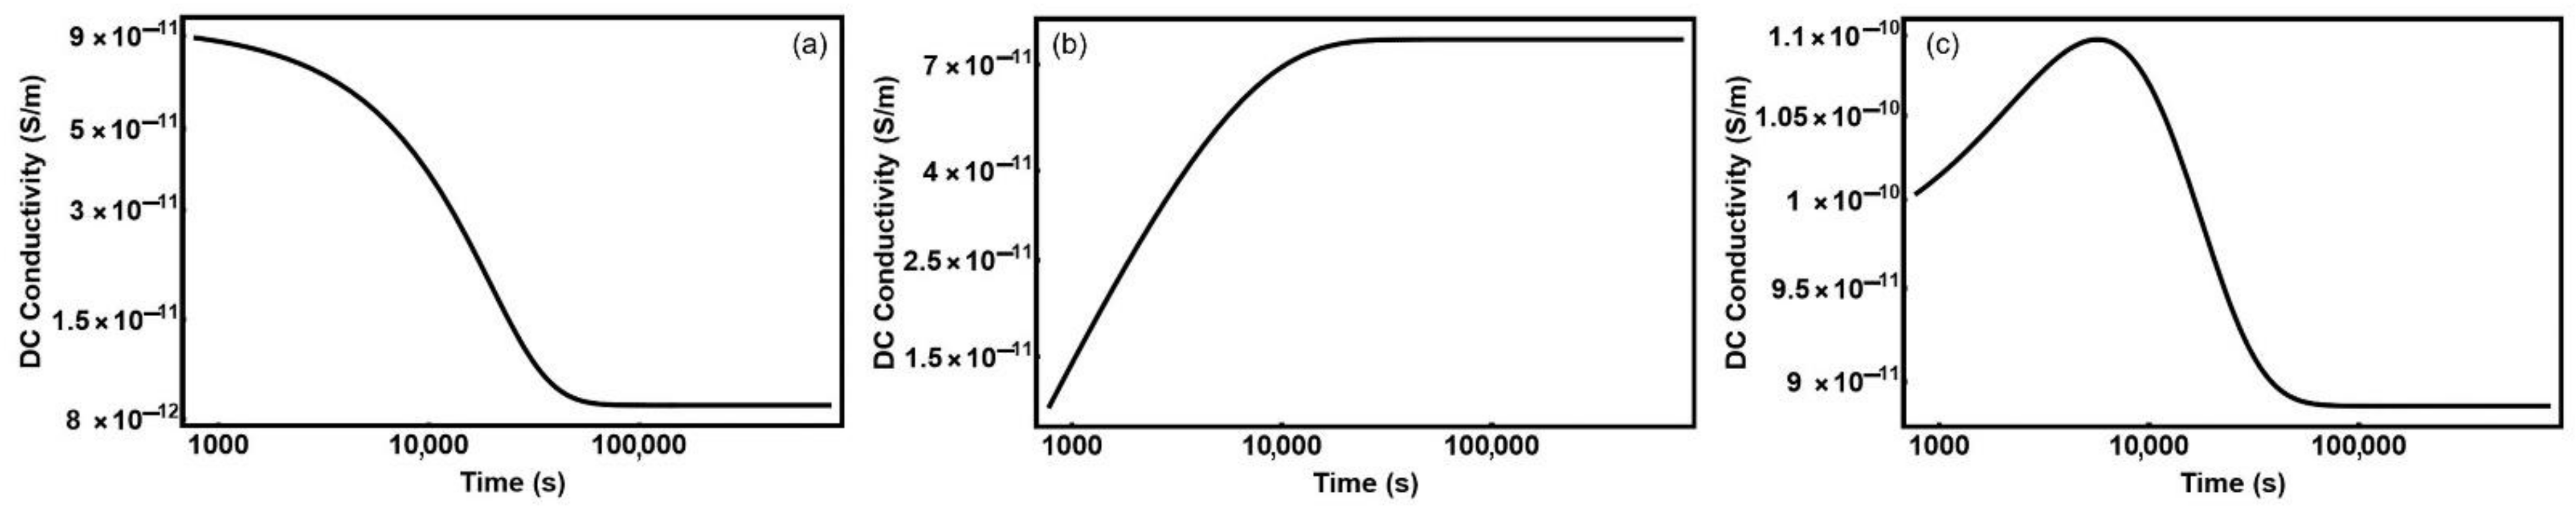
According to Figure 2, Figure 3 and Figure 4, an interplay between ion-capturing (Figure 2a, Figure 3a and Figure 4a) and ion-releasing (Figure 2b, Figure 3b and Figure 4b) regimes can result in a non-monotonous time dependence of DC conductivity of liquid crystal cells (Figure 2c, Figure 3c and Figure 4c). Interestingly, this time dependence strongly depends on the cell thickness. A rather weak maximum (Figure 2c) for a 1 µm thick cell becomes much stronger for a 5 µm thick cell (Figure 3c), and nearly disappears for a 50 µm thick cell (Figure 4c).
4. Conclusions
Interactions between ions and substrates of a liquid crystal cell can alter DC electrical conductivity in a very non-trivial way. As a result, DC conductivity of liquid crystal cells depends on the cell thickness. The type of this dependence can reveal important information about ions inherently present in liquid crystals and ions brought to liquid crystals by contaminated substrates. Once an empty cell is filled with liquid crystals, the combination of ion-capturing and ion-releasing processes results in time dependence of DC electrical conductivity. This time dependence is a function of the cell thickness (Figure 2, Figure 3 and Figure 4). By analyzing the time dependence of DC electrical conductivity, complementary information about ionic processes in liquid crystal cells can be obtained. Figure 1, Figure 2, Figure 3 and Figure 4 indicate that measuring ions in liquid crystals is a very non-trivial activity. Electrical conductivity of liquid crystals should be measured as a function of the cell thickness and as a function of time.
Author Contributions
Conceptualization, Y.G.; methodology, Y.G.; formal analysis, D.W. and Y.G.; investigation, D.W. and Y.G.; data generation, D.W.; writing—original draft preparation, D.W. and Y.G.; writing—review and editing, D.W. and Y.G.; supervision, Y.G.; project administration, Y.G.; funding acquisition, Y.G. All authors have read and agreed to the published version of the manuscript.
Funding
This research was supported by the CSU—AAUP Faculty Research Grant and by the Faculty—Student Research Grant.
Institutional Review Board Statement
Not applicable.
Informed Consent Statement
Not applicable.
Data Availability Statement
All data supporting the findings of this study are included within the article.
Acknowledgments
The authors would like to acknowledge the support provided by the School of Engineering, Science, and Technology at Central Connecticut State University.
Conflicts of Interest
The authors declare no conflict of interest.
References
- Koide, N. (Ed.) 50 years of liquid crystal R&D that lead the way to the future. In The Liquid Crystal Display Story; Springer: Tokyo, Japan, 2014. [Google Scholar] [CrossRef]
- Jones, C. The fiftieth anniversary of the liquid crystal display. Liq. Cryst. Today 2018, 27, 44–70. [Google Scholar] [CrossRef] [Green Version]
- Huang, Y.; Liao, E.; Chen, R.; Wu, S.-T. Liquid-Crystal-on-Silicon for Augmented Reality Displays. Appl. Sci. 2018, 8, 2366. [Google Scholar] [CrossRef] [Green Version]
- Xiong, J.; Hsiang, E.-L.; He, Z.; Zhan, T.; Wu, S.-T. Augmented reality and virtual reality displays: Emerging technologies and future perspectives. Light Sci. Appl. 2021, 10, 216. [Google Scholar] [CrossRef] [PubMed]
- Wang, Y.-J.; Lin, Y.-H. Liquid crystal technology for vergence-accommodation conflicts in augmented reality and virtual reality systems: A review. Liq. Cryst. Rev. 2021, 9, 35–64. [Google Scholar] [CrossRef]
- Abdulhalim, I. Non-display bio-optic applications of liquid crystals. Liq. Cryst. Today 2011, 20, 44–60. [Google Scholar] [CrossRef] [Green Version]
- Chigrinov, V.G. Liquid Crystal Photonics; Nova Science Pub Inc.: New York, NY, USA, 2014; 204p. [Google Scholar]
- Lin, Y.; Wang, Y.; Reshetnyak, V. Liquid crystal lenses with tunable focal length. Liq. Cryst. Rev. 2017, 5, 111–143. [Google Scholar] [CrossRef]
- Schenning, A.P.H.J.; Crawford, G.P.; Broer, D.J. (Eds.) Liquid Crystal Sensors; CRC Press, Taylor & Francis Group: Boca Raton, FL, USA, 2018; 164p. [Google Scholar]
- De Sio, L.; Roberts, D.E.; Liao, Z.; Hwang, J.; Tabiryan, N.; Steeves, D.M.; Kimball, B.R. Beam shaping diffractive wave plates. Appl. Opt. 2018, 57, A118–A121. [Google Scholar] [CrossRef] [PubMed]
- Otón, J.M.; Otón, E.; Quintana, X.; Geday, M.A. Liquid-crystal phase-only devices. J. Mol. Liq. 2018, 267, 469–483. [Google Scholar] [CrossRef]
- Morris, R.; Jones, C.; Nagaraj, M. Liquid Crystal Devices for Beam Steering Applications. Micromachines 2021, 12, 247. [Google Scholar] [CrossRef]
- Chen, W.T.; Zhu, A.Y.; Capasso, F. Flat optics with dispersion-engineered metasurfaces. Nat. Rev. Mater. 2020, 5, 604–620. [Google Scholar] [CrossRef]
- Jeng, S.C. Applications of Tamm plasmon-liquid crystal devices. Liq. Cryst. 2020, 47, 1223–1231. [Google Scholar] [CrossRef]
- Lininger, A.; Zhu, A.Y.; Park, J.S.; Palermo, G.; Chatterjee, S.; Boyd, J.; Capasso, F.; Strangi, G. Optical properties of metasurfaces infiltrated with liquid crystals. Proc. Natl. Acad. Sci. USA 2020, 117, 20390–20396. [Google Scholar] [CrossRef]
- Camley, R.; Celinski, Z.; Garbovskiy, Y.; Glushchenko, A. Liquid crystals for signal processing applications in the microwave and millimeter wave frequency ranges. Liq. Cryst. Rev. 2018, 6, 17–52. [Google Scholar] [CrossRef]
- Jakoby, R.; Gaebler, A.; Weickhmann, C. Microwave Liquid Crystal Enabling Technology for Electronically Steerable Antennas in SATCOM and 5G Millimeter-Wave Systems. Crystals 2020, 10, 514. [Google Scholar] [CrossRef]
- Dabrowski, R.; Dziaduszek, J.; Bozetka, J.; Piecek, W.; Mazur, R.; Chrunik, M.; Perkowski, P.; Mrukiewicz, M.; Żurowska, M.; Weglowska, D. Fluorinated smectics—New liquid crystalline medium for smart windows and memory displays. J. Mol. Liq. 2017, 267, 415–427. [Google Scholar] [CrossRef]
- Zhang, Y.; Yang, X.; Zhan, Y.; Zhang, Y.; He, J.; Lv, P.; Yuan, D.; Hu, X.; Liu, D.; Broer, D.J.; et al. Electroconvection in zwitterion-doped nematic liquid crystals and application as smart windows. Adv. Opt. Mater. 2020, 27, 2001465. [Google Scholar] [CrossRef]
- Geis, M.W.; Bos, P.J.; Liberman, V.; Rothschild, M. Broadband optical switch based on liquid crystal dynamic scattering. Opt. Express 2016, 24, 13812–13823. [Google Scholar] [CrossRef]
- Konshina, E.A.; Shcherbinin, D.P. Study of dynamic light scattering in nematic liquid crystal and its optical, electrical and switching characteristics. Liq. Cryst. 2018, 45, 292–302. [Google Scholar] [CrossRef]
- Shaban, H.; Wu, P.-C.; Lee, J.-H.; Lee, W. Dielectric and electro-optical responses of a dielectrically negative nematic liquid crystal doped with cationic surfactant. Opt. Mater. Express 2021, 11, 3208–3222. [Google Scholar] [CrossRef]
- Castellón, E.; Levy, D. (Eds.) Smart Windows Based on Liquid Crystal Dispersions. In Transparent Conductive Materials; Chapter 5.4; Wiley-VCH: Weinheim, Germany, 2018; pp. 337–365. [Google Scholar] [CrossRef]
- Blinov, L.M. Structure and Properties of Liquid Crystals; Springer: New York, NY, USA, 2010. [Google Scholar]
- Neyts, K.; Beunis, F. Ion Transport in Liquid Crystals. In Handbook of Liquid Crystals: Physical Properties and Phase Behavior of Liquid Crystals; Chapter 11; Wiley-VCH: Weinheim, Germany, 2014; Volume 2, pp. 357–382. [Google Scholar]
- Éber, N.; Salamon, P.; Buka, Á. Electrically induced patterns in nematics and how to avoid them. Liq. Cryst. Rev 2016, 4, 101–134. [Google Scholar] [CrossRef]
- Colpaert, C.; Maximus, B.; Meyere, D. Adequate measuring techniques for ions in liquid crystal layers. Liq. Cryst. 1996, 21, 133–142. [Google Scholar] [CrossRef]
- Barbero, G.; Evangelista, L.R. Adsorption Phenomena and Anchoring Energy in Nematic Liquid Crystals; Taylor & Francis: Boca Raton, FL, USA, 2006. [Google Scholar]
- Garbovskiy, Y. Conventional and unconventional ionic phenomena in tunable soft materials made of liquid crystals and nanoparticles. Nano Express 2021, 2, 012004. [Google Scholar] [CrossRef]
- Khazimullin, M.V.; Lebedev, Y.A. Influence of dielectric layers on estimates of diffusion coefficients and concentrations of ions from impedance spectroscopy. Phys. Rev. E 2019, 100, 062601. [Google Scholar] [CrossRef] [Green Version]
- Karaawi, A.R.; Gavrilyak, M.V.; Boronin, V.A.; Gavrilyak, A.M.; Kazachonok, J.V.; Podgornov, F.V. Direct current electric conductivity of ferroelectric liquid crystals–gold nanoparticles dispersion measured with capacitive current technique. Liq. Cryst. 2020, 47, 1507–1515. [Google Scholar] [CrossRef]
- Garbovskiy, Y. Evaluating the Concentration of Ions in Liquid Crystal Cells: Hidden Factors and Useful Techniques. Proceedings 2020, 62, 10. [Google Scholar] [CrossRef]
- Webb, D.; Garbovskiy, Y. Overlooked Ionic Phenomena Affecting the Electrical Conductivity of Liquid Crystals. Eng. Proc. 2021, 11, 1. [Google Scholar] [CrossRef]
- Dhara, S.; Madhusudana, N.V. Ionic contribution to the dielectric properties of a nematic liquid crystal in thin cells. J. Appl. Phys. 2001, 90, 3483–3488. [Google Scholar] [CrossRef]
- Kovalchuk, O.V. Adsorption of ions and thickness dependence of conductivity in liquid crystal. Semicond. Phys. Quantum Electron. Optoelectron. 2011, 14, 452–455. [Google Scholar] [CrossRef]
- Kumar, A.; Varshney, D.; Prakash, J. Role of ionic contribution in dielectric behaviour of a nematic liquid crystal with variable cell thickness. J. Mol. Liq. 2020, 303, 112520. [Google Scholar] [CrossRef]
- Murakami, S.; Naito, H. Electrode and Interface Polarizations in Nematic Liquid Crystal Cells. Jpn. J. Appl. Phys. 1997, 36, 2222–2225. [Google Scholar] [CrossRef]
- Naito, H.; Yasuda, Y.; Sugimura, A. Desorption processes of adsorbed impurity ions on alignment layers in nematic liquid crystal cells. Mol. Cryst. Liq. Cryst. Sci. Technol. Sect. A Mol. Cryst. Liq. Cryst. 1997, 301, 85–90. [Google Scholar] [CrossRef]
- Mizusaki, M.; Enomoto, S.; Hara, Y. Generation mechanism of residual direct current voltage for liquid crystal cells with polymer layers produced from monomers. Liq. Cryst. 2016, 44, 609–617. [Google Scholar] [CrossRef]
- Kravchuk, R.; Koval’chuk, O.; Yaroshchuk, O. Filling initiated processes in liquid crystal cell. Mol. Cryst. Liq. Cryst. 2002, 384, 111–119. [Google Scholar] [CrossRef]
- Garbovskiy, Y. Time-dependent electrical properties of liquid crystal cells: Unravelling the origin of ion generation. Liq. Cryst. 2018, 45, 1540–1548. [Google Scholar] [CrossRef]
- Garbovskiy, Y. Ion capturing/ion releasing films and nanoparticles in liquid crystal devices. Appl. Phys. Lett. 2017, 110, 041103. [Google Scholar] [CrossRef]
- Garbovskiy, Y. Ions and size effects in nanoparticle/liquid crystal colloids sandwiched between two substrates. The case of two types of fully ionized species. Chem. Phys. Lett. 2017, 679, 77–85. [Google Scholar] [CrossRef]
Figure 1.
DC conductivity (steady-state) of liquid crystals as a function of the cell thickness. (a) DC conductivity caused by ions already present in liquid crystals. The values of the parameters used in the simulations are listed in Table 1 (, , ). (b) DC conductivity (steady-state) due to ions originating from contaminated substrates of the liquid crystal cell. The values of the parameters used in the simulations are listed in Table 1 (, , , , ). (c) DC conductivity (steady-state) caused by the combination of ion-capturing and ion-releasing processes shown in Figure 1a,b. The values of the parameters used in the simulations are listed in Table 1 (, , , , , , , ). Reproduced from [33] under the Creative Commons Attribution License.

Figure 2.
Time-dependent DC conductivity of liquid crystal cells. The cell thickness is 1 µm. (a) Time dependence of DC conductivity caused by the ion-capturing effect (ions already present in liquid crystals are captured by the substrates of the cell). (b) Time dependence of DC conductivity due to the ion-releasing effect (ionic contaminants originated from contaminated substrates of the cell enrich liquid crystals with ions). (c) Time dependence of DC conductivity caused by the combination of the ion-capturing and ion-releasing processes shown in (a,b).

Figure 3.
Time-dependent DC conductivity of liquid crystal cells. The cell thickness is 5 µm. (a) Time dependence of DC conductivity caused by the ion-capturing effect (ions already present in liquid crystals are captured by the substrates of the cell). (b) Time dependence of DC conductivity due to the ion-releasing effect (ionic contaminants originated from contaminated substrates of the cell enrich liquid crystals with ions). (c) Time dependence of DC conductivity caused by the combination of the ion-capturing and ion-releasing processes shown in (a,b).

Figure 4.
Time-dependent DC conductivity of liquid crystal cells. The cell thickness is 50 µm. (a) Time dependence of DC conductivity caused by the ion-capturing effect (ions already present in liquid crystals are captured by the substrates of the cell). (b) Time dependence of DC conductivity due to the ion-releasing effect (ionic contaminants originated from contaminated substrates of the cell enrich liquid crystals with ions). (c) Time dependence of DC conductivity caused by the combination of the ion-capturing and ion-releasing processes shown in (a,b).


Table 1.
Physical parameters and their values.
| Physical Parameter | Value |
|---|---|
| 10−21 m3 (Figure 1a,c, Figure 2a,c, Figure 3a,c and Figure 4a,c) | |
| 10−26 m3/s (Figure 1a,c, Figure 2a,c, Figure 3a,c and Figure 4a,c) | |
| 10−5 s−1 (Figure 1a,c, Figure 2a,c, Figure 3a,c and Figure 4a,c) | |
| 10−22 m3 (Figure 1b,c, Figure 2b,c, Figure 3b,c and Figure 4b,c) | |
| 10−26 m3/s (Figure 1b,c, Figure 2b,c, Figure 3b,c and Figure 4b,c) | |
| 10−4 s−1 (Figure 1b,c, Figure 2b,c, Figure 3b,c and Figure 4b,c) | |
| 5 × 10¹⁶ m−2 (Figure 1, Figure 2, Figure 3 and Figure 4) | |
| 10−10 m2/Vs (Figure 1, Figure 2, Figure 3 and Figure 4) | |
| 0 (Figure 1a,c, Figure 2a,c, Figure 3a,c and Figure 4a,c) | |
| 10−3 (Figure 1b,c, Figure 2b,c, Figure 3b,c and Figure 4b,c) | |
| 6 × 10¹⁸ m−3 (Figure 1a,c, Figure 2a,c, Figure 3a,c and Figure 4a,c) | |
| 0 (Figure 1b,c, Figure 2b,c, Figure 3b,c and Figure 4b,c) |
Publisher’s Note: MDPI stays neutral with regard to jurisdictional claims in published maps and institutional affiliations. |
© 2022 by the authors. Licensee MDPI, Basel, Switzerland. This article is an open access article distributed under the terms and conditions of the Creative Commons Attribution (CC BY) license (https://creativecommons.org/licenses/by/4.0/).
Share and Cite
MDPI and ACS Style
Webb, D.; Garbovskiy, Y. Steady-State and Transient Electrical Properties of Liquid Crystal Cells. Chem. Proc. 2022, 9, 15. https://doi.org/10.3390/IOCC_2022-12147
AMA Style
Webb D, Garbovskiy Y. Steady-State and Transient Electrical Properties of Liquid Crystal Cells. Chemistry Proceedings. 2022; 9(1):15. https://doi.org/10.3390/IOCC_2022-12147
Chicago/Turabian StyleWebb, David, and Yuriy Garbovskiy. 2022. "Steady-State and Transient Electrical Properties of Liquid Crystal Cells" Chemistry Proceedings 9, no. 1: 15. https://doi.org/10.3390/IOCC_2022-12147