Article

Solving Competitive Location Problems with Social Media Data Based on Customers’ Local Sensitivities

1
School of Geography and Tourism, Anhui Normal University, Wuhu 241003, China
2
Engineering Technology Research Center of Resources Environment and GIS, Anhui Province, Wuhu 241003, China
3
State Key Laboratory of Information Engineering in Surveying, Mapping and Remote Sensing, Wuhan University, Wuhan 430079, China
4
Collaborative Innovation Center of Geospatial Technology, Wuhan University, Wuhan 430079, China
5
Faculty of Geomatics, East China University of Technology, Nanchang 330000, China
6
Wuhan Land Use and Urban Spatial Planning Research Center, Hubei Province, Wuhan 430079, China
7
Wuhan Land Resource and Planning Information Center, Hubei Province, Wuhan 430079, China
*
Author to whom correspondence should be addressed.
ISPRS Int. J. Geo-Inf. 2019, 8(5), 202; https://doi.org/10.3390/ijgi8050202
Submission received: 18 March 2019 / Revised: 24 April 2019 / Accepted: 2 May 2019 / Published: 4 May 2019
(This article belongs to the Special Issue Convergence of GIS and Social Media)

Abstract

:
Competitive location problems (CLPs) are a crucial business concern. Evaluating customers’ sensitivities to different facility attractions (such as distance and business area) is the premise for solving a CLP. Currently, the development of location-based services facilitates the use of location data for sensitivity evaluations. Most studies based on location data assumed the customers’ sensitivities to be global and constant over space. In this paper, we proposed a new method of using social media data to solve competitive location problems based on the evaluation of customers’ local sensitivities. Regular units were first designed to spatially aggregate social media data to extract samples with uniform spatial distribution. Then, geographically weighted regression (GWR) and the Huff model were combined to evaluate local sensitivities. By applying the evaluation results, the captures for different feasible locations were calculated, and the optimal location for a new retail facility could be determined. In our study, the five largest retail agglomerations in Beijing were taken as test cases, and a possible new retail agglomeration was located. The results of our study can help people have a better understanding of the spatial variation of customers’ local sensitivities. In addition, our results indicate that our method can solve competitive location problems in a cost-effective way.

1. Introduction

In most real situations, it is important to consider the competition between retail facilities in location decisions, namely, competitive location problems [1,2,3,4]. The aim of competitive location is to locate a new retail facility or agglomeration at a location that can maximize its capture. Evaluating customers’ sensitivities to different facility attractions (such as distance and business area) is the premise for solving a competitive location problem [5,6]. Based on the evaluation results, the optimal location for a new retail facility that provides the largest capture can be determined.
Traditionally, data for evaluating customers’ sensitivities has been mainly obtained from surveys and questionnaires. By investigating customers, much customer-related information can be collected, including home locations and visitation frequencies for given retail facilities. The information obtained was relatively complete and accurate. However, the methods of collecting traditional data (such as surveys) are labor intensive and time consuming [7]. Additionally, the spatial distribution of traditional data is uneven, and the data size is limited [8,9]. Because of the disadvantages of traditional data, the accuracy of sensitivity evaluations using traditional data was relatively low [10,11]. Other data were needed to solve competitive location problems. Location data might provide a solution [10,11].
With the development of location-based services, location data (such as mobile phone location data, taxi trajectory data and social media data) provide new opportunities for evaluating customers’ sensitivities to different attractions [10,11,12,13,14]. Compared with traditional data, location data is more widely distributed, and the data size is much larger. Lu et al. [10] designed an experiment for evaluating customers’ sensitivities with mobile phone location data and revealed the effects of sample location. Yue et al. [11] applied taxi trajectory data to sensitivity evaluations and delimited the spatial distribution of customers for target retail agglomerations. Based on social media data, Qu et al. [12] and Hu et al. [13] discussed how distance influences customers’ visitation behavior. By using the Huff model, Wang et al. proposed an effective method to extract samples from social media data that are suitable for delimitating trade areas [14]. In their study, Wang et al. investigated customers’ global sensitivities to distance and business areas quantitatively. All of these studies were conducted based on the assumption that the customers’ sensitivities are global and spatially homogeneous. However, owing to local differences in sociodemographic characteristics (such as the density and the income of the population), customers’ sensitivities were spatially heterogeneous. To date, no studies exist regarding how to accurately use location data to evaluate customers’ local sensitivities to facility attractions.
In this paper, we proposed a new method for using social media data to solve competitive location problems by accurately evaluating customers’ local sensitivities. Based on the proposed method, we will try to address the following research questions: (1) What are the characteristics of spatial distribution of customers’ local sensitivities? (2) To what extent can the method which combines Huff model and geographically weighted regression (GWR) evaluate the customers’ local sensitivities in a high spatial resolution? (3) Can social media samples be a reliable data source for the evaluation of customers’ local sensitivities?
Our method includes 3 main steps: sample extraction, local sensitivity evaluation and capture estimation. Regular spatial units were first designed to extract samples with uniform spatial distribution by spatially aggregating social media data. Then, the Huff model and GWR were combined to evaluate the customers’ local sensitivities. The Huff model is one of the most widely used competitive location models, and the sensitivity parameters in this model were used to represent the customers’ sensitivities [15,16]. Finally, through comparative analysis of the local and global sensitivities, suitable evaluation results were obtained for capture estimation. Based on the capture estimation, we took the feasible area with the largest capture as the optimal area for a new retail facility. The contributions of our study are twofold. First, the results of our study can help people have a better understanding about the spatial variation of customers’ sensitivities. Second, our study provides a cost-effective way to evaluate customers’ local sensitivities and solve competitive location problems with social media data.

2. Background

2.1. Sina Weibo

Sina Weibo is one of the largest social media services in China and is considered to be the “Chinese Twitter” [17]. As of March 2018, the number of active daily social media users had reached 184 million [18]. On the Sina Weibo platform, users can contact each other and post messages called “microblogs”. The form of the microblog can be pictures, webpage links, video links or text with a 140-Chinese-character limit. With the development of location services, location could also be appended to microblogs. In addition, Sina Weibo provided a set of application programming interfaces (APIs) for collecting microblogs, comments and the public information of users. In this study, we collected geotagged microblogs within a given time period and spatial area by applying the Sina API named “place/nearby_timeline”.

2.2. Competitive Location Approach

Many approaches have been proposed to solve competitive location problems [6]. These approaches range from the simple, such as the proximity model, to the sophisticated, such as the Huff model. All the approaches require a large number of samples to evaluate the customers’ sensitivities to facility attractions, except the proximity model [19].
The proximity model was first proposed by Hotelling in 1929 [20]. This model considers the location of two competitive facilities on a segment based on the assumption that distance is the only facility attraction. If one facility is already located on a segment, the location of this facility divides the segment into two parts. A new facility can be located on the longer part of the segment. This approach is not widely applied since it ignores other facility attractions (such as business area) [21].
To overcome the disadvantages of the proximity model, the deterministic utility approach was introduced to solve competitive location problems [22]. This approach first requires many samples to estimate the utility function parameters that represent the customers’ sensitivities. Then, the utilities can be calculated by using the estimated parameters. Last, the approach transforms the utility into a distance markup, and the break-even distance is obtained. The break-even distance refers to the maximum distance that a customer is willing to accept to visit a farther facility. A new facility can be located within the break-even distance. One problem with this approach is the assumption that all customers in the same spatial area are willing to visit the same facility [23].
The random utility approach can be considered to be an extension of the deterministic utility approach [24]. The random utility approach applies the multivariate normal distribution to measure the utilities of competitive facilities. Based on the utilities, the probability that customers visit the target facility is calculated. After calculating the probabilities, the captures for new facilities and the optimal location can be obtained. This approach uses the random distribution of the utility functions to overcome the problem of the deterministic utility approach [25]. The disadvantage of the random utility approach is that the utility decreases slowly for small distances and sharply for large distances [26].
The Huff model is one of the most widely used approaches in the field of competitive location studies [15]. This model assumes that the customers are sensitive to the business area of the facility and the distance [27]. The customers’ sensitivities are represented by the sensitive parameters in this model [28]. The Huff model formula is:
P i j = B j α D i j λ j = 1 n B j α D i j λ
where P i j is the probability that customers located in spatial area i visit the facility or agglomeration j, B j is the business area of the retail facility or agglomeration j, D i j is the distance between the spatial area i and the retail facility or agglomeration j, n is the number of competitive facilities within the study area, and α and λ are the sensitive parameters of business and distance, respectively. These two sensitive parameters were originally considered to be global and were defined as 1 and −2. Because the customers’ sensitivities are spatially heterogeneous, the sensitive parameters are local. The Huff model with local parameters can be expressed as follows:
P i j = B j α i D i j λ i j = 1 n B j α i D i j λ i
where α i and λ i are the local sensitive parameter in spatial area i. Compared with other methods, the attractions considered by the Huff model are relatively complete, and the formula is more reasonable. Therefore, we applied the Huff model to solve the competitive location problem in this study.

3. Study Area and Data
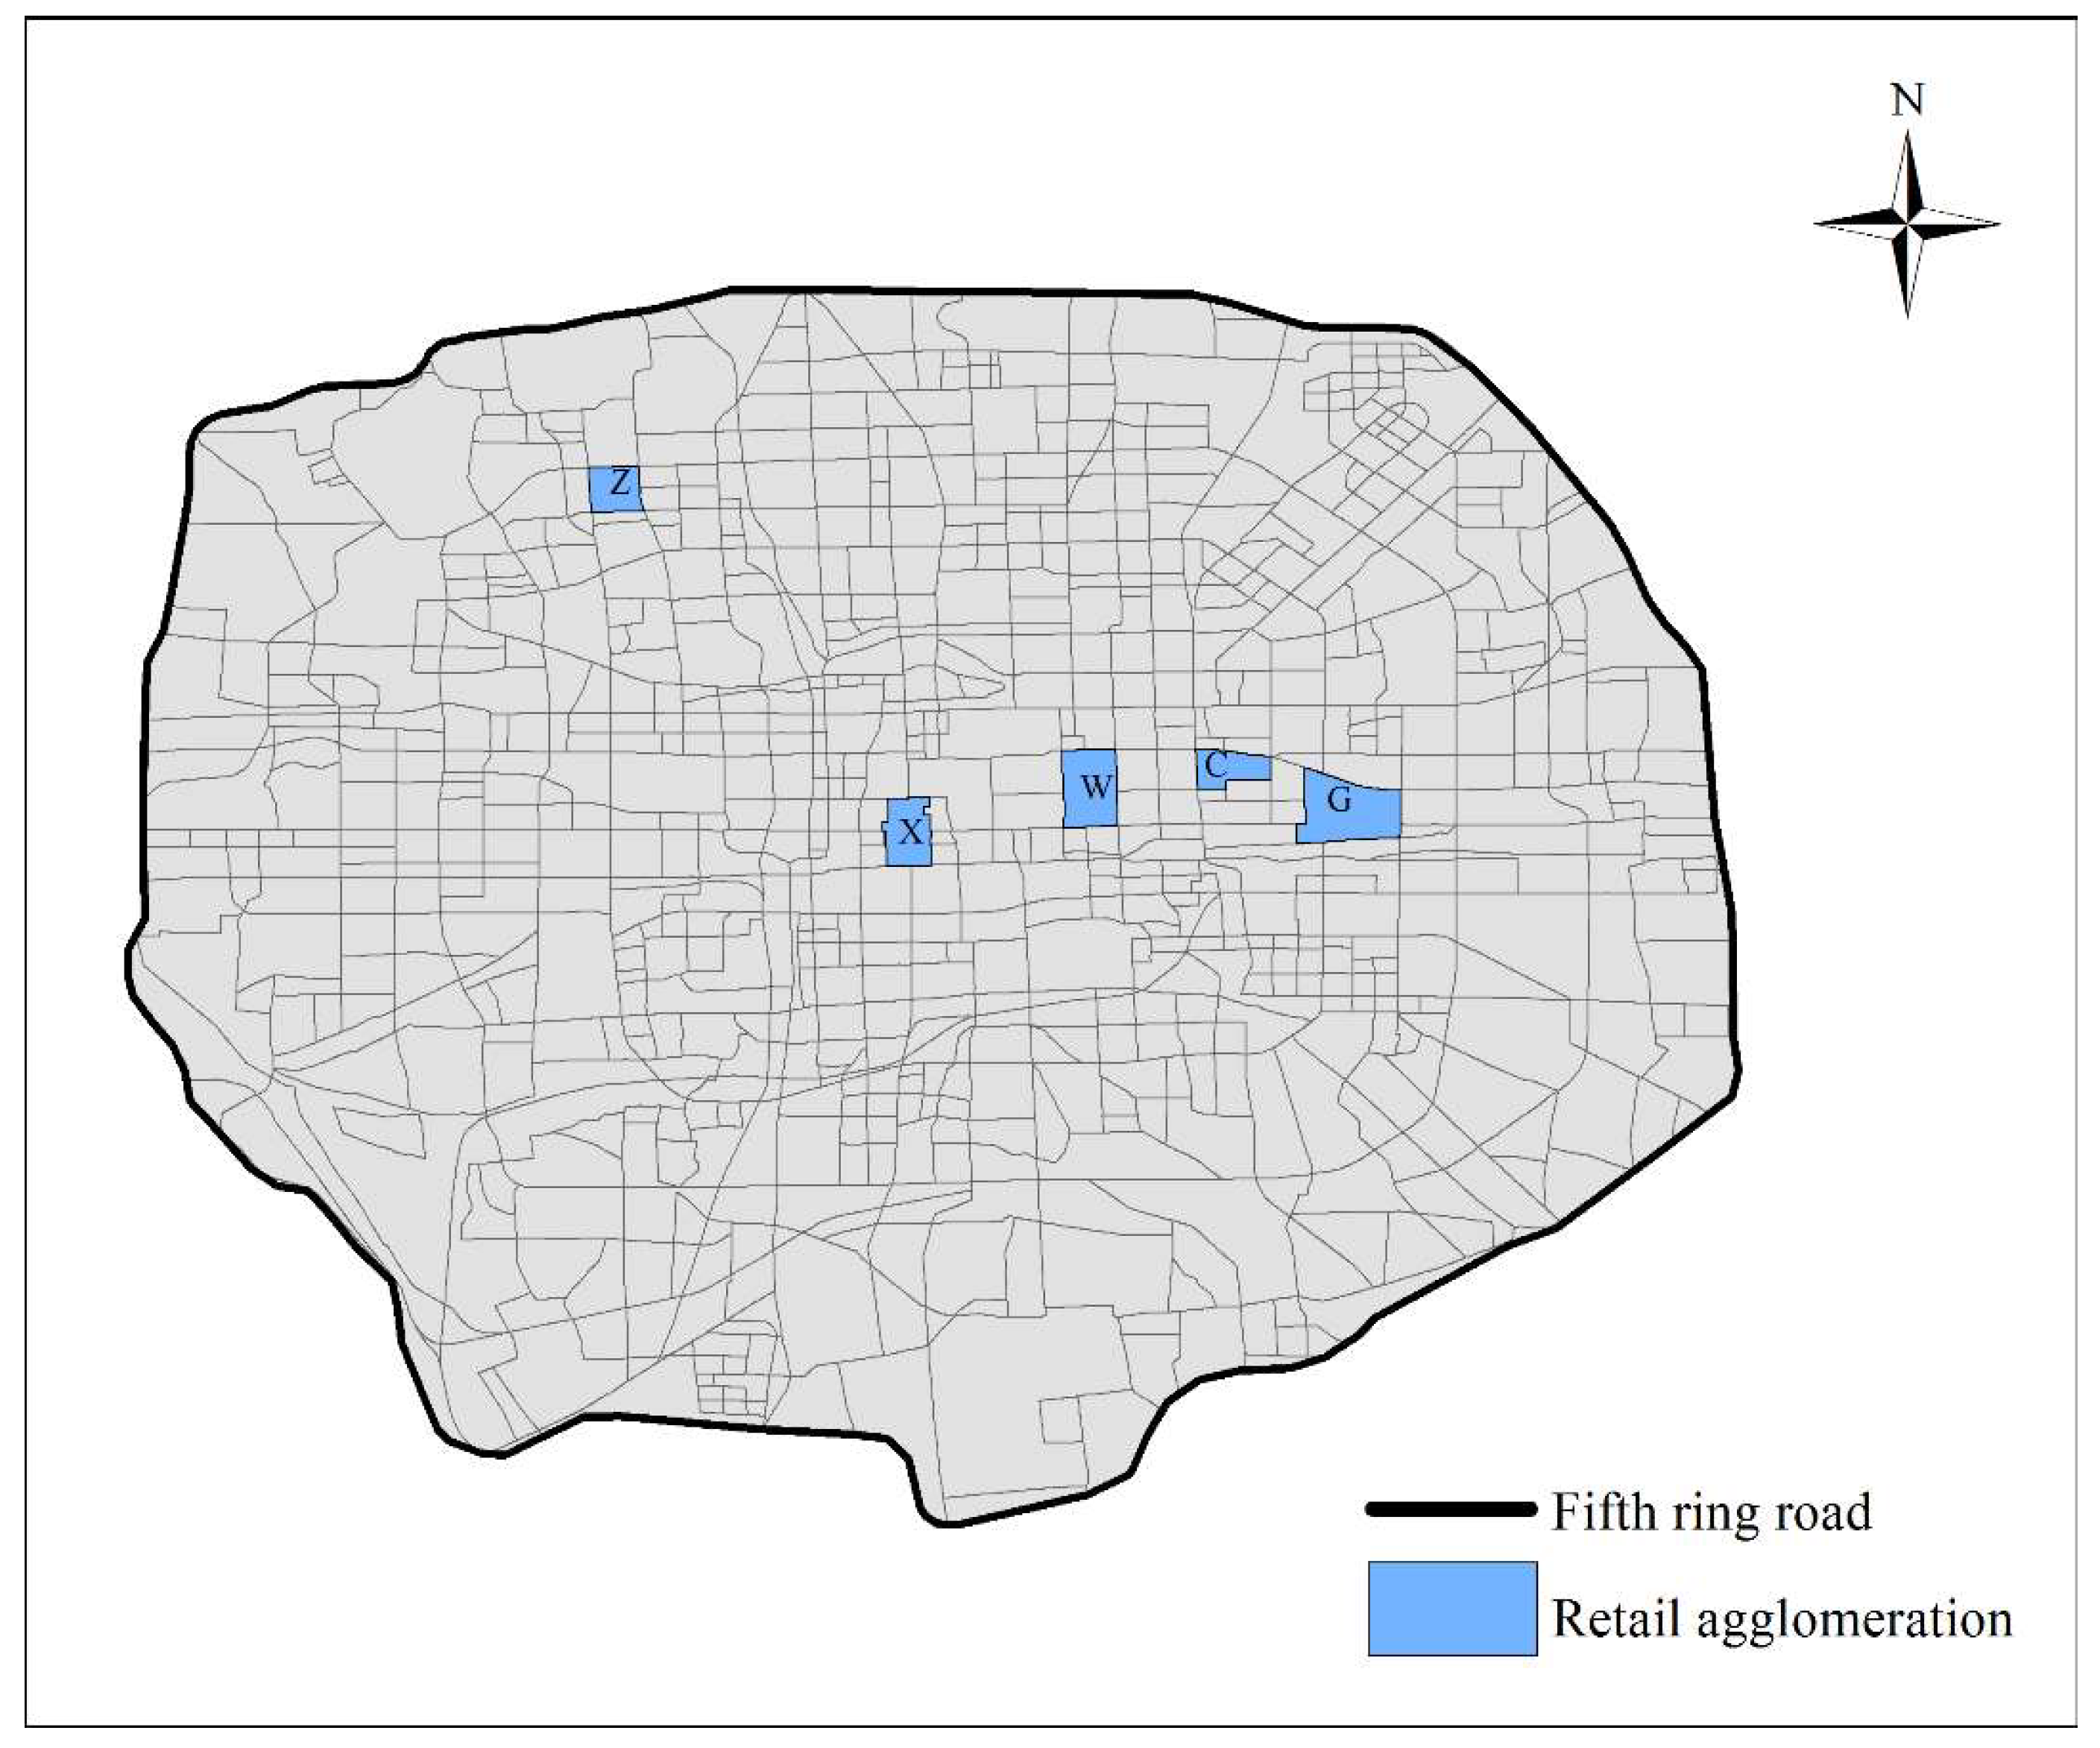
3.1. Study Area

The area surrounded by the fifth ring road in Beijing is taken to be the study area. Beijing is the capital of China and is the second largest metropolis in China. With the development of this metropolis, many retail agglomerations formed. The largest five retail agglomerations in Beijing were taken as test cases, and the location for a new retail agglomeration was determined in this study. The location of each retail agglomeration and study area are shown in Figure 1. “Z”, “W”, “G”, “X” and “C” represent the retail agglomerations Zhongguancun, Wangfujing, Guomao, Xidan and Chaowai, respectively. Each agglomeration has a relatively convenient traffic pattern and can attract a large number of customers every day.

3.2. Data Collection and Preprocessing
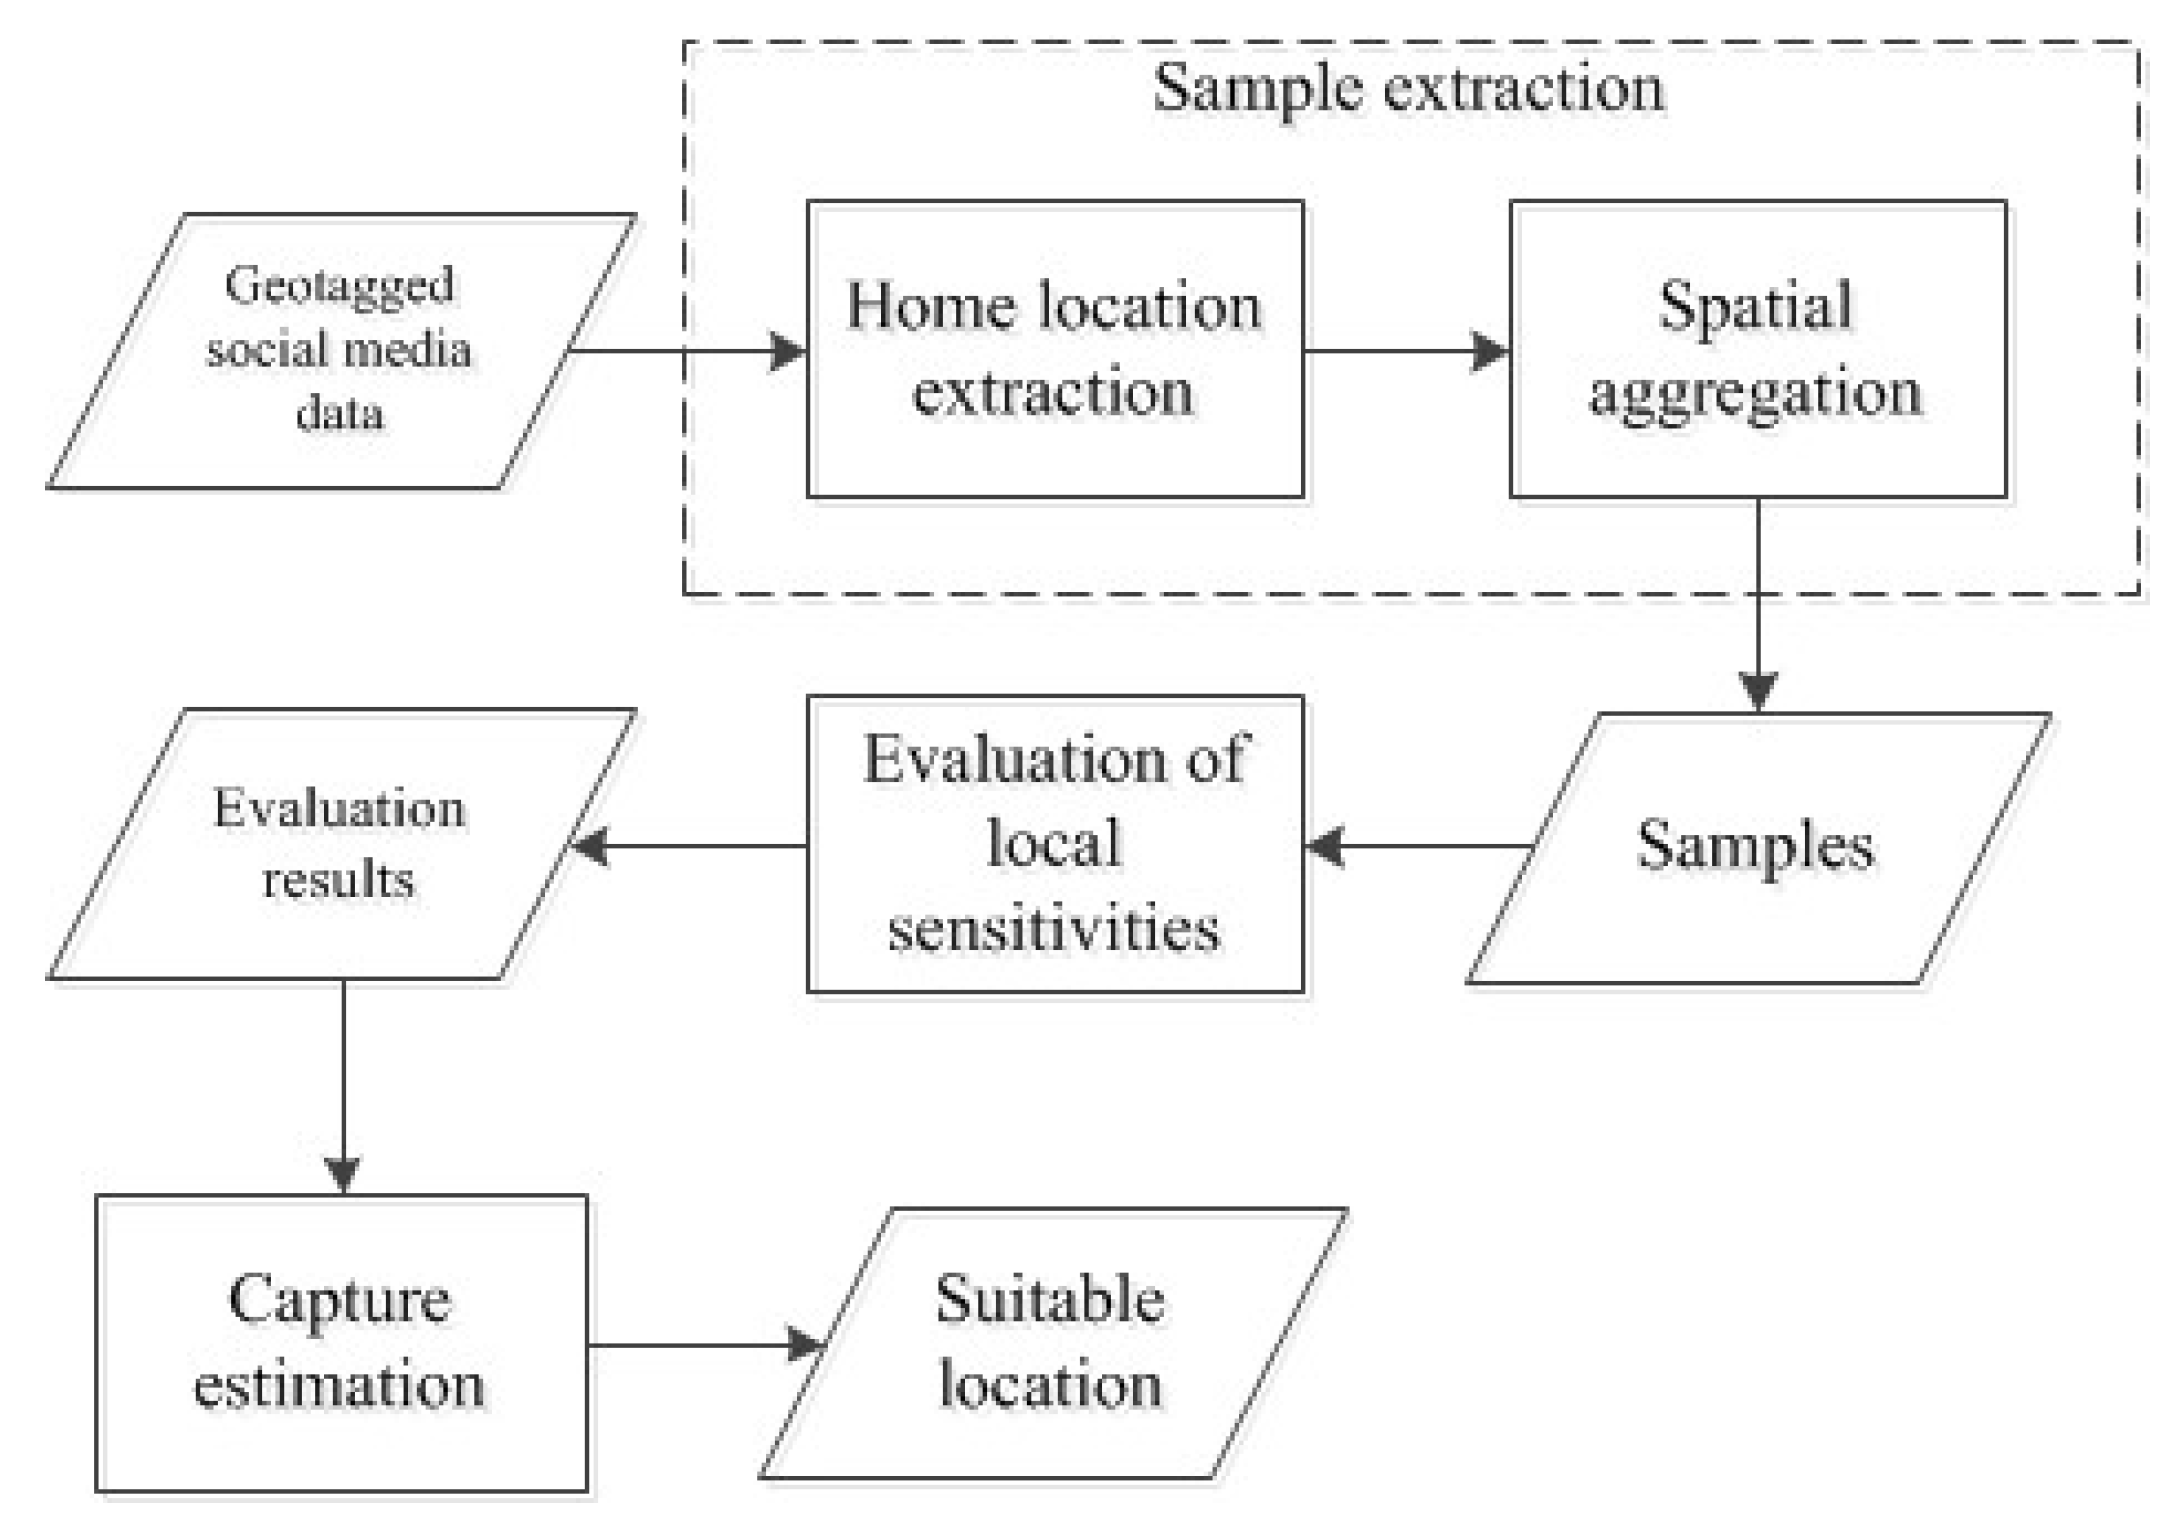
In this study, we collected Sina Weibo data posted within the study area based on the API provided by the Sina corporation. The Sina API is similar to the Twitter API. Both APIs only return no more than 1% of all messages and can collect geotagged messages posted within a circle with a given center and radius [29,30]. To our knowledge, there are also some differences between Sina API and Twitter API. By using Sina API, we can set the ending and starting time of the microblogs which we want to collect. The maximum time range of geotagged microblogs we can collect is 30 days. While, Twitter API need the identifications of Twitter as input rather than the ending and starting time. The maximum time range of geotagged Twitter we can collect is 7 days.
A set of 16,682,330 geotagged microblogs posted between 1 January 2014 and 28 February 2015 were collected. Each microblog in our dataset contains more than 50 attributes. These attributes reveal the detail information related to the microblog and its publisher. Data samples with some important attributes are shown in Table 1. The attributes in the Table 1 were introduced as follows: (1) “id”, “created_at”, “text” and “user_id” refer to the identification, posting time, text and user identification of the microblog, respectively; (2) “geo” refers to the posting location; (3) “retweet_status” can reveal whether the microblog is original. “1” means that this microblog reposts (retweet) other microblogs. “0” indicates that this microblog is original; (4) “POI_id” and “POI_title” refer to the identification and mane of the POI which users checked in. These two attributes in some microblogs are null. This is because some users post microblogs without checking in any POIs; (5) “source” refers to the name of application or phone model which users applied to post microblogs.
To filter out the noise and outliers in the social media dataset, the microblogs were preprocessed. The noise mainly refers to the advertisements and the microblogs which come from non-human sources, namely, bots [31,32,33]. Compared to the microblogs without location information, geotagged microblogs contained less noise and were more reliable. This is because geotagged microblogs in the Sina Weibo platform are all original and a large amount of noise is reposting microblogs (similar to retweets). The samples of noise were shown in Table 1. The noise among 100,000 randomly selected microblogs was first manually identified by members in our research group. Then, by analyzing the attributes of noise, two findings can be concluded: (1) most microblogs with some particular symbols in their texts, such as “【】”, were advertisements; (2) most microblogs posted by bots have a particular “source”, such as “unapproved application” and “PP time machine”. By filtering out the microblogs with particular symbols and “source”, 16,669,258 microblogs were retained. The detail information about the changes of our dataset was shown in Table 2.
After filtering out noises in the dataset, we removed the outliers. Some users may post a large amount of microblogs with the same location information in a short time. These microblogs will influence the final results of our study and can be considered as outliers [34]. Based on the study of Rzeszewski et al. [34], we restricted geotagged microblogs to one location per user in our case. Specifically, no matter how many microblogs with the same location information one user post, we only retain one microblog for one user in one week. Finally, as shown in Table 2, 16,664,073 geotagged microblogs posted by 2,428,294 users were retained for further analysis.

4. Method

In this section, we detail a new method of using social media data to solve competitive location problems by accurately evaluating customers’ local sensitivities to facility attractions. The framework of our method is shown in Figure 2. First, we extracted the home location from the geotagged social media data for each user. To overcome the disadvantages of traditional samples (such as uneven distribution and limited data size), samples with uniform spatial distribution were extracted by spatially aggregating the home locations of users. Then, based on the samples, GWR and the Huff model are combined to evaluate the customers’ local sensitivities. Last, the captures for different feasible locations were estimated, and the optimal location for a new retail agglomeration was determined.

4.1. Sample Extraction

To extract samples with uniform spatial distribution, regular spatial units were applied to spatially aggregate the social media data. Based on Equation (2), there are three types of sample attributes: the distance between the home location and the retail agglomeration; the visitation probability for the retail agglomeration; the business area of the retail agglomeration. The method for calculating the attributes for each aggregated sample is discussed next.

4.1.1. Home Location Extraction

Extracting home locations of the users who are attracted by retail agglomerations is the basis of calculating the distance, which is an important sample attribute. In this study, we first identified the attracted users. Then, the home location for each attracted user was extracted. Because the business hours of most retail facilities are from 9:00 AM to 10:00 PM [11], the users who posted microblogs when they were located at the retail agglomerations during this time period were identified as attracted users. A total of 87,171 attracted users were identified from our dataset. By applying the method proposed by Qu et al. [12], we then extracted the home location of each attracted user. Finally, the home locations of 31,382 attracted users have been obtained effectively. Based on the extraction results, we find that a large amount of Sina Weibo users posted very few geotagged social media data which is not enough for extracting their home location. Similar finding has also be proved by Rzeszewski et al. [34].

4.1.2. Spatial Aggregation

Because of the uneven distribution and limited data size, traditional samples cannot be applied to evaluate the local sensitivity with accuracy [10,11]. To provide reliable data support for the local sensitivity evaluation, we applied the method proposed by Wang et al. to spatially aggregate social media data and calculate sample attributes [14]. The method has been introduced in detail in the study of Wang et al. [14]. Based on this method, regular 600 m * 600 m grids were designed to spatially aggregate the home locations of the attracted users. Through spatial aggregation, all grids were retained and a set of 1411 aggregated samples were obtained. These samples are uniformly distributed and can reflect the overall visitation behavior of attracted users in each spatial unit. Therefore, compared with traditional samples, aggregated samples are more suitable for the local sensitivity evaluation in each unit.

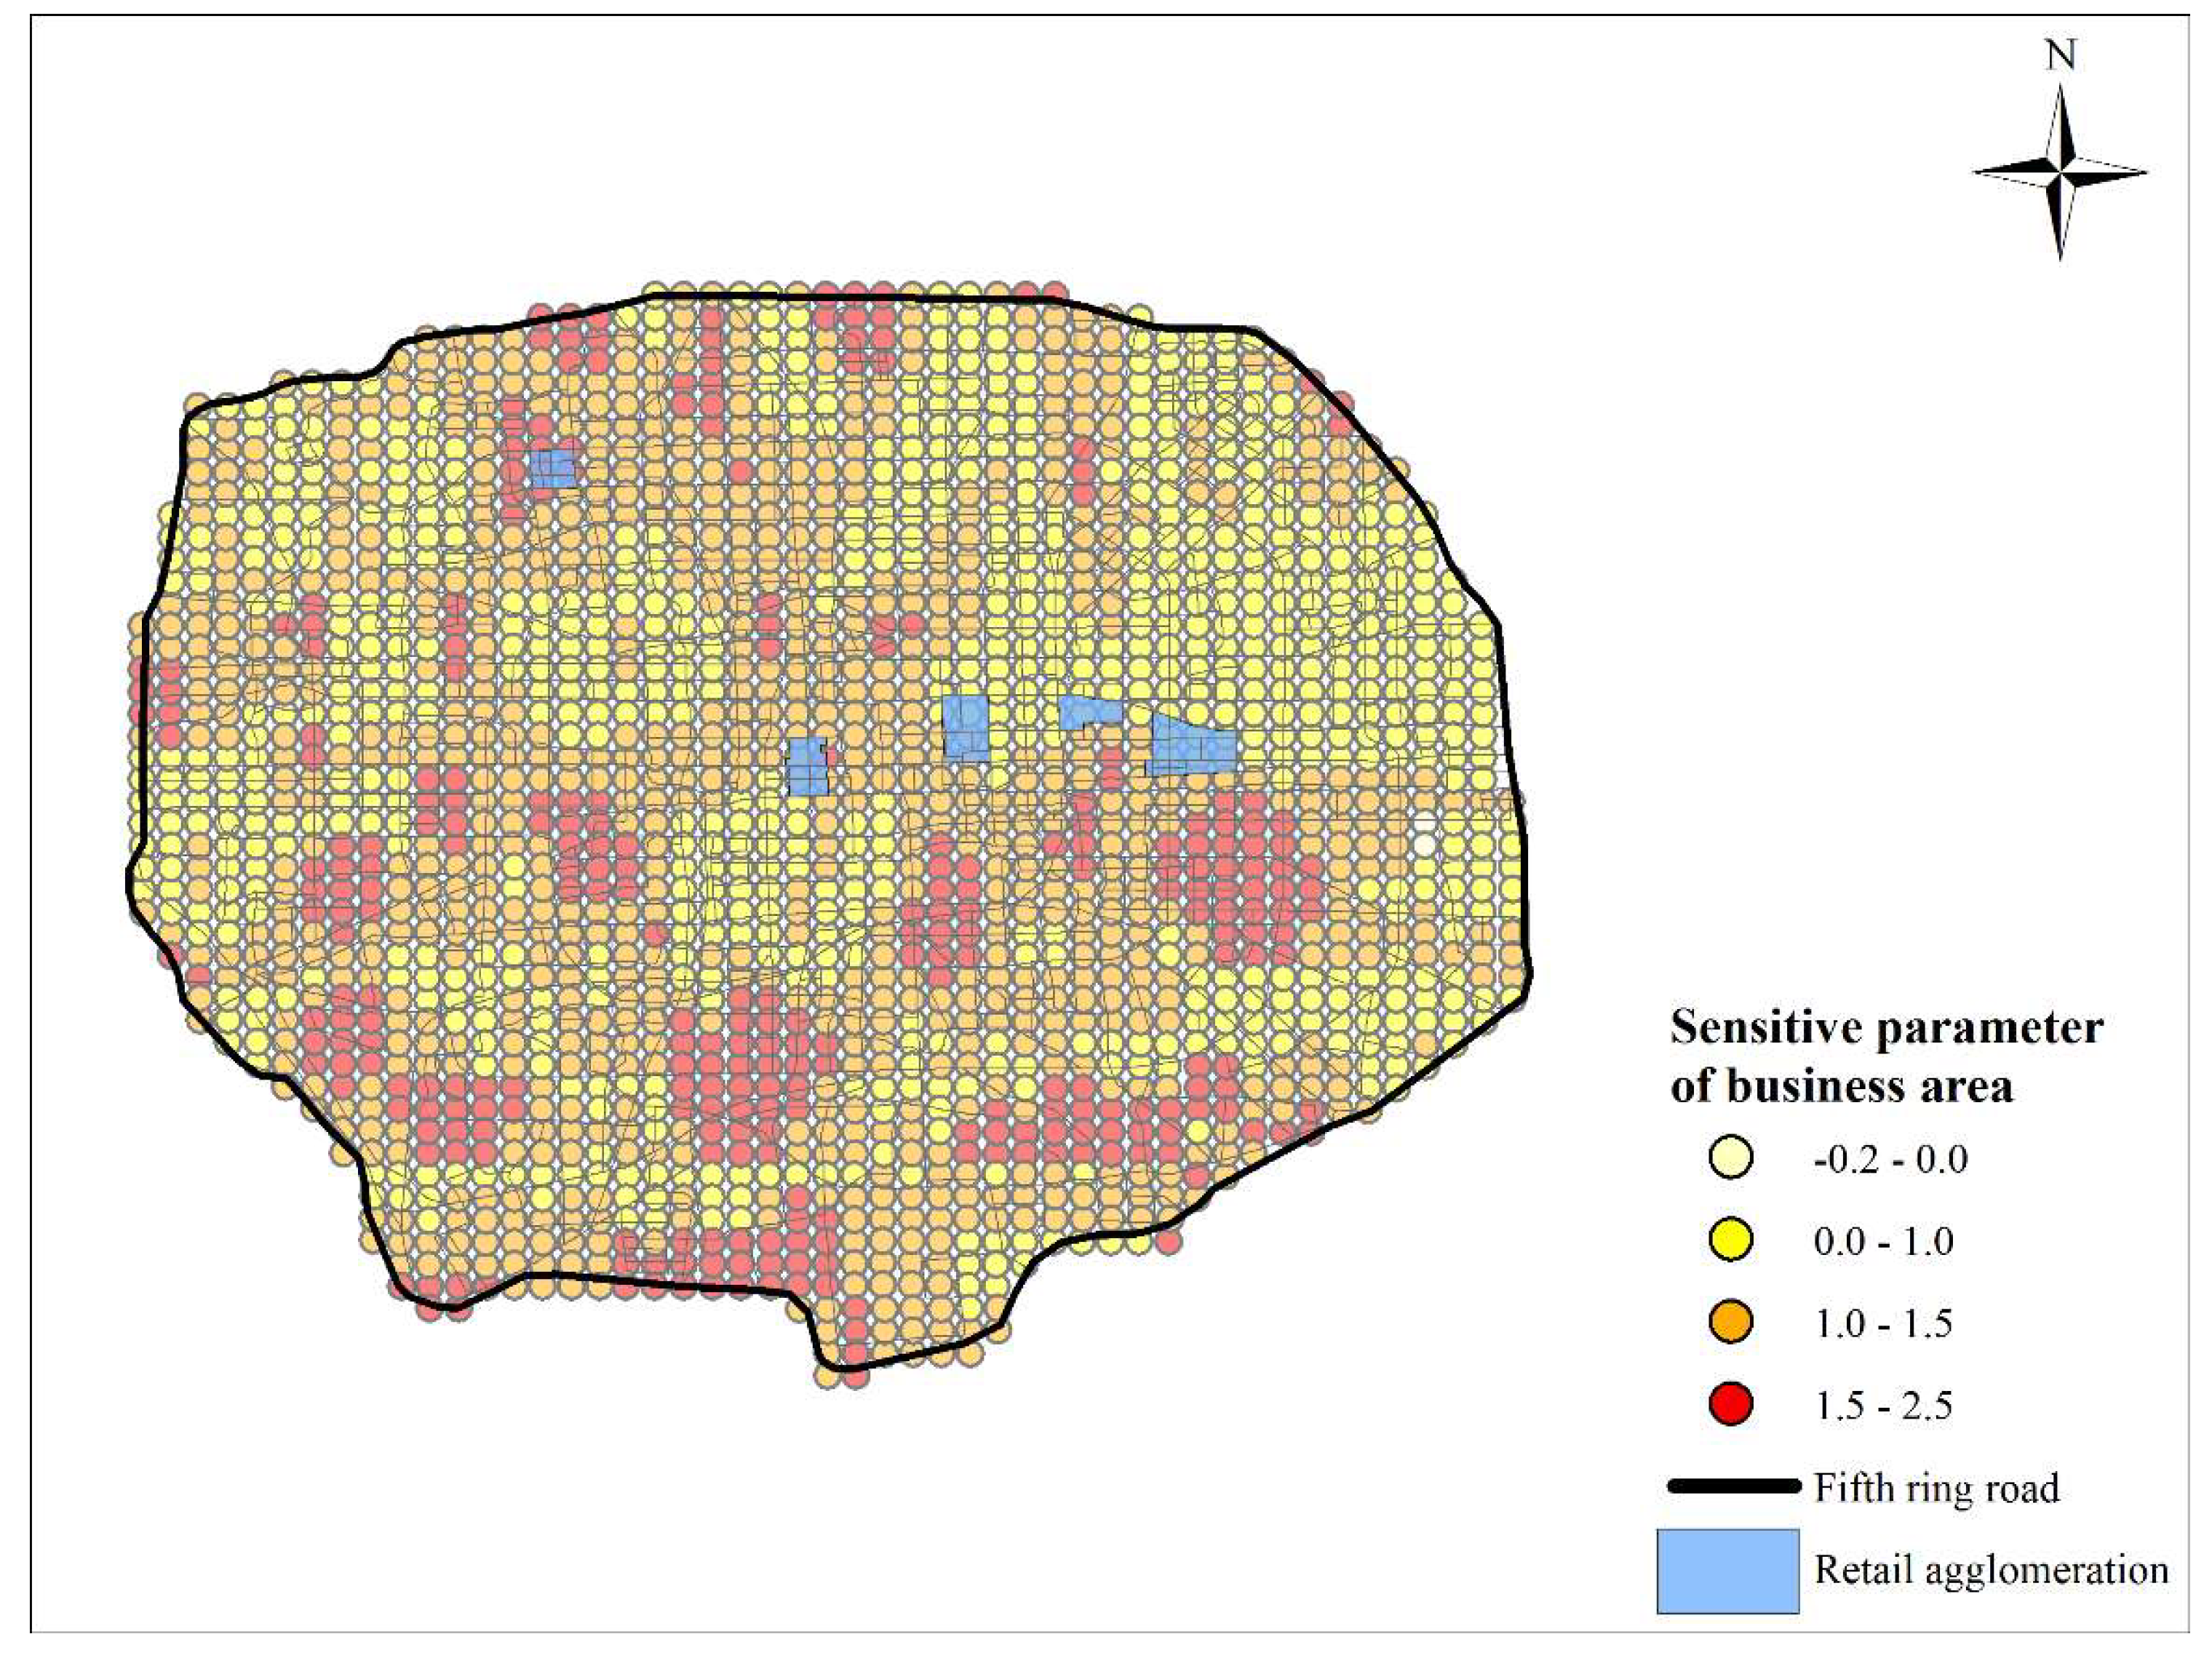
4.2. Local Sensitivity Evaluation

Evaluating customers’ sensitivities is the premise of calculating the capture of a new retail facility or agglomeration [5,6]. Based on the samples extracted, the Huff model and GWR method were applied to evaluate the customers’ local sensitivities. The GWR was proposed by Brunsdon et al. [35] and Fotheringham et al. [36] and assumed that closed locations have similar values. The GWR is an effective method of evaluating the spatial variation in the relationships between variables across the entire space [37,38]. Therefore, the original formula of GWR was suitable for evaluating local sensitivities in this study. The formula is expressed as:
y i = β 0 ( u i , v i ) + k = 1 p β k ( u i , v i ) x i k + ε i
where y i is the dependent variable, x i k is the independent variable, p is the number of independent variables, ( u i , v i ) are the coordinates of spatial unit i ,   ε i the is random error, and β k ( u i , v i ) is the regression parameter in spatial unit i and is the function of coordinates ( u i , v i ) .
Because GWR can only deal with linear models, the Huff model with local sensitive parameters (Equation (2)) was transformed to the linear model by using Nakanishi and Cooper’s transformation [39]. The transformed Huff model is expressed as:
ln ( P i j / P ˜ i ) = α i ln ( S j / S ˜ ) + λ i ln ( D i j / D ˜ i )
where P i j is the probability that attracted users located in unit i visit the retail agglomeration j, P ˜ i , S ˜ and D ˜ i are the geometric means of P i j , S j and D i j , respectively, and α i and λ i are the local sensitive parameters of business area and distance in spatial unit i, respectively. The local sensitive parameters were treated as the regression parameters in Equation (3).
By combining Equation (3) with Equation (4), the sensitive parameters in spatial unit i were estimated by following formula:
β ^ i = ( X T W i X ) 1 X T W i y
where X and y are the matrices of the observed independent and dependent variables, respectively; different spatial units have divergent impacts on the evaluation of the target unit i, and these impacts were quantified in the weight matrix W i . The weight matrix is shown as follows:
W i = [ w i 1 0 0 0 w i 2 0 0 0 0 0 w i n ]
where w i n represents the weight value between unit n and target unit i.
Here, the weighting scheme W i is a distance-decay function that is a ‘‘bell’’ shape. Many functions can be used for the weighting scheme. Based on the theory of Fotheringham [38], compared to many other functions, the calculative efficiency of bi-square function is higher. Therefore, a bi-square function is applied in this case. A bi-square is a type of Gaussian function and can be expressed as follows:
w i j = { [ 1 ( d i j / b ) 2 ] 2 d i j b 0 d i j > b
where d i j and w i j are the distance and weight between units i and j, respectively, and the bandwidth b is the key controlling parameter and is used to exclude the units that are farther than the distance threshold. Specifically, the bandwidth can determine the number of nearby units that are used for evaluating the local sensitive parameters in the target unit [40].
Finding the optimal bandwidth is an important step of the local evaluation. The Akaike Information Criterion (AICc) is first proposed by Akaike et al. to optimal the bandwidth [41]. Compared to many other indices, the formula of AICc is simpler and can be applied to find the optimal number of neighbors more effectively [40,41]. Therefore, AICc is introduced in this case. The formula of AICc is defined as follows:
A I C c = 2 n ln ( σ ^ ) + n ln ( 2 π ) + n { n + t r ( S ) n 2 t r ( S ) }
where n is the number of spatial units, σ ^ is the estimated standard deviation of the error term, and tr(S) is the trace of the hat matrix S. Lower AICc values represent more suitable bandwidth and better model performance. Through an iterative optimization process, a best-fit bandwidth can be determined by minimizing the value of AICc [42,43].
In addition to the AICc, the coefficient of determination R2 was also applied in our case for estimating the accuracy of the local sensitive parameter evaluation. R2 provides a measurement of how well observed outcomes can be replicated by the model. R2 is calculated by following formula:
R 2 = 1 i = 1 n ( y i y ^ i ) 2 i = 1 n ( y i y ¯ ) 2
where y, y ^ i and y ¯ are the observed, estimated and average values of the visitation probability, respectively. The higher values of R2 indicate that a larger proportion of the total variation of the outcomes can be explained by the GWR method.
The collinearity among the covariates is a problem that should be considered in the GWR model [44]. Local collinearity may appear when weight values in nearby units are high, and the sample sizes in these units are low. Local variance inflation factors (VIFs) and condition numbers (local-CN) were applied to detect the existence of local collinearity. As a general rule proposed by Belsley et al. [45], collinearity may exist for local-CNs that are greater than 30 or VIFs that are greater than 10. In addition to testing the local collinearity problem, the significance of each sensitive parameter that was evaluated was checked using the t-test.

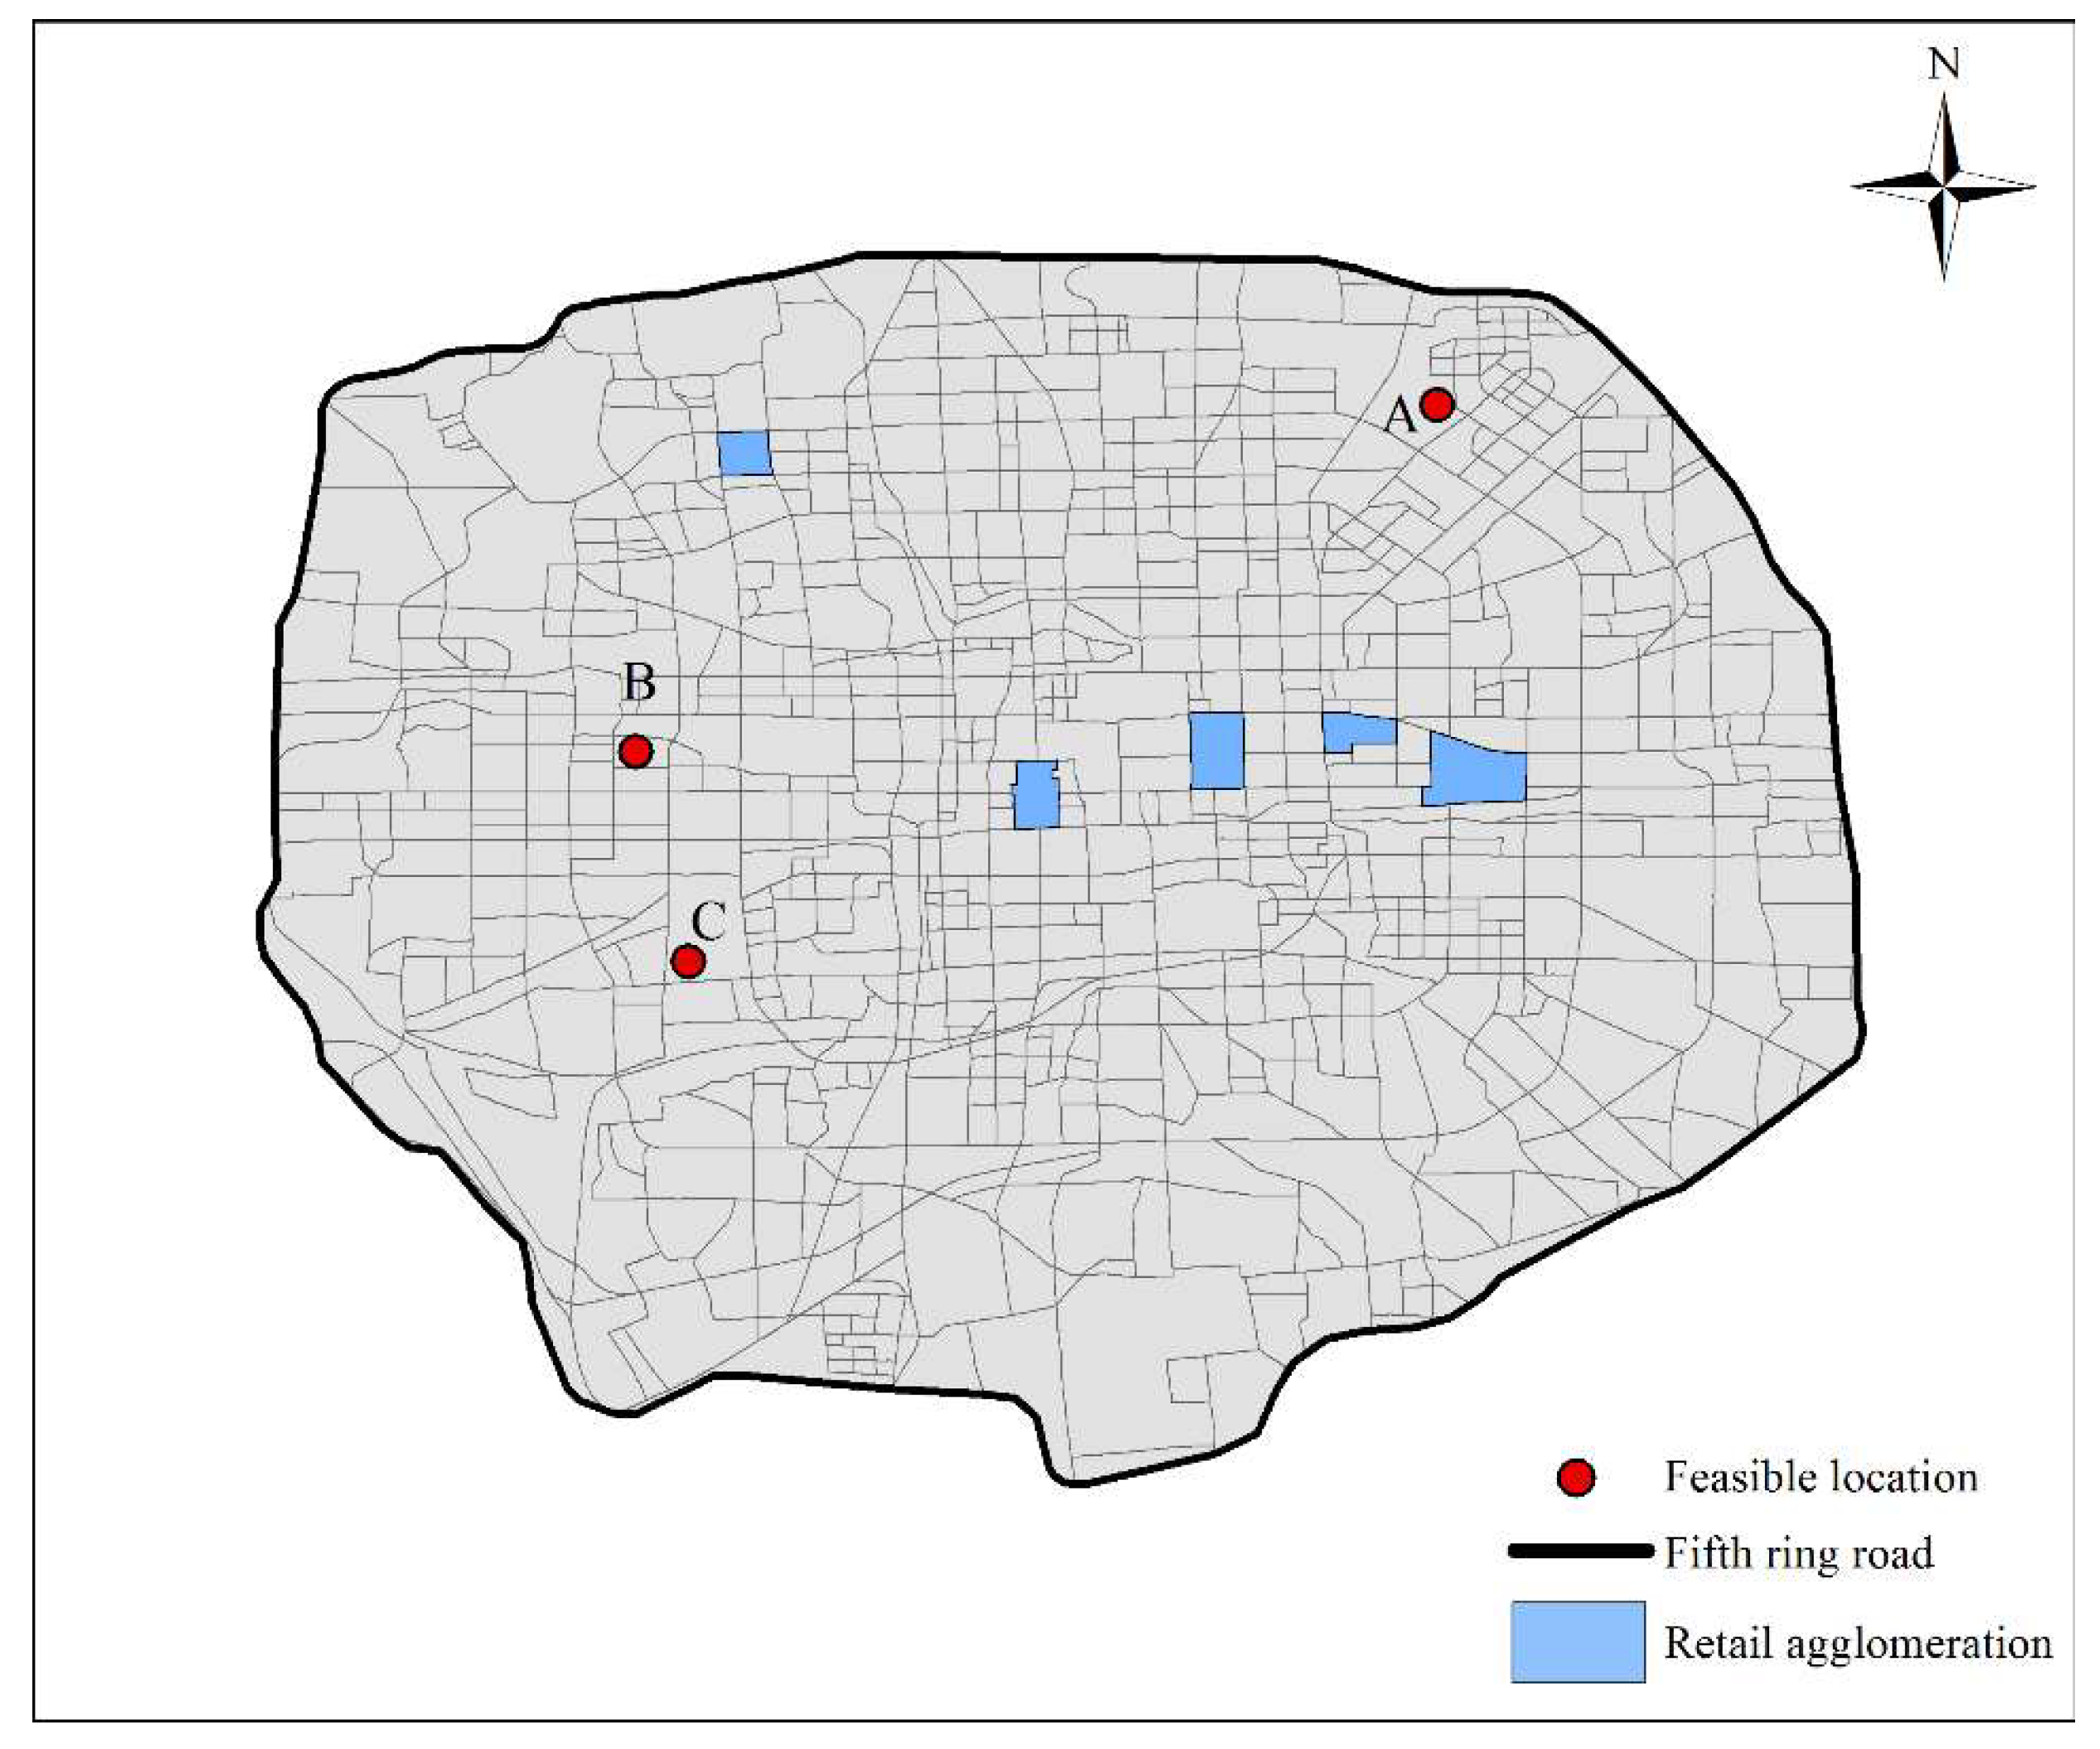
4.3. Capture Estimation

By using the evaluation results of customers’ local sensitivities, the captures for feasible locations were estimated to determine the optimal location for a new retail agglomeration. Three steps were included in this process: (1) feasible location identification; (2) visitation probability calculation; and (3) capture estimation. To identify the feasible locations, the areas with important infrastructures, scenic spots and government buildings were first removed based on a land use map. Then, the remaining areas were divided into plots. Each plot was geographically represented by its geometric center and could contain the maximum business area of a new agglomeration sized 80,000 m2. From these plots, we selected three suitable plots as feasible locations A, B and C, as shown in Figure 3.
The visitation probabilities for new retail agglomerations on the feasible locations were calculated. If a new retail agglomeration was placed on the feasible location F, the probability that customers located in unit i visit the new retail agglomeration can be calculated by:
P i F = B α i D i F λ i B α i D i F λ i + j = 1 n B j α i D i j λ i
where D i F is the shortest network distance between unit i and feasible location F, B is the business area of the new retail agglomeration, n is the number of existing retail agglomerations, and α i and λ i are the local sensitive parameters in spatial unit i. If the sensitive parameters were considered to be global over space, α 1 = = α i = α n and λ 1 = = λ i = λ n .
Based on the visitation probabilities, the capture of the new retail agglomeration can be calculated as follows:
C ( F ) = i = 1 n Y i P i F
where n is the number of spatial units, and Y i is the buying power of unit i. Buying power in each spatial area can be replaced by the population [5,6]. In recent years, the results of certain studies indicated that geotagged social media data can be used to approximately represent relative population density [13,31,46]. Therefore, in our case, the number of home locations of social media users was treated as the relative buying power. The results of the capture calculation are presented and analyzed in next section.

5. Results and Analysis

The evaluation results are compared and analyzed in this section. Based on the analysis results, the capture was calculated to determine the optimal location for a new retail agglomeration.

5.1. Comparative Analysis of Evaluation Results

To obtain the customers’ sensitivities with high accuracy, evaluation results of local and global sensitivities were compared. Furthermore, the characteristics of the spatial distribution of the local sensitivities were also investigated. Based on the sample set extracted from the geotagged social media data, customers’ local sensitivities were evaluated by using GWR, and the global sensitivities were evaluated by using ordinary least squares (OLS). Ordinary least squares is a method for estimating unknown parameters in a linear regression model [47]. The global and local evaluation results are shown in Table 3. Two global parameters are significant with p-values < 0.001. To detect the collinearity problems of the GWR, VIFs and local-CN were calculated. The VIFs varied from 1.0 to 8.59 and the range of local-CN values is from 2.28 to 9.35. Based on the general rule proposed by Belsley et al. [45], there are no local collinearity problems in the process of local evaluation. The local sensitive parameters of business area (αi) and distance (βi) are significant for 21.61% and 90.42% of the samples, respectively, which indicates that most customers tend to care more about the distance than the business area.
The evaluation accuracy of customers’ local sensitivities is higher than that of the global. The R2 and AICc values were applied to estimate the accuracy of the sensitivity evaluation. As shown in Table 3, the R2 of the local sensitive parameters is 0.73 and is significantly higher than that of the global. Additionally, the AICc of the local parameters is lower than that of the global. These results indicated that the customers’ sensitivities in the real world tend to be local. The mean local parameters αi and λi are 1.04 and −1.16, respectively. The global parameters α and λ are 0.97 and −1.04, respectively. The differences between the local and global parameters demonstrate that the global evaluation may underestimate customers’ sensitivities to business area and overestimate sensitivities to distance. Because of their high accuracy, the local parameters were applied to determine the optimal location for a new retail agglomeration.
The spatial distributions of the local αi and λi are presented in Figure 4 and Figure 5. As shown in Figure 4, most spatial units with high values of local αi (from 1.5 to 2.5) have relatively convenient transportation and customers in these areas are more willing to visit the retail agglomerations with large business areas. As shown in Figure 5, the spatial units with low absolute values of λi (from 0.0 to −1.0) were located in the north part of study area. High absolute values (from −2.8 to −2.0) were found in the units far from the existing retail agglomerations, which indicated that customers living far from retail agglomerations are more sensitive to the distance.

5.2. Capture Analysis

Based on the sensitive parameters that were evaluated, the captures for different feasible locations were calculated and analyzed to determine the optimal location for a new retail agglomeration. For each feasible area in Figure 3, the capture was calculated by using Equations (10) and (11). To analyze the effect of business area, the business area for a new retail agglomeration was set as 40,000, 60,000 and 80,000 m2. Additionally, local and global sensitive parameters were all applied in the capture estimation to reveal the differences between the local and global captures.
The captures for different feasible locations are shown in Table 4. There is a significant difference between two types of capture. Compared with the local capture, the global capture was higher at location A and was lower at locations B and C. The optimal location was determined at the base of local capture. Location A maximizes the local capture for the business area of 80,000 m2 and location B maximizes the local captures for 40,000 and 60,000 m2. Therefore, location A is the optimal location for a new retail agglomeration with a business area of 80,000 m2, and location B is the optimal location for 40,000 or 60,000 m2.

6. Conclusions

The development of location services provided considerable opportunities for applying geotagged social media data to locate new retail facilities and agglomerations. In this study, we proposed an improved method for using social media data to solve competitive location problems based on customers’ local sensitivities. The results indicated that: (1) our method can locate a new retail agglomeration in a cost-effective way; (2) social media samples can be a reliable data source for the evaluation of customers’ local sensitivities; (3) the customers far from the existing retail agglomerations may be more sensitive to the distance. Based on our study, decision makers can make more effective strategies to attract different types of customers. For example, to the customers who are very sensitive to the distance, decision makers can provide more convenient transportation modes to them.
Most previous studies first extracted suitable samples from location data (such as mobile phone location data, taxi trajectory data and social media data). Then, based on the extracted samples, they are mainly focused on applying the single Huff model to evaluate customers’ global sensitivities [10,11,14]. Compared to previous studies, our approach is different. The approach in our study consists of three parts: sample extraction, local sensitivity evaluation and capture estimation. In the process of local sensitivity evaluation, the Huff model was combined with GWR to evaluate the spatial distribution of customers’ local sensitivities with accuracy in a high spatial resolution. Based on the evaluation result, optimal location for a new retail agglomeration can be determined. Our method can be applied to locate retail facilities with large business areas or retail agglomerations in the spatial area where a large amount of location data were generated daily.
In future studies, more attention should be paid to alleviating the disadvantages of social media data, and following challenges should be addressed:
  • Representability. Social media services are widely used among young people. The age structure of social media users is different from that of the real world [18]. Therefore, social media data can only be used as an approximate representation of the population density and customers’ behavior in the real world. Our research team will investigate the impact of the representability of social media data on competitive location problem.
  • Text. Text information is an important attribute of social media data. People can post text that expresses their feelings and opinions about a retail facility. Therefore, from the text, we can find more factors that can attract customers. Based on text analysis, more facility attractions can be added to the competitive location models to further improve accuracy of the evaluation of the customers’ sensitivities.
  • Modifiable area unit problem (MAUP). In our case, 600 meter * 600 meter grids were applied to divide the study area based on previous studies. Different sizes of spatial units can generate different results, and the optimal size needs to be investigated. In the future, we will reveal the effect of the size of spatial units in competitive location problems and obtain the best-fit size.
  • Noise filtering. Based on the manual analysis of noises, we investigated the characteristics of noises in Sina Weibo dataset. The microblogs with particular symbols and “source” were identified as noises and filtered out. Although this process can filter out noises effectively, it is very time consuming and labor intensive. We need to develop machine learning procedures to remove noises.
  • Home location extraction. In this case, we applied the method proposed by Qu et al. for extracting the home locations of Sina Weibo users [12]. In the study of Qu et al, the home locations extracted from geotagged social media data were compared to the real homes. Although the accuracy of the proposed method has been proved to be higher than many other methods in their study, the accuracy was not evaluated in our dataset. In the future work, the electronic questionnaires will be sent to the Sina Weibo users and the accuracy of this method will be further investigated.
  • Privacy issues. Social media data contains a large amount of personal information (such as registration locations, age, friends and attitudes). Most users did not notice that their post information could be publicly obtained on the Internet and was applied to published research. More studies are needed to explore the protection of the privacy of social media users and provide guidance on developing academic ethical standards in social media data application.

Author Contributions

Conceptualization, Wei Jiang and Yandong Wang; methodology, Wei Jiang and Yandong Wang; software, Mingxuan Dou; validation, Senbao Liu; formal analysis, Mingxuan Dou and Senbao Liu; investigation, Mingxuan Dou and Senbao Liu; resources, Shiwei Shao and Hui Liu; writing—original draft preparation, Wei Jiang; writing—review and editing, Yandong Wang; visualization, Shiwei Shao and Hui Liu; supervision, Wei Jiang and Yandong Wang; project administration, Wei Jiang and Yandong Wang; funding acquisition, Wei Jiang and Yandong Wang.

Funding

This research was funded by the National Key Research Program of China (Grant No. 2016YFB0501403), the National Natural Science Foundation of China (Grant No. 41271399), Anhui Normal University Fund (Grant No. 2018XJJ46), China Special Fund for Surveying, Mapping and Geoinformation Research in the Public Interest (Grant No. 201512015)

Acknowledgments

The authors would like to appreciate Menglin Qiao for her work in the visualization part. Also, authors appreciate the contributions made by anonymous reviewers.

Conflicts of Interest

The authors declare no conflict of interest.

References

  1. Gentile, J.; Pessoa, A.A.; Poss, M.; Roboredo, M.C. Integer programming formulations for three sequential discrete competitive location problems with foresight. Eur. J. Oper. Res. 2018, 265, 872–881. [Google Scholar] [CrossRef]
  2. Kung, L.C.; Liao, W.H. An Approximation Algorithm for a Competitive Facility Location Problem with Network Effects. Eur. J. Oper. Res. 2018, 267, 176–186. [Google Scholar] [CrossRef]
  3. Fernández, J.; Pelegri, N.B.; Plastria, F.; Boglárka, T. Solving a Huff-like competitive location and design model for profit maximization in the plane. Eur. J. Oper. Res. 2007, 179, 1274–1287. [Google Scholar] [CrossRef]
  4. Blanquero, R.; Carrizosa, E.; Hendrix, M.T. Locating a competitive facility in the plane with a robustness criterion. Eur. J. Oper. Res. 2011, 215, 21–24. [Google Scholar] [CrossRef]
  5. Suárezvega, R.; Gutiérrezacuña, J.L.; Rodríguezdíaz, M. Locating a supermarket using a locally calibrated Huff model. Int. J. Geogr. Inf. Sci. 2015, 29, 217–233. [Google Scholar] [CrossRef]
  6. Drezner, T. A review of competitive facility location in the plane. Logist. Res. 2014, 7, 114–129. [Google Scholar] [CrossRef]
  7. Jiang, W.; Wang, Y.; Tsou, M.H.; Fu, X. Using social media to detect outdoor air pollution and monitor air quality index (aqi): A geo-targeted spatiotemporal analysis framework with Sina Weibo (Chinese Twitter). PLoS ONE 2015, 10, e0141185. [Google Scholar] [CrossRef]
  8. Lin, M.; Lucas, H.C.; Shmueli, G. Research Commentary—Too Big to Fail: Large Samples and the p-Value Problem. Inf. Syst. Res. 2013, 24, 906–917. [Google Scholar]
  9. O’Kelly, M.E. Trade-Area Models and Choice-based Samples: Methods. Environ. Plan. A 2008, 31, 613–627. [Google Scholar]
  10. Lu, S.; Shaw, S.L.; Fang, Z.; Zhang, X.; Yin, L. Exploring the Effects of Sampling Locations for Calibrating the Huff Model Using Mobile Phone Location Data. Sustainability 2017, 9, 159. [Google Scholar] [CrossRef]
  11. Yue, Y.; Wang, H.D.; Hu, B.; Li, Q.Q.; Li, Y.G.; Yeh, A.G.O. Exploratory calibration of a spatial interaction model using taxi GPS trajectories. Comput. Environ. Urban Syst. 2012, 36, 140–153. [Google Scholar] [CrossRef]
  12. Qu, Y.; Zhang, J. Trade area analysis using user generated mobile location data. In Proceedings of the 22nd International Conference on World Wide Web, New York, NY, USA, 13–17 May 2013; pp. 1053–1064. [Google Scholar]
  13. Hu, Q.; Wang, M.; Li, Q. Urban Hotspot and Commercial Area Exploration with Check-in Data. Acta Geod. Cartogr. Sin. 2014, 43, 314–321. [Google Scholar]
  14. Wang, Y.; Jiang, W.; Liu, S.; Ye, X.; Wang, T. Evaluating Trade Areas Using Social Media Data with a Calibrated Huff Model. ISPRS Int. J. Geo-Inf. 2016, 5, 112. [Google Scholar] [CrossRef]
  15. Huff, D.L. Defining and Estimating a Trading Area. J. Mark. 1964, 28, 34–38. [Google Scholar] [CrossRef]
  16. Markham, F.; Doran, B.; Young, M. Estimating gambling venue catchments for impact assessment using a calibrated gravity model. Int. J. Geogr. Inf. Sci. 2014, 28, 326–342. [Google Scholar] [CrossRef]
  17. Chen, S.; Zhang, H.; Lin, M.; Lv, S. Comparision of microblogging service between Sina Weibo and Twitter. In Proceedings of the 2011 International Conference on Computer Science and Network Technology (ICCSNT), Guangzhou, China, 24–26 December 2011; pp. 2259–2263. [Google Scholar]
  18. The Number of Sina Weibo Users Has Reached 411 Million. Available online: http://tech2ipo.com/10037717 (accessed on 9 May 2018).
  19. Eiselt, H.A.; Laporte, G.; Thisse, J.F. Competitive Location Models: A Framework and Bibliography. Transp. Sci. 1993, 27, 44–54. [Google Scholar] [CrossRef]
  20. Hotelling, H. Stability in Competition. Econ. J. 1929, 39, 41–57. [Google Scholar] [CrossRef]
  21. Yang, H.; Wong, S.C. A Continuous Equilibrium Model for Estimating Market Areas of Competitive Facilities with Elastic Demand and Market Externality. Transp. Sci. 2000, 34, 216–227. [Google Scholar] [CrossRef]
  22. Hodgson, M.J. Toward More Realistic Allocation in Location Allocation Models: An Interaction Approach. Environ. Plan. A 1978, 10, 1273–1285. [Google Scholar] [CrossRef]
  23. Wong, S.C.; Yang, H. Determining Market Areas Captured by Competitive Facilities: A Continuous Equilibrium Modeling Approach. J. Reg. Sci. 2010, 39, 51–72. [Google Scholar] [CrossRef]
  24. Leonardi, R.T. Random utility demand models and service location. Reg. Sci. Urban Econ. 2006, 14, 399–431. [Google Scholar] [CrossRef]
  25. Kress, D.; Pesch, E. Competitive Location and Pricing on Networks with Random Utilities. Netw. Spat. Econ. 2016, 16, 837–863. [Google Scholar] [CrossRef]
  26. Drezner, T.; Drezner, Z. Competitive facilities: Market share and location with random utility. J. Reg. Sci. 2010, 36, 1–15. [Google Scholar] [CrossRef]
  27. Baray, J.; Cliquet, G. Delineating store trade areas through morphological analysis. Eur. J. Oper. Res. 2007, 182, 886–898. [Google Scholar] [CrossRef]
  28. Gautschi, D.A. Specification of patronage models for retail center choice. J. Mark. Res. 1981, 18, 162–174. [Google Scholar] [CrossRef]
  29. Kryvasheyeu, Y.; Chen, H.; Obradovich, N.; Moro, E.; Van Hentenryck, P.; Fowler, J.; Cebrian, M. Rapid Assessment of Disaster Damage Using Social Media Activity. Sci. Adv. 2016, 2, e1500779. [Google Scholar] [CrossRef] [PubMed]
  30. Cai, J.; Huang, B.; Song, Y. Using multi-source geospatial big data to identify the structure of polycentric cities. Remote Sens. Environ. 2017, 24, 906–917. [Google Scholar] [CrossRef]
  31. Wang, Y.; Wang, T.; Tsou, M.H.; Li, H.; Jiang, W.; Gao, F. Mapping Dynamic Urban Land Use Patterns with Crowdsourced Geo-Tagged Social Media (Sina-Weibo) and Commercial Points of Interest Collections in Beijing, China. Sustainability 2016, 8, 1202. [Google Scholar] [CrossRef]
  32. Laylavi, F.; Rajabifard, A.; Kalantari, M.A. Multi-Element Approach to Location Inference of Twitter: A Case for Emergency Response. ISPRS Int. J. Geo-Inf 2016, 5, 56. [Google Scholar] [CrossRef]
  33. Wang, Y.; Fu, X.; Jiang, W.; Wang, T.; Tsou, M.H.; Ye, X. Inferring urban air quality based on social media. Comput. Environ. Urban Syst. 2017, 66, 110–116. [Google Scholar] [CrossRef]
  34. Rzeszewski, M.; Beluch, L. Spatial Characteristics of Twitter Users—Toward the Understanding of Geosocial Media Production. ISPRS Int. J. Geo-Inf. 2017, 6, 236. [Google Scholar] [CrossRef]
  35. Brunsdon, C.; Fotheringham, A.S.; Charlton, M.E. Geographically Weighted Regression: A Method for Exploring Spatial Nonstationarity. Geogr. Anal. 1996, 28, 281–298. [Google Scholar] [CrossRef]
  36. Fotheringham, A.S.; Charlton, M.; Brunsdon, C. The geography of parameter space: An investigation of spatial non-stationarity. Geogr. Inf. Syst. 1996, 10, 605–627. [Google Scholar] [CrossRef]
  37. Brunsdon, C.; Fotheringham, A.S.; Charlton, M. Some Notes on Parametric Significance Tests for Geographically Weighted Regression. J. Reg. Sci. 1999, 39, 497–524. [Google Scholar] [CrossRef]
  38. Fotheringham, A.S.; Charlton, M.E.; Brunsdon, C. Geographically weighted regression: A natural evolution of the expansion method for spatial data analysis. Environ. Plan. A 1998, 30, 1905–1927. [Google Scholar] [CrossRef]
  39. Nakanishi, M.; Cooper, L.G. Parameter Estimation for a Multiplicative Competitive Interaction Model: Least Squares Approach. J. Mark. Res. 1974, 11, 303–311. [Google Scholar]
  40. Loader, C.R. Bandwidth Selection: Classical or Plug-In? Ann. Stat. 1999, 27, 415–438. [Google Scholar] [CrossRef]
  41. Akaike, H. Information theory and an extension of the maximum likelihood principle. In Proceedings of the 2nd International symposium on information theory, Tsahkadsor, Armenian SSR, 2–8 September 1971; pp. 267–281. [Google Scholar]
  42. Hurvich, C.M.; Simonoff, J.S.; Tsai, C. Smoothing parameter selection in nonparametric regression using an improved Akaike information criterion. J. R. Stat. Soc. Ser. B Stat. Methodol. 2010, 60, 271–293. [Google Scholar] [CrossRef]
  43. Lu, B.; Charlton, M.; Harris, P.; Fotheringham, A.S. Geographically weighted regression with a non-Euclidean distance metric: a case study using hedonic house price data. Int. J. Geogr. Inf. Sci. 2014, 28, 660–681. [Google Scholar] [CrossRef]
  44. Wheeler, D.C. Diagnostic Tools and A Remedial Method for Collinearity in Geographically Weighted Regression. Environ. Plan. A 2007, 39, 2464–2481. [Google Scholar] [CrossRef]
  45. Belsley, D.A.; Kuh, E.; Welsch, R.E. Regression Diagnostics—Identifying Influential Data and Sources of Collinearity. J. Oper. Res. Soc. 1981, 32, 157–158. [Google Scholar]
  46. Adnan, M.; Leak, A.; Longley, P. A geocomputational analysis of Twitter activity around different world cities. Geo-Spat. Inf. Sci. 2014, 17, 145–152. [Google Scholar] [CrossRef]
  47. Puntanen, S.; Styan, G.P.H. The Equality of the Ordinary Least Squares Estimator and the Best Linear Unbiased Estimator. Am. Stat. 1989, 43, 153–161. [Google Scholar]
Figure 1. Study area and the distribution of the retail agglomerations.
Ijgi 08 00202 g001
Figure 2. Framework for using social media data to solve competitive location problems.
Ijgi 08 00202 g002
Figure 3. Feasible areas for a new retail agglomeration in the study area.
Ijgi 08 00202 g003
Figure 4. Spatial distribution of local sensitive parameters of business area.
Ijgi 08 00202 g004
Figure 5. Spatial distribution of local sensitive parameters of distance.
Ijgi 08 00202 g005
Table 1. Sina Weibo data samples.
IDCreated_atTextUser_IDGeoRetweet_StatusPOI_IDPOI_TitleSource
xx2014-02-06 09:45:53#孕期运动##辣妈健身##孕期瑜伽##【享孕无忧】
(#pregnancy exercises##hot mum fitness## pregnancy yoga#【safe pregnancy program】)
xx116.70063;
39.91037
0NullNullPP时光机
(PP time machine)
xx2014-04-19 11:27:51如果你是单身狗,千万不要点开!
(If you are single, do not click this Sina Weibo!)
xx116.657333;
39.9077
0xx通州新城
(Tongzhou new town)
未通过审核的应用
(unapproved application)
xx2014-09-01 18:28:14在北京王府井这里,感觉也没什么好玩的,一条商业街而已。
(In Wangfujing, I find nothing interesting. There is just a commercial street.)
xx116.342531;
39.73123
0xx王府井百货
(Wangfujing department store)
MI 3
xx2015-01-04 16:12:47这个点在西单大悦城,和朋友一起吃下午茶。
(Have afternoon tea with friends at Xidan Joy City.)
xx116.37326;
39.91082
0xx西单大悦城
(Xidan Joy City)
iPhone 5
Table 2. Detail information about the changes of the dataset.
Geotagged MicroblogsUsers
Original dataset16,682,3302,428,946
After filtering out noises16,669,2582,428,294
After filtering out outliers16,664,0732,428,294
Table 3. Evaluation results of global and local sensitive parameters.
Local Sensitive ParameterGlobal Sensitive Parameter
Min αi−0.19
Mean αi1.040.97
Max αi2.27
% sig par. for αi21.61
Min λi−2.68
Mean λi−1.16−1.04
Max λi0.18
% sig par. for λi90.42
AICc4761.907039.26
R20.730.51
Bandwidth118
Table 4. Global and local captures for different feasible locations.
Feasible Location40,000 m260,000 m280,000 m2
Global CaptureLocal CaptureGlobal CaptureLocal CaptureGlobal CaptureLocal Capture
A2141.942059.882989.502820.123748.453727.14
B1872.522101.762648.232905.033352.153642.59
C1482.111770.392127.682463.272719.403103.61

