Article

Exploring the Influence of Biological Traits and Environmental Drivers on Water Use Variations across Contrasting Forests

1
School of Biological Sciences, The University of Auckland, Private Bag 92019, Auckland 1142, New Zealand
2
Guangdong Provincial Key Laboratory of Applied Botany, South China Botanical Garden, Chinese Academy of Sciences, Guangzhou 510650, China
3
Key Laboratory of Vegetation Restoration and Management of Degraded Ecosystems, South China Botanical Garden, Chinese Academy of Sciences, Guangzhou 510650, China
4
Te Pūnaha Matatini, The University of Auckland, Private Bag 92019, Auckland 1142, New Zealand
*
Author to whom correspondence should be addressed.
Forests 2021, 12(2), 161; https://doi.org/10.3390/f12020161
Submission received: 9 December 2020 / Revised: 18 January 2021 / Accepted: 28 January 2021 / Published: 29 January 2021
(This article belongs to the Section Forest Ecophysiology and Biology)

Abstract

:
Understanding species-specific water use patterns across contrasting sites and how sensitivity of responses to environmental variables changes for different species is critical for evaluating potential forest dynamics and land use changes under global change. To quantify water use patterns and the sensitivity of tree transpiration to environmental drivers among sites and species, sap flow and meteorological data sets from three contrasting climatic zones were combined and compared in this analysis. Agathis australis from NZHP site, Schima wallichii Choisy (native) and Acacia mangium Willd (exotic) from CHS site, Liquidamber formosana Hance, Quercus variabilis Blume and Quercus acutissima Carruth from CJGS site were the dominant trees chosen as our study species. Biological traits were collected to explain the underlying physiological mechanisms for water use variation. Results showed that the strongest environmental drivers of sap flow were photosynthetically active radiation (PAR), vapor pressure deficit (VPD) and temperature across sites, indicating that the response of water use to abiotic drivers converged across sites. Water use magnitude was site specific, which was controlled by site characteristics, species composition and local weather conditions. The species with higher sap flow density (Fd) generally had greater stomatal conductance. Native deciduous broadleaved species had a higher Fd and faster response to stomatal regulation than that of native evergreen broadleaved species (S. wallichii) and conifer species A. australis. The analysis also showed that exotic species (A. mangium) consumed more water than native species (S. wallichii). Trees with diffuse porous and lower wood density had relatively higher Fd for angiosperms, suggesting that water use was regulated by physiological differences. Water use characteristics across sites are controlled by both external factors such as site-specific characteristics (local environmental conditions and species composition) and internal factors such as biological traits (xylem anatomy, root biomass and leaf area), which highlights the complexity of quantifying land water budgets for areas covered by different species.

1. Introduction

Transpiration, the process of water movement through a plant and release from the canopy is the most important component of evapotranspiration [1], integrating physical and biological processes within the energy, water and carbon cycles of ecosystems [2,3]. There are two main categories of factors that influence transpiration: environmental drivers and biological factors [4]. At landscape and regional scales, forest transpiration depends on a number of site-specific characteristics that are related to the physical properties of geology, soil type, vegetation and ambient meteorological conditions because of their influence on water and energy availability [5,6]. The primary environmental drivers for forest evapotranspiration are solar radiation, vapor pressure deficit and soil moisture [6,7]. The sensitivity of evapotranspiration to these abiotic drivers varies depending on the physiology of different plant species and site characteristics [6,8,9].
Rising atmospheric concentration of CO2 enhances photosynthesis, but elevated CO2 also causes rising temperatures, and other climatic changes such as significant drought, causing worldwide forests mortality with atmospheric shifts continuing in the future [10]. Changes in vegetation cover on the land surface and climate change can influence water and carbon cycles at regional and global scales [11,12]. Under similar environmental conditions, various species show different water use patterns because of distinguishing adaptations to water availability. For example, Catovsky et al. [13] found that deciduous broadleaved species had more than two-fold greater annual water use compared with temperate evergreen conifers, while the reduction rate of sap flow was lower in some conifers under drought stress [14]. In a common environment, tropical evergreen forests have larger daily water consumption and have more sensitive crown conductance responses to VPD than deciduous species in southwestern China [15]. In contrast, Kaplick et al. [16] found that gymnosperms displayed convergent behaviors in diurnal gas exchange and water use efficiency in a southern temperate forest. A global analysis of sap flow patterns in sites across the world is exploring large-scale patterns in water use, but comparisons of contrasting sites with different forest functional types can also help us understand the relative importance of environmental and biological controls of water use patterns [17].
Species-specific water use behavior depends on biological properties such as wood anatomy, tree size, root depth and stomatal regulation [18,19,20,21]. Wood density directly influences stem composition (xylem density and xylem vessel size), which affects both stem strength and hydraulic conductivity, as well as its resistance to stem cavitation [22,23]. For example, trees with lower wood density typically have greater xylem vessel area and size that could explain higher stem sap flow [24,25]. Many studies show that contrasting stem anatomy (ring-and diffuse-porous species) results in different biomass growth and water use patterns seasonally and annually [9,26,27]. Stomatal regulation (isohydric/anisohydric behavior) and sensitivity of stomata to environmental factors influence plant water status and reflects plant water use strategy [28,29,30]. Isohydric species maintain relatively consistent leaf water potential by limiting gas exchange, while anisohydric species have decreased leaf water potentials because of sustained high stomatal conductance [31,32]. As Feng et al. [33] showed, biological responses often interplay with environmental conditions but understanding the relative importance of these different factors will help us predict climate change impacts and define the capacity for plants to adapt to changing conditions.
Quantifying water use patterns of different vegetation types with respect to climatic elements, will improve predictions of vegetation responses to future climate and the resulting influence on forest water cycle. Such research is key for management of water resources. In order to explain plant water use variation measured as sap flow density and stand transpiration across multiple sites and species, in the present study, we collated sap flow measurement data over approximately two year periods. In this international collaboration, our research sites with different species composition, forest management and environmental conditions were chosen as an opportunity to study the biological, abiotic drivers and site-specific impacts on plant water use patterns. Our objectives were to (1) compare differences in sap flow density among study species, (2) determine how these tree species vary in water use at daily and seasonal time scales in response to environmental drivers and examine the most important environmental drivers across sites and species and (3) explore biological traits and structural factors to explain the observed transpiration differences in the co-occurring tree species.

2. Materials and Methods

2.1. Research Sites

Data were collected from four research sites: three in China and the fourth in New Zealand. All meteorological data including air temperature (°C), relative humidity (RH %), wind speed (m/s), photosynthetically active radiation (PAR µmol m−2 s−1) and rainfall (mm) were collected from meteorological stations near each research site throughout the respective sample periods. Locations, study period and climate information for each site are summarized in Table 1.
Biological traits and hydraulic data including wood density (WD), leaf nitrogen content (N) and carbon content (C), leaf stomatal conductance (gs), leaf carbon isotope ratio (δ13C), photosynthetic rate (A), xylem water potential at 50% loss of hydraulic conductance (P50), minimum leaf water potential (Ψmin), specific leaf area (SLA) and the maximum leaf area index (LAI) for each species were collected for this work. Some of these data are indicated by previous research at the same or nearby research sites and some are indicated by our own results. All the data were shown in Table 2. Data sources and references were shown in Supplementary Materials Table S1.
New Zealand-Huapai temperate conifer forest (NZHP): The University of Auckland Huapai Scientific Reserve in the Waitakere Range is approximately 25 km west of central Auckland, New Zealand. The 15 ha research site is dominated by A.australis, which accounts for 80% of the stand basal area (94m2 ha−1) [34]. Phyllocladus trichomanoides, Podaocarpus totara and Knightia excelsa contribute 6%, 4% and 2% of the basal area, respectively [16]. Silver ferns (Cyathea dealbata), Geniostoma rupestre, Hedycarya arborea and Coprosma spp. are highly abundant in the understory. This site is characterized by a warm temperate climate, with a winter dominant rainfall [7]. NZHP annual weather data in Table 1 are based on the report during 1981–2010 [35]. Soils are brown granular clays, which is sticky when wet and hard and fragile when dry [36]. Six sample trees were selected for this site, and tree size ranged from 21 to 178 cm DBH with the tree height from 20 to 25 m, covering the range of trees found at the site.
China-Heshan subtropical evergreen broadleaved forest (CHS): This research site is located in the Heshan National Field Research Station in Guangdong Province, South China. The region is a typical south subtropical monsoonal climate, with the wet season occurring from April to September and the dry season from October to March. Annual weather in Table 1 were the mean values during 1985–2014 [20]. The soil is laterite that has been significantly eroded because of a lack of forest coverage and the forest is a nitrogen and phosphorus limited ecosystem [20]. This research site is a secondary forest under the earlier restoration campaign. Two mono-species plantations of S. wallichii (native) and A. mangium (exotic) of about 30 years old were used in the experiment. The main understory shrub species includes Ilex asprella, Clerodendron fortunatum. Psychotria rubra. The main herbaceous layer includes Adiantum flabellutatum, Dicranoperis dichorama, Blechum orientale. These two stands are located close to each other with similar soil properties [37] and share one weather station. The abbreviations CHSS (China-Heshan S. wallichii plantation) and CHSA (China-Heshan A. mangium plantation) were used for these two stands. Fifteen sample trees of each stand were selected. Their DBH ranged from 13 to 32 cm with the tree height from 10 to 17 m for S. wallichill species, and tree size spans from 16 to 39 cm with the tree height from 9 to 18 m for A.mangium species, respectively.
China-Jigongshan temperate mixed deciduous forest (CJGS): This research site is located in the National Nature Reserve in Henan Province, Central China, which is within a transitional zone from a warm temperature to subtropical climate [38]. CJGS annual weather for the last 60 years [38] was shown in Table 1. The forest is about 45 years old with three dominant species, L. formosana, Q. variabilis and Q. acutissima [39,40], accounting for 28.6%, 20.0% and 19.1% of the stand basal area respectively. Lindera glauca, Vernicia fordii and Acer buergerianum seedlings are the main undergrowth shrub layer species. Stand LAI during the growing season (April to October) ranged from 2.6 to 3.4m2 m−2. The soil type is yellow-brown sandy loam with an organic matter content of 2.1% [38]. This research site is a nitrogen manipulation experiment site [38] but we only used data from control blocks (without N addition). Tree size of L. formosana, Q. acutissima and Q. variabilis species ranged from 8 to 36 cm, 24 to 53 cm and 33 to 54 cm DBH, with their tree height of 10 to 22 m, 18 to 31 m and 17 to 28 m respectively.

2.2. Sap Flow Measurements and Scaling to Stand Water Use

At all sites, Granier-type sap flow sensors [7,9,37] were installed on sample trees at breast height on the northern side of the stem to measure sap flow, and sap flux density (Fd, g/m2/s) was calculated over the study periods at each site (see Table 1) using the Granier equation as
Fd =   119 × ( Δ Tmax Δ T Δ T ) 1.231
where ΔT was the temperature difference between the heated and unheated probes and ΔTmax was the difference between the six-day rolling maximum T and each sap flow measurement.
Total daily water use of individual trees (Qt, g/d) was then calculated by multiplying Fd and sapwood area (As). The As of each tree in our sites was derived through the allometric equation (Table 3) based on the relationship between diameter at breast height (DBH cm) and sapwood area of 10 to 15 trees around each site [37,41,42,43]. Then the daily whole stand-scale transpiration (EC, mm/d) was estimated by summing Qt for all the trees in the plot and dividing by the plot area.
For NZHP research site, a modified Granier-type sap flow sensor [7] was used for sap flux measurements at a depth of 3.5 cm in the sapwood. The temperature difference between the upper and lower probes was measured and recorded with a data logger (CR10x, Campbell Scientific, Logan UT, USA) for 15 min averages. Because of the significant sap flow variation along the radial profile of A. australis [34], the following model based on sap flow density from different depths [42,43] was used to calculate whole tree water use:
Qt = ( 2.02 × Fd   × A 1 )   +   ( Fd   × A 2 )   + ( Fd   × ( Asw A 1 A 2 ) ) 2
where Fd is measured at 3.5 cm depth, A1 is sapwood area between the vascular cambium and 2.5 cm depth of sapwood, and A2 is sapwood area between 2.5cm and 4.5 cm depths.
For the other two sites, Granier type sap flow sensors were installed at a depth of 2 cm and the instantaneous temperature difference between the two probes was measured and recorded using a Delta-T logger (DL2e, Delta-T Devices, UK). The following model equation proposed by Pataki and others (2011) [46] was used to calculate radial variation of Fd with sapwood depths.
F i F 0 = 1.033 × exp [ 0.5 ( x 0.09963 0.4263 ) 2 ]
where Fi/Fo is the ratio of sap flow density at the depths of outermost (2 cm) and x is the relative sapwood depth.
Soil volumetric water content (VMC%) was measured at 10, 30 and 60 cm depth with water content reflectometers (CS616, Campbell Scientific) and recorded with a data logger (CR10x) as 30 min averages for the NZHP site [7]. For CHSS and CHSA sites, VMC was measured at 5, 10, 20, 30, 40, 50, 60, 90, 120 and 150 cm depths using soil moisture sensors (A755 GPRS, Adcon, Klosterneubury, Austria) and recorded with a data logger at 30 min intervals [37].

2.3. Data Analysis

Because our sites span the equator, sap flow seasonal pattern was identified based on local weather. Four seasons at NZHP site in the southern hemisphere are identified as spring (September—November), summer (December—February), autumn (March—May) and winter (June—August). Seasonal patterns in the northern hemisphere are identified as spring (March—May), summer (June—August), autumn (September—November) and winter (December—February) for the other three sites. Tukey’s post hoc test with one-way ANOVA was used for analysis of daily maximum sap flow density among species. We used two methods to explore the influence of environmental drivers on sap flow. First, Principle Component Analysis (PCA) was used to determine how environmental variables combine to drive daily sap flow and to explore which variables were the important factors among four research forest sites in three contrasting climatic zones during our research period [47]. Because there were no daily measurements of soil moisture for JGS research site, we were limited to using six daily environmental variables in the PCA models for JGS research site, while seven variables were used for the other research sites. PCA was conducted using the “prcomp” function in R (Version 4.0.2). The second analytical method we used was multiple linear regression for each stand with daily whole tree water use. This allowed us to determine the proportional influence of each environmental driver. Soil moisture at 10 cm depth was used for all the analysis.
An exponential saturation model Fd= a (1 − expbx)) was used to describe the relationship between daily sap flow and the two main drivers of sap flow, PAR and VPD [4] for each species. In the exponential saturation model, parameter a is the approximate maximum transpiration and parameter b is the sensitivity to environmental variables. The model was performed using “aomisc” package in R (Version 4.0.2).

3. Results

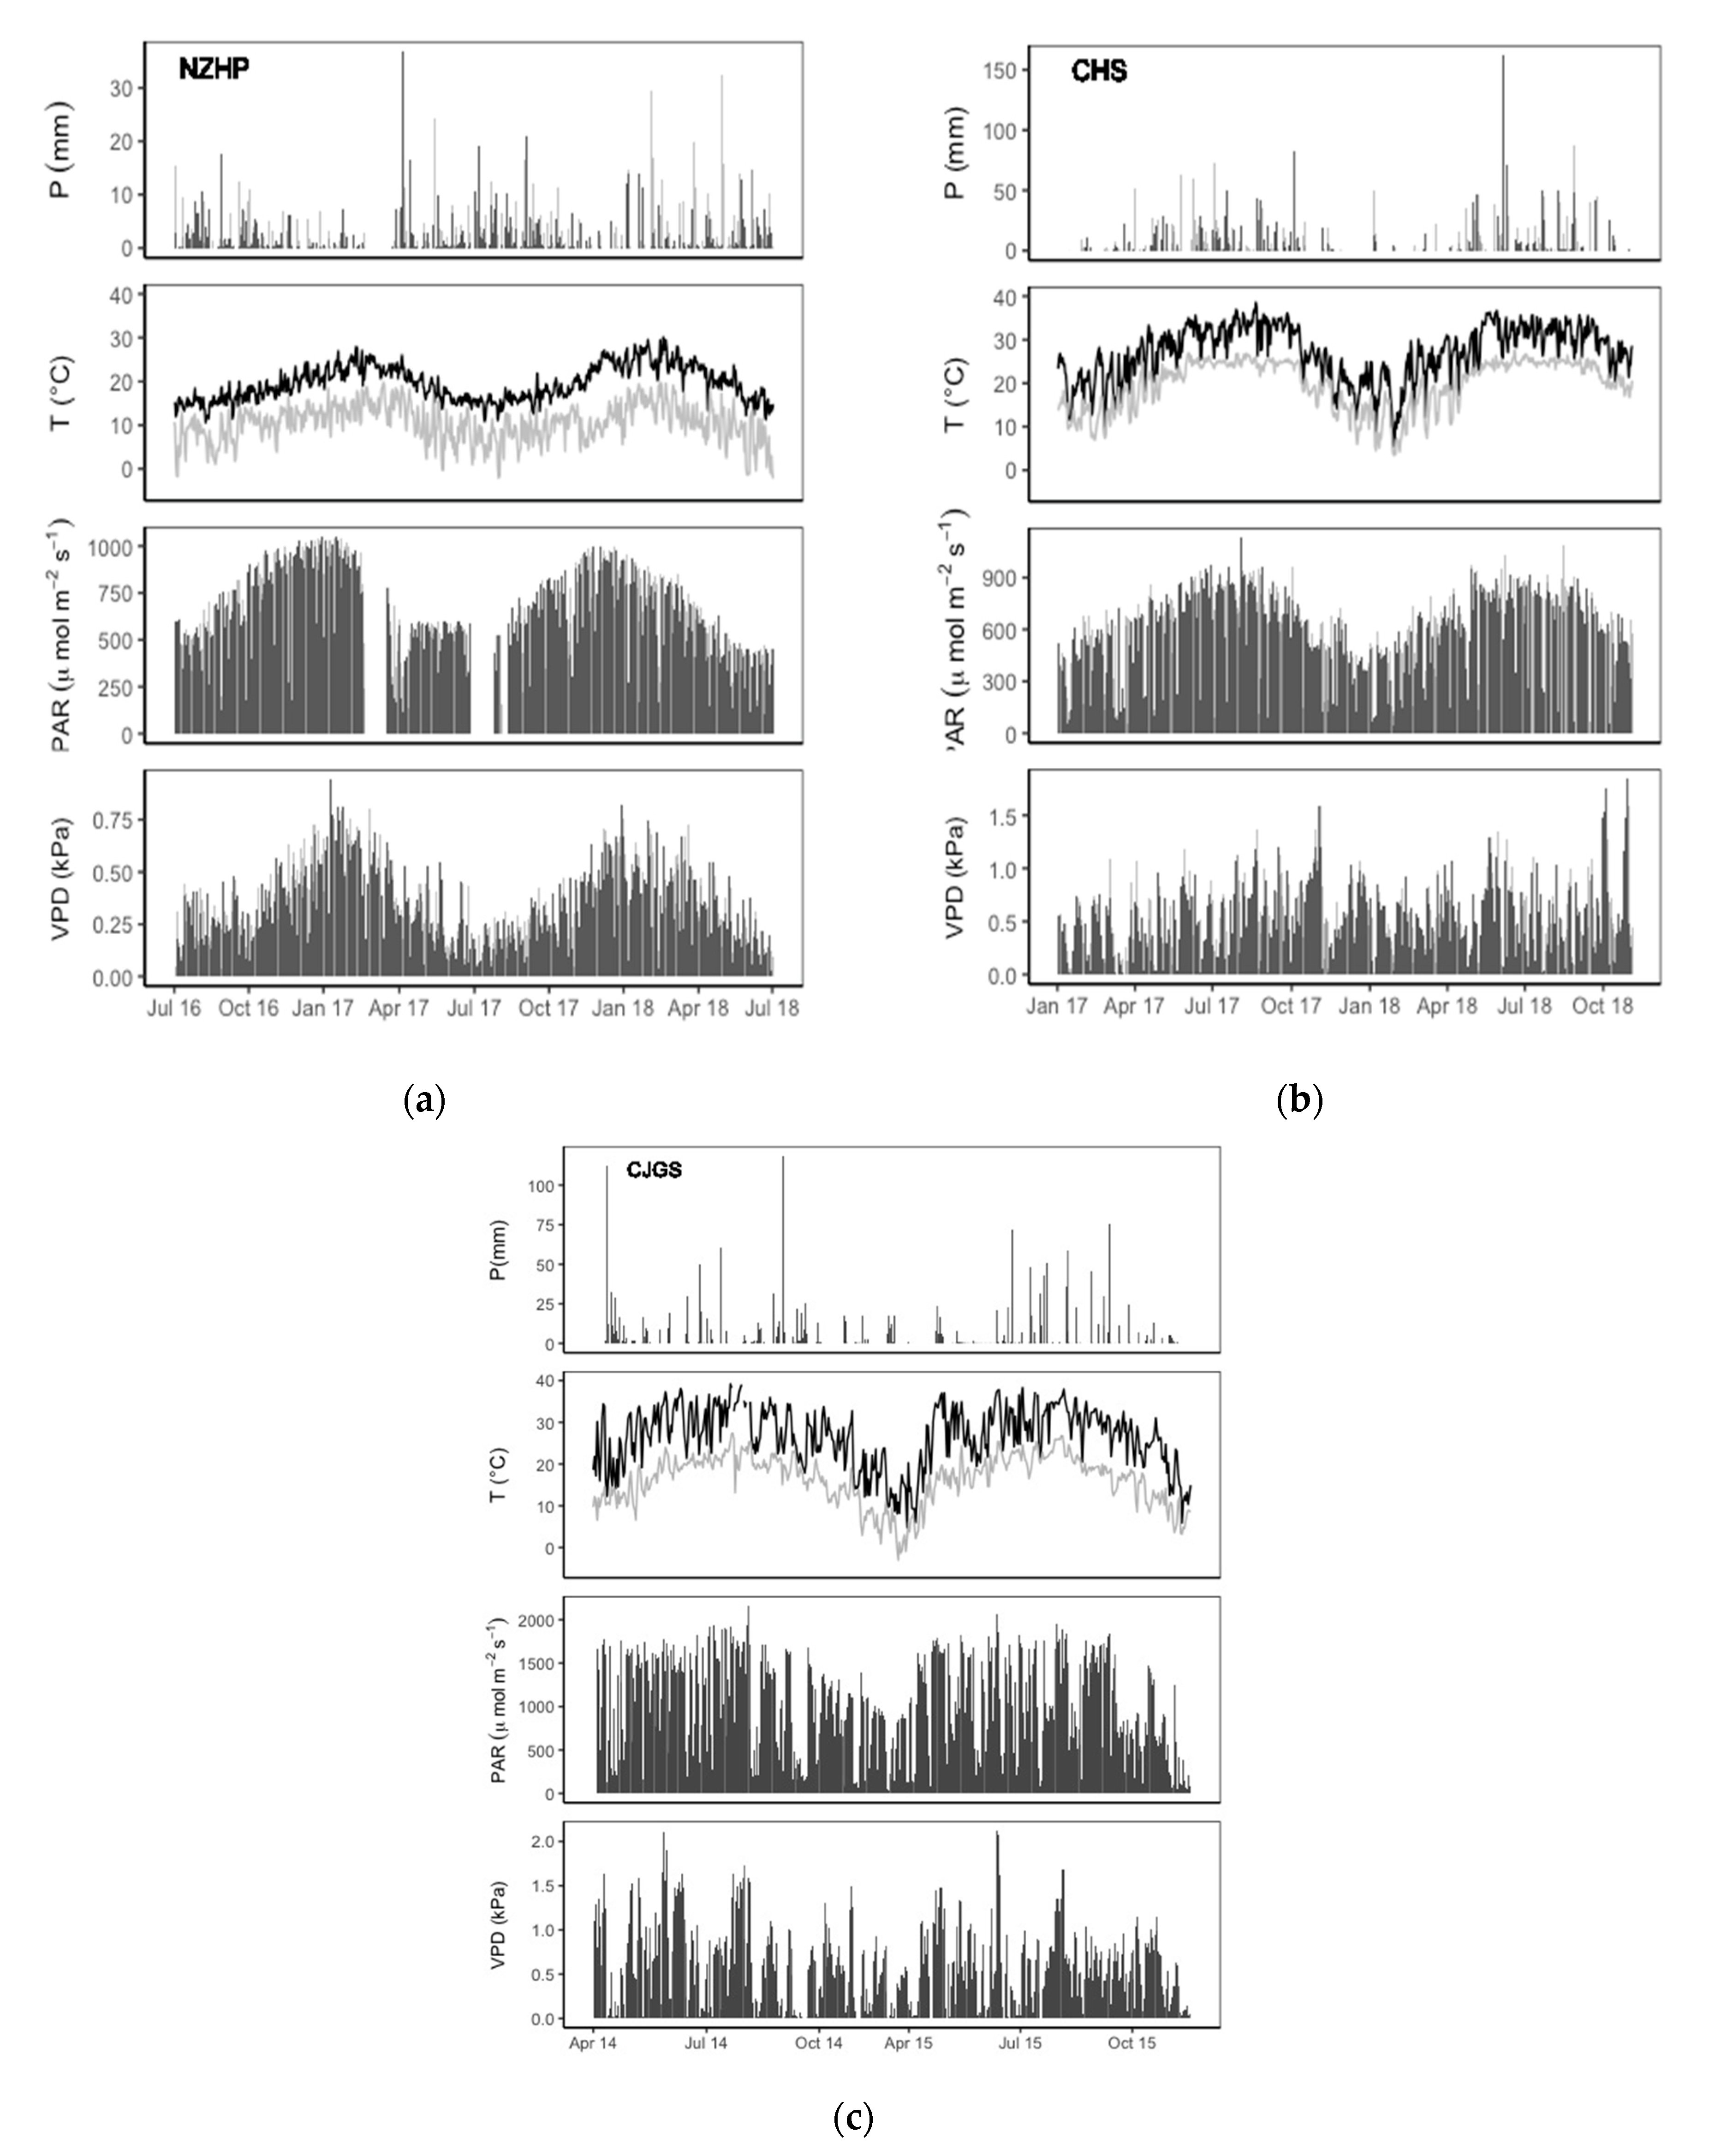
3.1. Environmental Conditions across Three Climatic Zones

The environmental conditions showed a clear seasonal trend for each research site (Figure 1). Total rainfall during the two years (24 months) were 3034.8 mm, 3458.9 and 2027.9 mm, for NZHP, CHS and CJGS respectively. Rainfall was mostly concentrated from April to September, accounting for about 63%–73%, 77%–87%, and 85%–86% of total annual precipitation for NZHP, CHS and CJGS. Seasonal patterns of temperature showed good agreement with rainfall patterns at CHS and CJGS and maximum precipitation in summer coincided with high air temperatures. These conditions provided high efficiency of forest water use. In contrast, wintertime (around July) had more consistent rainfall rather than summer and early autumn at NZHP. These misaligned rainfall and temperature patterns resulted in seasonally dry soil when the driving factors for tree transpiration were strong [7]. The temperature range was −2.2 to 30.1 °C with the mean temperature of 14.9 °C during the study period at NZHP. CHS temperature varied between 3.5 and 38.6 °C, with an average temperature of 22.2 °C over two years. The coldest recorded temperature was −3.1 °C and the maximum was 41.4 °C during the growing season from April to November at the CJGS site.

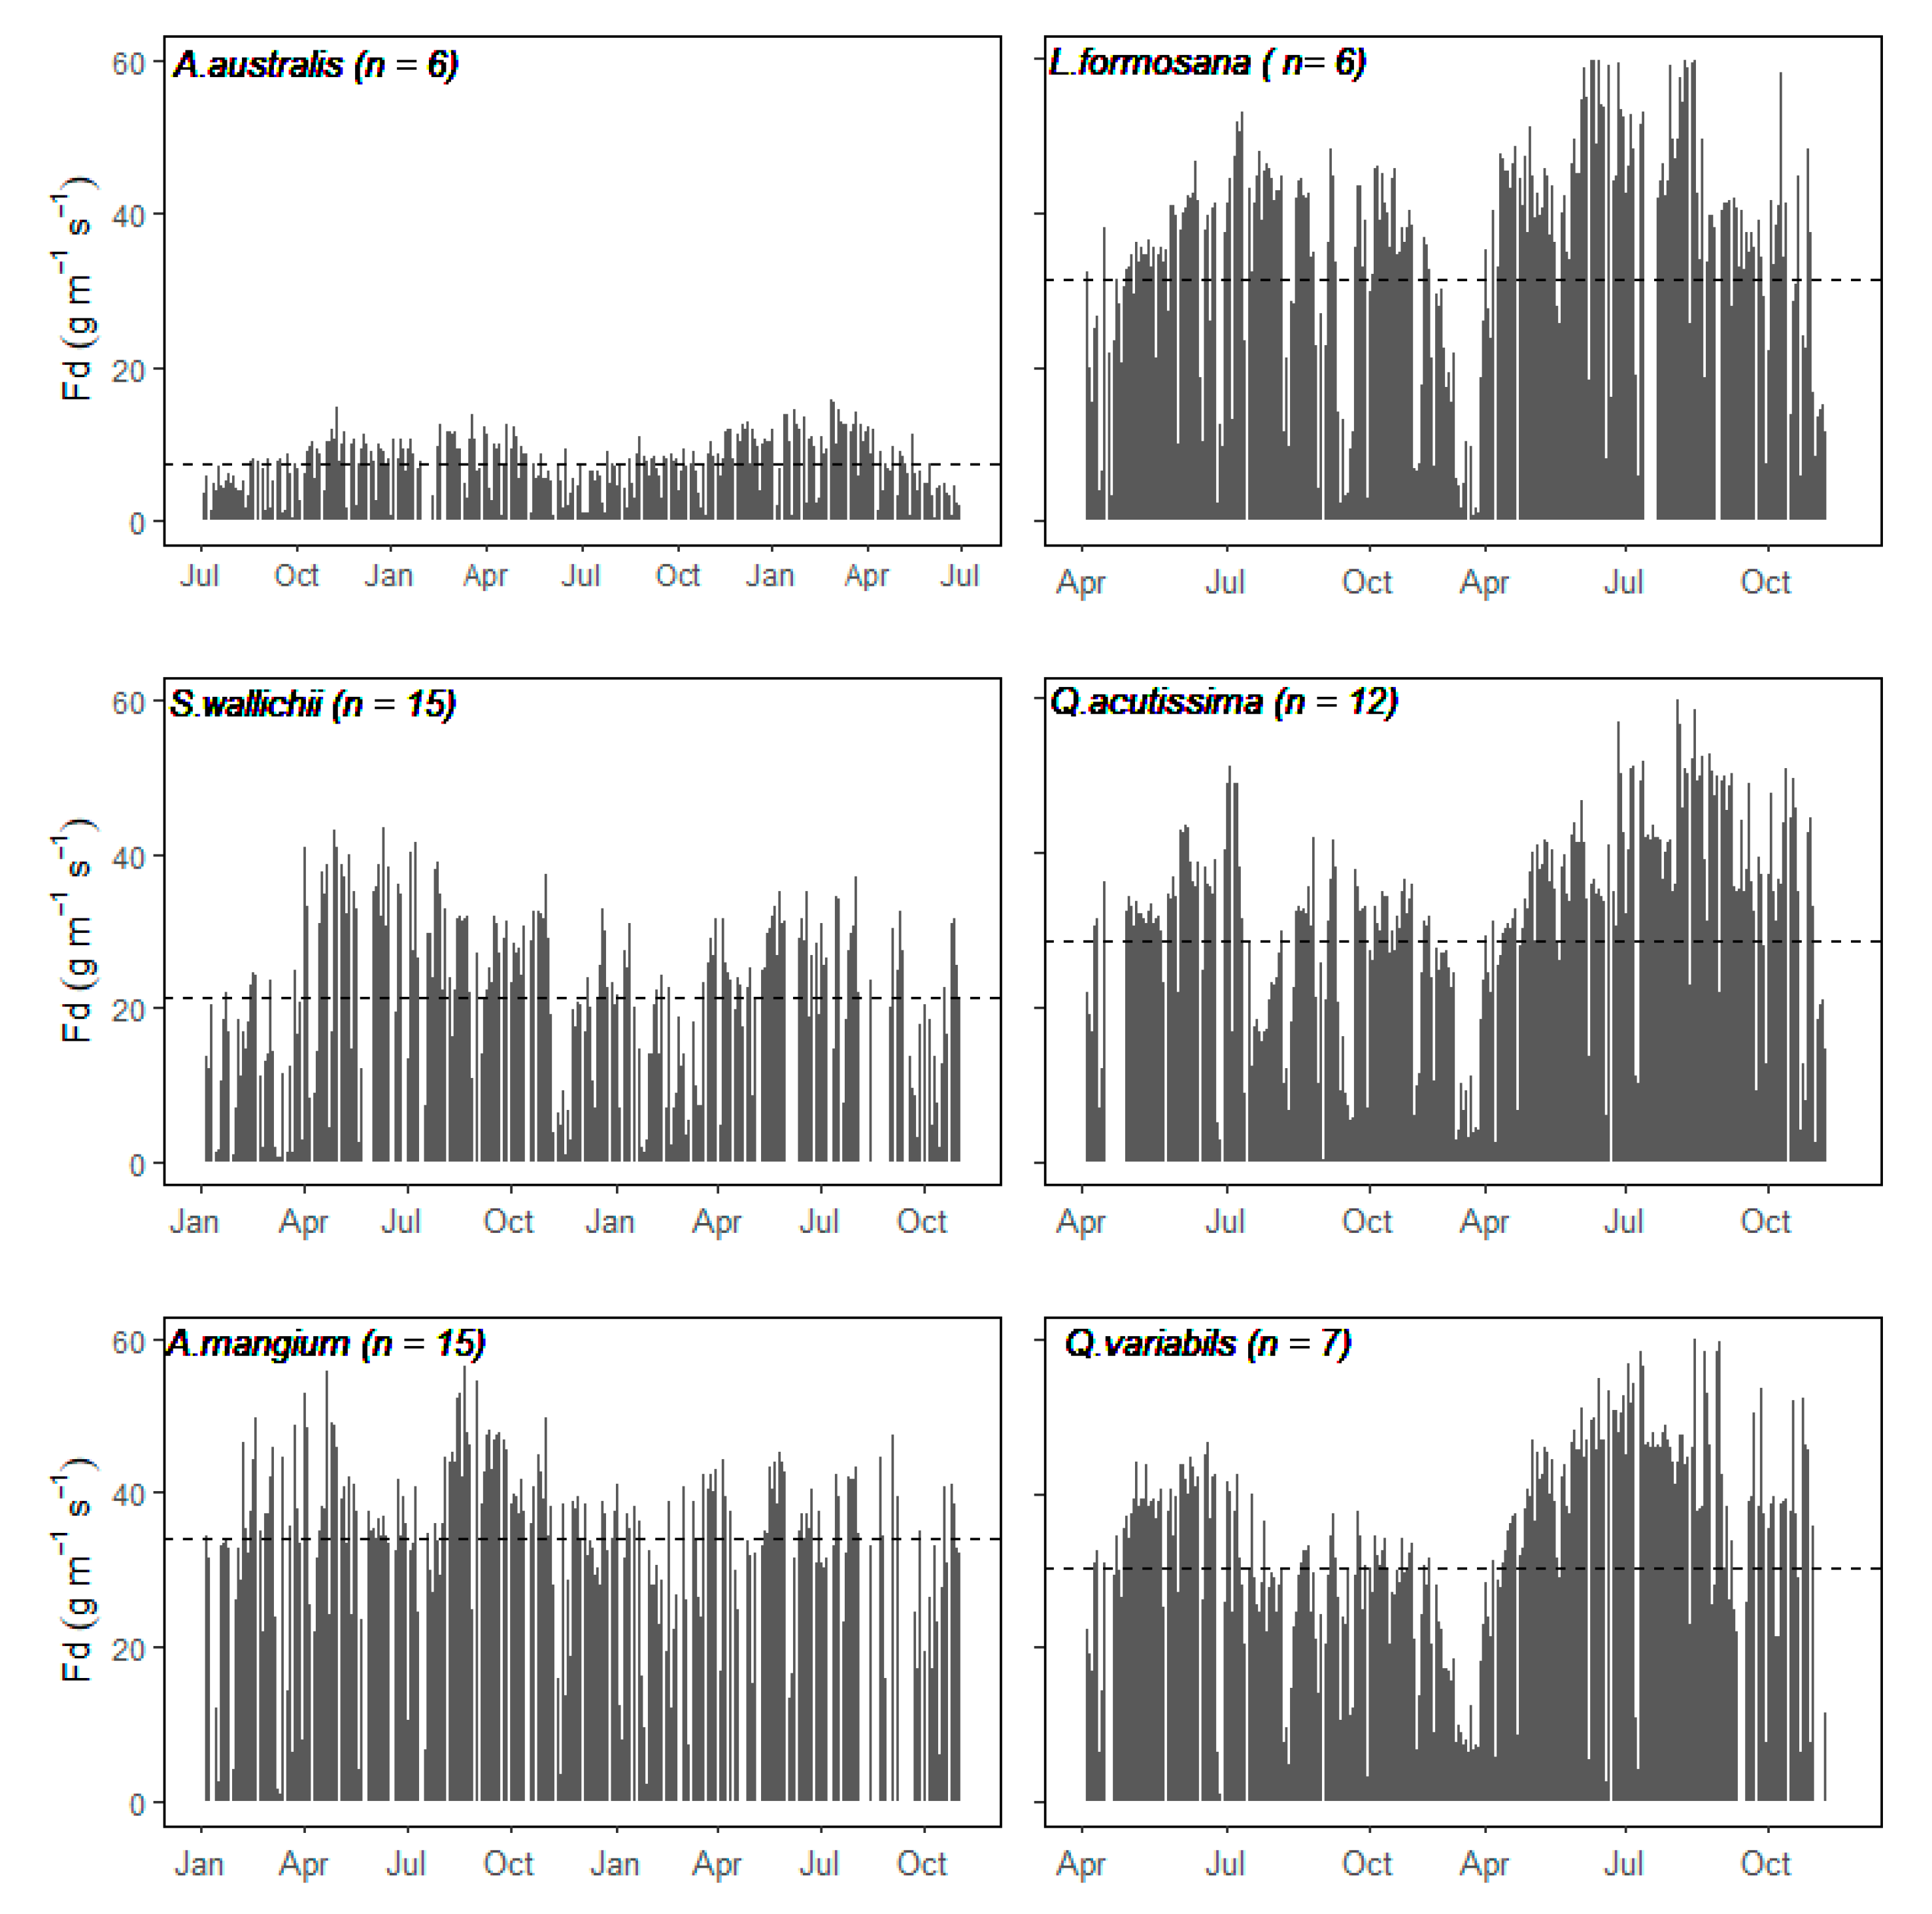
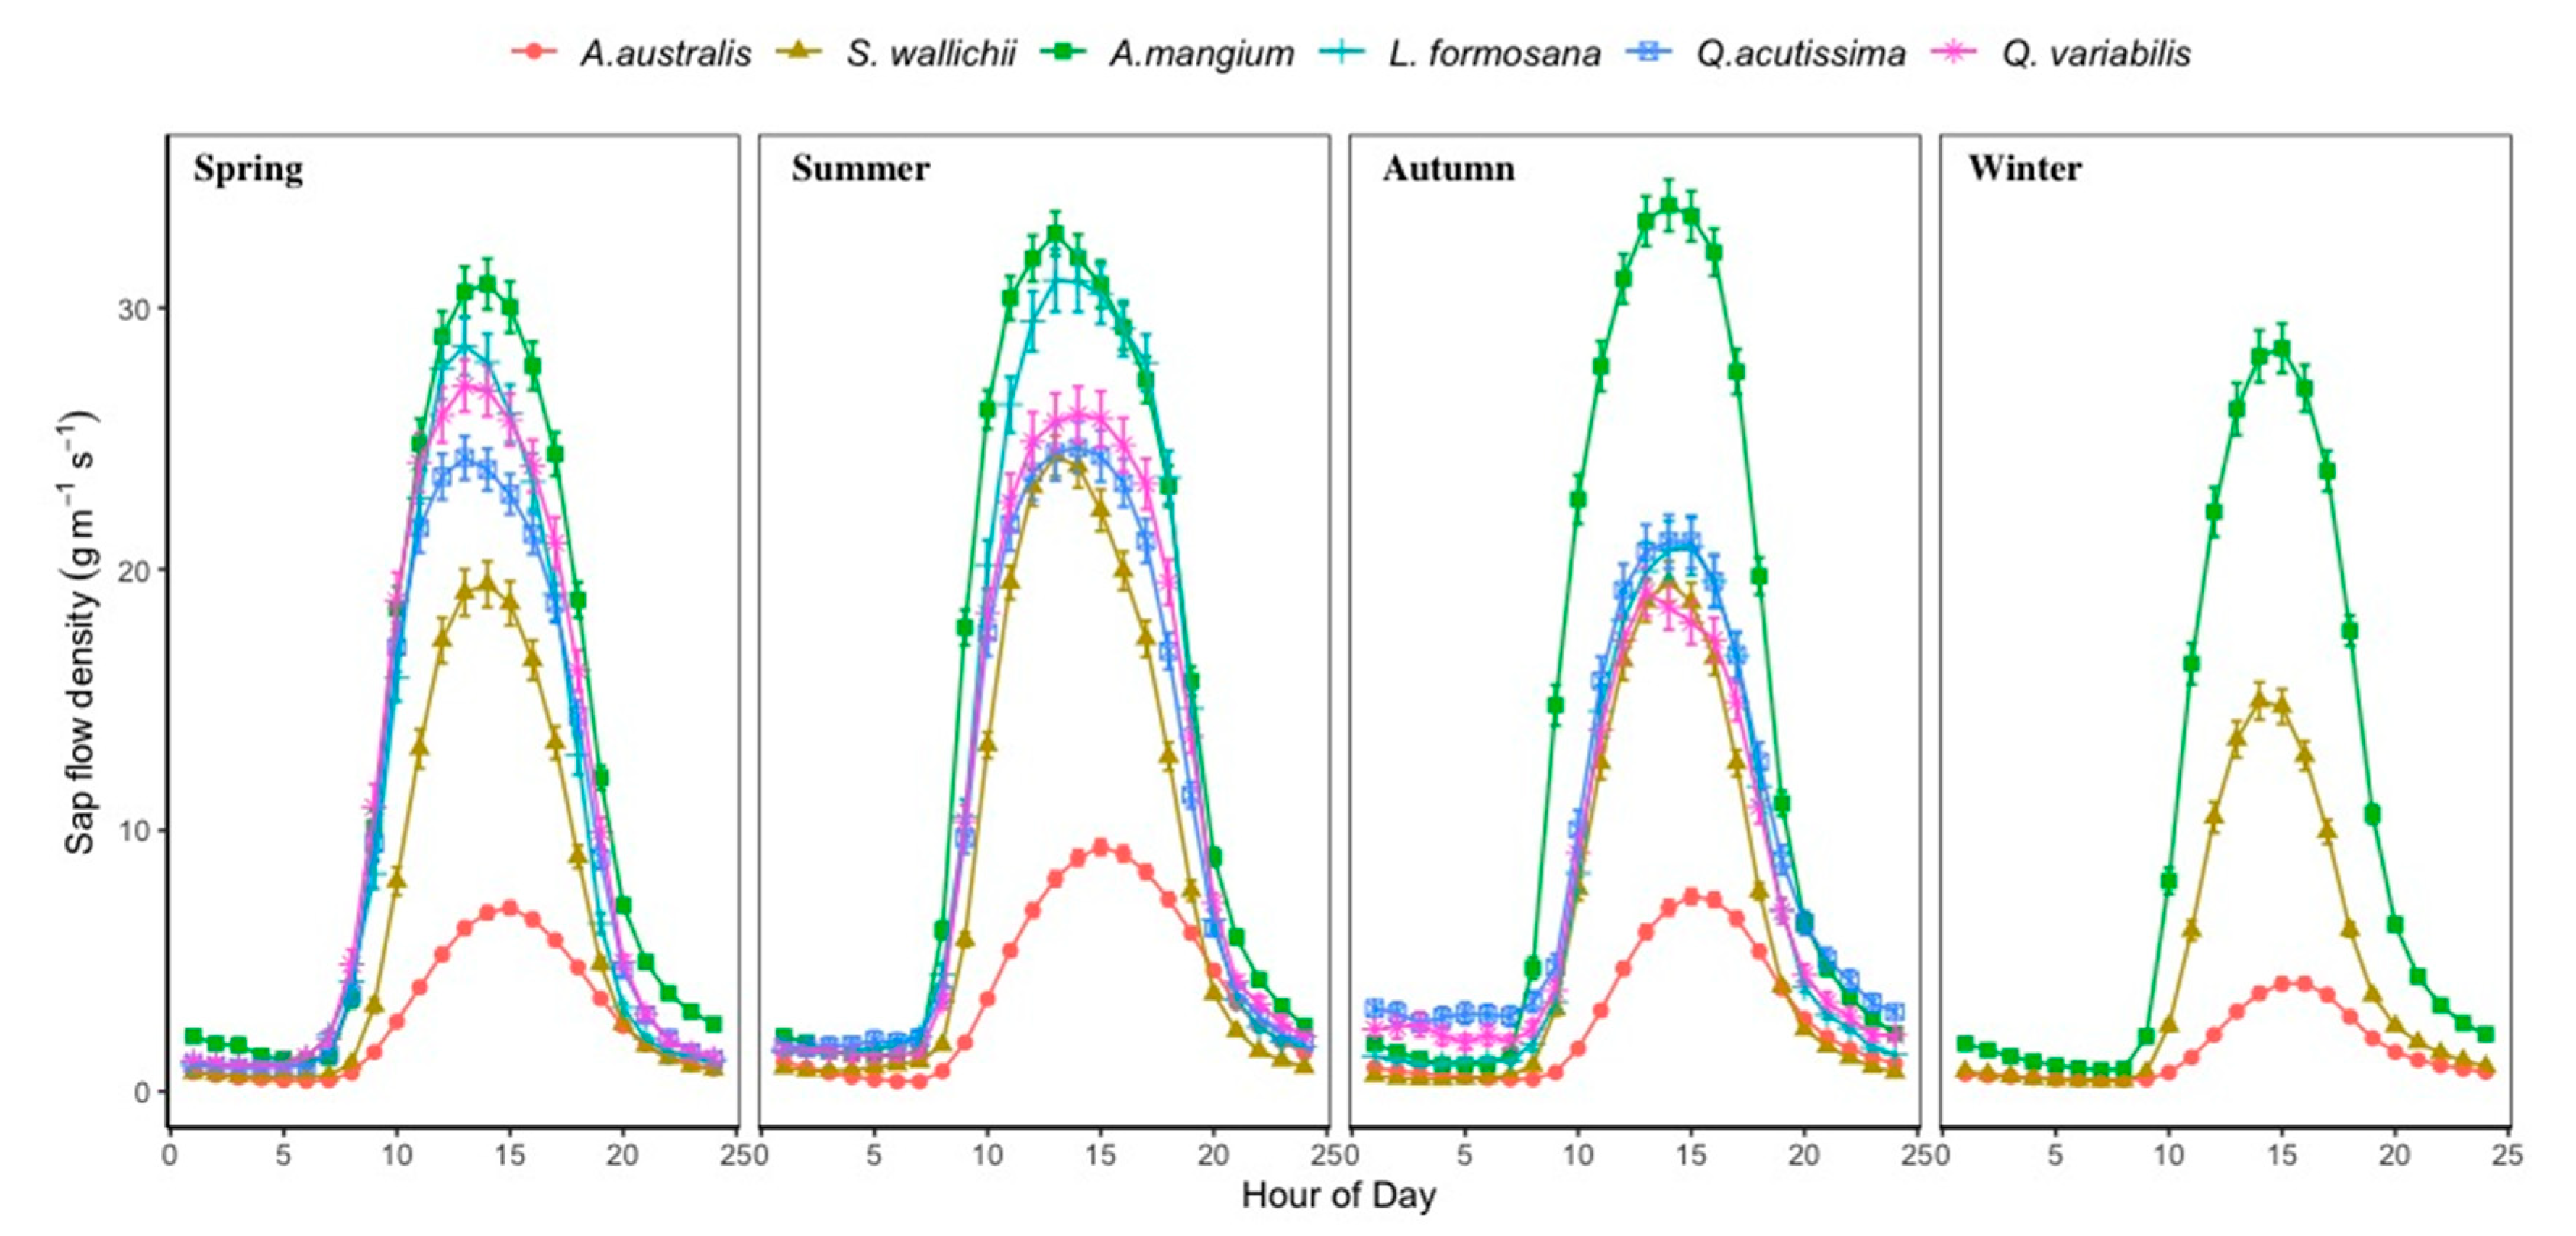
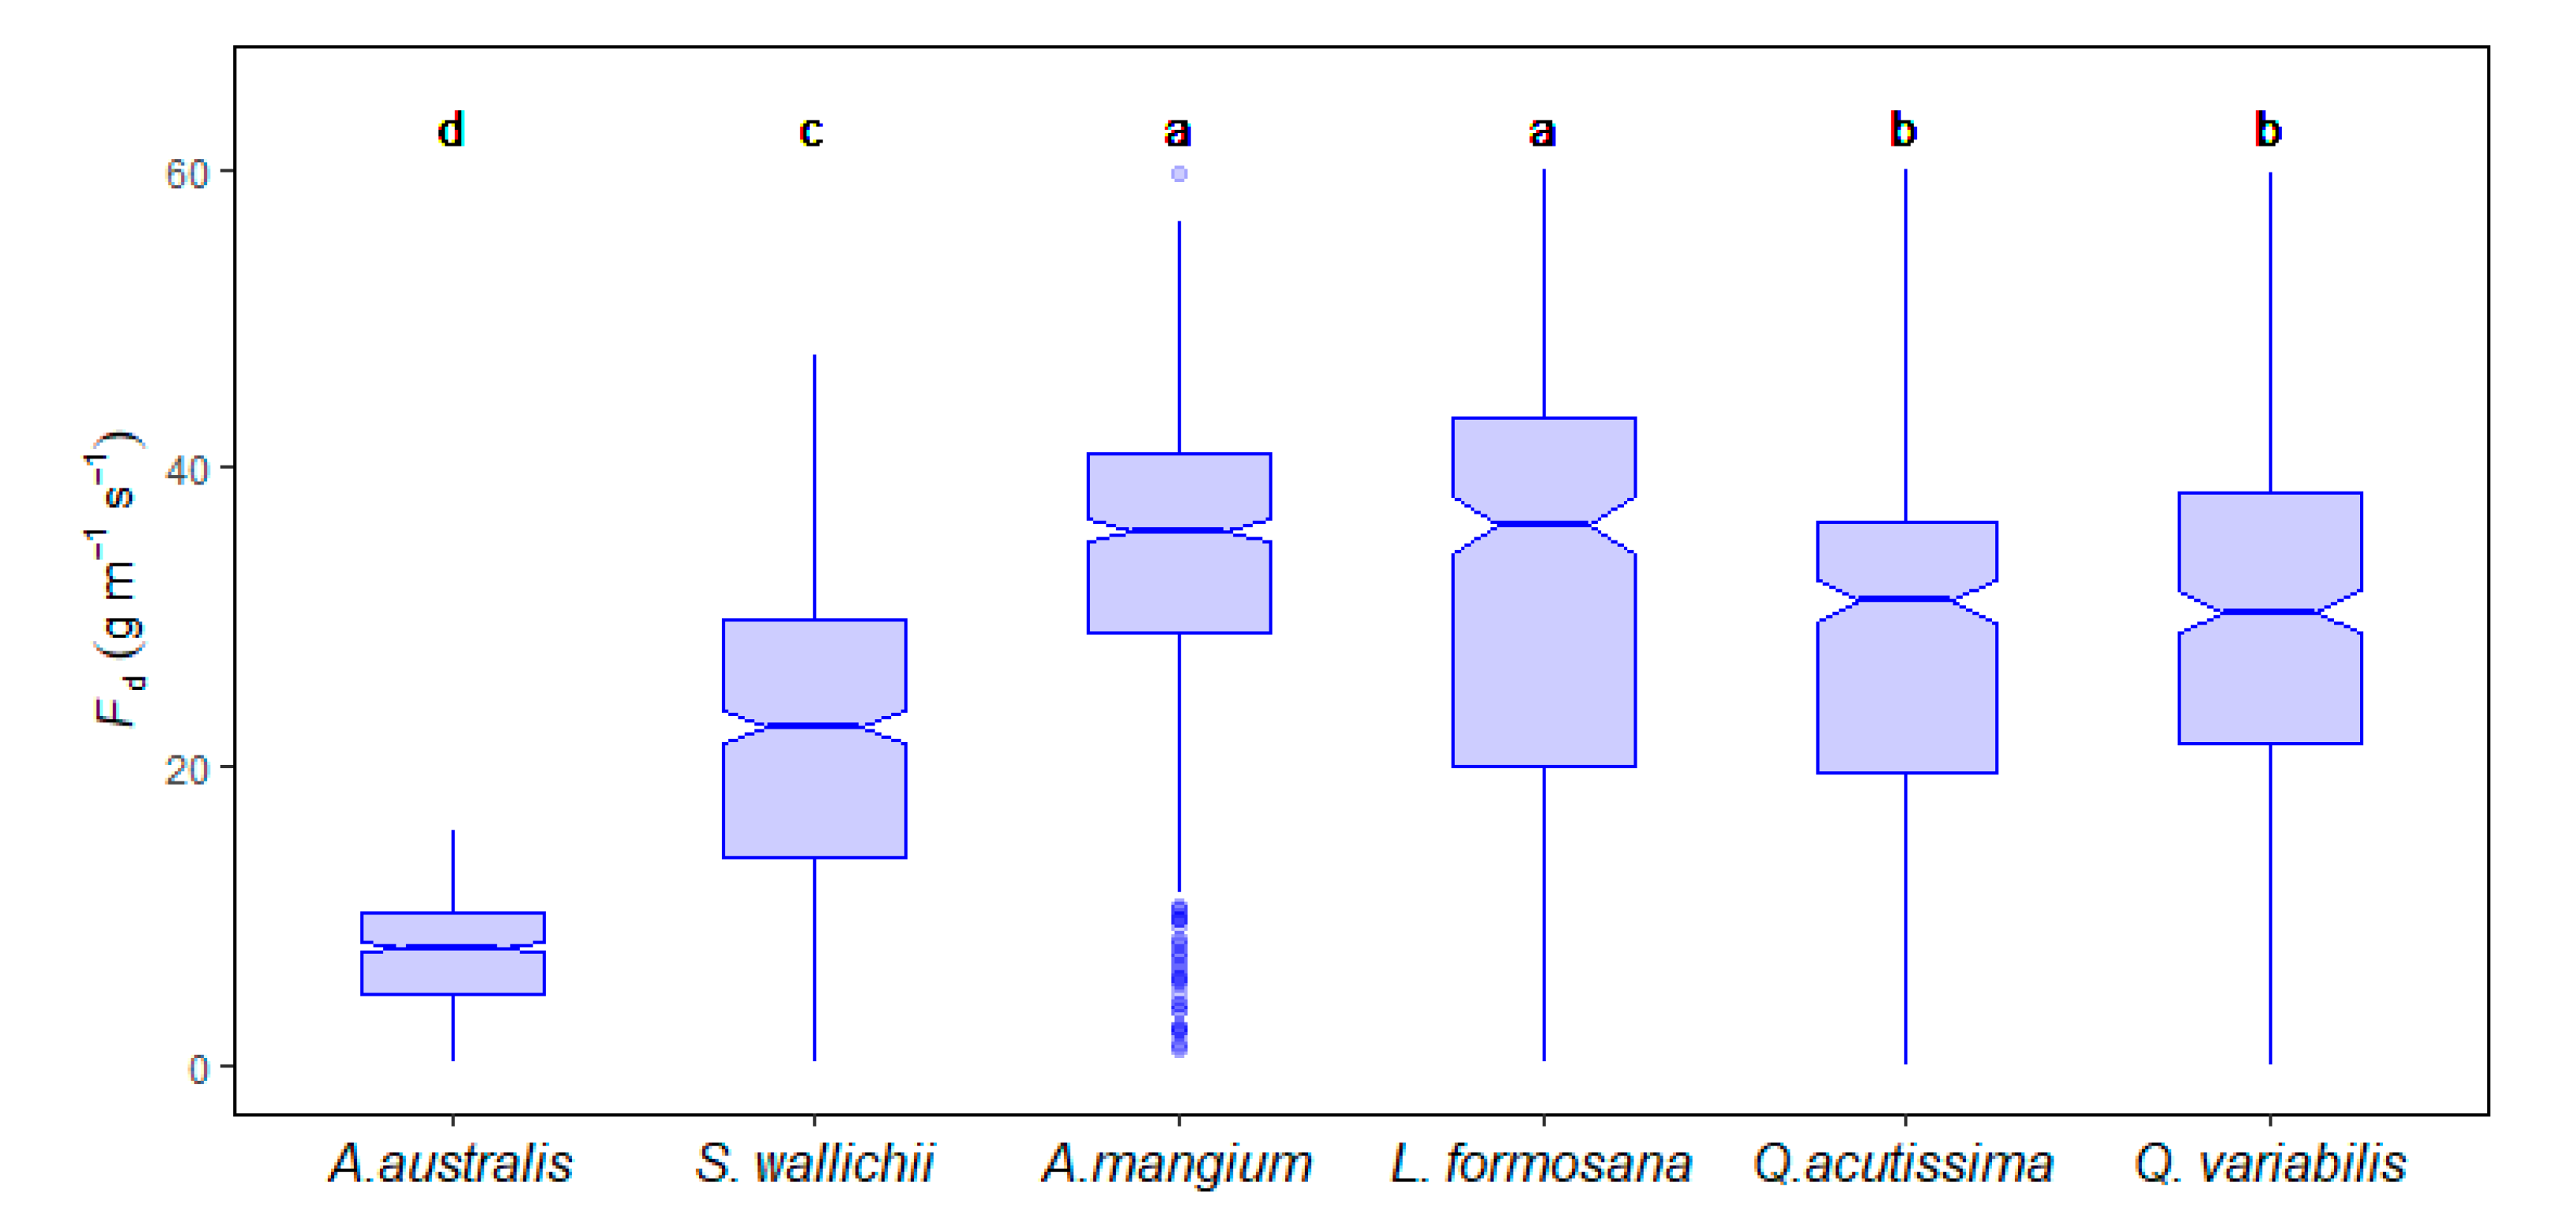
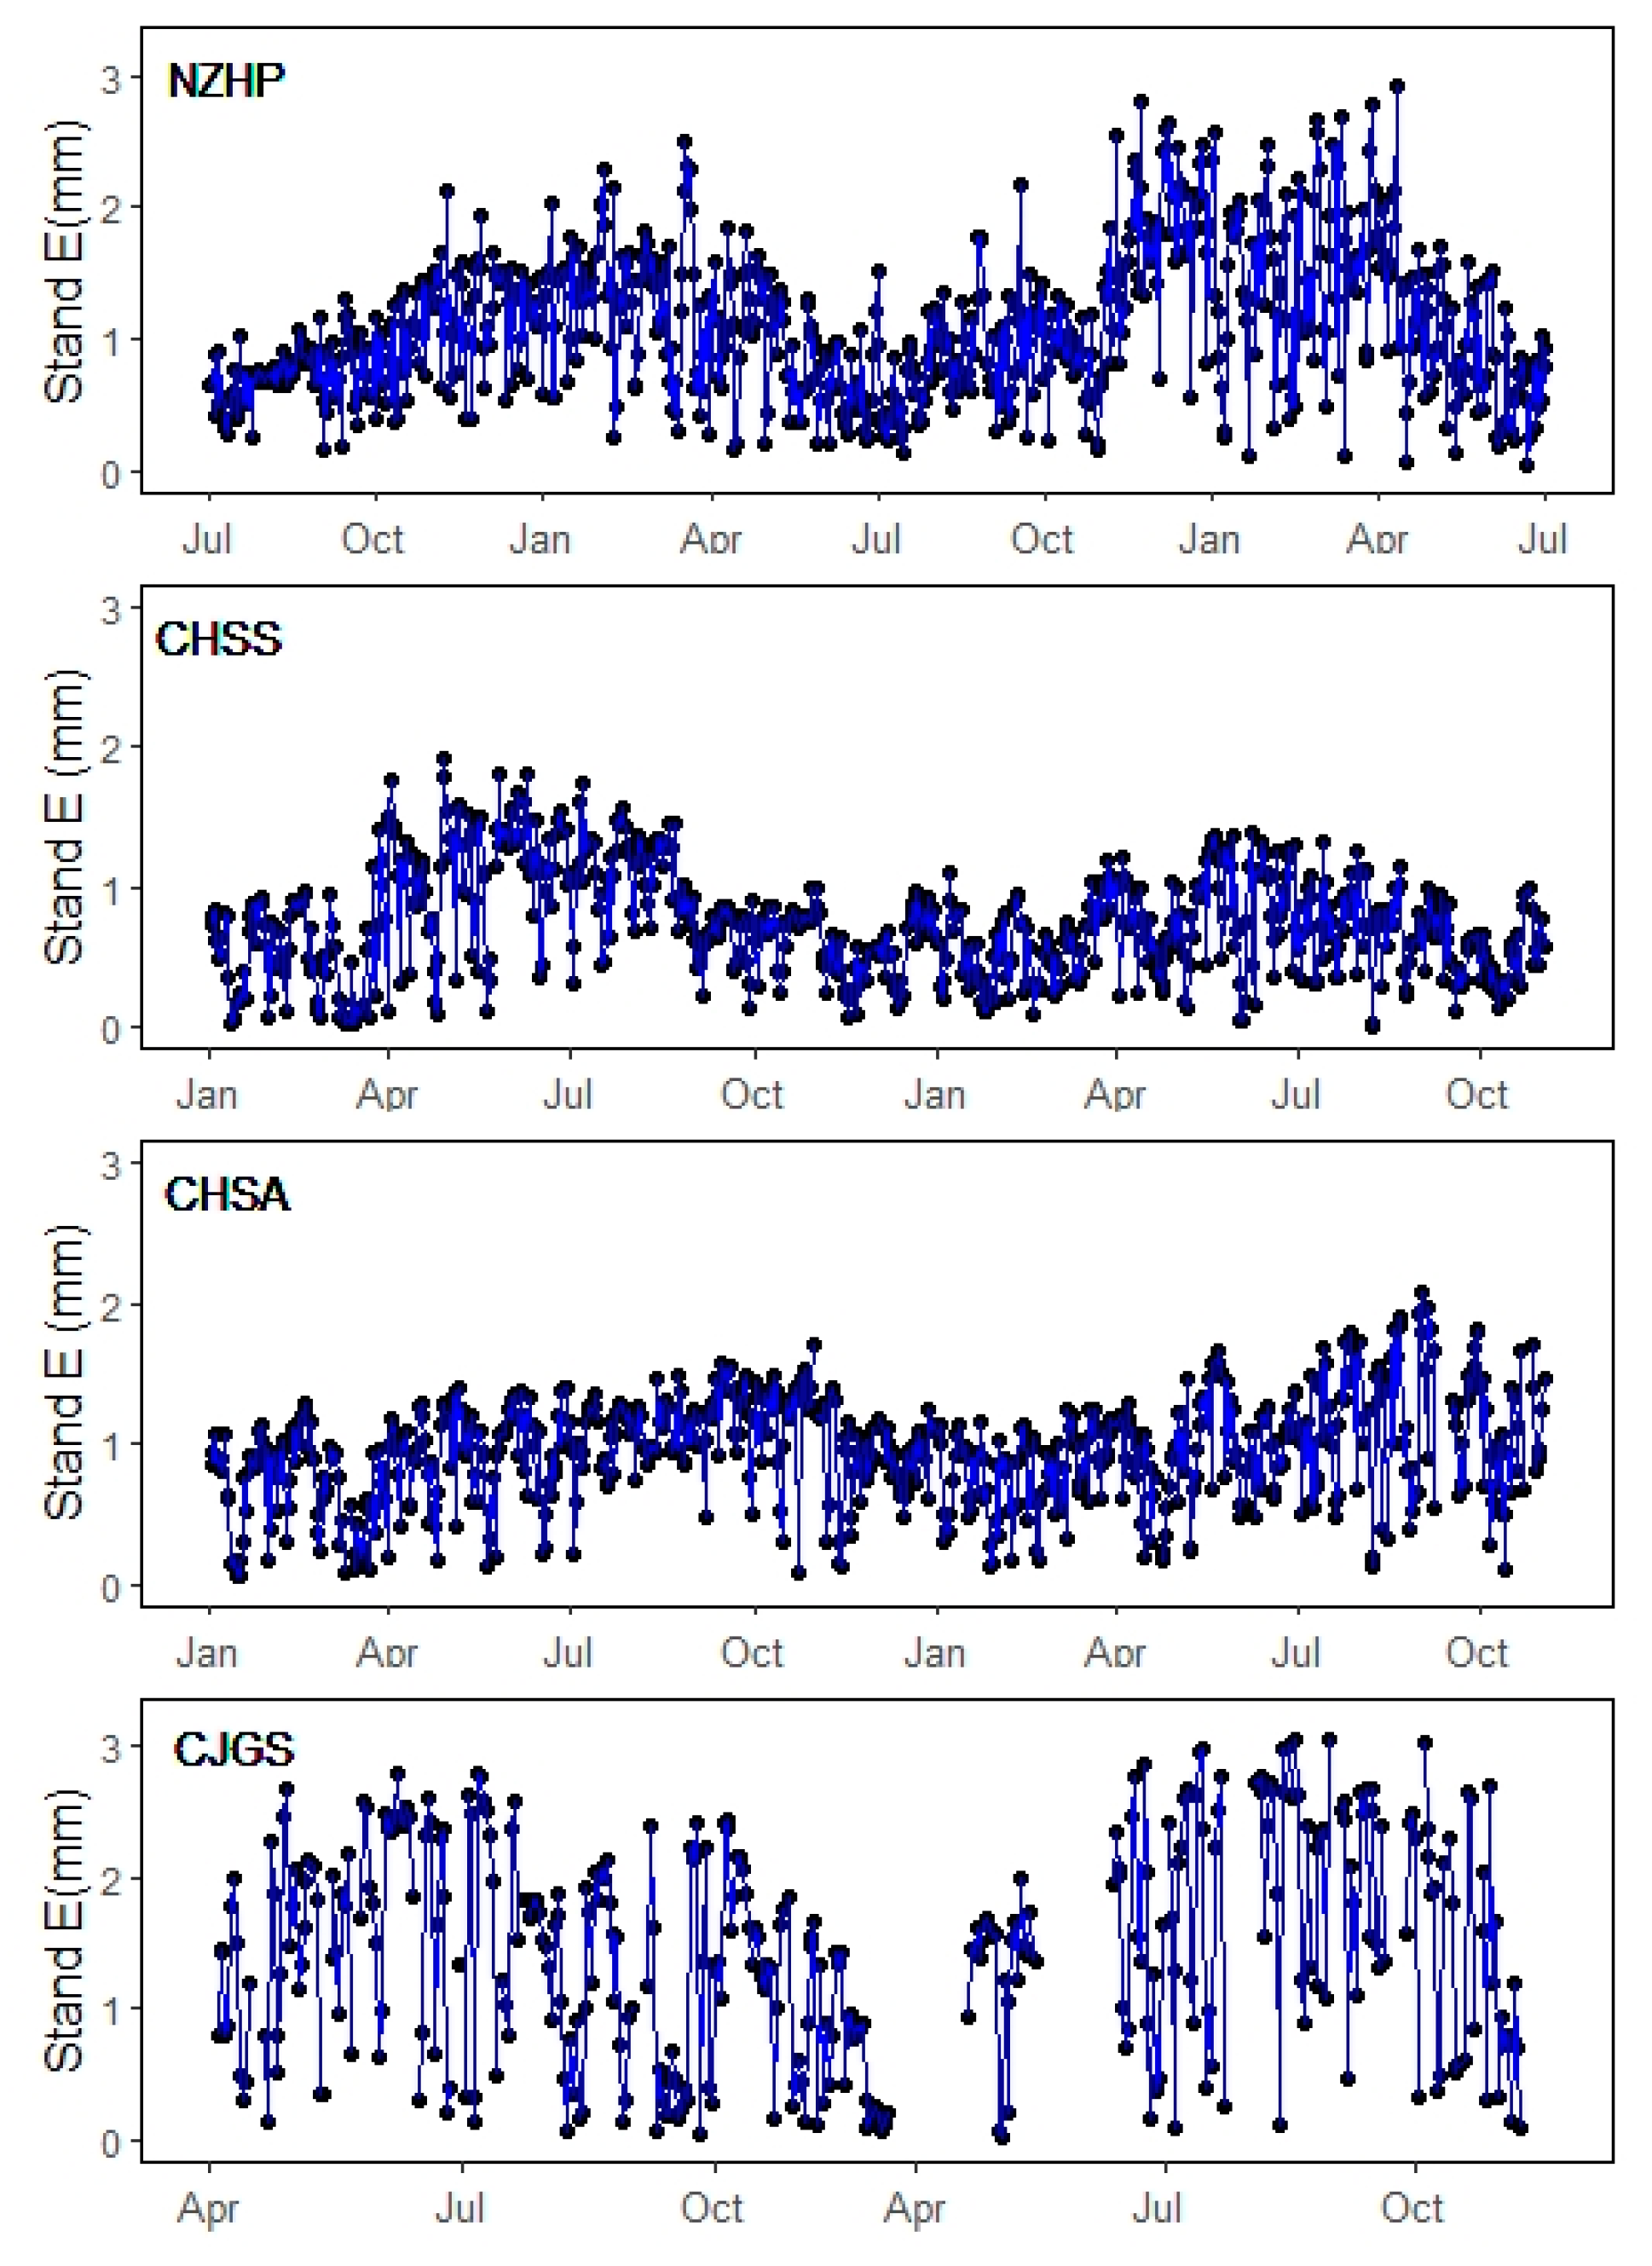
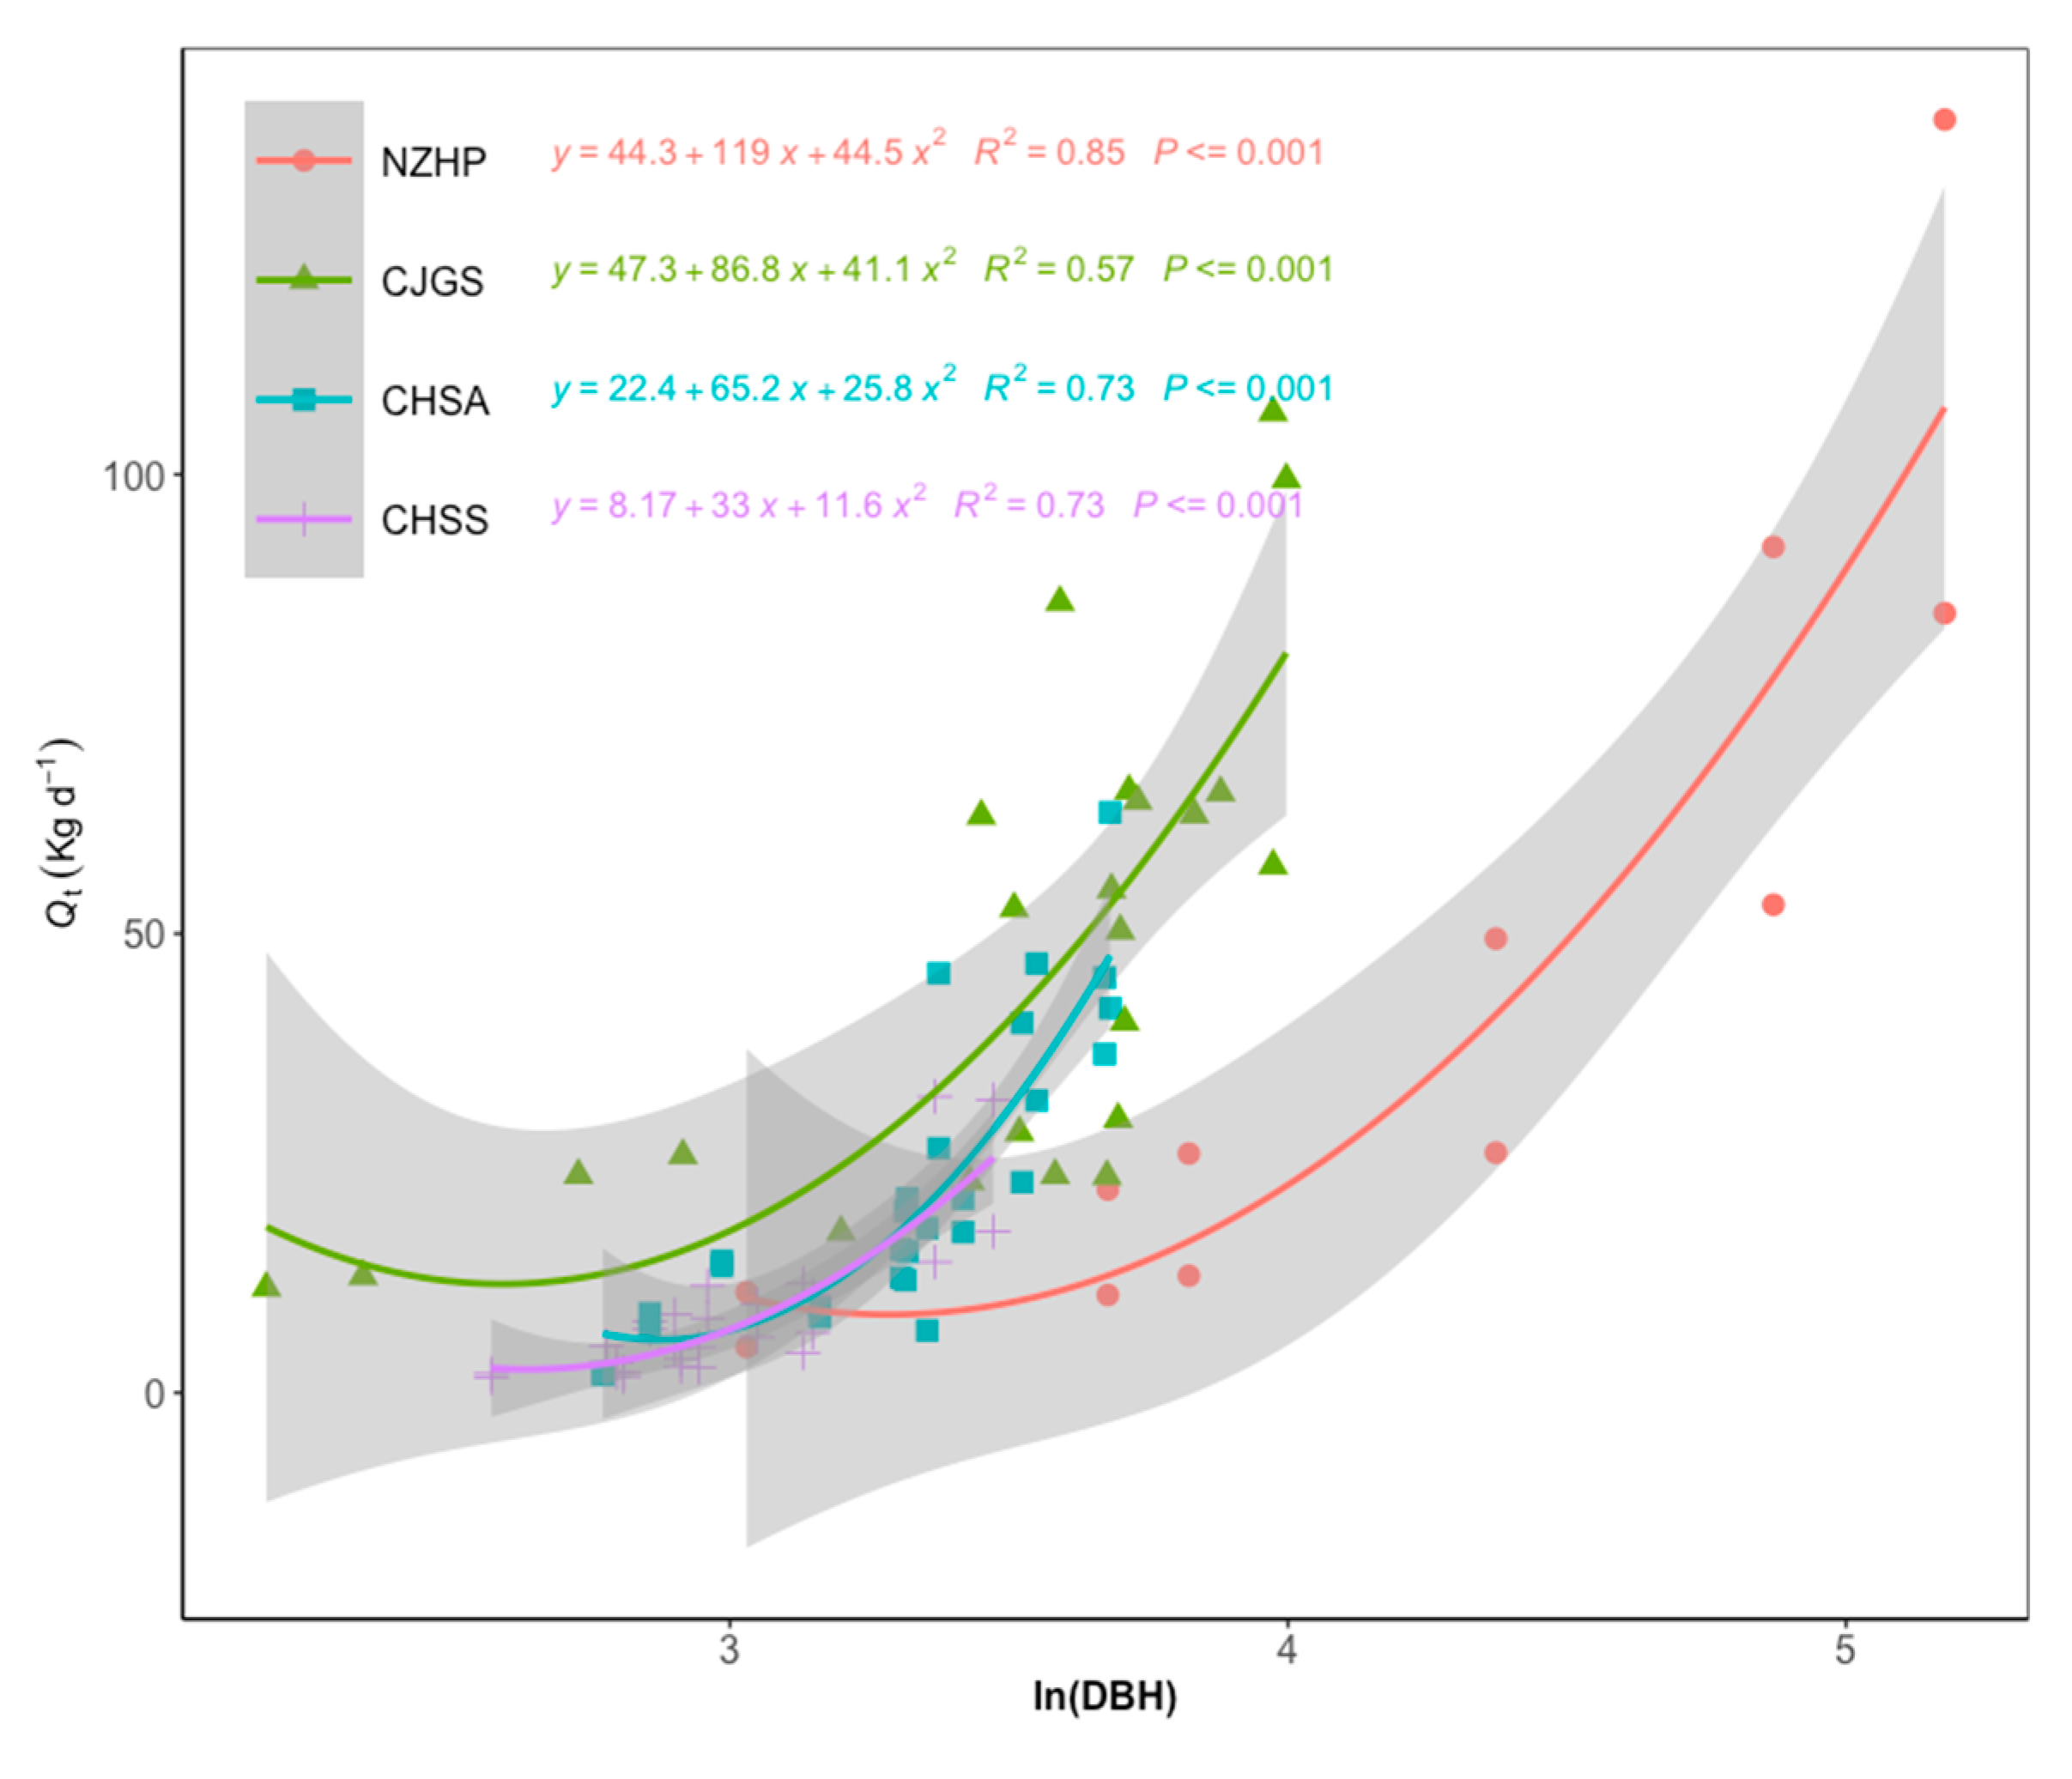
3.2. Sap Flow Density and Stand Scale Transpiration

Annual patterns of Fd for each species varied among six species along with the local weather of different climatic zones (Figure 2). Sap flow density increased and reached peak values in summertime, concurrent with increasing values of environmental drivers (temperature, PAR, VPD) for all species (Figure 3). The seasonal patterns of Fd within each species were consistent across the two years, the interannual variation in the magnitude of Fd can be attributed to different site characteristics and plant functional types. The evergreen conifer species, A. australis showed lower Fd values throughout the two years (Figure 2 and Figure 4), with a daily maximum Fd value of about 15 g H2O m−2 s−1, compared to the angiosperm species with maximum values of 40–60 g H2O m−2 s−1 (Figure 2; Figure 3).
Although some species were measured at the same site with the same weather conditions, A. mangium had the highest Fd year-round, with less seasonal fluctuations compared to S. wallichii (Figure 3 and Figure 4). For those three temperate deciduous species at CJGS site, Fd reduced in July 2014 because of an insect attack causing a huge reduction of leaf area [9]. For 2015, daily Fd increased progressively during spring and peaked during summer, then dropped again in autumn (Figure 3).
Daily stand transpiration showed seasonal variation among four research sites (Figure 5), which changed synchronously with their local environmental conditions (Figure 1) and had a similar pattern with daily sap flow density (Figure 2). There was greater annual transpiration variation at NZHP and CJGS sites, which is consistent with more distinct seasonal changes compared to CHS sites at the subtropical location. Over the two-year study period, average stand daily water use was 1.10 mm for the NZHP, 0.74 mm for CHSS, 0.95 mm for CHSA and 1.48 mm for CJGS site. CHSS and CHSA subtropical evergreen broadleaved forests had lower values of average stand daily water use, while deciduous broadleaved forest of CJGS site had higher values.
Although Fd value of the conifer species was the lowest, the NZHP stand water use was higher than that of the subtropical stand throughout the study period. The reason was mainly attributed to the larger tree size and stand total basal area (Table.1) because whole tree water use (Qt) strongly increased with tree diameter (R2 = 0.57–0.85, p < 0.001) for our research sites (Figure 6). In addition, trees with DBH bigger than 50 cm contributed 45.6% of total stand sapwood area in NZHP site.

3.3. Environmental Variables for Stand Scale and Key Drivers Affecting Tree Sap Flow

Principle components analysis (PCA) on all our research sites showed that the first three factors explained 78%–86% of the total variation in tree transpiration based on local environmental variables across three climatic zones (Table 4). The first component (PC1) explained 38%–53% of the variance and was positively correlated with temperature, PAR and VPD and negatively correlated to rain and RH or soil moisture, suggesting that high evaporative demand with dry, sunny and warm climatic conditions would cause a strong atmosphere-canopy reaction [8]. The second and third component explained between 13% and 26% of the total variance in the dataset and were related to precipitation and wind, as well as soil moisture.

3.4. Response of Individual Daily Sap Flux to VPD and PAR for Different Species

All predicted environmental variables together explained between 45 and 66% of daily whole tree water use (Table 5) by multiple linear regression. Both VPD and PAR were the strongest indicators influencing whole-tree water use for all the stands, though they had different partial effects (Partial R2) for each stand. Temperature was the third most powerful driver (Table 5).
The relationship between Fd and the most important key drivers, VPD and PAR, for the six species are well described by using an exponential saturation model (Table S1). The responses of Fd to increasing VPD showed that daily Fd of L. formosana was higher than the other species, as described by the highest value for parameter a in the exponential saturation models (Table 6). For the two oak species, Q. acutissima and Q. variabilis, and A. mangium species, daily Fd reached peak values when VPD was about 1 kPa (Table S1) and sustained a high level of sap flux, with larger values for parameter b, indicating higher sensitivity of leaf transpiration (stomatal conductance) to VPD in those species, followed by L. formosana. A distinctive response curve occurred in A. australis and S. wallichii whereby Fd did not plateau over the measured VPD range. These two species also had smaller values of parameter b, indicating less sensitivity of leaf transpiration to rising VPD.
The relationships between daily Fd and PAR for all the species showed a distinctive asymptotic response (Table S1). During the research periods, A. mangium showed the highest parameter b, indicating the most sensitivity of Fd to increasing PAR, compared to the other species.

4. Discussion

4.1. Climate—Depend Water Use Variation across Sites

Due to the differences in geographic and climatic zones, the response characteristics of species in various research sites were different as expected. Species in the same area usually had similar functional and structural behavior, showing convergence in response to site-specific characteristics [8,16,48]. For example, NZHP site has a maritime climate with a low daily VPD and relatively low summer temperatures compared to the other two regions. Several co-occurring species including conifers and angiosperms here showed similar gas exchange rate and tree hydraulic conductance, indicating the functional convergence in water relations [16]. Temperate deciduous forest faced higher evaporative demand (Figure 1) and usually had higher water use efficiency than subtropical forests [49].
Our study covering three contrasting climatic zones with six dominant species revealed an overall control of weather effects on plant transpiration for all sites both at the individual tree scale and stand-level water use (Figure 1, Figure 2 and Figure 4). Applying PCA to daily sap flux datasets, the impacts of local environmental conditions on the transpiration of each site might be depicted by a set of composite variables, namely the main transpiration demand drivers (air temperature, PAR, VPD), precipitation, soil moisture and wind (Table 4). The strongest drivers for all the research sites were PAR, VPD and air temperature, indicating that tree transpiration increased with higher evaporative demand index (when the environment became warmer, brighter and less humid) [8,47]. The strong positive correlation of sap flow and environmental predictors (Table 4; Table 5) confirmed that atmospheric control contributes as the main external drivers for transpiration [50,51].
Spatial water use variation was shown to be site-specific in the influence of characteristics such as tree species, tree size, plant density, leaf area index, as well as climate conditions [5,6]. During the two-year study periods, CJGS site showed the highest daily stand water use from higher sap flow density and higher stand basal area (Table 1), stand-scale water use accounting for 37.9% of total rainfall during its growth season. Stand-scale water use of NZHP site accounted for 26.5% of total rainfall, followed by CHSA site (18.7% of total rainfall) and CHSS site (14.5% of total rainfall) during the studied period. Higher stand transpiration was associated with higher stand basal area (Table 1), a finding supported by the positive relationship between daily whole tree water use and basal area across all sites (Figure 6). This is consistent with the relationship observed in many other studies [6,52]. Therefore, NZHP conifer forests had the second greatest stand transpiration resulting from the biggest sapwood area among the four sites, even though it had the lowest sap flow density (Figure 4).

4.2. Response of Tree Transpiration to Environmental Drivers

Generally, the main environmental drivers of transpiration are VPD and PAR [5,6,7,53]. Soil moisture is another important factor causing variation in transpiration across sites [6] and is a limiting factor in semiarid or arid regions [54]. The importance of soil moisture can be greater for smaller trees and during dry periods [7,55]. Multiple regression analyses of whole tree water use and environmental factors showed that VPD and PAR were the strongest drivers for our research sites followed by temperature and soil moisture (Table 5). Our results were consistent with previous studies at the same research sites [7,9,37]. Whitley et al. [6] also found transpiration patterns over five contrasting Australian research sites were more responsive to VPD and PAR than soil moisture. Soil moisture did not become a limiting factor at all our research sites, but its importance was greater for A. australis trees than for other species (Table 5). Potential reasons for these differences may be the misaligned rainfall and growing season in the southern hemisphere and the frequency of summer droughts under climate change across the region of A. australis [7], as there was only 27% to 37% of annual rainfall during October to the following March; however, it was the fastest stem growth season during summer with the highest evaporative demand.
Competition for light is considered the main competition process within forest stands, especially in single-species stands [56]. VPD and PAR were the key drivers for the two subtropical evergreen forests, while PAR was shown more influential for whole tree transpiration of CHSS as light availability competition became a limiting factor within the stand. There was higher plant density in the CHSS stand with LAI monthly values ranging from 1.4 to 3.9 m2 m−2 compared to CHSA stand with LAI values between 1.3 to 2.8 m2 m−2 (Table 2) [37].

4.3. Transpiration Differences among Tree Species

There were marked differences in both the magnitude and pattern of daily Fd characteristics among the six species, mainly due to differences in biological parameters among plant functional types and hydraulic architecture [4,57]. Biological characteristics and hydraulic traits for each species are available in Table 2. The evergreen conifer (A. australis) generally has less water use, large sapwood area offering high capacity of stem water storage and more conservative stomatal regulation than angiosperms, to avoid severe hydraulic failure [7,16,54,55,56,57,58]. This is in agreement with our results that A. australis showed the smallest Fd in daily and seasonal variation (Figure 3 and Figure 4).
Although some species were located at the same site, exploring Fd patterns for those co-occurring species reflected the various water and growth competition strategies [59]. At CJGS site, the ring porous species (Q. acutissima and Q. variabilis) showed no difference in daily Fd and seasonal average Fd, but Fd values were lower than those of the diffuse porous species L. formosana (Figure 4) which had lower wood density (Table 2) during the period of well-watered conditions like the second study year. However, when soil moisture was limiting and the trees experienced an insect attack (after July) during the first study year, Fd declined substantially in those oak species and did not totally recover compared to L.formasana. The higher Fd before the drought and the increased nocturnal sap flow during drought might be the reason of fast recovery [40] in any disturbance under current climatic conditions. Besides that, tree height of L. formasana was significantly shorter than other co-occurring species, with smaller leaf area (p < 0.05) (Table 3). At CHS site (subtropical evergreen broadleaved forest region), A. mangium showed higher Fd values than those of S. wallichii (Figure 3; Figure 4) both at wet and dry season, which is in agreement with the previous study results within the same site [35]. Both of those species are diffuse porous species but wood density of S. wallichii is higher than A. mangium wood density. Root depth and light resource availability within the stand might be the main reasons for Fd variation between these species. S. wallichii was reported to have most root biomass concentrated in the top 50 cm layer based on studies in south China [55], whilst A. mangium was thought have deeper roots to extract deeper soil water [37,60]. Because of the high planting density, fierce competition for light resources within the S. wallichii stand (867 trees per ha) was more intensive than the A. mangium stand (519 trees per ha). Moreover, A. mangium is less tolerant of wet soil and more adaptable to good drainage sites [37], as it is shown the negative relationship between soil moisture and daily water use in Table 4. As an exotic and fast-growing species, it is more competitive in warmer and drier conditions than native species [61], for example, S. wallichii in this study.

4.4. Sensitivity and Vulnerability to Environmental Drivers

Physiological traits related to water transport have a critical role in predicting a tree’s vulnerability and resilience to extreme events, such as drought and higher temperatures [62,63]. A cross-species study of leaf traits revealed that stomatal conductance, specific xylem hydraulic conductivity and cavitation resistance were closely correlated with leaf nitrogen content and leaf area, while stomatal control parameters were unassociated with leaf economics spectrum [64]. A meta-analysis across 475 species showed that low wood density was a significant predictor of mortality anomalies in angiosperms but not gymnosperms because of their fundamentally different wood anatomy. In addition, trees with less negative P50 values experienced higher rates of mortality [62]. How plants respond to environmental drivers is related to species’ differences in their water use strategies such as their vulnerability to xylem cavitation and stomatal sensitivity to transpiration demand [4]. In this study, the sensitivity index (parameter b of the exponential saturation model) of transpiration to VPD is lower in A. australis and S. wallichii species (Table 6), indicating that those two species probably had lower soil-leaf hydraulic conductance and less sensitivity to environmental variables than others [20,65]. A. australis was found highly vulnerable to hydraulic failure, described by low P50 values and architectural structure, but they have a highly conservative water use strategy, including tight stomatal regulation with low stomatal conductance (Table 2) in both wet and dry soil conditions and large water capacitance in stems [7,42].
Plants with strong stomatal control can adapt well to mesic environments because they can increase transpiration under low VPD or increase their growth rate [59]. Trees with a high transpiration rate under low VPD were more competitive with respect to growth and reproductive rate [1], for example, deciduous species and A. mangium in this study. For angiosperms, evergreen species had significantly lower values of maximum hydraulic conductivity and lower P50 values than deciduous species (see Table 2 and [64]) based on research at our Chinese sites. Ring-porous species (Q. variabilis and Q. acutissima) with large earlywood vessels [66] have a higher risk of embolism or cavitation than L. formosana, therefore they had higher sensitivity of stomatal regulation to reduce embolism at high stem tension [45]. Diffuse porous species (L. formosana) have narrower vessel diameters and greater conducting sapwood with a lower wood density and higher hydraulic capacitance according to previous studies at the same research site [9,67]. Species with high capacitance guarantee hydraulic safety and buffer fluctuations in tension by releasing stored water and maintaining minimum xylem water potentials above critical values [57,68]. Teasing apart the relative importance of biotic controls and abiotic drivers of plant water use by different species across different climatic zones requires more datasets to build up a comprehensive picture of plant responses to environmental conditions. The work of the SAPFLUXNET team [17] will help to build global models of sap flow but our paper provides a snapshot of three contrasting climatic forests as an example of different plant response patterns.

5. Conclusions

Our study showed that water use responses to environmental factors were similar across sites, with VPD and PAR playing the strongest role in driving transpiration. However, the patterns and magnitude of sap flow of our six species differed significantly according to the variety of site-specific conditions and biological attributes. Conifer species (A.australis) showed the most conservative water use characters. The exotic species (A. mangium) revealed higher Fd all year round even in the dry season, suggesting higher water resource needs and higher adaptive ability to some warmer and drier conditions than the native species (S. wallichii). L. formosana species displayed fast recovery possibilities after disturbance compared to the oak ring-porous species at CJGS site. These observed results indicate that biophysical characteristics such as canopy structure, xylem anatomy, wood density and root depth and other physiological traits such as water use conservation, water storage capacity, stomata sensitivity to environmental drivers combined with site conditions together contribute to the water use patterns for individual trees and at the stand scale. For better predictions of forest dynamics under future climate scenarios, we need to take these biological traits, site factors and climatic conditions into account.

Supplementary Materials

The following is available online at https://www.mdpi.com/1999-4907/12/2/161/s1, Table S1: Biological and hydraulic data sources and references.

Author Contributions

X.Z. analyzed all data and prepared the first draft of the manuscript; C.M.-N., P.Z., L.Z., Q.W., Y.H., B.M.C., J.K., O.L., X.C., G.N. and Q.Y. contributed to fieldwork; C.M.-N. helped reviewed the draft and analytical approaches. All authors contributed to manuscript preparation. All authors have read and agreed to the published version of the manuscript.

Funding

Funding was provided by the National Natural Science Foundation of China (41630752, 31700532), a Faculty Research Development Fund (FRDF) grant from the University of Auckland (grant number 3717388) and a Rutherford Discovery Fellowship from the Royal Society Te Apārangi to CMN (RDF-UOA1504).

Institutional Review Board Statement

Not applicable.

Informed Consent Statement

Not applicable.

Data Availability Statement

Sap flow data from the Huapai site is available from the SAPFLUXNET database http://sapfluxnet.creaf.cat/.

Acknowledgments

We thank Yaxing Zhang, Zhenzhen Zhang and Zhipeng Chen for their help conducting regular fieldwork and Heshan research station for providing the meteorological data. We also thank the Meteorological Service of New Zealand Ltd. for providing the temperature and relative humidity data for the periods our sensor malfunctioned. Specific thanks to Alexandra Candeille for her help in R software usage and Niandong Du for providing feedback on the paper.

Conflicts of Interest

The authors declare no conflict of interest.

References

  1. Ghimire, C.P.; Bruijnzeel, L.A.; Lubczynski, M.W.; Zwartendijk, B.W.; Odongo, V.O.; Ravelona, M.; Van Meerveld, H.J. Transpiration and stomatal conductance in a young secondary tropical montane forest: Contrasts between native trees and invasive understorey shrubs. Tree Physiol. 2018, 38, 1053–1070. [Google Scholar] [CrossRef]
  2. Tor-ngern, P.; Oren, R.; Oishi, A.C.; Uebelherr, J.M.; Palmroth, S.; Tarvainen, L.; Ottosson-Löfvenius, M.; Linder, S.; Domec, J.C.; Näsholm, T. Ecophysiological variation of transpiration of pine forests: Synthesis of new and published results. Ecol. Appl. 2017, 27, 118–133. [Google Scholar] [CrossRef]
  3. Manoli, G.; Domec, J.C.; Novick, K.; Oishi, A.C.; Noormets, A.; Marani, M.; Katul, G. Soil–plant–atmosphere conditions regulating convective cloud formation above southeastern US pine plantations. Glob. Chang. Biol. 2016, 22, 2238–2254. [Google Scholar] [CrossRef]
  4. Peters, E.B.; McFadden, J.P.; Montgomery, R.A. Biological and environmental controls on tree transpiration in a suburban landscape. J. Geophys. Res. 2010, 115, G04006. [Google Scholar] [CrossRef]
  5. Hassler, S.K.; Weiler, M.; Blume, T. Tree-, stand-and site-specific controls on landscape-scale patterns of transpiration. Hydrol. Earth Syst. Sci. 2018, 22, 13–30. [Google Scholar] [CrossRef] [Green Version]
  6. Whitley, R.; Taylor, D.; Macinnis-Ng, C.; Zeppel, M.; Yunusa, I.; O’Grady, A.; Froend, R.; Medlyn, B.; Eamus, D. Developing an empirical model of canopy water flux describing the common response of transpiration to solar radiation and VPD across five contrasting woodlands and forests. Hydrol. Process. 2013, 27, 1133–1146. [Google Scholar] [CrossRef]
  7. Macinnis-Ng, C.; Wyse, S.; Veale, A.; Schwendenmann, L.; Clearwater, M. Sap flow of the southern conifer, Agathis australis during wet and dry summers. Trees-Struct. Funct. 2016, 30, 19–33. [Google Scholar] [CrossRef]
  8. Wang, H.; Wang, X.; Zhao, P.; Zheng, H.; Ren, Y.; Gao, F.; Ouyang, Z. Transpiration rates of urban trees, Aesculus Chinensis. J. Environ. Sci. 2012, 24, 1278–1287. [Google Scholar] [CrossRef]
  9. Hu, Y.T.; Zhao, P.; Zhu, L.W.; Zhao, X.H.; Ni, G.Y.; Ouyang, L.; Schäfer, K.V.R.; Shen, W.J. Responses of sap flux and intrinsic water use efficiency to canopy and understory nitrogen addition in a temperate broadleaved deciduous forest. Sci. Total Environ. 2019, 648, 325–336. [Google Scholar] [CrossRef]
  10. Sperry, J.S.; Venturas, M.D.; Todd, H.N.; Trugman, A.T.; Anderegg, W.R.; Wang, Y.; Tai, X. The impact of rising CO2 and acclimation on the response of US forests to global warming. PNAS 2019, 116, 25734–25744. [Google Scholar] [CrossRef]
  11. Chemura, A.; Rwasoka, D.; Mutanga, O.; Dube, T.; Mushore, T. The impact of land-use/land cover changes on water balance of the heterogeneous Buzi sub-catchment, Zimbabwe. RSASE 2020, 18, 100292. [Google Scholar] [CrossRef]
  12. Kume, T.; Otsuki, K.; Du, S.; Yamanaka, N.; Wang, Y.L.; Liu, G.B. Spatial variation in sap flow velocity in semiarid region trees: Its impact on stand-scale transpiration estimates. Hydrol. Process. 2012, 26, 1161–1168. [Google Scholar] [CrossRef]
  13. Catovsky, S.; Holbrook, N.M.; Bazzaz, F.A. Coupling whole-tree transpiration and canopy photosynthesis in coniferous and broad-leaved tree species. Can. J. Forest Res. 2002, 32, 295–309. [Google Scholar] [CrossRef] [Green Version]
  14. Bhusal, N.; Lee, M.; Reum Han, A.; Han, A.; Kim, H.S. Responses to drought stress in Prunus sargentii and Larix kaempferi seedlings using morphological and physiological parameters. For. Ecol. Manag. 2020, 465, 118099. [Google Scholar] [CrossRef]
  15. Siddiq, Z.; Chen, Y.J.; Zhang, Y.J.; Zhang, J.L.; Cao, K.F. More sensitive response of crown conductance to VPD and larger water consumption in tropical evergreen than in deciduous broadleaf timber trees. Agric. Forest Meteorol. 2017, 247, 399–407. [Google Scholar] [CrossRef]
  16. Kaplick, J.; Clearwater, M.J.; Macinnis-Ng, C. Comparative water relations of co-occurring trees in a mixed podocarp-broadleaf forest. J. Plant Ecol. 2019, 12, 163–175. [Google Scholar] [CrossRef]
  17. Poyatos, R.; Granda, V.; Molowny-Horas, R.; Mencuccini, M.; Steppe, K.; Martínez-Vilalta, J. SAPFLUXNET: Towards a global database of sap flow measurements. Tree Physiol. 2016, 36, 1449–1455. [Google Scholar] [CrossRef] [Green Version]
  18. Qaderi, M.M.; Martel, A.B.; Dixon, S.L. Environmental factors influence plant vascular system and water regulation. Plants 2019, 8, 65. [Google Scholar] [CrossRef] [Green Version]
  19. Meinzer, F.C.; Woodruff, D.R.; Eissenstat, D.M.; Lin, H.S.; Adams, T.S.; McCulloh, K.A. Above-and belowground controls on water use by trees of different wood types in an eastern US deciduous forest. Tree Physiol. 2013, 33, 345–356. [Google Scholar] [CrossRef] [Green Version]
  20. Gao, J.; Zhao, P.; Shen, W.; Rao, X.; Hu, Y. Physiological homeostasis and morphological plasticity of two tree species subjected to precipitation seasonal distribution changes. Perspect. Plant Ecol. 2017, 25, 1–19. [Google Scholar] [CrossRef]
  21. Tombesi, S.; Almehdi, A.; Dejong, T.M. Phenotyping vigour control capacity of new peach rootstocks by xylem vessel analysis. Sci. Hortic. 2011, 127, 353–357. [Google Scholar] [CrossRef]
  22. Hietz, P.; Rosner, S.; Hietz-Seifert, U.; Wright, S.J. Wood traits related to size and life history of trees in a Panamanian rainforest. New Phytol. 2017, 213, 170–180. [Google Scholar] [CrossRef] [Green Version]
  23. Kattge, J.; Bönisch, G.; Díaz, S.; Lavorel, S.; Prentice, I.C.; Leadley, P.; Tautenhahn, S.; Werner, G.D.A.; Aakala, T.; Abedi, M.; et al. TRY plant trait database– enhanced coverage and open access. Glob. Chang. Biol. 2020, 26, 119–188. [Google Scholar] [CrossRef] [Green Version]
  24. Oliva, C.L.; Bucci, S.J.; Di, F.D.; Lezcano, O.A.; Campanello, P.I.; Scholz, F.G.; Rodríguez, S.; Madanes, N.; Cristiano, P.M.; Hao, G.Y.; et al. Water storage dynamics in the main stem of subtropical tree species differing in wood density, growth rate and life history traits. Tree Physiol. 2015, 35, 354–365. [Google Scholar] [CrossRef] [Green Version]
  25. Bhusal, N.; Bhusal, S.J.; Yoon, T.M. Comparisons of physiological and anatomical characteristics between two cultivars in bileader apple trees (Malus × domestica Borkh.). Sci. Hortic. 2018, 231, 73–81. [Google Scholar] [CrossRef]
  26. von Allmen, E.I.; Sperry, J.S.; Bush, S.E. Contrasting whole-tree water use, hydraulics, and growth in a co-dominant diffuse-porous vs. ring-porous species pair. Trees-Struct. Funct. 2015, 29, 717–728. [Google Scholar] [CrossRef]
  27. Matheny, A.M.; Fiorella, R.P.; Bohrer, G.; Poulsen, C.J.; Morin, T.H.; Wunderlich, A.; Vogel, C.S.; Curtis, P.S. Contrasting strategies of hydraulic control in two codominant temperate tree species. Ecohydrology 2017, 10, e1815. [Google Scholar] [CrossRef]
  28. Martínez-Vilalta, J.; Garcia-Forner, N. Water potential regulation, stomatal behaviour and hydraulic transport under drought: Deconstructing the iso/anisohydric concept. Plant Cell Environ. 2017, 40, 962–976. [Google Scholar] [CrossRef] [Green Version]
  29. Buckley, T.N. How do stomata respond to water status? New Phytol. 2019, 224, 21–36. [Google Scholar] [CrossRef] [Green Version]
  30. Hochberg, U.; Rockwell, F.E.; Holbrook, N.M.; Cochard, H. Iso/anisohydry: A plant–environment interaction rather than a simple hydraulic trait. Trends Plant Sci. 2018, 23, 112–120. [Google Scholar] [CrossRef]
  31. Klein, T. The variability of stomatal sensitivity to leaf water potential across tree species indicates a continuum between isohydric and anisohydric behaviours. Funct. Ecol. 2014, 28, 1313–1320. [Google Scholar] [CrossRef]
  32. Roman, D.T.; Novick, K.A.; Brzostek, E.R.; Dragoni, D.; Rahman, F.; Phillips, R.P. The role of isohydric and anisohydric species in determining ecosystem-scale response to severe drought. Oecologia 2015, 179, 641–654. [Google Scholar] [CrossRef]
  33. Feng, X.; Ackerly, D.D.; Dawson, T.E.; Manzoni, S.; McLaughlin, B.; Skelton, R.P.; Vico, G.; Weitz, A.P.; Thompson, S.E. Beyond isohydricity: The role of environmental variability in determining plant drought responses. Plant Cell Environ. 2019, 42, 1104–1111. [Google Scholar] [CrossRef] [Green Version]
  34. Macinnis-Ng, C.; Schwendenmann, L.; Clearwater, M. Radial variation of sap flow of kauri (Agathis australis) during wet and dry summers. Acta Hortic. 2013, 991, 205–214. [Google Scholar] [CrossRef]
  35. Chappel, P.R. The climate and weather of Auckland. NIWA Sci. Technol. Ser. 2013, 60, 40. [Google Scholar]
  36. Thomas, M.B.; Spurway, M.I. Nutrition of container-grown rewa-rewa (Knightia excelsa). In The International Plant Propagators’ Society Combined Proceedings; Lincoln University: Canterbury, New Zealand, 1987; Volume 36, pp. 450–455. [Google Scholar]
  37. Wang, Q.; Lintunen, A.; Zhao, P.; Shen, W.; Salmon, Y.; Chen, X.; Ouyang, L.; Zhu, L.; Ni, G.; Sun, D.; et al. Assessing Environmental Control of Sap Flux of Three Tree Species Plantations in Degraded Hilly Lands in South China. Forests 2020, 11, 206. [Google Scholar] [CrossRef] [Green Version]
  38. Zhang, W.; Shen, W.; Zhu, S.; Wan, S.; Luo, Y.; Yan, J.; Wang, K.; Liu, L.; Dai, H.; Li, P.; et al. CAN Canopy Addition of Nitrogen Better Illustrate the Effect of Atmospheric Nitrogen Deposition on Forest Ecosystem? Sci Rep. 2015, 5, 1–12. [Google Scholar] [CrossRef] [Green Version]
  39. Zhu, L.; Hu, Y.; Zhao, X.; Zhao, P.; Ouyang, L.; Ni, G.; Liu, N. Specific responses of sap flux and leaf functional traits to simulated canopy and understory nitrogen additions in a deciduous broadleaf forest. Funct. Plant Biol. 2019, 46, 986–993. [Google Scholar] [CrossRef]
  40. Zhu, L.; Hu, Y.; Zhao, X.; Zeng, X.; Zhao, P.; Zhang, Z.; Ju, Y. The impact of drought on sap flow of cooccurring Liquidambar formosana Hance and Quercus variabilis Blume in a temperate forest, Central China. Ecohydrology 2017, 10, e1828. [Google Scholar] [CrossRef]
  41. Zhu, L.W.; Zhao, P.; Cai, X.A.; Zeng, X.P.; Ni, G.Y.; Zhang, J.Y.; Zou, L.L.; Mei, T.T.; Yu, M.H. Effects of sap velocity on the daytime increase of stem CO 2 efflux from stems of Schima superba trees. Trees-Struct. Funct. 2012, 26, 535–542. [Google Scholar] [CrossRef]
  42. Kaplick, J. Water and Carbon Relations in New Zealand Kauri Forest. Ph.D. Thesis, The University of Auckland, Auckland, New Zealand, 2018. [Google Scholar]
  43. Burkhardt, T. Thirsty at Night: Patterns and Functionality of Nocturnal Transpiration in Kauri (Agathis australis). Master’s Thesis, The University of Auckland, Auckland, New Zealand, 2019. [Google Scholar]
  44. Karikala, C. Sapwood Area and Density of Temperate Kauri Forest Species. Honours Thesis, The University of Auckland, Auckland, New Zealand, 2015. [Google Scholar]
  45. Ouyang, L.; Zhao, P.; Zhu, L.; Zhang, Z.; Zhao, X.; Ni, G. Difference in response of water use to evaporative demand for codominant diffuse-porous versus ring-porous tree species under N addition in a temperate forest. Ecohydrology 2017, 10, e1829. [Google Scholar] [CrossRef]
  46. Pataki, D.E.; McCarthy, H.R.; Litvak, E.; Pincetl, S. Transpiration of urban forests in the Los Angeles metropolitan area. Ecol. Appl. 2011, 21, 661–677. [Google Scholar] [CrossRef] [Green Version]
  47. Xu, S.; Yu, Z. Environmental Control on Transpiration: A Case Study of a Desert Ecosystem in Northwest China. Water 2020, 12, 1211. [Google Scholar] [CrossRef]
  48. Wu, J.; Chavana-Bryant, C.; Prohaska, N.; Serbin, S.P.; Guan, K.; Albert, L.P.; Yang, X.; van Leeuwen, W.J.; Garnello, A.J.; Martins, G.; et al. Convergence in relationships between leaf traits, spectra and age across diverse canopy environments and two contrasting tropical forests. New Phytol. 2017, 214, 1033–1048. [Google Scholar] [CrossRef] [Green Version]
  49. Tan, Z.H.; Zhang, Y.P.; Deng, X.B.; Song, Q.H.; Liu, W.J.; Deng, Y.; Tang, J.W.; Liao, Z.Y.; Zhao, J.F.; Song, L.; et al. Interannual and seasonal variability of water use efficiency in a tropical rainforest: Results from a 9 year eddy flux time series. J. Geophys. Res.-Atmos. 2015, 120, 464–479. [Google Scholar] [CrossRef]
  50. Jonard, F.; André, F.; Ponette, Q.; Vincke, C.; Jonard, M. Sap flux density and stomatal conductance of European beech and common oak trees in pure and mixed stands during the summer drought of 2003. J. Hydrol. 2011, 409, 371–381. [Google Scholar] [CrossRef]
  51. Clausnitzer, F.; Köstner, B.; Schwärzel, K.; Bernhofer, C. Relationships between canopy transpiration, atmospheric conditions and soil water availability-Analyses of long-term sap-flow measurements in an old Norway spruce forest at the Ore Mountains/Germany. Agric. Forest Meteorol. 2011, 151, 1023–1034. [Google Scholar] [CrossRef]
  52. Zeppel, M.J.; Macinnis-Ng, C.M.; Yunusa, I.A.; Whitley, R.J.; Eamus, D. Long term trends of stand transpiration in a remnant forest during wet and dry years. J. Hydrol. 2008, 349, 200–213. [Google Scholar] [CrossRef] [Green Version]
  53. Ouyang, S.; Xiao, K.; Zhao, Z.; Xiang, W.; Xu, C.; Lei, P.; Deng, X.; Li, J. Stand Transpiration Estimates from Recalibrated Parameters for the Granier Equation in a Chinese Fir (Cunninghamia lanceolata) Plantation in Southern China. Forests 2018, 9, 162. [Google Scholar] [CrossRef] [Green Version]
  54. Wang, K.; Dickinson, R.E. A review of global terrestrial evapotranspiration: Observation, modeling, climatology, and climatic variability. Rev. Geophys. 2012, 50, RG2005. [Google Scholar] [CrossRef]
  55. Hu, Y.; Zhao, P.; Shen, W.; Zhu, L.; Ni, G.; Zhao, X.; Zhang, Z.; Rao, X.; Ouyang, L.; Zeng, X.; et al. Responses of tree transpiration and growth to seasonal rainfall redistribution in a subtropical evergreen broad-leaved forest. Ecosystems 2018, 21, 811–826. [Google Scholar] [CrossRef]
  56. Bourdier, T.; Cordonnier, T.; Kunstler, G.; Piedallu, C.; Lagarrigues, G.; Courbaud, B. Tree size inequality reduces forest productivity: An analysis combining inventory data for ten European species and a light competition model. PLoS ONE 2016, 11, e0151852. [Google Scholar] [CrossRef]
  57. Johnson, D.M.; McCulloh, K.A.; Woodruff, D.R.; Meinzer, F.C. Hydraulic safety margins and embolism reversal in stems and leaves: Why are conifers and angiosperms so different? Plant Sci. 2012, 195, 48–53. [Google Scholar] [CrossRef]
  58. Wyse, S.V.; Macinnis-Ng, C.M.; Burns, B.R.; Clearwater, M.J.; Schwendenmann, L. Species assemblage patterns around a dominant emergent tree are associated with drought resistance. Tree Physiol. 2013, 33, 1269–1283. [Google Scholar] [CrossRef] [Green Version]
  59. Gao, J.; Zhao, P.; Shen, W.; Niu, J.; Zhu, L.; Ni, G. Biophysical limits to responses of water flux to vapor pressure deficit in seven tree species with contrasting land use regimes. Agric. Forest Meteorol. 2015, 200, 258–269. [Google Scholar] [CrossRef]
  60. Germon, A.; Guerrini, I.A.; Bordron, B.; Bouillet, J.P.; Nouvellon, Y.; de Moraes Gonçalves, J.L.; Jourdan, C.; Paula, R.R.; Laclau, J.P. Consequences of mixing Acacia mangium and Eucalyptus grandis trees on soil exploration by fine-roots down to a depth of 17 m. Plant Soil. 2018, 424, 203–220. [Google Scholar] [CrossRef] [Green Version]
  61. Siddiq, Z.; Cao, K.F. Increased water use in dry season in eight dipterocarp species in a common plantation in the northern boundary of Asian tropics. Ecohydrology 2016, 9, 871–881. [Google Scholar] [CrossRef]
  62. Anderegg, W.R.; Klein, T.; Bartlett, M.; Sack, L.; Pellegrini, A.F.; Choat, B.; Jansen, S. Meta-analysis reveals that hydraulic traits explain cross-species patterns of drought-induced tree mortality across the globe. PNAS 2016, 113, 5024–5029. [Google Scholar] [CrossRef] [Green Version]
  63. Anderegg, W.R.; Konings, A.G.; Trugman, A.T.; Yu, K.; Bowling, D.R.; Gabbitas, R.; Karp, D.S.; Pacala, S.; Sperry, J.S.; Sulman, B.N.; et al. Hydraulic diversity of forests regulates ecosystem resilience during drought. Nature 2018, 561, 538–541. [Google Scholar] [CrossRef] [Green Version]
  64. Kröber, W.; Zhang, S.; Ehmig, M.; Bruelheide, H. Linking xylem hydraulic conductivity and vulnerability to the Leaf Economics Spectrum—A cross-species study of 39 evergreen and deciduous broadleaved subtropical tree species. PLoS ONE 2014, 9, e109211. [Google Scholar] [CrossRef] [PubMed] [Green Version]
  65. Õunapuu, E.; Sellin, A. Daily dynamics of leaf and soil-to-branch hydraulic conductance in silver birch (Betula pendula) measured in situ. Plant Physiol. Bioch. 2013, 68, 104–110. [Google Scholar] [CrossRef] [PubMed]
  66. Gil-Pelegrín, E.; Peguero-Pina, J.J.; Sancho-Knapik, D. (Eds.) Oaks Physiological Ecology: Exploring the Functional Diversity of Genus Quercus L.; Springer: Berlin/Heidelberg, Germany, 2017; Volume 7. [Google Scholar]
  67. Köcher, P.; Horna, V.; Leuschner, C. Stem water storage in five coexisting temperate broad-leaved tree species: Significance, temporal dynamics and dependence on tree functional traits. Tree Physiol. 2013, 33, 817–832. [Google Scholar] [CrossRef]
  68. Richards, A.E.; Wright, I.J.; Lenz, T.I.; Zanne, A.E. Sapwood capacitance is greater in evergreen sclerophyll species growing in high compared to low-rainfall environments. Funct. Ecol. 2014, 28, 734–744. [Google Scholar] [CrossRef]
Figure 1. Environmental conditions for three climatic zones among NZHP (a), CHS (b) and CJGS (c) over two years. Values are: total daily precipitation (mm); minimum (grey line) and maximum (black line) temperature (T °C); daily maximum PAR (µmol m−2 s−1); daily average VPD (kPa).
Forests 12 00161 g001
Figure 2. Seasonal course of daily max sap flow density for six dominant species at our research site during two years of study period. Dashed line in each panel represents average value for that species.
Forests 12 00161 g002
Figure 3. Average diurnal patterns of Fd at the outer most sapwood area on our sample trees for six dominant species during two years of study period. Error bars represent ± standard error. Winter Fd patterns for L. formosana, Q. acutissima and Q. variabills are not available because measurements were suspended during winter time at CJGS research site.
Forests 12 00161 g003
Figure 4. Maximum daily sap flow density comparison for six species. Circles indicate outliers or data points outside the whiskers, notches show approximately 95% confidence intervals around the medians. Groups with the same letter have similar means determined by a Tukey’s post hoc test.
Forests 12 00161 g004
Figure 5. Daily stand scale transpiration of four research sites during the study period.
Forests 12 00161 g005
Figure 6. Relationship between DBH and daily whole tree water use with standard error for sample trees in each site during two-year period. We transformed DBH values for each stand to allow comparison across the sites.
Forests 12 00161 g006
Table 1. Details of study sites including location, study period, climate and forest characteristics with trees ≥ 3 cm DBH at each stand. The presented values are means ± SE.
SiteNew Zealand
NZHP
South ChinaCentral China
CJGS
CHSSCHSA
Location36°47.7′ S
174°29.5′ E
22°41′ N, 112°54′ E31°46′–31°52′ N
114°01′–114°06′ E
Study periodJuly 2016–June 2018
24 months
January 2017–November 2018
23 months
April–November 2014, April–October 2015
15 months
Annual mean temperature (°C)14.221.915.2
Annual rainfall (mm)123115801119
Plot size (m2)200090016001600
Stand DBH (cm)26.2 ± 2.120.4 ± 0.823.9 ± 1.112.6 ± 0.2
Stand height(m)19.8 ± 1.612.5 ± 0.414.8 ± 0.512.1 ± 0.2
Tree density (N ha−1)770867519446
Stand basal area (m2 ha−1)943126.255.6
Table 2. Biological traits for six species used in this study. Wood density (WD), leaf nitrogen content (N) and carbon content (C), leaf stomatal conductance (gs), leaf carbon isotope ratio (δ13C), photosynthetic rate (A), xylem water potential at 50% loss of hydraulic conductance (P50), minimum leaf water potential (Ψ-min), specific leaf area (SLA), the maximum leaf area index (LAI) are shown. Letter ‘s’ represents data from seedlings. Letters c, d and r represent conifer, the diffuse porous and ring porous wood characteristics respectively. An x represents no data available.
Biological TraitsA. australisS. wallichiiA. mangiumL. formosanaQ. acutissimaQ. variabilis
Wood type
WD (g/cm3)
c
0.45
d
0.60
d
0.46
d
0.59
r
0.91
r
0.82
N (%)0.731.722.531.892.342.25
C (%)51.1547.8749.1542.1545.5745.71
gs (mmol/m2/s1) 130–158130350120(s)×100–400
δ13C (‰)−26.28−31.40−33.60−30.0−30.7−30.0
A (µmol/m2/s)8.20 7.009.6712.63(s)9.412.56–14.54(s)
P50 (MPa)−2.32−2.8×−3.5−3.39×
Ψ-min (MPa)−(1.2–1.5)−(1.2–1.7)−(1.6)−(1.7–2.3)−(1.7–1.9)×
SLA (cm2/g−1) 27.3××238.2166.9143.1
LAI ×3.92.8×××
Table 3. Overview of sapwood area equations for six studied species and average tree height and tree size of sample trees at each site. Values are mean ± SE.
SitesSpeciesSample TreesHeight
(m)
DBH
(cm)
As e Equation Reference
NZHPA. australis623.5 ± 0.883.6 ± 24.40.2971 × DBH1.4226[7,44]
CHSS. wallichii1512.85 ± 0.4320.3 ± 1.30.2077 × DBH2.2168[37]
A. mangium1514.61 ± 0.6328.48 ± 1.780.4936 × DBH1.761
CJGSL. formosana617.4 ± 2.118.8 ± 3.80.0068 × exp 0.0677DBH[39,45]
Q. acutissima1125.7 ± 1.040.3 ± 2.60.0071 × exp 0.0512DBH
Q. variabilis724.0 ± 1.240.7 ± 2.60.0083 × exp 0.0495DBH
Table 4. The first three principal components describing the daily sap flow of four research forest stands over two years of study period. Eigenvalues, variance explained (%) and correlations between each variable and principle component are loaded. The strongest term for each component is shown in bold.
CategoryNZHPCHSSCHSACJGS
PC1PC2PC3PC1PC2PC3PC1PC2PC3PC1PC2PC3
Eigenvalue1.761.250.961.701.370.961.641.340.991.781.080.92
Variance
(%)
44.4422.2423.3041.2726.8113.1138.5025.5814.0152.7619.5513.90
Cum.var (%) 80.00 81.19 78.10 86.22
Variables Loadings
Tem0.3510.5000.2850.564−0.020−0.0050.5730.111−0.0040.451−0.3920.204
PAR0.435−0.183−0.0970.471−0.240−0.0360.520−0.110−0.1060.501−0.1340.103
VPD0.5120.1880.0220.370−0.497−0.1700.472−0.383−0.1310.532−0.0270.145
Rain−0.3140.1170.7480.0430.4930.538−0.0380.487−0.250−0.274−0.2550.876
RH−0.3960.476−0.0020.1990.5870.3480.0720.6440.292−0.429−0.3390.004
VMC−0.399−0.218−0.3060.3410.259−0.5300.0990.3070.806xxx
wind0.084−0.0630.506−0.407−0.201−0.527−0.403−0.287−0.4180.0520.8050.399
Table 5. Results of multiple linear regression for daily whole tree water use over two years of study period at each site. Daily PAR, daily VPD, daily temperature, daily RH, total rain, wind speed and daily VMC (if available) are shown. For JGS, we used average whole tree water use for three species here because of the weak relationship between predicted variables and whole tree water use.
SitesVariablesEstimatep ValuePartial R2
NZHP(Intercept)−1.071<0.0010.607
PAR0.0406<0.0010.386
VPD11.43<0.0010.488
T
RH
−0.8699
0.0797
<0.001
<0.001
0.0896
0.1038
VMC0.5095<0.0010.1036
P−0.1355<0.0010.205
Wind−5.842<0.0010.0004
CHSS(Intercept)−1.5678<0.050.6601
PAR0.0073<0.0010.4645
VPD5.991<0.0010.3969
T0.0817<0.050.2372
VMC0.0484<0.050.0504
CHSA(Intercept)0.84100.74000.4562
PAR0.0039<0.010.2377
VPD4.9375<0.0010.3023
T
RH
0.4816
−0.0108
<0.001
<0.001
0.1564
0.0577
VMC0.2483<0.0010.0439
CJGS(Intercept)0.4163<0.010.4977
PAR0.0017<0.0010.3895
VPD0.4959<0.0010.3644
T0.0279<0.0010.2474
P−0.0089<0.050.0952
Wind−0.2431<0.0010.0035
Table 6. Parameters for the Exponential Saturation Model Fd = a (1 − expbx) for six species, where a and b are the fitted parameters.
Species Fd vs. VPDFd vs. PAR
nabpabp
A. australis618.730.67<0.0011.330.0016<0.001
S. wallichii1538.150.71<0.0015.610.0015<0.001
A. mangium1541.231.89<0.0014.260.0035<0.001
L. formosana644.251.09<0.0015.080.0011<0.001
Q. acutissima1235.941.68<0.0013.810.0018<0.001
Q. variabilis735.112.26<0.0014.010.0016<0.001
Publisher’s Note: MDPI stays neutral with regard to jurisdictional claims in published maps and institutional affiliations.

