Method of Estimating Degraded Forest Area: Cases from Dominant Tree Species from Guangdong and Tibet in China
by
 ,
,
Biyun Wu
1,2, 
Xiang Meng
1,2,
Qiaolin Ye
3,
Ram P. Sharma
4 ,
,
Guangshuang Duan
1,2,
Yuancai Lei
1,2 and
Liyong Fu
1,2,* 1
Research Institute of Forest Resource Information Techniques, Chinese Academy of Forestry, Beijing 100091, China
2
Key Laboratory of Forest Management and Growth Modeling, National Forestry and Grassland Administration, Beijing 100091, China
3
College of Information Science and Technology, Nanjing Forestry University, Nanjing 210037, China
4
Institute of Forestry, Tribhuwan University, Kritipur, Kathmandu 44600, Nepal
*
Author to whom correspondence should be addressed.
Forests 2020, 11(9), 930; https://doi.org/10.3390/f11090930
Submission received: 27 June 2020
/
Revised: 17 August 2020
/
Accepted: 19 August 2020
/
Published: 26 August 2020
(This article belongs to the Section Forest Ecology and Management)
Abstract
:Forest degradation has been considered as one of the main causes of climate change in recent years. The knowledge of estimating degraded forest areas without the application of remote sensing tools can be useful in finding solutions to resolve degradation problems through appropriate restoration methods. Using the existing knowledge through literature review and field-based primary information, we generated new knowledge by combining the information obtained from multi-criteria decision analyses with an analytic hierarchy process, and this was then used to estimate degraded forest area. Estimation involves determining forest degradation index (FDI) and degradation threshold. Continuous inventory data of permanent sample plots collected from degraded forests, consisting of various forest types divided by dominant tree species in the Guangdong province and Tibet autonomous region of China, were used for the purposes. We identified four different forest degradation levels through the determination and comprehensive evaluation of FDI. The degraded forest area with broad-leaved species as dominant tree species in the Guangdong province was estimated to be 83.3% of a total forest area of 24,037 km2. In the same province, the degraded forest area with eucalyptus as a dominant tree species was 59.5% of a total forest area of 18,665 km2. In the Tibet autonomous region, the degraded forest area with spruce as a dominant tree species was 99.1% of a total forest area of 17,614 km2, and with fir as a dominant tree species, the degraded area was 98.4% of a forest area of 12,103 km2. A sampling accuracy of forest areas with national forest inventory was about 95% in both provinces. Our study concludes that the FDI method used has a certain scientific rationality in estimating degraded forest area. The forest provides a variety of tangible and intangible goods and services for humans. Therefore, forest management should focus on the improvement of its overall productivity, which is only possible with improving forest site quality. One of the important steps to improve the quality of a forest site is to resolve its degradation issues. The presented method in this article will be useful in finding the solutions to forest degradation problems. This method, which does not need any remote sensing tool, is simple and can be easily applied for estimating any degraded forest area and developing effective forest restoration plans.
1. Introduction
Forests and their associated biodiversity provide people with a wide range of products and services [1]. The State of the World’s Forests 2020 confirmed that deforestation and forest degradation continued to occur rapidly, which greatly led to the continuous loss of biodiversity [2]. Carbon emission from forest degradation is currently considered as one of the main causes of climate change, and therefore deforestation and forest degradation have been becoming much more burning issues among international communities [3]. Reducing emissions from deforestation and forest degradation (REDD+), enhancing forest carbon stocks, conservation and the sustainable management of forests in developing countries are the key components of the United Nations Framework Convention on Climate Change [4]. To carry out the REDD+ project, it is necessary to have a scientific understanding of the definition, connotation, monitoring and evaluation of forest degradation, and analyze the status quo and development trend of forest degradation in China [5]. However, only few studies exist so far in China, which intend to assess forest degradation from the perspective of forest ecosystem productivity.
Assessing forest degradation is a very complex issue, as none of the universally accepted standard definitions of forest degradation exist, and definition are always based on the objectives of intended research and the functionalities of forests in questions [6]. The International Union of Forest Research Organizations [7] states that forest degradation is the damage of soil quality and potential productivity of forests caused by improper land uses or management practices. The Convention on Biological Diversity argues that degraded forests could maintain only a limited biodiversity and ecosystem functioning [8]. The Food and Agriculture Organization of the United Nations [9] and the International Tropical Timber Organization [10] regard forest degradation as a decline in the ability of forests to produce forest products and provide ecosystem services. The Intergovernmental Panel on Climate Change [11] considers forest degradation as a long-term loss of the forest carbon stocks caused by anthropogenic activities. Chinese researchers have also put forward the definition of forest degradation—for example, Ma et al. [12] defined forest degradation as a destruction of forest structures and functions under anthropogenic and natural interference.
As mentioned above, the definition of forest degradation could largely vary, and therefore methods of assessing forest degradation may be based on the objectives of an intended study. For example, sustainable forest management (SFM) requires the methods and approaches that recognize numerous parameters and conflicting objectives and constraints or multiple criteria. The SFM requires decision-making approaches that examine the trade-offs between competing and conflicting managing objectives (e.g., timber harvesting, biodiversity conservation, recreation, watershed protection, wildlife conservation), according to the economic, environmental, and social dimension of sustainability. The multi-criteria decision analysis (MCDA) enables decision-makers to evaluate alternatives by explicitly considering the multiple criteria. The methods and procedures of MCDA have been widely used to address forest resource management issues [13] and continue to be used in the work of some studies in natural resource management [14,15]. The analytic hierarchy process (AHP) can solve decision-making problems by obtaining the weight of relative alternatives according to the appropriate hierarchy [16,17]. Since its first application [18], AHP has been widely used in forest planning and management. The AHP uses the pairwise comparison matrix (PCM) to obtain measurement scales of the tangible and intangible factors effectively, overcoming the human difficulty in simultaneously evaluating the importance of all the factors involved [19]. In this article, the forest degradation index (FDI) proposed by Modica et al. [19] to judge the degree of forest degradation was selected for evaluation. The FDI is a stand level index and is calculated using the multi-criteria decision analysis with analytic hierarchy process (AHP–MCDA) approach.
According to the existing definition, this study puts forward the definition of forest degradation according to the situation in China. From the perspective of databases and practical applications, the evaluation indicators suitable for evaluating forest degradation are selected, and the method for calculating the area of degraded forest in China is determined. Taking two forest types divided by dominant tree species in two provinces of China as examples, respectively, the degraded forest area is calculated, which provides a reference for evaluating forest degradation research in the future.
2. Materials and Methods
2.1. Study Sites
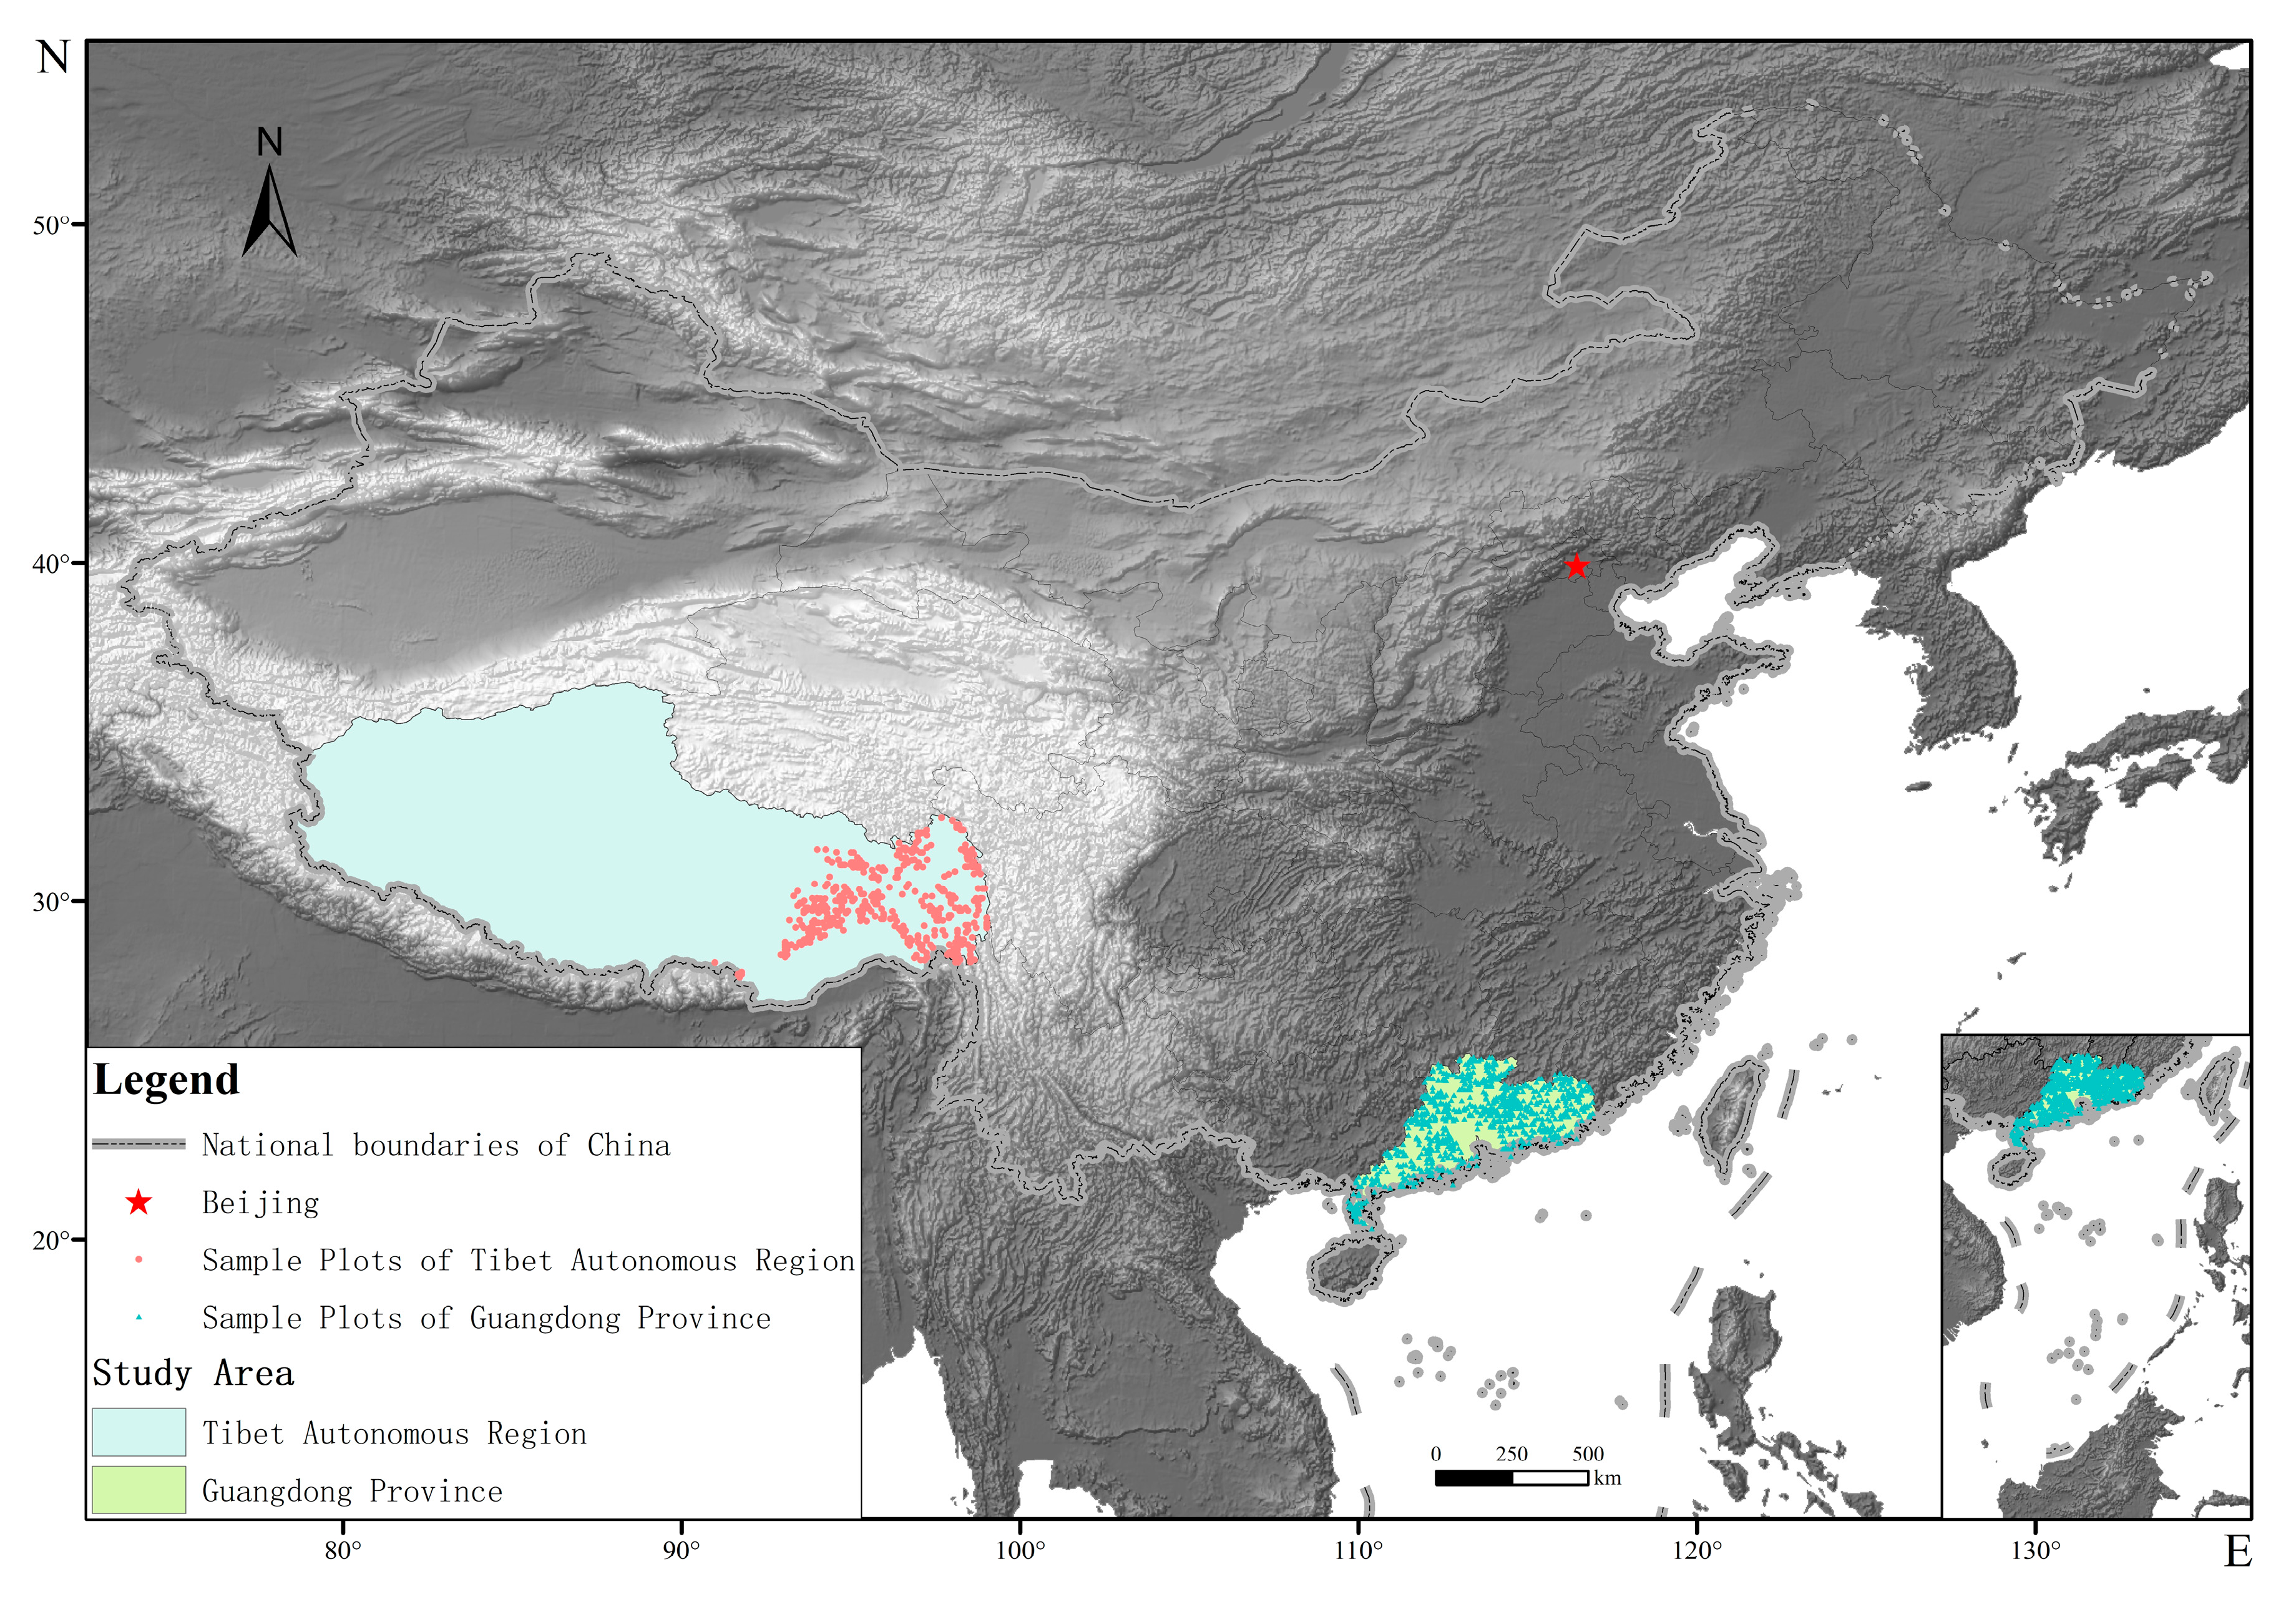
The study sites are located in the Guangdong province and Tibet autonomous region in China (Figure 1). The Guangdong province has a land area of 179,725 km2. It is located in the southernmost part of mainland China and belongs to the East Asian monsoon region. From north to south, three climatic zones—central subtropical zone, south subtropical zone and tropical zone—are present. The province’s average annual precipitation is 1771 mm. It is rich in sun light, heat, and water resources. Its main forest types divided by dominant species are broad-leaved mixed forest (including Liquidambar formosana and Cinnamomum camphora and other species) and eucalyptus forest (website: http://www.gd.gov.cn/, April 2020).
The Tibet autonomous region has a land area of 1,228,400 km2. The region is located in the southwest border of China, with a climate varying from southeast to northwest successively including: tropical zone, subtropical zone, plateau temperate zone, plateau sub-fridge zone, plateau fridge zone and others. The annual precipitation is between 66.3–894.5 mm. Territory is sparsely populated and has abundant resources. Its main forest types divided by dominant species are spruce forest and fir forest (website: http://www.xizang.gov.cn/, April 2020).
2.2. Data
Since the late 1970s, China has conducted a systematic national forest inventory almost every five years [20]. The data used in this study were obtained from the seventh, eighth and ninth surveys of national forest inventory. The survey years in the Guangdong province are 2007 (seventh), 2012 (eighth) and 2017 (nineth), while those in Tibet autonomous region are 2006 (seventh), 2011 (eighth) and 2016 (nineth). The permanent sample plots (hereafter termed as sample plots) were established throughout the Guangdong province and Tibet autonomous region. Each sample plot with an area of 0.0667 ha was measured for various forest attributes, which were then used to compute different stand indices—namely, forest stand volume, number of living standing trees, number of recruitment trees [21,22], number of tree species, stand canopy, and forest disaster level. We only considered the sample plots, which satisfied the following conditions for estimating degraded forest area: (1) arboreal forest lands; (2) latest survey data not showing zero as a forest accumulation. A total of 731 sample plots in the Guangdong province and 405 sample plots in the Tibet autonomous region were eventually used and two forest types divided by dominant species in each region were used for estimating the degraded forest area. In the national forest inventory, the dominant tree species in the sample plots are the tree species which account for more than 65% of the forest volume in the sample plots. The sample plots of the same dominant tree species in the same province were calculated as a forest type. The forest types considered in Guangdong province were broad-leaved mixed forest and eucalyptus forest, while those in the Tibet autonomous region were spruce forest and fir forest.
2.3. New Definition of Degraded Forest
Combined with the definitions of forest degradation at home and abroad in the introduction and current forest conditions in China, this study defined degraded forest as a “forest that is affected by man-made or natural factors, resulting in forest productivity or ecological service function that is continuously lower than the average level of similar stands at the same stage of development under the same forest sites, and it is difficult to recover itself to natural stage in a short term”. According to this definition, there would be some forest degradation indicators that can be easily measurable, repeatable and ecologically meaningful, and can provide quantitative information. A comprehensive index, FDI is needed to integrate the above-mentioned indicators to evaluate forest degradation [6,23,24,25].
2.4. Forest Degradation Index (FDI)
In order to determine the FDI, we selected five indicators where each indicator can evaluate the status of forest degradation based on national forest inventory data. The approach of the AHP–MCDA was applied to obtain the weight of each indicator and their combination with the normalized values were used to determine FDI.
2.5. Indicators
2.5.1. Forest Accumulation Growth Rate (FAGR)
It is necessary to have the quantitative information of the growing stock, which helps in understanding the ecological dynamics and productive capacity of forests and managing forests within the context of sustainable production. The estimation of the loss or gain (increment) in the growing stock over time can be used as a quantitative indicator of forest degradation. Decline in the growing stock indicates forest degradation, but long-term monitoring is required [26].
The FAGR [24] refers to the 10-year standing net growth rate of each sample plot. We used the following formula to compute this indicator:
where is the 10-year FAGR of a sample plot, is the forest stand volume (m3 ha−1) of the seventh survey of the permanent sample plots, and is the forest stand volume (m3 ha−1) of the ninth survey of the permanent sample plots.
2.5.2. Forest Recruitment Rate (FRR)
Recruitment is usually quantified by the number of trees or saplings reaching or exceeding a certain threshold size (e.g., 1.3 m height, 5 cm DBH over bark, etc.) in a certain period of time [21,22]. The stand recruitment process plays an important role in the study of forest volume at multiple levels. If we do not consider the stand recruitment process, it is impossible to accurately predict future stand growth and harvest [27].
The FRR [28] refers to the ratio of the number of recruitment trees to the number of living standing trees in the sample plot during the 10-year survey period of the national forest inventory. We used the following formula to calculate this indicator:
where is FRR of forests during the 10-year period of the permanent plots of national forest inventory, is the number of trees (number of plants per 0.0667 ha) in the threshold value within the 10-year period compared with the seventh survey of the national forest inventory, an is the seventh survey number of the live trees in a permanent sample plot (number of plants per 0.0667 ha).
2.5.3. Tree Species Reduction Rate (TSRR)
Biodiversity can also be used to determine the amount of forest degradation. Biodiversity provides the important ecosystem services. For example, complex species composition can improve forest resilience and reduce the origin and spreading of diseases. The loss of biodiversity reduces the ecosystem functions and services [29,30].
The species reduction rate [28] refers to the ratio of the number of tree species reduced in the sample plots to the total number of tree species at the beginning of the survey during the 10-year survey period of the national forest inventory. We used the following formula to calculate this indicator:
where is the rate of TSR in the permanent plots of national forest inventory, is the number of tree species in the preliminary survey (seventh survey) of the permanent sample plots of national forest inventory, and is the number of tree species reduced within 10 years of the permanent plots of national forest inventory (number of tree species in the seventh survey minus number of tree species in the ninth survey).
2.5.4. Forest Canopy Cover Reduction Rate (FCCRR)
Forest canopy cover is defined as a proportion of the forest floor covered by the vertical projection of the canopy. Canopy is one of the main factors determining forest microhabitats. It affects the growth and survival of plants, thus determining the nature of vegetation and the habitat of wildlife [31]. In this study, the canopy projection method is the main method available for measuring canopy closure degree. This is an accurate method to investigate canopy density [32].
The FCCRR [28] refers to the ratio of the amount of canopy reduction in the sample plots during the 10-year survey period of national forest inventory to the canopy closure degree of the sample plots in the initial survey period. We used the following formula to calculate this indicator:
where is the reduction rate of forest canopy closure in permanent sample plot of national forest inventory, is the forest canopy closure degree in the previous survey (seventh survey) of the permanent sample plots, and is the reduction of stand density in a permanent plot in 10 years (stand canopy of the seventh survey minus stand canopy of the ninth survey).
2.5.5. Forest Disaster Level (FDL)
A variety of the native and exotic insects and diseases affect the forest ecosystem [33]. The occurrence of forest disasters would lead to the destruction of forest ecological environment. If the disasters continue to occur and show an increasing trend, the damage of forest ecological environment could worsen or even become increasingly serious ecological problems, which in turn pose a serious threat to the survival of human beings.
The FDL [28] refers to the severity of forests that are subject to pests, diseases, fires, and other natural disasters. Based on the percentage of trees on the damaged site as a percentage of the total number of plants, the national forest inventory divided disaster levels into four—free, minor, moderate, and severe—which are represented by 0–3, and the expression is as follows:
2.6. Normalizing the Indicators
In order to avoid numerical difficulties in the process of calculation, the normalization method is adopted [34,35]. A common method, min–max normalization, was used in this research [36]. We normalized each of the above-mentioned indicators using certain rules. The distribution of the minimum and maximum values for the indicators keeps the original distribution of fractions other than the scaling factor, and distributed between [0, 1] [19].
2.6.1. Normalizing the FAGR and FRR
We normalized the FAGR using the following formula:
where is the normalized FAGR of the ith permanent plot, is the FAGR of the ith permanent sample plot, and is the maximum value of the FAGR in all sample plots of a certain type of unit (different dominant species), and is the minimum FAGR in all plots of a certain type of unit (different dominant species). The method used for normalizing the FRR was the same as for normalizing the FAGR.
2.6.2. Normalizing the TSRR, FCCRR, and FDL
We used the following formula to normalize the TSRR:
where is the normalized value of TSRR in the th permanent sample plot, is the TSRR of the th permanent sample plot, and is the maximum reduction rate of tree species in all plots of a certain type of unit (different dominant species), is the minimum reduction rate of tree species in all plots of a certain type of unit (different dominant species). The methods of normalization of the reduction rate of stand closure degree and FDL were used in the same way as for normalization of the reduction rate of tree species.
2.7. Weighting the Indicators
Following these steps, we used the AHP to weigh the indicators [16,17]. In the process of AHP, the decision-making problem was taken as the overall goal, and the problem was decomposed into different sub-criteria, and finally reached the lowest level of hierarchy (the scheme for decision-making).
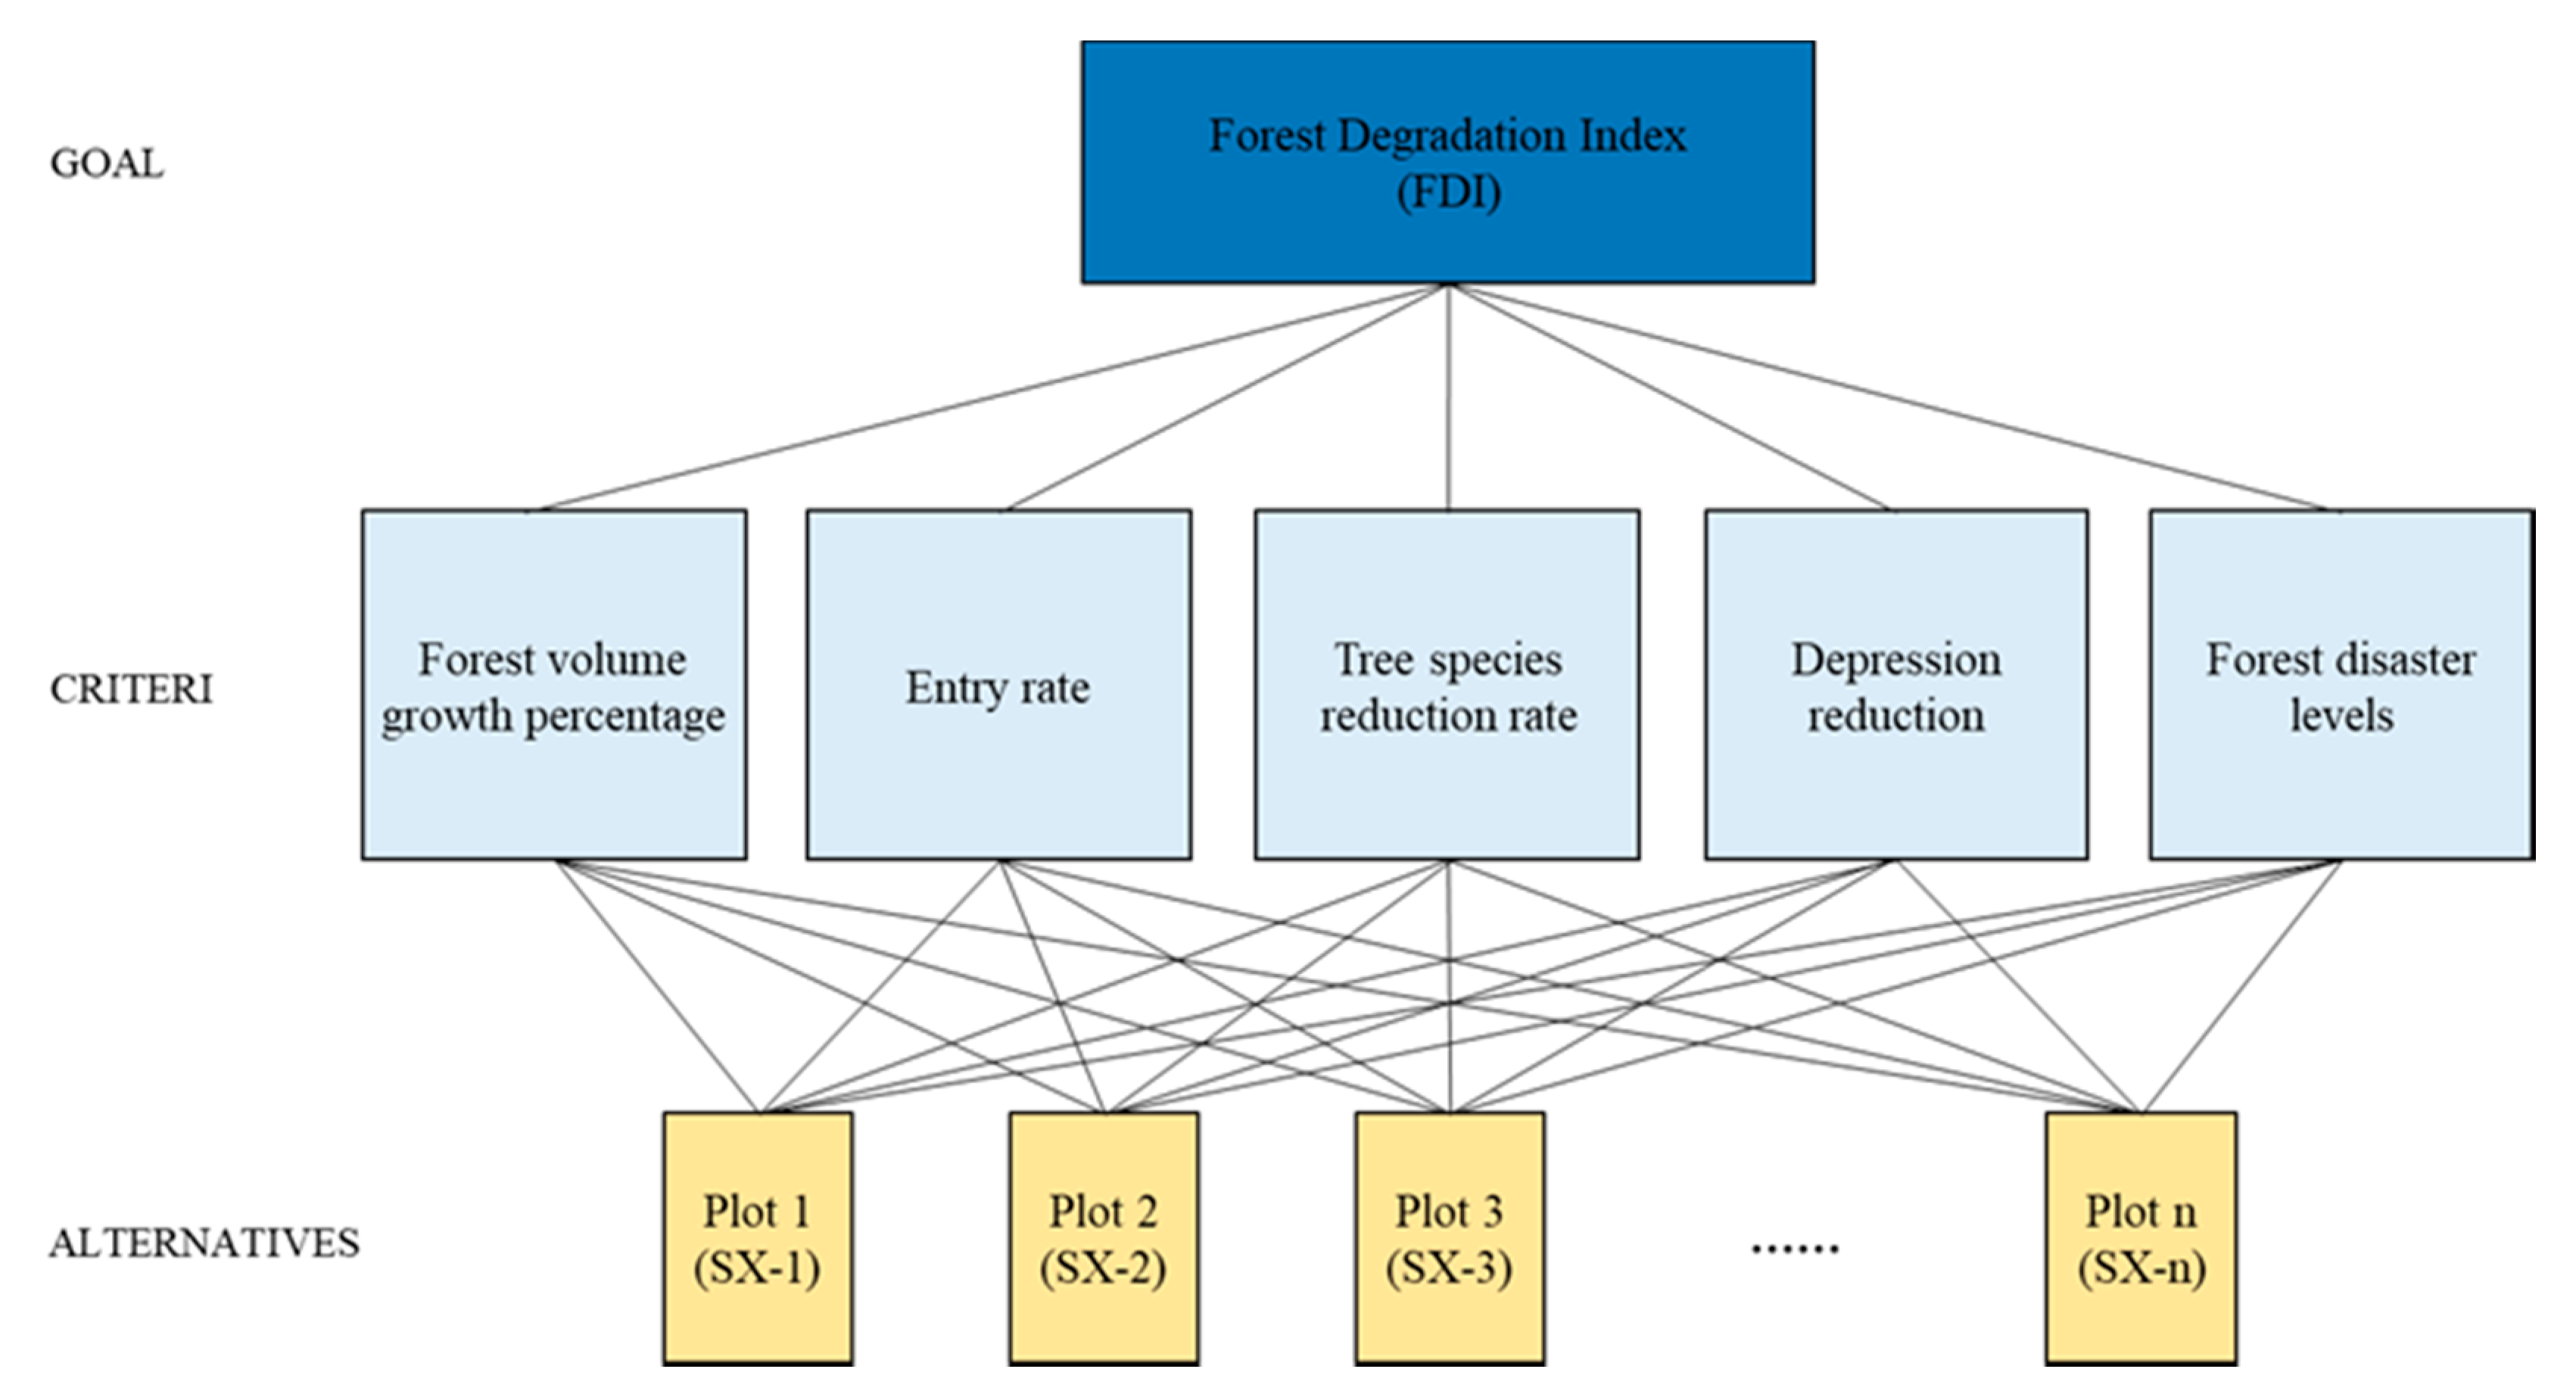
2.7.1. Building the Hierarchy Model
A decision tree is provided in Figure 2 to show the process of decomposing FDI into different hierarchies. The AHP was used to aggregate the five indicators of FDI, and four forest types in the two provinces were distinguished.
2.7.2. Establishing Pairwise Comparison Matrix (PCM)
We asked 22 experts in forestry from Chinese Academy of Forestry in Beijing to grade the expert rating scale, which we found very helpful to obtain the relative importance of the different indicators for determining FDI. According to the indicator reference table (Table 1), each expert was asked to fill in an assigned scoring table (Table 2), and a PCM was obtained by Equation (8), which is represented by the letter A [37].
where is the PCM and is the ratio of the importance of element i to element j.
2.7.3. Calculating Weight of Each Indicator
We used the eigenvalue method to calculate the weight of each indicator [17]. The maximum eigenvalue of each matrix and its corresponding eigenvector were calculated. Each element of the eigenvector gives the experts the corresponding weight of five indicators.
where is the largest characteristic root of A and is the corresponding feature vector.
2.7.4. Consistency Test
We used the following steps to make the consistency test, which checked the consistency of each expert’s judgment, eliminated the inconsistent matrices, and did not participate for the indicator to be used for weight calculation.
- a.
- Calculating the consistency index (CI):
The CI can measure the deviation degree of judging PCM consistency [17].
where is the maximum eigenvalue of the reciprocal matrix A of the expert scoring table, and n = 5 is the dimension of the matrix.
- b.
- Finding the corresponding random index (RI)
Satty [39] conducted 500 simulation experiments and obtained the following results (Table 3), which we used as a basis for obtaining the consistency ratio (CR).
- c.
- Calculating the consistency ratio (CR)
The CR allows us to evaluate the overall consistency of all paired comparison judgments provided by the experts [38].
- d.
- If the CR value was <0.10, the expert’s judgment was assumed to be consistent, otherwise it was an invalid value [39].
2.7.5. Aggregating by Means of Geometric Mean
Following the aggregating individual judgment approach [40], we calculated the geometric mean of all the valid indicators weights (i = 1, 2, …, n, n is the number of valid experts):
2.7.6. Standardization of Indicator Weights
We standardized the five elements in the weight vector to make a sum of 1, and we got . Each element in is the final weight of FAGR, FRR, TSRR, FCCRR, and FDL.
Take as an example:
where is the weight of FAGR; is the weight of FRR; is the weight of TSRR; is the weight of FCCRR; is the weight of FDL; and is the weight of FAGR after standardization.
2.8. Data Aggregation
We constructed the evaluation grades of forest degradation using FAGR (), FRR (), TSRR (), FCCRR (), FDL (), and corresponding indicator weights as comprehensive indicators:
where FDI is the forest degradation index of the th sample plot, 10 is a correction factor in order to obtain the [0, 10] range of FDI, 5 is the number of input variables (i.e., five indicators of degraded forest), is the th indicator of the th sample plot, and j = 1, 2, 3, 4, 5 represents cumulative periodic net growth rate, FRR, TSRR, FCCRR, and FDL; is the weight corresponding to the th indicator.
2.9. Grading Forest Degradation
We divided the value of FDI [0, 10] into four intervals, which are represented by FDI-I, FDI-II, FDI-III, and FDI-IV, each representing a different condition of ecological function, as below:
where FDI-I forests were categorized as “non-degraded” and they were considered to have promising ecological functions; FDI-II forests were categorized “lightly degraded”; FDI-III forests were categorized as “moderately degraded”; FDI-IV forests were categorized as “severely degraded”.
FDI-I: (7–10);
FDI-II: (5–7);
FDI-III: (3–5);
FDI-IV: (0–3).
2.10. Calculating Degraded Forest Area
We used the following formula for calculating the area of regional degraded forest:
where is the degraded forest area of a certain type of unit (different dominant species) in the Guangdong province or Tibet autonomous region, is the total forest area of a certain type of unit (different dominant species) in the Guangdong province or Tibet autonomous region, is the total fixed sample plots calculated by a certain type of unit (different dominant species) in the Guangdong province or Tibet autonomous region, and is the jth degraded grade (j = 1, 2, 3, representing light, medium and heavy grades). The accuracy requirement of forest area in national forest inventory was about 95% for provinces with forest coverage more than 12% [41]. The forest coverage rate of Guangdong and Tibet has exceeded 12% (website: http://www.forestry.gov.cn/, July 2020), so the sampling accuracy of both provinces has reached about 95%. The FDI method could be used to estimate the degradation forest area of a certain type of unit (different dominant species) in other provinces in China, as a reference for China’s degradation forest area.
3. Results
3.1. Weighted Indicator Values
We evaluated forest degradation for our study sites using the AHP methods described in the materials and methods section. We calculated the experts’ scoring tables and aggregated the weighted indicators, , CI and CR by the aggregating individual judgment approach in valid experts’ scoring tables (Table 4).
3.2. Degraded Forest Area and Classification
With the help of calculated FDI we judged the degree of forest degradation in permanent sample plots in the Guangdong province and Tibet autonomous region that meet the calculation requirements by combining the multi-criteria decision analysis with analytic hierarchy process (AHP-MCDA) methods. Based on this, we could also obtain the degradation level of the arboreal forest lands of two forest types divided by dominant tree species in the Guangdong province and two forest types divided by dominant tree species in the Tibet autonomous region. A total of 731 sample plots in the Guangdong province were included in the calculation and results are presented in Table 5. A total of 405 sample plots in the Tibet autonomous region participated in the calculation, and the results are shown in Table 6.
According to the Table 5, the forest degradation level of two forest types divided by dominant tree species in the Guangdong province was judged. Among them, the forest area with broad-leaved species as the dominant species was 24,037 km2, and that of the degraded forest was 20,013.86 km2, accounting for 83.26% of the forest area. The forest area with eucalyptus as the dominant species was 18,665 km2, and the degraded forest area was 11,098.11 km2, accounting for 59.46% of the forest area.
According to Table 6, the degradation level of two forest types divided by dominant tree species in the Tibet autonomous region was judged. Among them, the forest area in which the dominant species is spruce was 17,614 km2, and that of the degraded forest was 17,453.14 km2, accounting for 99.09% of the forest area. The forest area with fir as the dominant species was 12,103 km2, and the degraded forest area was 11,907.79 km2, accounting for 98.39% of the forest area.
A total of 731 sample plots in the Guangdong province and 405 sample plots in the Tibet autonomous region were included in the calculation, and the grade of degraded forests divided by them was combined with FAGR, as shown in Table 7 and Table 8.
A total of 472 sample plots were selected from the forests with broad-leaved species as the dominant species in the Guangdong province, and the FAGR ranking of 404 sample plots was consistent with the forest degradation degree, accounting for 85.59% of all the sample plots. In total, 259 sample plots were selected from the forests with eucalyptus as the dominant species in the Guangdong province, and the FAGR ranking of 221 sample plots was consistent with the degree of forest degradation, accounting for 85.33% of all sample plots.
In total, 219 sample plots were selected from the forests with spruce as the dominant species in the Tibet autonomous region, and the FAGR ranking of 194 sample plots was consistent with the forest degradation degree, accounting for 88.58% of all sample plots. A total of 186 sample plots was selected from the forests with fir as the dominant species in the Tibet autonomous region, and the FAGR ranking of 119 sample plots was consistent with the degree of forest degradation, accounting for 63.98% of all sample plots.
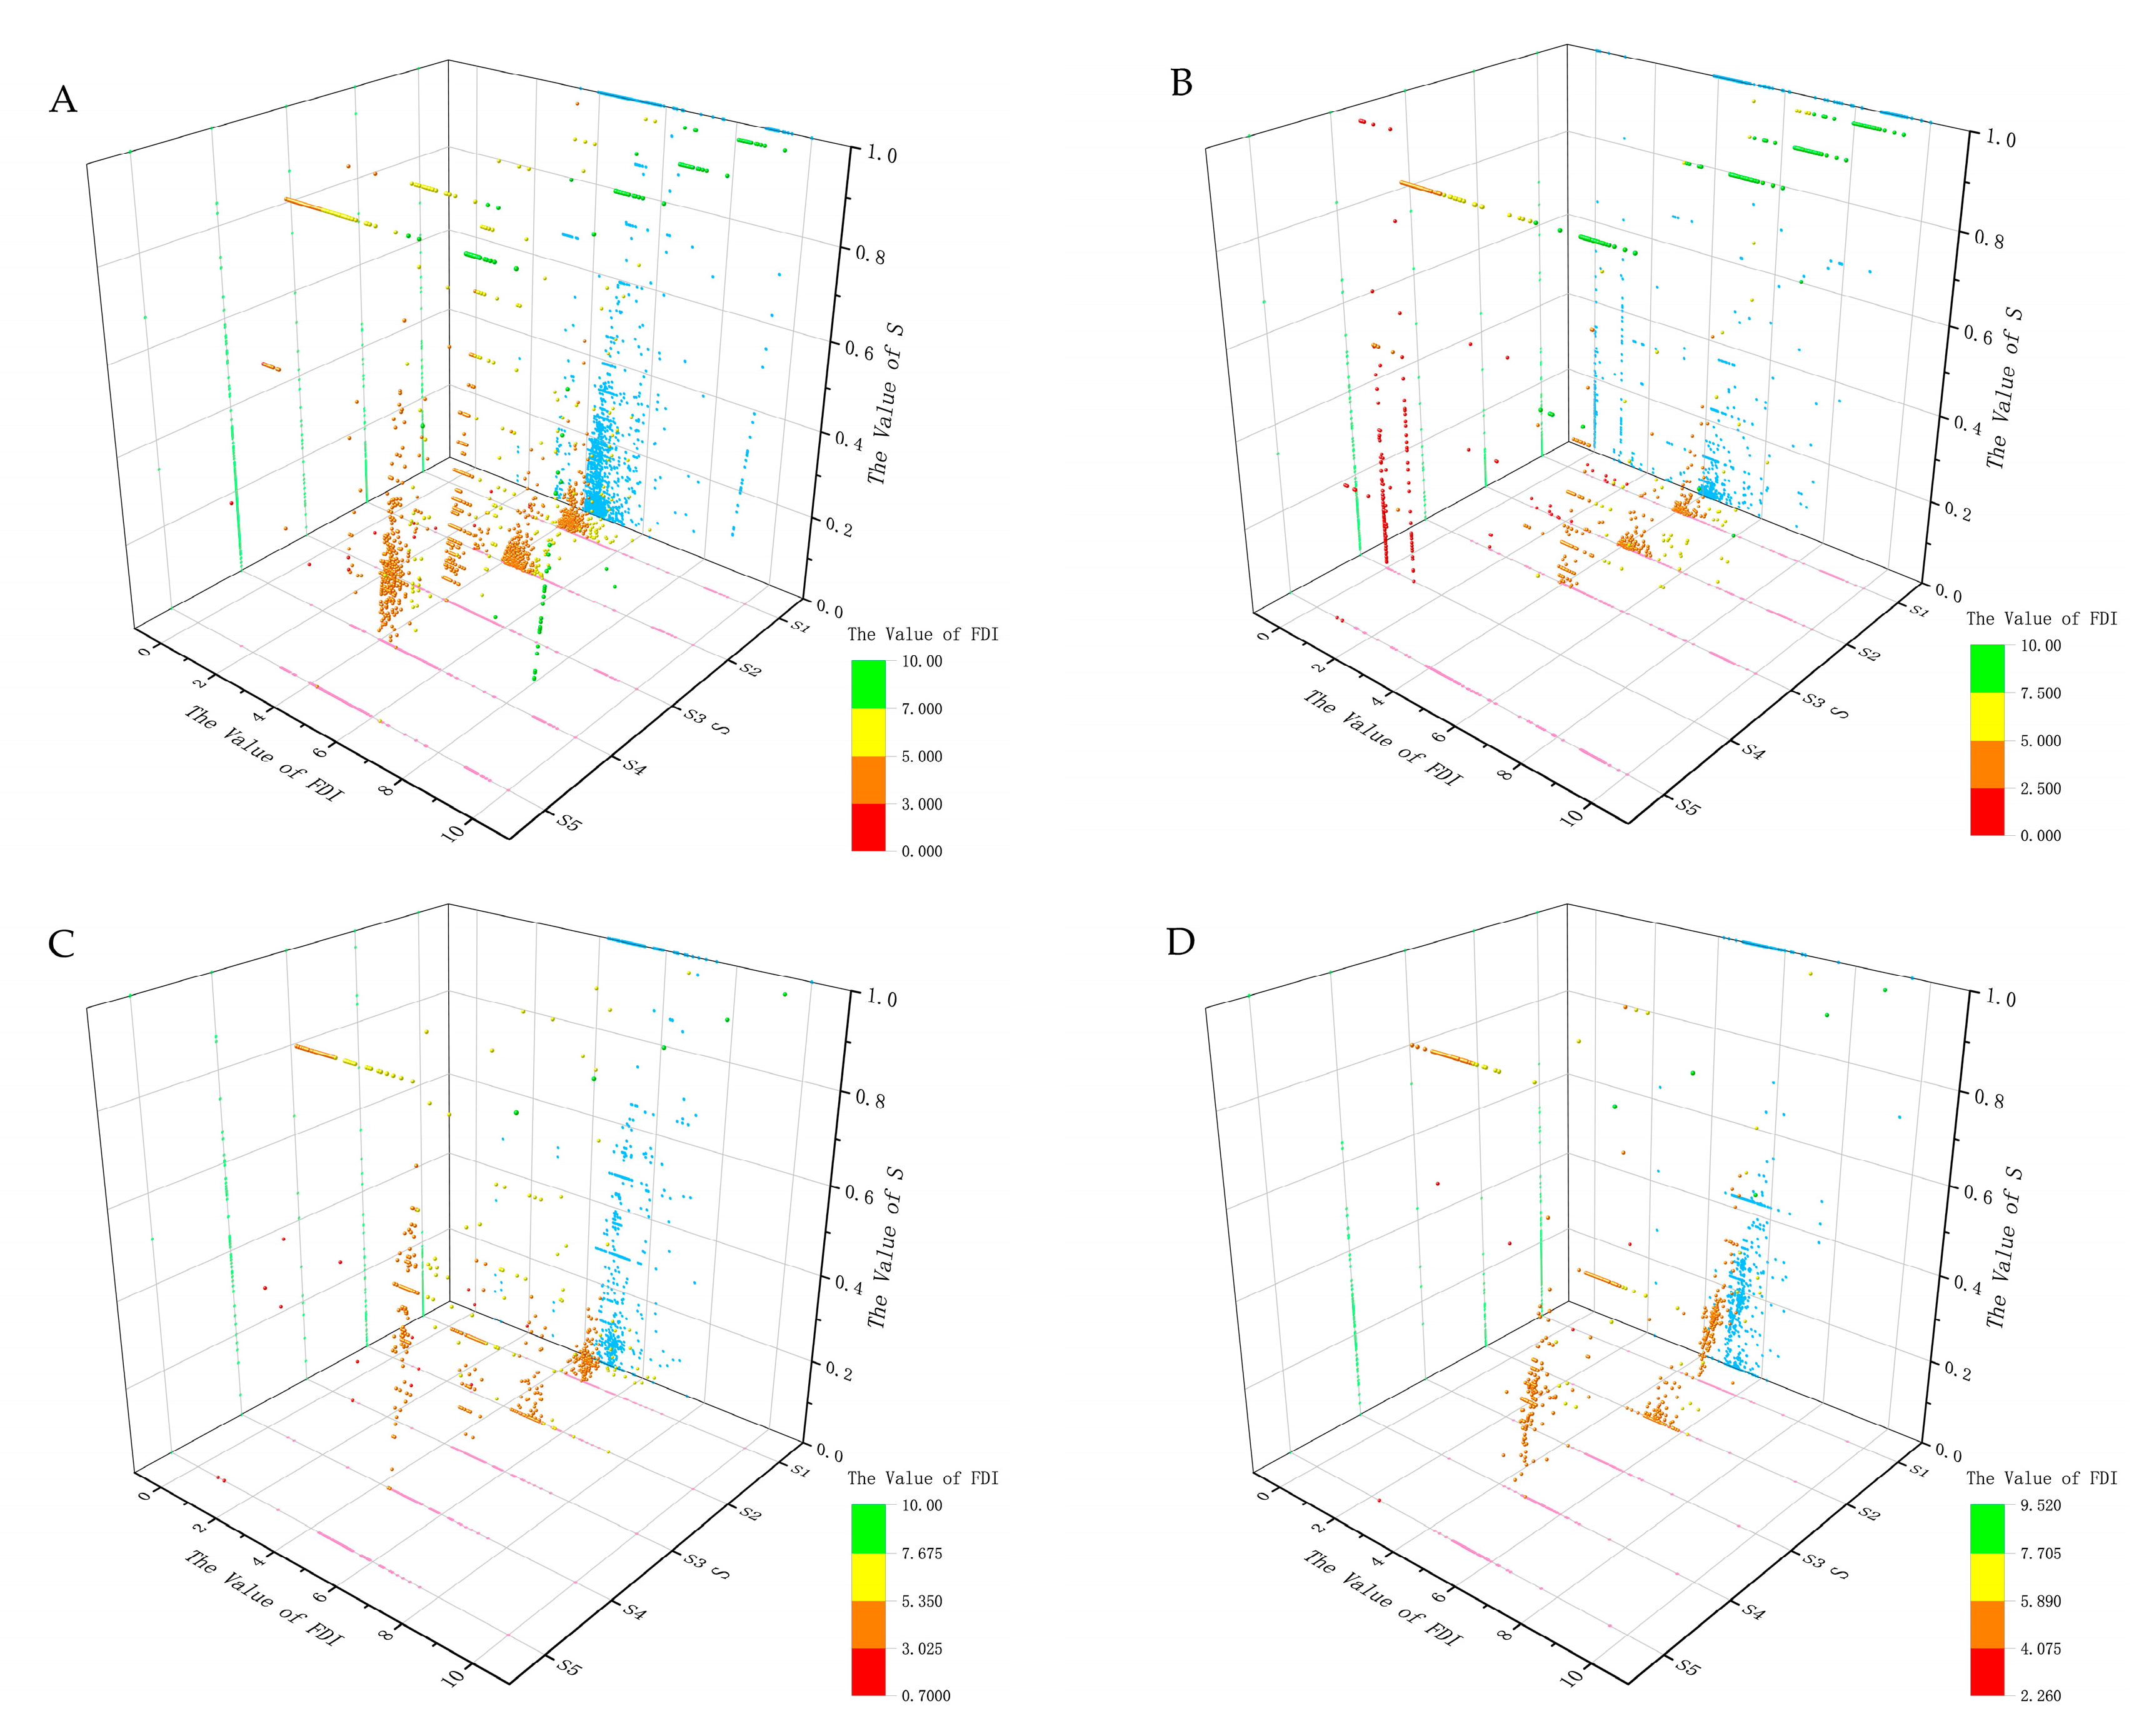
In order to show the relationship between the FDI value of the sample plot and the five indicators values, the distribution of the five indicators of each sample plot is shown in Figure 3. Figure 3A,B show the sample plot with a large distribution of FDI-I (7–10) and FDI-III (3–5), and the indicators of S5 are mainly distributed at both ends of 1, and S1, S2, S3, and S4 are evenly distributed between (0, 1). Figure 3C,D show that the sample plot has a large distribution of FDI-ΙΙ (5–7) and FDI-III (3–5), and the indicators of S5 are mainly distributed at both ends of 1, and S1, S2, S3, S4 are evenly distributed between (0, 0.5).
4. Discussion
According to the results of the weighted indicators scored by experts (Table 4), the order of weight of each indicator is , and experts agreed that forest disaster level could be the most important indicator. This result is consistent with the statement by Simula [42], that the main causes of forest degradation in Asia are fire, excessive logging, diseases and insect pests, which are the key common factors.
Guangdong and Tibet have slightly different forest degradation patterns, with Guangdong having more sample plots of FDI-III (moderate degradation) and FDI-I (no degradation) and Tibet more FDI-II (light degradation) and FDI-III (moderate degradation) (Table 5 and Table 6). This indicates that the overall forest degradation in the Guangdong province is somehow lower than that in the Tibet autonomous region with the two major forest types in each region taken into consideration (broad-leaved mixed forest and eucalyptus forest in Guangdong, and spruce and fir forests in Tibet). The problem of forest degradation in the Guangdong province could be mainly due to the massive level of forest destruction, which includes long-term massive deforestation, expansion of agricultural lands, and forest fires [43]. However, due to the influence of national policy of reducing the environmental degradation and timber shortages caused by forest destruction, the Guangdong province has been making great efforts to restore the degraded forest areas since 1985, and has achieved a great success in reducing forest degradation [44,45,46,47]. Whereas Tibet, as the main body of the Qinghai-Tibet Plateau is more sensitive to the vegetation changes and forest degradation under the influence of climate change and human activities. This may be the reason that this region has become one of the hot spots for global ecological research by virtue of its unique geographical location, ecological environment, and anthropogenic activities [48,49,50,51,52,53]. Global warming may accelerate soil nutrient and moisture loss, which may cause vegetation changes. The combined effects of global warming, rapidly growing human population and urbanization in the region, may lead to forest degradation and vegetation changes [54]. The increase in human population and economic development can increase the output of livestock in the region, and overgrazing may lead to locally increased temperature causing land degradation [55,56]. Teng et al. found the areas that suffer from severe soil erosion in the Hengduan Mountains and the southeastern Himalayas and predicted soil erosion in 2050 would substantially increase [57]. Yue et al. and Wang et al. also got similar results [58,59]. Soil erosion can lead to the reduction in organic matter content, the thinning of soil layers and the deterioration of site conditions. With global warming, the glacial lake breaking debris flow has become one of the main geological disasters in the forest concentrated area of southeast Tibet [60]. Therefore, the above-mentioned factors (e.g., global warming, human activities, etc.) may lead to forest degradation in the Tibet region, which will be a serious problem in the future if the processes are not reversed. Our results indicate this possibility in the region where there are some sample plots with FDI-IV (severe degradation), which are fewer than those in Guangdong, however (Table 5 and Table 6).
It can be seen from Table 7 and Table 8 that the ranking of FAGR values from high to low in sample plots has a high coincidence degree with forest degradation grades from non-degradation to severe degradation. It can also be seen in Figure 3 that the distribution of FAGR values is similar to that of FDI values. This result is consistent with the higher relative weight of FAGR among the five indicators in the AHP method (Table 4). FAGR plays an important role in the evaluation of forest ecosystem function, and is an integral part of many ecological measurement units (carbon fixation and oxygen release function, forest accumulation of nutrients function, etc.) that can represent the ecological complexity of forests, forest dynamics, and potential forest productivity [61,62]. Song calculated the change in ratio of stand volume and area in each province with national forest inventory data, and found that the ratio of stand volume and area in Guangdong had been slightly increasing since the 20th century, whereas there is a downward trend in Tibet. This is also consistent with our finding that forest degradation in Tibet would be more serious than that in the Guangdong province [63]. Our finding, which is also corroborated with that of the previous study, suggests that FAGR can be used as one of the important indicators to evaluate forest degradation. However, a single FAGR value cannot fully reflect the degraded forest grade, because the degraded forest grade is also affected by the other four indicators. Therefore, assessing forest degradation needs a more comprehensive analysis from the perspectives of forest growth, regeneration, diversity, structure and natural disasters [42].
Figure 3 shows that the growth, regeneration, diversity, structure and natural disaster of the severely degraded forest, determined by FDI, are also poor. The growth, regeneration, diversity, structure and natural disasters of non-degraded forest were also better than those of degraded forest. FDI is not determined by a single indicator of forest degradation, but by five indicators to determine the overall quality of the forest by reflecting the comprehensive situation of forest growth, regeneration, diversity, structure and natural disasters. In the sustainable management of forest, it is a main problem to judge the degree of forest degradation. Currently, no widely accepted method is available for evaluating forest degradation accurately [19]. In forest management, MCDA methods have been applied to better meet the many challenges [13,64]. The FDI, by using the approach of the AHP–MCDA, can help evaluate the quality of forest and determine the state of forest, so as to guide the SFM.
Nevertheless, there are still some problems associated with our study that need to be properly resolved in the future. In order to assess the growing changes in forests, a monitoring system that involves duplication requiring consistent measurements is needed. The time span represented by the data used in this study is 15 years (three measurement periods with a 5-year interval), which can reflect the change in the forest status in 15 years. A negative trend, such as severe forest fires, may indicate forest degradation, but long-term monitoring [65] is needed to explain temporary fluctuations. The evaluation indicators selected in this study are based on the feasibility of measurement and reflect the overall situation of the forest. These indicators can be assessed based on the information already collected as a part of a national forest inventory. However, the indicators in this study are still limited [66,67], mainly reflecting the growth of trees in the stand, but not enough to reflect the overall ecological changes. Some indicators (e.g., forest aesthetic values, wildlife risks, etc.), though their measurements are difficult and costly, may still need to be studied in the future [26]. The FAO considers that natural and planted forests may need different sets of indicators [26], as they differently describe the ecological complexities and forest disturbance variabilities. Thus, it is necessary to select suitable indicators according to different forest types for obtaining more precise FDI. Future research on FDI can be further improved with use of additional field data to increase its scope of application.
5. Conclusions
We estimated the area of degraded forests consisting of four forest types divided by dominant tree species using survey data from two important regions of China (Guangdong and Tibet). We used commonly used methods of estimating degradation area, such as the multi-criteria decision analysis with analytic hierarchy process (AHP–MCDA) method. By synthesizing the experts’ judgment on the importance of different indicators, we can get the weight of indicators in decision-making. The AHP–MCDA method can combine evaluations and measurements that reflects not only the impact of different indicators on forest degradation, but also whole forests through comprehensive analysis. Our results show that the FDI can estimate the area of degraded forest quickly and easily. Our results are the fundamental basis for estimating degraded forest areas in other forested regions of similar or different types and evaluating the quality of forests in terms of their productivity (goods and services). Our methods and results will serve as an important basis for developing the appropriate forest management strategies.
There are still some problems that need to be studied more in the future. Using long-term data should avoid short-term fluctuations of forest conditions. According to different forest types, we can consider selecting suitable indicators and corresponding weights to evaluate forest degradation. By specifying the problems, our method can be used to estimate the area of degraded forests elsewhere in the world.
Author Contributions
B.W., X.M., Q.Y., Y.L. and R.P.S. conceived the idea and designed methodology; B.W., X.M., G.D. and L.F. collected data; B.W., X.M., Q.Y. and L.F. analyzed data; B.W., R.P.S. and L.F. wrote the manuscript and contributed critically to improve the manuscript, and gave a final approval for publication. All authors have read and agreed to the published version of the manuscript.
Funding
We would like to thank the National Natural Science Foundations of China (No. 31971653) for the financial support of this study.
Acknowledgments
We are grateful to three anonymous reviewers, who provided the constructive comments and suggestions for improvement of the article.
Conflicts of Interest
The authors declare no competing financial interest.
Data Accessibility
Data used in this study are available from the Chinese Forestry Science Data Center (http://www.cfsdc.org/).
References
- Nilsson, K.; Sangster, M.; Gallis, C.; Hartig, T.; De Vries, S.; Seeland, K.; Schipperijn, J. Forests, Trees and Human Health; Springer Netherlands: Dordrecht, The Nerthland, 2010. [Google Scholar]
- UNEP; FAO. The State of the World’s Forests 2020. Forests, Biodiversity and People; FAO: Rome, Italy, 2020. [Google Scholar]
- Parker, C.; Mitchell, A.; Trivedi, M.; Mardas, N.; Parker, C.; Mitchell, A.; Trivedi, M.; Mardas, N. The Little REDD Book: A Guide to Governmental and Non-Governmental Proposals for Reducing Emissions from Deforestation and Degradation; Global Canopy Programme: Oxford, UK, 2008. [Google Scholar]
- UNFCCC. The Cancun Agreements: Outcome of the Work of the Ad Hoc Working Group on Long-Term Cooperative Action under the Convention; UNFCCC: Cancun, Mexico, 2010. [Google Scholar]
- Lei, J.P.; Xiao, W.F.; Liu, J.F.; Bai, Y.F.; Xin, L. Forest degradation and its evaluation. Sci. Silvae Sin. 2010, 46, 153–157. [Google Scholar]
- Orsi, F.; Geneletti, D.; Newton, A.C. Towards a common set of criteria and indicators to identify forest restoration priorities: An expert panel-based approach. Ecol. Indic. 2011, 11, 337–347. [Google Scholar] [CrossRef]
- Nieuwenhuis, M. Terminology of Forest Management Planning; IUFRO World Series: Vienna, Austria, 2000. [Google Scholar]
- Ian, T.; Patterson, G.; Leiner, S.; Nasi, R.; Ledanff, J.P. Review of the Status and Trends of, and Major Threats to, Forest Biological Diversity; Secretariat of the Convention on Biological Diversity: Montreal, Canada, 2002. [Google Scholar]
- FAO. Proceedings of the Second Expert Meeting on Harmonizing Forest-Related Definitions for Use by Various Stakeholders. Rome, Italy, 11–13 September 2002. [Google Scholar]
- ITTO. ITTO Guidelines for the Restoration, Management and Rehabilitation of Degraded and Secondary Tropical Forests; Itto Policy Development: Yokohama, Japan, 2007. [Google Scholar]
- IPCC. Good Practice Guidance for Land Use, Land-Use Change and Forestry; IPCC/IGES: Hayama, Japan, 2003. [Google Scholar]
- Jiangming, M.; Liu, S.; Shi, Z.; Liu, X. A review on restoration evaluation studies of degraded forest ecosystem. Acta Ecol. Sin. 2010, 30, 3297–3303. [Google Scholar]
- Ananda, J.; Herath, G. A critical review of multi-criteria decision making methods with special reference to forest management and planning. Ecol. Econ. 2009, 68, 2535–2548. [Google Scholar] [CrossRef]
- Mendoza, G.; Martins, H. Multi-criteria decision analysis in natural resource management: A critical review of methods and new modelling paradigms. For. Ecol. Manag. 2006, 230, 1–22. [Google Scholar] [CrossRef]
- Diaz-Balteiro, L.; Romero, C. Making forestry decisions with multiple criteria: A review and an assessment. For. Ecol. Manag. 2008, 255, 3222–3241. [Google Scholar] [CrossRef]
- Saaty, T.L. A scaling method for priorities in hierarchical structures. J. Math. Psychol. 1977, 15, 234–281. [Google Scholar] [CrossRef]
- Saaty, T.L. The Analytic Hierarchy Process: Planning, Priority Setting, Resource Allocation; McGraw-Hill: New York, NY, USA, 1980. [Google Scholar]
- Mendoza, G.; Sprouse, W. Forest Planning and Decision Making under Fuzzy Environments: An Overview and Illustration. For. Sci. 1989, 35, 481–502. [Google Scholar]
- Modica, G.; Merlino, A.; Solano, F.; Mercurio, R. An index for the assessment of degraded Mediterranean forest ecosystems. For. Syst. 2015, 24, 13–2171. [Google Scholar] [CrossRef] [Green Version]
- Du, L.; Zhou, T.; Zou, Z.; Zhao, X.; Huang, K.; Wu, H. Mapping Forest Biomass Using Remote Sensing and National Forest Inventory in China. Forests 2014, 5, 1267–1283. [Google Scholar] [CrossRef] [Green Version]
- Shifley, S.R.; Ek, A.R.; Burk, T.E. A generalized methodology for estimating forest ingrowth at multiple threshold diameters. For. Sci. 1993, 39, 776–798. [Google Scholar]
- Zhang, X.; Lei, Y.; Cai, D.; Liu, F. Predicting tree recruitment with negative binomial mixture models. For. Ecol. Manag. 2012, 270, 209–215. [Google Scholar] [CrossRef]
- Ochoa-Gaona, S.; Kampichler, C.; Jong, B.H.J.D.; Hernández, S.; Geissen, V.; Huerta, E. A multi-criterion index for the evaluation of local tropical forest conditions in Mexico. For. Ecol. Manag. 2010, 260, 618–627. [Google Scholar] [CrossRef]
- Wang, Z.; Daun, C.; Yuan, L.; Rao, J.; Zhou, Z.; Li, J.; Yang, C.; Xu, W. Assessment of the restoration of a degraded semi-humid evergreen broadleaf forest ecosystem by combined single-indicator and comprehensive model method. Ecol. Eng. 2010, 36, 757–767. [Google Scholar] [CrossRef]
- Thompson, I.D.; Guariguata, M.R.; Okabe, K.; Bahamondez, C.; Nasi, R.; Heymell, V.; Sabogal, C. An Operational Framework for Defining and Monitoring Forest Degradation. Ecol. Soc. 2013, 18, 20. [Google Scholar] [CrossRef]
- FAO. Assessing Forest Degradation: Towards the Development of Globally Applicable Guidelines; Forest Resource Assessment Working paper 177; FAO: Rome, Italy, 2011. [Google Scholar]
- Andreassen, K. Development and Yield in Selection Forest; Norsk Institutt for Skogforskning: Aas, Norway, 1994. [Google Scholar]
- Fu, L.; Duan, G.; Wu, B. Technical Programme for Survey and Evaluation of Degraded Forests. 2019. Available online: http://www.cfsdc.org/ (accessed on 8 June 2020).
- Wagg, C.; Bender, S.F.; Widmer, F.; Heijden, M.G.A.V. Soil biodiversity and soil community composition determine ecosystem multifunctionality. Proc. Natl. Acad. Sci. USA 2014, 111, 5266–5270. [Google Scholar] [CrossRef] [Green Version]
- Loreau, M. Biodiversity and Ecosystem Functioning: Current Knowledge and Future Challenges. Science 2001, 294, 804–808. [Google Scholar] [CrossRef] [Green Version]
- Jennings, S.B.; Brown, N.D.; Sheil, D. Assessing forest canopies and understorey illumination: Canopy closure, canopy cover and other measures. Forestry 1999, 72, 59–74. [Google Scholar] [CrossRef]
- Yongning, L.; Binlan, Z.; Shuying, Q.; Shuaiying, L.; Xuanru, H. Review of research and application of forest canopy closure and its measuring methods. World For. Res. 2008, 21, 40–46. [Google Scholar]
- Scarbrough, D.; Juzwik, J. Native and Exotic Insects and Diseases in Forest Ecosystems in the Hoosier-Shawnee Ecological Assessment Area; General Technical Reports: St. Paul, MN, USA, 2004. [Google Scholar]
- Lin, S.W.; Lee, Z.J.; Chen, S.C.; Tseng, T.Y. Parameter determination of support vector machine and feature selection using simulated annealing approach. Appl. Soft Comput. 2008, 8, 1505–1512. [Google Scholar] [CrossRef]
- Shilaskar, S.; Ghatol, A. Feature selection for medical diagnosis: Evaluation for cardiovascular diseases. Expert Syst. Appl. 2013, 40, 4146–4153. [Google Scholar] [CrossRef]
- Long, N.C.; Meesad, P.; Unger, H. A highly accurate firefly based algorithm for heart disease prediction. Expert Syst. Appl. 2015, 42, 8221–8231. [Google Scholar] [CrossRef]
- Finan, J.S.; Hurley, W.J. The analytic hierarchy process: Does adjusting a pairwise comparison matrix to improve the consistency ratio help? Comput. Oper. Res. 1997, 24, 749–755. [Google Scholar] [CrossRef]
- Tummala, V.M.R.; Hong, L. A Note on the Computation of the Mean Random Consistency Index of the Analytic Hierarchy Process (Ahp). Theory Decis. 1998, 44, 221–230. [Google Scholar] [CrossRef]
- Saaty, T.L. Multicriteria Decision Making: The Analytic Hierarchy Process: Planning, Priority Setting Resource Allocation; RWS Publishers: Pittsburgh, PA, USA, 1990. [Google Scholar]
- Forman, E.; Peniwati, K. Aggregating individual judgments and priorities with the analytic hierarchy process. Eur. J. Oper. Res. 1998, 108, 165–169. [Google Scholar] [CrossRef]
- The State Administration of Forestry. Technical Regulations of National Forest Resource Continuous Inventory; The State Administration of Forestry: Beijing, China, 2014. [Google Scholar]
- Simula, M. Towards Defining Forest Degradation: Comparative Analysis of Existing Definitions; FAO Forestry Department: Rome, Italy, 2009. [Google Scholar]
- Guangdong Forestry Bureau; Forestry Chronicle Compiling Board. Guangdong Forestry Memorabilia; Forestry Survey and Planning Academy Press: Guangzhou, China, 1994. [Google Scholar]
- Chokkalingam, U.; Zaizhi, Z. Guangdong province’s forest rehabilitation efforts: Potential for contribution to biodiversity conservation. Living For. 2006, 11, 26–28. [Google Scholar]
- Zhou, Z.; Chokkalingam, U. Lessons learned and success of initiatives to rehabilitate degraded forests in Guangdong Province, China. Int. J. Sustain. Dev. World Ecol. 2010, 17, 263–270. [Google Scholar] [CrossRef]
- Huizhen, D. The first province for rehabilitating and greening barren land, new strategies for the second initiative-Review Guangdong forestry development. Chin. For. 1999, 10, 13–14. [Google Scholar]
- Chokkalingam, U. Learning Lessons from China’s Forest Rehabilitation Efforts: National Level Review and Special Focus on Guangdong Province; Center for International Forestry Research: Bogor, Indonesia, 2006. [Google Scholar]
- Xu, W.; Liu, X. Regional Pattern of Vegetation Responses to Global Warming in the Qinghai-Tibet Plateau during Late Spring and Early Summer. Plateau Meteorol. 2009. [Google Scholar] [CrossRef]
- Gao, R.; Gang, W.Z.; Jie, D.W.; Hai, W.C.; Ling, Z.H. Variation of the Snow and Frozen Soil over Qinghai-Xizang Plateau in the Late Twentieth Century and Their Relations to Climatic Change. Plateau Meteorol. 2003, 22, 191–196. [Google Scholar]
- Li, D.L.; Zhong, H.L.; Wu, Q.B.; Zhang, Y.J.; Tang, M.C. Analyses on changes of surface temperature over Qinghai-Xizang Plateau. Plateau Meteorol. 2005. [Google Scholar] [CrossRef]
- Liu, X.; Liang, T.; Wei, Z. Numerical experiments of influences of surface albedo variation in qinghai-xizang plateau on east-asia summer monsoon. Plateau Meteorol. 1994, 13, 468–472. [Google Scholar]
- Luo, Y. Studies on the effect of snow cover over the qinghai-xizang plateau in winter and spring on general circulation over east asia in summer. Plateau Meteorol. 1995, 14, 505–512. [Google Scholar]
- Zhou, N.F.; Qin, N.S.; Qi-Pu, T.U.; Dong-Liang, L.I. Analyese on Regional Characteristics of Temperature Changes over Qinghai-Xizang Plateau in Recent 50 Years. Plateau Meteorol. 2005. [Google Scholar] [CrossRef]
- Zhuo, G.; Li, X.; Bu, L.; Wang, C.Y. Satellite dataset analysis of recent vegetation variation in Tibet region. Sci. Cold Arid Reg. 2011, 3, 426–435. [Google Scholar]
- Du, M.; Kawashima, S.; Yonemura, S.; Zhang, X.; Chen, S. Mutual influence between human activities and climate change in the Tibetan Plateau during recent years. Glob. Planet Chang. 2004, 41, 241–249. [Google Scholar] [CrossRef]
- Yushan, D.; Na, W. Analysis on the Process and Trends of Urbanizatio in Tibet. Tibetan Stud. 2015, 4, 67–74. [Google Scholar]
- Teng, H.; Liang, Z.; Chen, S.; Liu, Y.; Rossel, R.A.V.; Chappell, A.; Yu, W.; Shi, Z. Current and future assessments of soil erosion by water on the Tibetan Plateau based on RUSLE and CMIP5 climate models. Sci. Total Environ. 2018, 635, 673–686. [Google Scholar] [CrossRef]
- Yue, Y.; Ni, J.; Ciais, P.; Piao, S.; Wang, T.; Huang, M.; Borthwick, A.G.; Li, T.; Wang, Y.; Chappell, A. Lateral transport of soil carbon and land-atmosphere CO2 flux induced by water erosion in China. Proc. Natl. Acad. Sci. USA 2016, 113, 6617–6622. [Google Scholar] [CrossRef] [Green Version]
- Wang, X.; Zhong, X.; Fan, J. Assessment and spatial distribution of sensitivity of soil erosion in Tibet. J. Geogr. Sci. 2004, 14, 41–46. [Google Scholar] [CrossRef]
- Zunlan, C.; Pingyi, Z.; Chao, D.; Jingjing, L. Hazards of Debris Flow due to Glacier-Lake Outburst in Southeastern Tibet. J. Glaciol. Geocryol. 2008, 30, 954–959. [Google Scholar]
- National Forestry and Grassland Administration. Specifications for Assessment of Forest Ecosystem Services; GB/T 38582-2020; National Forestry and Grassland Administration: Beijing, China, 2020. [Google Scholar]
- The State Administration of Forestry. Specifications for Assessment of Forest Ecosystem Services in China; LY/T 1721-2008; The State Administration of Forestry: Beijing, China, 2008. [Google Scholar]
- Qingfeng, S. Study on Impact of Forest Resource Dynamic Change on Forest Ecological Function in Recent 40 Years in China; Chinese Academy of Forestry: Beijing, China, 2015. [Google Scholar]
- Kangas, J.; Kangas, A. Multiple criteria decision support in forest management—the approach, methods applied, and experiences gained. For. Ecol. Manag. 2005, 207, 143. [Google Scholar] [CrossRef]
- Schreuder, H.T.; Czaplewski, R.L. Long-term strategy for the statistical design of a forest health monitoring system. Environ. Monit. Assess. 1993, 27, 81–94. [Google Scholar] [CrossRef] [PubMed]
- Oliver, I.; Beattie, A.J. Designing a Cost-Effective Invertebrate Survey: A Test of Methods for Rapid Assessment of Biodiversity. Ecol. Appl. 1996, 6, 594. [Google Scholar] [CrossRef]
- Lewandowski, A.S.; Noss, R.F.; Parsons, D.R. The Effectiveness of Surrogate Taxa for the Representation of Biodiversity. Conserv. Biol. 2010, 24, 1367–1377. [Google Scholar] [CrossRef] [PubMed]
Figure 1.
Location of the study area consisting of Guangdong province and Tibet autonomous region and spatial distribution of corresponding permanent sample plots.
Figure 1.
Location of the study area consisting of Guangdong province and Tibet autonomous region and spatial distribution of corresponding permanent sample plots.

Figure 2.
The forest degradation index (FDI) is divided into two hierarchical structures (Modica et al. [19] after modifications). SX includes Site A (SA), Site B (SB), Site C (SC) and Site D (SD). SA is broad-leaved mixed forest and SB is eucalyptus forest in Guangdong province; SC is spruce forest and SD is fir forest in Tibet autonomous region.

Figure 3.
Distribution degradation levels of different forest types divided by dominant species in the Guangdong province and Tibet autonomous region; (A) Distribution of broad-leaved mixed forest in the Guangdong province; (B) Distribution of eucalyptus forest in the Guangdong province; (C) Distribution of fir forest in the Tibet autonomous region; (D) Distribution of spruce forest in the Tibet autonomous region. FDI: forest degradation index; S values: methodological description of obtaining these values is provided in a Section 2.6 (Normalizing the indicators) whereby S1: Forest accumulation growth rate after standardization of each sample plot; S2: Forest recruitment rate after standardization of each sample plot; S3: Tree species reduction rate after standardization of each sample plot; S4: Forest canopy cover reduction rate after standardization of each sample plot; S5: Forest disaster level after standardization of each sample plot; The pink points represent the projection of the plots on “S” (X-axis) and “The Value of FDI” (Y-axis); The light green points represent the projection of the plots on “S” (X-axis) and “The Value of S” (Z-axis). The blue points represent the projection of plots on “The Value of FDI” (Y-axis) and “The Value of S” (Z-axis).


Table 1.
Scale reference for indicators.
| Scale | Meaning |
|---|---|
| 1 | Two elements are of equal important. |
| 3 | Former is more slightly important than the latter compared to other two elements. |
| 5 | Former is more obviously important than the latter compared to other two elements. |
| 7 | Former is more strongly important than the latter compared to other two elements. |
| 9 | Former is extremely more important than the latter compared to other two elements. |
| 2, 4, 6, 8 | Represent the intermediate value of the above adjacent judgments. |
| Reciprocal | If the ratio of the importance of element i to element j is aij (aij = ai/aj), the ratio of the importance of element j to element i is aji = 1/aij. |
Table 2.
Scoring for forest degradation indicators (only filling in the part above or below the diagonal line).
Table 2.
Scoring for forest degradation indicators (only filling in the part above or below the diagonal line).
| Indicators | FAGR | FRR | TSRR | FCCRR | FDL |
|---|---|---|---|---|---|
| FAGR | 1 | ||||
| FRR | 1 | ||||
| TSRR | 1 | ||||
| FCCRR | 1 | ||||
| FDL | 1 |
Note: FAGR: forest accumulation growth rate; FRR: forest recruitment rate; TSRR: tree species reduction rate; FCCRR: forest canopy cover reduction rate; FDL: forest disaster level.
Table 3.
The random index (RI).
| Matrix Order | 1 | 2 | 3 | 4 | 5 | 6 | 7 |
| RI | 0 | 0 | 0.58 | 0.90 | 1.12 | 1.24 | 1.32 |
Table 4.
Weight of each indicator.
| Indicator | Weighted Sum Vector (Equation (9), Equation (13)) | Normalized Weight (Equation (14)) |
|---|---|---|
| FAGR | 0.1584 | 0.1873 |
| FRR | 0.1142 | 0.1350 |
| TSRR | 0.1430 | 0.1691 |
| FCCRR | 0.1109 | 0.1312 |
| FDL | 0.3191 | 0.3774 |
| (Equation (9)) | 5.1931 | |
| CI (Equation (10)) | 0.0339 | |
| CR (Equation (12)) | 0.0303 | |
Note: FAGR: forest accumulation growth rate; FRR: forest recruitment rate; TSRR: tree species reduction rate; FCCRR: forest canopy cover reduction rate; FDL: forest disaster level; : maximum eigenvalue of the reciprocal matrix of the expert’s judgement scoring table, which is also known as a pairwise comparison matrix (Equation (8)); CI: consistency index, which measures the deviation degree of consistency of pairwise comparison of the judgement; CR: consistency ratio, which allows us to evaluate the overall consistency of all paired comparisons of the judgement provided by the expert, and if CR < 0.1, an expert judgement is assumed to be consistent.
Table 5.
Evaluation results of forest degradation grade of two forest types divided by dominant tree species in the Guangdong province. A total of 731 sample plots of the province were included in the study. FDI: forest degradation index.
Table 5.
Evaluation results of forest degradation grade of two forest types divided by dominant tree species in the Guangdong province. A total of 731 sample plots of the province were included in the study. FDI: forest degradation index.
| Degradation Level | Forest Type | ||
|---|---|---|---|
| Broad-Leaved Mixed Forest | Eucalyptus Forest | ||
| FDI-Ⅰ | No. of sample plots | 79 | 105 |
| Proportion | 16.74% | 40.54% | |
| FDI-Ⅱ | No. of sample plots | 55 | 15 |
| Proportion | 11.65% | 5.79% | |
| FDI-Ⅲ | No. of sample plots | 335 | 128 |
| Proportion | 70.97% | 49.42% | |
| FDI-Ⅳ | No. of sample plots | 3 | 11 |
| Proportion | 0.64% | 4.25% | |
Table 6.
Evaluation results of forest degradation grade of two forest types divided by dominant tree species in the Tibet autonomous region. A total of 405 sample plots of the region were included in the study. FDI: forest degradation index.
Table 6.
Evaluation results of forest degradation grade of two forest types divided by dominant tree species in the Tibet autonomous region. A total of 405 sample plots of the region were included in the study. FDI: forest degradation index.
| Degradation Level | Forest Type | ||
|---|---|---|---|
| Spruce Forest | Fir Forest | ||
| FDI-Ⅰ | No. of sample plots | 2 | 3 |
| Proportion | 0.91% | 1.61% | |
| FDI-Ⅱ | No. of sample plots | 143 | 72 |
| Proportion | 65.3% | 38.71% | |
| FDI-Ⅲ | No. of sample plots | 73 | 108 |
| Proportion | 33.33% | 58.06% | |
| FDI-Ⅳ | No. of sample plots | 1 | 3 |
| Proportion | 0.46% | 1.61% | |
Table 7.
Relationship between forest degradation level and Forest accumulation growth rate (FAGR) in the Guangdong province (FDI: forest degradation index).
Table 7.
Relationship between forest degradation level and Forest accumulation growth rate (FAGR) in the Guangdong province (FDI: forest degradation index).
| Degradation Level | Broad-Leaved Mixed Forest | Eucalyptus Forest | ||||
|---|---|---|---|---|---|---|
| No. of Sample Plots | No. of Sample Plots with the Same FAGR as the Rank of Degraded Forest | Proportion of the Latter Relative to the Former (%) | No. of Sample Plots | No. of Sample Plots with the Same FAGR as the Rank of Degraded Forest | Proportion of the Latter Relative to the Former (%) | |
| FDI-Ⅰ | 79 | 79 | 100 | 105 | 104 | 99.05 |
| FDI-Ⅱ | 55 | 23 | 41.82 | 15 | 6 | 40 |
| FDI-Ⅲ | 335 | 302 | 90.15 | 128 | 110 | 85.94 |
| FDI-Ⅳ | 3 | 0 | 0 | 11 | 1 | 9.09 |
| All levels | 472 | 404 | 85.59 | 259 | 221 | 85.33 |
Table 8.
Relationship between forest degradation level and Forest accumulation growth rate (FAGR) in the Tibet autonomous region (FDI: forest degradation index).
Table 8.
Relationship between forest degradation level and Forest accumulation growth rate (FAGR) in the Tibet autonomous region (FDI: forest degradation index).
| Degradation Level | Spruce Forest | Fir Forest | ||||
|---|---|---|---|---|---|---|
| No. of Sample Plots | No. of Sample Plots with the Same FAGR as the Rank of Degraded Forest | Proportion of the Latter Relative to the Former (%) | No. of Sample Plots | No. of Sample Plots with the Same FAGR as the Rank of Degraded Forest | Proportion of the Latter Relative to the Former (%) | |
| FDI-Ⅰ | 2 | 2 | 100 | 3 | 2 | 66.67 |
| FDI-Ⅱ | 143 | 131 | 91.61 | 72 | 40 | 55.56 |
| FDI-Ⅲ | 73 | 61 | 83.56 | 108 | 77 | 71.30 |
| FDI-Ⅳ | 1 | 0 | 0 | 3 | 0 | 0 |
| All levels | 219 | 194 | 88.58 | 186 | 119 | 63.98 |
© 2020 by the authors. Licensee MDPI, Basel, Switzerland. This article is an open access article distributed under the terms and conditions of the Creative Commons Attribution (CC BY) license (http://creativecommons.org/licenses/by/4.0/).
Share and Cite
MDPI and ACS Style
Wu, B.; Meng, X.; Ye, Q.; Sharma, R.P.; Duan, G.; Lei, Y.; Fu, L. Method of Estimating Degraded Forest Area: Cases from Dominant Tree Species from Guangdong and Tibet in China. Forests 2020, 11, 930. https://doi.org/10.3390/f11090930
AMA Style
Wu B, Meng X, Ye Q, Sharma RP, Duan G, Lei Y, Fu L. Method of Estimating Degraded Forest Area: Cases from Dominant Tree Species from Guangdong and Tibet in China. Forests. 2020; 11(9):930. https://doi.org/10.3390/f11090930
Chicago/Turabian StyleWu, Biyun, Xiang Meng, Qiaolin Ye, Ram P. Sharma, Guangshuang Duan, Yuancai Lei, and Liyong Fu. 2020. "Method of Estimating Degraded Forest Area: Cases from Dominant Tree Species from Guangdong and Tibet in China" Forests 11, no. 9: 930. https://doi.org/10.3390/f11090930
Note that from the first issue of 2016, this journal uses article numbers instead of page numbers. See further details here.