Article

Responses to Water Deficit and Salt Stress in Silver Fir (Abies alba Mill.) Seedlings

1
Faculty of Horticulture, University of Agricultural Sciences and Veterinary Medicine, 400372 Cluj-Napoca, Romania
2
Mediterranean Agroforestry Institute (IAM), Universitat Politècnica de València, Camino de Vera s/n, 46022 Valencia, Spain
3
Institute for Conservation and Improvement of Valencian Agrodiversity (COMAV), Universitat Politècnica de València, Camino de Vera s/n, 46022 Valencia, Spain
*
Author to whom correspondence should be addressed.
Forests 2020, 11(4), 395; https://doi.org/10.3390/f11040395
Submission received: 4 March 2020 / Revised: 24 March 2020 / Accepted: 30 March 2020 / Published: 2 April 2020
(This article belongs to the Special Issue The Physiology of Tree Response to Drought)

Abstract

:
Forest ecosystems are frequently exposed to abiotic stress, which adversely affects their growth, resistance and survival. For silver fir (Abies alba), the physiological and biochemical responses to water and salt stress have not been extensively studied. Responses of one-year-old seedlings to a 30-day water stress (withholding irrigation) or salt stress (100, 200 and 300 mM NaCl) treatments were analysed by determining stress-induced changes in growth parameters and different biochemical markers: accumulation of ions, different osmolytes and malondialdehyde (MDA, an oxidative stress biomarker), in the seedlings, and activation of enzymatic and non-enzymatic antioxidant systems. Both salt and water stress caused growth inhibition. The results obtained indicated that the most relevant responses to drought are based on the accumulation of soluble carbohydrates as osmolytes/osmoprotectants. Responses to high salinity, on the other hand, include the active transport of Na+, Cl and Ca2+ to the needles, the maintenance of relatively high K+/Na+ ratios and the accumulation of proline and soluble sugars for osmotic balance. Interestingly, relatively high Na+ concentrations were measured in the needles of A. alba seedlings at low external salinity, suggesting that Na+ can contribute to osmotic adjustment as a ‘cheap’ osmoticum, and its accumulation may represent a constitutive mechanism of defence against stress. These responses appear to be efficient enough to avoid the generation of high levels of oxidative stress, in agreement with the small increase in MDA contents and the relatively weak activation of the tested antioxidant systems.

1. Introduction

Drought and soil salinity are considered the most adverse and critical environmental factors for plants, causing massive losses in agricultural production worldwide and, at the same time, substantially affecting the distribution of wild species in nature [1,2]. Drought and salinity affect more than 10 percent of total arable land, and desertification and salinization are rapidly spreading globally [3,4,5]. Accumulation of salts dissolved in irrigation water leads to the progressive ‘secondary’ salinization of irrigated cropland, especially in arid and semiarid regions, and this problem will worsen in the near future due to the effects of the present climate change [6].
Plants can perceive abiotic stresses, such as water deficit and salt stress, and activate appropriate physiological, biochemical and molecular responses, with altered metabolism, growth and development [7]. The study of these responses and the mechanisms of tolerance to drought and salinity is currently one of the major topics of research in plant biology.
Silver fir (A. alba Mill.) is an economically and ecologically important forest tree species, especially in lower-mountain forests. This species covers the main mountain areas in central and southern Europe, including populations in the Mediterranean climatic zone, in the south of Italy (Calabria), in the northeast of Spain (Catalonia) and the south of France (south of the great Alps and Pyrenees) [8]. In Pyrenees and Calabria, the populations of A. alba belong to particular ecotypes, differentiated genetically from other populations [9,10]. Abies alba is generally associated with spruce Picea abies (L.) H. Karst. in the upper mountain belt, and with beech Fagus sylvatica (L.) in lower and middle mountain belts. Moreover, this species forms pure forests in the subalpine belt in some areas of the Southern Alps [11]. A. alba has a high-altitude range, between 500 and 2000 m a.s.l., in the pre-Alps and southern French Alps [12,13].
Regarding environmental requirements, silver fir is tolerant to a wide variety of soil types with different nutrient content and alkalinity conditions, except hydromorphic and compact soils. This species prefers soils deep and moist with a pH from acid to neutral [14]. Silver fir ecotypes also show remarkable variation in features such as shade tolerance, frost hardiness and drought resilience. It is expected that climate change will contribute to reduce the abundance and distribution range of this species; therefore, improvements in forest management programmes are recommended, as they will be required for the conservation of silver fir [15]. Water stress, which will increase under climate change conditions, as mentioned above, is actually one of the factors most damaging for the success of reforestation actions. On the other hand, conifers are known to have a relatively high sensitivity to salt [16]. Consequently, silver fir—as other conifers—does not grow naturally in saline environments but can be affected by relatively high salt concentrations in stands near mountains roads, due to the common practice in many European countries of road de-icing in winter, using large amounts of NaCl [17,18]. Despite the interest of these studies, the information available regarding the responses of this species to drought and salinity is still limited. There are several published reports dealing with the effects of drought on silver fir, mostly describing fieldwork with adult tress (see, for example References [19,20,21]), but we have not found publications addressing the physiological and biochemical mechanisms of response to stress in Abies alba seedlings, except for our preliminary study [22].
Regardless of their degree of tolerance, plants react against environmental stressors by activating a series of conserved responses. These common responses encompass various physiological and biochemical processes, at the cell and whole plant levels, in specific environmental contexts [23,24]. These general responses include the inhibition of photosynthesis and plant growth [25,26], the accumulation of different osmolytes, the activation of antioxidant systems and the expression of specific defence proteins [3,27,28,29,30]. Besides, certain stress conditions trigger specific responses, such as the control of ion transport and ion homeostasis in the presence of high salt concentrations [31], or the cold-induced synthesis of antifreeze proteins [32].
Osmolytes are of particular importance since, in addition to contributing to cellular osmotic adjustment under stress, they have essential roles as “osmoprotectants” [33], acting as low-molecular-weight chaperones in the direct stabilisation of membranes, proteins and other macromolecular structures under conditions of cellular dehydration, and as signalling molecules [34,35,36]. A general reaction to abiotic stresses, which causes oxidative stress through the generation of ‘reactive oxygen species’ (ROS), is the activation of antioxidant systems to prevent or reduce oxidative damage of proteins, membranes and DNA [37]. These antioxidant activities include several enzymes such as superoxide dismutase (SOD), catalase (CAT), ascorbate peroxidase (APX) (and other peroxidases), monodehydroascorbate reductase (MDAR), or glutathione reductase (GR), among others [38]. Non-enzymatic antioxidant compounds, including vitamins C and E, carotenoids, glutathione, or phenolic compounds, especially the subclass of flavonoids, may also play an essential role in maintaining cellular redox balance under stress conditions [39].
Considering that the identification and evaluation of reliable biochemical stress markers will significantly contribute to elucidate the mechanisms of tolerance to drought and salinity, this work aimed to select the optimal indicators associated with silver fir’s general responses to salt and water stress, at the seedling stage. Improving our knowledge on the mechanisms of stress tolerance of silver fir, apart from its academic interest, may help to design and implement more efficient conservation programmes for this economically and ecologically important species, allowing an appropriate use of reproductive seed material on reforestation sites. For this study, A. alba seedlings were subjected to water deficit (withholding irrigation) and salt stress (watering the plants with increasing salt concentrations) treatments, under controlled greenhouse conditions. After the treatments, the following variables were determined in control and stressed plants: growth parameters, levels of photosynthetic pigments, ions concentrations in needles and roots, the leaf contents of common osmolytes, the degree of oxidative stress, by quantification of malondialdehyde (MDA, a reliable oxidative stress marker), total phenolic compounds and flavonoid contents, as representative non-enzymatic antioxidants, and the specific activities of major antioxidant enzymes.

2. Materials and Methods

2.1. Plant Growth and Stress Treatments

One-year-old seedlings of silver fir from the Romanian Carpathians Mountains (Gârda Seacă nursery, 46°31′ N/22°46′ E) were transferred to the greenhouse of the Institute for the Preservation and Improvement of Valencian Agrodiversity (COMAV), Universitat Politècnica de València, Valencia, Spain. After one week of acclimatisation, 175 seedlings, at approximately the same developmental stage, were selected, transplanted into 0.3 L individual pots containing ‘Humin-substrat N3’ (Klasmann-Deilmann, Germany) substrate, and randomly distributed into five groups of 35 seedlings, each group of pots placed within a plastic tray. The pots were maintained in a greenhouse with controlled temperature (minimum of 15 °C and maximum of 30 °C) under natural light and watered twice a week with tap water. Salt and water stress treatments started 21 days later. Salt treatments were applied by watering the plants twice weekly with NaCl solutions of 0 (for the controls), 100, 200 or 300 mM final concentration (in tap water), adding 1 L of solution per tray. The water stress (WS) treatment was performed by altogether withholding irrigation. Treatments were stopped after 30 days, before any seedling mortality was observed. Plant samples (needles and roots) were collected separately for the measurement of growth parameters and biochemical analyses. Seven replicates, each one consisting of a pooled sample of five seedlings, were used per treatment.

2.2. Substrate Analysis

The electrical conductivity of the substrate was measured after the treatments. Soil samples were collected from every pot, air-dried and passed through a 2 millimetre sieve. A soil:water suspension (1:5) was prepared in deionised water, mixed at 600 rpm for one hour at room temperature and then filtered through filter paper. Electrical conductivity was measured with a Crison 522 Conductivity-meter and expressed in dS m−1.
The gravimetric method was used to determine soil moisture, as follows: a fraction of each soil sample was weighed (soil weight, SW), dried in an oven at 105 °C until constant weight and then weighed again (dry soil weight, DSW). The soil water content was calculated as:
Soil humidity (%) = [(SW − DSW)/SW] × 100

2.3. Plant Growth Parameters

Before starting the stress treatments (time 0), the number of needles and the stem length were determined for all A. alba seedlings. To analyse the effects of water and salt stress on A. alba, at the stage of vegetative growth, the increases in the number of needles (Nno) and stem length (SL) with respect to the values measured at time 0, and the fresh weight (FW) of needles, were determined. Part of the needle material was weighed (FW), dried at 65 °C until constant weight, and weighed again (dry weight, DW), and the water content percentage (WC%) of needles was calculated as:
WC% = [(FW − DW)/FW] × 100

2.4. Photosynthetic Pigments

Chlorophyll a (Chl a), chlorophyll b (Chl b) and total carotenoids (Caro) were determined following a previously described method [40]. Fresh needle material (0.05–0.10 g) was ground in the presence of liquid nitrogen. One ml of ice-cold 80% acetone was added to the sample, which was shaken overnight in the dark, at 4 °C. Following a 10 min centrifugation at 12,000 rpm, at 4 °C, the supernatants were collected, and the absorbance was measured at 470, 645 and 663 nm. The following equations were used for the calculation of pigment concentrations [40]:
Chl a (µg/mL) = 12.21 × (A663) − 2.81 × (A646);
Chl b (µg/mL) = 20.13 × (A646) − 5.03 × (A663);
Caro (µg/mL) = (1000 × A470 − 3.27 × [Chl a] − 104 × [Chl b])/227
Chlorophyll and carotenoid contents were finally expressed in mg g−1 DW.

2.5. Ion Contents

Sodium (Na+), potassium (K+), calcium (Ca2+) and chloride (Cl) ions were determined in roots and needles of all replicates, after four-week treatments, according to Weimberg [41]. Dried plant material (0.05–0.10 g) was ground to a fine powder and extracted in 15 mL of Milli-Q water, by heating the samples for 1 h in a boiling water bath, followed by cooling on ice and filtration through a nylon filter of 0.45 µm pore. Na+, Ca2+ and K+ were quantified with a PFP7 flame photometer (Jenway Inc., Staffordshire, UK) and Cl was measured with a chloride analyser (Sherwood, model 926, Cambridge, UK).

2.6. Osmolyte Quantification

Two main types of osmolytes were analysed in silver fir needles, proline (Pro) and total soluble sugars (TTS). Pro content was measured by the ninhydrin-acetic acid method [42]. Briefly, needle extracts were prepared from fresh plant material in a 3% (w/v) sulfosalicylic acid solution, mixed with acid ninhydrin, incubated for one hour at 95 °C in a water bath, cooled and extracted with toluene. The absorbance of the organic phase was measured at 520 nm, using toluene as the blank. Pro concentration was calculated from a standard curve, prepared with known amounts of the osmolyte, and expressed in μmol g−1 DW.
TSS contents were measured according to a published procedure [43]. Needle fresh material (0.05–0.10 g) was ground in the presence of liquid N2 and suspended in 3 mL of 80% (v/v) methanol. The samples were vortexed, centrifuged at 12,000 rpm for 10 min, the supernatants were collected, and a fraction of each extract was diluted 10-fold with water. The diluted sample (0.5 mL) was supplemented with concentrated sulphuric acid (2.5 mL) and 5% phenol (0.5 mL). Finally, the absorbance of the sample was measured at 490 nm. TSS contents were expressed as ‘mg equivalent of glucose’ (used as standard), mg eq. glucose g−1 DW.

2.7. Malondialdehyde (MDA)

Methanol extracts (80%, v/v, in water) were prepared by grinding 0.05–0.10 g of fresh needles, shaking the samples in a rocker shaker overnight, at room temperature, followed by centrifugation at 12,000 rpm for 15 min. MDA was quantified in the supernatants, as previously described [44]. Each sample was mixed with 0.5% thiobarbituric acid (TBA) prepared in 20% trichloroacetic acid (TCA)—or with 20% TCA without TBA for the controls—and then incubated at 95 °C for 15 min, in a water bath. The reactions were stopped on ice, the samples were centrifuged at 12,000 rpm for 10 min, at 4 °C, and the absorbance of the supernatants was measured at 532 nm. After subtracting the non-specific absorbance at 600 and 440 nm, the MDA concentration was calculated applying the equations described by Hodges [44] based on the molar extinction coefficient of the MDA-TBA adduct at 532 nm (ε 532 = 155 mM−1 cm−1).

2.8. Non-Enzymatic Antioxidants

Concentrations of total phenolic compounds (TPC) and total flavonoids (TF) were determined in the same 80% methanol extracts used for MDA measurements. TPC were determined according to the protocol of Blainski [45], which is based on the reaction with the Folin–Ciocalteu reagent, in the presence of NaHCO3. The reaction mixtures were incubated at room temperature, in the dark, for 90 min, and the absorbance was then recorded at 765 nm. TPC concentration was expressed as equivalents of the standard, gallic acid (mg eq. GA g−1 DW).
TF were determined by nitration of catechol groups with NaNO2, followed by reaction with AlCl3 under alkaline conditions [46]. The absorbance of the samples was read at 510 nm, using catechin as the standard. TF concentration was expressed as equivalents of catechin (mg eq. C g−1 DW).

2.9. Antioxidant Enzyme Activities

The specific activity of four major antioxidant enzymes, namely, superoxide dismutase (SOD), catalase (CAT), ascorbate peroxidase (APX) and glutathione reductase (GR), was determined at room temperature (~25 °C) in crude protein extracts prepared from silver fir needles, essentially as previously described [47]. The plant material was ground in liquid N2 and mixed with extraction buffer (20 mM Hepes, pH = 7.5, 50 mM KCl, 1 mM EDTA, 0.1% (v/v) Triton X-100, 0.2% (w/v) polyvinylpyrrolidone, 0.2% (w/v) polyvinylpolypyrrolidone and 5% (v/v) glycerol). To improve protein extraction, 1/10 volume of ‘high salt buffer’ (225 mM Hepes, pH 7.5, 1.5 M KCl and 22.5 mM MgCl2) was added to the samples, mixed well by vortexing and kept for 15 min on ice. After centrifugation at 13,500 rpm for 15 min at 4 °C, the supernatants were collected, concentrated in U-Tube concentrators (Novagen, Madison, WI, USA), and centrifuged again to remove precipitated material. The supernatants, referred to as ‘protein extracts’, were frozen in liquid N2 and stored in aliquots at −75 °C. Protein concentration in the extracts was measured by the method of Bradford [48], using the Bio-Rad reagent and bovine serum albumin (BSA) as standard.
SOD activity in the protein extracts was determined following, at 560 nm, the inhibition of nitroblue tetrazolium (NBT) photoreduction in reaction mixtures containing riboflavin as the source of superoxide radicals [49]. A SOD unit was defined as the amount of enzyme that causes 50% inhibition of NBT photoreduction under the assay conditions.
CAT activity was assessed by the decrease in absorbance at 240 nm, which parallels the consumption of H2O2 added to the extracts [50]. A CAT unit was defined as the amount of enzyme that will decompose one mmol of H2O2 per minute at 25 °C.
For ascorbate peroxidase (APX), the enzyme activity was determined by the decrease in absorbance observed at 290 nm as ascorbate becomes oxidised in the reaction [51]. One APX unit was defined as the amount of enzyme required to consume one mmol of ascorbate per minute, at 25 °C.
GR activity was quantified according to Reference [52], following the decrease in absorbance at 340 nm due to oxidation of NADPH—the cofactor of the GR-catalysed reduction of oxidised glutathione (GSSG). One GR unit was defined as the amount of enzyme that will oxidise one mmol of NADPH per minute, at 25 °C.

2.10. Statistical Analyses

Data were analysed using the program Statgraphics Centurion XVI (Statgraphics Technologies, The Plains, VA, USA). Significant differences between treatments were tested by one-way analysis of variance (ANOVA) at the 95% confidence level, and post hoc comparisons were made using the Tukey’s HSD test at p < 0.05. All mean values throughout the text are based on seven biological replicates, each one corresponding to a composite sample of five pooled individual seedlings. Hierarchical cluster analysis (HCA) and the corresponding heatmap were performed using the ClustVis tool [53], for traits for which significant differences (p < 0.05) had been detected in the ANOVA with the purpose to find a signature of responses specific to the water and salinity stresses applied. Unit variance scaling for the normalised and centred data was used. Distance measures for the HCA were based on Pearson correlations, and the average clustering method with the higher median value first for the tree ordering option was used.

3. Results

3.1. Substrate Analysis

The electric conductivity (EC1:5) of the substrate increased in parallel to the increasing NaCl concentration in the irrigation solutions, reaching almost an eight-fold higher value in the presence of 300 mM NaCl than in the control pots, confirming the high correlation between EC and the concentration of the saline solutions used in the salt treatments. The water stress treatment also led to a significant increase in the substrate EC, probably due to concentration of salts in the soil. However, logically, it was lower than in the pots watered with NaCl solutions, even at the lowest concentration tested (100 mM). As expected, the humidity of the substrate was strongly reduced, by more than 40%, in the pots that were not irrigated (WS treatment), whereas those watered with saline solutions showed only slight reductions, as compared to the control (Table 1).

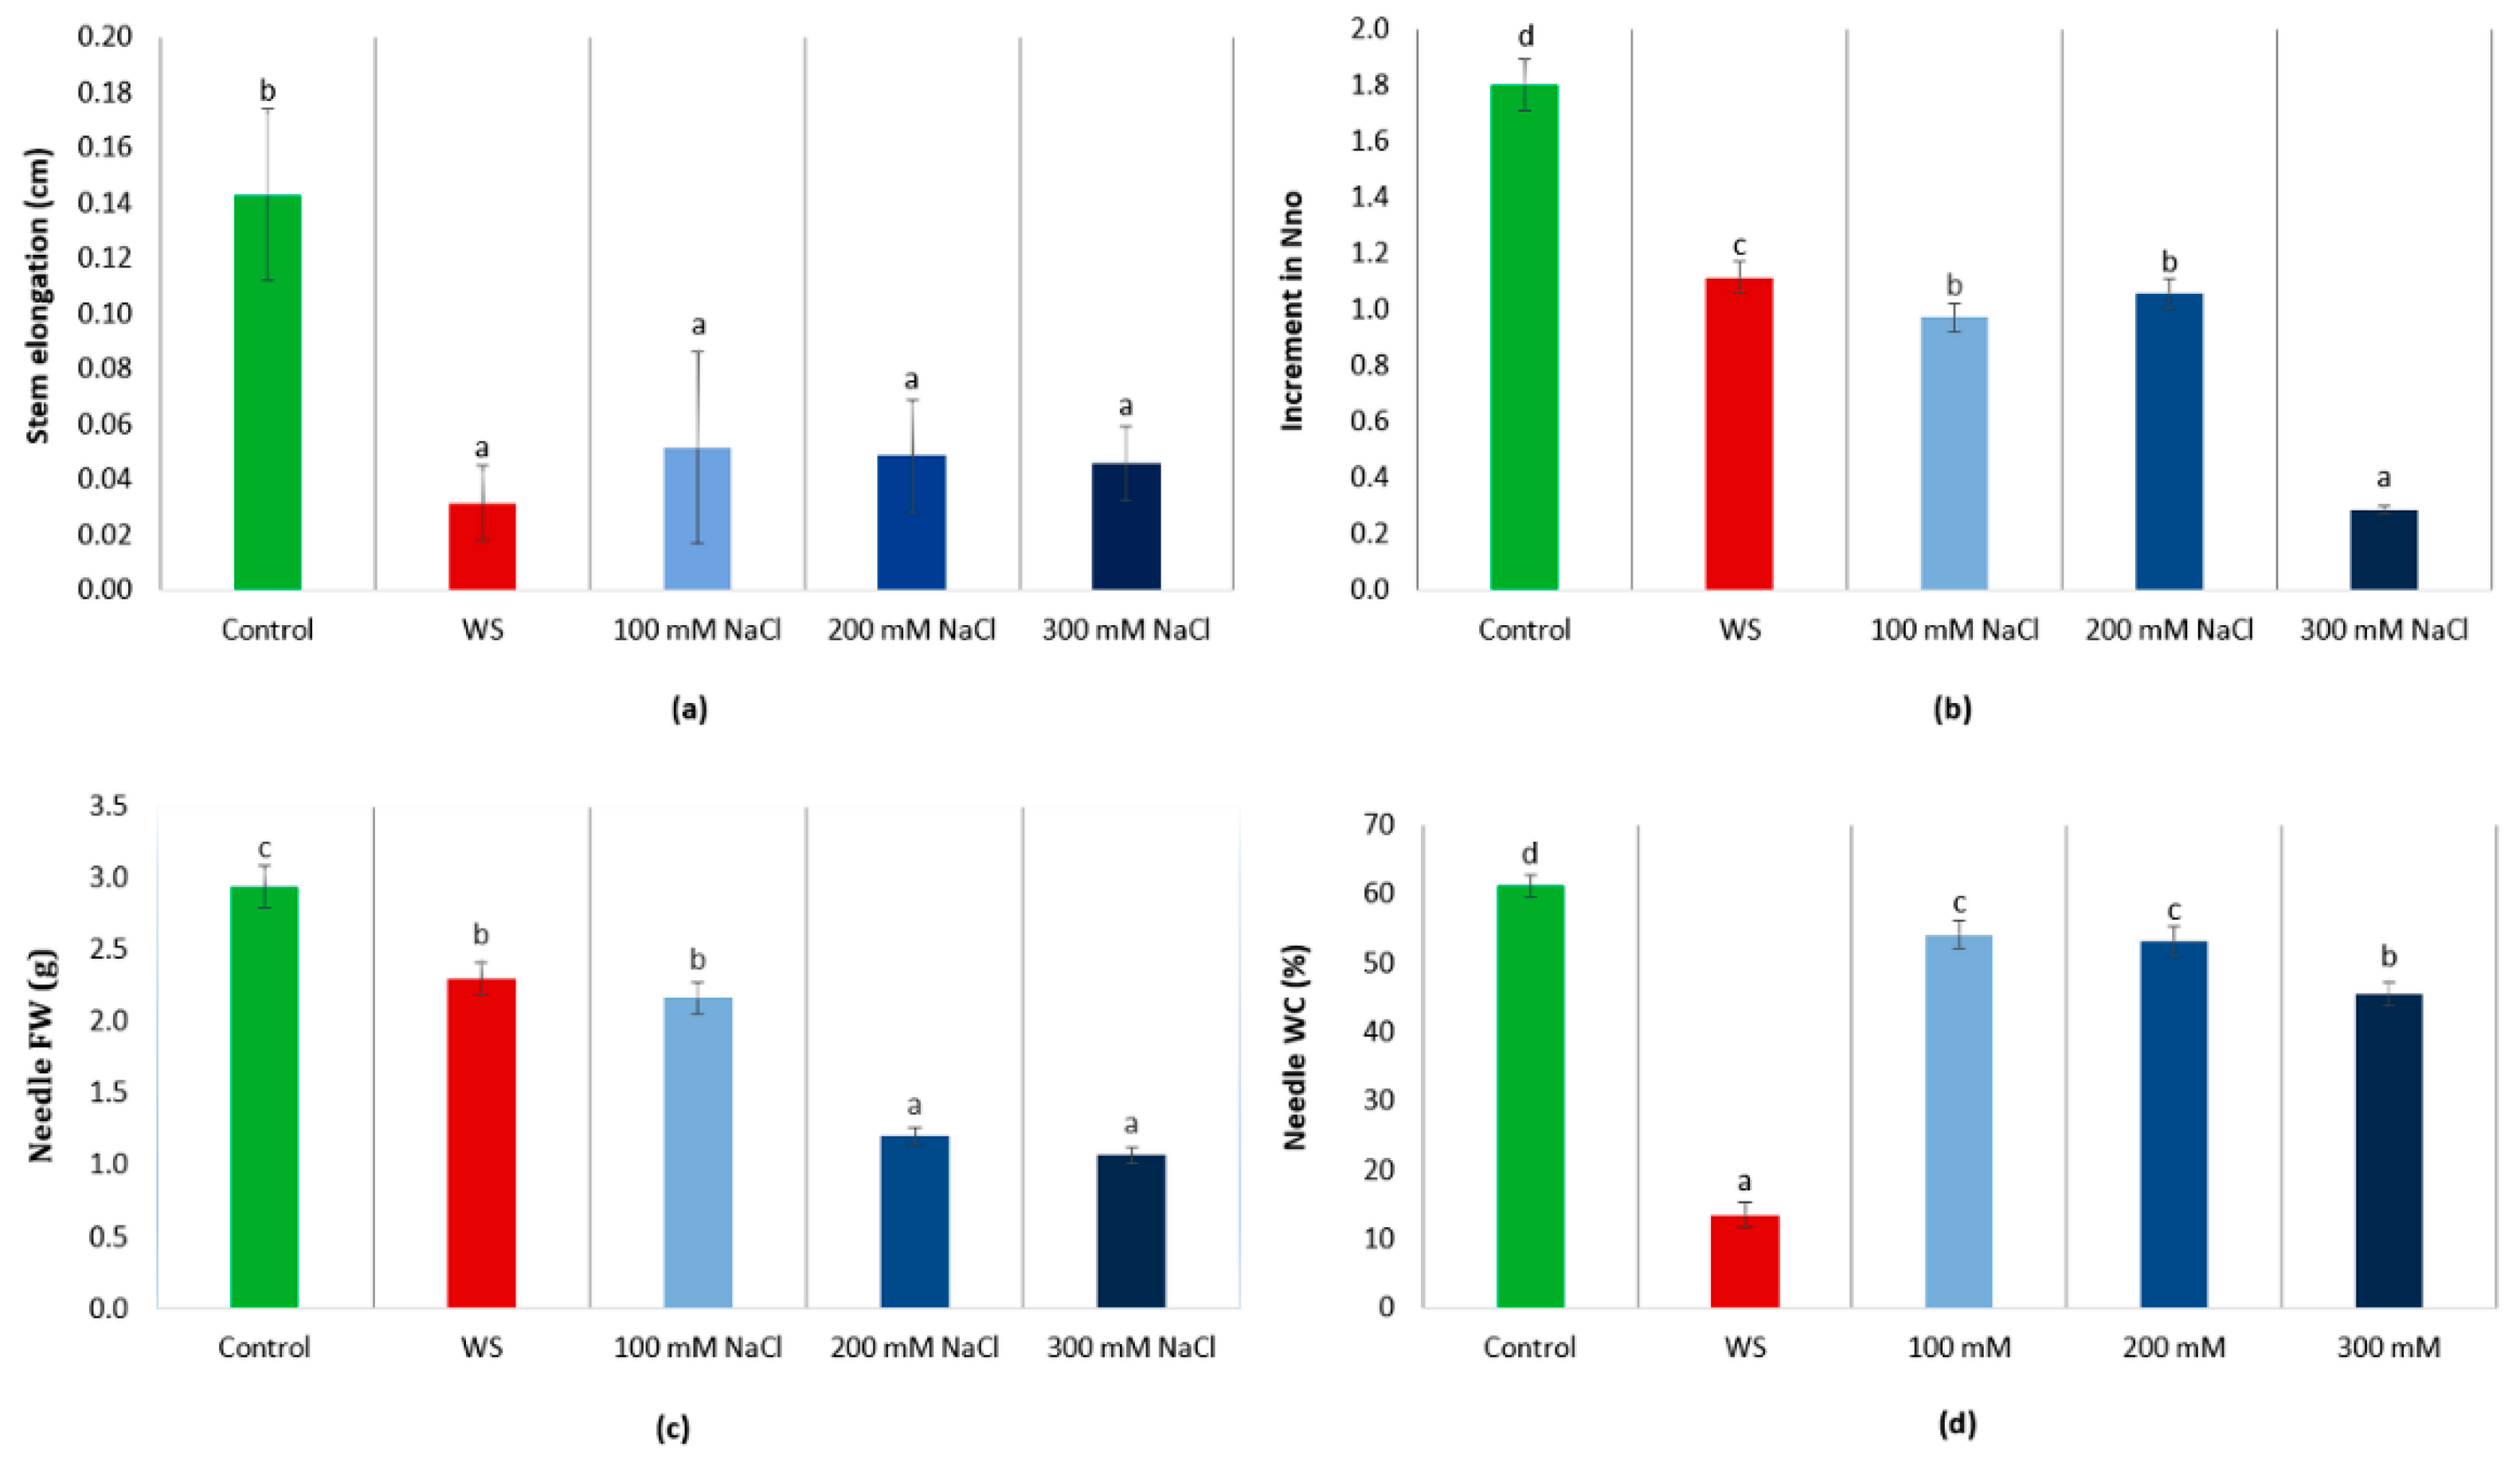
3.2. Plant Growth Analysis

Salt and water stress inhibited the growth of A. alba seedlings, as shown by the relative reductions in stem elongation, increase of the number of needles and biomass accumulation in the stressed plants, as compared to the non-stressed controls. For example, all stress treatments strongly reduced the mean stem elongation measured in the control seedlings, but no statistically significant (p < 0.05) differences were observed between the water deficit treatment and the three different NaCl concentrations (Figure 1a). In terms of the increment in the number of needles (Figure 1b) or the needles’ FW (Figure 1c), growth inhibition of the salt-treated seedlings was concentration-dependent, with the strongest effects observed at the highest NaCl concentration tested. Under our experimental conditions, the water deficit treatment resulted in inhibition of growth similar to that caused by the lowest salinity applied to the A. alba seedlings. Increasing external salinity led to a significant, concentration-dependent reduction in the needles water content, down to about 45% in the presence of 300 mM NaCl (Figure 1d). Nevertheless, the stress-induced dehydration of the needles was much more pronounced in the plants subjected to water deficit, where water content dropped to 13% (Figure 1d). Therefore, the observed reduction of fresh weight in water-stressed seedlings is probably due, to a large extent, to loss of water by the needles.

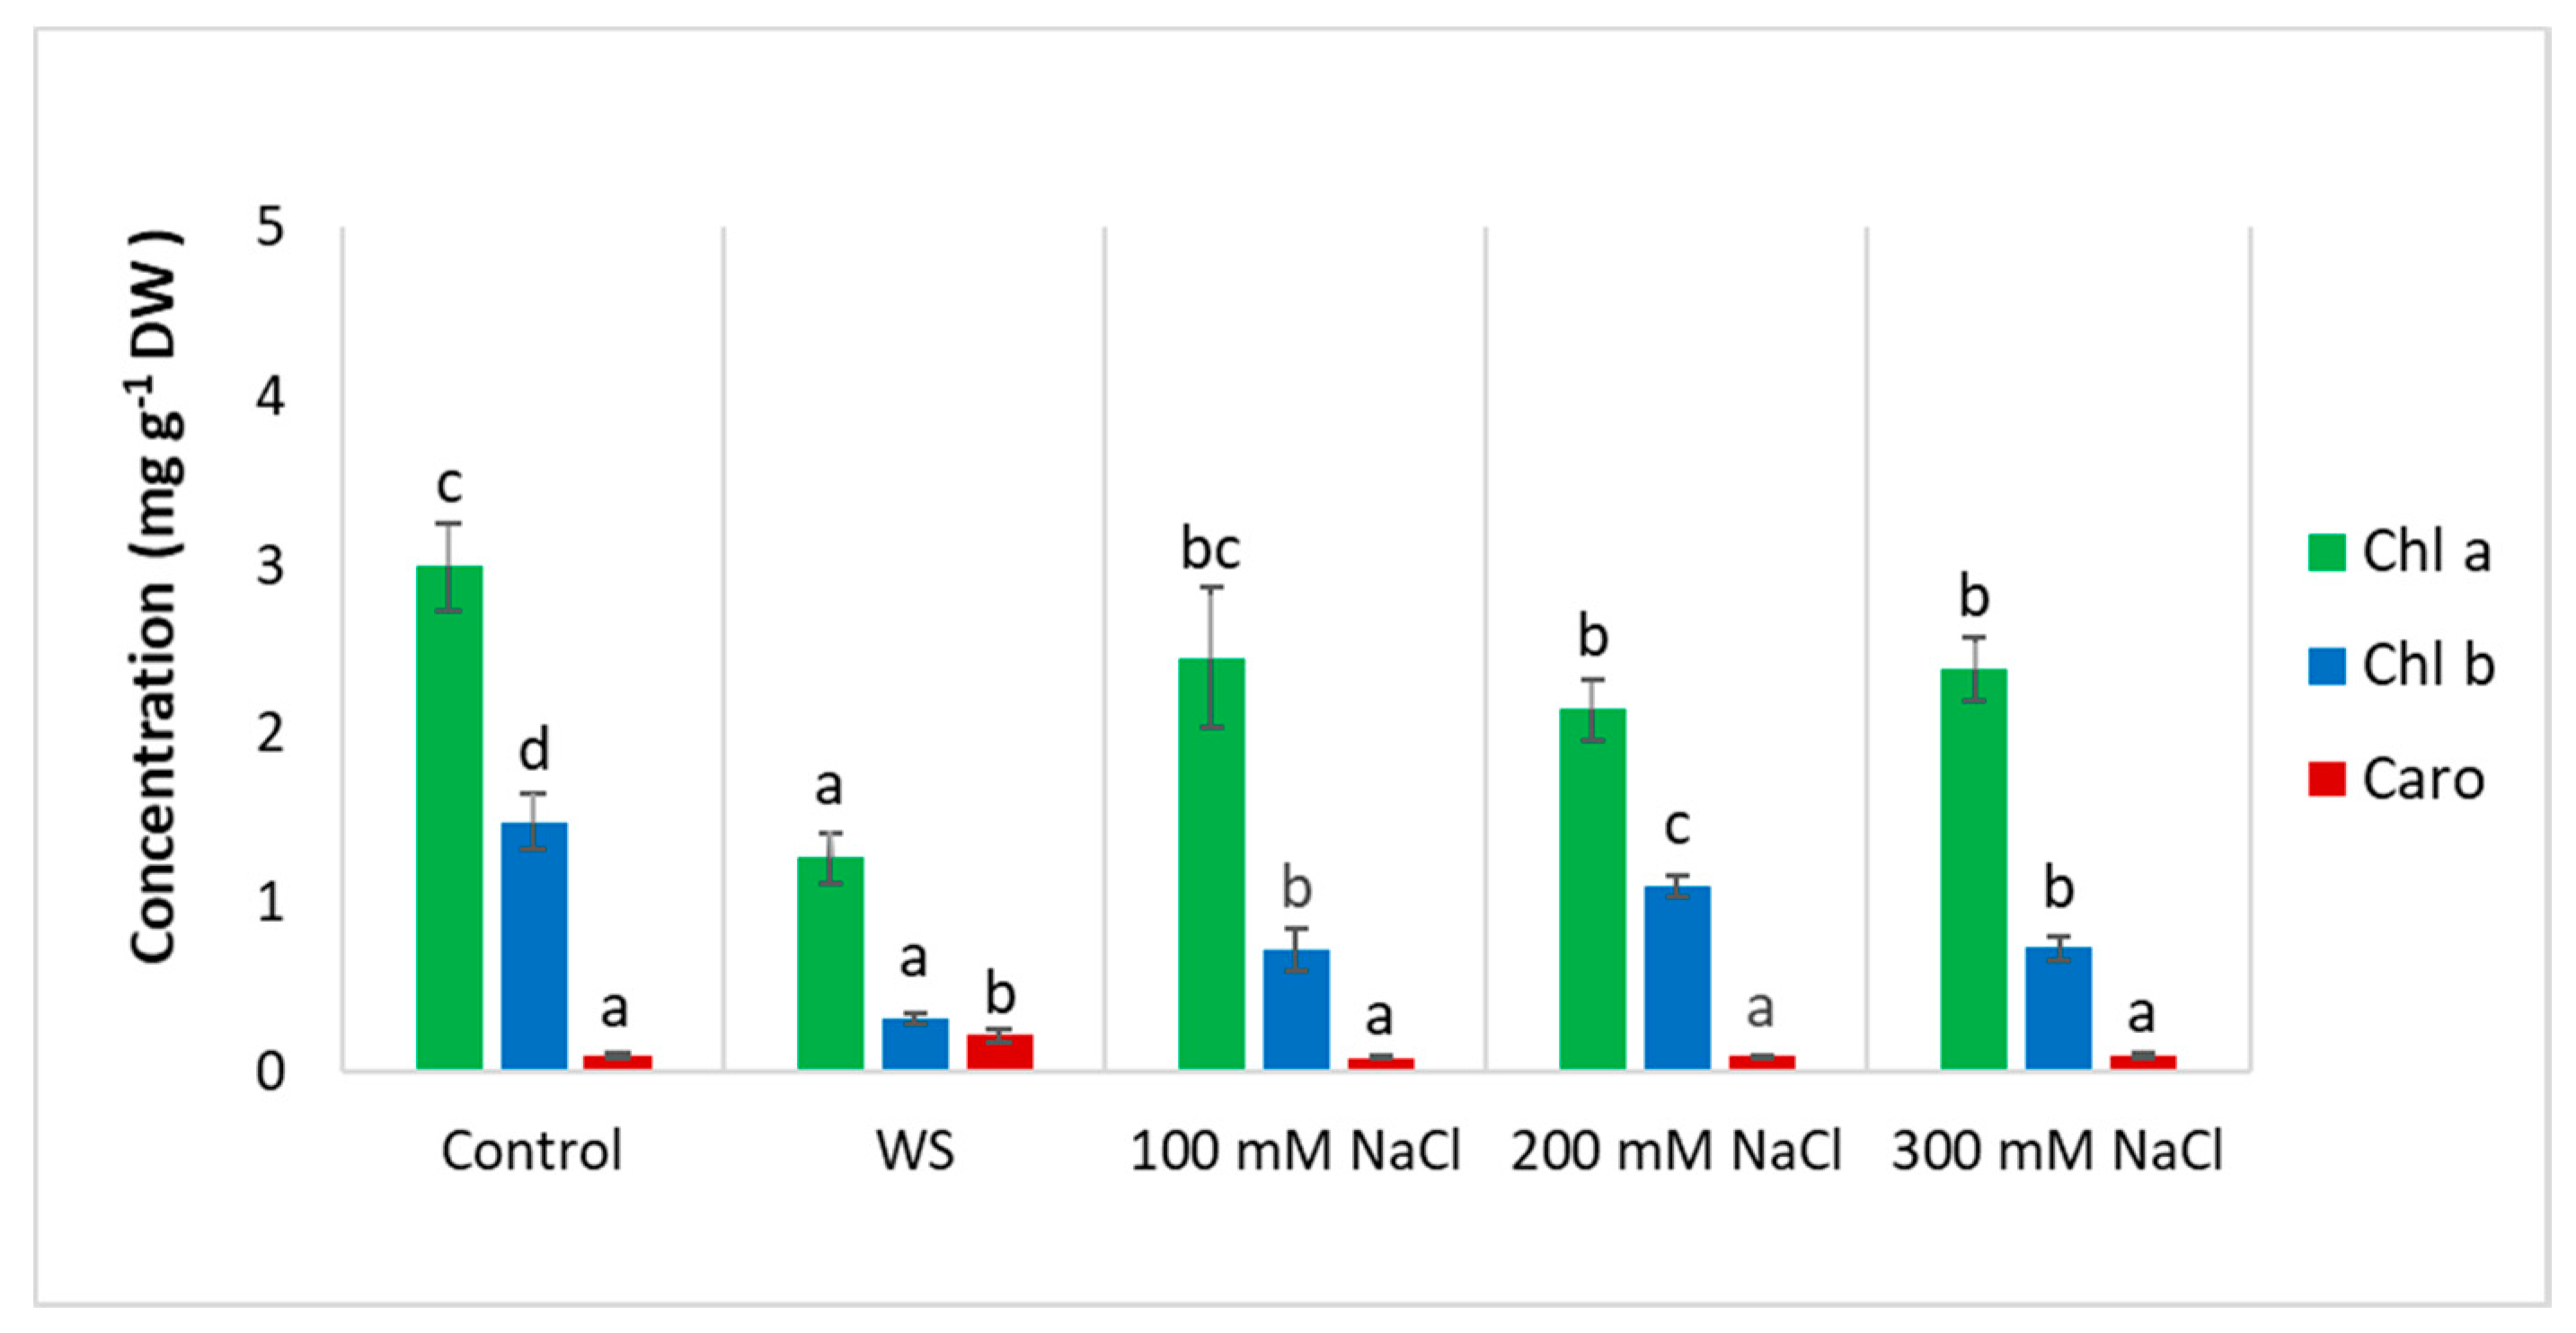
3.3. Photosynthetic Pigments
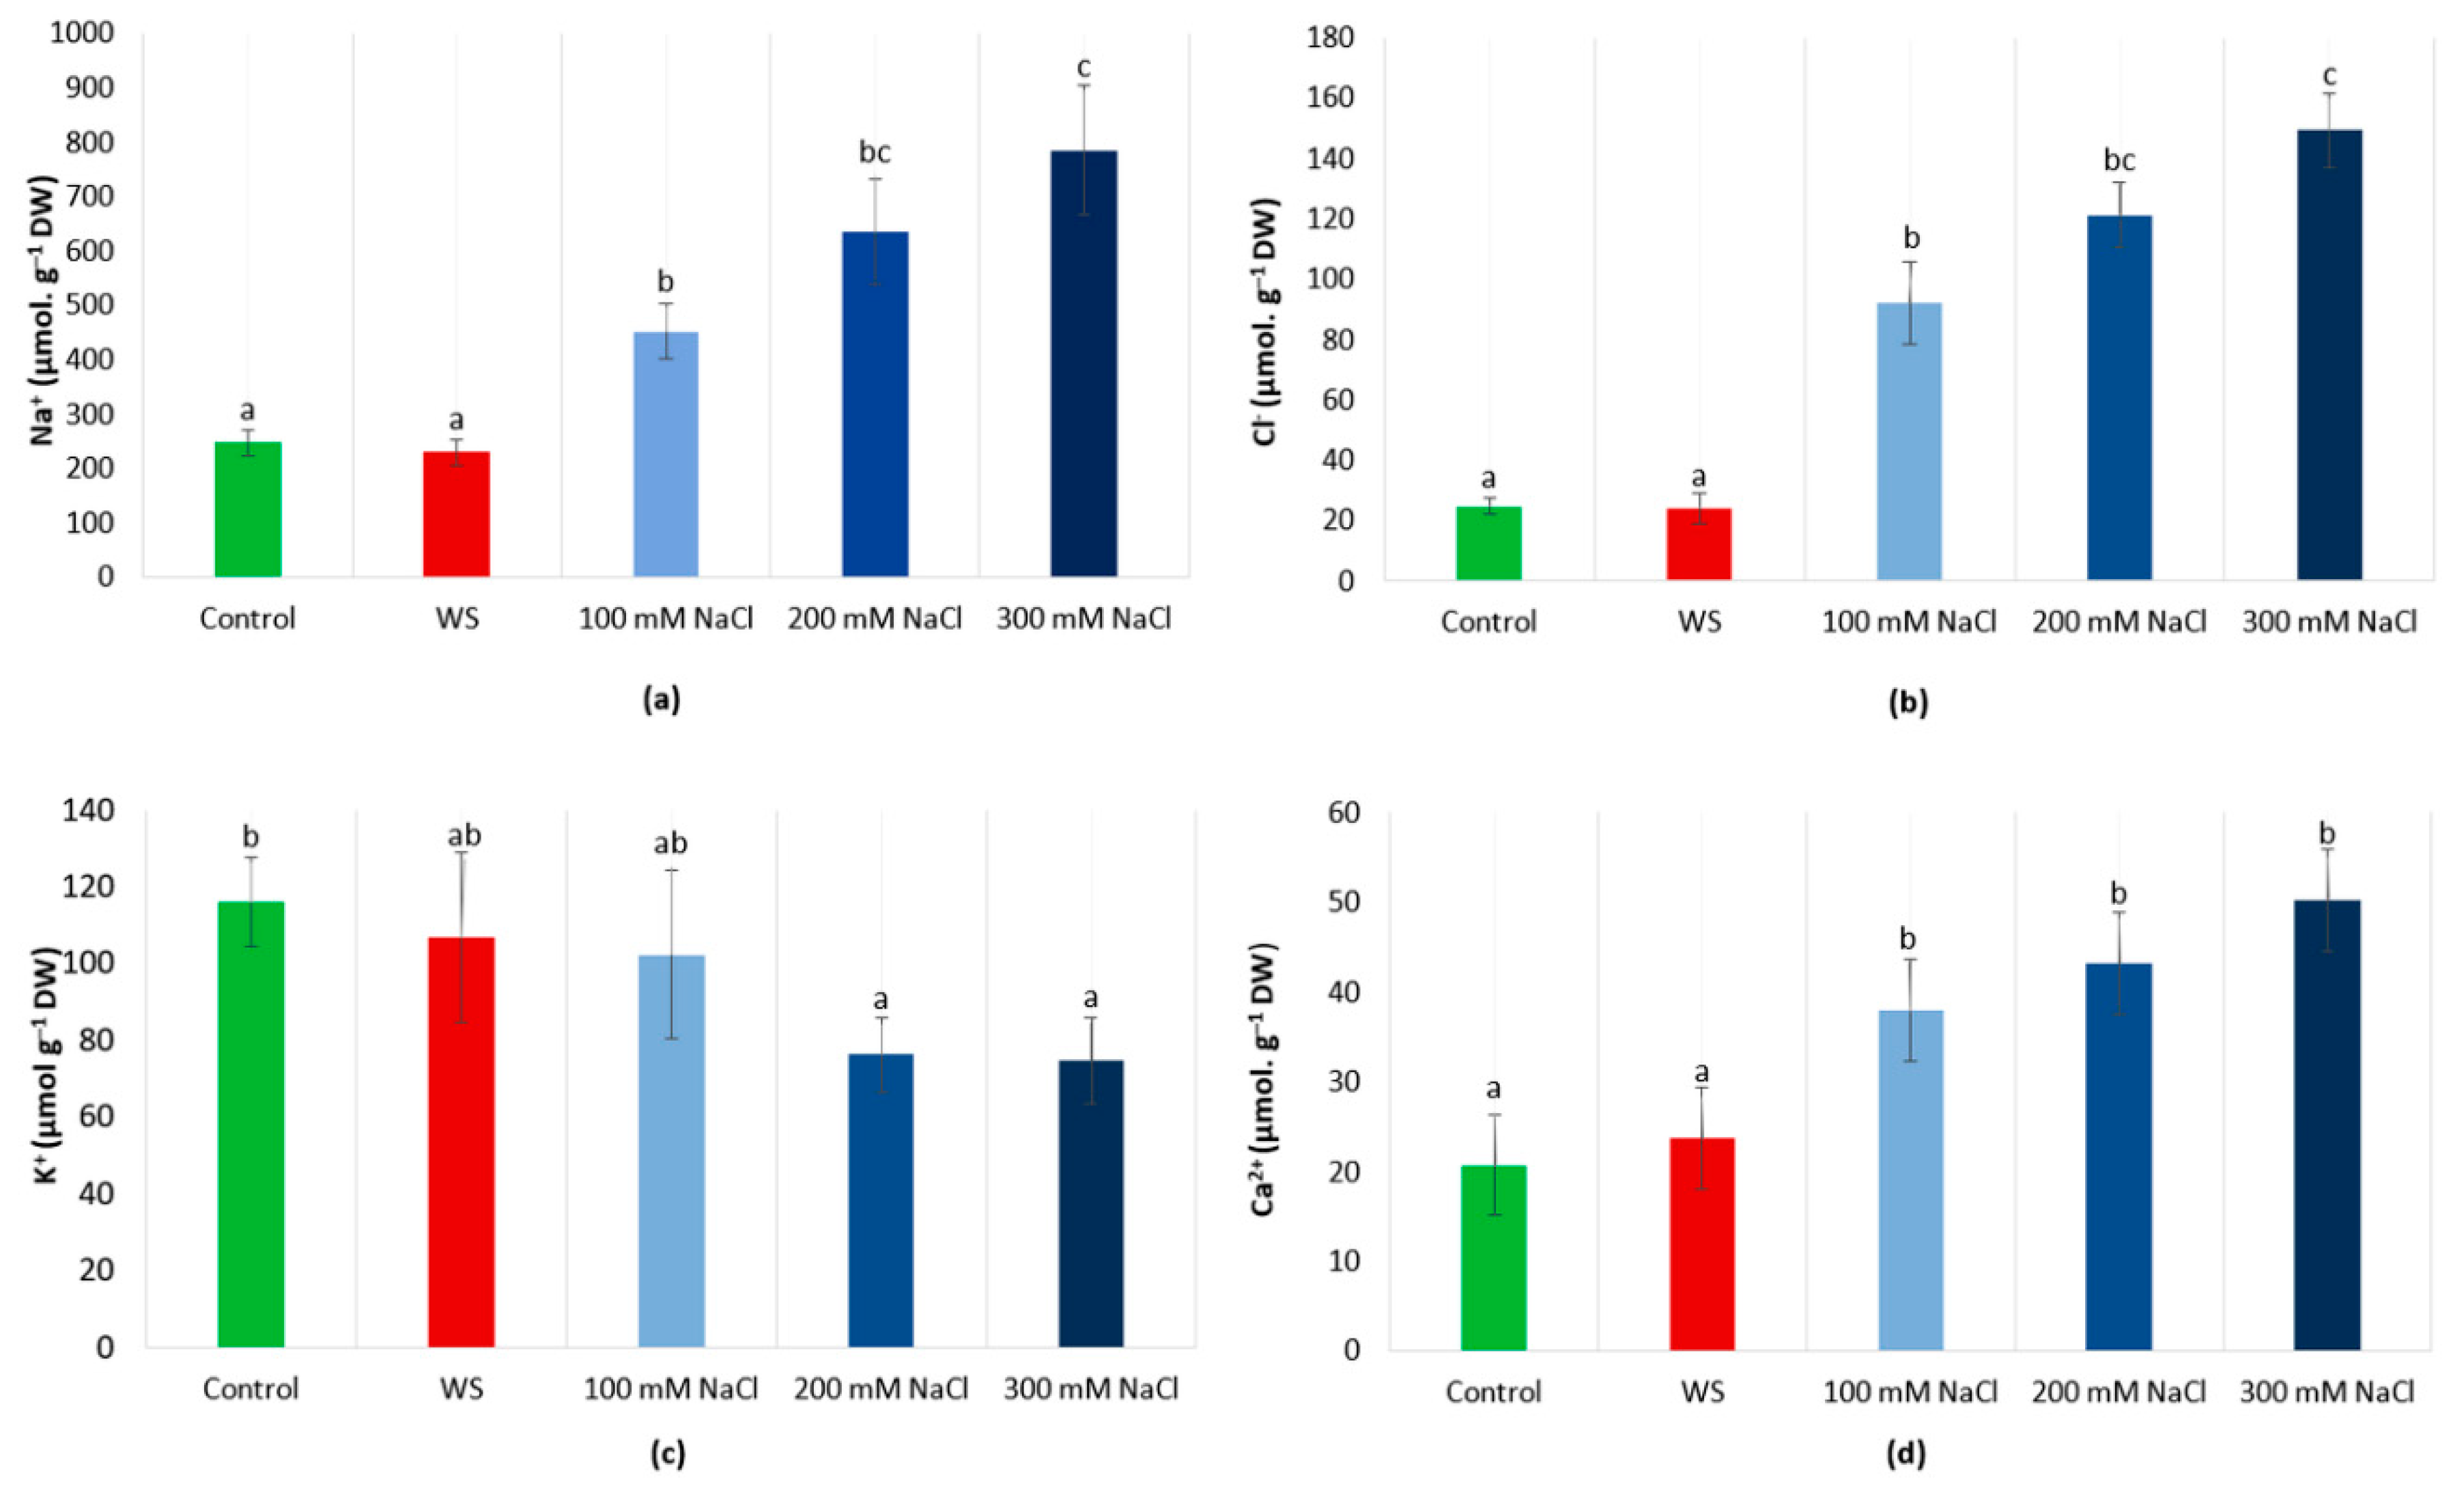
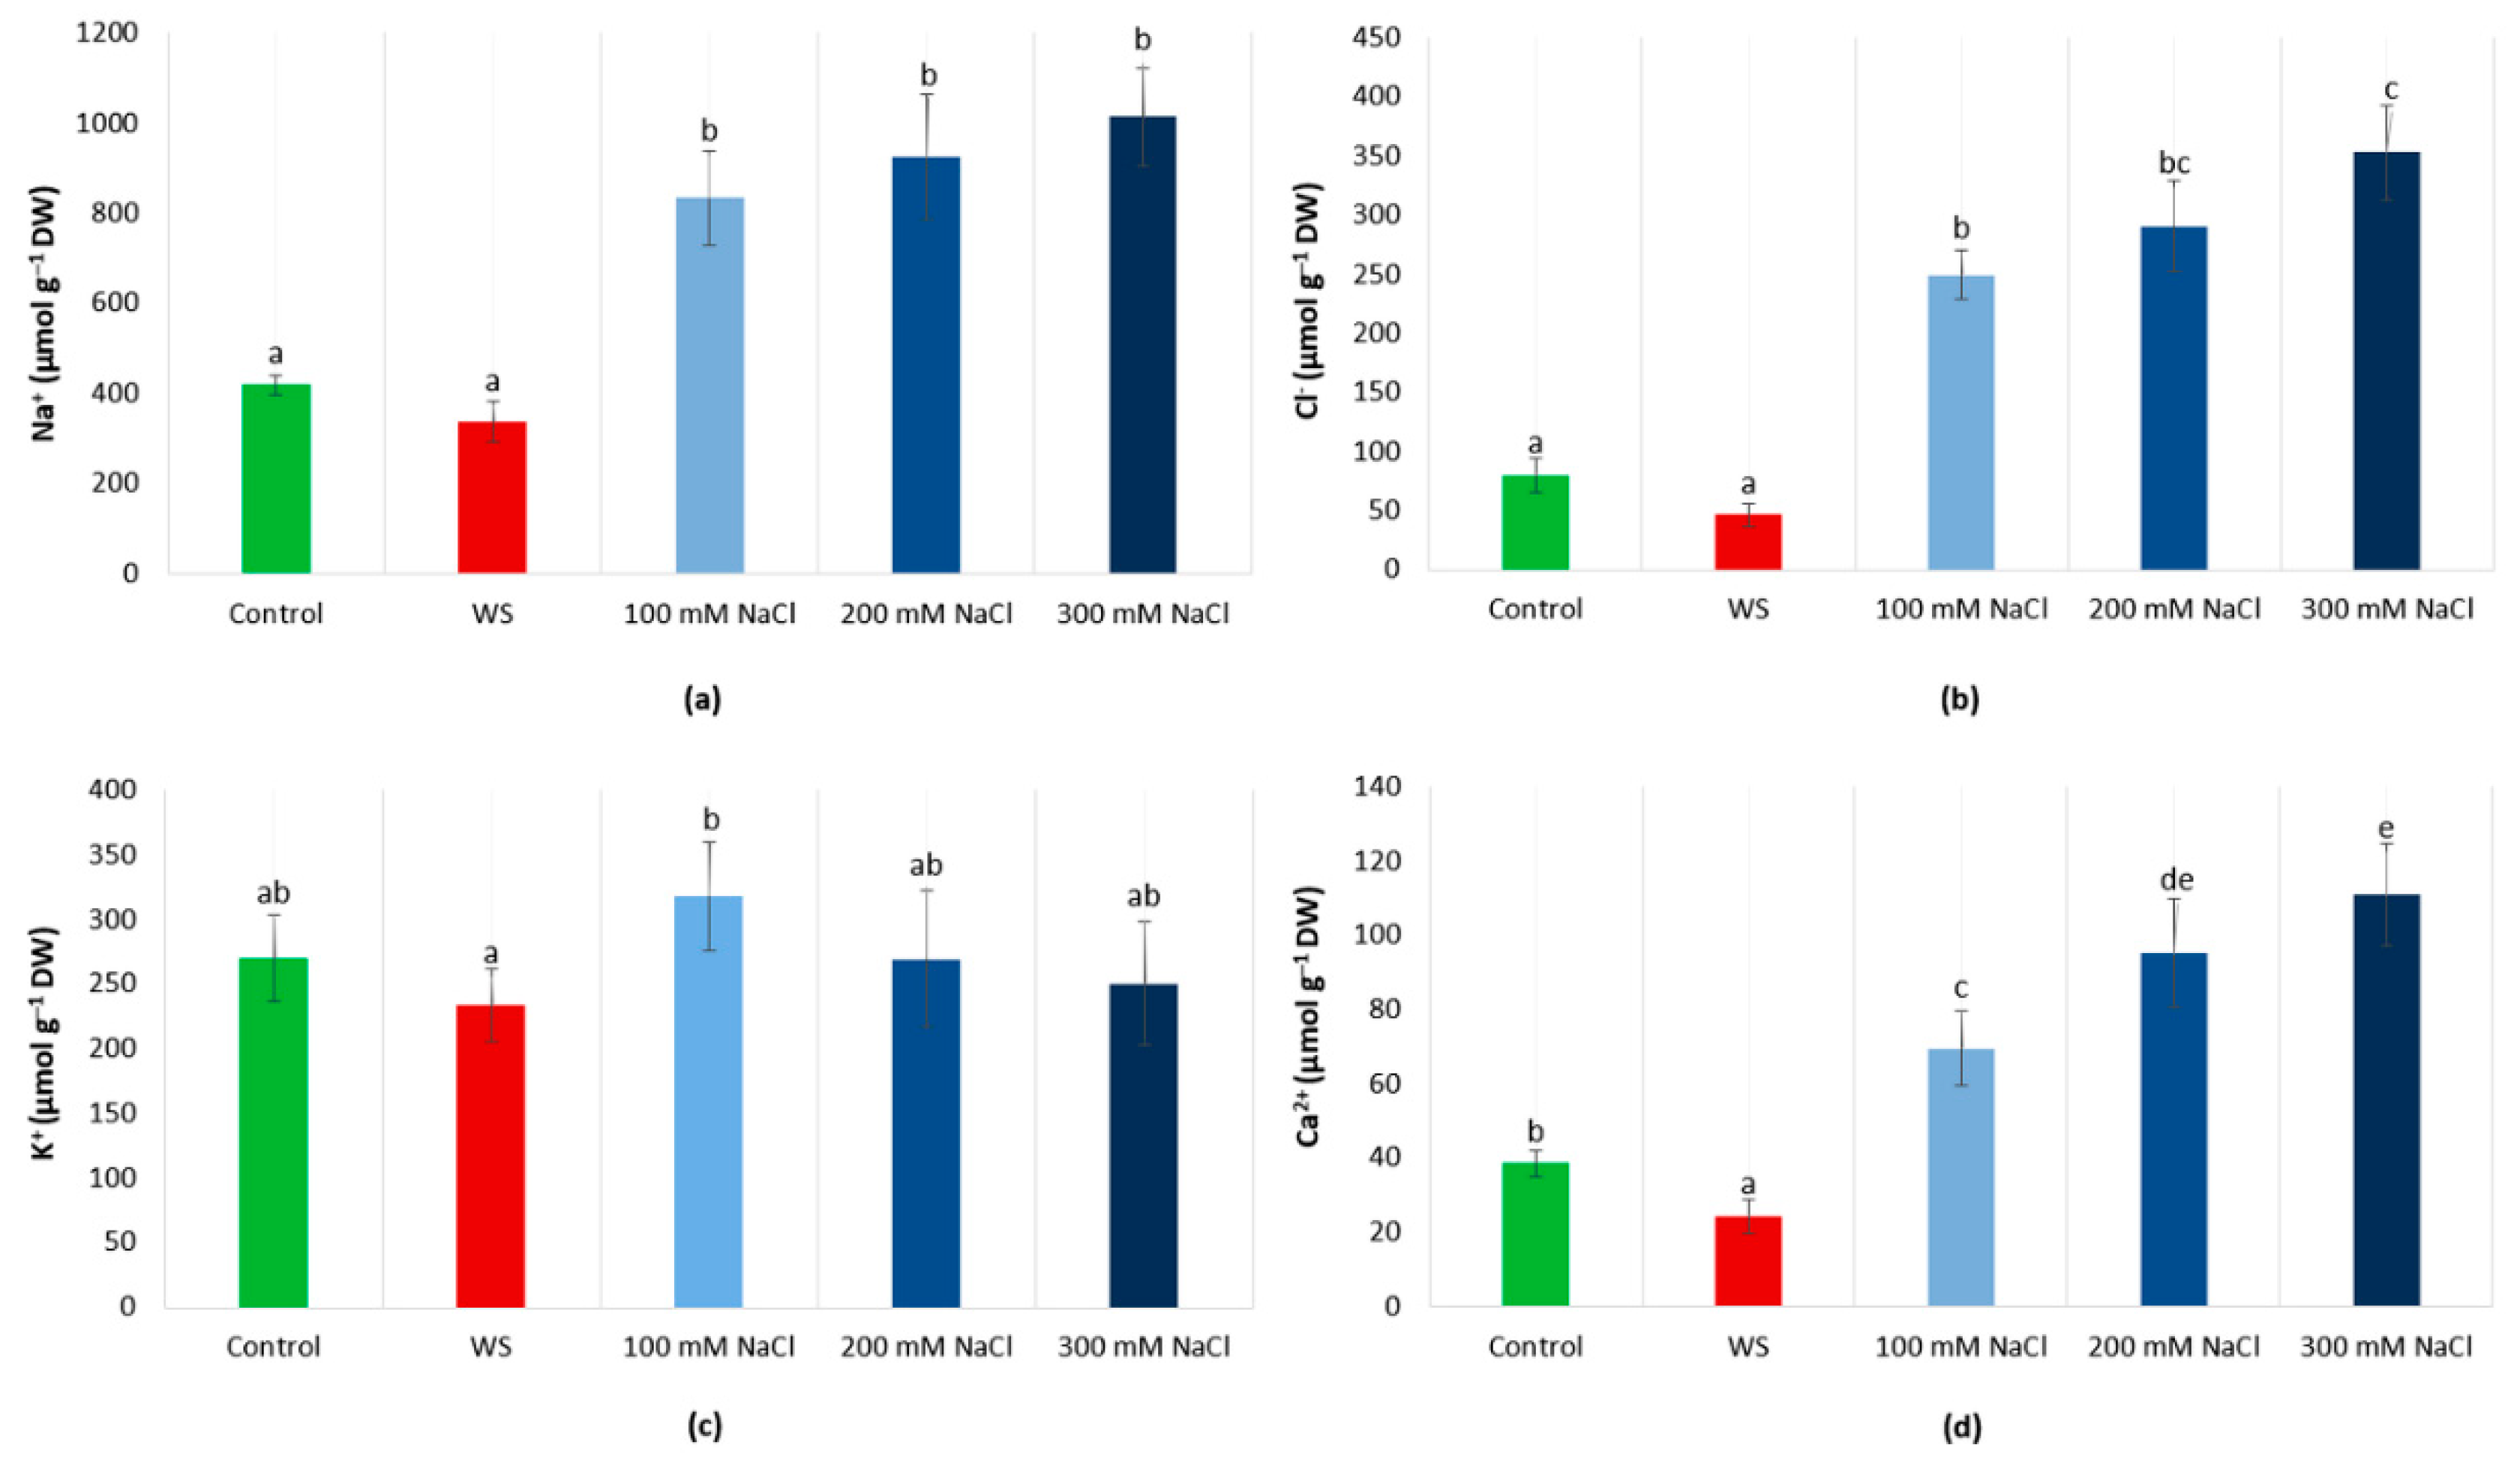
Photosynthetic pigments’ (chlorophylls a and b, carotenoids) concentrations decreased under stress. Seedlings subjected to either water deficit or salinity, showed lower chlorophylls contents than the non-stressed controls, and the differences were statistically significant in all cases, except for Chl a in plants watered with 100 mM NaCl. The strongest relative reductions were observed in water-stressed seedlings (Figure 2). Needle levels of carotenoids were low and, in general, did not show significant differences between treatments, except for the increase observed in response to water stress (Figure 2).

3.4. Ions Levels

As it should be expected, there were no significant differences in the levels of Na+ and Cl between control and drought-stressed plants, neither in needles nor in roots. On the contrary, Na+ and Cl levels were much higher in salt-treated plants than in the non-stressed controls. In the presence of 300 mM NaCl, Na+ contents were about three-fold higher than under non-stress conditions, both in needles and roots (Figure 3a and Figure 4a). On the other hand, the salt treatment induced the accumulation of Cl to concentrations seven-fold (roots) or five-fold (needles) higher than in the corresponding controls (Figure 3b and Figure 4b). For all treatments (controls, water deficit and each NaCl concentration in the irrigation water), both in roots and needles, Na+ concentrations were always higher than those of Cl under the same conditions. When comparing Na+ and Cl contents between roots and needles, they were always substantially higher in needles, for each treatment and the two ions (compare Figure 4a with Figure 3a, and Figure 4b with Figure 3b). It is interesting to note the high Na+ concentration (about 400 µmol g−1 DW) measured in needles of control plants, in the absence of salt (Figure 4a).
Ca2+ and K+ levels were also higher in the needles than in the roots, in the controls and for all applied treatments (Figure 3c,d and Figure 4c,d). Mean K+ contents generally decreased in roots and needles of water-stressed seedlings, and in response to salt stress in a concentration-dependent manner. Still, the differences with the non-stressed controls were statistically significant only in roots and in the presence of 200 or 300 mM NaCl (Figure 3c and Figure 4c). As compared to the controls, mean Ca2+ concentrations increased in parallel to external salinity, both in roots and in needles, but significant differences were found only in needles. This effect was not observed under water deficit conditions (Figure 3d and Figure 4d).

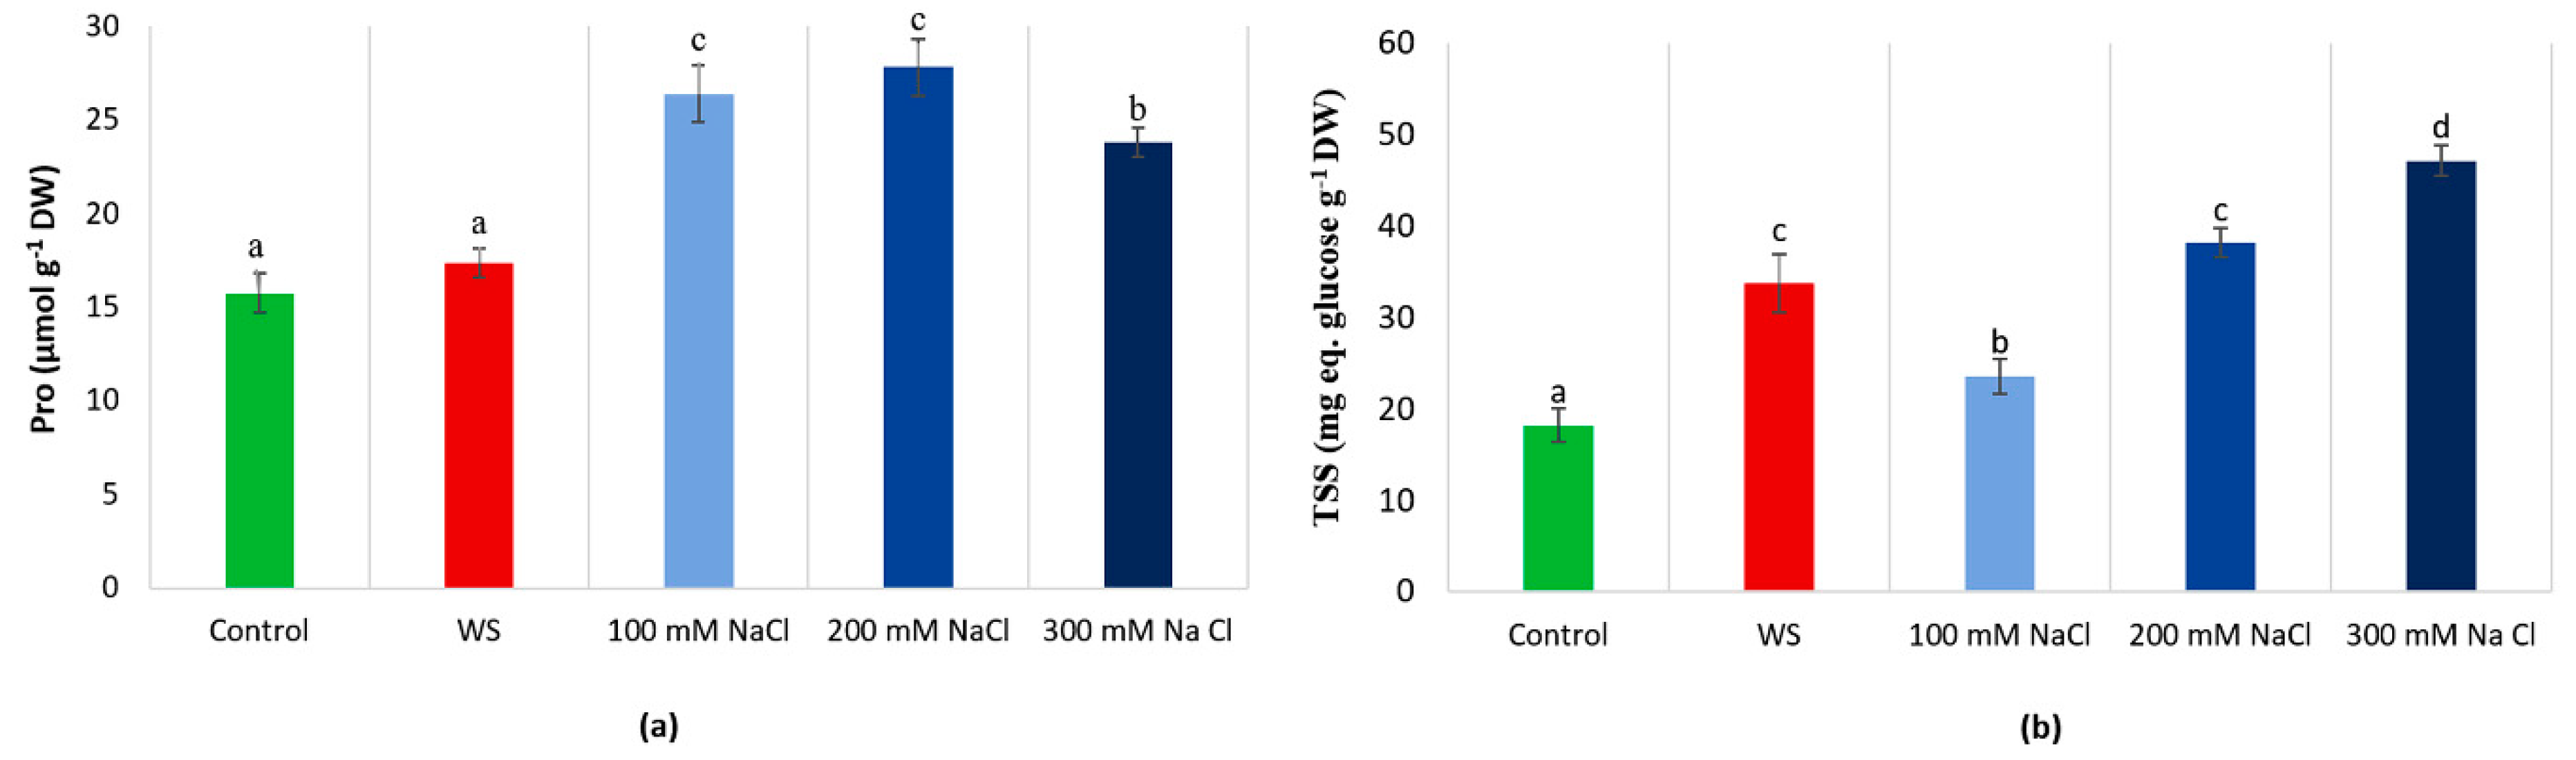
3.5. Osmolyte Contents

Osmolyte biosynthesis is a general response of all organisms, including plants, to environmental conditions that generate osmotic stress, such as salinity or drought. The accumulation of these compatible solutes helps maintain osmotic balance, minimising or even avoiding cell dehydration. In this study, we measured the levels of the two main plant osmolytes: proline (Pro) and total soluble sugars (TSS), in needles of A. alba seedlings after the water and salt stress treatments. For this species, under our experimental conditions, Pro concentrations were low (less than 15 µmol g−1 DW) in the control plants, and did not vary significantly in the plants subjected for one month to the water deficit conditions; however, a significant increase of about two-fold was observed in the presence of salt (Figure 5a). The mean TSS level in non-stressed seedlings was 20 mg eq. glucose g−1 DW, approximately, and increased significantly, both under water deficit and salt stress conditions, in the latter case, in a clear concentration-dependent manner, reaching a maximum value of ca. 50 mg eq. glucose g−1 DW (Figure 5b).

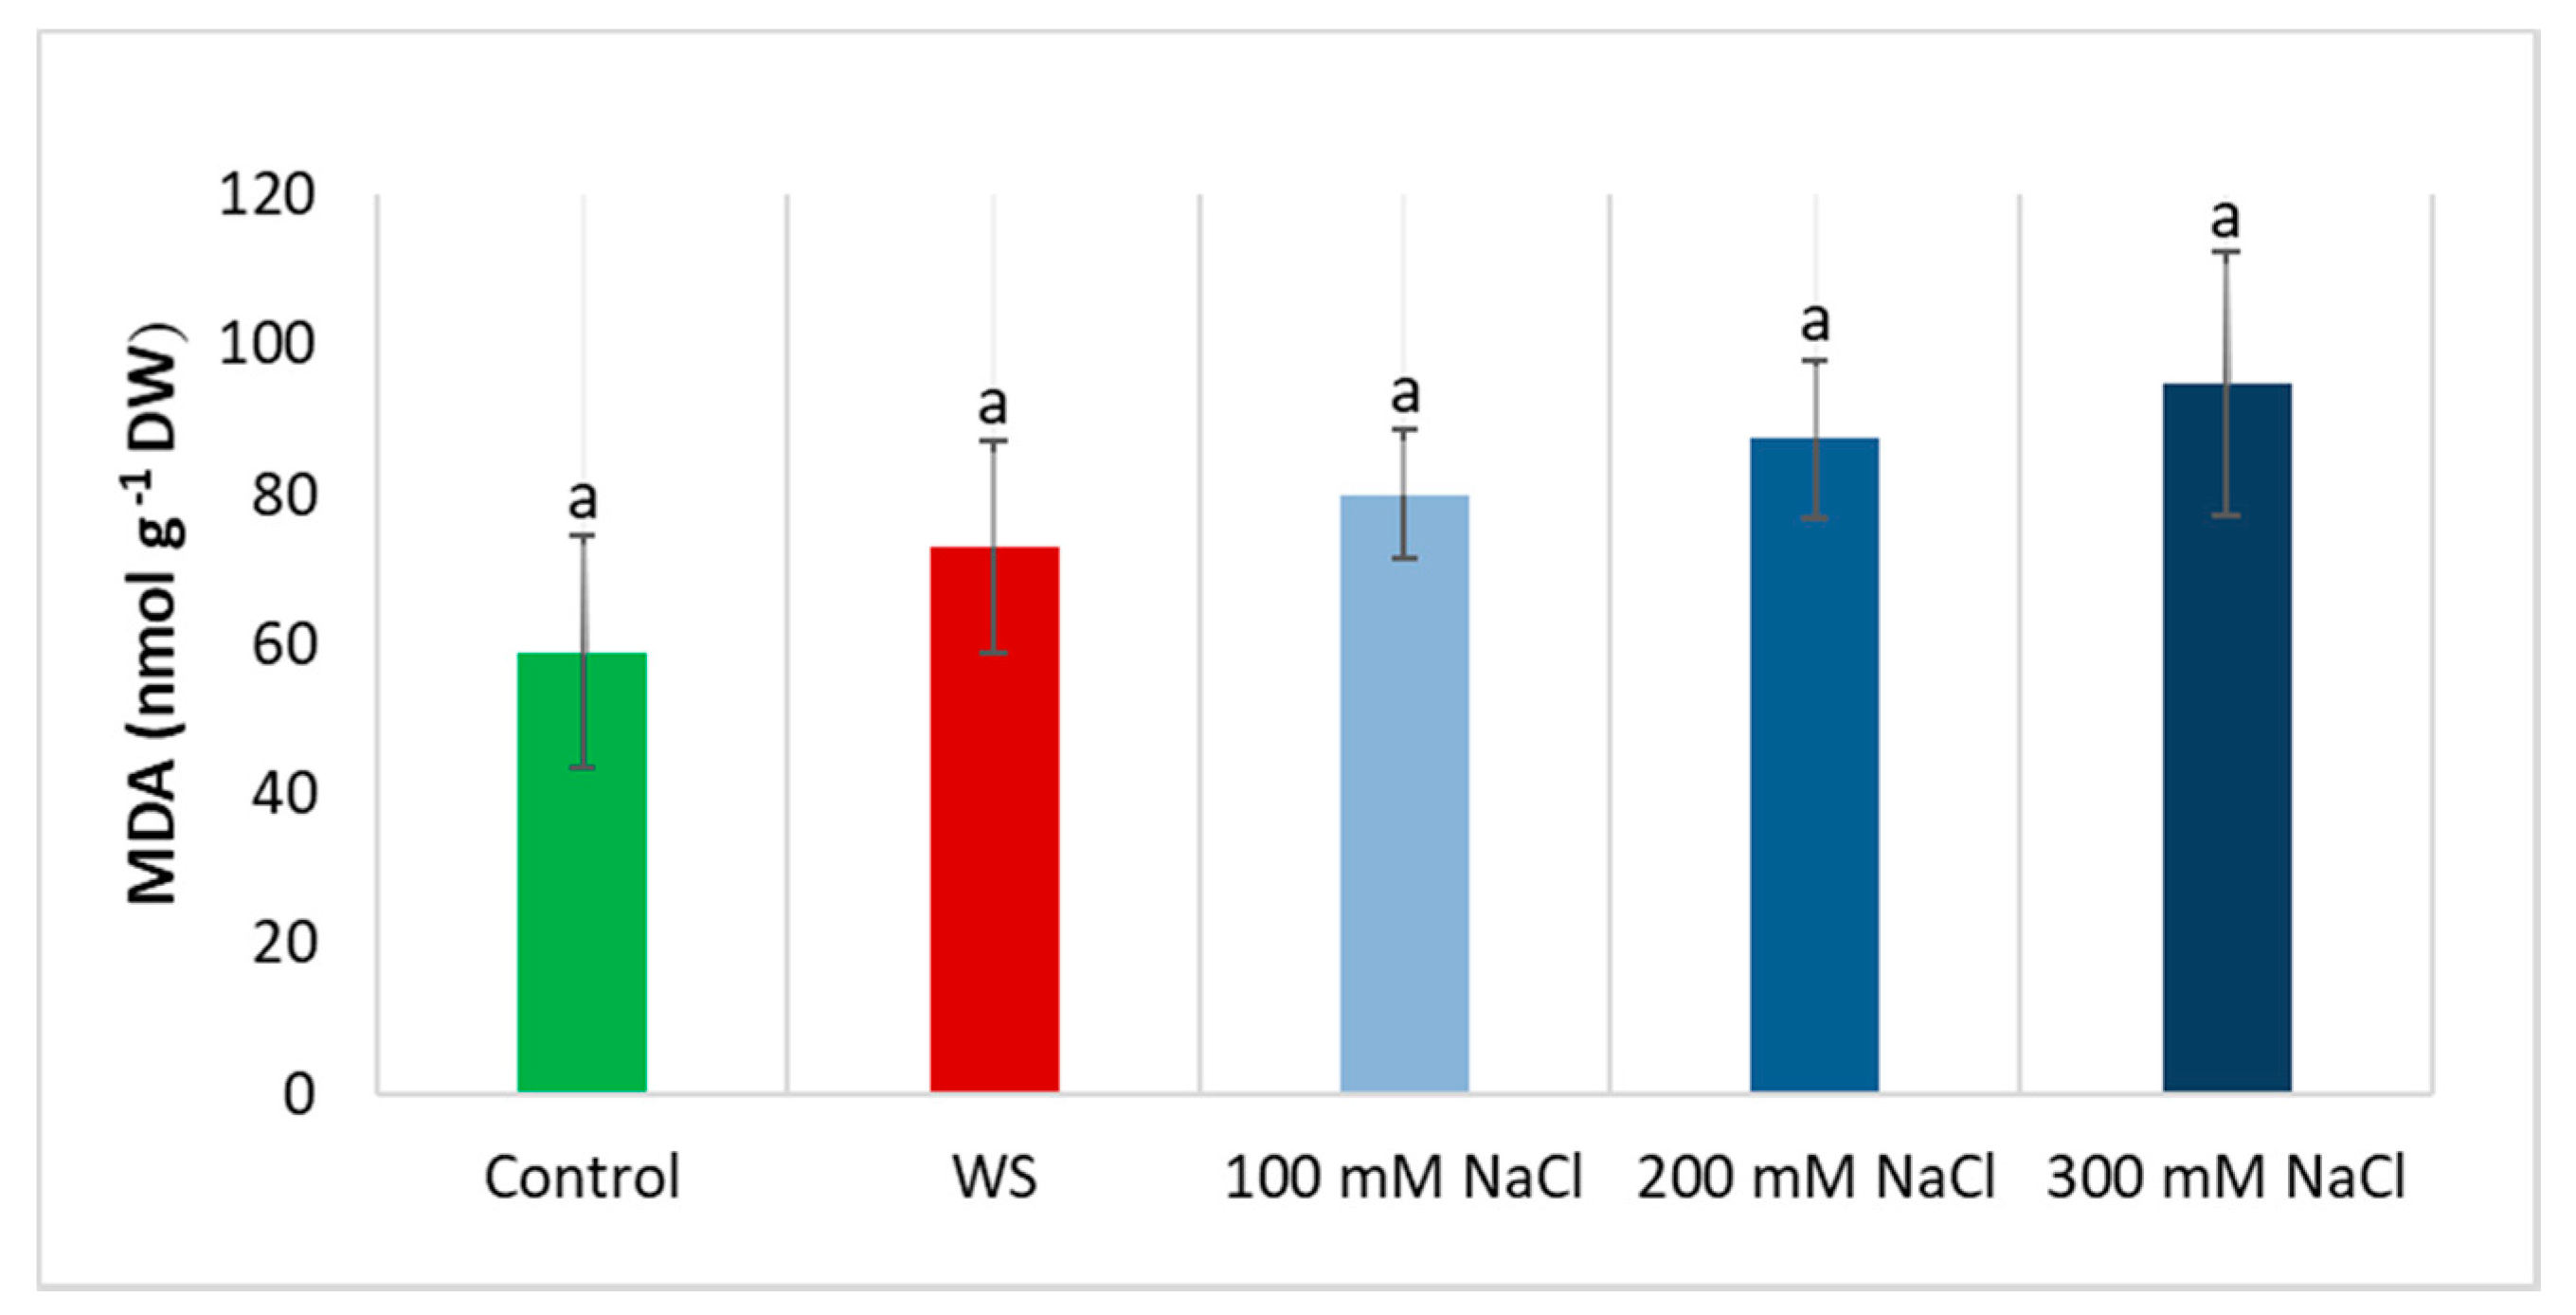
3.6. Oxidative Stress

Malondialdehyde (MDA) is a product of lipid peroxidation, often employed as a reliable biomarker of cellular oxidative stress [54]. Needle MAD concentrations were determined in silver fir seedlings after the stress treatments. When compared to control values, mean MDA contents showed small increases under water deficit conditions, as well as with growing external salinity. The observed differences, however, were not statistically significant (Figure 6).

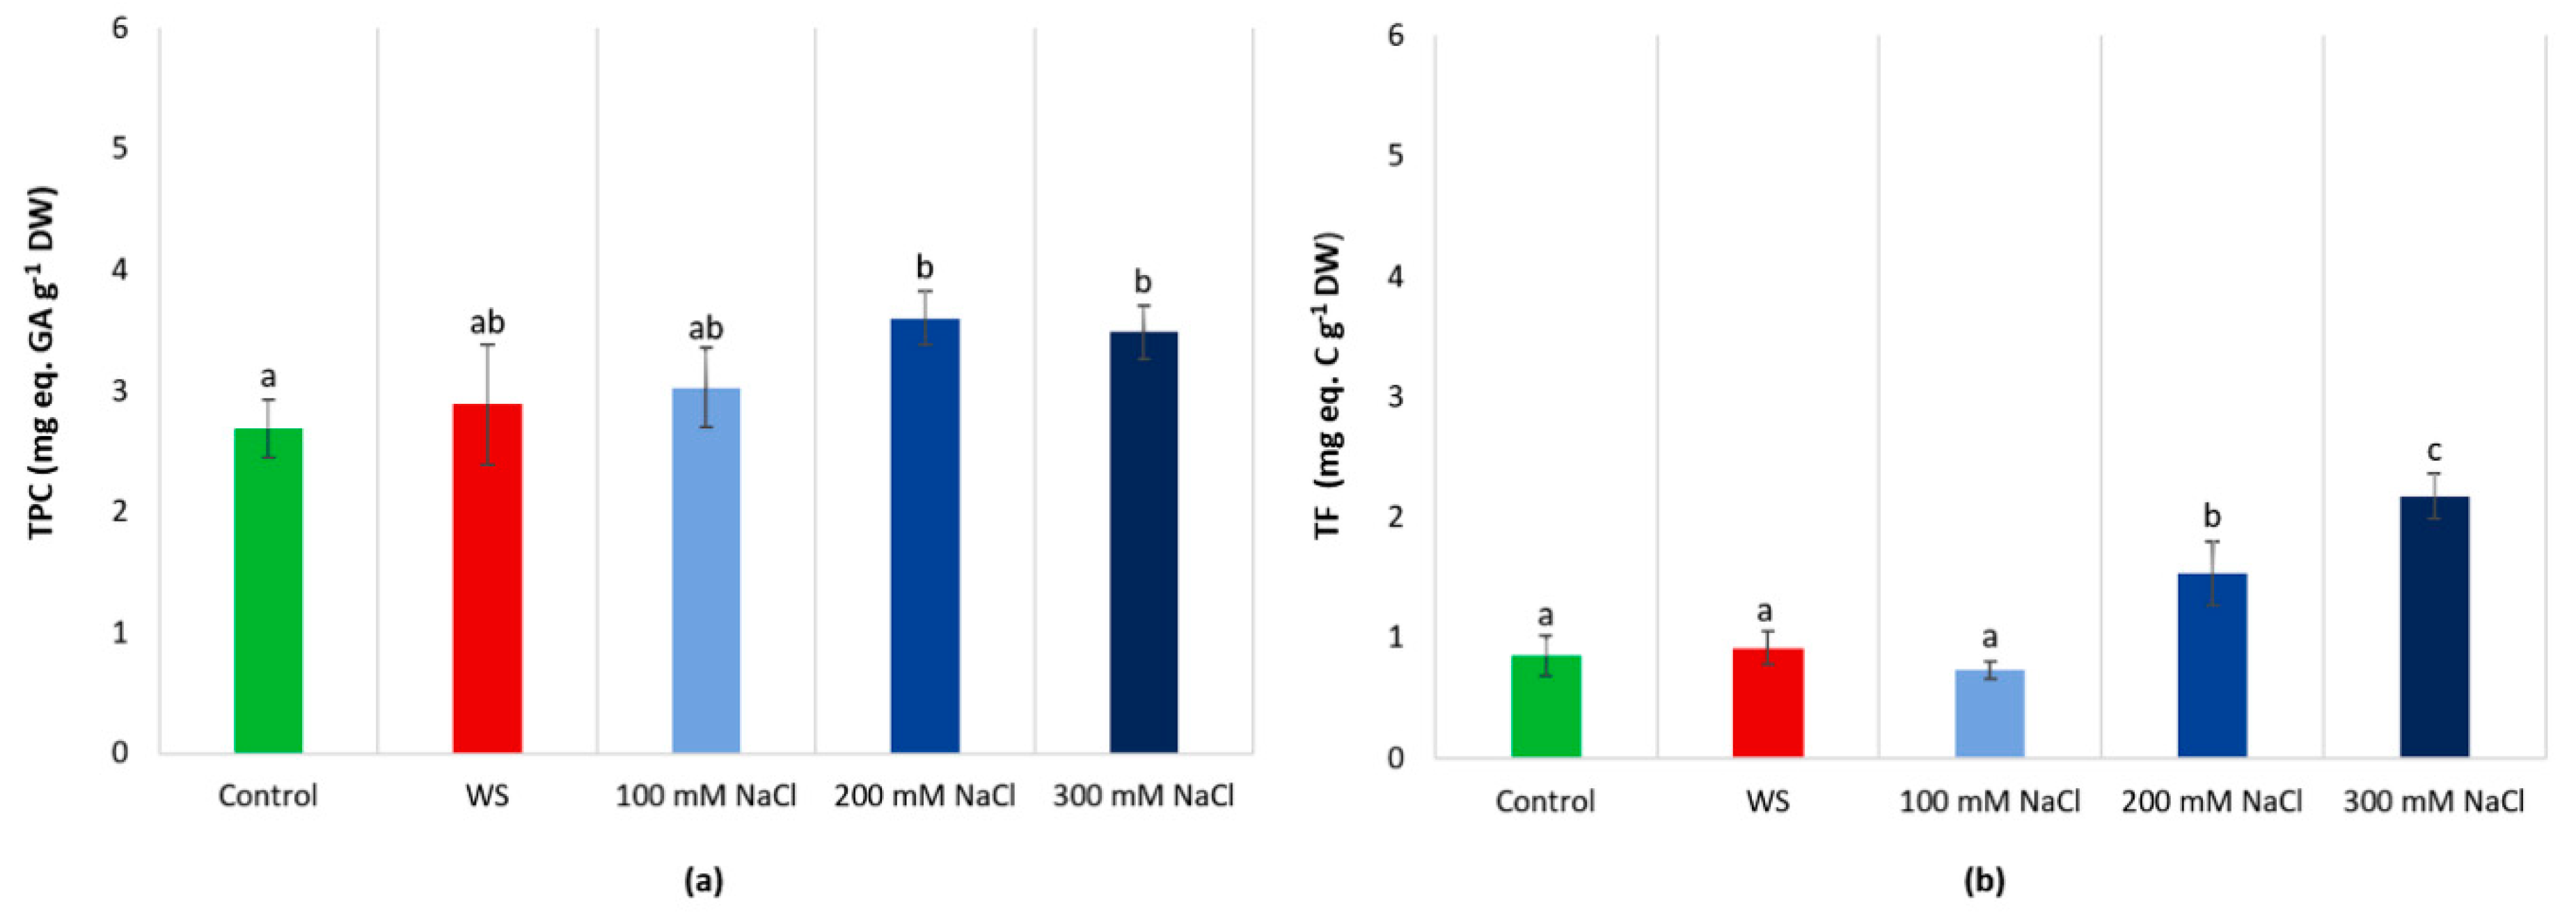
3.7. Non-Enzymatic Antioxidants

No significant changes in the needle concentrations of total phenolic compounds (TPC, Figure 7a) or total flavonoids (TF, Figure 7b), were observed when comparing the control, non-stressed plants to those subjected to the water deficit treatment or grown in the presence of low salt concentration (100 mM NaCl). At higher salinities (200 and 300 mM NaCl), however, a significant increase in TPC and TF needle contents was observed. In any case, the absolute levels of the antioxidants and their relative accumulation compared to the control samples were small, with a maximum of about two-fold in the presence of the highest salt concentration tested for TF, and even less for TPC (Figure 7).

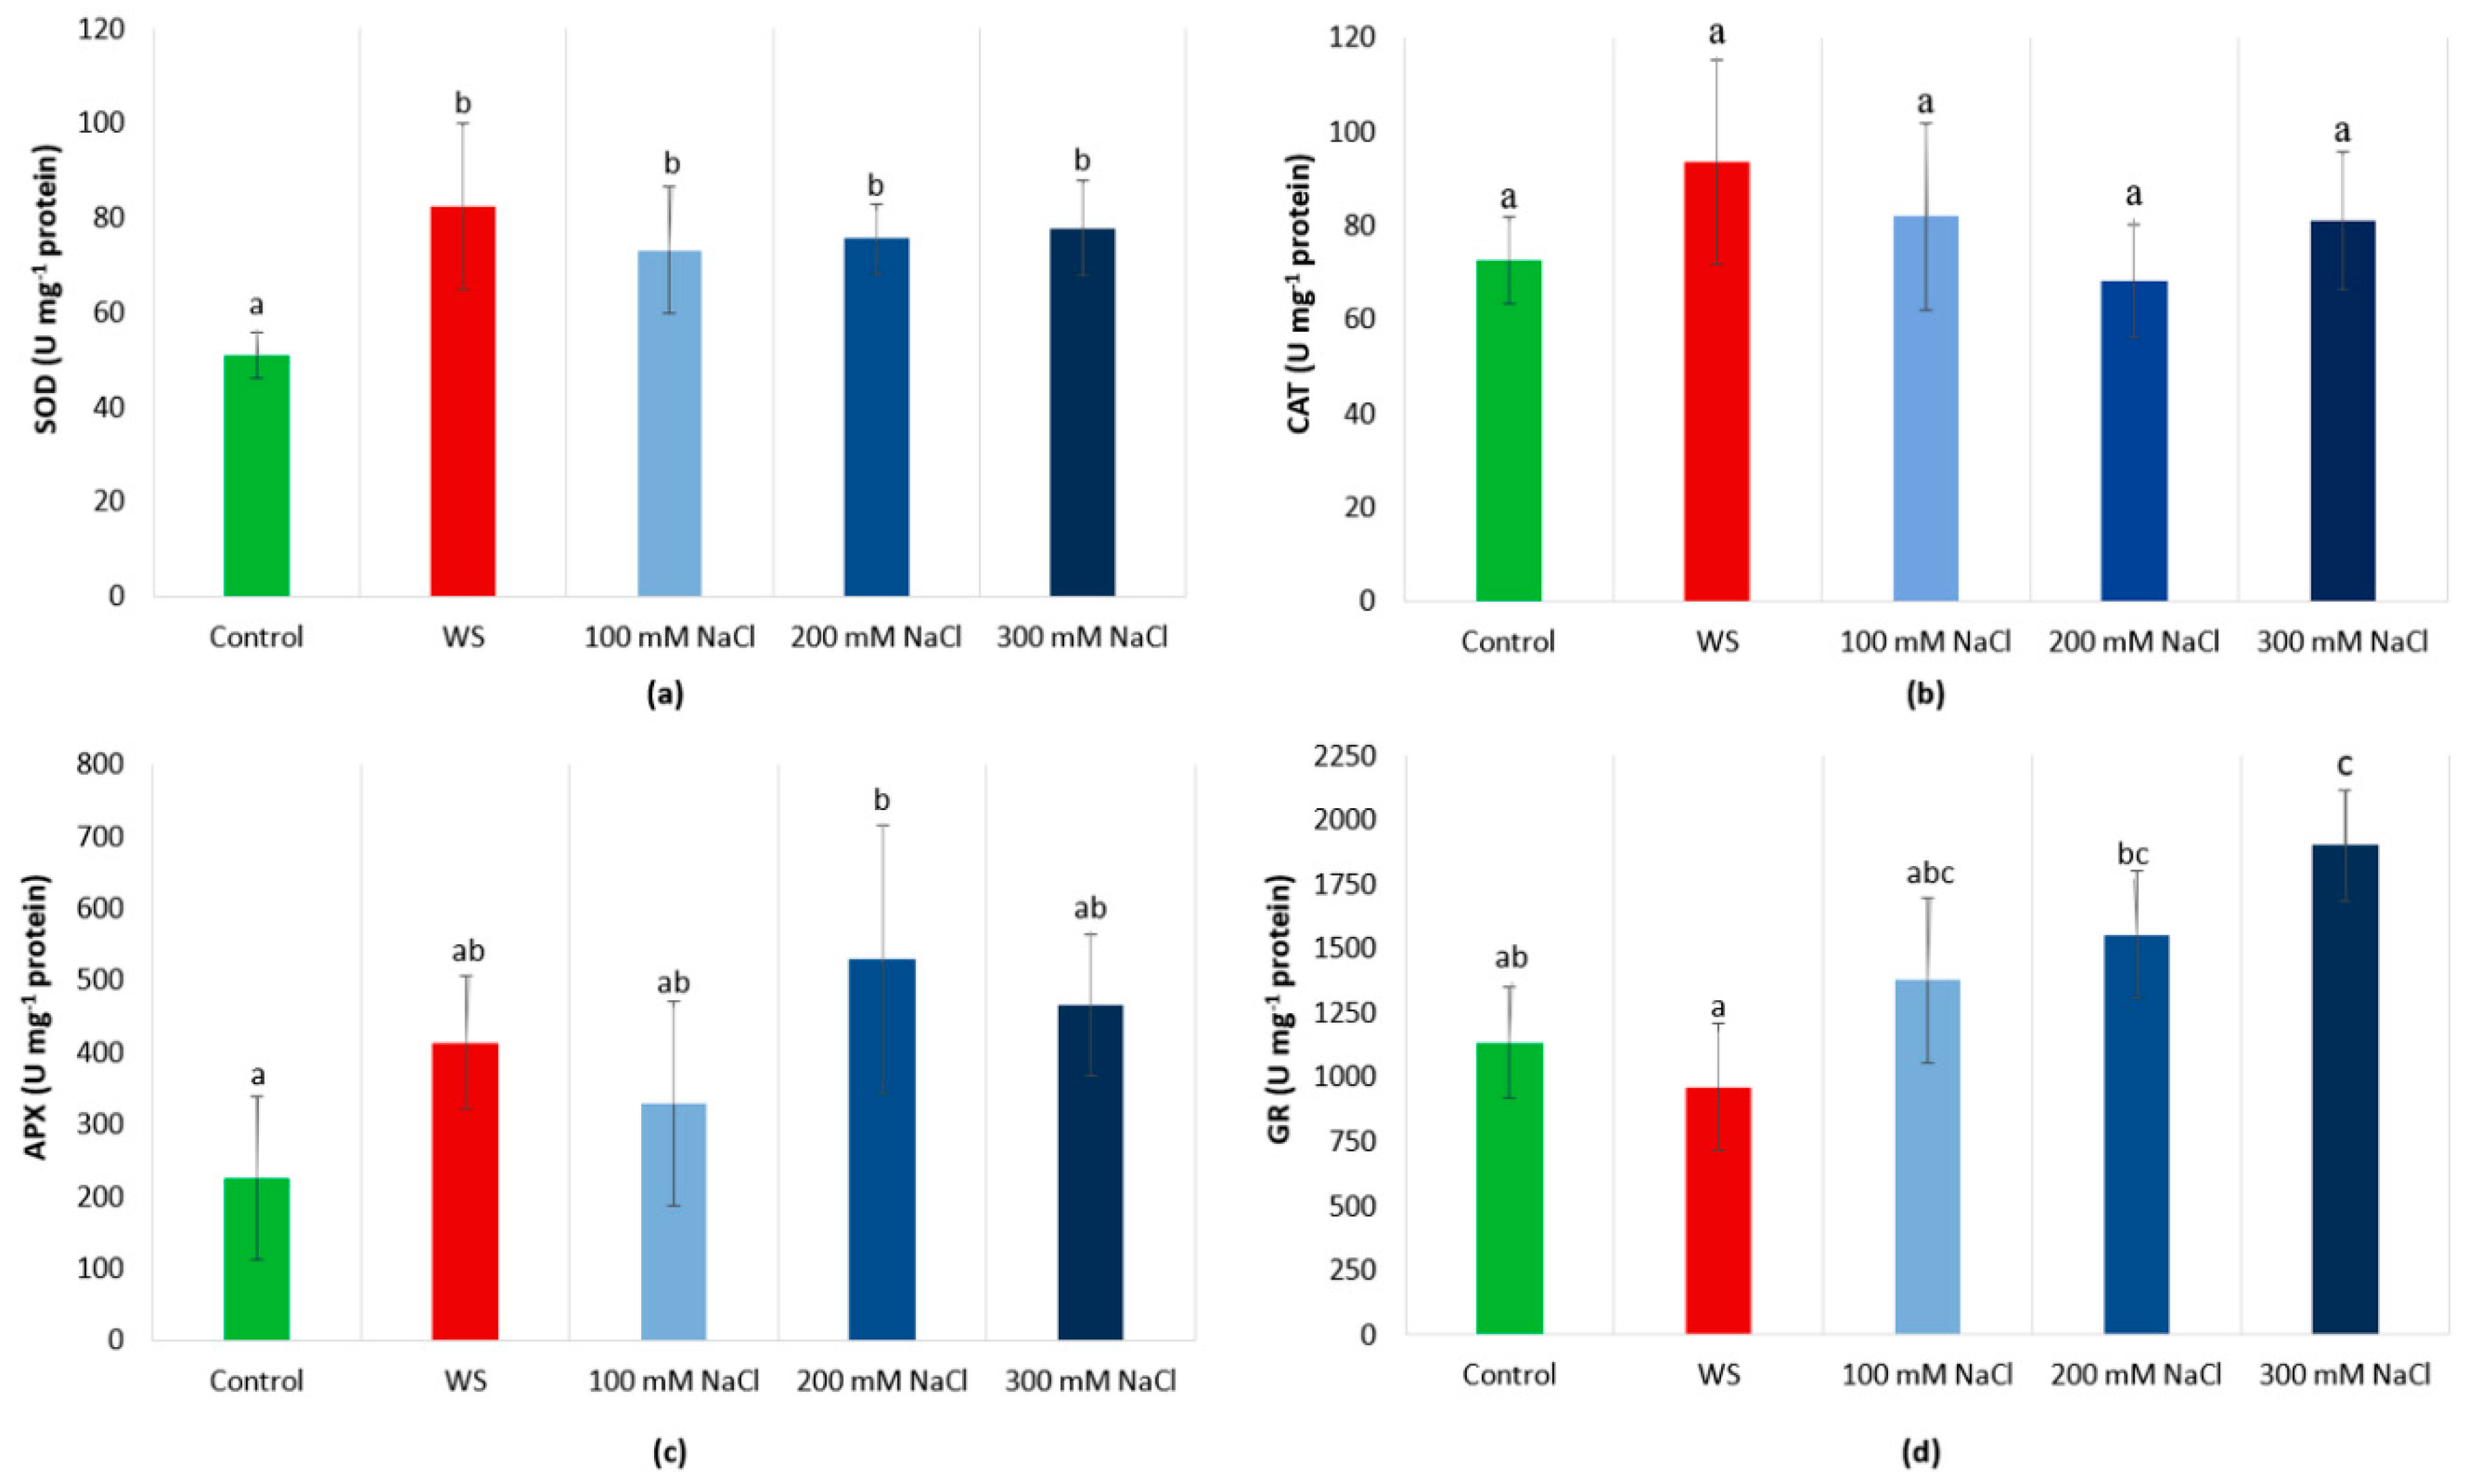
3.8. Antioxidant Enzyme Activities

The specific activities for some of the most important antioxidant enzymatic systems: SOD, CAT, APX and GR, were calculated in protein extracts prepared from all collected needle samples (Figure 8). A slight increase in the average values of the specific activities of all tested enzymes, except GR, was detected under water deficit conditions. However, the differences with the corresponding controls were statistically significant only for SOD. Regarding salt stress conditions, CAT-specific activity did not vary significantly for any of the applied treatments (Figure 8b), whereas for the other three enzymes, a slight, but significant, increase was observed, either at all NaCl concentrations (SOD, Figure 8a) or only at medium and high salinities (APX, Figure 8c; GR, Figure 8d). These data are also in agreement with the relatively low level of oxidative stress induced by water deficit or salinity in A. alba seedlings under our experimental conditions.

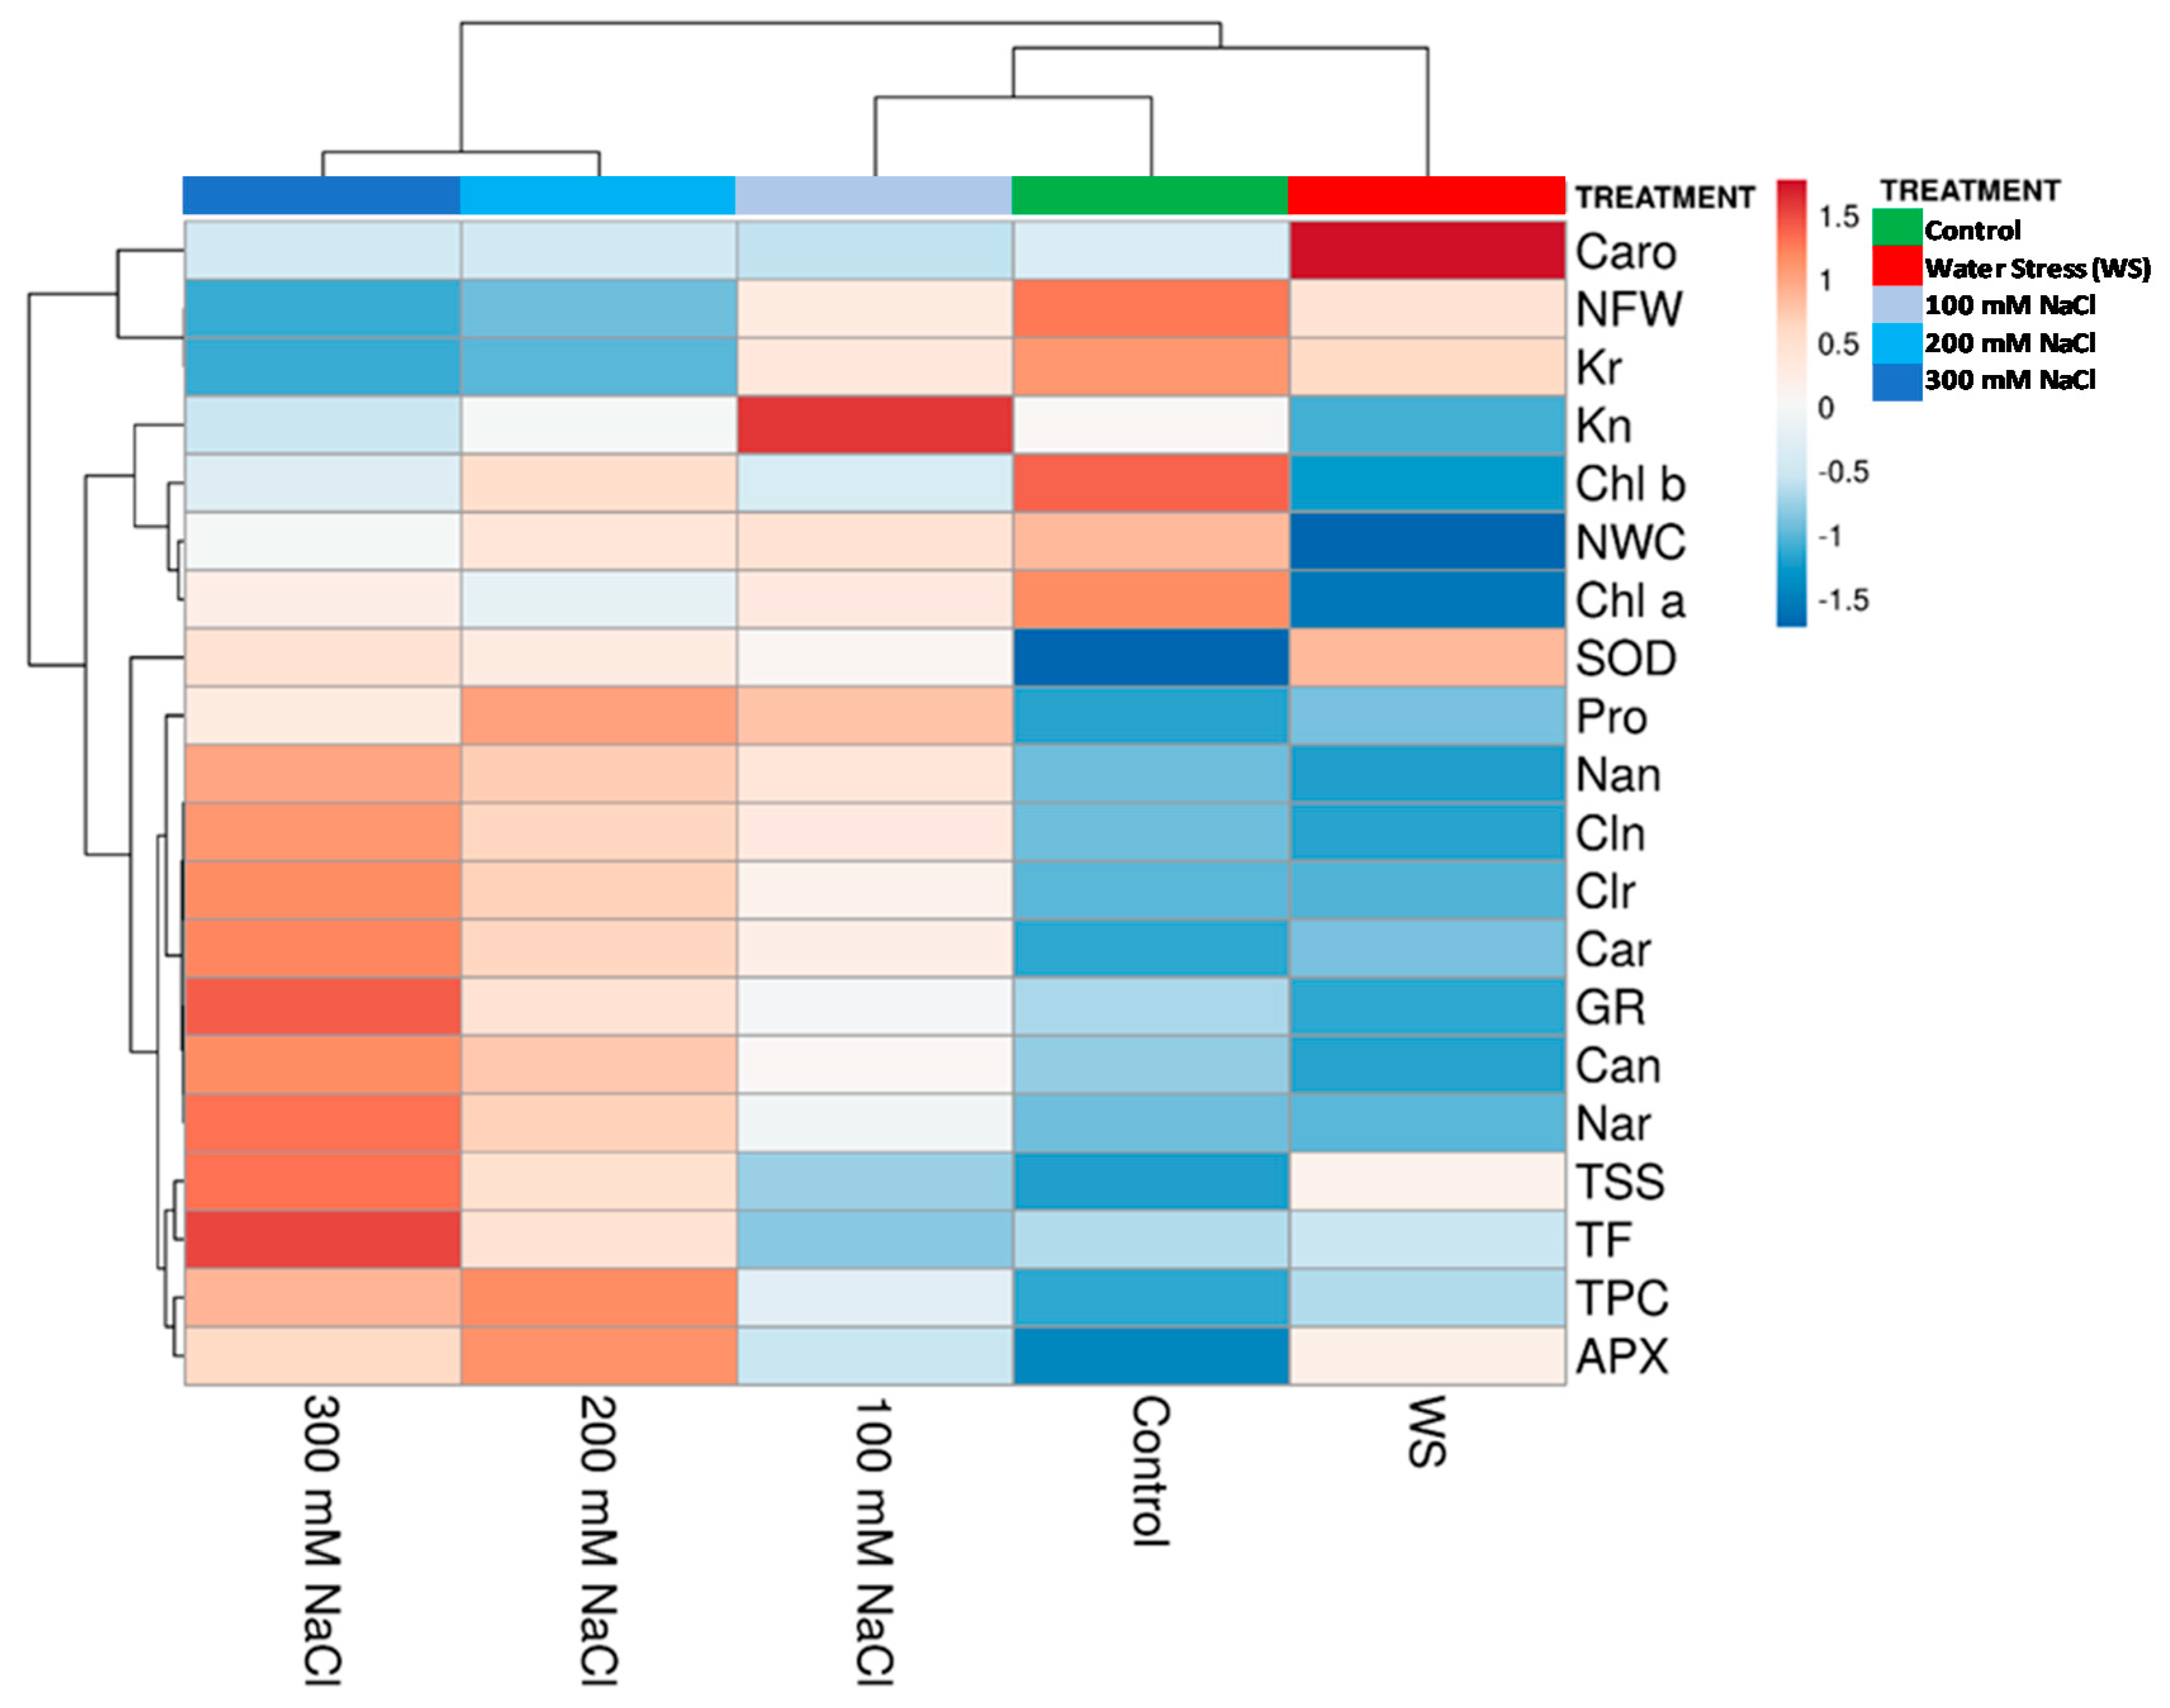
3.9. Hierarchical Cluster Analysis (HCA)

Growth, physiological and biochemical parameters that showed significant differences (p < 0.05) in the ANOVA were included in a hierarchical cluster analysis (HCA) of the data (Figure 9). The HCA analysis allowed for establishing a signature of responses depending on the stress applied. Considering the different treatments, the two main branches of the HCA separated the control, water stress and 100 mM NaCl treatments, on the one side, from the 200 and 300 mM NaCl treatments, on the other. Besides, within the first cluster, the control and the 100 mM NaCl treatments were grouped together and separated from the water deficit conditions. In terms of the general profile of all analysed variables, the treatments at higher salinities, 200 and 300 mM NaCl, were the most closely correlated (Figure 9). The water stress treatment had a characteristic signature in the response, which was quite similar to the control, but with lower needle fresh weight (NFW) and needle water content (NWC), lower levels of chlorophylls and higher of carotenoids, lower concentrations of K, and slightly higher concentrations of osmolytes (Pro and TSS), phenolics (TPC) and flavonoids (TF), as well as of the enzymatic activities SOD and APX. Regarding salinity, the two treatments with highest NaCl concentrations (200 and 300 mM) were characterised by a specific signature, which was displayed with greater intensity at the highest NaCl concentration (300 mM), corresponding to high levels of concentrations of Na, Cl and Ca, and low levels of K, as well as high levels of osmolytes and non-enzymatic and enzymatic antioxidants. The 100 mM NaCl was generally intermediate between the control and the 200 mM NaCl treatment, except for a remarkably high content in K in the needles (Figure 9).
Two major clusters were also distinguished regarding the different measured parameters. The first one includes needle fresh weight (NFW), K+ in roots (Kr) and total carotenoids (Caro)—the two former variables were highly correlated and displayed the highest values in the control and the lowest in the presence of 300 mM NaCl. The rest of the traits form a second major cluster, in which several sub-clusters were identified (Figure 9). For example, needle water content (NWC), the chlorophylls (Chl a and Chl b) and K+ in needles (Kn) can be grouped in one of the major sub-clusters, all displaying the lowest levels in the water stress treatment. The other major sub-cluster includes the rest of the variables: Ca2+, Na+ and Cl in needles and roots (Can, Car, Nan, Nar, Cln, Clr), osmolytes (Pro, TSS), antioxidant compounds (TPC, TF) and the SOD, APX and GR activities. Generally, these traits displayed higher levels under salt stress, in most cases increasing in parallel to increasing salinity. SOD, however, appeared to be activated predominantly by water deficit. The highest correlations were observed between the ion concentrations, in both roots and needles, as well as between the ions, Pro and GR activity (Figure 9).

4. Discussion

4.1. Effect of Salt and Water Stress on Seedlings’ Growth and Photosynthetic Pigments

Growth inhibition is probably the first and most general response of plants to different types of stress, which induce a switch from primary to secondary metabolism as energy and metabolic precursors, normally used for biomass accumulation during the vegetative growth phase, are redirected to the activation of defence reactions against those stress factors [55,56]. In most plant species, therefore, determination of growth parameters is commonly used to assess the effects of stress on the plants. This approach is not so useful for slow-growing species such as conifers, including the silver fir, especially in the first years of life [22,57,58]. Nevertheless, after one month of water and salt stress treatments, we could detect a significant inhibition of growth in one-year-old silver fir seedlings, indicating that at this developmental stage, this species is relatively more sensitive to drought and high salinity than other conifers, for example, Picea abies [59]. Fresh weight and water content are probably the most precise parameters to assess the degree of stress-induced growth inhibition, but their measurement requires the destruction of the plants. It is, therefore, essential to identify and characterise appropriate physiological and biochemical stress indicators that could be quantified through simple, sensitive and minimally invasive assays requiring small amounts of plant material.
Photosynthetic pigments can be included in these putative stress markers, as inhibition of photosynthesis is also a common effect of stress [60,61,62], and is accompanied by a reduction of chlorophyll contents, by inhibition of its synthesis combined with activation of its degradation [63]. Previous studies on plants of different conifer species exposed to salt or drought treatments have also reported a decrease in chlorophylls a and b and, in some cases, in total carotenoids [59,64,65]. Following this general trend, in the present study, water and salt stress caused a significant reduction of chlorophylls a and b contents in silver fir needles. On the contrary, carotenoid levels were very low and did not show any significant decrease under stress.

4.2. Effect of Salt Stress on Ion Accumulation

Salt-sensitive plants (glycophytes), which include all major crops, generally respond to salt stress by trying to keep low concentrations of toxic ions in the leaves, either by exclusion mechanisms at the root level or by blocking its transport to the aerial parts of the plant, mechanisms that are effective only at low soil salinities [66,67,68]. On the contrary, in A. alba, salt stress caused the accumulation of relatively high concentrations of Na+ and Cl (and also Ca2+) in roots and needles, in parallel to the increasing NaCl concentration in the irrigation water. This behaviour has also been reported for other coniferous species [18,65,69]. What should be highlighted is that, for each NaCl concentration, the levels of all tested ions were substantially higher in the needles than in the roots, indicating the presence of active systems for their transport to the aerial parts of the plants. It is also worth noting the high Na+ concentration (not so much for Cl) measured in needles of control seedlings. This result suggests that silver fir possesses active mechanisms for uptake and transport to the needles of these ions, mainly Na+, to be used as ‘cheap’ inorganic osmolytes, even under low salinity conditions. In terms of energy consumption, ion transport will be less demanding than the synthesis of organic osmolytes [70]. Therefore, it can be concluded that the responses of A. alba seedlings to stress include constitutive mechanisms based on the accumulation in needles of Na+ and other inorganic ions, without reaching toxic levels. The increase in Ca2+ concentration in parallel to increasing soil salinity should also be considered as a mechanism of tolerance against salt stress, as the role of calcium counteracting the harmful effects of NaCl is well established [71].
Accumulation of Na+ in plant tissues is generally accompanied by a reduction of K+ levels, as both ions compete for the same membrane transporters [72,73]. Maintenance of relatively high K+/Na+ ratios is considered as a relevant mechanism for salt tolerance [74]. Salt-induced reduction of K+ concentration has been detected, indeed, in roots of silver fir seedlings, but not in needles, where no significant differences with the controls were observed. The active transport of K+ from the roots limited the reduction of K+/Na+ ratios in the needles, thus contributing to salt tolerance.

4.3. Osmolyte Synthesis

Environment stress conditions that lead to cellular dehydration, including salinity and water stress, trigger the cytosolic accumulation of various compatible organic solutes or osmolytes. Proline (Pro) is a common osmolyte in plants, synthesised in many species in response to different abiotic stresses [75]. Previous studies have reported significant increases in Pro concentrations under water deficit and/or high salinity also in conifers, such as spruce [18,59,76] or pine [77,78]. In the present study, a significant increase in Pro concentration has been detected in response to salt stress, although the differences with the non-stressed controls were small, as were the absolute Pro levels were reached. Therefore, it is likely that the contribution of Pro to osmotic adjustment under salt stress conditions is also small; nevertheless, this does not exclude a role of Pro in the mechanisms of salt tolerance in A. alba, based on its additional functions as an ‘osmoprotectant’ [79]. On the contrary, Pro does not seem to play any role in the response of silver fir to water deficit, at least under our experimental conditions.
Soluble carbohydrates also play functional roles in the abiotic stress responses of many different plant species, contributing to osmotic adjustment and as osmoprotectants [80]. Accumulation of total soluble sugars (TSS) in response to salts stress has been reported, for example, in the needles, sapwood and inner bark of some coniferous species [81]. The experiments performed in the present study showed a significant increase in TSS levels under water deficit and salt stress conditions, suggesting the participation of these osmolytes in the responses of silver fir seedlings to both drought and salinity.

4.4. Oxidative Stress and Antioxidant Defence Mechanisms

Reactive oxygen species (ROS) are produced in plants as by-products during different metabolic reactions, for example, photosynthesis and respiration, and play essential roles in cell signalling and homeostasis [82]. ‘Normal’ physiological ROS levels can increase dramatically under stress conditions—drought, salinity, high temperatures or UV irradiation, among others—breaking down the balance between ROS production and scavenging, and causing oxidative stress [83,84]. The harmful effects of excess ROS can be counteracted by the activation of antioxidant enzymes, such as superoxide dismutase (SOD), catalase (CAT), ascorbate peroxidase (APX) or glutathione reductase (GR) [85,86], and there are many published reports demonstrating the increase in the specific activity of these enzymes under stress conditions. SOD is considered as the first line of defence against oxidative stress, eliminating the highly reactive superoxide radicals [87]. SOD activity increases in response to high salinity stress, for example, in pea [88], maize [89], Morus alba [90] or Brassica napus [91]. The combined effects of drought and high light irradiation significantly increased SOD activity in spruce (Picea asperata Mast.) seedlings [92]. CATs are tetrameric heme-containing enzymes, mainly located in the peroxisomes, which convert the SOD-generated H2O2 into O2 and H2O, thus contributing to ROS scavenging [93,94]. APXs also eliminate hydrogen peroxide, playing an essential role in the antioxidant system of plants [95]. GR is a highly conserved enzyme localised mainly in the chloroplast stroma, but also present in mitochondria, cytosol and peroxisomes [83]. GR activity has been shown to increase in response to different stresses, for example, by chilling in cucumber (Cucumis sativus L.) leaves [96], at high temperature in Triticum aestivum [97], under salt stress in cotton calli [98] or in alfalfa nodules subjected to water deficit [99].
In addition to the antioxidant enzymes mentioned above (and other oxidoreductases), non-enzymatic antioxidants, such as phenolic compounds, especially the subgroup of flavonoids—many of them showing strong antioxidant activities—are also involved in ROS scavenging and maintaining cellular redox equilibrium. Therefore, the stress-induced biosynthesis of these metabolites can contribute to the mechanisms of defence against abiotic stress [100,101].
According to the results of the present study, the only antioxidant system that appears to be substantially involved in the response of silver fir seedlings to water deficit stress, under the specific experimental conditions used, is SOD. Neither the activities of the other three assayed enzymes (CAT, APX and GR) nor phenolics or flavonoids needle contents, showed significant changes with respect to the values measured in the controls. On the contrary, salt stress induced significant increases in the specific activities of all tested enzymes, except CAT, as well as in the levels of total phenolic compounds and flavonoids. In all cases, however, the observed stress-induced activation of antioxidant systems was relatively weak, as shown by data that correlate with the low degree of drought- and salt-induced oxidative stress suggested by the observed changes in MDA contents. It appears that other mechanisms, such as the regulation of ion transport (for salt stress) and the accumulation of specific osmolytes (for both, salinity and water deficit) are enough to avoid higher levels of oxidative stress under the particular conditions used in our experiments. Stronger stress treatments will likely cause a stronger degree of oxidative stress and consequently induce a more pronounced activation of the antioxidant enzymes, and the accumulation to higher levels of phenolic compounds and flavonoids.

4.5. Hierarchical Cluster Analysis

The joint analysis by HCA of all growth and biochemical variables that showed statistically significant changes in response to the applied treatments generally confirmed and extended the information provided by the individual experiments and revealed specific signatures of the growth, physiological and biochemical responses to the different stresses. Concerning the responses of A. alba seedlings to water deficit, it clearly showed inhibition of growth (reduction of needle fresh weight), needle dehydration (decrease in water content), the increase in carotenoid contents, decrease in chlorophylls and the activation of SOD, but also a weaker activation of APX and the accumulation of TSS and, to a much lesser extent, Pro. This analysis also confirmed the concentration-dependent reduction of fresh weight in the presence of increasing external NaCl, needle dehydration—although less intense than under water deficit stress—relatively strong activation of GR and APX and not so strong of SOD, and the accumulation, to a greater or lesser extent, of TPC, TF and all measured ions, except K+ in roots. As shown here, the responses of A. alba seedlings to drought and salinity partly overlap, although quantitative differences between the two treatments have been observed. This is to be expected considering that both environmental conditions cause osmotic and oxidative stress in plants. There are, however, mechanisms of response specific for salt stress, based mostly on the control of ion transport and ion homeostasis.

5. Conclusions

This work provided new experimental data on silver fir (Abies alba), an economically and ecologically important coniferous species, for which very little information is available regarding its responses to drought and, especially, high salinity. Silver fir does not seem to be very resistant to water deficit or salt stress, at least at the seedling stage, since one-month application of both treatments inhibited growth. Nevertheless, the results presented here allowed for establishing the most relevant mechanisms of (limited) tolerance to drought, mostly based on the accumulation of soluble carbohydrates as osmolytes/osmoprotectants. Tolerance to salt, on the other hand, seems to depend on the active transport to the needles of Na+, Cl and Ca2+, the maintenance of relatively high K+/Na+ ratios and the accumulation of Pro and soluble sugars for osmotic adjustment. Interestingly, A. alba seedlings present relatively high Na+ concentrations in their needles, in the absence of salt. As far as it does not reach toxic levels, Na+ can contribute to osmotic balance as a ‘cheap’ osmoticum, and its accumulation may represent a constitutive mechanism of defence against stress. These responses appear to be efficient enough to avoid the generation of high levels of oxidative stress; therefore, the activation of antioxidant systems most likely play only a secondary role in the mechanisms of tolerance to drought and salinity in silver fir seedlings.
In addition, from a practical point of view, we would like to suggest the increase in carotenoids contents, the decrease of chlorophylls a and b levels and the accumulation of soluble sugars as reliable biomarkers for drought stress in this species. Salt stress, on the other hand, is associated to the decrease in chlorophylls levels and the accumulation in the needles of TSS, Pro (as organic osmolytes) and, especially, cations such as Na+ or Ca2+. These biochemical stress markers may be useful for the future management of silver fir forests and reforestation programmes.

Author Contributions

Conceptualization, M.B. and R.E.S.; Formal analysis, A.F.S.; Investigation, I.M.T., S.G.-O. and M.P.; Resources, I.M.T. and A.F.S.; Supervision, M.B., O.V. and R.E.S.; Validation, A.F.S. and J.P.; Visualization, O.V.; Writing—original draft, I.M.T.; Writing—review and editing, O.V. All authors have read and agreed to the published version of the manuscript.

Funding

This research was partially funded by Doctoral School from the University of Agricultural Sciences and Veterinary Medicine of Cluj-Napoca, granted to I.M.T. The publication was supported by funds from the National Research Development Projects to finance excellence (PFE)-37/2018–2020 granted by the Romanian Ministry of Research and Innovation.

Acknowledgments

I.M.T. is grateful for a scholarship in UPV (Valencia) supported by the Erasmus+ mobility programme, financed by the European Commission.

Conflicts of Interest

The authors declare no conflict of interest.

References

  1. Raza, A.; Razzaq, A.; Mehmood, S.S.; Zou, X.; Zhang, X.; Lv, Y.; Xu, J. Impact of climate change on crops adaptation and strategies to tackle its outcome: A review. Plants 2019, 8, 34. [Google Scholar] [CrossRef] [PubMed] [Green Version]
  2. Zhou, S.-X.; Prentice, I.C.; Medlyn, B.E. Bridging drought experiment and modeling: Representing the differential sensitivities of leaf gas exchange to drought. Front. Plant Sci. 2019, 9, 1965. [Google Scholar] [CrossRef] [PubMed]
  3. Fita, A.; Rodríguez-Burruezo, A.; Boscaiu, M.; Prohens, J.; Vicente, O. Breeding and domesticating crops adapted to drought and salinity: A new paradigm for increasing food production. Front. Plant Sci. 2015, 6. [Google Scholar] [CrossRef] [PubMed] [Green Version]
  4. Daliakopoulos, I.N.; Tsanis, I.K.; Koutroulis, A.G.; Kourgialas, N.; Varouchakis, E.A.; Karatzas, G.P.; Ritsema, C.J. The threat of soil salinity: A European scale review. Sci. Total Environ. 2016, 573, 727–739. [Google Scholar] [CrossRef] [PubMed]
  5. Cuevas, J.; Daliakopoulos, I.N.; del Moral, F.; Hueso, J.J.; Tsanis, K.A. Review of soil-improving cropping systems for soil salinization. Agronomy 2019, 9, 295. [Google Scholar] [CrossRef] [Green Version]
  6. IPCC Intergovernmental panel on climate change. In Proceedings of the 5th Assessment Report, WGII, Climate Change 2014: Impacts, Adaptation, and Vulnerability. Available online: http://www.ipcc.ch/report/ar5/wg2/ (accessed on 15 January 2020).
  7. Bartels, D.; Ramanjulu, S. Drought and salt tolerance in plants. Rev. Plant Sci. 2005, 24, 23–58. [Google Scholar] [CrossRef]
  8. Tinner, W.; Colombaroli, D.; Heiri, O.; Henne, P.D.; Steinacher, M.; Untenecker, J.; Vescovi, E.; Judy, R.M.; Carraro, G.; Conedera, M.; et al. The past ecology of Abies alba provides new perspectives on future responses of silver fir forests to global warming. Ecol. Monogr. 2013, 83, 419–439. [Google Scholar] [CrossRef] [Green Version]
  9. Vicario, F.; Vendramin, G.G.; Rossi, P.; Lio, P.; Giannini, R. Allozyme, chloroplast DNA and RAPD markers for determining genetic relationships between Abies alba and the relict population of Abies nebrodensis. Theor. Appl.Genet. 1995, 90, 1012–1018. [Google Scholar] [CrossRef]
  10. Fady, B.; Forest, I.; Hochu, I.; Ribiollet, A.; de Beaulieu, J.-L.; Pastuszka, P. Genetic differentiation in Abies alba Mill. populations from south-eastern France. Forest Genet. 1999, 6, 129–138. [Google Scholar]
  11. Rameau, J.-C.; Mansion, D.; Dume, G.; Lecointe, A.; Timbal, J.; Dupont, P.; Keller, R. Flore Forestiere Francaise, Guide écologique illustré; 2, Vols. 1989–1993; Institut Pour le Développement Forestier. Ministere de l’Agriculture et de la Peche, Direction de l’Espace rural et de la Foret, Ecole nationale du Genie rural, des Eaux et des Forets: Paris, France, 1993; p. 4206. [Google Scholar]
  12. Muller, S.D.; Nakagawa, T.; De Beaulieu, J.L.; Court-Picon, M.; Carcaillet, C.; Miramont, C.; Roiron, P.; Boutterin, C.A.; Ali, A.; Bruneton, H. Post-glacial migration of silver fir (Abies alba Mill.) in the south-western Alps. J. Biogeogr. 2007, 34, 876–899. [Google Scholar] [CrossRef]
  13. Quezel, P.; Medail, F. Ecologie et Biogeographie des Forets du Bassin Mediterraneen; Elsevier: Paris, France, 2003; p. 571. [Google Scholar]
  14. Ruosch, M.; Spahni, R.; Joos, F.; Henne, P.D.; Van der Knaap, W.O.; Tinner, W. Past and future evolution of A. alba forests in Europe–comparison of a dynamic vegetation model with palaeo data and observations. Glob. Chang. Biol. 2016, 22, 727–740. [Google Scholar] [CrossRef] [PubMed]
  15. Dobrowolska, D.; Bončina, A.; Klumpp, R. Ecology and silviculture of silver fir (Abies alba Mill.): A review. J. For. Res. 2017, 22, 326–335. [Google Scholar] [CrossRef]
  16. Larcher, W. Physiological Plant Ecology: Ecophysiology and Stress Physiology of Functional Groups; Springer: Berlin/Heidelberg, Germany; New York, NY, USA, 2001. [Google Scholar]
  17. Fluckiger, W.; Braun, S. Perspectives of reducing the deleterious effect of de-icing salt upon vegetation. Plant Soil. 1981, 63, 527–529. [Google Scholar] [CrossRef]
  18. Şchiop, T.S.; Al Hassan, M.; Sestras, A.F.; Boscaiu, M.; Sestras, R.; Vicente, O. Identification of Salt Stress Biomarkers in Romanian Carpathian Populations of Picea abies (L.) Karst. PLoS ONE 2015, 10, e0135419. [Google Scholar] [CrossRef] [Green Version]
  19. Cailleret, M.; Nourtier, M.; Amm, A.; Durand-Gillmann, M.; Davi, H. Drought-induced decline and mortality of silver fir differ among three sites in Southern France. Ann. Forest Sci. 2014, 71, 643–657. [Google Scholar] [CrossRef]
  20. Nourtier, M.; Chanzy, A.; Cailleret, M.; Yingge, X.; Huc, R.; Davi, H. Transpiration of silver Fir (Abies alba mill.) during and after drought in relation to soil properties in a Mediterranean mountain area. Ann. Forest Sci. 2014, 71, 683–695. [Google Scholar] [CrossRef]
  21. Gazol, A.; Camarero, J.J.; Gutierrez, E.; Popa, I.; Andreu-Hayles, L.; Motta, R.; Nola, P.; Ribas, M.; Sangüesa-Barreda, G.; Urbinati, C.; et al. Distinct effects of climate warming on populations of silver fir (Abies alba) across Europe. J. Biogeogr. 2015, 42, 1150–1162. [Google Scholar] [CrossRef] [Green Version]
  22. Todea (Morar), I.M.; González-Orenga, S.; Plazas, M.; Sestras, A.F.; Prohens, J.; Vicente, O.; Sestras, R.E.; Boscaiu, M. Screening for salt and water stress tolerance in fir (Abies alba) populations. Not. Bot. Horti Agrobot. 2019, 47, 1063–1072. [Google Scholar] [CrossRef] [Green Version]
  23. Larcher, W. Physiological Plant Ecology; Springer: Berlin, Germany, 2003. [Google Scholar]
  24. Mbarki, S.; Sytar, O.; Cerda, A.; Zivcak, M.; Rastogi, A.; He, X.; Zoghlami, A.; Abdelly, C.; Brestic, M. Strategies to mitigate the salt stress effects on photosynthetic apparatus and productivity of crop plants. In Salinity Responses and Tolerance in Plants, Volume 1. Targeting Sensory, Transport and Signaling Mechanisms; Kumar, V., Wani, S.H., Suprasanna, P., Tran, L.-S.P., Eds.; Springer International Publishing AG: Cham, Switzerland, 2018; pp. 85–136. [Google Scholar]
  25. Sun, Z.W.; Ren, L.K.; Fan, J.W.; Li, Q.; Wang, K.J.; Guo, M.M.; Wang, L.; Li, J.; Zhang, G.X.; Yang, Z.Y.; et al. Salt response of photosynthetic electron transport system in wheat cultivars with contrasting tolerance. Plant Soil Environ. 2016, 62, 515–521. [Google Scholar]
  26. Zhu, J.-K. Abiotic stress signaling and responses in plants. Cell 2016, 167, 313–324. [Google Scholar] [CrossRef] [Green Version]
  27. Lugo-Cruz, E.; Zavala-García, F.; Picón-Rubio, F.; Urías-Orona, V.; Rodríguez-Fuentes, H.; Vidales-Contreras, J.; Carranza-De La Rosa, R.; Niño-Medina, G. Water stress effect on cell wall components of maize (Zea mays) Bran. Not. Sci. Biol. 2016, 8, 81–84. [Google Scholar] [CrossRef]
  28. Battaglia, M.; Olvera-Carrillo, Y.; Garciarrubio, A.; Campos, F.; Covarrubias, A.A. The enigmatic LEA proteins and other hydrophilins. Plant Physiol. 2008, 148, 6–24. [Google Scholar] [CrossRef] [PubMed] [Green Version]
  29. Zhang, D.; Tong, J.; He, X.; Xu, Z.; Xu, L.; Wei, P.; Huang, Y.; Brestic, M.; Ma, H.; Shao, H. A novel soybean intrinsic protein gene, GmTIP2;3, involved in responding to osmotic stress. Front. Plant Sci. 2016, 6, 1237. [Google Scholar] [CrossRef] [Green Version]
  30. Fardus, J.; Matin, M.; Hasanuzzaman, M.; Hossain, M.; Nath, S.; Hossain, M.; Rohman, M.; Hasanuzzaman, M. Exogenous salicylic acid-mediated physiological responses and improvement in yield by modulating antioxidant defense system of wheat under salinity. Not. Sci. Biol. 2017, 9, 219–232. [Google Scholar] [CrossRef] [Green Version]
  31. Flowers, T.J.; Colmer, T.D. Salinity tolerance in halophytes. New Phytol. 2008, 179, 945–963. [Google Scholar] [CrossRef] [PubMed]
  32. Griffith, M.; Yaish, M.W.F. Antifreeze proteins in overwintering plants: A tale of two activities. Trends Plant Sci. 2004, 9, 399–405. [Google Scholar] [CrossRef]
  33. Slama, I.; Abdelly, C.; Bouchereau, A.; Flowers, T.; Savouré, A. Diversity, distribution and roles of osmoprotective compounds accumulated in halophytes under abiotic stress. Ann. Bot. 2015, 115, 433–447. [Google Scholar] [CrossRef] [Green Version]
  34. Chen, T.H.H.; Murata, N. Glycinebetaine: An effective protectant against abiotic stress in plants. Trends Plant Sci. 2008, 13, 499–505. [Google Scholar] [CrossRef]
  35. Hussain, T.M.; Chandrasekhar, T.; Hazara, M.; Sultan, Z.; Saleh, B.K.; Gopal, G.R. Recent advances in salt stress biology—A review. Biotechnol. Mol. Biol. Rev. 2008, 3, 8–13. [Google Scholar]
  36. Szabados, L.; Savouré, A. Proline: A multifunctional amino acid. Trends Plant Sci. 2010, 15, 89–97. [Google Scholar] [CrossRef]
  37. Esfandiari, E.; Gohari, G. Response of ROS-scavenging systems to salinity stress in two different wheat (Triticum aestivum L.) cultivars. Not. Bot. Horti Agrobot. 2017, 45, 287–291. [Google Scholar] [CrossRef] [Green Version]
  38. Apel, K.; Hirt, H. Reactive oxygen species: Metabolism, oxidative stress, and signal transduction. Annu. Rev. Plant Biol. 2004, 55, 373–399. [Google Scholar] [CrossRef] [PubMed] [Green Version]
  39. Miller, G.; Shulaev, V.; Mittler, R. Reactive oxygen signaling and abiotic stress. Physiol. Plant. 2008, 133, 481–489. [Google Scholar] [CrossRef] [PubMed]
  40. Lichenthaler, H.K.; Wellburn, A.R. Determinations of total carotenoids and chlorophylls a and b of leaf extracts in different solvents. Biochem. Soc. Trans. 1983, 11, 591–592. [Google Scholar] [CrossRef] [Green Version]
  41. Weimberg, R. Solute adjustments in leaves of two species of wheat at two different stages of growth in response to salinity. Physiol. Plant. 1987, 70, 381–388. [Google Scholar] [CrossRef]
  42. Bates, L.S.; Waldren, R.P.; Teare, I.D. Rapid determination of free proline for water stress studies. Plant Soil. 1973, 39, 205–207. [Google Scholar] [CrossRef]
  43. Dubois, M.; Gilles, K.A.; Hamilton, J.K.; Rebers, P.A.; Smith, F. Colorimetric method for determination of sugars and related substances. Anal. Chem. 1956, 28, 350–356. [Google Scholar] [CrossRef]
  44. Hodges, D.M.; Delong, J.M.; Forney, C.F.; Prange, R.K. Improving the thiobarbituric acid-reactive-substances assay for estimating lipid peroxidation in plant tissues containing anthocyanin and other interfering compounds. Planta 1999, 207, 604–611. [Google Scholar] [CrossRef]
  45. Blainski, A.; Lopes, G.C.; Palazzodemello, J.C. Application and analysis of the Folin Ciocalteu method for the determination of the total phenolic content from Limonium brasiliense L. Molecules 2013, 18, 6852–6865. [Google Scholar] [CrossRef] [Green Version]
  46. Zhishen, J.; Mengcheng, T.; Jianming, W. The determination of flavonoid contents in mulberry and their scavenging effects on superoxide radicals. Food Chem. 1999, 64, 555–559. [Google Scholar] [CrossRef]
  47. Gil, R.; Bautista, I.; Boscaiu, M.; Lidón, A.; Wankhade, S.; Sánchez, H.; Llinares, J.; Vicente, O. Responses of five Mediterranean halophytes to seasonal changes in environmental conditions. AoB Plants 2014, 6, plu049. [Google Scholar] [CrossRef] [PubMed]
  48. Bradford, M.M. A rapid and sensitive method for the quantitation of microgram quantities of protein utilizing the principle of protein-dye binding. Anal. Biochem. 1976, 72, 248–254. [Google Scholar] [CrossRef]
  49. Beyer, W.F., Jr.; Fridovich, I. Assaying for superoxide dismutase activity: Some large consequences of minor changes in conditions. Anal. Biochem. 1987, 161, 559–566. [Google Scholar] [CrossRef]
  50. Aebi, H. Catalase in vitro. Methods Enzymol. 1984, 105, 121–126. [Google Scholar] [PubMed]
  51. Nakano, Y.; Asada, K. Hydrogen peroxide is scavenged by ascorbate specific peroxidase in spinach chloroplasts. Plant Cell Physiol. 1981, 22, 867–888. [Google Scholar]
  52. Conell, J.P.; Mullet, J.E. Pea chloroplast glutathione reductase: Purification and characterization. Plant Physiol. 1986, 82, 351–356. [Google Scholar] [CrossRef] [PubMed] [Green Version]
  53. Metsalu, T.; Vilo, J. ClustVis: A web tool for visualizing clustering of multivariate data using Principal Component Analysis and heatmap. Nucleic Acids Res. 2015, 43, W566–W570. [Google Scholar] [CrossRef]
  54. Del Rio, D.; Stewart, A.J.; Pellegrini, N. A review of recent studies on malondialdehyde as toxic molecule and biological marker of oxidative stress. Nutr. Metab. Cardiovasc. Dis. 2005, 15, 316–328. [Google Scholar] [CrossRef]
  55. Zhu, J.K. Plant salt tolerance. Trends Plant Sci. 2001, 6, 66–71. [Google Scholar] [CrossRef]
  56. Munns, R.; Tester, M. Mechanisms of salinity tolerance. Annu. Rev. Plant Biol. 2008, 59, 651–681. [Google Scholar] [CrossRef] [Green Version]
  57. Ganança, J.F.; Freitas, J.G.; Nóbrega, H.G.; Rodrigues, V.; Antunes, G.; Gouveia, C.S.; Rodrigues, M.; Chaϊr, H.Â.A. Pinheiro de Carvalho, M.; Lebot, V. Screening for drought tolerance in thirty three taro cultivars. Not. Bot. Horti Agrobot. 2018, 46, 65–74. [Google Scholar]
  58. Wolf, H. EUFORGEN Technical Guidelines for Genetic Conservation and Use for Silver fir (Abies alba); International Plant Genetic Resources Institute: Rome, Italy, 2003. [Google Scholar]
  59. Schiop, S.T.; Al Hassan, M.; Sestras, A.F.; Boscaiu, M.; Sestras, E.; Vicente, O. Biochemical responses to drought, at the seedling stage, of several Romanian Carpathian populations of Norway spruce (Picea abies L. Karst). Trees 2017, 31, 1479–1490. [Google Scholar] [CrossRef]
  60. De Melo, H.F.; De Souza, E.R.; Cunha, J.C. Fluorescence ofchlorophyll a and photosynthetic pigments in Atriplex nummularia under abiotic stresses. Rev. Bras. Eng. Agric. Ambient. 2017, 21, 232–237. [Google Scholar] [CrossRef] [Green Version]
  61. Kozminska, A.; Al Hassan, M.; Kumar, D.; Oprica, L.; Martinelli, F.; Grigore, M.N.; Vicente, O. Characterizing the effects of salt stress in Calendula officinalis L. J. Appl. Bot. Food Qual. 2017, 90, 323–329. [Google Scholar] [CrossRef]
  62. Kumar, D.; Al Hassan, M.; Naranjo, M.A.; Agrawal, V.; Boscaiu, M.; Vicente, O. Effects of salinity and drought on growth, ionic relations, compatible solutes and activation of antioxidant systems in oleander (Nerium oleander L.). PLoS ONE 2017, 12, e0185017. [Google Scholar] [CrossRef]
  63. Santos, C.V. Regulation of chlorophyll biosynthesis and degradation by salt stress in sunflower leaves. Sci. Hort. 2004, 103, 93–99. [Google Scholar] [CrossRef]
  64. Miron, M.S.; Sumalan, R.L. Physiological responses of Norway spruce (Picea abies L. Karst) seedlings to drought and overheating stress conditions. J. Hortic. For. Biotechnol. 2015, 19, 146–151. [Google Scholar]
  65. Plesa, I.M.; Al Hassan, M.; González-Orenga, S.; Sestras, A.F.; Vicente, O.; Prohens, J.; Boscaiu, M.; Sestras, R.E. Responses to drought in seedlings of European larch (Larix decidua Mill.) from several Carpathian provenances. Forests 2019, 10, 511. [Google Scholar] [CrossRef] [Green Version]
  66. Munns, R.; Gilliham, M. Salinity tolerance of crops—What is the cost? New Phytol. 2015, 208, 668–673. [Google Scholar] [CrossRef] [Green Version]
  67. Tang, X.; Mu, X.; Shao, H.; Wang, H.; Brestic, M. Global plant-responding mechanisms to salt stress: Physiological and molecular levels and implications in biotechnology. Crit. Rev. Biotechnol. 2015, 35, 425–437. [Google Scholar] [CrossRef]
  68. Gu, M.F.; Li, N.; Shao, T.Y.; Long, X.H.; Brestič, M.; Shao, H.B.; Li, J.B.; Mbarki, S. Accumulation capacity of ions in cabbage (Brassica oleracea L.) supplied with sea water. Plant Soil Environ. 2016, 62, 314–320. [Google Scholar]
  69. Bogemans, J.; Neirinckx, L.; Stassart, J.M. Effect of de-icing chloride salts on ion accumulation in spruce (Picea abies (L.) sp.). Plant Soil 1989, 113, 3–11. [Google Scholar] [CrossRef]
  70. Raven, J.A. Tansley review no. 2. Regulation of pH and generation of osmolarity in vascular plants: A cost-benefit analysis in relation to efficiency of use of energy, nitrogen and water. New Phytol. 1985, 101, 25–77. [Google Scholar] [CrossRef]
  71. Manishankar, P.; Wang, N.; Köster, P.; Alatar, A.A.; Kudla, J. Calcium signaling during salt stress and in the regulation of ion homeostasis. J. Exp. Bot. 2018, 69, 4215–4226. [Google Scholar] [CrossRef] [Green Version]
  72. Greenway, H.; Munns, R. Mechanisms of salt tolerance in non-halophytes. Annu. Rev. Plant Biol. 1980, 31, 149–190. [Google Scholar] [CrossRef]
  73. Rodríguez-Navarro, A. Potassium transport in fungi and plants. Biochim. Biophys. Acta 2000, 1469, 1–30. [Google Scholar] [CrossRef]
  74. Almeida, D.M.; Oliveira, M.M.; Saibo, N.J.M. Regulation of Na+ and K+ homeostasis in plants: Towards improved salt stress tolerance in crop plants. Genet. Mol. Biol. 2017, 40 (Suppl. 1), 326–345. [Google Scholar] [CrossRef] [Green Version]
  75. Kavi Kishor, P.B.; Sreenivasulu, N. Is proline accumulation per se correlated with stress tolerance or is proline homeostasis a more critical issue? Plant Cell Environ. 2014, 37, 300–311. [Google Scholar] [CrossRef]
  76. Ditmarová, L.; Kurjak, D.; Palmroth, S.; Kmet, J.; Strelcová, K. Physiological responses of Norway spruce (Picea abies) seedlings to drought stress. Tree Physiol. 2010, 30, 205–213. [Google Scholar] [CrossRef] [Green Version]
  77. Zamani, M.; Hakimi, M.H.; Mosleh Arany, A.; Kiani, B.; Rashtian, A. Comparing the effects of SNP and SA under salinity stress on proline, sugar, Na, K and chlorophyll of leaves of Pinus eldarica and Cupressus sempervirens in Iran. Bull. Environ. Pharmacol. Life Sci. 2014, 3, 91–95. [Google Scholar]
  78. Taïbi, K.; del Campo, A.D.; Vilagrosa, A.; Bellés, J.M.; López-Gresa, M.P.; Pla, D.; Calvete, J.J.; López-Nicolás, J.M.; Mulet, J.M. Drought Tolerance in Pinus halepensis seed sources as identified by distinctive physiological and molecular markers. Front. Plant Sci. 2017, 8, 202. [Google Scholar] [CrossRef] [PubMed] [Green Version]
  79. Hayat, S.; Hayat, Q.; Alyemeni, M.N.; Wani, A.S.; Pichtel, J.; Ahmad, A. Role of proline under changing environments: A review. Plant Signal. Behav. 2012, 7, 1456–1466. [Google Scholar] [CrossRef] [PubMed] [Green Version]
  80. Gil, R.; Boscaiu, M.; Lull, C.; Bautista, I.; Lidón, A.; Vicente, O. Are soluble carbohydrates ecologically relevant for salt tolerance in halophytes? Funct. Plant Biol. 2013, 40, 805–818. [Google Scholar] [CrossRef]
  81. Clancy, K.M.; Wagner, M.R.; Reich, P.B. Ecophysiology and insect herbivory. In Ecophysiology of Coniferous Forests; Smith, W.K., Hinckley, T.M., Eds.; Academic Press: San Diego, CA, USA, 1995; pp. 125–180. [Google Scholar]
  82. Van Breusegem, F.; Vranová, E.; Dat, J.F.; Inzé, D. The role of active oxygen species in plant signal transduction. Plant Sci. 2001, 161, 405–414. [Google Scholar] [CrossRef]
  83. Ahmad, P.; Jaleel, C.A.; Salem, M.A.; Nabi, G.; Sharma, S. Roles of enzymatic and nonenzymatic antioxidants in plants during abiotic stress. Crit. Rev. Biotechnol. 2010, 30, 161–175. [Google Scholar] [CrossRef]
  84. Chan, Z.; Yokawa, K.; Kim, W.-Y.; Song, C.-P. Editorial: ROS Regulation during plant abiotic stress responses. Front. Plant Sci. 2016, 7, 1536. [Google Scholar] [CrossRef]
  85. Shi, Q.H.; Zhu, Z.J. Effects of exogenous salicylic acid on manganese toxicity, element contents and antioxidative system in cucumber. Environ. Exp. Bot. 2008, 63, 317–326. [Google Scholar] [CrossRef]
  86. Ashraf, M. Biotechnological approach of improving plant salt tolerance using antioxidants as markers. Biotechnol. Adv. 2009, 27, 84–93. [Google Scholar] [CrossRef]
  87. Huang, H.; Ullah, F.; Zhou, D.-X.; Yi, M.; Zhao, Y. Mechanisms of ROS regulation of plant development and stress responses. Front. Plant Sci. 2019, 10, 800. [Google Scholar] [CrossRef]
  88. Ahmad, P.; Jhon, R.; Sarwat, M.; Umar, S. Responses of proline, lipid peroxidation and antioxidative enzymes in two varieties of Pisum sativum L. under salt stress. Int. J. Plant Prod. 2008, 2, 353–366. [Google Scholar]
  89. Tuna, A.L.; Kaya, C.; Dikilitas, M.; Higgs, D. The combined effects of gibberellic acid and salinity on some antioxidant enzyme activities, plant growth parameters and nutritional status in maize plants. Environ. Exp. Bot. 2008, 62, 1–9. [Google Scholar] [CrossRef]
  90. Harinasut, P.; Poonsopa, D.; Roengmongkoi, K.; Charoensataporn, R. Salt effects on antioxidant enzymes in mulberry cultivar. Sci. Asia 2003, 29, 109–113. [Google Scholar] [CrossRef]
  91. Ashraf, M.; Ali, Q. Relative membrane permeability and activities of some antioxidant enzymes as the key determinants of salt tolerance in canola (Brassica napus L.). Env. Exp. Bot. 2008, 63, 266–273. [Google Scholar] [CrossRef]
  92. Yang, Y.; Han, C.; Liu, Q.; Lin, B.; Wang, J. Effect of drought and low light on growth and enzymatic antioxidant system of Picea asperata seedlings. Acta Physiol. Plant. 2008, 30, 433–440. [Google Scholar] [CrossRef]
  93. Srivalli, B.; Chinnusamy, V.; Khanna-Chopra, R. Antioxidant defense in response to abiotic stresses in plants. J. Plant Biol. 2003, 30, 121–139. [Google Scholar]
  94. Ben-Amor, N.; Hamed, K.B.; Debez, A.; Grignon, C.; Abdelly, C. Physiological and antioxidant response of the perennial halophytes Crithmum maritimum to salinity. Plant Sci. 2005, 168, 889–899. [Google Scholar] [CrossRef]
  95. Kangasjärvi, S.; Lepistö, A.; Hännikäinen, K.; Piippo, M.; Luomala, E.M.; Aro, E.M.; Rintamäki, E. Diverse roles for chloroplast stromal and thylakoidbound ascorbate peroxidases in plant stress responses. Biochem. J. 2008, 412, 275–285. [Google Scholar] [CrossRef] [Green Version]
  96. Lee, D.H.; Lee, C.B. Chilling stress-induced changes of antioxidant enzymes in the leaves of cucumber: In gel enzyme activity assays. Plant Sci. 2000, 159, 75–85. [Google Scholar] [CrossRef]
  97. Keles, Y.; Oncel, I. Response of antioxidative defence system to temperature and water stress combinations in wheat seedlings. Plant Sci. 2002, 163, 783–790. [Google Scholar] [CrossRef]
  98. Vital, S.A.; Fowler, R.W.; Virgen, A.; Gossett, D.R.; Banks, S.W.; Rodriguez, J. Opposing roles for superoxide and nitric oxide in the NaCl stress-induced upregulation of antioxidant enzyme activity in cotton callus tissue. Environ. Exp. Bot. 2008, 62, 60–68. [Google Scholar] [CrossRef]
  99. Naya, L.; Ladrera, R.; Ramos, J.; González, E.M.; Arrese-Igor, C.; Minchin, F.R.; Becana, M. The response of carbon metabolism and antioxidant defenses of alfalfa nodules to drought stress and to the subsequent recovery of plants. Plant Physiol. 2007, 144, 1104–1114. [Google Scholar] [CrossRef] [Green Version]
  100. Sharma, A.; Shahzad, B.; Rehman, A.; Bhardwaj, R.; Landi, M.; Zheng, B. Response of phenylpropanoid pathway and the role of polyphenols in plants under abiotic stress. Molecules 2019, 24, 2452. [Google Scholar] [CrossRef] [Green Version]
  101. Kebbas, S.; Benseddik, T.; Makhlouf, H.; Aid, F. Physiological and Biochemical Behaviour of Gleditsia triacanthos L. Young seedlings under drought stress conditions. Not. Bot. Horti Agrobot. 2018, 46, 585–592. [Google Scholar] [CrossRef] [Green Version]
Figure 1. Effect of water and salt stress treatments on growth inhibition in A. alba. Stem elongation (a), increment in the number of needles (Nno) (b), needle fresh weight (FW) (c), needle water content (WC%) (d) of one-year-old A. alba seedlings after 30 days of growth in the presence of the indicated salt concentrations or subjected to water deficit (completely withholding irrigation) (WS). Stem length and number of needles’ measurements were taken just before starting the treatments (time 0), and before collecting the samples (time 30). Bars represent means ± SE (n = 7). Different letters above the bars indicate significant differences between treatments, according to Tukey’s test (α = 0.05).
Forests 11 00395 g001
Figure 2. Photosynthetic pigments levels under water and salt stress. Needle concentrations of chlorophyll a (Chl a), chlorophyll b (Chl b) and total carotenoids (Caro) in one-year-old A. alba seedlings after 30 days of growth in the presence of the indicated salt concentrations or subjected to water deficit (completely withholding irrigation) (WS). Bars represent means ± SE (n = 7). For each of the three pigments, different letters above the bars indicate significant differences between treatments, according to Tukey’s test (α = 0.05).
Forests 11 00395 g002
Figure 3. Ion contents in roots of one-year-old A. alba seedlings after 30 days of growth in the presence of the indicated NaCl concentrations or subjected to water deficit stress (WS). (a) sodium, (b) chloride, (c) potassium, (d) calcium. Bars represent means ± SE (n = 7). Different letters above the bars indicate significant differences between treatments, according to Tukey’s test (α = 0.05).
Forests 11 00395 g003
Figure 4. Ion contents in needles of one-year-old A. alba seedlings after 30 days of growth in the presence of the indicated NaCl concentrations or subjected to water deficit stress (WS). (a) sodium, (b) chloride, (c) potassium, (d) calcium. Bars represent means ± SE (n = 7). Different letters above the bars indicate significant differences between treatments, according to Tukey’s test (α = 0.05).
Forests 11 00395 g004
Figure 5. Needle contents of (a) proline (Pro) and (b) total soluble sugars (TSS), in one-year-old A. alba seedlings after 30 days of growth in the presence of the indicated NaCl concentrations or subjected to water deficit stress (WS). Bars represent means ± SE (n = 7). Different letters above the bars indicate significant differences between treatments, according to Tukey’s test (α = 0.05).
Forests 11 00395 g005
Figure 6. Malondialdehyde (MDA) needle levels in one-year-old A. alba seedlings after 30 days of growth in the presence of the indicated NaCl concentrations or subjected to water deficit stress (WS). Bars represent means ± SE (n = 7). Different letters above the bars indicate significant differences between treatments, according to Tukey’s test (α = 0.05).
Forests 11 00395 g006
Figure 7. (a) Total phenolic compounds (TPC) and (b) total flavonoids (TF) needle contents in one-year-old A. alba seedlings after 30 days of growth in the presence of the indicated NaCl concentrations or subjected to water deficit stress (WS). Bars represent means ± SE (n = 7). Different letters above the bars indicate significant differences between treatments, according to Tukey’s test (α = 0.05).
Forests 11 00395 g007
Figure 8. (a) Superoxide dismutase (SOD)-, (b) catalase (CAT)-, (c) ascorbate peroxidase (APX)- and (d) glutathione reductase (GR)-specific activities in needle protein extracts of one-year-old A. alba seedlings after 30 days of growth in the presence of the indicated NaCl concentrations or subjected to water deficit stress (WS). Bars represent means ± SE (n = 7). Different letters above the bars indicate significant differences between treatments, according to Tukey’s test (α = 0.05).
Forests 11 00395 g008
Figure 9. Hierarchical cluster analysis (HCA) and heatmap of growth, physiological and biochemical parameters displaying significant differences (p < 0.05) in analysis of variance (ANOVA) tests, in one-year-old A. alba seedlings after 30 days of water or salt stress treatments. NFW, needle fresh weight; NWC, needle water content; Chl a, chlorophyll a; Chl b, Chlorophyll b; Caro, total carotenoids; Nan, sodium in needles; Cln, chloride in needles; Can, calcium in needles; Kn, potassium in needles; Nar, sodium in roots; Clr, chloride in roots; Car, calcium in roots; Kr, potassium in roots; Pro, proline; TSS, total soluble sugars; TPC, total phenolic compounds; TF, total flavonoids; SOD, superoxide dismutase activity; APX, ascorbate peroxidase activity; GR, glutathione reductase activity.
Forests 11 00395 g009
Table 1. Electric conductivity (EC) of the substrate, in a 1:5 soil suspension (EC1:5), and soil humidity (SH) on the pots of A. alba seedlings after 30 days of water deficit (WS) and salt stress (100, 200 and 300 mM NaCl) treatments 1.
Soil ParameterControlWS100 mM NaCl200 mM NaCl300 mM NaCl
EC1:5 (dS m−1)2.70 ± 0.08 a5.08 ± 0.63 b9.41 ± 0.51 c19.04 ± 0.57 d20.66 ± 0.54 e
(SH) (%)62.14 ± 0.90 c35.53 ± 2.34 a59.50 ± 0.30 b58.48 ± 0.40 b59.07 ± 0.88 b
1 Values shown are means ± SE (n = 7). Different letters in each row indicate significant differences between treatments, according to Tukey’s test (α = 0.05).

