Evaluation of Agroforestry Carbon Storage Status and Potential in Irrigated Plains of Pakistan
by
 , , ,
, , ,
Ghulam Yasin
1,2,* ,
,
Muhammad Farrakh Nawaz
1,
Timothy Ancel Martin
2,
Nabeel Khan Niazi
3,4,
Sadaf Gul
5 and
Muhammad Talha Bin Yousaf
1 1
Department of Forestry and Range Management, University of Agriculture, Faisalabad, Punjab 38000, Pakistan
2
School of Forest Resources and Conservation, University of Florida, Gainesville, FL 32611, USA
3
Institute of Soil and Environmental Sciences, University of Agriculture Faisalabad, Punjab 38000, Pakistan
4
School of Civil Engineering and Surveying, University of Southern Queensland, Toowoomba 4350, Australia
5
Department of Botany, University of Karachi, Karachi, Karachi City, Sindh 75270, Pakistan
*
Author to whom correspondence should be addressed.
Forests 2019, 10(8), 640; https://doi.org/10.3390/f10080640
Submission received: 9 May 2019
/
Revised: 24 July 2019
/
Accepted: 26 July 2019
/
Published: 29 July 2019
(This article belongs to the Section Forest Ecology and Management)
Abstract
:The Kyoto Protocol includes agroforestry practices as a suggested approach for mitigating global atmospheric CO2. Agroforestry systems are a desirable option for mitigating atmospheric CO2, as they provide numerous secondary benefits, including food, fodder, fuel, increased farm income, biodiversity maintenance, and soil conservation. This research was planned to assess the current carbon storage status and future potential of agroforestry systems in Pakistan through a nondestructive approach (allometric equations) in 14 subdivisions (tehsils) of three selected districts located in the irrigated plains of Punjab, Pakistan. A total of 1750 plots of 0.405 ha each were selected in a randomized, unbiased sampling to estimate the total number of trees, tree species diversity, diameters at breast height (DBHs), and tree heights. Soil carbon was also measured at 0–30 cm using the Walkley–Black method in a subset of plots. It was found that the current number of trees in farms in the study area varied from 18 to 51 trees/ha, which can be increased to 42–83 trees/ha if all the farmers plant the maximum permissible number of trees along with their crops. The estimated total tree carbon stock ranged from 0.0003 to 8.79 Mgha−1, with the smallest mean value of 0.39 Mgha−1 for tehsil Faisalabad, and the largest mean value of 1.41 Mgha−1 for tehsil Chiniot. The whole study area had an estimated woody vegetation carbon stock of 950,470 Mg and a soil carbon stock of 22,743,008 Mg. If farmers in the study area all increased tree stocking to their average maximum desired stocking, the total tree carbon stock would more than double to 2,497,261 Mg. These results highlight both the current and potential carbon sequestration potential of agroforestry in Pakistan and can be further used in devising strategies for implementing tree planting programs on agricultural lands and designing future carbon sequestration projects in Pakistan.
1. Introduction
Pakistan is a low-income country with a population of 207 million and an average annual growth rate of 2.4% [1]. Agriculture is an important land use, occupying 23.8 million ha out of Pakistan’s 79.6 million ha. The irrigated plains agricultural area (14.6 million ha) lies in the valley of the river Indus and its tributaries and is a large geographical subdivision of Pakistan comprising the provinces of Punjab, Sindh, and some parts of Khyber Pakhtunkhwa. However, the agricultural sector is shrinking (−0.19% rate of growth) compared with the rest of the economy (2.53% rate of growth) [2] due to extreme fluctuations in climatic conditions, which threatens food security [3,4]. These conditions have combined to produce an alarming level of food insecurity: according to the Food and Agricultural Organization of the United Nations (FAO), 22% of Pakistan’s population is undernourished [5].
Pakistan recently ratified the Paris Agreement on Climate Change to reduce greenhouse gas emissions to mitigate the harshest effects of climate change. Unfortunately, Pakistan’s terrestrial carbon sequestration is at the bottom among South Asian countries because of poor forestry resources [6,7]. However, agroforestry systems have the potential to address both food insecurity and carbon mitigation goals [8,9]. Agroforestry is a system in which trees and different crops are merged together in the same area for net economic returns to farmers [10]. Agroforestry has been identified as a potential greenhouse gas mitigation and afforestation approach under the Kyoto Protocol [11,12]. Several researchers have determined that planting trees with crops results in higher carbon sequestration compared with croplands depending upon the environmental and socioeconomic conditions of the area [13,14]. Around 45.3 PgC of the world’s terrestrial carbon is currently stored in agricultural lands, with trees contributing 33.9 PgC [15], and the potential could increase up to another 586 Tg year−1 by 2040 if 630 million ha of unproductive croplands were converted into agroforestry globally [16].
The average carbon storage by agroforestry worldwide has been assessed to be 9, 21, 50, and 63 Mg C ha−1 in semiarid, subhumid, humid, and temperate regions, respectively [17]. Agroforestry systems with different trees have a greater capability to cope with climate change and sequester a higher amount of carbon. Trees planted with crops can increase the carbon stock up to many folds when compared with monocrop systems, for example, 34.61 t C ha−1 in an agrisilvicultural system compared with 18.74 t C ha−1 in a monocrop system [18]. The carbon storage in a 6-year-old silvopastoral system was found to range from 1.5 to 12.3 t C ha−1 in the case of Dalbergia sissoo Roxb. and Sporobolus marginatus Hochst. ex A. Rich. [19]. In Africa, an agroforestry system with rotational trees can store carbon from around 2.2 up to 5.8 Mg C ha−1 yr−1 [20]. The estimated carbon stock in agroforestry systems among 26 districts of India ranged from 2.24 to 27. 78 Mg C ha−1 and had a maximum carbon sequestering potential of 1.03 Mg C ha−1 yr−1 [21]. Although some studies have estimated the carbon stock in different forest types of Pakistan [22,23,24,25], no significant study has produced robust carbon stock estimates for agroforestry systems in the country. This study reports a comprehensive carbon inventory of agroforestry systems in three districts of Punjab, Pakistan. The objective of the research was to provide a baseline for further research for monitoring and assessing the carbon in different agroforestry systems of the country and to identify factors that could be managed to enhance carbon sequestration in these systems.
2. Materials and Methods
2.1. Study Locations and Sampling Methodology
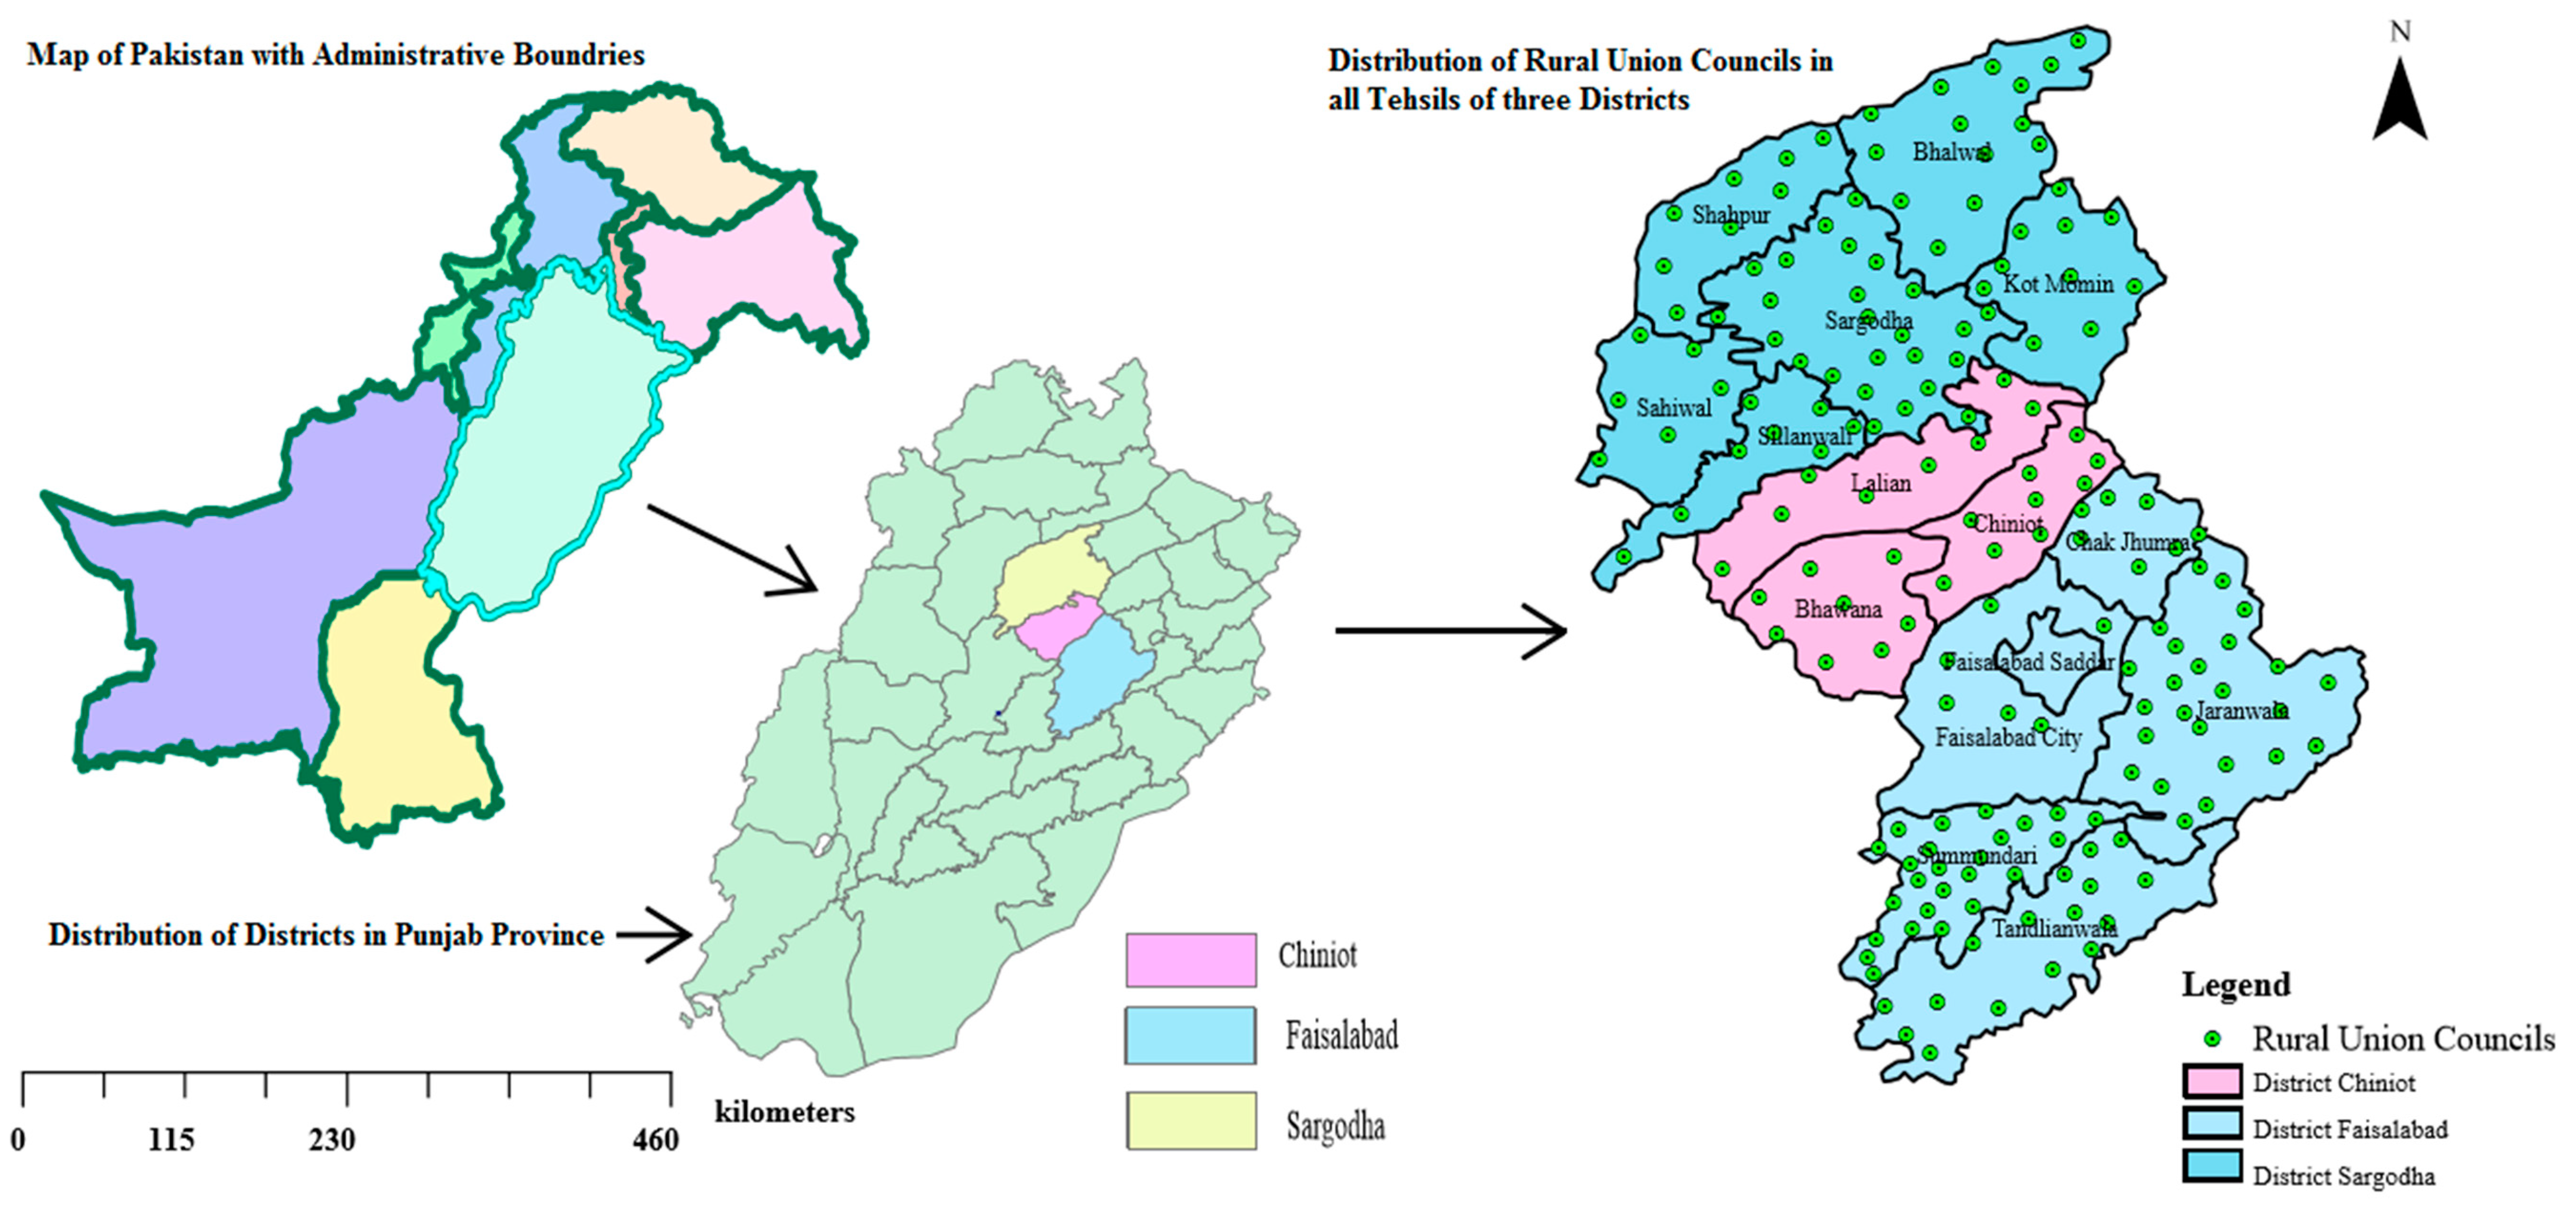
The study was conducted in three semiarid districts located in the same ecological zone (central irrigated plains) in Punjab province of Pakistan: Chiniot, Faisalabad, and Sargodha (Figure 1). The climatic conditions in all three districts fall within the warm desert climate (BWh) according to the Köppen–Geiger classification. The average annual precipitation is 336 mm in Chiniot, 346 mm in Faisalabad, and 410 mm in Sargodha. The average annual temperatures range from 23.8 °C in Sargodha to 24.2 °C in Faisalabad, with mean minimum and maximum temperatures of approximately 11.9 and 34 °C, respectively, in all the districts. Inventory data were collected from 175 rural union councils and 350 villages from 14 tehsils of the abovementioned districts to estimate both the carbon in biomass and soil. A total of 1750 quadrate plots of 0.405 ha (1 acre) each with agroforestry practices were selected and measured by adopting a lottery method of random sampling. The tehsil and the union council are administrative units of the Pakistan government. The tehsil is the fourth administrative unit, which comes after the district, and comprises a few towns and a large number of union councils, and the union council is the fifth administrative unit after the tehsil and only comprises five to seven villages.
2.2. Above- and Belowground Biomass Carbon Estimation
Field visits for inventory data collection were carried out from March 2014 to September 2016. For each tree within each 0.405 ha plot, the girth at 1.37 m above the ground level (except 30 cm above ground for orange trees) and the terminal height were measured and recorded. Tree ages were determined from interviews with the owner of each plot. Tree biomass was calculated with allometric equations from the literature (Table A1) and corrected for log bias where appropriate. When equations for belowground biomass were not available, belowground biomass was assumed to be 26% of the aboveground biomass [26,27]. Individual tree biomass was then scaled to biomass per plot, biomass per hectare, and carbon stock per hectare. Carbon content was calculated from biomass by assuming that the dry mass was 48.1% carbon [28]. The relationship between plot-level tree basal area and carbon content was analyzed using linear regression.
2.3. Total and Potential Carbon Pools
Total tehsil tree carbon was estimated by multiplying the per hectare carbon from sampled plots by the total area of the tehsil. To estimate the potential tree carbon stock of the study area if additional trees were planted, we used the following formula:
where current tree density (trees ha−1) is the average tree density from the field sampling, and potential tree density (trees ha−1) is the average maximum desired tree density specified by farmers interviewed in the study area. Within each union council (subdivision of tehsil, as noted previously), if the average maximum desired tree density specified by farmers in interviews was lower than the largest measured plot tree density in that union council, then the measured value was taken as the potential tree density. This approach allowed our estimate of potential tree density to be influenced by both farmers’ perceptions as well as the logistical and biophysical limitations reflected in the maximum measured tree density [29,30]. Uncertainty in our estimates of potential tree density were expressed as the standard deviation of farmers’ responses to the question, “What is the maximum tree density that you would plant on your farm?”. Standard deviations for potential mean tree C stock and potential tehsil C stock were then scaled appropriately from the SD of potential tree density.
Potential carbon stock = Potential tree density/current tree density × actual carbon stock ha−1
2.4. Soil Sampling and Analysis
Soil was sampled in a random subset of plots stratified to represent the major tree and crop combinations. Soil samples were collected at 0–30 cm depth near the base of a randomly selected tree from the four cardinal directions and were mixed to attain a composite sample. A total of 420 samples were collected from the study area and bulk density was measured using a 100 cm3 stainless-steel cylinder. Samples were stored in polythene bags and analyzed at the University of Agriculture, Faisalabad. After air-drying and passing through a 2 mm sieve, organic carbon was measured using the Walkley–Black method [31]. The values of bulk density, soil depth, and percentage of organic carbon were then multiplied to calculate the soil carbon per hectare [32].
3. Results
3.1. Tree Inventory
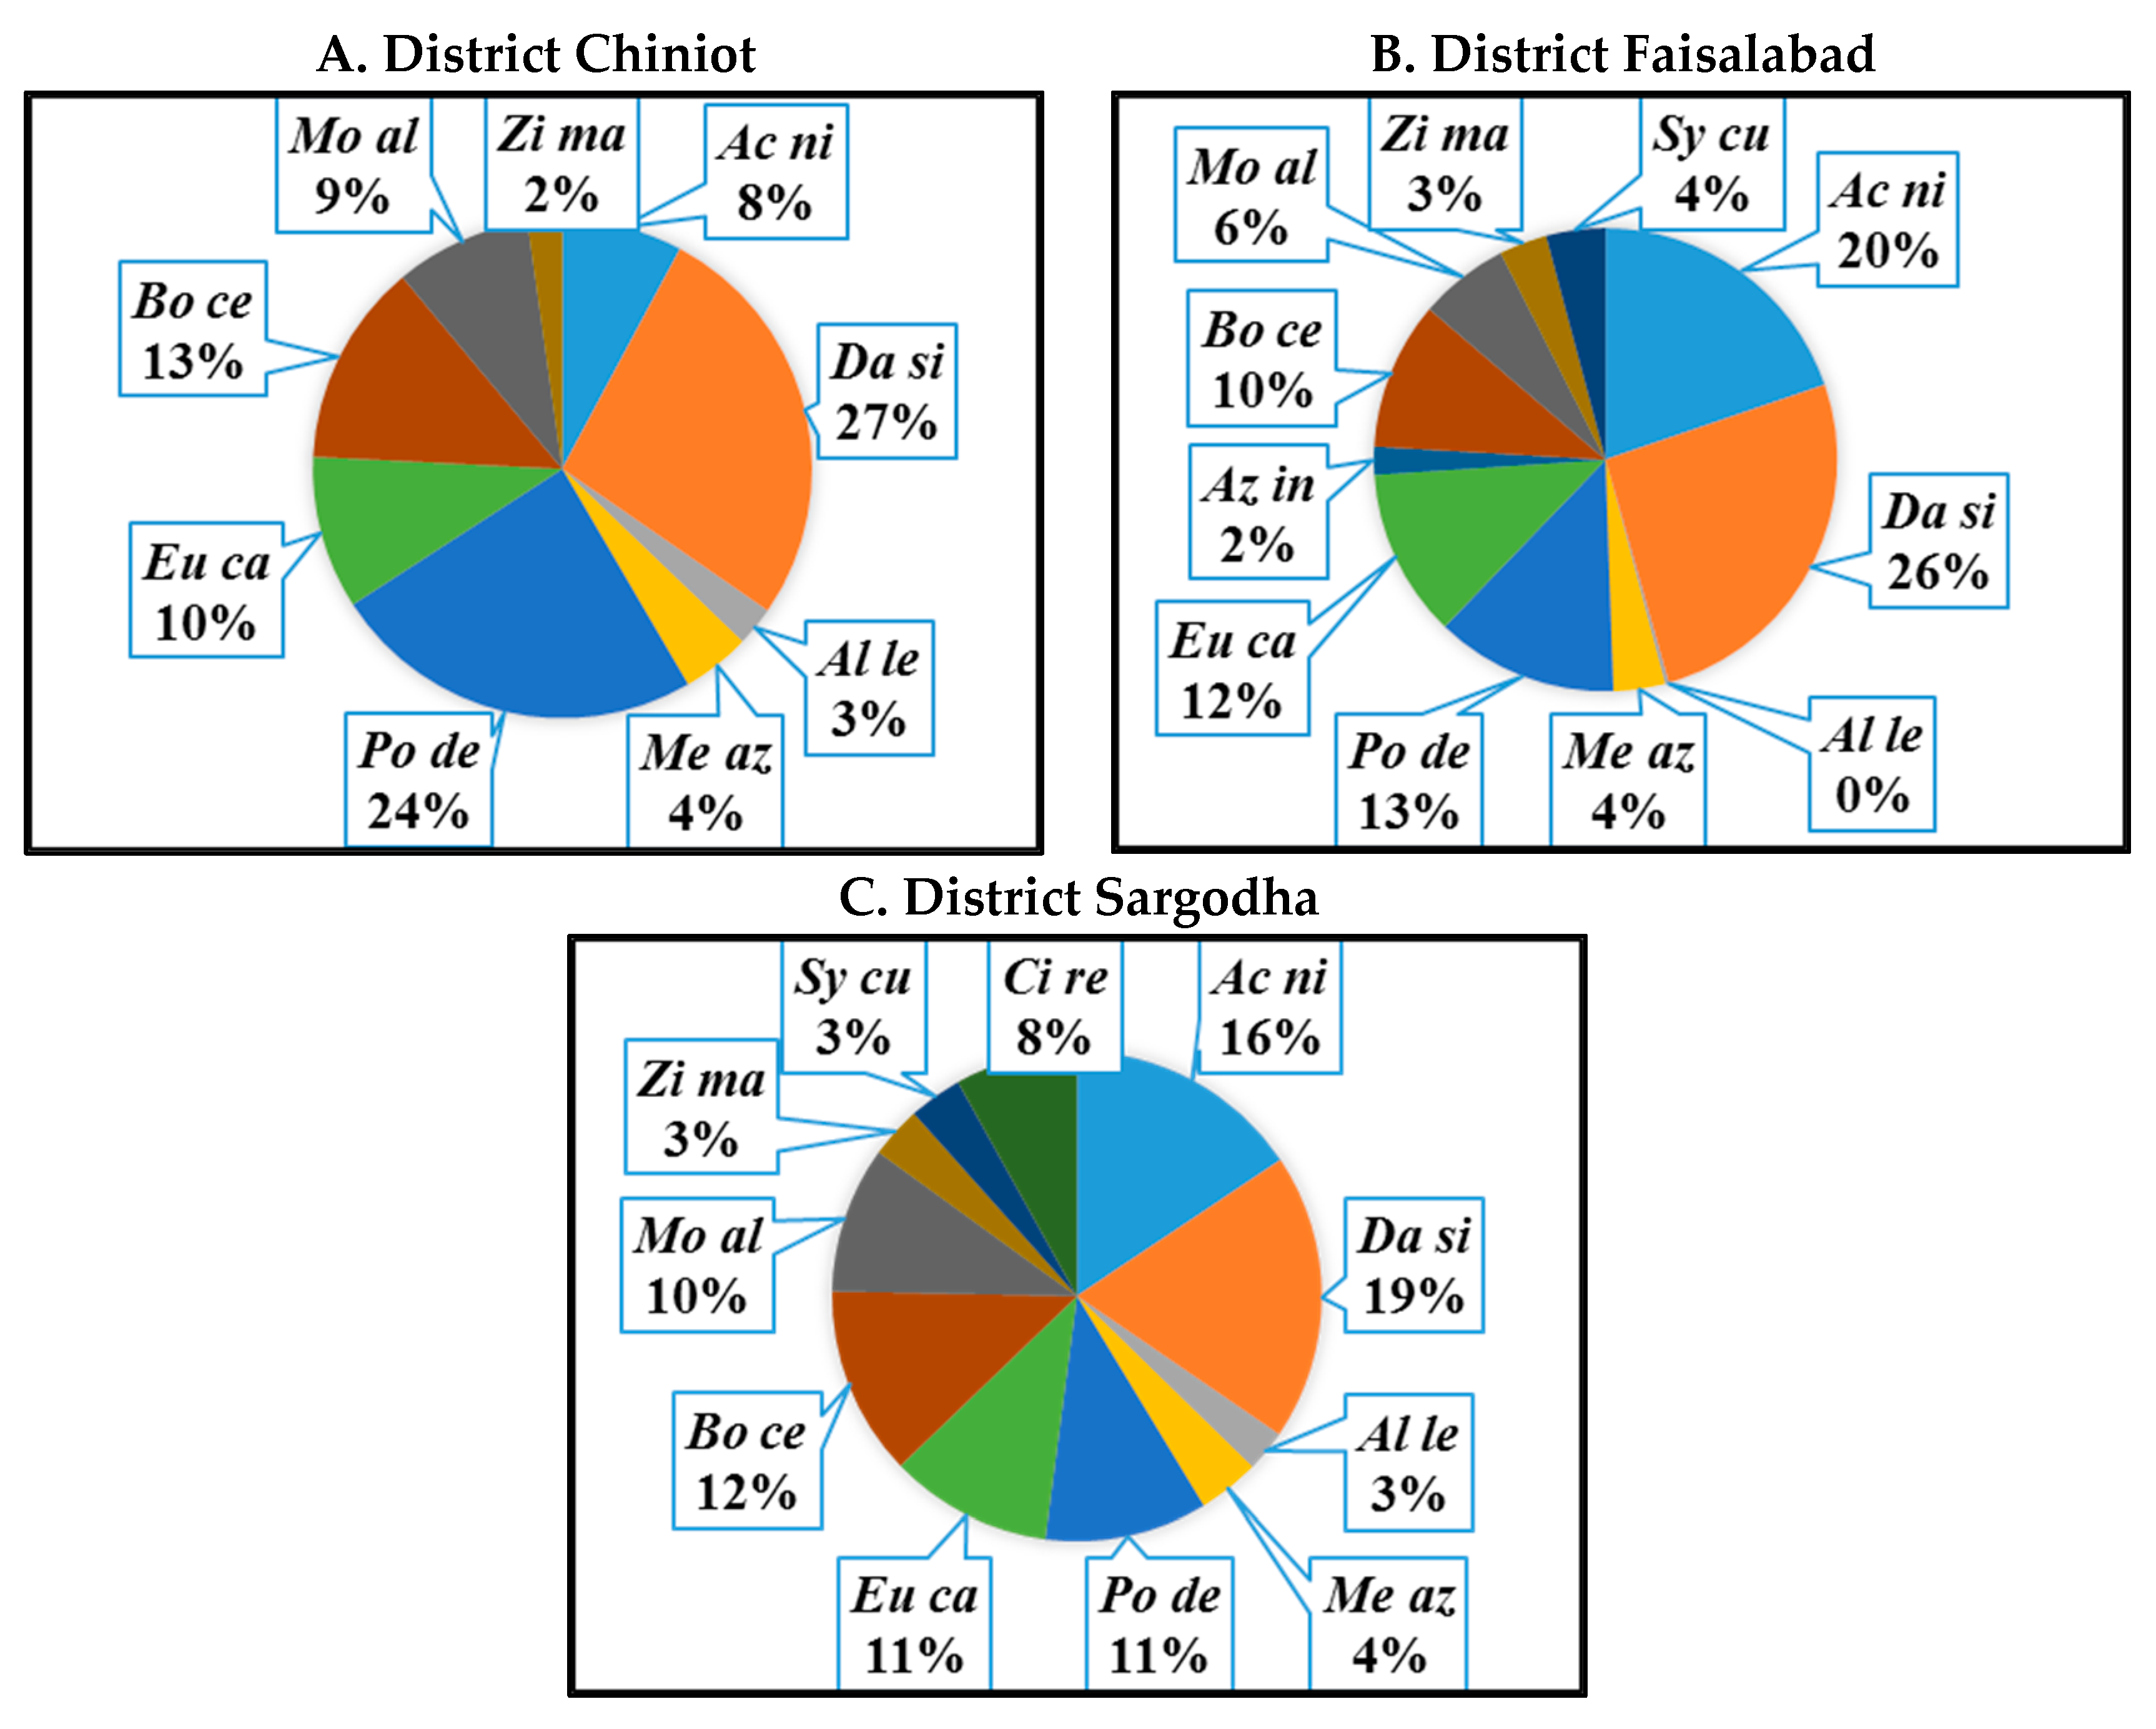
Table 1 summarizes the basic inventory information, namely, diameter at breast height (DBH, cm), height (m), tree age, tree density (ha−1), and tree basal area (m2 ha−1) in three districts at the tehsil level. Linear plantation and interplanting agroforestry patterns were seen among whole study area. There was not much variation in values among all parameters. We observed almost similar types of species in all tehsils of the three districts. The major species preferred by farmers for agroforestry were D. sissoo, Populus deltoides W. Bartram ex Marshall, Eucalyptus camaldulensis Dehnh., and Acacia nilotica Delile. D. sissoo was the dominant species in terms of basal area (27% in Chiniot, 26% in Faisalabad, and 19% in Sargodha) compared with all other species. As shown in Figure 2A–C, the district Chiniot had a much higher basal area of P. deltoides (24%), followed by Faisalabad (13%) and Sargodha (11%). Citrus reticulata Blanco was commercially more interplanted along field crops in district Sargodha compared with the other two districts, accounting for 8% of the basal area. Other species, such as Morus alba Sudw., Albizia lebbek (L.) Benth., Azadirachta indica A. Juss., Ziziphus mauritiana Lam., and Melia azedarach L., shared less than 10% of the basal area in all three districts. Tehsil Samundri in district Faisalabad had the maximum mean DBH (11.97 cm) and height (6.68 m) compared with all other tehsils in the three districts. The mean maximum tree age was observed in tehsil Kot Momin (4.43 years) in district Sargodha and the minimum was in tehsil Jhumra (2.97 years) in district Faisalabad. The mean maximum tree density (51.47 trees ha−1) was observed for tehsil Kot Momin in district Sargodha, followed by tehsil Lalian (41.14 ha−1) in district Chiniot. Tehsil Lalian had maximum mean values of tree basal area (0.68 m2 ha−1) in all three districts, followed by tehsil Chiniot (0.44 m2 ha−1), while all other tehsils had similar basal areas.
3.2. Carbon Stocks
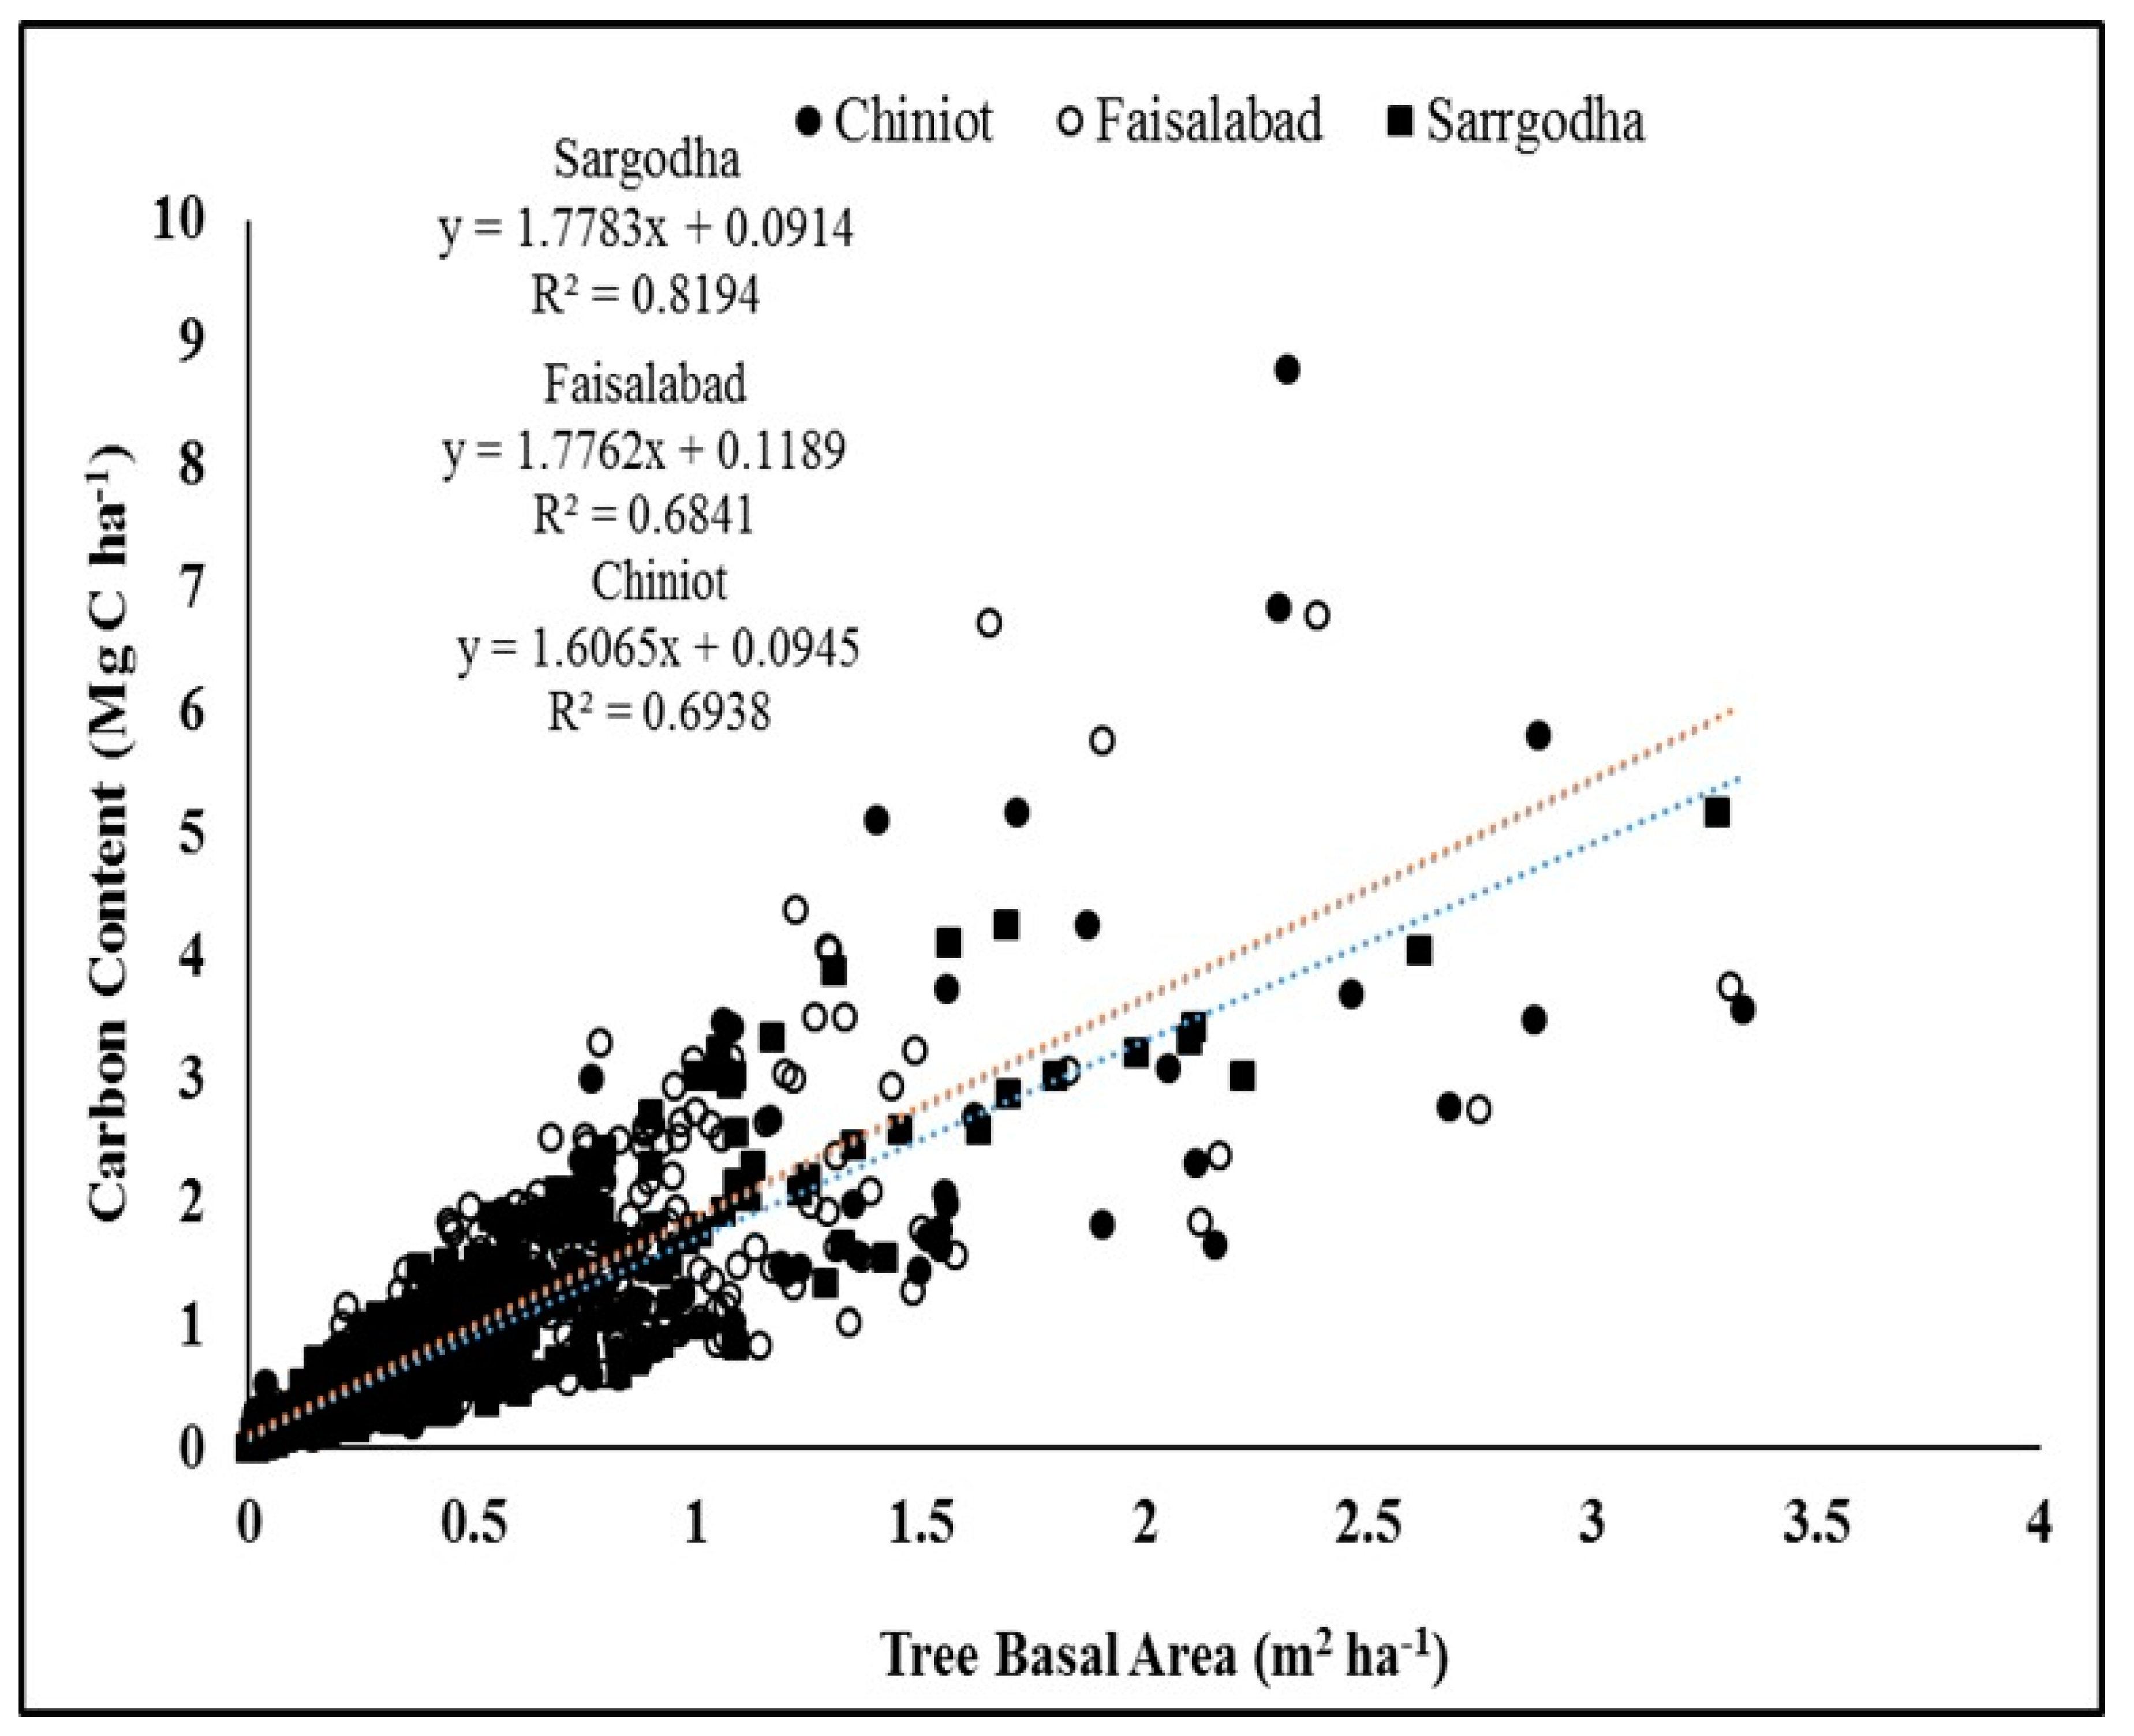
Among all three tehsils of district Chiniot, the maximum carbon stock of the farm trees was found in tehsil Lalian, with an average value of 1.41 Mg ha−1 (Table 2). It was estimated that tehsil Lalian had the maximum current total tree and soil carbon stock of 15,886 and 1,799,920 Mg, respectively, followed by tehsil Chiniot (60,567 and 13,52,179 Mg), whereas tehsil Bhawana had the lowest total tree and soil carbon stock (37,802 and 1,077,813 Mg) in district Chiniot. In district Faisalabad, tehsil Jaranwala had the maximum mean tree carbon stock, with an average value of 0.98 Mg ha−1, followed by tehsils Tandlianwala, Samundri, Jhumra, and Faisalabad. On an area basis, the maximum total tree and soil carbon stock was found in tehsil Jaranwala (1,73,465 and 2,842,199 Mg), while the minimum tree and soil carbon stock was measured in tehsil Jhumra (34,976 and 7,38,350 Mg), respectively (Table 3). It was found that in district Sargodha (Table 4), tehsil Shahpur had the maximum tree carbon stock (5.18 Mg ha−1), while tehsil Silanwali had the lowest tree carbon stock (2.14 Mg ha−1) among all tehsils. The maximum total estimated tehsil tree and soil carbon stock was found in tehsil Sargodha (2,554,870 Mg), while the minimum was estimated in tehsil Silanwali (1,013,827 Mg). Overall, among all tehsils of the three districts, tehsil Lalian had the greatest tree carbon stock (8.79 Mg ha−1), while tehsil Faisalabad had the smallest (0.39 Mg ha−1). The total tehsil tree and soil carbon stock was higher in tehsil Jaranwala compared with all other tehsils in the three districts. When summed to the district level, the total estimated tree and soil carbon stocks were 4,487,087 Mg for Chiniot, 9,396,682 Mg for Faisalabad, and 9,952,629 for Sargodha. There was a strong linear relationship between tree carbon stock and tree basal area at the plot level for each of the three districts (R2 from 0.68 to 0.82, Figure 3). The slope for the regression relating carbon stock to basal area was lower for district Chiniot compared with those for Faisalabad and Sargodha (p = 0.0002).
3.3. Estimated Potential Carbon Stocks
The potential tree carbon stocks were calculated for all three districts by estimating the stocks that would exist if all farms were planted with the maximum desired tree basal area, as determined from farmer interviews and measurements of maximum observed tree densities. The average per hectare potential tree carbon stock was highest in district Chiniot (2.18 Mg C ha−1) compared with districts Faisalabad (1.838 Mg C ha−1) and Sargodha (1.395 Mg C ha−1). When scaled by total land area, district Faisalabad had the highest potential tree carbon stock (1,074,050 Mg), followed by districts Sargodha (838,208 Mg) and Chiniot (585,003 Mg), as indicated in Table 5, Table 6 and Table 7. These potential tree carbon stocks represented a 127.47% (Chiniot), 149.55% (Faisalabad), and 106.54% (Sargodha) increase relative to current total tree carbon stocks.
4. Discussion
This study provides the first assessment of existing and potential carbon pools for agroforestry systems in Pakistan. Although not inherently carbon dense compared to systems such as forests or intensively managed pastures, agroforestry systems provide opportunities to increase carbon storage in agricultural fields by about 20.4 to 21.4 tC ha−1 globally [15] through the incorporation of long-lived, deep-rooted trees [33]. While climatic conditions are homogeneous across the districts we sampled, the amount of carbon sequestered varied because of the distribution of tree species, tree density, tree basal area, and tree age, emphasizing the importance of management decisions in determining carbon stocks. For example, tehsil total mean tree carbon stock was lowest (0.39 Mg ha−1) in Faisalabad and highest (1.41 Mg ha−1) in Lalian among all tehsils in the three districts. This appears to be related primarily to the level of tree stocking in the districts, with tehsil Lalian having the highest average basal area of all tehsils (0.68 m2 ha−1), and Faisalabad having the lowest tree basal area (0.20 m2 ha−1).
The relationship between tree stocking (as defined by basal area) and total carbon stocks was consistent across all plots sampled, with basal area explaining from 69% to 82% of the variation in plot-level carbon stocks across the three districts (Figure 3). Similar patterns were reported in other studies [34,35]. Takimoto et al. [35] noted that traditional agroforestry systems capture and store a higher amount of carbon than developed agroforestry systems or barren lands, principally in light of the fact that traditional systems have older-age trees compared with developed agroforestry systems. The traditional agroforestry system involves cultivation of crops and useful plants under the natural tree canopy with varying structures, functions, socioeconomic attributes, and ecological services. In comparison, improved agroforestry involves selective management of trees with high economic value in association with high-yielding annual and perennial crops. The economics is concerned with looking at how limited resources are best used to create optimal services for rural people [36,37]. Although tree stocking is central in determining carbon storage in agroforestry systems [21], tree species choice also can play an important role [17,33]. This was demonstrated in our data, which showed that the relationship between the total carbon stock and tree basal area differed among the districts (Figure 2). District Chiniot, which had a smaller slope for this relationship, had a much higher proportion of P. deltoides than the other two districts. The lower wood density of Populus likely accounted for this difference.
Nair et al. [38] reported that, worldwide, agroforestry systems have a carbon sequestration potential ranging from 0.29 to 15.21 Mg C ha−1 y−1, depending on factors such as soil properties, species type, tree age, and land management practices. The carbon sequestration potential in our study area ranges from 0.89 (Kot Momin) to 2.84 Mg C ha−1 (Lalian), with an average value of 1.8 Mg C ha−1. At the district level, increasing the tree density has the potential to increase carbon pools by up to 150%. While the level of uncertainty in these estimates (as quantified by standard deviations of the estimates) is substantial, our estimates represent a critical first step in providing useful information for understanding the potential of these systems to store additional carbon. Importantly, our estimate of potential carbon pools is based not only on the relationships between tree basal area and stored carbon (Figure 3) but also on farmer interviews regarding the maximum desirable tree density on farms. As such, our estimate incorporates not only biophysical constraints but also the socioeconomic constraints associated with farmer adoption of cropping changes. For this reason, our estimate represents a likely achievable level of change for Punjab farms. Much previous agroforestry research has involved farm-level agroforestry systems under experimental management, usually with single tree species planted with one or two crops for a defined time [21]. Our study has the advantage of comprehensively and systematically sampling farms from the village level across three districts. Similar types of data collection and biomass estimation were assessed by Murthy et al. [30] from eight villages of two Indian States: Tamilnadu and Karnataka. Pathak et al. [39] described the carbon sequestration rate ranging from 0.02 to 1.2 Mg C ha−1 yr−1 on different cropping patterns in India, which is very similar to our results.
Soil is known as an important subsystem in the agroforestry system to reduce CO2 in the atmosphere. Nair et al. [12] compared the trend of carbon sequestration in agroforestry and other land use systems and ranked them according to their soil carbon sequestration rate: forests > agroforests > tree plantations > arable crops. Agroforestry systems have higher soil carbon contents, as soil carbon in agroforestry largely depends on the amount and quality of biomass input by tree and non-tree components of the system. Moreover, a greater amount of organic carbon returns to the soil in the form of vegetation detritus and litter from pruning under proper agroforestry management [40,41]. Along with tree density, several other factors, such as rainfall, temperature, humidity, leaf litter and its decomposition, crop residues, and chemical properties of the litter, influence the rate of soil carbon sequestration in various agroforestry systems [42]. In this study, the average soil carbon pools ranged from 15.06 to 17.20 Mg C ha−1. Kimaro et al. [43] reported that a greater amount of carbon (21.6–25.6 Mg C ha−1) was sequestered by an agroforestry system having Acacia species (leguminous trees) compared with a monocrop system (13 Mg C ha−1).
5. Conclusions
Our intensive sampling in three districts showed that agroforestry systems in Punjab, Pakistan currently store moderate amounts of carbon in plants and soil. Based on farmer willingness to increase tree stocking, the three districts studied have the potential to increase tree carbon storage from 106.54% to 149.55%. Given appropriate incentives, Punjab’s farmers could help Pakistan meet her commitments to the Paris Climate Accord through reasonable changes in tree planting on existing agroforestry systems.
Author Contributions
Formal analysis, G.Y. and T.A.M.; Investigation, S.G. and M.T.B.Y.; Methodology, G.Y.; Visualization, M.F.N. and N.K.N.; Writing—original draft, G.Y.; Writing—review and editing, M.F.N., T.A.M., and N.K.N.
Funding
The funding was provided by the Higher Education Commission (HEC) Pakistan under NRPU Project #2459.
Acknowledgments
The authors are highly thankful to funding agency (HEC) for providing the funds and required facilities to complete the current research under NRPU Project #2459. We thank Rosvel Bracho and Salvador Gezan for logistical support and statistics advice.
Conflicts of Interest
The authors declare no conflict of interest.
Appendix A

Table A1.
Equations used to estimate biomass for different tree species. Equations are presented transformed appropriately to directly calculate component biomass in kg. In the absence of belowground equations for a species, belowground biomass was assumed to be 26% of aboveground biomass [26].
Table A1.
Equations used to estimate biomass for different tree species. Equations are presented transformed appropriately to directly calculate component biomass in kg. In the absence of belowground equations for a species, belowground biomass was assumed to be 26% of aboveground biomass [26].
| Species | Component 1 | Equation 2 | Citation |
|---|---|---|---|
| A. nilotica | A | 10−1.0646 * D2H0.9098 | Rawat et al. (2008) |
| A. nilotica | B | 10−1.3952 * D2H0.8253 | Rawat et al. (2008) |
| D. sissoo | A | 101.536 * D2H2.929 | Tyagi et al. (2009) |
| D. sissoo | B | 101.087 * D2H2.913 | Tyagi et al. (2009) |
| C. reticulata | A | −6.64 + 0.279 * BA + 0.000514 * BA2 | Schroth et al. (2002) |
| E. camaldulensis | A | e−2.2660 * D2.4663 | Hawkins (1987) |
| M. azedarach | A | 42.31 + 9.52 * 10−5 * D2H | Roy et al. (2006) |
| P. deltoides | A | 173.144 * (1 + e(2.956-(0.120*D)))−1 | Das and Chtervaudi (2005) |
| P. deltoides | B | 69.105 * (1 + e (3.273-(0.077*D)))−1 | Das and Chtervaudi (2005) |
| S. cumini | A | 10−1.2066 * D2H0.9872 | Rai (1984) |
| Tropical moist 3 | A | e−3.1141 * D2H0.9719 | Brown et al. (1989) |
1 A = aboveground; B = belowground. 2 D = tree diameter at 1.3 m (cm), H = total tree height (m), BA = individual tree basal area (cm2). 3 In the absence of species-specific equations, this generalized equation for tropical moist forest trees was used.
References
- Pakistan Bureau of Statistics. A Report on Population Census. 2017. Available online: http://www.pbs.gov.pk/content/population census. (accessed on 12 September 2017).
- Pakistan Economic Survey. Agriculture; 2016; pp. 1–22. Available online: http://www.finance.gov.pk/survey/chapters_17/Pakistan_ES_2016_17_pdf.pdf (accessed on 1 March 2017).
- Mendelsohn, R. The impact of climate change on agriculture in Asia. J. Integr. Agric. 2014, 13, 660–665. [Google Scholar] [CrossRef]
- Sajjad, A.; Liu, Y.; Ishaq, M.; Shah, T.; Abdullah Ilyas, A.; Din, I.U. Climate change and its impact on the yield of major food crops: Evidence from Pakistan. Foods 2017, 6, 39. [Google Scholar]
- Food and Agricultural Organization; International Fund for Agricultural Development; World Food Programme. The State of Food Insecurity in the World 2015. In Meeting the 2015 International Hunger Targets: Taking Stock of Uneven Progress; FAO: Rome, Italy, 2015; pp. 1–62. Available online: http://www.fao.org/3/a i4646e.pdf (accessed on 1 September 2017).
- Zubair, M.; Garforth, C. Farm level tree planting in Pakistan: The role of farmers, perceptions and attitudes. Agrofor. Syst. 2006, 66, 217–229. [Google Scholar] [CrossRef]
- Farooq, T.H.; Nawaz, M.F.; Khan, M.W.; Gilani, M.M.; Buajan, S.; Iftikhar, J.; Tunon, N.; Wu, P. Potentials of agroforestry and constraints faced by the farmers in its adoption in District Nankana Sahib, Pakistan. Int. J. Dev. Sustain. 2017, 6, 586–593. [Google Scholar]
- Yasin, G.; Nawaz, M.F.; Siddiqui, M.T.; Niazi, N.K. Biomass, carbon stocks and CO2 sequestration in three different aged irrigated Populus Deltoides bartr. ex marsh. bund planting agroforestry systems. App. Ecol. Env. Res. 2018, 16, 6239–6252. [Google Scholar] [CrossRef]
- Nawaz, M.F.; Shah, S.A.A.; Gul, S.; Afzal, S.; Ahmad, I.; Ghaffar, A. Carbon sequestration and production of Eucalyptus Camaldulensis plantations on marginal sandy agricultural lands. Pak. J. Agric. Sci. 2017, 54, 335–342. [Google Scholar]
- Alao, J.S.; Shuaibu, R.B. Agroforestry practices and concepts in sustainable land use systems in Nigeria. J. Hort. 2013, 5, 156–159. [Google Scholar]
- Makundi, W.R.; Sathaye, J.A. GHG mitigation potential and cost in tropical forestry-relative role for agroforestry. Env. Dev. Sustain. 2004, 6, 235–260. [Google Scholar] [CrossRef]
- Nair, P.K.R.; Nair, V.D.; Kumar, B.M.; Haile, S.G. Soil carbon sequestration in tropical agroforestry systems: A feasibility appraisal. Environ. Sci. Policy 2009, 12, 1099–1111. [Google Scholar] [CrossRef]
- Sanchez, P.A. Linking climate change research with food security and poverty reduction in the tropics. Agric. Ecosyst. Environ. 2000, 82, 371–383. [Google Scholar] [CrossRef]
- Nair, P.K.R.; Kumar, B.M.; Nair, V.D. Agroforestry as a strategy for carbon sequestration. J. Plant. Nutr. Soil Sci. 2009, 172, 10–23. [Google Scholar] [CrossRef]
- Zomer, R.J.; Neufeldt, H.; Xu, J.; Ahrends, A.; Bossio, D.; Trabucco, A.; van Noordwijk, M.; Wang, M. Global tree cover and biomass carbon on agricultural land: The contribution of agroforestry to global and national carbon budgets. Sci. Rep. 2016, 6, 29987. [Google Scholar]
- Smith, P. Carbon sequestration in croplands: The potential in Europe and the global context. Eur. J. Agron. 2004, 20, 229–236. [Google Scholar] [CrossRef]
- Schroeder, P. Carbon storage benefits of agroforestry systems. Agrofor. Syst. 1994, 27, 89–97. [Google Scholar] [CrossRef]
- Chauhan, S.K.; Sharma, S.C.; Beri, V.; Yadav, S.; Gupta, N. Yield and carbon sequestration potential of Wheat (Triticum aestivum) Poplar (Populus deltoides) based Agri-Silvicultural system. Indian. J. Agric. Sci. 2010, 80, 129–135. [Google Scholar]
- Kaur, B.; Gupta, S.R.; Singh, G. Carbon storage and nitrogen cycling in silvipastoral system on sodic soil Northwestern India. Agrofor. Syst. 2002, 54, 21–29. [Google Scholar] [CrossRef]
- Luedeling, E.; Sileshi, G.; Beedy, T.; Dietz, J. Carbon sequestration potential of agroforestry systems in Africa. In Carbon Sequestration Potential of Agroforestry Systems: Opportunities and Challenges; Kumar, B.M., Nair, P.K.R., Eds.; Springer Science+Business Media: Dordrecht, The Netherlands, 2010; Volume 8, pp. 61–83. [Google Scholar]
- Ajit Dhyani, S.K.; Ramnewaj Handa, A.K.; Prasad, R.; Alam, B.; Rizvi, R.H.; Gupta, G.; Pandey, K.K.; Jain, A. Modeling analysis of potential carbon sequestration under existing agroforestry systems in three districts of Indo-Gangetic plains in India. Agrofor. Syst. 2013, 87, 1129–1146. [Google Scholar] [CrossRef]
- Nizami, S.M. The inventory of the carbon stocks in sub-tropical forest of Pakistan for reporting under Kyoto Protocol. J. Res. 2012, 23, 377–384. [Google Scholar] [CrossRef]
- Ahmad, A.; Mirza, S.N.; Nizami, S.M. Assessment of biomass and carbon stocks in coniferous forest of Dir Kohistan, KPK. Pak. J. Agric. Sci. 2014, 51, 335–340. [Google Scholar]
- Ahmad, A.; Nizami, S.M. Carbon stocks of different land uses in the Kumrat Valley, Hindu Kush Region of Pakistan. J. Res. 2014, 26, 57–64. [Google Scholar] [CrossRef]
- Sajjad, S.; Ashraf, M.I.; Adnan, A.; Rahman, Z. The Bela forest ecosystem of District Jhelum, a potential carbon sink. Pak J. Bot. 2017, 48, 121–129. [Google Scholar]
- Cairns, M.A.; Brown, S.; Helmer, E.H.; Baumgardner, G.A. Root biomass allocation in the world’s upland forests. Oecologia 1997, 111, 1–11. [Google Scholar] [CrossRef]
- Ravindranath, N.H.; Ostwald, M. Methods for Below-Ground Biomass. In Carbon Inventory Methods: Handbook for Greenhouse gas Inventory, Carbon Mitigation and Roundwood Production Projects; Springer Science & Business Media: Dordrecht, The Netherlands, 2008; Volume 29, pp. 149–156. [Google Scholar]
- Thomas, S.C.; Martin, A.R. Carbon content of tree tissues. A Synthesis. Forests 2012, 3, 332–352. [Google Scholar] [CrossRef]
- Nawaz, M.F.; Yousaf, M.T.B.; Yasin, G.; Gul, S.; Ahmed, I.; Abdullah, M.; Rafay, M.; Tanvir, M.A.; Asif, M.; Afzal, S. Agroforestry status and its role to sequester atmospheric CO2 under semi-arid climatic conditions in Pakistan. Appl. Ecol. Environ. Res. 2018, 16, 645–661. [Google Scholar] [CrossRef]
- Murthy, I.K.; Gupta, M.; Tomar, S.; Munsi, M.; Tiwari, R.; Hegde, G.T. Carbon sequestration potential of agroforestry systems in India. J. Earth Sci. Clim. Chang. 2013, 4, 1–7. [Google Scholar] [CrossRef]
- Walkley, A.J.; Black, I.A. An examination of the Degtjareff method for determining soil organic matter and a proposed modification of the chromic acid titration method. Soil Sci. 1934, 37, 29–38. [Google Scholar] [CrossRef]
- De Joa Carlos, M.S.; Carlos, C.C.; Warren, A.D.; Lal, R.; Filho, S.P.V.; Piccolo, M.C.; Feigl, B.E. Organic matter dynamics and carbon sequestration rates for a tillage chrono sequence in a Brazilian Oxisol. Soil. Sci. Soc. Am. J. 2001, 65, 1486–1499. [Google Scholar]
- Albrecht, A.; Kandji, S.T. Carbon sequestration in tropical agroforestry systems. Agric. Ecosyst. Environ. 2003, 99, 15–27. [Google Scholar] [CrossRef]
- Marone, D.; Poirier, V.; Coyea, M.; Olivier, A.; Munson, A.D. Carbon storage in agroforestry systems in the semi-arid zone of Niayes, Senegal. Agrofor. Syst. 2017, 91, 941–954. [Google Scholar] [CrossRef]
- Takimoto, A.; Nair, P.K.; Nair, V.D. Carbon stock and sequestration potential of traditional and improved agroforestry systems in the West African Sahel. Agric. Ecosyst. Environ. 2008, 125, 159–166. [Google Scholar] [CrossRef]
- Viswanath, S.; Lubina, P.A.; Subbanna, S.; Sandhya, M.C. Traditional Agroforestry Systems and Practices: A Review. Adv. Agric. Res. Technol. J. 2018, 2, 18–29. [Google Scholar]
- Sekhar, N.U. Traditional versus improved agroforestry systems in Vietnam: A comparison. Land Degrad. Dev. 2007, 18, 89–97. [Google Scholar] [CrossRef]
- Nair, P.K.R.; Nair, V.D.; Kumar, B.M.; Showalter, J.M. Carbon sequestration in agroforestry systems. Adv. Agron. 2010, 108, 237–246. [Google Scholar]
- Pathak, H.; Byjesh, K.; Chakrabarti, B.; Agarawal, P.K. Potential and cost of carbon sequestration in Indian agriculture: Estimates from long term experiments. Field Crop. Res. 2011, 120, 102–111. [Google Scholar] [CrossRef]
- De Stefano, A.; Jacobson, M.G. Soil carbon sequestration in agroforestry systems: A meta-analysis. Agrofor. Syst. 2018, 92, 285–299. [Google Scholar] [CrossRef]
- Oelbermann, M.; Voroney, R.P.; Gordon, A.M. Carbon sequestration in tropical and temperate agroforestry systems: A review with examples from Costa Rica and Southern Canada. Agric. Ecosyst. Environ. 2004, 104, 359–377. [Google Scholar] [CrossRef]
- Swamy, S.L.; Puri, S. Biomass production and carbon sequestration of Gmelina arborea in plantation and agroforestry system in India. Agrofor. Syst. 2005, 64, 181–195. [Google Scholar] [CrossRef]
- Kimaro, A.A.; Isaac, M.E.; Chamsharma, S.A.O. Carbon pools in tree biomass and soils under rotational woodlot systems in eastern Tanzania. In Carbon Sequestration Potential of Agroforestry Systems: Opportunities and Challenges; Kumar, B.M., Nair, P.K.R., Eds.; Springer Science+Business Media, B.V.: Dordrecht, The Netherlands, 2010; Volume 8, pp. 129–144. [Google Scholar]
Figure 1.
Study area map showing the distribution of union councils within tehsils in three selected districts of Punjab, Pakistan. Sampling plots were within villages associated with each union council shown on the map.
Figure 1.
Study area map showing the distribution of union councils within tehsils in three selected districts of Punjab, Pakistan. Sampling plots were within villages associated with each union council shown on the map.

Figure 2.
Species distribution expressed as a percentage of total basal area for agroforestry plots in districts Chiniot (A), Faisalabad (B), and Sargodha (C) in Punjab, Pakistan. Species abbreviations are as follows: Ac ni—Acacia nilotica Delile, Al le—Albizia lebbek, Az in—Azadirachta indica, Bo ce—Bombax ceiba Burm. f., Ci re—Citrus reticulata, Da si—Dalbergia sissoo, Eu ca—Eucalyptus camaldulensis, Me az—Melia azedarach, Mo al—Morus alba, Po de—Populus deltoides, Sy cu—Syzygium cuminii (Gamble) Tenjarla & Kashyapa, and Zi ma—Ziziphus mauritiana Lam.

Figure 3.
Relationship between total tree carbon stock (Mg C ha−1) and tree basal area (m2 ha−1) for agroforestry inventory plots in Chiniot, Faisalabad, and Sargodha districts in Punjab, Pakistan. The slope for the regression for Chiniot is significantly lower (p = 0.0002) than the slopes for Faisalabad and Sargodha.

Table 1.
Summary of number of measured plots, tree diameter at breast height (DBH), tree height, tree age, tree density, and tree basal area for agroforestry sampling in tehsils within Chiniot, Faisalabad, and Sargodha districts in Punjab, Pakistan.
Table 1.
Summary of number of measured plots, tree diameter at breast height (DBH), tree height, tree age, tree density, and tree basal area for agroforestry sampling in tehsils within Chiniot, Faisalabad, and Sargodha districts in Punjab, Pakistan.
| District | Tehsil | Number of 0.405 ha Plots | DBH (cm) | Height (m) | Tree Age (year) | Tree Density (trees ha−1) | Tree Basal Area (m2 ha−1) | ||||||||||
|---|---|---|---|---|---|---|---|---|---|---|---|---|---|---|---|---|---|
| Mean | Range | SD | Mean | Range | SD | Mean | Range | SD | Mean | Range | SD | Mean | Range | SD | |||
| Chiniot | Bhawana | 80 | 10.86 | 0−27.05 | 6.99 | 5.96 | 0−15.85 | 3.72 | 3.53 | 0−11 | 2.28 | 21.59 | 0−101.31 | 18.99 | 0.30 | 0−1.50 | 0.32 |
| Chiniot | 90 | 11.79 | 0−25.06 | 6.39 | 6.05 | 0−11.91 | 2.58 | 4.15 | 0−10 | 2.11 | 27.26 | 0−123.55 | 21.26 | 0.44 | 0−3.33 | 0.61 | |
| Lalian | 80 | 11.73 | 0−29.32 | 6.60 | 6.44 | 0−12.91 | 3.31 | 3.98 | 0−15 | 2.52 | 41.14 | 0−91.43 | 26.02 | 0.68 | 0−2.87 | 0.70 | |
| Faisalabad | Faisalabad | 60 | 10.02 | 0−23.89 | 6.30 | 5.90 | 0−14.42 | 3.04 | 3.36 | 0−11 | 2.13 | 17.96 | 0−56.83 | 12.60 | 0.20 | 0−1.29 | 0.26 |
| Jaranwala | 250 | 10.38 | 0−27.71 | 6.33 | 6.04 | 0−15.77 | 3.48 | 3.62 | 0−13 | 2.37 | 28.21 | 0−116.14 | 21.38 | 0.39 | 0−2.38 | 0.38 | |
| Jhumra | 70 | 8.60 | 0−24.75 | 6.52 | 5.17 | 0−12.58 | 3.47 | 2.97 | 0−9 | 2.03 | 27.18 | 0−135.91 | 25.69 | 0.35 | 0−3.30 | 0.57 | |
| Samundri | 250 | 11.97 | 0−26.53 | 6.07 | 6.68 | 0−13.80 | 3.20 | 4.38 | 0−14 | 2.57 | 20.40 | 0−76.60 | 15.52 | 0.32 | 0−2.12 | 0.31 | |
| Tandlianwala | 170 | 9.96 | 0−30.87 | 6.82 | 5.56 | 0−14.72 | 3.45 | 3.56 | 0−13 | 2.66 | 25.17 | 0−98.84 | 21.65 | 0.31 | 0−2.16 | 0.35 | |
| Sargodha | Bhalwal | 140 | 9.86 | 0−22.43 | 5.34 | 6.07 | 0−12.66 | 2.84 | 4.10 | 0−12 | 2.14 | 39.87 | 0−276.76 | 43.59 | 0.37 | 0−2.21 | 0.37 |
| Kot Momin | 100 | 9.89 | 0−23.95 | 6.27 | 5.83 | 0−11.71 | 3.27 | 4.43 | 0−10 | 2.65 | 51.47 | 0−358.30 | 85.51 | 0.29 | 0−1.69 | 0.34 | |
| Sahiwal | 60 | 11.77 | 0−31.66 | 7.21 | 6.57 | 0–15.13 | 3.68 | 4.30 | 0−12 | 2.69 | 18.08 | 0−49.42 | 12.84 | 0.29 | 0−1.08 | 0.26 | |
| Sargodha | 250 | 9.67 | 0−26.68 | 6.84 | 5.32 | 0−14.67 | 3.30 | 3.75 | 0−14 | 2.87 | 19.41 | 0−244.63 | 35.30 | 0.21 | 0−2.61 | 0.33 | |
| Shahpur | 75 | 10.16 | 0−23.82 | 6.30 | 6.28 | 0−12.15 | 3.53 | 4.36 | 0−13 | 2.91 | 35.81 | 0−331.12 | 63.60 | 0.36 | 0−3.27 | 0.53 | |
| Silanwali | 75 | 10.15 | 0−23.24 | 7.19 | 6.03 | 0−14.11 | 3.85 | 4.02 | 0−10 | 2.59 | 28.13 | 0−271.82 | 53.44 | 0.25 | 0−1.41 | 0.27 | |
Table 2.
Carbon stock for agroforestry plots from tehsils within district Chiniot in Punjab, Pakistan. Values in parentheses show range.
Table 2.
Carbon stock for agroforestry plots from tehsils within district Chiniot in Punjab, Pakistan. Values in parentheses show range.
| Tehsil | |||
|---|---|---|---|
| Bhawana | Chiniot | Lalian | |
| No. of Plots Measured (0.405 ha) | 80 | 90 | 80 |
| Total Tree Carbon Stock (Mg ha−1) | 0.58 (0.007–2.68) | 0.77 (0.001–5.11) | 1.41 (0.01–8.79) |
| Total Tehsil Area (ha) | 64,151 | 78,593 | 112,072 |
| Total Estimated Tehsil Tree Carbon Stock (Mg) | 37,802 | 60,567 | 15,886 |
| Total Estimated Tehsil Soil Carbon Stock (Mg) | 1,077,813 | 1,352,179 | 1,799,920 |
| Total Estimated Tehsil Tree and Soil Carbon Stock (Mg) | 1,115,615 | 1,412,746 | 1,815,806 |
Table 3.
Carbon stock for agroforestry plots from tehsils within district Faisalabad in Punjab, Pakistan. Values in parentheses show range.
Table 3.
Carbon stock for agroforestry plots from tehsils within district Faisalabad in Punjab, Pakistan. Values in parentheses show range.
| Tehsil | |||||
|---|---|---|---|---|---|
| Faisalabad | Jaranwala | Jhumra | Samundri | Tandlianwala | |
| No. of Plots Measured (0.405 ha) | 60 | 250 | 70 | 250 | 170 |
| Total Tree Carbon Stock (Mg ha−1) | 0.39 (0.01–1.92) | 0.98 (0.0003–6.79) | 0.80 (0.002–3.76) | 0.75 (0.02–4.05) | 0.84 (0.005–5.75) |
| Total Tehsil Area (ha) | 118,600 | 177,005 | 43,720 | 90,386 | 128,463 |
| Total Estimated Tehsil Tree Carbon Stock (Mg) | 46,254 | 173,465 | 34,976 | 67,790 | 107,909 |
| Total Estimated Tehsil Soil Carbon Stock (Mg) | 1,900,175 | 2,842,199 | 738,350 | 1,361,699 | 2,123,865 |
| Total Estimated Tehsil Tree and Soil Carbon Stock (Mg) | 1,946,429 | 3,015,664 | 773,326 | 1,429,489 | 2,231,774 |
Table 4.
Carbon stock for agroforestry plots from tehsils within district Sargodha in Punjab, Pakistan. Values in parentheses show range.
Table 4.
Carbon stock for agroforestry plots from tehsils within district Sargodha in Punjab, Pakistan. Values in parentheses show range.
| Tehsil | ||||||
|---|---|---|---|---|---|---|
| Bhalwal | Kot Momin | Sahiwal | Sargodha | Shahpur | Silanwali | |
| No. of Plots Measured (0.405 ha) | 140 | 100 | 60 | 250 | 75 | 75 |
| Total Tree Carbon Stock (Mg ha−1) | 0.90 (0.001–4.26) | 0.71 (0.007–3.02) | 0.59 (0.01–2.72) | 0.58 (0.005–4.11) | 0.78 (0.0003–5.18) | 0.57 (0.03–2.14) |
| Total Tehsil Area (ha) | 109,500 | 102,000 | 82,900 | 153,600 | 76,900 | 60,700 |
| Total Estimated Tehsil Tree Carbon Stock (Mg) | 98,954 | 72,469 | 49,277 | 89,562 | 60,464 | 35,096 |
| Total Estimated Tehsil Soil Carbon Stock (Mg) | 1,830,933 | 1,663,054 | 1,328,712 | 2,465,308 | 1,280,071 | 978,730 |
| Total Estimated Tehsil Tree and Soil Carbon Stock (Mg) | 1,929,887 | 1,735,523 | 1,377,989 | 2,554,869 | 1,340,535 | 1,013,826 |
Table 5.
Potential tree carbon stock for agroforestry plots from tehsils within district Chiniot in Punjab, Pakistan. Standard deviations are shown for each estimate.
Table 5.
Potential tree carbon stock for agroforestry plots from tehsils within district Chiniot in Punjab, Pakistan. Standard deviations are shown for each estimate.
| Tehsil | Total | |||
|---|---|---|---|---|
| Bhawana | Chiniot | Lalian | ||
| Tree Density (trees ha−1) | 22 ± 17 | 27 ± 22 | 41 ± 26 | - |
| Potential Tree Density (trees ha−1) | 63 ± 39 | 71 ± 43 | 83 ± 40 | - |
| Potential Mean Tree C Stock (Mg ha−1) | 1.69 ± 1.35 | 2.01 ± 1.54 | 2.84 ± 2.11 | - |
| Tehsil Area (ha) | 64,151 | 78,593 | 112,073 | 254,817 |
| Total Potential Tehsil C Stock (Mg) | 108,573 ± 86,891 | 157,618 ± 120,667 | 318,811 ± 236,096 | 585,003 ± 279,019 |
Table 6.
Potential tree carbon stock for agroforestry plots from tehsils within district Faisalabad in Punjab, Pakistan. Standard deviations are shown for each estimate.
Table 6.
Potential tree carbon stock for agroforestry plots from tehsils within district Faisalabad in Punjab, Pakistan. Standard deviations are shown for each estimate.
| Tehsil | Total | |||||
|---|---|---|---|---|---|---|
| Faisalabad | Jaranwala | Jhumra | Samundri | Tandlianwala | ||
| Tree Density (trees ha−1) | 18 ± 15 | 28 ± 22 | 27 ± 17 | 20 ± 13 | 25 ± 8 | - |
| Potential Tree Density (trees ha−1) | 42 ± 23 | 69 ± 42 | 53 ± 33 | 44 ± 22 | 65 ± 22 | - |
| Potential Mean Tree C Stock (Mg ha−1) | 0.91 ± 0.53 | 2.39 ± 1.87 | 1.56 ± 1.53 | 2.15 ± 1.33 | 2.17 ± 1.46 | - |
| Tehsil Area (ha) | 118,600 | 177,005 | 43,720 | 90,386 | 128,463 | 558,174 |
| Total Potential Tehsil C Stock (Mg) | 108,166 ± 67,745 | 424,285 ± 330,915 | 68,202 ± 66,958 | 194,729 ± 119,845 | 278,668 ± 187,810 | 1,074,050 ± 410,138 |
Table 7.
Potential tree carbon stock for agroforestry plots from tehsils within district Sargodha in Punjab, Pakistan. Standard deviations are shown for each estimate.
Table 7.
Potential tree carbon stock for agroforestry plots from tehsils within district Sargodha in Punjab, Pakistan. Standard deviations are shown for each estimate.
| Tehsil | Total | ||||||
|---|---|---|---|---|---|---|---|
| Bhalwal | Kot Momin | Sahiwal | Sargodha | Shahpur | Silanwali | ||
| Tree Density (trees ha−1) | 39 ± 31 | 51 ± 38 | 18 ± 17 | 19 ± 14 | 35 ± 30 | 28 ± 24 | - |
| Potential Tree Density (trees ha−1) | 71 ± 42 | 65 ± 43 | 45 ± 21 | 56 ± 30 | 76 ± 36 | 53 ± 31 | - |
| Potential Mean Tree C Stock (Mg ha−1) | 1.60 ± 1.23 | 0.89 ± 0.80 | 1.47 ± 0.73 | 1.67 ± 1.26 | 1.66 ± 0.94 | 1.07 ± 0.72 | - |
| Tehsil Area (ha) | 109,500 | 102,000 | 82,900 | 153,600 | 76,900 | 60,700 | 585,600 |
| Total Potential Tehsil C Stock (Mg) | 175,497 ± 134,918 | 91,457 ± 81,896 | 121,736 ± 63,371 | 257,028 ± 193,390 | 127,301 ± 72,192 | 65,188 ± 43,527 | 838,208 ± 270,983 |
© 2019 by the authors. Licensee MDPI, Basel, Switzerland. This article is an open access article distributed under the terms and conditions of the Creative Commons Attribution (CC BY) license (http://creativecommons.org/licenses/by/4.0/).
Share and Cite
MDPI and ACS Style
Yasin, G.; Nawaz, M.F.; Martin, T.A.; Niazi, N.K.; Gul, S.; Yousaf, M.T.B. Evaluation of Agroforestry Carbon Storage Status and Potential in Irrigated Plains of Pakistan. Forests 2019, 10, 640. https://doi.org/10.3390/f10080640
AMA Style
Yasin G, Nawaz MF, Martin TA, Niazi NK, Gul S, Yousaf MTB. Evaluation of Agroforestry Carbon Storage Status and Potential in Irrigated Plains of Pakistan. Forests. 2019; 10(8):640. https://doi.org/10.3390/f10080640
Chicago/Turabian StyleYasin, Ghulam, Muhammad Farrakh Nawaz, Timothy Ancel Martin, Nabeel Khan Niazi, Sadaf Gul, and Muhammad Talha Bin Yousaf. 2019. "Evaluation of Agroforestry Carbon Storage Status and Potential in Irrigated Plains of Pakistan" Forests 10, no. 8: 640. https://doi.org/10.3390/f10080640
Note that from the first issue of 2016, this journal uses article numbers instead of page numbers. See further details here.