
Sensor-Based Entropy Source Analysis and Validation for Use in IoT Environments


1
Faculty of Automatic Control and Computers, University POLITEHNICA of Bucharest, 060042 Bucharest, Romania
2
Military Equipment and Technologies Research Agency, 077025 Clinceni, Romania
*
Author to whom correspondence should be addressed.
Electronics 2021, 10(10), 1173; https://doi.org/10.3390/electronics10101173
Submission received: 24 April 2021
/
Revised: 10 May 2021
/
Accepted: 11 May 2021
/
Published: 14 May 2021
(This article belongs to the Section Networks)
Abstract
:The IoT market has grown significantly in recent years, and it is estimated that it will continue to do so. For this reason, the need to identify new solutions to ensure security is vital for the future development in this field. Inadequate sources of entropy are one of the factors that negatively influence security. In this study, inspired by NIST’s latest entropy estimation recommendations, we proposed a methodology for analyzing and validating a sensor-based entropy source, highlighted by an innovative experiment design. Moreover, the proposed solution is analyzed in terms of resistance to multiple types of attacks. Following an analysis of the influence of sensor characteristics and settings on the entropy rate, we obtain a maximum entropy value of 0.63 per bit, and a throughput of 3.12 Kb/s, even when no motion is applied on the sensors. Our results show that a stable and resistant entropy source can be built based on the data obtained from the sensors. Our assessment of the proposed entropy source also achieves a higher complexity than previous studies, in terms of the variety of approached situations and the types of the performed experiments.
1. Introduction
The IoT market is continuously growing. At this moment, is close to 250 billion US dollars, and is estimated to exceed the threshold of 1500 billion in 2025 [1]. More and more fields of activity are using different types of IoT sensors to solve specific problems in healthcare, industry, automation, smart homes, electrical grids, etc. [2,3,4,5]. However, the large and diverse number of used sensors brings a significant amount of concern regarding security and privacy [6,7,8]. These aspects are treated punctually in specialized research approaching different techniques and procedures [9,10,11]. All of them use cryptographic techniques, to ensure security features such as confidentiality, authentication, and integrity. All cryptographic methods need reliable and verifiable sources of randomness [12,13]. These features are even more difficult to obtain in the case of devices with limited resources, such as those available from IoT devices.
Modern cryptographic mechanisms are available to the public and are analyzed in detail. Cryptographic security depends on the ability to have strong and secret keys. A key is strong if it is difficult to guess, therefore random. According to NIST [14], a cryptographic key must have at least 112 bits, which means that the effort required to break the key involves trying at least 2112 combinations. The cryptographic community allocates considerable time and resources for the analysis of the cryptographic strength of the algorithms, or for the identification of specific implementation errors, but, overall, it neglects the analysis of the degree of randomness of the cryptographic keys [15]. A study conducted in 2012 [16] to identify weaknesses in TLS showed that 0.75% of the certificates contain keys with insufficient entropy. The same analysis conducted in 2016 [17] showed that the number of affected devices has increased over time, even though notifications about these vulnerabilities have been made public.
According to NIST [18], the cryptographic key must be generated using approved deterministic random bit generators (DRBGs). Thus, the random sequence generated using the seed as input can be reconstructed. In this way, the problem is transferred to the entropy source, with which DRBG’s seeds are generated. Compared to other types of applications, much more restrictive conditions are imposed for entropy sources in cryptography. Thus, it is mandatory for DRBGs mechanisms to use seeds with at least the number of bits of entropy as their rated security strength [19]. In order to ensure the desired entropy level, a detailed analysis of the entropy source is required [20]. For this purpose, it is necessary to know in detail the natural source of noise, the access to the raw generated data and to have the possibility to analyze its behavior to different environmental factors or adversarial attacks. To achieve all these objectives, in the case of IoT devices, is very difficult due to their high degree of diversity.
There are several types of entropy sources which can be divided into two main categories: software and hardware [15]. Software solutions extract their source of randomness from variation of system events and processes. These are especially suitable for devices that have an operating system, see [21] for Linux and [22] for Windows. In IoT devices these solutions have several disadvantages as they require considerable resources and are suitable for machines that are running many processes. Usually, hardware sources of entropy are based on the unstable behavior of electronic circuits [23], or logic gates in the case of FPGA devices [24,25,26]. These solutions offer good entropy rates, but should be implemented separately or on existing IoT devices, involving additional resources. Thus, some manufacturers have implemented random number generators directly on electronic boards used in IoT (Raspberry Pi, Arduino, STM32), but most of these sources of randomness are not documented well enough, or they manage to solve the problem only for a limited category of devices.
In this paper, we analyzed and validated a sensor-based entropy source. This approach, in which random data is collected from sensors, has also been addressed in several papers [27,28,29,30,31,32,33,34,35,36]. The test methodology used in the analysis of entropy sources is varied and often incomplete. Moreover, the use case scenarios were not taken into account. For these reasons, the values obtained for entropy are varied and cannot be a benchmark for deciding on the practical implementation. The testing and validation methodology used in our study brings improvements regarding the following aspects: entropy estimation, amount of data evaluated, use case analysis, entropy source stability, and resistance to side channels attacks.
The entropy estimation methodology uses 10 different estimators according to the latest NIST recommendation [20]. The lowest value of the entropy obtained from these estimates is considered the real one. The current methodology is more complete than the ones used in the analyzed studies, which lead us to the conclusion that the values of entropy have been overestimated and unrealistic. In our experiments, all entropy estimations were made using 1,000,000 bits sequences as input. The use of smaller sequences can significantly influence the estimated value of entropy, as in the study [28], where differences of approximately 50% were reported. The sensors’ use case scenarios significantly influence the value of entropy, a fact also reported in [36]. Depending on the application in which a sensor is used, certain settings are applied. The influence of sampling frequency on the entropy value has been analyzed in other works [27,29], but the influence of bandwidth and measurement range has not been addressed so far. The analysis of the influence of the temperature has been done before in [29], but it was not performed on large data sequences. The stability estimate of the entropy source after restarting and for a long time period has not been performed so far. In [28], several side channel attacks are presented, but none of them were experimentally conducted. In our experiments, we demonstrated that the generated string of sensors could not be obtained using an identical platform located in the proximity.
The sensor-based entropy source, proposed in this paper, is suitable for the use in IoT environments. The first aspect that supports this statement is that we used sensors for the entropy extraction that are resources already available on the IoT nodes. This solution can have a large applicability because the accelerometer, gyroscope, and magnetometer are used in a variety of IoT applications, such as fitness and sports, drones for flight stabilization, phones, tablets and cameras for rotation control function, vehicle collisions, navigation, orientation, and velocity. To highlight the utility of this method in an IoT environment, we performed a performance and power analysis on a device used as IoT node.
The remainder of this paper is structured as follows. Section 2 presents state of the art of sensor-based entropy sources. Section 3 presents background referring to the NIST recommendation for entropy source validation. In Section 4, the architecture of the entropy source and methodology for analyzing and validation of the proposed solution are presented. Section 5 provides a detailed description of the experiments performed to validate the entropy source while Section 6 offers some conclusions and future work.
2. State of the Art
Many studies address the problem of harvesting entropy from sensor data. The results obtained are often contradictory or do not address all aspects necessary to implement a source of entropy. The differences that appear in the obtained results are largely given by the entropy measurement methodology or using the sensors in various scenarios by applying different setting. On the other hand, the lack of analysis of the entropy source in terms of unpredictability, stability, and protection against adversarial knowledge and control does not give total confidence in the source’s ability to provide, all the time and under any conditions, the same level of entropy. In this chapter, we have summarized the most important works in the field, focusing on aspects that have not been fully addressed in terms of validating an entropy source, according to NIST requirements.
In [27], the data extracted from different types of sensors (vibration, accelerometer, magnetic, motion, gas pressure, temperature, humidity), that are found on most boards used for IoT nodes, are analyzed. The analysis is performed using three scenarios (normal, dynamic and saturation), depending on the specificity of each sensor. To assess the level of entropy, the authors used the NIST methodology available at that time-first draft NIST Special Publication 800-90B, Jan. 2012. Taking into account that the data are biased, they used the estimation methodology used for non i.i.d. (independently and identically distributed) entropy sources using four estimators (frequency test, the collision test, partial collection and compression test), Shannon entropy, and min-entropy. The value of the source entropy was considered to be the minimum of the entropy values obtained from the estimators. From the analysis, it was found that Shannon entropy and min-entropy are even five times higher than those obtained by the other estimators. This can explain the differences in entropy values reported by other authors. Although the entropy analysis performed in this study is closest to the NIST methodology, several aspects can influence the correctness of the results. In this study, four estimators were used compare to the final version of the NIST recommendations where ten estimators are used. The amount of data collected for each experiment is not the same and that influence the estimated values of entropy. In some cases, for various reasons, they cannot collect a sufficient amount of data necessary for good estimation of entropy.
In [28], the authors demonstrated that the type of environment measurements and the sensor devices are sources of randomness, especially on the least significant bits extracted from the measured data. Subsequently, all entropy estimates were made using 1-bit sequences using min entropy and Shannon entropy. Two kinds of experiment were implemented. In the first one, the entropy was calculated using on-board temperature, humidity and light sensors in a home-office environment. In the second, the resilience of the sensors to the reduction of environmental influence and micro-differences of the electronics of the sensors were analyzed. The obtained results showed that good values of entropy could be obtained, especially for temperature and light sensors. Moreover, the second experiment, in which the sensors were sealed in a black box, revealed that the entropy depends on electronic devices with which the measurements are conducted. The experiments showed high values for entropy obtained from high inertia sensors such as temperature and light when performed on small samples. When a longer-term analysis was used, these values decreased by 50%. These values may be even lower if the NIST methodology for estimating entropy is used.
In [29], the possibility of implementing a random number generator using the data purchased from an accelerometer is studied. Moreover, the authors present a solution implemented on a RFID tag, a device with limited resources. The authors demonstrate that the accelerometer generates entropy even when it is used in stationary mode and that it is resistant to a variety of environmental variations and adversarial manipulation. The entropy level is calculated for different types of movements, noise levels, sampling rates, temperatures and even the resonant frequency of the sensor. The conclusion is that the lowest level of entropy is obtained when the sensor is in stationary state.
Seong-Min Cho et al. propose [30] a random number generator, specially designed for drones, with seed extracted from data sensors used for flight: accelerometer, gyroscope and barometer. They used only bits with entropy for seeding the RNG. For that, they identified the positions of the bits that generate entropy depending on the state of the drone: stationary or flight. They also make a comparison between the classic RNGs used for drones and the proposed solution. Finally, a power consumption evaluation is performed. The method used for randomness analysis of data extracted from sensors is derived from the NIST statistical tests [37]. In this approach, a number of 15 tests were used, and a large amount of data. In this paper, only seven tests were used, and there is no information about the amount of data used for experiments. Moreover, NIST recommends another standard [20] to analyze and estimate the entropy sources.
Papers [31,32,33,34] analyze different random number generators that can be developed on mobile phones, using random data extracted from on-build sensors. In this paper, the amount of entropy sources was not estimated, instead some of the tests implemented in NIST statistical tests [37] were deployed for random analysis of sensor data. Because, for statistic reasons, the methodology involves the analysis of a very large number of data (1000 samples of length 1,000,000 bits, the results obtained are not conclusive. For example, in [31,32], a number of three tests were used and, for 75% of tests passed, a sample is considered random. In other papers, the tests were conducted after the application of a conditioning function [33], or an extractor [32].
In papers [35,38,39] are presented different types of random number generators that use sensors. Further, in these studies, the value of entropy was not estimated, but NIST statistical tests were used to directly evaluate the proposed random number generator. Even if the results obtained are satisfactory for RNGs, it is necessary to estimate the entropy they generate to ensure unpredictability for the random material generated.
All the works presented above tried to prove that enough entropy can be extracted from the sensors. Each paper presents a series of experiments performed using different sensors, deployed in various conditions. In addition, the evaluation methodologies are also heterogeneous and non-standardized. For this reason, the obtained results are also often divergent.
The following table presents a comparison between different methodologies used to analyze and validate a source of randomness using five indicators:
- -
- Entropy estimation.
- -
- Amount of data used in experiments.
- -
- Influence of sensors parameters on entropy value.
- -
- Attack resistance and entropy source validation.
As can be seen from Table 1, none of the studies analyzed used 10 estimators for entropy estimation. The use of a large and varied number of estimators increases the level of confidence in the randomness of the entropy source. This is an important factor, as the assessed entropy is the lowest value obtained from these estimators. With one exception [33], the experiments performed in these studies did not use an amount of 1,000,000 samples.
3. Background
In 2018, NIST has released the final version of recommendations for the entropy sources used for random bit generation [20]. This publication contains all the information needed for constructing an entropy source that can be used as input for a NIST approved random bit generator (RBG). Relevant aspects of NIST recommendations for the construction and validation of entropy sources will be presented below.
3.1. Definitions
In order to create a unitary understanding of the concepts described and used in this paper, we will further present a series of basic terms and definitions [20]:
Entropy: A measure of unpredictability, variability or randomness of information contained in a message.
Min-entropy: Min-entropy is a method to measure entropy and it is used in all performed experiments. It quantifies the efficiency of the method of guessing the most likely result of the source of entropy. The formula used in our experiment is presented in (1), where X is an independent discrete random variable that takes values from the set A = {a1,a2, …, ak} with probability pi = Pr(X = ai).
Deterministic random bit generator (DRBG): An RBG that use a deterministic mechanism to produces a sequence of bits from a secret initial value called a seed, along with other possible inputs. For a DRBG to produce bit sequences with certain entropy value, it will use as inputs values extracted from an entropy source.
Entropy rate: The rate at which an entropy source provides entropy. It is a value between 0 and 1, and it is computed by dividing the bitstring assessed entropy to the total number of bits in the bitstring.
Noise source: The component of an entropy source that contains the non-deterministic, entropy—producing activity—in our case, the data collected from the sensors.
Entropy source: The component that produces random bitstrings using a noise source, at the output of which health tests, and, optionally, a conditioning component are used.
Conditioning component: A function used to process the raw data from the noise source in order to reduce bias and ensure a certain entropy rate.
Health tests: A test implemented after or during normal operation of an entropy source, to determine that the implementation continues to perform as implemented and as validated.
Independent and identically distributed (IID): A sequence of random variables, with the same probability distribution, and mutually independent.
Raw data: The digitized output of a noise source.
3.2. Entropy Source Rate Estimation and Validation
The process of validation of an entropy source rate is very important in order to obtain assurance that all relevant requirements are met. For example, the source of entropy must be consistent and provide entropy at a rate that is at least equal to a specified value, or, if the raw noise-source output is biased, an appropriate conditioning component should be included. The main steps of entropy source estimation, which we also followed in this paper, are: noise source entropy estimate, entropy estimation after restart, and entropy estimation after the conditioning component. To validate the entropy source rate, a stability analysis, an adversarial attack analysis, and a health test should be performed.
3.2.1. Noise Source Entropy Estimation
The first step of entropy estimate is made on the raw data collected from the noise source. The estimation method depends on the type of data analyzed. These can be of two types: IID or non-IID. Data can be considered independent and identically distributed if the IID assumption is verified. The IID assumption is tested by applying statistical tests that have the role of highlighting the fact that samples are not IID. If no evidence is identified that these samples are non-IID, then it is assumed that the samples are IID. The statistical tests used for IID data are of two types: permutation tests and chi-square tests. Permutation testing is a method of testing a statistical hypothesis, in which the result of the statistical test applied to a permutation of the original data is compared with the result of the statistical test applied to the original data, and not with a standard statistical distribution. The individual statistical tests used for permutation testing are the following [20]: excursion test statistic, number of directional runs test, length of directional runs test, number of increases and decreases test, number of runs based on the median test, average collision test statistic, maximum collision test, statistic periodicity test statistic, covariance test statistic, and compression test statistic. Chi-square additional testing is performed to test independence and goodness-of-fit as following: test the independence for binary/non-binary data, test the goodness-of-fit for binary/non-binary data, and longest repeated substring test.
For entropy sources with IID output, the entropy rate is estimated using the most common value estimator.
For sources with non-IID outputs, the entropy rate is the minimum value obtained by the following ten estimators: most common value estimate, collision estimate, markov estimate, compression estimate, t-tuple estimate, longest repeated substring estimate, multi most common in window prediction estimate, lag prediction estimate, multiMMC prediction estimate and LZ78Y prediction estimate.
All the tests are performed using a sequential dataset of at least 1,000,000 sample values extracted from noise source (raw data).
3.2.2. Entropy Estimation after Restart
Many entropy sources generate correlated sequences after restart, thus allowing an attacker who has access to the entropy source to predict the sequences generated by it with a higher probability than the entropy estimate suggests. For this reason, it is necessary to perform a re-evaluation of the entropy rate, using acquired data after the source is restarted. The restart dataset is composed from 1000 consecutive samples collected directly from the noise source after 1000 restarts obtaining a Mi,j matrix. Using these data, two datasets are constructed by concatenating the row and the columns of the matrix M. Further, these two data sets are used for entropy re-estimation, using methodology described above for the IID and non-IID data, respectively. First, a sanity check is performed for these two datasets. This test checks the frequency of the most common value, and, if this frequency is significantly greater than the expected value, given the initial entropy estimate, the test fails. This means that the entropy source is not suitable for entropy generation. Second, these two data sets are used for entropy re-estimation using the methodology described above, for the IID and non-IID data, respectively.
3.2.3. Entropy Estimation after Conditioning Component
In some cases, a conditioning component is used to reduce bias or to increase the entropy rate of the entropy source output. To estimate the output entropy, the following formulas are used [20]:
where:
nin = input length;
nout = output length;
nw = narrowest interval width;
Hin = initial (raw source) entropy estimate.
3.2.4. Health Tests
Entropy sources that use physical phenomena to generate random data can be affected by various operating conditions or hardware failures. To detect and act against failures of the noise source, a couple of health tests are required. In [20], two health tests are required. The first one, repetition count test, is made to detect rapidly when the source output the same value for a specific period. The number of identically outputs that cause the health test to fail is calculated by Formula (3), and it depends on the estimated entropy of the source and false positive probability. A reasonable value for this probability is α = 2−20.
The second health test is the adaptive proportion test, and it is designed to detect substantial decreases in the value of entropy caused by various external factors. This test detects if, within a certain range, the source outputs the same sample much more frequently than expected. The windows size is selected at 1024 for binary sources and 512 for the others. The number of repetitions for a sample in the given interval is calculated to satisfy the following Equation (4), using the formula from (5).
where B represents the number of repetitions in given interval and is α = 2−20.
4. Architecture and Entropy Source Analysis and Validation Approach
4.1. Entropy Source Construction
The entropy source that we propose in this paper takes into account the NIST recommendations in [20]. According to them, an entropy source is composed of several mandatory elements, and some optional ones. Figure 1 shows the model of the entropy source that we implemented.
The main component and the root of security is the noise source. The noise source is responsible for the level of randomness of the data at the output of the entropy source. The analysis of this component requires a lot of attention because, if it no longer generates random sequences, there is no other component to compensate for the lack of entropy. The data extracted from the output of this component in digitized form is called raw data.
Health tests represent a very important and mandatory component for the entropy source, because they have the ability to detect in real time any deviation from normal operation within its defined parameters.
Most entropy sources cannot provide unbiased data, or the required level of entropy. In these cases, a deterministic function, named the conditional component, can be used. Our solution uses a SHA256 function as conditional component, which is one of the cryptographic functions recommended by NIST in [20]. Because of that, is not necessary to re-estimate entropy after the conditional component. The solution proposed and analyzed in this paper uses the following built-in sensors on the STM32-B-L475E-IOT01A acquisition board: the LSM6DSL sensor that has a built-in accelerometer and a gyroscope, and the LIS3MDL sensor that has a built-in magnetometer. In addition to this platform, in our experiments, we used other types of sensors or acquisition boards to demonstrate that certain characteristics of these entropy sources are independent of these factors.
The validation of the entropy source was performed in a no motion use case for several reasons. Firstly, the value of the entropy obtained was the lowest in this case, which implies that the use of sensors in other use cases will not decrease the level of security. Secondly, in order to obtain source validation, a large amount of data should be extracted, and this use case made this objective achievable.
4.2. Entropy Source Analysis and Validation
The analysis and validation of the proposed solution accomplished the NIST recommendations for entropy sources specified in [20]. All the theoretical assumptions were validated in the experiments presented in Section 5. The flowchart of the entropy source analysis and validation is presented in Figure 2.
In the first part, the following elements of the noise source that generates noise were identified and analyzed: the physical phenomenon, ADC, and the acquisition platform. Subsequently, we analyzed the stability of the entropy source over time, at temperature variations and the behavior at restart. The number of errors, reported when performing health tests, is another analyzed parameter that indicates the stability of the source over time. Further, we analyzed the resistance to different types of side-channel attacks. The tests ended with an estimate of the availability of the entropy source, and an analysis of the performance and power consumed in the case of the three sensors.
The proposed entropy source is based on the randomness of the data acquired by physical sensors. Three types of motion sensors of different models were used for the experiments performed in this study. For more details about sensors used in experiments, see Section 5.1. We chose these sensors because they are widely used in different types of applications such as fitness and sports, drones, phones, tablets and cameras, vehicle navigation and many others.
Analysis of the noise source was made using the model presented in [28] and in Figure 3. It consists of a sensor, a digital analog converter and a microcontroller (MCU). The sensor reacts to a physical phenomenon that it converts into an analog electrical signal. The ADC converts the analog signal from the sensor into a digital signal through the sampling process, with a certain frequency. Finally, the MCU takes over the digital signal from ADC, and uses it as raw data for the entropy source input.
According to the source model presented above, we conducted the noise source analysis taking into account each component included in noise source model.
4.2.1. Physical Phenomenon Influence on Entropy
In this paper, we analyzed three types of motion sensors: accelerometer, gyroscope and magnetometer. Separately or together, they are used to detect different types of movement. The same analysis was performed for each sensor with the aim of highlighting the random nature of the physical phenomenon detected by the sensors and the influence of movement type on entropy rate.
The physical phenomenon measured by an accelerometer is the accelerating force acting on the sensor. The accelerometer can detect two types of acceleration forces: static and dynamic. Static forces are those that are applied constantly and are represented by frictional or gravitational forces. For this reason, the sensor generates entropy even when it is not moved. Dynamic forces are forces that detect the movement of objects. Gyroscopes measure the angular velocity of a sensor. They are used to measure the tilt and lateral orientation of the object. The operation of the gyroscope is based on the conservation of angular momentum, which specifies that an object that rotates around its own axis tends to maintain the axis of rotation. Magnetometers are sensors that measure the magnetic field or magnetic dipole moment. There are two types of magnetometers: stationary ones, used for measuring at fixed points, and mobile ones, used in applications where motion detection is desired. Taking into account this aspect, it can be understood why sensors with sufficiently high sensitivity can generate entropy.
4.2.2. Sensor Settings and ADC Influence on Entropy
Nowadays, the vast majority of sensors have a built-in ADC. Under these conditions, it is impossible to analyze separately the influence of the sensor and the ADC in the entropy value. Following the experiments performed, we found that some characteristics of the sensor influence the output entropy. The first of them is the measurement range. This parameter defines the amplitude of the physical phenomenon that the sensor can measure. Depending on the application in which the sensor is used, the signals for the internal ADC must be scaled. For example, if an accelerometer is used to detect small variations in acceleration, the sensor device is configured to its smallest measurement range. In our case this value is ±2 g. In this case, if the ADC resolution is on 16 bits, ADC converts the acceleration measured by the sensors into numbers from 0 to 65536. However, if the measurement range is set to a higher value, the ADC converts all the small accelerations to the minimum value and, in this way, the sensor’s output variety is reduced, resulting a smaller value of entropy. In conclusion, a sensor that is not correctly scaled for application in which is used can reduce the level of entropy.
Another characteristic of the sensor that influences the output entropy is the bandwidth. Each sensor has a filtering chain that filters the analog signal coming from the mechanical parts, before being converted by the ADC. If these filters are activated, the low or high frequencies of the analog signal are cut off (the bandwidth is reduced), thus decreasing the level of variation of the output signal, and therefore the level of entropy.
4.2.3. Acquisition Platform Influence on Entropy
The acquisition platform, including the communication channels with the sensors, the type of microcontroller and other electronic components on the acquisition board, could influence the value of the entropy. To determine whether the type of acquisition platform influences the value of entropy, in experiment 4, we used different acquisition boards with the same sensor.
4.2.4. Noise Source Stability
One of the most important features of an entropy source is its stability, which ensures that the entropy rate does not change significantly during normal operation. This characteristic is important as the noise source is external and is based on physical phenomena. We analyzed the noise source stability performing two experiments. In experiment 5, we performed tests to demonstrate the stability of the entropy source by estimating the entropy for a larger number of sequences, and in experiment 6, we considered the case of operation at extreme temperatures.
4.2.5. Attack Resistance
Sources of entropy must be resistant to any type of attack that could decrease the level of entropy. A sensor-based solution is more exposed to all sorts of outside attacks. Attacks can be of two types: active and passive. By active attacks is meant that the attacker tries to change the external environment of the sensor, in order to decrease the entropy level. Passive attacks are those in which the attacker, using an identical acquisition platform, observes the external environment and tries to deduce the random sequence of bits generated by the entropy source. The latter can be categorized as a side channel attack.
In this paper, we have analyzed four types of active attacks that can be performed against the source of entropy: temperature, saturation, repetitive movement, and sampling frequency. The entropy value can be influenced by changing the temperature of the sensor-operating environment. In Experiment 6, we collected data from sensors at low and high temperature. By applying enough motion, the sensors saturation phenomenon can appear, with outputs acquiring only maximum values, thus reducing the value of entropy to almost zero. Preventative solutions to these types of attacks are health tests. They operate in real time, with minimal resources, and are designed to quickly detect drastic decreases of entropy generated by repetitive values output. Another method of attack could be to engage the sensors in a repetitive motion, trying to generate repetitive output sequences. We tried to simulate this type of attack in Experiment 1, in which we placed the sensors on a rotating platform and analyzed the entropy of the data collected under these conditions. Another parameter that can be modified, and which could influence the entropy, is the sampling frequency. In Experiment 3, we analyzed this possibility.
As a passive side-channel attack, we chose to analyze the one that is easiest to perform. The experiment aims to reproduce the string of random bits using an identical acquisition platform. In Experiment 7, we collected data at the same time from two identical acquisition boards, set with the same parameters, placed next to each other in no-motion cases. We analyzed the similarity between the two strings using two mathematical tools: Pearson correlation coefficient, and Hamming distance, also used in [40,41,42]. Details about how we used these tools are presented in Appendix B.
4.2.6. Restart Tests Analysis
Many sources of entropy behave differently immediately after starting. For example, operating systems such as Linux [21] or Windows [22] use to accumulate entropy different types of events that are not very common when restarting the system. For this reason, it is necessary to test the entropy source immediately after restart. According to NIST recommendations [20], we restarted the entropy source 1000 times, and each time we collected a sequence of 1000 samples. With these data, we construct the restart data, consisting in a matrix with 1000-lines and 1000-columns, where Mi,j represents the ith sample from the jth restart. Using this data, we constructed two datasets composed concatenating the rows and columns of matrix Mi,j.
For each row and column from matrix, a sanity check test and entropy estimation are performed. The sanity check test verifies the frequency of the most common value in the rows and the columns of the matrix M. The frequency must be under a specified value, according to the entropy estimate for the test to pass. For each constructed dataset, an entropy re-estimation was performed for each sensor analyzed.
4.2.7. Health Tests Analysis
Health tests are necessary for the rapid detection of major failures materialized by drastically decreasing of entropy rate. Hardware errors or different types of attacks can cause these failures. We implemented two types of health tests (repetition count test and adaptive proportion test), and we analyzed the number of errors detected with these tests for the proposed solution. The repeat count test is applied continuously, and it detects an error if the noise source outputs the same value a certain number of times.
The adaptive proportion test detects when a value repeats with high frequency over a period. This test is constructed to detect more subtle failures. The test checks if a generated sample is identical to the next W-1 samples. W represents window size and is equal to 512 in our case, because our source output is not binary.
5. Experiments and Results
This chapter describes all the experiments performed to support and validate the proposed solution. Evaluation of the entropy source was performed by estimating the entropy level of the noise source under different conditions of sensor use, by analyzing the stability of the entropy source and its resistance to different types of attacks. The entropy value of the noise source was analyzed considering the model shown in Figure 2. Thus, we analyzed the influence of the type of motion in experiment 1, bandwidth and measurement range in experiment 2, sampling frequency in experiment 3, and sensors board and acquisition board in experiment 4. The stability of the source was analyzed on a large number of samples acquired over a long period of time in experiment 5, and the analysis of influence of temperature on entropy value in experiment 6. Side-channel attack resistance was analyzed in experiment 7, and entropy source behavior analysis at restart in experiment 8. The availability of the source was analyzed by estimating the number of errors reported following the application of health tests in experiment 9. The performance analysis and calculation of power consumed are detailed in experiment 10.
For the experiments, three test platforms containing the three motion sensors (magnetometer, accelerometer and gyroscope) from different manufacturers were used. We chose to do this for several reasons. Firstly, we showed that the proposed entropy source can be made with sensors from different manufacturers. Secondly, we were able to analyze the level of entropy in the case of several types of movements. Thirdly, we were able to analyze the influence of the acquisition board on the entropy value, which is impossible to achieve with onboard sensors. Finally, we were able to analyze the influence of bandwidth and measurement range settings for different types of sensors.
Entropy was estimated using the NIST recommendations according to [20] for non-IID data as follows:
- -
- A bitstream of 1,000,000 samples.
- -
- An 8-bit sample representing the least significant bits of raw values extracted from the sensors.
- -
- A number of 10 estimators were used to evaluate the source entropy and the minimum of all the estimates is taken as the entropy assessment.
- -
- The NIST recommended software is used as tool for entropy estimation.
The description and interpretation of the results of the experiments can be found in Section 5.2, and the details regarding the configuration of the sensors is presented in Appendix A.
5.1. Hardware Platforms Description
Several acquisition boards and several sensor models of three types were used for experimental tests. The test platforms are described below.
- ○
- Platform 1 STM32
A specialized board for IoT applications was used for data acquisition. The B-L475E-IOT01A board is developed by STMicroelectronics and uses an ultra-low-power STM32L4 Series MCUs based on Arm Cortex-M4 core with 1 MB of Flash memory and 128 Kbytes of SRAM. The data collected from the sensors were purchased using a laptop and the Teraterm application. The following sensors with which the board is equipped were used for experiments:
- -
- 3-axis accelerometer (LSM6DSL) with the following characteristics: measurement range between ±2 and ±16 g, sensitivity between 0.061 and 0.488 mg/LSB, ODR between 1.6 and 6660 Hz, resolution = 16 bits;
- -
- 3-axis gyroscope (LSM6DSL) with the following characteristics: measurement range between ±125 and ±2000 dps, sensitivity between 4.375 and 70 dps/LSB, ODR between 12.5 and 6660 Hz, resolution = 16 bits;
- -
- 3-axis magnetometer (LIS3MDL) with the following characteristics: measurement range between ±4 and ±16 gauss, sensitivity between 6842 and 1711 LSB/gauss, ODR between 0.625 and 80 Hz, resolution = 16 bits;
- ○
- Platform 2 MPU9250
The second platform used in our experiments uses MPU9250 type sensors and Arduino Uno R3/Atmega 256 as acquisition boards. The Arduino Uno R3 board is equipped with an 8 –bit microcontroller (ATMEGA328P-PU) with flash memory reach to 32k bytes. The Atmega 256 board is equipped with an 8 –bit microcontroller (ATMEGA256) with flash memory to 256k bytes. The data collected from the sensors were purchased using a laptop and the Teraterm application. MPU-9250 is a multi-chip module that contains the following sensors:
- -
- 3-axis accelerometer with the following characteristics: measurement range between ±2 and ±16 g, sensitivity between 0.061 and 0.488 mg/LSB, ODR between 500 and 4000 Hz, resolution = 16 bits;
- -
- 3-axis gyroscope with the following characteristics: measurement range between ±250 and ±2000 dps, sensitivity between 7.63 and 60.97 mdps/LSB, ODR = between 4 and 8000 Hz, resolution = 16 bits;
- -
- 3-axis magnetometer with the following characteristics: full scale measurement range ±48 Gauss, sensitivity =166.66 LSB/gauss, power consumption = 280 uA, resolution = 14 bits;
- ○
- Platform 3 Mobile phone
Huawei ANE-LX1 mobile phone was used as the third platform. The data collected from the sensors were purchased using the SensorData application downloaded from Google Drive. Because with this application we could not change sensor’s parameters, for all the experiments we used the default parameters. For the experiments, we used the following sensors:
- -
- 3-axis accelerometer (ST accelerometer-lsm6ds3) with a measurement range of 8 g and a resolution of 0.009576807 m/s²;
- -
- 3-axis gyroscope with a maxim measurement range of 2000 dps and a resolution of 1.7453292E-5rad/sec;
- -
- 3-axis magnetometer (akm mag-akm09918) with a maximum range of 2000.0 uT and a resolution of 0.0625 uT.
5.2. Experiment Description
- ○
- Experiment 1: Influence of motion on entropy value
In this experiment, we analyzed the influence of the physical phenomenon (in this case the motion applied to the sensors), on the entropy value. We performed experiments on five use cases: car-driving, rotation, running, walking and no moving. In order to highlight the influence of the motion on the entropy value, we performed experiments on all acquisition platforms with the sensors set, as much as possible, with the same parameters. The tests for car-driving motion were performed with all platforms. The data was acquired as much as possible when the car was moving, avoiding routes that would not involve waiting times at traffic lights or pedestrian crossings. The test for walking and running were performed only with platform 3, mobile phone, due to the mobility that this platform offers. For walking use case, the phone was held in the pocket and, for running use case, it was held in hand to simulate the use of sensors in a bracelet. Rotation use case was performed using sensor from platform 2. In this case, the sensors were mounted on a servomotor that had a semi-circular rotational motion at an angle of 180 degrees. The no-motion case tests were performed with platforms 1 and 2. For the third platform, no entropy was gained, because of the sensor settings.
The results are presented in Figure 4, Figure 5 and Figure 6. The highest values were obtained for rotation followed by car driving and running. Entropy was also obtained for no-moving case, but lower values than other use cases. Of the three sensors used for experiments, the magnetometer is the least affected by the type of movement. In the case of MPU9250 and mobile phone platforms, no entropy was obtained because the measurement range is very high. For the STM32 platform, the difference between the entropy values obtained in the two use cases is relatively small compared to the other two sensors.
- ○
- Experiment 2: Influence of bandwidth and measurement range on entropy value
In this experiment, we analyzed the influence of measurement range and bandwidth on entropy value. The experiments were performed with the sensors from platform 1 in no-motion case. Entropy was estimated for different values of measurement range and bandwidth. Different values of bandwidth cannot be set for the magnetometer, so we analyzed the influence of this parameter only for the accelerometer and gyroscope.
The results are presented in Table 2. Analyzing the data from the table, it can be observed that the entropy decreases directly proportional to the bandwidth and inversely proportional to the measurement range. This may be the explanation for the fact that, in different papers [27,28], that did not take this into account, diverging results for entropy were obtained.
- ○
- Experiment 3: Influence of sampling frequency on entropy value
In this experiment, we analyzed the influence of sampling frequency on entropy value. The experiments were performed with the sensors from platform 1 in no-motion case. Entropy was estimated for cases where sensors were set for different values of sampling frequency. In most cases, the sampling frequency is closely related to the bandwidth, so we performed the experiments to have the same bandwidth but different sampling frequency. Observing the results from Table 3, it can be seen that the entropy value is not influenced by the sampling frequency.
- ○
- Experiment 4: Influence of sensors board and acquisition board on entropy value
In this experiment, we analyzed the influence of acquisition board on entropy value. For the experiments, we used two sensors of the same type and different acquisition boards: three boards of the same type, Arduino Uno, and one of another type, Atmega256 equipped with another type of microcontroller. From the results presented in Table 4, it can be seen that the acquisition boards do not influence the entropy value.
- ○
- Experiment 5: Stability of noise source
In this experiment, we studied the stability of noise source by entropy analysis over a long period. For this purpose, we collected data from the sensors on the STM 32 platform for 100 sequences for no-motion use case, 10 sequences for car-driving use case. In addition, from the sensors on the MPU9250 platform, we collected data for 30 sequences in no-motion use case. Table 5 shows the minimum and maximum values obtained, as well as the standard deviation. From Table 5, it can be seen that the entropy values are stable, and standard deviations have very small values of order 10−2.
- ○
- Experiment 6: Influence of temperature on entropy value
In this experiment, we analyzed the stability of noise source in case of operation at extreme temperatures. The tests were performed for minimum temperatures around −18 °C and maximum temperatures around +82 °C. From the results presented in Table 6, it can be seen that, for low temperatures, the entropy values are not different from those estimated in the case of operation at usual temperatures (approximately 23 °C) and, in case of high temperatures, the values are much higher, due to the noise induced by the electronic circuits on the acquisition platform. This theory is validated by the study made in paper [43], in which a direct relationship between temperature and MEMs sensors noise is presented.
- ○
- Experiment 7: Resistance to side channel of attacks
In this experiment, we analyzed the possibility to reconstruct the stream generated by entropy source, using side channel attacks. The experiments were performed with two identical platforms of type 1 in no-motion case. The data were collected at the same time from the two identical platforms, set with the same parameters, placed next to each other. In this way, we tried to create, as much as possible, similar data acquisition conditions. To obtain a better correlation between the two sequences, we introduced a one-second sleep between two consecutive output values. The results were analyzed using two mathematical tools: Pearson correlation coefficient and Hamming distance. For details, see Appendix B.
In Table 7, the Pearson coefficient values for different entropy values are presented. As can be seen from the results, there is no correlation between streams generated by the two identical noise sources.
In Table 8 are presented the Hamming distance values and an average of the deviations (see Formula (3) from Appendix B) for different entropy values. From the results, it can be seen that as the entropy value decreases, the probability of guessing the original bitstring increases using this method of attack. On the other hand, using the sensors set with parameters adapted to the detected signal amplitude, the average deviation is very small and, consequently, the probability of guessing the original string is very small too.
- ○
- Experiment 8: Restart tests
In this experiment, we analyzed the entropy source behavior at restart. To perform the test, the acquisition board was restarted 1000 times by interrupting the power supply for 15 min to allow the electronic circuits to enter the power-off mode. For the collected data, the sanity test-most common value in the rows and columns-was applied. After that, the entropy was re-estimated. Sanity test was performed according to NIST recommendation in [20]. Entropy was estimated for row and column datasets
After performing the experiment, it was found that the sanity check test was passed for each sensor analyzed. As can be seen in Table 9, the re-estimated values of entropy for line and row datasets are higher than those of the initial entropy estimation. We can conclude that this entropy source model does not behave differently at restart.
- ○
- Experiment 9: Health tests
In this experiment, we estimated the number of entropy source failures when health tests are applied. This type of test is important in order to determine if the solution is suitable for implementation in real applications. A large number of failures will decrease the output speed, putting the source in impossibility to generate the necessary random output material.
In Table 10 the numbers of failures for the two health tests are presented. The calculations were made to a very large number of collected data (100,000,000 samples). The results are calculated for different false positive probability values (α). The C values are calculated using NIST recommendations, using Formula (5). In the case of repetition count test for α = 2−20, only in the case of the accelerometer, a number of 10 errors were reported. This means that the entropy source will generate an error at an interval of 785 days. By imposing higher values for false positive probability, health tests will generate errors more often, but not at an alarming rate that could significantly affect the operation of the entropy source. In the case of adaptive count test, no failures are obtained, and it can be seen that, even for small values of false positive probability, the source of entropy does not fall into error.
- ○
- Experiment 10: Performance and power consumption
In this experiment, we calculated the performance and power consumption for the solution proposed. We calculated the performance in Kb/s and the number of bits that can be generated using a 1000 mAh battery. The method of estimating the consumed power was based on the data acquisition scheme, which includes the consumption of the sensor and the consumption of the microcontroller used for the acquisition and for the calculation of the SHA256 conditioning function. Sensor power consumption was estimated using the formulas presented in Appendix A.
Table 11 shows the measurements made for the currents and execution times of the various operations and, finally, the throughput and an estimate of the number of bits generated using a 1000 mAh battery. The current consumed by the sensors is the one estimated by the manufacturer in the datasheet. The MCU current was measured using an ammeter connected to the JP5 pin of the acquisition board. Execution times were measured with the internal timer of the acquisition board.
As can be seen from Table 11, the highest speed and the highest number of bits generated with a 1000 mAh battery was obtained for the magnetometer, even if it did not have the highest entropy value. MCUs consume much more current than sensors, therefore this aspect should be taken into account for optimization. Another important observation is that the conditional function consumes less current than extracting data from sensors, because it has much shorter execution time.
5.3. Results Analysis
The experiments performed in this study had the following purposes: to identify the factors that influence the noise source entropy, to analyze entropy source stability, to determine entropy source resistance to side-channel attack and to analyze the performance and power consumption for the entropy source under analysis.
The first four experiments were performed to identify how motion, parameters settings (bandwidth and measurement range), sampling frequency and acquisition board influence the raw data level of entropy. The influence of the movement on the entropy was also realized in most of the similar studies. From the results obtained in experiment 1, presented in Figure 4, Figure 5 and Figure 6, it can be seen that the intensity of the movement is directly proportional to the entropy. For example, repetitive rotational motion obtains the highest entropy and the state in which the sensors are not moved the lowest values. Compared to other papers in our study we used three different platforms to highlight this aspect.
From the results presented in Table 2, it can be seen that the value of entropy decreases proportionally to bandwidth and increases with measurement range in no-motion use case. The influence of these factors is more important as they differ depending on the use case. For example, to detect the rotation of the mobile phone, certain filters are activated, reducing the bandwidth, while for the detection of wider movements a larger measurement range is set. In comparison with similar studies analyzed in Section 2, this is the first study that uses this approach. This may also explain why large differences in entropy values have been reported in different studies [27,28].
In experiment 3, we analyzed the influence of sampling frequencies on entropy. The results showed that there is no influence on the value of entropy. In this test case the challenge was to obtain a different sampling frequency for the same bandwidth. Usually, they are correlated and not all sensors allow their differentiated setting.
In experiment 4, we analyzed the influence of the acquisition platform and the sensors on the entropy value. This issue has been addressed only in [28] but at a theoretical level. In the experiment, we used two types of Arduino Uno and Atmega256 boards, equipped with different microcontrollers. In the case of the Arduino Uno model, we used three different boards. With all these boards we extracted data using two sensors but of the same type of MPU9250 sensor. From the results presented in Table 4 it can be seen that the constructive differences of the sensors or the type of acquisition platforms do not influence the entropy value.
In experiment 5, we performed a long-term analysis on the entropy source values. The data were collected for two use cases: car driving and no-motion. As we know, this is the first long term analysis of this kind of entropy source. At the same time, we demonstrate that the proposed entropy source generates the same amount of entropy over time. This aspect is also strengthened by the analysis of the effect of temperature on the entropy value.
In experiment 6 we collected data at extreme temperatures between −18 °C and +82 °C. In addition, the stability of the source was demonstrated in experiments 8 and 9. From the analysis of the restart tests presented in Table 9, it can be seen that, after restarting the source, the value of entropy does not decrease. Originally interpreting the health tests, we found that the probability that the proposed source of entropy would go into error is extremely low, once every 784 days, and only in the case of the accelerometer.
In experiment 7, we analyzed the resistance of the proposed solution to the easiest and most likely to conduct side channel attack. We collect data from an identical acquisition platform at the same time. The data were compared using Hamming distance and Pearson coefficient. Although this attack was mentioned in [28], this is the first time it was experimentally conducted.
In experiment 10, we analyzed the performance and power consumption of the proposed solution. This kind of analyze was performed before in several papers [28,30,32]. A comparison with the results presented in these studies is difficult to achieve because both the throughput and power consumption are calculated relatively to full entropy bits generated and none of the studies presented use our entropy estimation methodology. In studies that use min-entropy for entropy estimation, a smaller number of estimators were used: four estimators in [27], three estimators in [28], and one estimator in [29].
To demonstrate the differences that may occur in entropy estimation, inspired by the methods proposed in [44,45,46], in Table 12 we present the results of statistical tests obtained by the 10 estimators used in our work. As can be seen, the estimator used in the most researches, i.e., most common value, always shows much higher values than the assessed entropy values. On the other hand, it is necessary to use all 10 estimators because different estimators give the assessed entropy value. These aspects may rise doubts on the accuracy of the results obtained using other types of entropy estimation methodologies.
In other papers [30,31,32,33], the authors chose to evaluate entropy after processing the raw data with different algorithms. By doing this, they can obtain overestimated values for entropy, depending on the statistical properties of the used algorithms.
In the following section, we synthetically clarify the value of the entropy estimation methodology we used in our experiments.
6. Conclusions
In this paper, we propose an approach to analyze and validate a sensor-based source of entropy. The used methodology takes into account the latest NIST recommendations regarding the evaluation of entropy sources [20]. The theoretical analysis is supported by an innovative experimental design that validates the source of entropy submitted for evaluation. Moreover, we practically demonstrated that this type of entropy source is resistant to side-channel attacks. The fact that the proposed solution uses existing resources, cumulated with an analysis of performance and power consumption on a platform with limited resources, qualifies it for use in IoT applications.
An improperly validated entropy source can create as many security issues as one that has not been analyzed at all. On the contrary, it can create a false impression of trust that can be exploited by attackers. Our validating methodology aims, by conducting experiments, to remove any doubt regarding the source’s ability to always and constantly generate the same amount of entropy, which cannot be influenced or guessed by attackers.
The first argument that supports this statement is the method to estimate the level of entropy generated by the noise source. We demonstrated, in Table 12, that the use of a small number of estimators, or only of most common value, can lead to very large overestimations of entropy. Looking at the papers we analyzed, this study is the only one that uses a complete estimation method that is in accordance with the latest NIST recommendations.
The second aspect to consider is the one referring to the factors that can modify the level of entropy. In our experiments, we tried to identify which these are, and how they can influence entropy. This was done for the first time in this study and shows that this type of entropy sources is influenced by the way the sensors are used. The performed experiments were focused on identifying the influence of sensor characteristics and mode of operation on the value of entropy. From the analysis of the results, obtained after estimating the entropy for five different types of motion, it can be deducted that more motion applied to the sensors generates higher entropy. This was validated using three different types of acquisition platforms, including three different types of sensors, for which the same values of the parameters that influence the entropy were set. Bandwidth and measurement range are other parameters that influence the entropy rate. The bandwidth is related to the filtering of the signal extracted by the sensors. Cutting signals of a certain frequency reduces the entropy level. The filtering method is specific for each sensor, and it must be analyzed separately in each case. The measurement range is usually set according to the amplitude of the analyzed motion. Setting this parameter to a much lower or higher level than the actual value of the measured signal, can produce output data of sensors of the same value, which causes a substantial decrease in the entropy value. From the experiments performed, we did not observe an influence of sampling rate and acquisition board on entropy value. Following this analysis, we obtained very good entropy values, even if no motion was applied to the sensors. The highest entropy value, specifically 0.63 per bit, was obtained for the accelerometer. Compared to the values reported in other works [27,29], our resulting value is higher, despite the fact that the entropy evaluation conditions were more restrictive in our case.
The second set of experiments was performed to validate the proposed solution. For this, we used an original experimental design to demonstrate the noise source stability and its resistance to external attacks. Stability tests were performed on a large number of data sequences, for two use cases. From the standard deviation values calculated in these cases, it can be observed that the entropy values do not vary much. Moreover, from the interpretation of the restart tests, it can be deduced that the value of the entropy source will not decrease, and the health tests show that the probability of the source entering into errors is extremely low.
Active attacks analysis showed that entropy could not be decreased. Only high temperatures can influence entropy, but only in a positive way. The probability of guessing the random output string from the entropy source using an identical acquisition platform is very low, as demonstrated by the values of Pearson coefficient and Hamming distance. As far as we know, an assessment of such complexity (in terms of situations and the types of experiments approached) has not been performed until now on a source of entropy. In addition, the correlation is much lower in our case that the one reported in [47], where entropy sources in cloud computers are analyzed.
Finally, a performance and a power consumption analysis were made. The throughput and the numbers of bits of full entropy extracted from source, powered by a 1000 mAh battery, were calculated for all three sensors. The best results were obtained by the magnetometer, with a throughput of 3.12 Kb/s and an amount of 508.3 Mb of full entropy. This was due to the shorter extraction time of a sample from the sensor compared to the accelerometer, which had a higher entropy rate: 0.63 per bit compared to 0.42 of the magnetometer.
Overall, in this paper we demonstrated that using an appropriate approach, highlighted by a well-conducted set of experiments, we were able to identify the factors that influence a sensor-based entropy source and to validate it in terms of stability and attack resistance. The approach and experimental design presented in the paper can provide a very good and complete model for the analysis and for the validation of an entropy source in order to provide the premises for an implementation in real-life applications.
As future work, we aim to study the possibility of implementing random number generators based on the source model proposed in this paper.
Author Contributions
Formal analysis, Ș.-D.C. and M.E.; funding acquisition, R.R.; investigation, F.R. and M.E.; methodology, F.R. and M.E.; software, F.R.; supervision, R.R.; validation, R.R.; Visualization, Ș.-D.C.; writing—original draft, F.R.; writing—review & editing, R.R., Ș.-D.C., and M.E. All authors have read and agreed to the published version of the manuscript.
Funding
This work was supported by a grant of the Romanian National Authority for Scientific Research and Innovation, CNCS-UEFISCDI, project number 2PTE⁄2020, YGGDRASIL-“Automated System for Early Detection of Cyber Security Vulnerabilities”.
Conflicts of Interest
The authors declare no conflict of interest.
Appendix A
In this Appendix are presented details about the sensor used and data acquisition method used in experiments.
- Experiment 1
- -
- Sensors used:
- ○
- Platform 1:
- ▪
- accelerometer using: measurement range ±16 g and bandwidth 104 Hz;
- ▪
- gyroscope using: measurement range ±2000 dps and bandwidth 104 Hz;
- ▪
- magnetometer using: measurement range ±4 Gauss;
- ○
- Platform 2:
- ▪
- accelerometer using: measurement range ±16 g and bandwidth 92 Hz;
- ▪
- gyroscope using: measurement range ±2000 dps and bandwidth 92 Hz;
- ▪
- magnetometer using: measurement range ±48 Gauss;
- ○
- Platform 3:
- ▪
- accelerometer using: measurement range ±8 G;
- ▪
- gyroscope using: measurement range ±2000 dps;
- ▪
- magnetometer using: measurement range ±48 Gauss.
- -
- Data acquisition method: 1,000,000 samples composed of the least significant 8 bits extracted from the sensors data. The samples from the three axes of the sensor were concatenated to form the bitstring;
- Experiment 2
- -
- Sensors used:
- ○
- Platform 1:
- ▪
- accelerometer using: measurement range ±2/±4/±8 g and bandwidth 3330/417/53 Hz;
- ▪
- gyroscope using: measurement range ±245/±500/±1000 dps and bandwidth 3330/312/22 Hz;
- ▪
- magnetometer using: measurement range ±4/±8/±12 gauss;
- -
- Data acquisition method: 1,000,000 samples composed of the least significant 8 bits extracted from the sensors data. The samples from the three axes of the sensor were concatenated to form the bitstring;
- Experiment 3
- -
- Sensors used:
- ○
- Platform 1:
- ▪
- accelerometer using: measurement range ±2 g, sampling frequency 6660 Hz and 3330 Hz and bandwidth 1666 Hz;
- ▪
- gyroscope using: measurement range ±500 dps, sampling frequency 6660 Hz and 3330 Hz and bandwidth 172 Hz and 173 Hz respectively;
- -
- Data acquisition method: 1,000,000 samples composed of the least significant 8 bits extracted from the sensors data. The samples from the three axes of the sensor were concatenated to form the bitstring;
- Experiment 4
- -
- Sensors used:
- ○
- Platform 2:
- accelerometer using: measurement range ±2 g and bandwidth 92 Hz;
- gyroscope using: measurement range ±500 dps and bandwidth 92 Hz;
- -
- Data acquisition method: 1,000,000 samples composed of the least significant 8 bits extracted from the sensors data. The samples from the three axes of the sensor were concatenated to form the bitstring.
- Experiment 5
- -
- Sensors used:
- ○
- Platform 1:
- ▪
- accelerometer using: measurement range ±2 g and bandwidth 3330 Hz;
- ▪
- gyroscope using: measurement range ±500 dps and bandwidth 3330 Hz;
- ▪
- magnetometer using: measurement range ±4 Gauss;
- ○
- Platform 2:
- ▪
- accelerometer using: measurement range ±2 g and bandwidth 92 Hz;
- ▪
- gyroscope using: measurement range ±500 dps and bandwidth 92 Hz;
- -
- Data acquisition method:
- ○
- 100 sequences for no motion use case and 10 sequences for car-driving with sensors from platform 1 STM32;
- ○
- 30 sequences for no motion use case with sensors from platform 2-MPU9250;
- ○
- Each sequence consists of 1,000,000 samples composed of the least significant 8 bits extracted from the sensors data. The samples from the three axes of the sensor were concatenated to form the bitstring;
- Experiment 6
- -
- Sensors used:
- ○
- Platform 1:
- ▪
- accelerometer using: measurement range ±2 g and bandwidth 3330 Hz;
- ▪
- gyroscope using: measurement range ±500 dps and bandwidth 3330 Hz;
- ▪
- magnetometer using: measurement range ±4 Gauss;
- -
- Data acquisition method: 1,000,000 samples composed of the least significant 8 bits extracted from the sensors data. The samples from the three axes of the sensor were concatenated to form the bitstring.
- Experiment 7
- -
- Sensors used:
- ○
- Platform 1:
- ▪
- accelerometer using: measurement range ±2 g/±4 g/±8 g and bandwidth 3330/417/52 Hz;
- ▪
- gyroscope using: measurement range ±500/±1000 dps and bandwidth 3330/417/52 Hz;
- ▪
- magnetometer using: measurement range ±4/±8/±12 Gauss;
- -
- Data acquisition method:
- ○
- Pearson coefficient analysis: 50 samples of length NBs = Nbs/8 bytes for different combinations of measurement range-bandwidth. Nbs was calculated using Formula (A2). Each byte represents the least significant 8 bits extracted from the sensors data for each axis.
- ○
- Hamming distance analysis: 10,000 samples composed of the least significant 8 bits extracted from each axe of the sensors data. This dataset was collected at the same time from the two identical platforms.
- Experiment 8
- -
- Sensors used:
- ○
- Platform 1:
- ▪
- accelerometer using: measurement range ±2 g and bandwidth 3330 Hz;
- ▪
- gyroscope using: measurement range ±500 dps and bandwidth 3330 Hz;
- ▪
- magnetometer using: measurement range ±4 Gauss;
- -
- Data acquisition method: each 1000 samples extracted after 1000 restarts constructing a matrix where Mi,j represents the jth sample from the ith restart. Two datasets are constructed using the matrix M:
- ○
- Row dataset, constructed by concatenating the rows of the matrix M;
- ○
- Column dataset, constructed by concatenating the columns of the matrix M.
- Experiment 9
- -
- Sensors used:
- ○
- Platform 1:
- ▪
- accelerometer using: measurement range ±2 g and bandwidth 3330 Hz;
- ▪
- gyroscope using: measurement range ±500 dpsa and bandwidth 3330 Hz;
- ▪
- magnetometer using: measurement range ±4 Gauss;
- -
- Data acquisition method: 100,000,000 samples composed of the least significant 8 bits extracted from the sensors data. The samples from the three axes of the sensor were concatenated to form the bitstring;
- Experiment 10
- -
- Sensors used:
- ○
- Platform 1:
- ▪
- accelerometer using: measurement range ±2 g and bandwidth 3330 Hz;
- ▪
- gyroscope using: measurement range ±500 dpsa and bandwidth 3330 Hz;
- ▪
- magnetometer using: measurement range ±4 Gauss;
- ○
- Formulas used to estimate sensors power consumption
- -
- IDE is current consumption mAh needed to extract data from sensors;
- -
- IDD_S is the sensor’s current consumption (mA) estimated from sensors’ datasheet;
- -
- IDD_MCU_S is the MCU’s current measured on the MCU while extracting data from sensor (mA);
- -
- ISHA is current consumption mAh needed to extract data run SHA256 function;
- -
- IDD_MCU_SHA is the MCU’s current measured on the MCU while running SAH256 function (mA);
- -
- ITOT is current consumption mAh needed to extract a full entropy bit from source;
- -
- tDE is the time required to generate a full entropy bit;
- -
- tb is the time required to extract a bit from sensor;
- -
- titer is the time required to extract a set of values corresponding to the three axes (x, y and z)
- -
- Nbe is the number of bits extracted at one iteration = 8-sample size × 3-number of axes;
- -
- ES is entropy value estimation;
- -
- tSHA is the time required to run an instance of the SHA256 function.
Appendix B
In this appendix, methods used to estimate the resistance of entropy source to side-channel attacks presented in Experiment 7 are presented. For the analysis, we used two mathematical tools: Pearson correlation coefficient and Hamming distance.
The Pearson correlation coefficient measures the similarity between two strings of random numbers. In addition, it is referred to as the bivariate correlation and it measures the linear correlation between two variables X and Y. It can take values between +1 and −1, representing positive/negative linear correlation. Given two paired data sets {(x1,y1), … (xn,yn)} (in our case the two sequences collected from the two identical platforms), the Pearson coefficient can be expressed as follows:
where n is the sequence size, xi, yi are individual samples and is the sequence mean.
In the analysis of the attack, we started from the idea that an attacker tries to guess an output of the full entropy source of 256 bits in length, which can be, for example, a cryptographic key. According to NIST recommendations for RBG construction [18], to obtain a full entropy source, an amount of entropy that is twice the length of the conditioning-function output block is needed. In our case, because we use SHA256, we need an amount of 512 bits of entropy. The number of bits needed from the noise source to obtain a full entropy source output is related to the entropy estimation of the noise source as follow:
where is the number of bits needed from the noise source, is the entropy source output in bits and is the estimated entropy of noise source (in our case the sensors min-entropy values estimated in Experiment 5).
Taking the above into account, we calculated the Pearson coefficient for the three axes of each sensor separately for sequences equal to Nbs. We performed the analysis for several values of the entropy of the noise source obtained according to the measurement range and bandwidth. Table 8 shows the averages of the values obtained for the Pearson coefficient for a number of 50 sequences.
The second statistical tool that we used is Hamming distance (HD) that represents the number of bits that an attacker should change to guess the original bitstring. The tests were performed for 10.000 samples of 8-bit length. In this case, HD values around 4 express the fact that the sequences are not correlated. In Table 9, the DH and average deviation (see Formula (3)) values for each axe of each sensor are shown, for several values of the entropy of the noise source, obtained according to the measurement range and bandwidth. The results are presented as an average of the deviations as in (3) because the proposed entropy source uses concatenated values of the three axes of the sensors.
References
- Statista, Size of the IoT Market Worldwide. Available online: https://www.statista.com/statistics/976313/global-iot-market-size/ (accessed on 22 December 2020).
- Hogan, M.; Piccarreta, B. NISTIR 8200. Interagency Report on the Status of International Cybersecurity Standardization for the Internet of Things (IoT). 2018. Available online: https://nvlpubs.nist.gov/nistpubs/ir/2018/NIST.IR.8200.pdf (accessed on 9 February 2021).
- Perwej, Y.; Haq, K.; Parwej, F.; Mumdouh, M. The Internet of Things (IoT) and its Application Domains. Int. J. Comput. Appl. 2019, 182, 36–49. [Google Scholar] [CrossRef]
- Lampropoulos, G.; Siakas, K.; Anastasiadis, T. Internet of Things (IoT) in Industry: Contemporary Application Domains. Int. J. Adv. Sci. Res. Eng. 2018, 4, 109–118. [Google Scholar] [CrossRef]
- Hassan, Q.F. Internet of Things A to Z: Technologies and Applications; Wiley-IEEE Press: New York, NY, USA, 2018; pp. 12–14. [Google Scholar]
- Malhotra, P.; Singh, Y.; Anand, P.; Bangotra, D.P.; Singh, P.K.; Wei-Chiang, H. Internet of Things: Evolution, Concerns and Security Challenges. Sensors 2021, 21, 1809. [Google Scholar] [CrossRef] [PubMed]
- Shaikh, E.; Mohiuddin, I.A.; Manzoor, A. Internet of Things (IoT): Security and Privacy Threats. In Proceedings of the 2019 2nd International Conference on Computer Applications & Information Security (ICCAIS), Riyadh, Saudi Arabi, 1–3 May 2019; IEEE: New York, NY, USA, 2019. [Google Scholar] [CrossRef]
- Mohammed, H.; Qayyum, M. Internet of Things: A Study on Security and Privacy Threats. In Proceedings of the 2017 2nd International Conference on Anti-Cyber Crimes (ICAAC), Abha, Saudi Arabia, 26–27 March 2017; IEEE: New York, NY, USA, 2017. [Google Scholar] [CrossRef]
- Tawalbeh, L.; Muheidat, F.; Tawalbeh, M.; Muhannad, Q. IoT Privacy and Security: Challenges and Solutions. Appl. Sci. 2020, 10, 4102. [Google Scholar] [CrossRef]
- Mohanty, J.; Mishra, S.; Patra, S.; Pati, B.; Panigrahi, C.R. IoT Security, Challenges, and Solutions: A Review. In Progress in Advanced Computing and Intelligent Engineering. Advances in Intelligent Systems and Computing; Panigrahi, C.R., Pati, B., Mohapatra, P., Buyya, R., Li, K.C., Eds.; Springer: Singapore, 2021; Volume 1199. [Google Scholar] [CrossRef]
- Aldowah, H.; Rehman, S.U.; Umar, I. Security in Internet of Things: Issues, Challenges, and Solutions. In Proceedings of the International Conference of Reliable Information and Communication Technology IRICT 2018, Kuala Lumpur, Malaysia, 23–24 July 2018; pp. 396–405. [Google Scholar] [CrossRef]
- RFC 4086—Randomness Requirements for Security. 2005. Available online: https://tools.ietf.org/html/rfc4086. (accessed on 10 February 2021).
- Stipčević, M.; Koç, C.K. True Random Number Generators. In Open Problems in Mathematics and Computational Science; Springer: New York, NY, USA, 2014; pp. 275–315. [Google Scholar]
- Barker, E.; Roginsky, A. NIST Special Publication 800-131A Revision 2, Transitioning the Use of Cryptographic Algorithms and Key Lengths. 2019. Available online: https://nvlpubs.nist.gov/nistpubs/SpecialPublications/NIST.SP.800-131Ar2.pdf (accessed on 9 February 2021).
- Apostol Vassilev, A.; Hall, T.A. The Importance of Entropy to Information Security. Computer 2014, 47, 78–81. [Google Scholar] [CrossRef]
- Nadia, H.; Zakir, D.; Eric, W.; Halderman, J.A. Mining your Ps and Qs: Detection of widespread weak keys in network devices. Security 2012, 12, 35. [Google Scholar]
- Hastings, M.; Fried, J.; Heninger, N. Weak Keys Remain Widespread in Network Devices. In Proceedings of the Internet Measurement Conference, Santa Monica, CA, USA, 14–16 November 2016; pp. 49–63. [Google Scholar] [CrossRef] [Green Version]
- Barker, E.; Kelsey, J. NIST SP 800-90C–Recommendation for Random Bit Generator (RBG) Constructions (Second Draft). 2016. Available online: https://csrc.nist.gov/csrc/media/publications/sp/800-90c/draft/documents/sp800_90c_second_draft.pdf (accessed on 9 February 2021).
- Barker, E.; John Kelsey, J. NIST Special Publication 800-90A Revision 1—Recommendation for Random Number Generation Using Deterministic Random Bit Generators. 2015. Available online: https://nvlpubs.nist.gov/nistpubs/SpecialPublications/NIST.SP.800-90Ar1.pdf (accessed on 9 February 2021).
- Turan, M.S.; Barker, E.; Kelsey, J.; McKay, K.A.; Baish, M.L.; Boyle, M. NIST SP 800-90B Recommendation for the Entropy Sources Used for Random Bit Generation. 2018. Available online: https://nvlpubs.nist.gov/nistpubs/SpecialPublications/NIST.SP.800-90B.pdf (accessed on 9 February 2021).
- Müller, S. Linux Random Number Generator—A New Approach. 2017. Available online: http://www.chronox.de/lrng/doc/lrng.html (accessed on 10 February 2021).
- Ferguson, N. The Windows 10 Random Number Generation Infrastructure. 2019. Available online: https://download.microsoft.com/download/1/c/9/1c9813b8-089c-4fef-b2ad-ad80e79403ba/Whitepaper%20-%20The%20Windows%2010%20random%20number%20generation%20infrastructure.pdf (accessed on 10 February 2021).
- Lampert, B.; Riad Wahby, R.; Shane Leonard, S.; Levis, P. Robust, low-cost, auditable random number generation for embedded system security. In Proceedings of the 14th ACM Conference on Embedded Network Sensor Systems CD-ROM, SenSys ’16, Sttanford, CA, USA, 14–16 November 2016; Association for Computing Machinery: New York, NY, USA, 2016; pp. 16–27. [Google Scholar] [CrossRef] [Green Version]
- Varchola, M.; Drutarovsky, M. New High Entropy Element for FPGA Based True Random Number Generators; Lecture Notes in Computer Science; Springer: Berlin/Heidelberg, Germany, 2010. [Google Scholar] [CrossRef] [Green Version]
- Rethinam, S.; Rajagopalan, S.; Arumugham, S.; Janakiraman, S.; Lakshmi, C.; Rengarajan, A. Pyramid Entropy Source for True Random Number Generator on FPGA. In Proceedings of the 3rd International Conference on Advanced Computing and Intelligent Engineering (ICACIE), Bhubaneswar, India, 22–24 December 2018; Volume 2, pp. 22–23. [Google Scholar] [CrossRef]
- Majzoobi, M.; Koushanfar, F.; Devadas, S. FPGA-Based True Random Number Generation Using Circuit Metastability with Adaptive Feedback Control; Lecture Notes in Computer Science; Springer: Berlin/Heidelberg, Germany, 2011; Volume 6917. [Google Scholar] [CrossRef] [Green Version]
- Hennebert, C.; Hossayni, H.; Lauradoux, C. Entropy harvesting from physical sensors. In Proceedings of the Sixth ACM Conference on Security and Privacy in Wireless and Mobile Networks (WISEC’13), Budapest, Hungary, 17–19 April 2013; pp. 149–154. [Google Scholar] [CrossRef]
- Pawlowski, M.P.; Jara, A.; Ogorzalek, M. Harvesting Entropy for Random Number Generation for Internet of Things Constrained Devices Using On-Board Sensors. Sensors 2015, 15, 26838–26865. [Google Scholar] [CrossRef] [PubMed] [Green Version]
- Voris, J.; Nitesh Saxena, N.; Tzipora Halevi, T. Accelerometers and Randomness: Perfect Together. In Proceedings of the Fourth ACM Conference on Wireless Network Security (WiSec ’11), Hamburg, Germany, 11–14 June 2011; pp. 115–126. [Google Scholar] [CrossRef]
- Cho, S.M.; Hong, E.; Seo, S.H. Random Number Generator Using Sensors for Drone. IEEE Access 2020, 8, 30343–30354. [Google Scholar] [CrossRef]
- Wallace, K.; Moran, K.; Novak, E.; Zhou, G.; Sun, K. Toward Sensor-Based Random Number Generation for Mobile and IoT Devices. IEEE Internet Things J. 2016, 3, 1189–1201. [Google Scholar] [CrossRef]
- Marghescu, A.; Teseleanu, G.; Svasta, P. Cryptographic Key Generator Candidates based on Smartphone built-in Sensors. In Proceedings of the 20th International Symposium for Design and Technology in Electronic Packaging (SIITME), Bucharest, Romania, 23–26 October 2014; pp. 239–243. [Google Scholar] [CrossRef]
- Loutfi, J.; Chehab, A.; Elhajj, I.H.; Kayssi, A. Smartphone Sensors as Random Bit Generators. In Proceedings of the 11th International Conference on Computer Systems and Applications AICCSA, Doha, Qatar, 10–13 November 2014; pp. 773–780. [Google Scholar] [CrossRef]
- Suciu, A.; Lebu, D.; Marton, K. Unpredictable random number generator based on mobile sensors. In Proceedings of the 7th International Conference on Intelligent Computer Communication and Processing, Cluj Napoca, Romania, 25–27 August 2011; pp. 445–448. [Google Scholar] [CrossRef]
- Hong, S.L.; Liu, C. Sensor-based random number generator seeding. IEEE Access 2015, 562–568. [Google Scholar] [CrossRef]
- Lv, N.; Chen, T.; Ma, Y. Analysis on Entropy Sources based on Smartphone Sensors. In Proceedings of the 10th International Conference on Communication and Network Security (ICCNS), Tokyo, Japan, 27–29 November 2020; pp. 21–31. [Google Scholar] [CrossRef]
- Rukhin, A.; Soto, J.; Nechvatal, J.; Smid, M.; Barker, E.; Leigh, S.; Levenson, M.; Vangel, M.; Banks, D.; Heckert, A.; et al. A Statistical Test Suite for Random and Pseudorandom Number Generators for Cryptographic Applications, revision 1a, Standard 800-22. 2010. Available online: https://nvlpubs.nist.gov/nistpubs/Legacy/SP/nistspecialpublication800-22r1a.pdf (accessed on 10 February 2021).
- Sun, Y.; Lo, B. Random Number Generation Using Inertial Measurement Unit Signals for On-Body IoT Devices. In Proceedings of the Living in the Internet of Things: Cybersecurity of the IoT—2018, London, UK, 28–29 March 2018; IET: London, UK, 2018; p. 9. [Google Scholar] [CrossRef]
- Chen, I.T. Random Numbers Generated from Audio and Video Sources. Math. Probl. Eng. 2013. [Google Scholar] [CrossRef]
- Randolph, M.; Diehl, W. Power Side-Channel Attack Analysis: A Review of 20 Years of Study for the Layman. Cryptography 2020, 4, 15. [Google Scholar] [CrossRef]
- Socha, P.; Miskovsky, V.; Kubatova, H.; Novotny, M. Optimization of Pearson correlation coefficient calculation for DPA and comparison of different approaches. In Proceedings of the 20th International Symposium on Design and Diagnostics of Electronic Circuits & Systems (DDECS), Dresden, Germany, 19–21 October 2017; IEEE: New York, NY, USA, 2017; pp. 184–189. [Google Scholar] [CrossRef]
- Liua, H.; Gotoa, S.; Tsunoo, Y. Correlation Power Analysis with Companding Methods. Procedia Eng. 2011, 15, 2108–2112. [Google Scholar] [CrossRef] [Green Version]
- Mohd-Yasin, F.; Nagel, D.; Can Korman, C. Topical Review: Noise in Mems, Measurement Science and Technology. Meas. Sci. Technol. 2010, 21, 1. [Google Scholar] [CrossRef]
- Fan, G.; Qing, S.; Wang, H.; Hong, W.C.; Li, H.J. Support vector regression model based on empirical mode decomposition and auto regression for electric load forecasting. Energies 2013, 6, 1887–1901. [Google Scholar] [CrossRef]
- Chen, Y.H.; Hong, W.C.; Shen, W.; Huang, N.N. Electric load forecasting based on LSSVM with fuzzy time series and global harmony search algorithm. Energies 2016, 9, 70. [Google Scholar] [CrossRef]
- Li, M.W.; Wang, Y.T.; Geng, J.; Hong, W.C. Chaos cloud quantum bat hybrid optimization algorithm. Nonlinear Dyn. 2021, 103, 1167–1193. [Google Scholar] [CrossRef]
- Kerrigan, B.; Chen, Y. A Study of Entropy Sources in Cloud Computers: Random Number Generation on Cloud Hosts. In Proceedings of the 6th International Conference on Mathematical Methods, Models and Architectures for Computer Network Security: Computer Network Security (MMM-ACNS), Saint Petersburg, Russia, 17–19 October 2012; pp. 286–298. [Google Scholar] [CrossRef]
Figure 1.
Entropy source model [20].
Figure 1.
Entropy source model [20].

Figure 2.
Entropy source analysis and validation.

Figure 3.
Noise source model.

Figure 4.
Entropy values for STM32 platform for no-moving and car driving use cases.

Figure 5.
Entropy values for MPU9250 platform for no-moving, car driving, and rotation use cases.

Figure 6.
Entropy values for mobile phone platform for car-driving, running, and walking use cases.


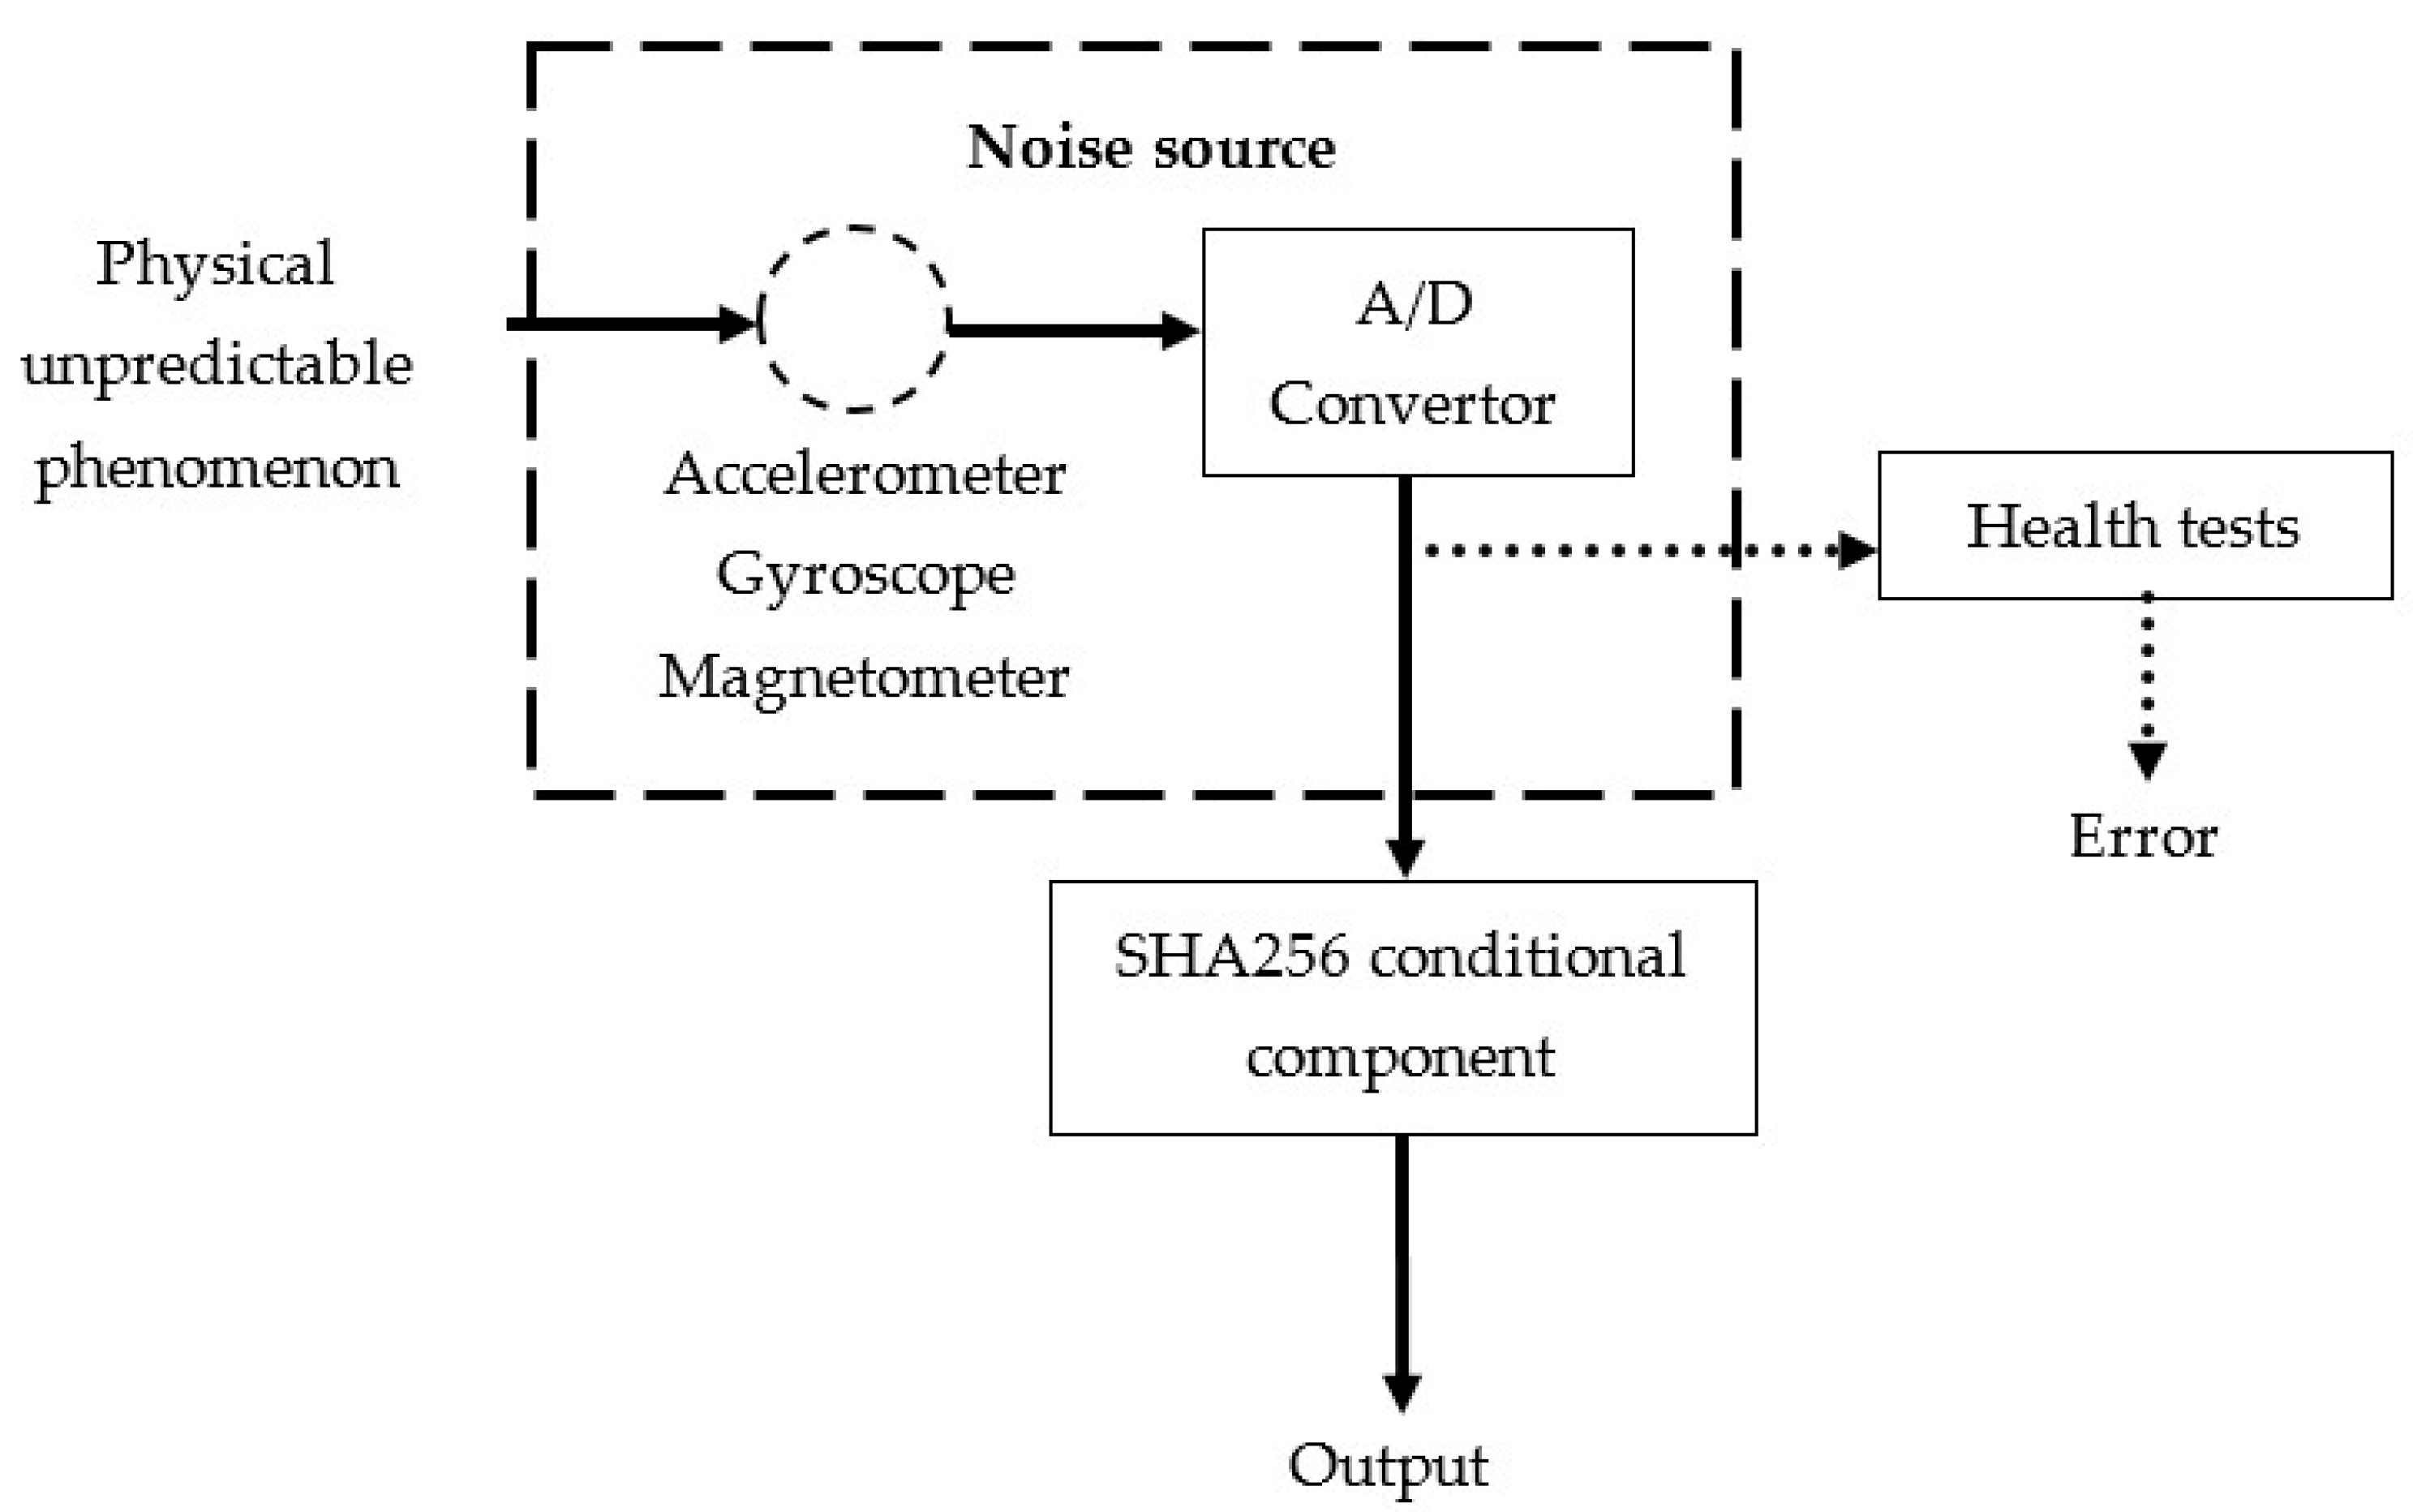
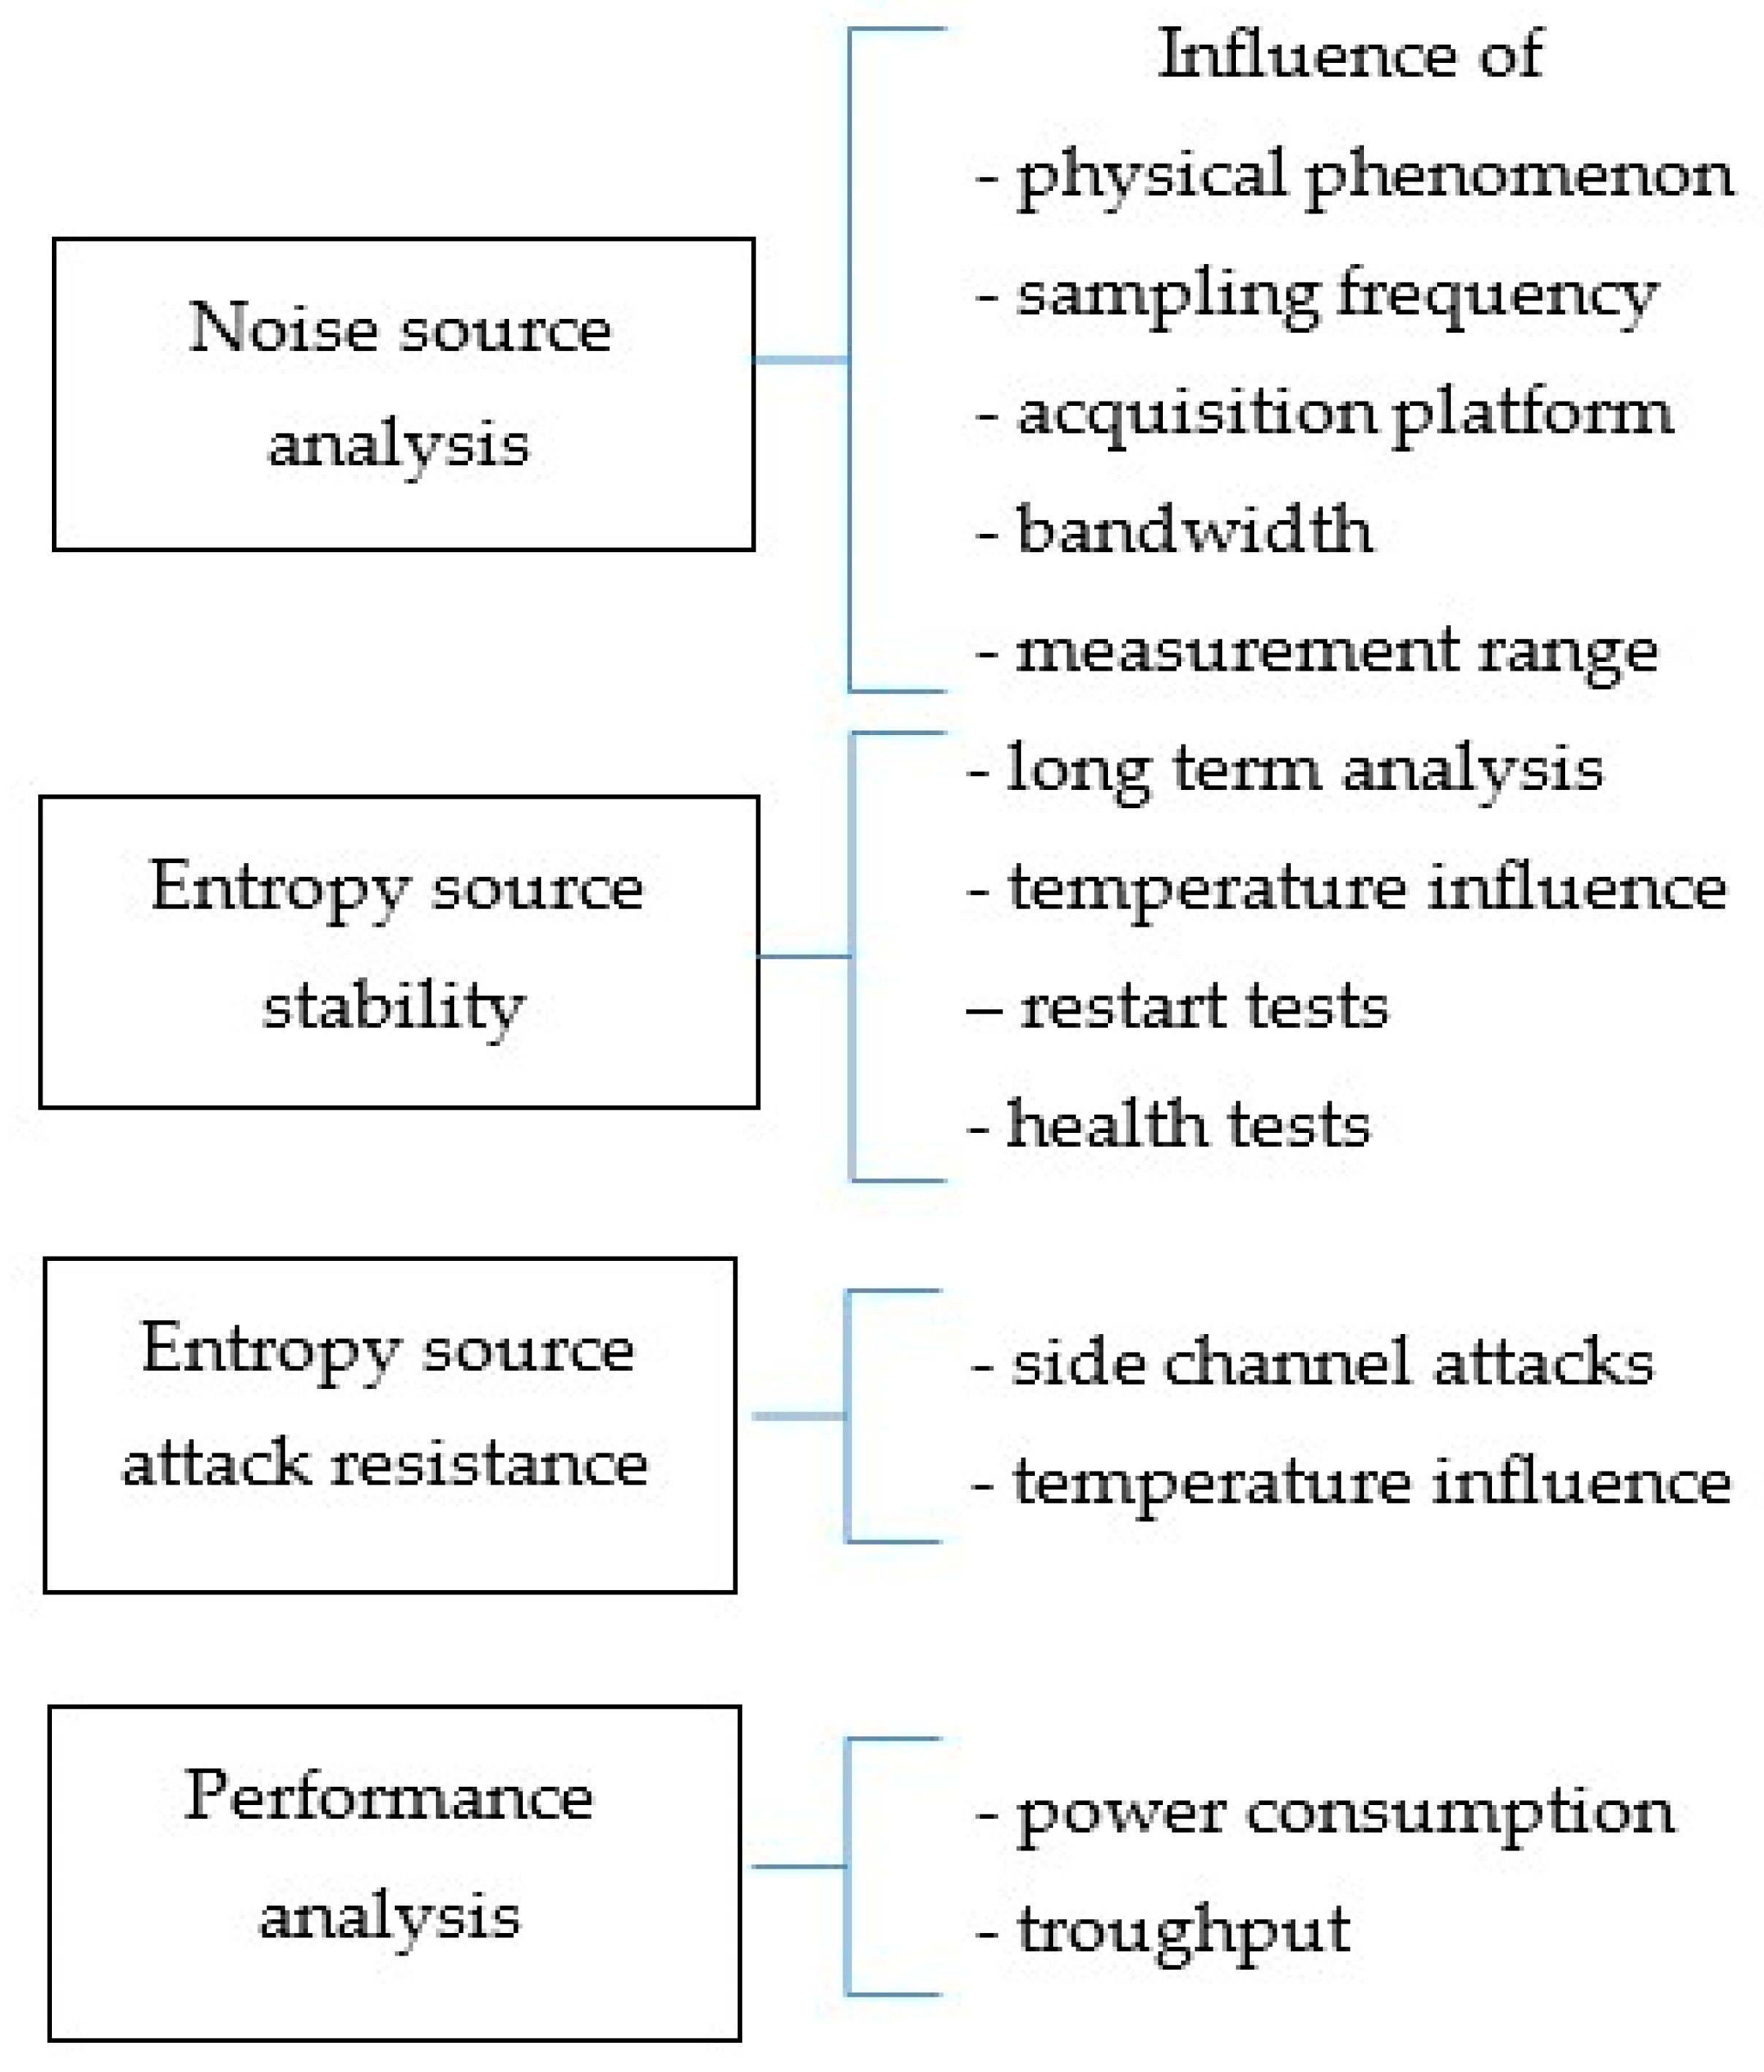
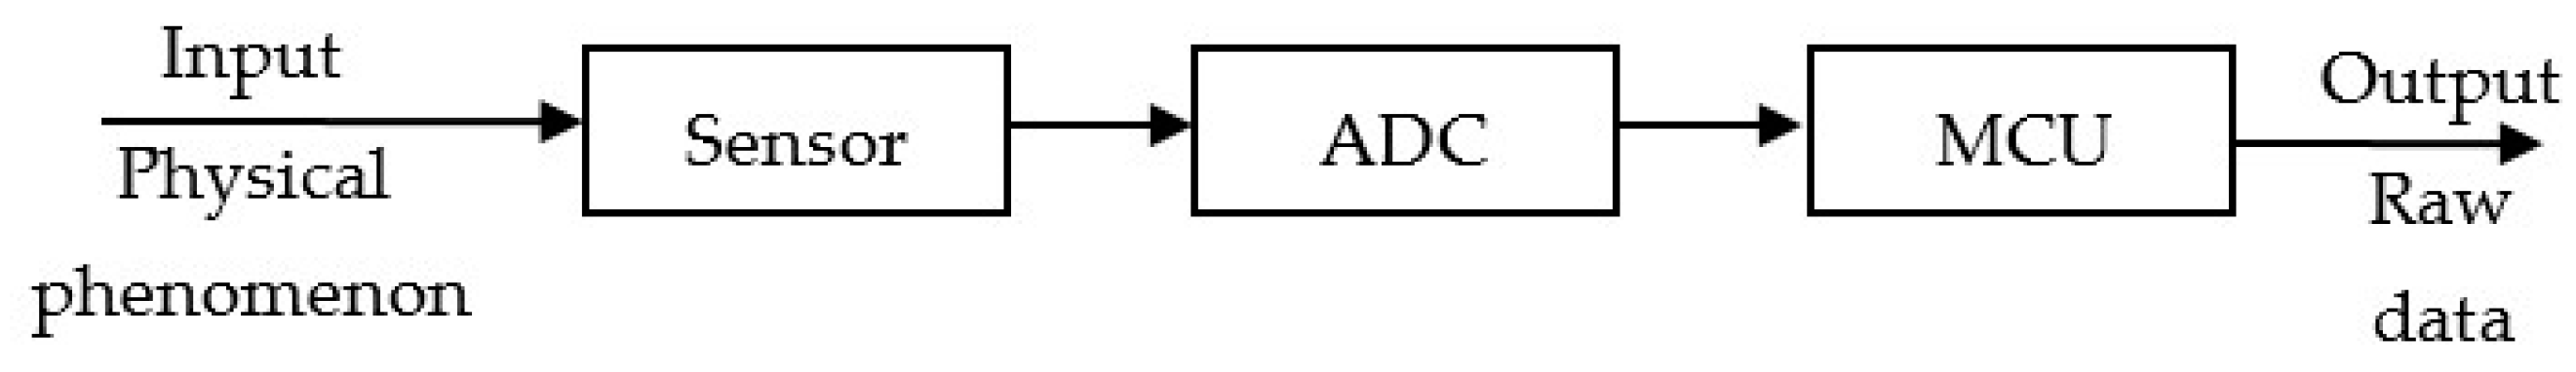
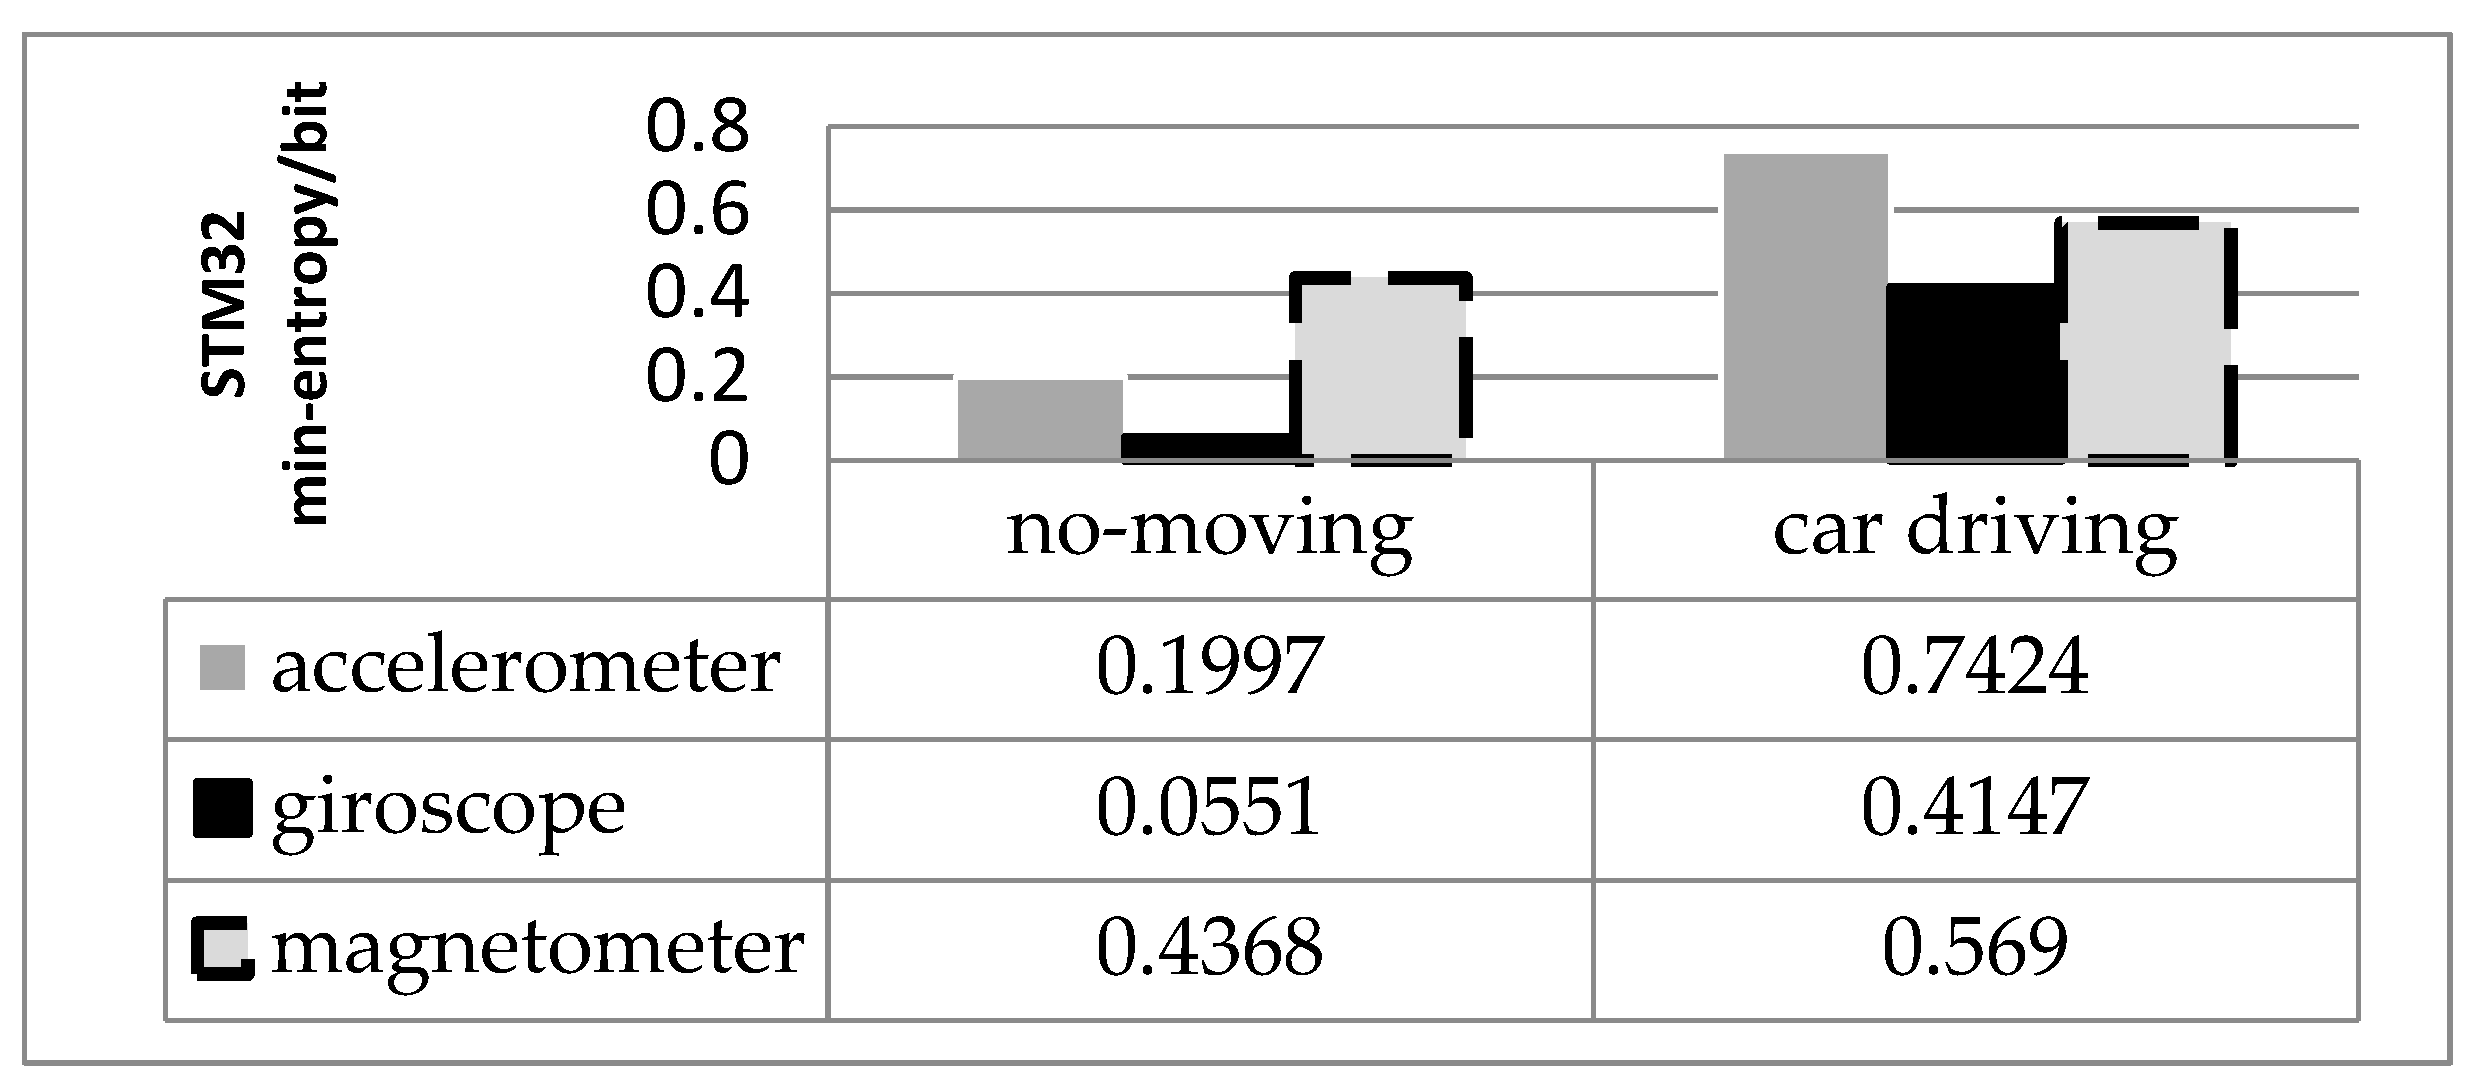
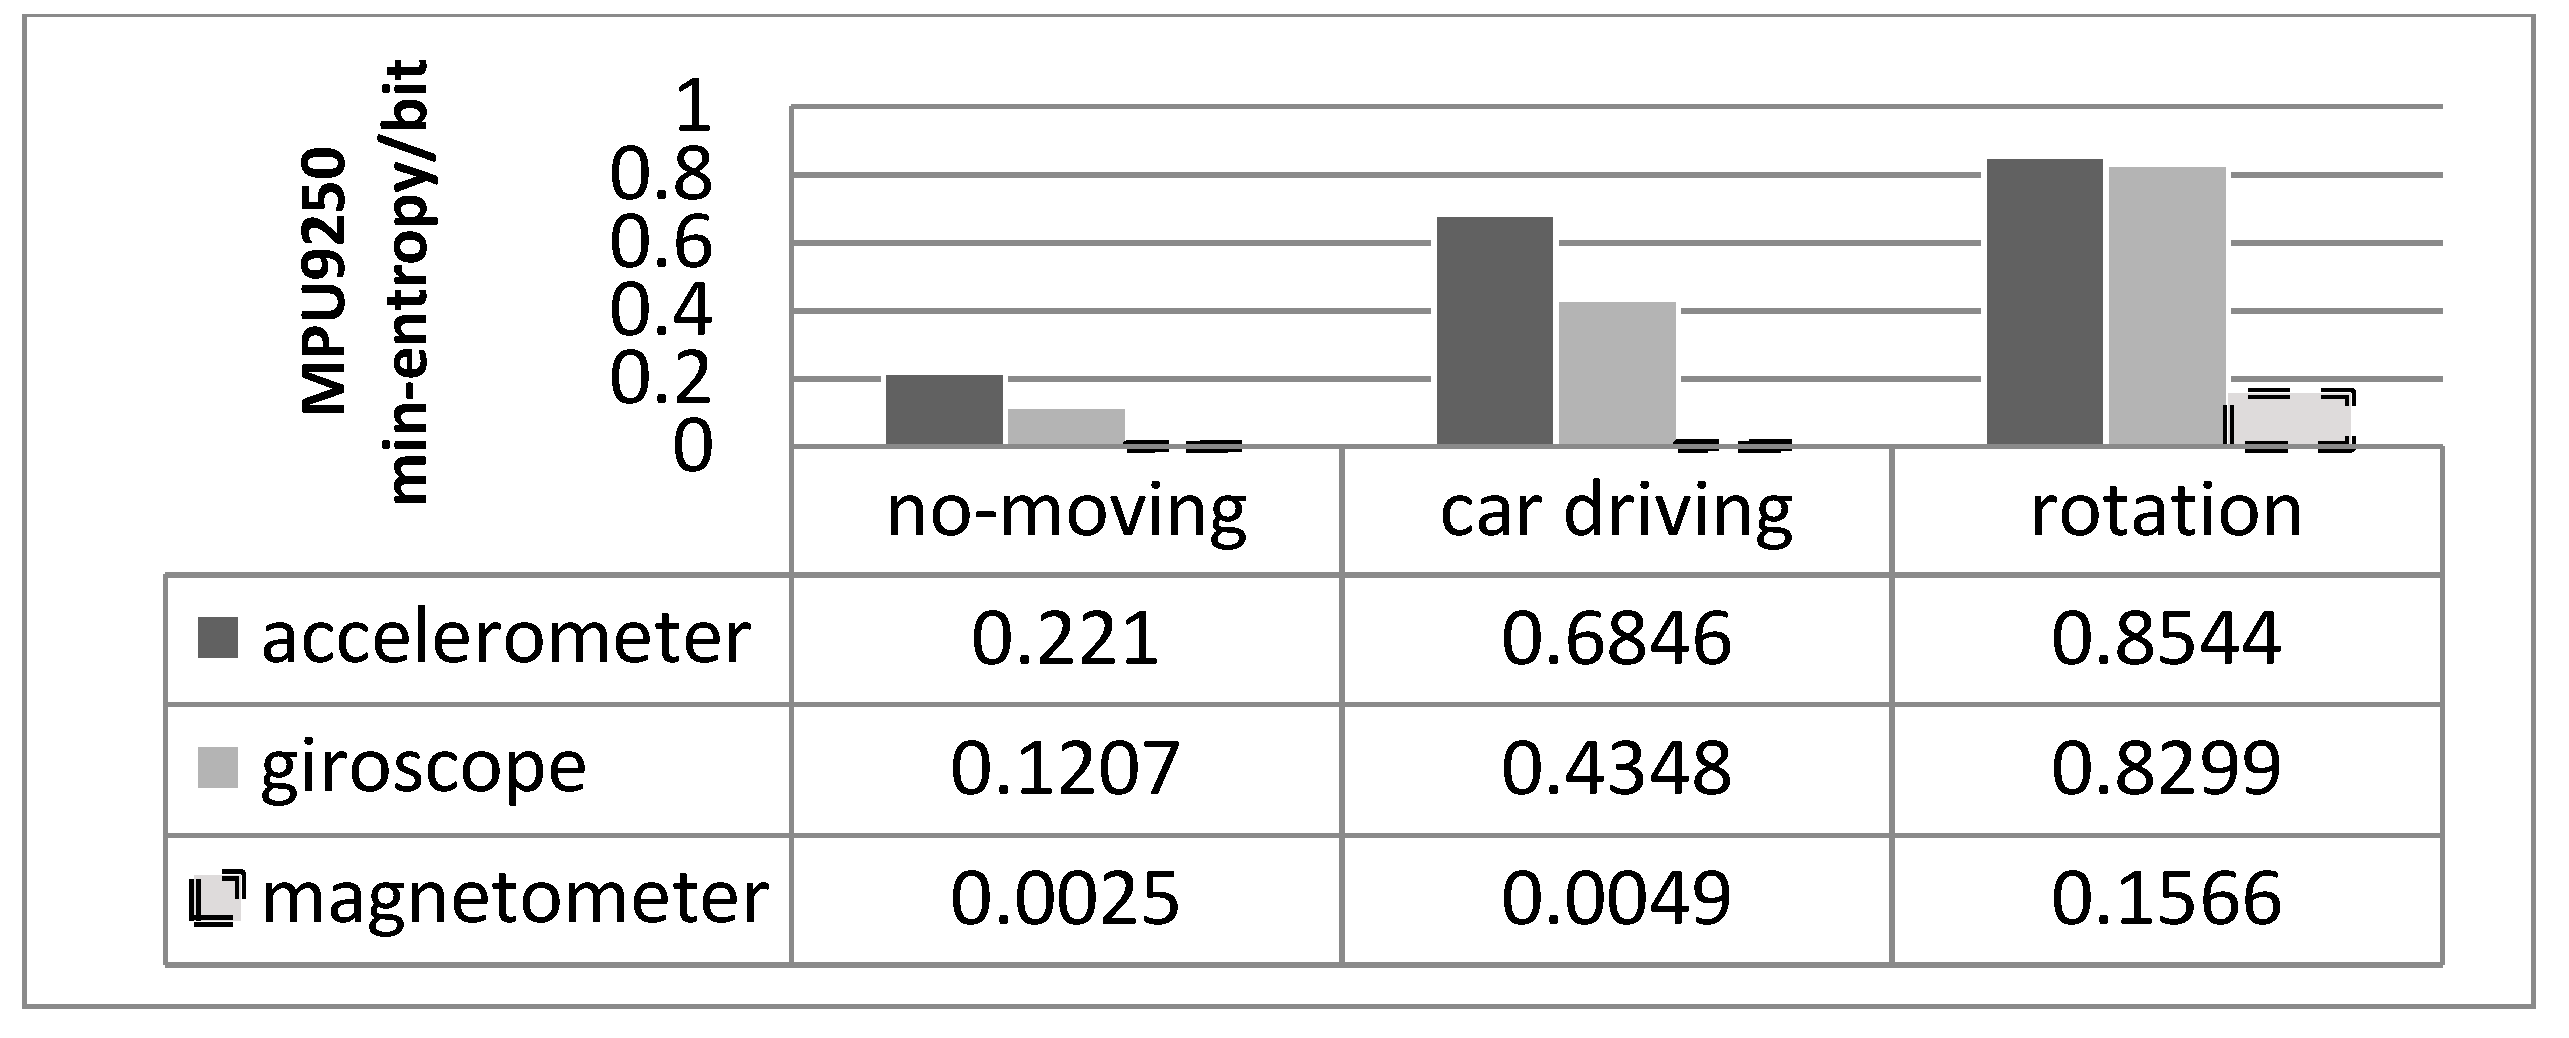
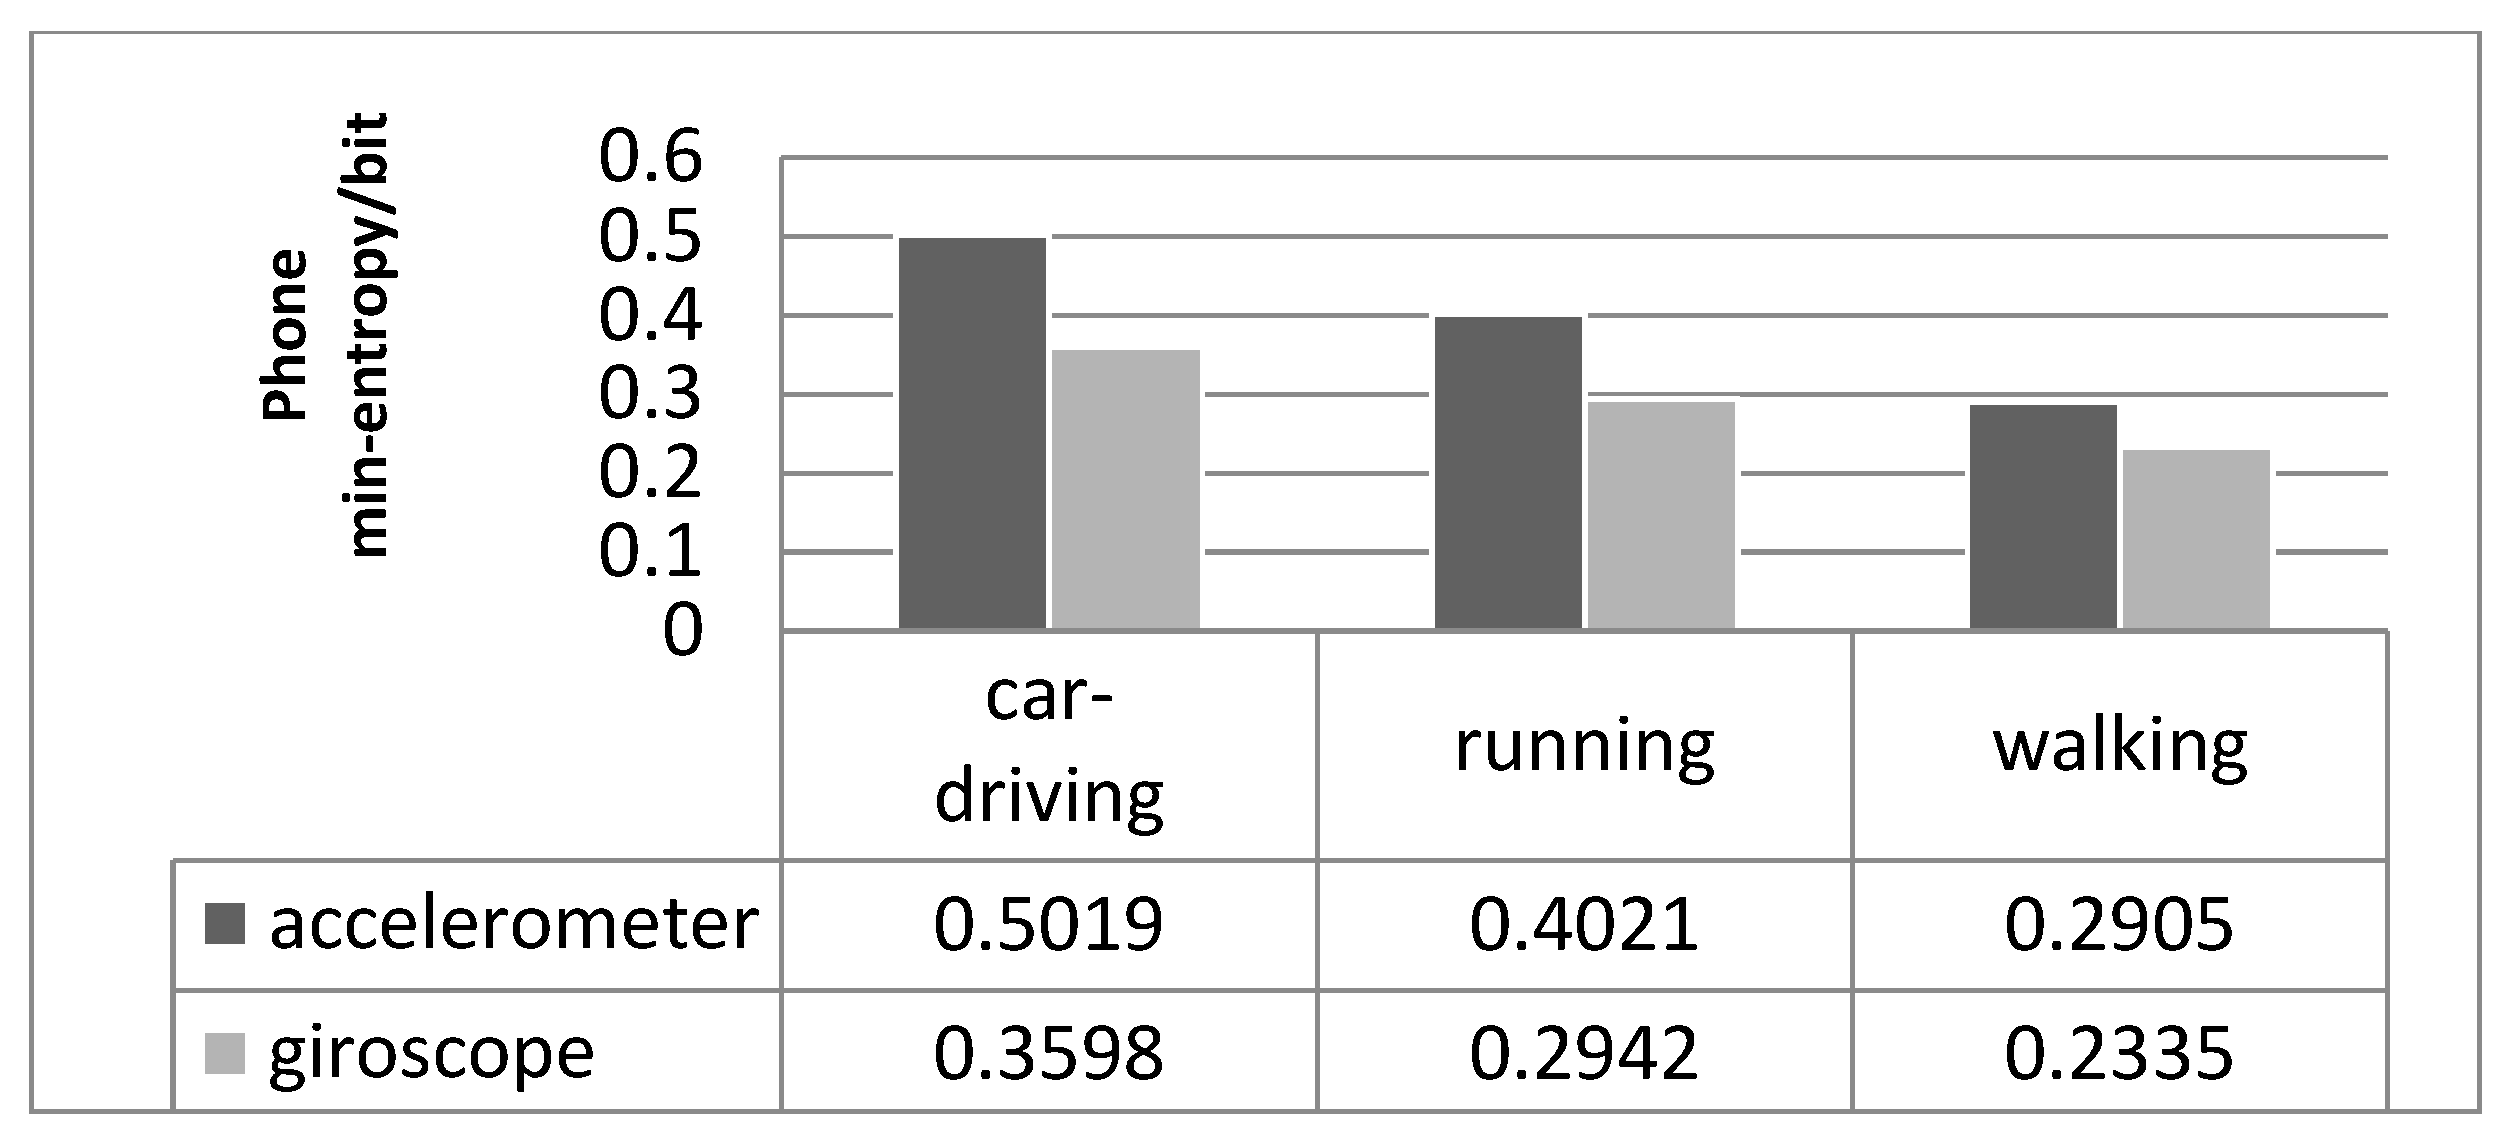
Table 1.
Randomness source analysis and validation methodologies comparison.
| Paper Analyzed | Entropy Estimation Methodology | Amount of Data | Parameters that Influence Entropy Value | Attack Resistance | Entropy Source Validation |
|---|---|---|---|---|---|
| [27] | 4 estimators | Not sufficient for all experiments | No | No | No |
| [28] | 3 estimators | Short- and long-term analysis (max 300.000 samples) | No | Theoretical analysis | Theoretical validation |
| [29] | 1 Estimator | Not sufficient for all experiments | No | No | Partial |
| [30] | No | Not mentioned | No | No | No |
| [31] | No | Good for microphone and low for GPS sensor | No | No | No |
| [32] | No | Not specified | No | No | No |
| [33] | No | 1,000,000 samples | No | No | No |
| [34] | No | N/A | No | No | No |
| [35] | No | Not sufficient (200,000 samples) | No | No | No |
| [38] | No | N/A | No | No | No |
| [39] | No | N/A | No | No | |
| Our paper | 10 estimators | 1,000,000 samples | Bandwidth Measurement Range | Side channel attack | Long term analysis Restart tests Health tests |
Table 2.
Entropy values for different values of bandwidth and measurement range.
| Accelerometer | |||
| Bandwidth\Measurement Range | 2 g | 4 g | 8 g |
| 3330 Hz | 0.6438 | 0.5133 | 0.4194 |
| 417 Hz | 0.4957 | 0.3831 | 0.3382 |
| 53 Hz | 0.3049 | 0.2549 | 0.1904 |
| Gyroscope | |||
| Bandwidth\Measurement Range | 245 dps | 500 dps | 1000 dps |
| 1250 Hz | 0.3931 | 0.4337 | 0.3356 |
| 312 Hz | 0.3401 | 0.2386 | 0.2118 |
| 22 Hz | 0.2094 | 0.1736 | 0.1083 |
| Magnetometer | |||
| Measurement Range | 4 Gauss | 8 Gauss | 12 Gauss |
| 0.4414 | 0.4137 | 0.385 | |
Table 3.
Entropy values different values of sampling frequency.
| Sampling Frequency\Bandwidth | Accelerometer |
| 6660 Hz/1666 Hz | 0.6212 |
| 3330 Hz/1666 Hz | 0.6142 |
| Sampling frequency\Bandwidth | Gyroscope |
| 6660 Hz/173 Hz | 0.2278 |
| 3330 Hz/172 Hz | 0.2414 |
Table 4.
Sensors’ entropy values using different acquisition boards.
| MPU 9250 Sensors | Accelerometer | Gyroscope | ||
|---|---|---|---|---|
| Acquisition Boards | Sensor 1 | Sensor 2 | Sensor 1 | Sensor 2 |
| Arduino Uno1 | 0.4618 | 0.4626 | 0.269 | 0.2708 |
| Arduino Uno2 | 0.4660 | 0.4618 | 0.2371 | 0.2400 |
| Arduino Uno3 | 0.4681 | 0.4671 | 0.2513 | 0.2586 |
| Atmega 256 | 0.4670 | 0.4571 | 0.2258 | 0.2387 |
Table 5.
Entropy values statistic for analyzing noise source stability.
| Accelerometer | Average | Min | Max | Standard Deviation | Number of Sequences |
| STM32 no-motion | 0.6499 | 0.6379 | 0.6638 | 0.0058 | 100 |
| STM32 car-driving | 0.8480 | 0.8076 | 0.8878 | 0.0263 | 10 |
| MPU9250 no-motion | 0.4732 | 0.4503 | 0.5086 | 0.0139 | 30 |
| Gyroscope | Average | Min | Max | Standard Deviation | Number of Sequences |
| STM32 no-motion | 0.4154 | 0.3427 | 0.4619 | 0.0222 | 100 |
| STM32 car-driving | 0.4295 | 0.3564 | 0.5132 | 0.0475 | 10 |
| MPU9250 no-motion | 0.2347 | 0.1840 | 0.2745 | 0.0287 | 30 |
| Magnetometer | Average | Min | Max | Standard Deviation | Number of Sequences |
| STM32 no-motion | 0.4411 | 0.4189 | 0.4658 | 0.0108 | 100 |
| STM32 car-driving | 0.5521 | 0.4964 | 0.597 | 0.0268 | 10 |
Table 6.
Temperature influence on entropy values.
| Temperature | Accelerometer | Gyroscope | Magnetometer |
|---|---|---|---|
| −18 °C | 0.6313 | 0.4393 | 0.4500 |
| +82 °C | 0.7596 | 0.4637 | 0.6365 |
| +23 °C | 0.6379 | 0.4153 | 0.4411 |
Table 7.
Correlation analysis using Pearson coefficient.
| Accelerometer | |||
| Measurement range-bandwidth-min-entropy | 2 g-3330 Hz-0.64 | 4 g-417 Hz-0.38 | 8 g-52 Hz-0.19 |
| NBs | 100 | 168 | 337 |
| x-axis | 0.0813 | 0.0695 | 0.0520 |
| y-axis | 0.0744 | 0.0634 | 0.0509 |
| z-axis | 0.0836 | 0.0637 | 0.0649 |
| Gyroscope | |||
| Measurement range-bandwidth-min-entropy | 500 dps-1250 Hz-0.43 | 500 dps-312 Hz-0.23 | 1000 dps-22 Hz-0.10 |
| NBs | 148 | 269 | 591 |
| x-axis | 0.0626 | 0.0582 | 0.0807 |
| y-axis | 0.0636 | 0.0607 | 0.0524 |
| z-axis | 0.0619 | 0.0593 | 0.0581 |
| Magnetometer | |||
| Measurement range min-entropy | 4 Gauss-0.44 | 8 Gauss-0.41 | 12 Gauss-0.38 |
| Nbs | 145 | 155 | 167 |
| x-axis | 0.0748 | 0.0812 | 0.0665 |
| y-axis | 0.0603 | 0.0616 | 0.0760 |
| z-axis | 0.0682 | 0.0672 | 0.0733 |
Table 8.
Correlation analysis using Hamming distance.
| Accelerometer | |||
| Measurement range-bandwidth-min-entropy | 2 g-3330 Hz-0.64 | 4 g-417 Hz-0.38 | 8 g-52 Hz-0.19 |
| x-axis | 4.05 | 4.13 | 4.98 |
| y-axis | 4.01 | 5.02 | 3.42 |
| z-axis | 3.95 | 3.99 | 3.36 |
| Deviation average | 0.03 | 0.38 | 0.73 |
| Gyroscope | |||
| Measurement range-bandwidth-min-entropy | 500 dps-1250 Hz-0.43 | 500 dps-312 Hz-0.23 | 1000 dps-22 Hz -0.10 |
| x-axis | 3.96 | 3.22 | 2.44 |
| y-axis | 3.98 | 3.39 | 2.28 |
| z-axis | 4.03 | 2.84 | 2.66 |
| Deviation average | 0.02 | 0.84 | 1.54 |
| Magnetometer | |||
| Measurement range-min-entropy | 4 Gauss-0.44 | 8 Gauss-0.41 | 12 Gauss-0.38 |
| x-axis | 4.04 | 3.74 | 5.10 |
| y-axis | 4.26 | 3.36 | 4.10 |
| z-axis | 3.90 | 3.86 | 3.77 |
| Deviation average | 0.13 | 0.34 | 0.47 |
Table 9.
Restart datasets entropy estimation.
| Sensor Type | Initial Entropy | Row Dataset Entropy | Column Dataset Entropy |
|---|---|---|---|
| Accelerometer | 0.63 | 0.90 | 0.88 |
| Gyroscope | 0.34 | 0.47 | 0.50 |
| Magnetometer | 0.41 | 0.46 | 0.43 |
Table 10.
Health tests results.
| Repetition Count Test | ||||||
|---|---|---|---|---|---|---|
| α | C | Accelerometer | C | Gyroscope | C | Magnetometer |
| 2−20 | 4 | 10 | 8 | 0 | 7 | 0 |
| 2−15 | 3 | 1075 | 6 | 2 | 5 | 10 |
| Adaptive Count Test | ||||||
| α | C | Accelerometer | C | Gyroscope | C | Magnetometer |
| 2−20 | 38 | 0 | 120 | 0 | 89 | 0 |
| 2−10 | 30 | 0 | 105 | 0 | 76 | 0 |
| 2−5 | 24 | 0 | 94 | 0 | 67 | 0 |
Table 11.
Performance and power analysis.
| Accelerometer | Gyroscope | Magnetometer | |
|---|---|---|---|
| IDD_S (mA) | 13.81 | 13.81 | 13.81 |
| IDD_MCU_S (mA) | 0.16 | 0.49 | 0.27 |
| IDD_MCU_SHA (mA) | 14.67 | 14.67 | 14.67 |
| titer (µs) | 2560 | 2560 | 1540 |
| tSHA (µs) | 160 | 160 | 160 |
| Throughput (Kb/s) | 2.88 | 1.56 | 3.12 |
| Nr_bits (Mb)-1000 mAh battery | 485.07 | 303.30 | 508.30 |
Table 12.
Entropy estimation in different cases using 10 estimators.
| Estimator | Estimated Entropy Case 1 | Estimated Entropy Case 2 | Estimated Entropy Case 3 |
|---|---|---|---|
| Most Common Value | 0.82 | 0.97 | 0.99 |
| Collision | 0.76 | 0.86 | 0.66 |
| Markov | 0.77 | 0.96 | 0.91 |
| Compression | 0.12 | 0.52 | 0.77 |
| t-Tuple | 0.19 | 0.79 | 0.89 |
| LRS | N/A | N/A | N/A |
| MultiMCW Prediction | 0.83 | 0.98 | 0.98 |
| Lag Prediction | 0.23 | 0.29 | 0.90 |
| MultiMMC Prediction | 0.10 | 0.93 | 0.90 |
| LZ78Y Prediction | 0.82 | 0.97 | 0.90 |
| Assessed entropy | 0.10 | 0.29 | 0.66 |
Publisher’s Note: MDPI stays neutral with regard to jurisdictional claims in published maps and institutional affiliations. |
© 2021 by the authors. Licensee MDPI, Basel, Switzerland. This article is an open access article distributed under the terms and conditions of the Creative Commons Attribution (CC BY) license (https://creativecommons.org/licenses/by/4.0/).
Share and Cite
MDPI and ACS Style
Răstoceanu, F.; Rughiniș, R.; Ciocîrlan, Ș.-D.; Enache, M. Sensor-Based Entropy Source Analysis and Validation for Use in IoT Environments. Electronics 2021, 10, 1173. https://doi.org/10.3390/electronics10101173
AMA Style
Răstoceanu F, Rughiniș R, Ciocîrlan Ș-D, Enache M. Sensor-Based Entropy Source Analysis and Validation for Use in IoT Environments. Electronics. 2021; 10(10):1173. https://doi.org/10.3390/electronics10101173
Chicago/Turabian StyleRăstoceanu, Florin, Răzvan Rughiniș, Ștefan-Dan Ciocîrlan, and Mihai Enache. 2021. "Sensor-Based Entropy Source Analysis and Validation for Use in IoT Environments" Electronics 10, no. 10: 1173. https://doi.org/10.3390/electronics10101173
Note that from the first issue of 2016, this journal uses article numbers instead of page numbers. See further details here.