
The Impact of the COVID-19 Pandemic on Teaching Mathematics and Students’ Knowledge, Skills, and Grades


1
Faculty of Mining, Ecology, Process Control and Geotechnologies, Technical University of Košice, 042 00 Košice, Slovakia
2
Institute of Mathematics, P.J. Šafárik University in Košice, 040 01 Košice, Slovakia
*
Author to whom correspondence should be addressed.
Educ. Sci. 2021, 11(5), 225; https://doi.org/10.3390/educsci11050225
Submission received: 31 March 2021
/
Revised: 26 April 2021
/
Accepted: 30 April 2021
/
Published: 10 May 2021
(This article belongs to the Special Issue Online and Distance Learning during Lockdown Times: COVID-19 Stories)
Abstract
:As a consequence of the COVID-19 pandemic and measures to secure public health, many processes have moved to the online space. The educational process is not an exception. Our main goal, which is presented in this article, was to re-design the educational process from face-to-face to distance learning in the Mathematics 1 course at the Technical University of Košice. This article describes our approach to teaching, observations, and experience. This case study examines three factors: Firstly, the impact of distance education on overall assessments of students. Using descriptive statistics, the results of student evaluations were compared from the overall assessments for the last six academic years. It was found that distance learning does not affect excellent students and eliminates the number of students who do not pass. Secondly, the participation of students during online lessons, and thirdly, the use of electronic materials. The questionnaire survey and the data from the learning management system Moodle were used to examine the second and third factors. Descriptive statistics were used to describe the questionnaire survey data (frequencies, percentages and averages). An exploratory factor analysis was performed in order to assess the underlying key concepts regarding student evaluation of the teaching process. The exploratory factor analysis confirmed that this questionnaire followed the four key concepts.
1. Introduction
With the entry of a new generation of students (Generation Z) to the school environment, the need arose to create online materials to support teaching. With the arrival of rapid digitalization in the school environment, several questions have arisen associated with the manner and suitability of the technologies and tools used. The impact of these changes on pupils and students is further examined.
To enhance an otherwise dull rewrite of textbook content into a digital representation, animations can be a great way to light up the digital material. Numerous studies at various education levels have shown that introducing animations into study materials effectively explains the presented topics and captures learners’ attention [1,2,3]. However, can they make a difference in the realm of university-level mathematics? Azman et al. [4] investigated the use of 2D and 3D animations created in Computer Algebra Software (CAS) for explaining the continuity of 2D functions and Taylor polynomials in 3D. They concluded that it can effectively relay the message of the presentation and demonstrate crucial concepts that cannot be otherwise explained by text or graphics. Recently, the prevalent nature of dynamic content on the web has inspired mathematics educators to experiment with JavaScript and its powerful visualization libraries such as GeoGebra. On the topic of Taylor polynomials, Lindner [5] created an interactive explanation embedding GeoGebra’s JavaScript reactive element within a HTML website.
Most students agree that using software as an aid in the learning process is impacting them positively [6]. Nowadays, successful engineers cannot be without computational skills, which they acquire from solving problems in computational software. An example of such software for conveniently expressing, analyzing, modeling, and solving problems is MATLAB, which has been implemented into mathematics courses at many universities [6,7,8,9,10,11,12,13].
1.1. Redesign of The Mathematics Course
Mathematics is a systematic scientific discipline, and this systematic nature is the basis for education. Its content is integrated into the educational process from kindergarten to university. The mathematics curriculum is adapted to the specific focus of schools (high school and university). Mathematics courses are included among the compulsory subjects, the teaching of which is usually realized in the first semester of a bachelors’ study at a technical university. The mission of education is to develop the correct mathematical language, which is then used for problem solving in specialized subjects. This is the basic goal, which is adopted in every part of the educational process, whereas the emphasis is on the correct idea of mathematical concepts, objects, and the relationships between them.
1.1.1. Process of Distance Education
Significance has been attached to the overelaborate and complex nature of online materials using several types of ICT, even more so during distance education.
In order to re-design Mathematics 1 course for distance education, it was necessary to choose a practical Learning Management System (LMS), which provides integration with other standard university information systems (in our case, the MAIS system).
The LMS system Moodle was chosen for distance education in the present Mathematics 1 course. Moodle (Modular Object-Oriented Dynamic Learning Environment) is an open-source online learning management system created by Martin Dougiamas in 2002 [14]. It is used in a wide range of schools and educational institutions across the world. This learning platform has a wide range of features for teachers and students. Moodle provides a modern, easy-to-use interface for teaching materials, collaborative tools, and online activities; convenient file management; notifications; and administrative features [14]. Students have access to course learning materials, tests for continuous automated assessment, forums, lessons, quizzes, and wikis; they can upload their work, track grades, and much more [14].
Online study materials were available for students throughout the semester on the Moodle system. New online materials were added to the topic every week, including the following:
- Video lectures;
- MATLAB video tutorials;
- MATLAB Live Scripts;
- Online collection of solved examples;
- Visualizations of examples:
- ○
- Animation of solving examples in LaTeX;
- ○
- Presentations with solutions of examples in the JavaScript.
Considering the specifics of teaching mathematics, the existence of online materials alone is not sufficient. We agree with the opinion published in [15] that teaching mathematics is a dynamic and creative process that requires the physical presence of students in a lecture hall for instantaneous fine-tuning of the development of a lecture according to the reaction of the students. This missing interaction can manifest itself, for example, in the incorrect understanding of individual concepts and a subsequent inaccurate or incomplete solution to problems on the mathematical basis. Without the teacher–student interaction, these misconceptions would only be diagnosed during the evaluation of students.
Therefore, the teacher–student interaction was maintained and realized in the form of regular online meetings by using the following communication system:
- Online lectures (two lessons with all students enrolled in the course);
- Online exercises (three teaching hours for students divided into groups based on the group’s study focus; maximum 40 students present in the group).
The communication system from the teaching point of view had to satisfy the following requirements:
- User-friendly design.
- High number of invited participants in one video call (approx. 300 participants).
- Multi-platform solution.
- Possibility of fully functional video conferencing on several devices (PC, tablets, smartphone—from the point of view of guests and participants).
- Possibility to create a schedule of online meetings for a prolonged period (13 weeks) with the possibility of automatic reminders.
- Possibility to share a desktop computer and tablet for host and participants.
- Possibility to use a blackboard with handwritten notes.
- Possibility to record part of the lesson, only available to the host.
- Possibility to export the list of participants after the end of a lecture.
- Possibility of creating groups (approx. 40 participants) and sharing documents before the online lecture.
At present, there are a lot of different video conferencing systems. The Technical University of Košice purchased a license for two communication systems: MS Teams and Cisco WebEx Meetings. Considering the requirements described earlier, the Cisco WebEx Meetings software was chosen. This system meets all of our requirements for education, and its added value is security. Hence, it is used frequently in business.
1.1.2. Evaluation of Distance Education
Continuous tests are a diagnostic tool to verify gained mathematical knowledge at the first and second levels of understanding. Continuous and final tests were realized in the LMS system Moodle after student registration in the system using the unique login and password of the student. The tests were generated based on key concepts from prepared tasks. Therefore, each student had a different, individual series of tasks. Students of same group had the tests available at a prearranged time, usually before the exercise.
After the end of the semester’s teaching part, a final student evaluation was performed by means of a final test. This test consisted of tasks where answers had to be created.
A unique test was generated for each student from the task bank based on the teacher’s predefined requirements. After calculating the task, the students wrote their answers in the online test and attached a photo of a handwritten solution to each task.
Finally, the test closed automatically in the system after a set time limit of 120 min.
If the students completed the tasks earlier, they had the option to close the test from their profile and then log out of the system.
Creation of online study materials for the Mathematics 1 course began in 2008 and experienced accelerated development in the years 2014 to 2019. These materials were reworked, thematically expanded, and improved with the arrival of modern technologies. With the onset of the COVID-19 pandemic and the request to change the teaching method from face-to-face to distance learning, we were prepared from the point of view of the quantity and quality of online materials and the technological and technical equipment for immediate transfer to an online space.
1.2. Computational Software and Online Study Materials
In addition to computational software that is used for practicing what students have learnt, the theoretical fundamentals for mathematics courses in the times of online distance learning are often presented in static documents published on the web in PDF format or static HTML websites. They provide a classic, written, non-dynamic form of presenting the information. However, in many higher-level mathematical courses, students are expected to know how to manipulate and work with higher-dimensional objects and concepts. Therefore, anything that helps with better presenting these concepts than in a static, two-dimensional form, often hiding or not communicating clearly enough the dimensionality of the problem at hand, is of great benefit for the learner. A better understanding can be built by implementing better visualization methods into study materials. Visualization supports the learning and understanding of concepts when analyzing and solving problems. It can improve or even replace some verbal explanations [13]. Integrating visualization into static documents is a substantial enhancement, but the non-dynamicity of the medium is a big limiting factor. Therefore, for the creation of online study materials used in online distance learning, beside the classic approach of creating materials with static content, we explored three additional approaches for transforming static documents into interactive and dynamic ones, while using gained degrees of freedom to design a rich learning environment.
The digital study materials that we implemented can be divided into the following categories:
- Materials with static content;
- Materials with static animations;
- Materials with dynamic, reactive elements;
- Editable materials with editable code.
To be more specific, they are (1) solved problem sets distributed on an online blogging platform, (2) authoring documents with static animated elements in LaTeX, (3) reactive documents with JavaScript, and (4) Live Scripts with MATLAB Live Editor.
1.2.1. Materials with Static Content
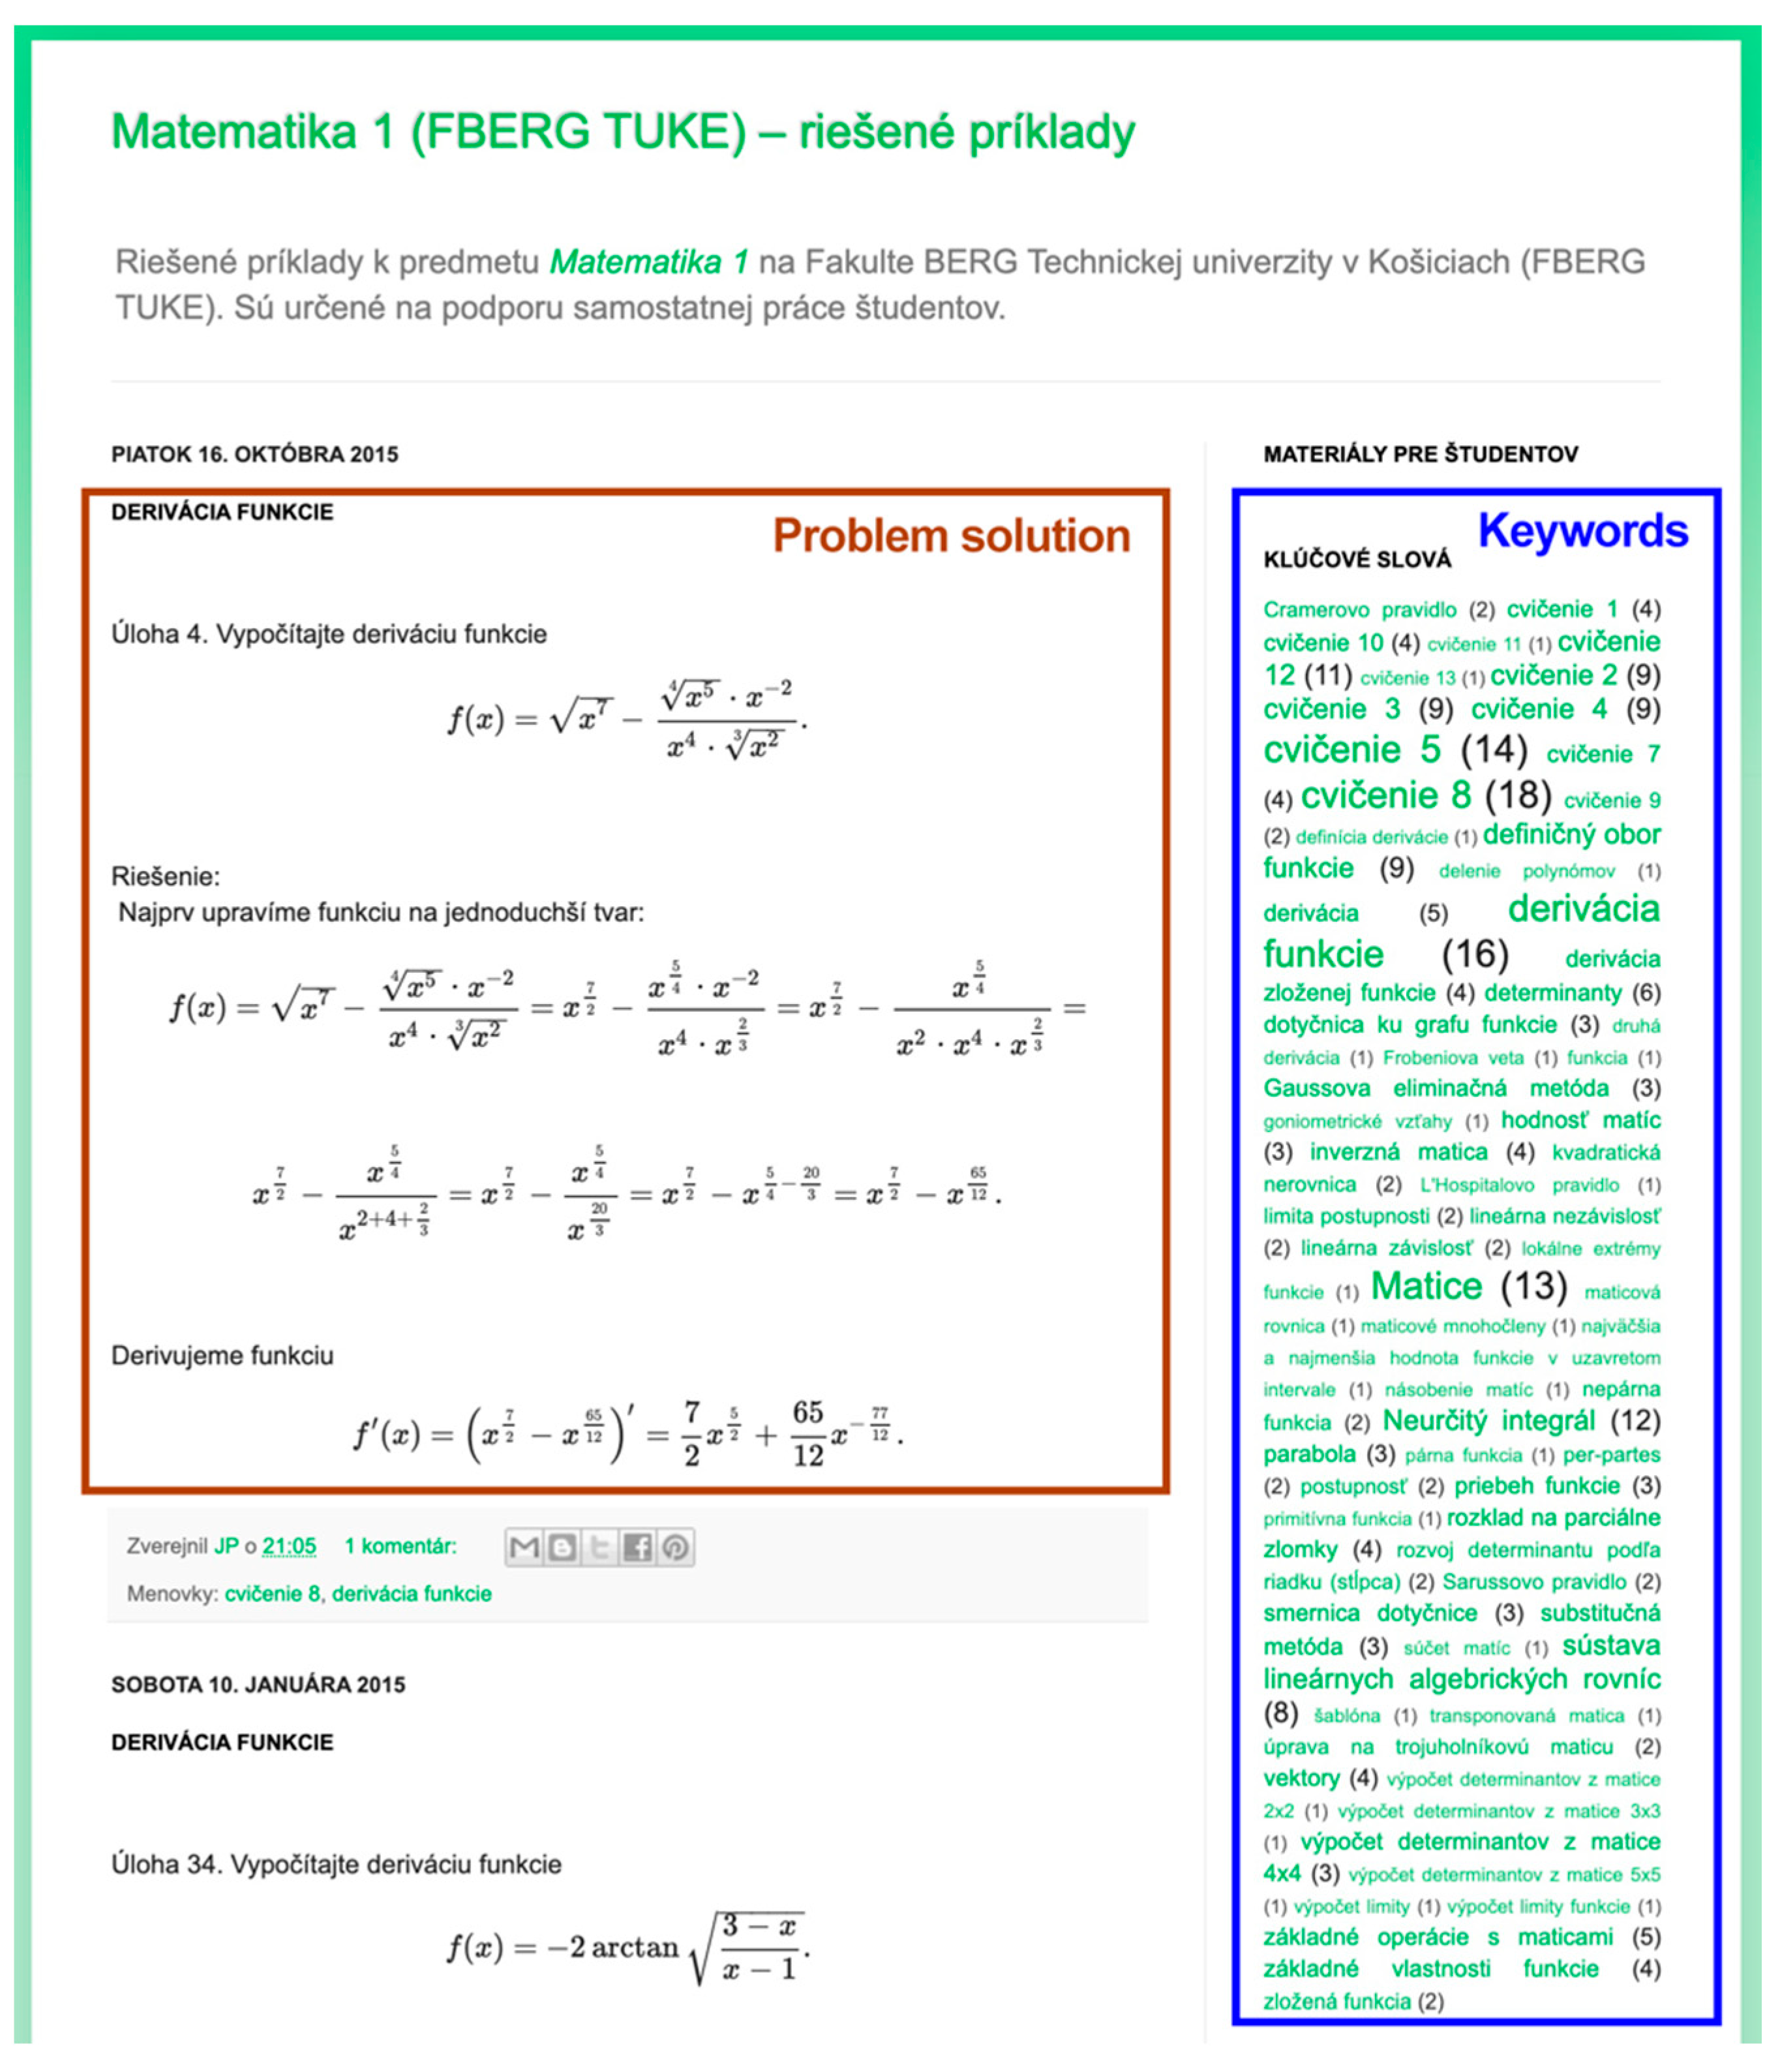
Blogger is a free Google service for creating blogs [16] that supports multiple languages. It offers free web hosting with easy administration and integrates MathJax [16].
Therefore, Blogger was a perfect candidate for creating online material with static content for the Mathematics 1 course (Figure 1) [17].
The blog contains examples with detailed comments and references to the basic properties and definitions needed for the successful solution of mathematical problems. The examples are solved by the most used methods because our goal was to demonstrate different approaches that lead to the correct solution. The selected tasks correspond to the lectured themes and are sorted by keywords acquired in the course.
1.2.2. Materials with Static Animations
In materials with static animations, an element is animated from one state to another automatically. The user can stop it and control the evolution manually (forward or backward in time). They are different from dynamic animations in that the latter are typically triggered by some event or user interaction.
One of the technologies for authoring such materials is LaTeX. It is free software created by Leslie Lamport in 1985 as a document preparation system for high-quality typesetting [18]. LaTeX is popular in academic communities, mainly for writing scientific papers, as the low-level TeX language developed by Donald Knuth, on which LaTeX is built, was written with an emphasis on the precise presentation of mathematical formulas. Many of its commands, macros, and packages for typesetting and embedding images, multimedia, tables, etc., provide the ground for producing several types of documents (articles, presentations, journals, books, etc.). Raw LaTeX source is usually compiled into Portable Document Format—PDF.
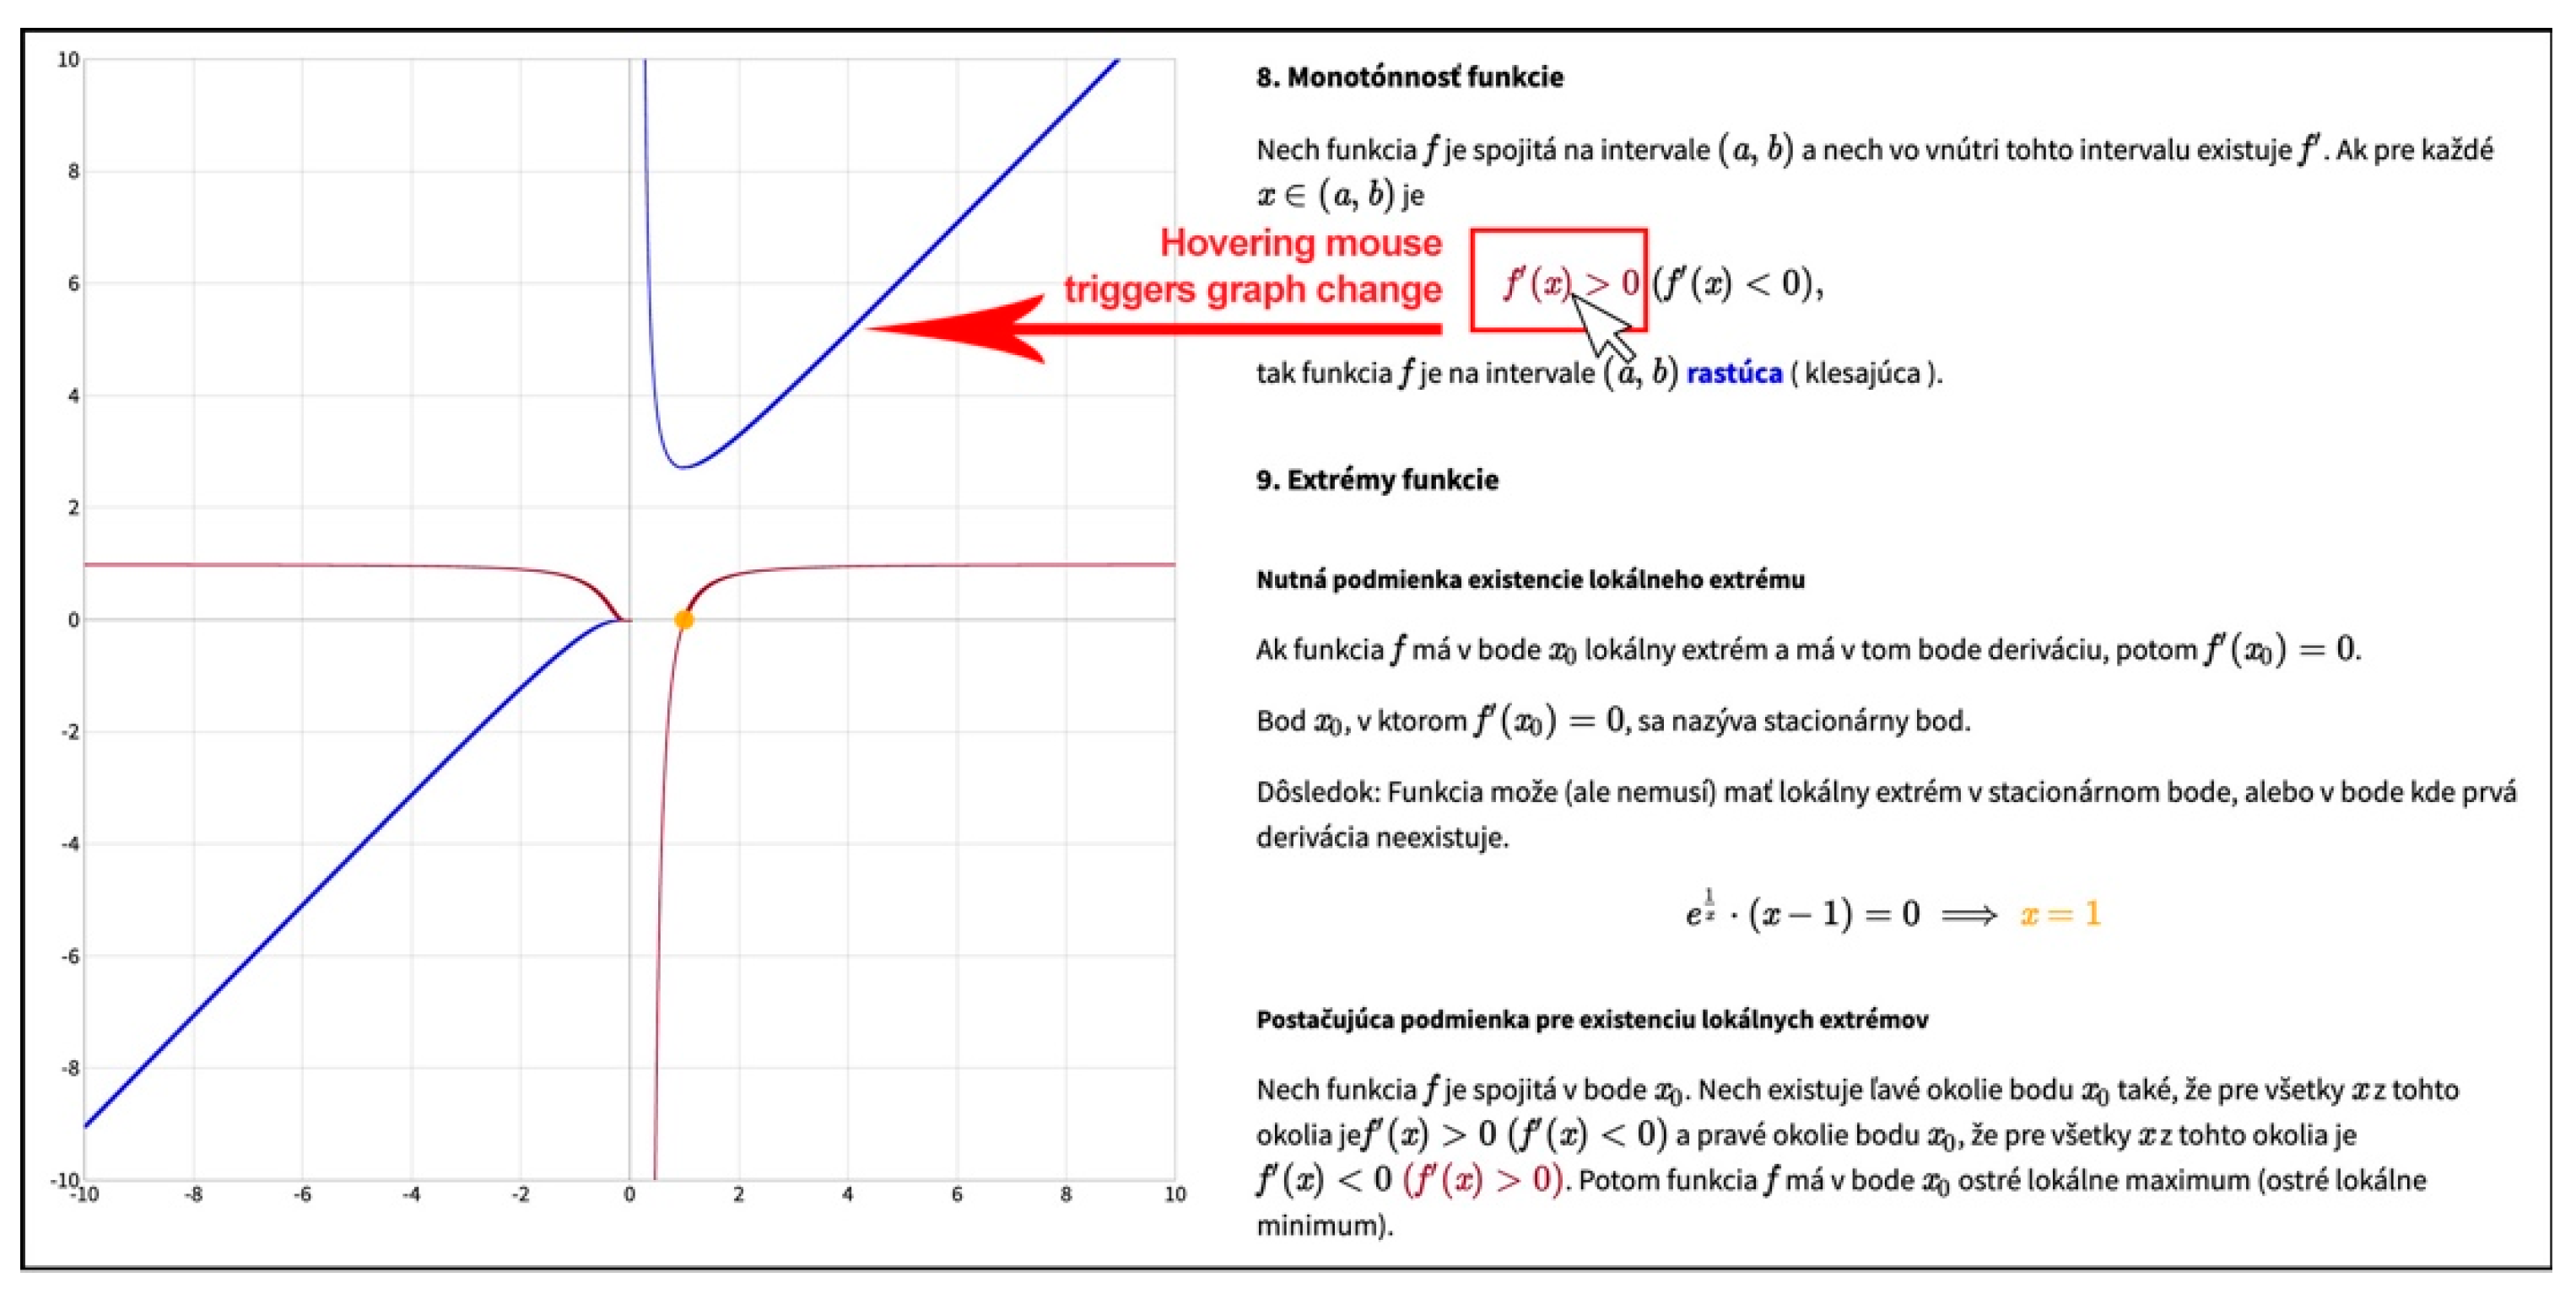
To enrich static PDF files with animated elements, it is possible to leverage the Animate package. Under the hood, it uses JavaScript to drive presentation-style animations created from sets of vector or raster graphics, embedding them together into compiled documents [19]. Graphical representations that are used for animations can be created with the PGF/TikZ package, which is a language for creating graphics in LaTeX [20] (Figure 2).
1.2.3. Materials with Dynamic, Reactive Elements
With the help of JavaScript, a scripting language used for developing dynamic elements inside HTML documents, it is possible to create engaging and visually appealing online materials. When the document is loaded as a page in a web browser, it creates a Document Object Model (DOM) from that page, which can be viewed as a tree of objects describing all of the page’s HTML elements [21]. JavaScript provides an API for manipulating an otherwise static representation of a DOM and allows for changing its parts on the fly.
This dynamic behavior can be exploited in various ways, including drawing graphical representations of mathematical concepts. These can be static but also fully dynamic, animated automatically, or interactive with user input. Specifically, for creating mathematical visualizations and animations, the JavaScript ecosystem has many libraries available. WebGL (Web Graphics Library) [22], math.js, and MathBox.js [23] are widely used. For 3D visualizations, there is the Three.js library that is built on top of WebGL [24].
When designing online materials (Figure 3), we took advantage of the dynamic behavior of JavaScript reactive elements to show an immediate connection between the mathematical language and the visual representation of solved problems. Mouse interactions with mathematics content written with LaTeX triggers a change in various parts of the web page, mainly emphasizing the graph parts by changing their color or thickness. This way, students gain a better understanding of the underlying mathematics.
1.2.4. Editable Materials with Editable Code
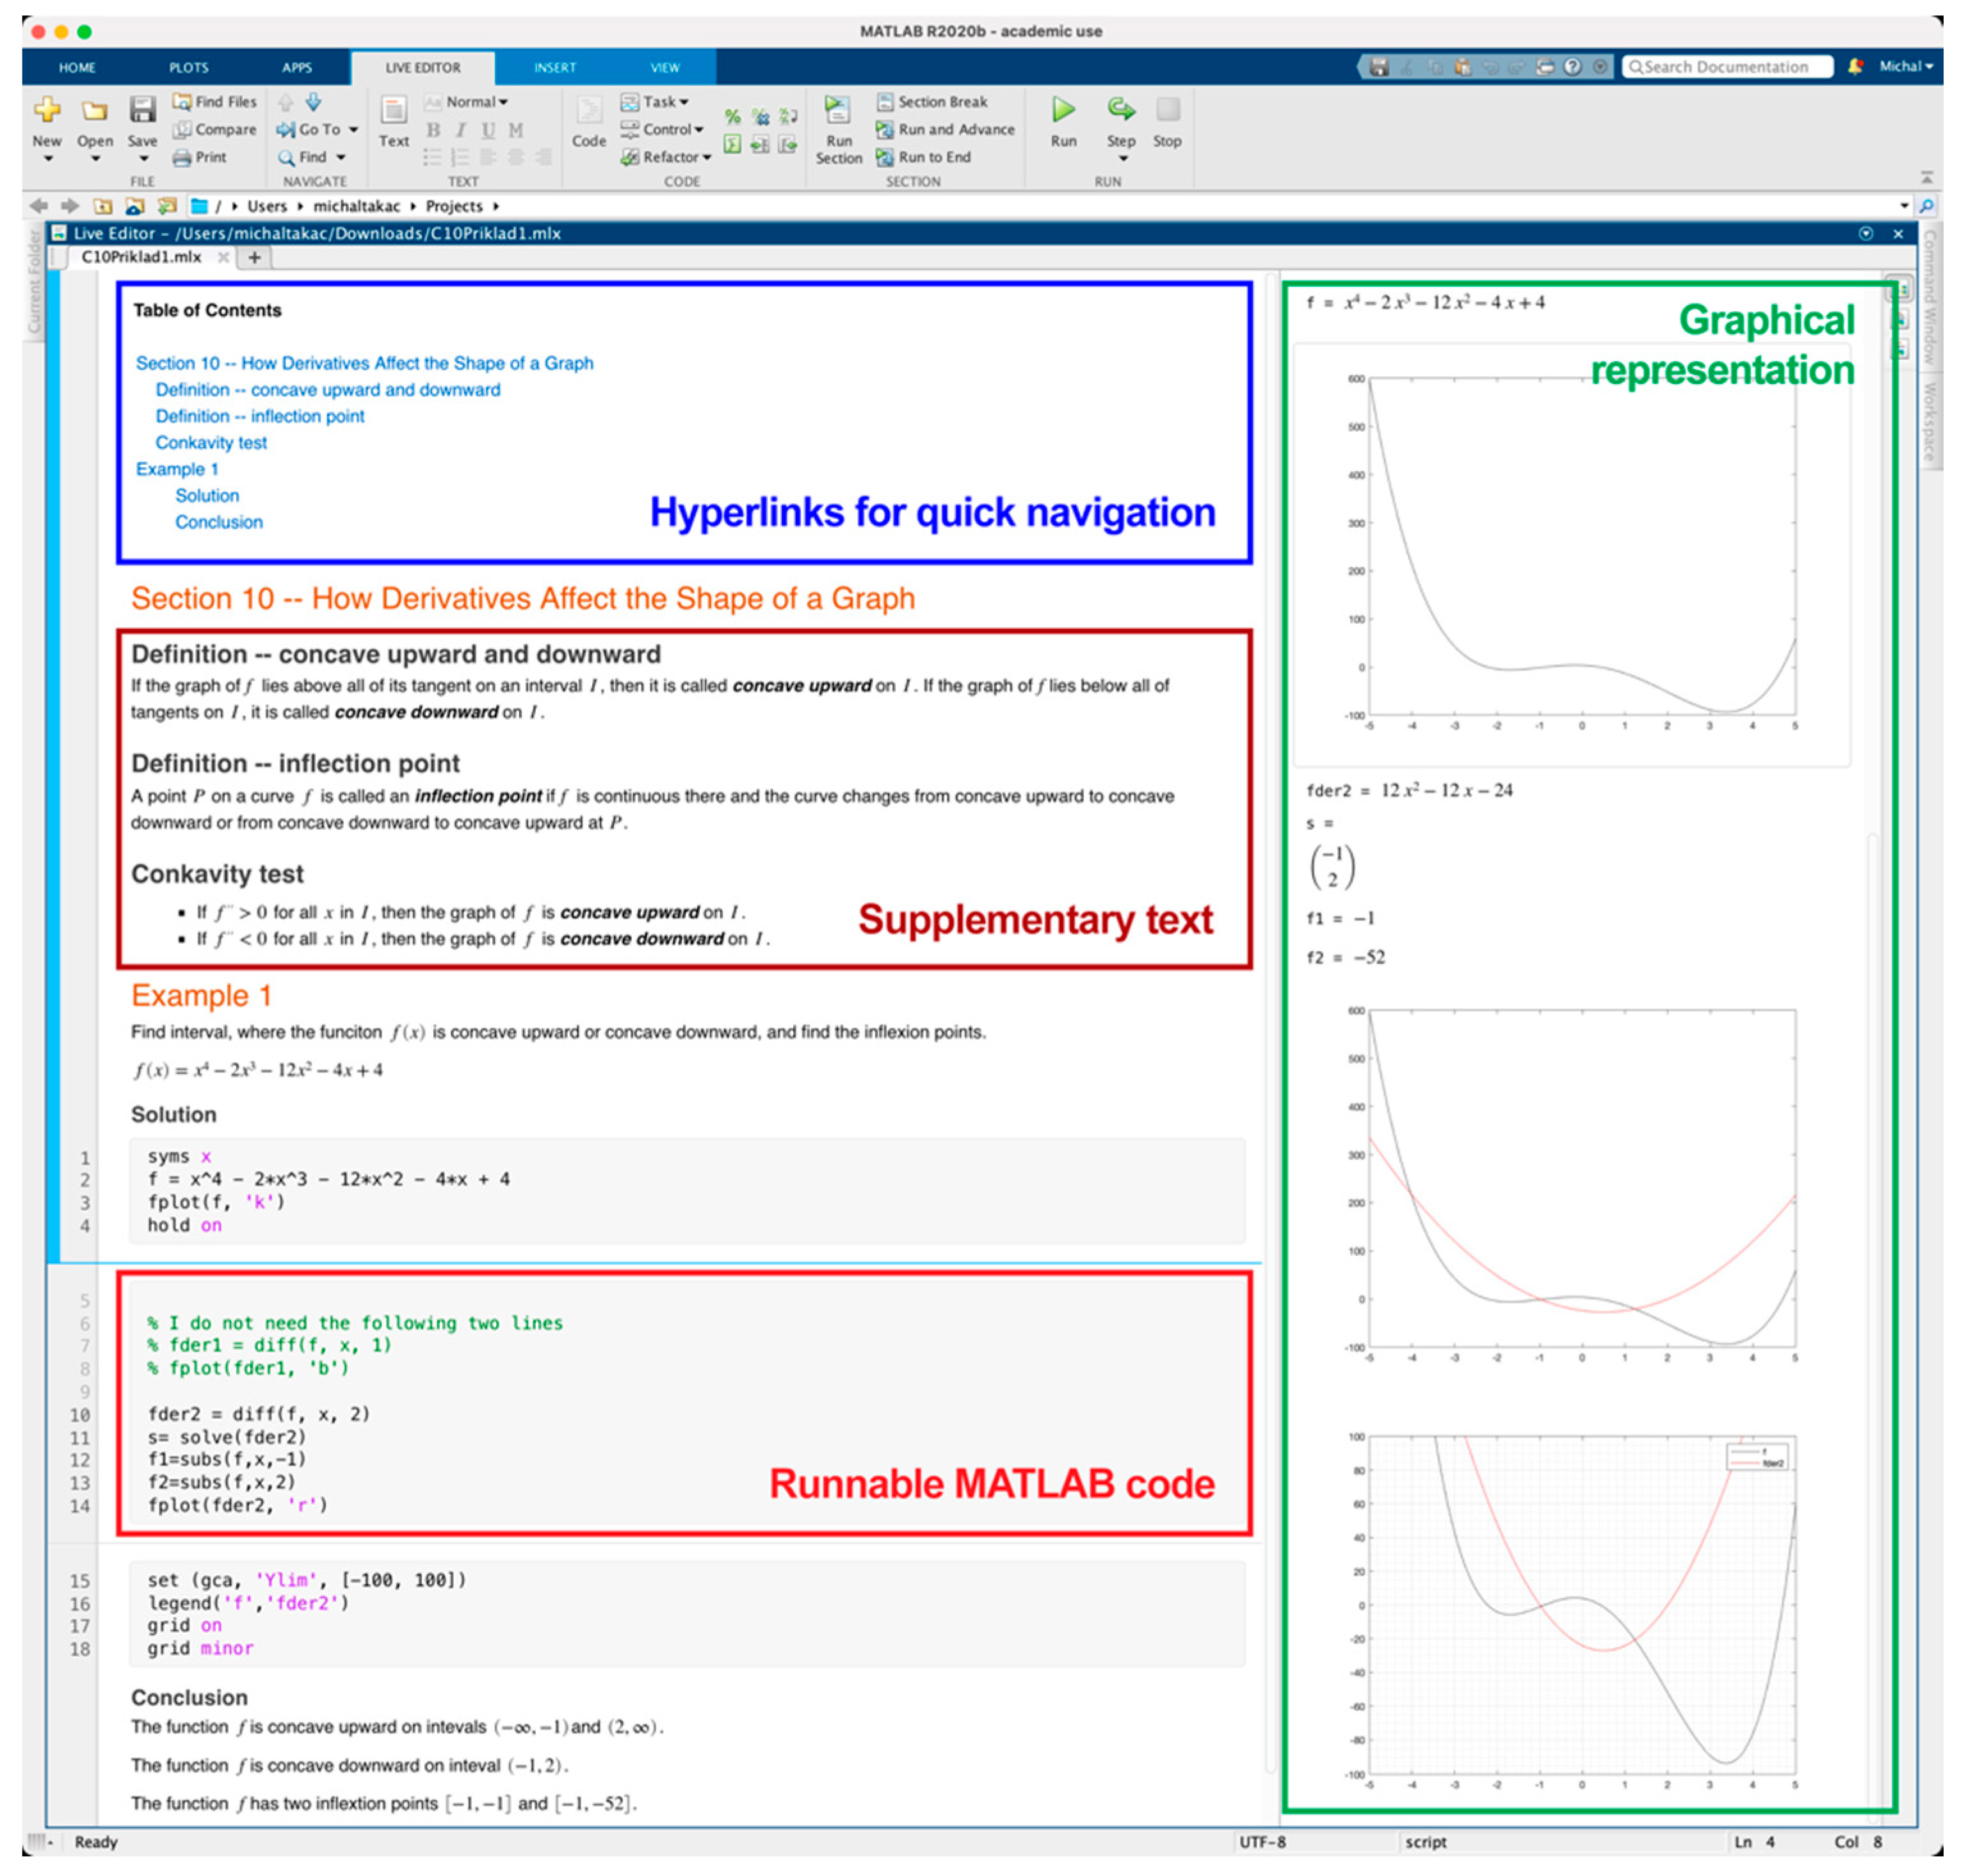
Interactive learning material is important to support students to actively engage with the learning material. MATLAB Live Editor is a feature introduced in version R2016a. It provides an interactive environment in the form of interactive documents resembling Jupyter notebooks, which are often used by data analysis practitioners. Live Scripts combine MATLAB code with formatted text, equations, and images (Figure 4).
Our main goal was to change the education process from face-to-face to distance learning in the Mathematics 1 course at the Technical University of Košice. In this article, we describe process of change and our observations, experience, and conclusions on the basis of the data obtained from distance education.
This goal is specified in the following research questions:
- RQ1: What impact does distance education have on the evaluations of the students in the Mathematics 1 course?
- RQ2: Which online materials did students use most frequently?
- RQ3: Which mathematical topics are most interesting for students?
- RQ4: Which mathematical topic is the easiest for students, and which is the most difficult?
- RQ5: What is the relationship between the easiest topic and using online materials?
- RQ6: What is the relationship between the most difficult topic and using online materials?
2. Materials and Methods
As mentioned above, our goal was to change the education process from face-to-face to distance learning in the Mathematics 1 course at the Technical University of Košice and to analyze the impact of this change from the perspective of the students and the teachers.
A total of 252 first-year bachelor students were enrolled in the Mathematics 1 course in the academic year 2020/2021. There were students from nine different study programs. In terms of gender, 69% of the students were male and 31% were female. The students obtained an average of 18% from the continuous assessment and 55% from the overall assessment.
To answer the research questions, the overall assessment of students was analyzed, and a questionnaire was developed.
- Analysis of overall assessment of students in this academic year and comparison of the results with the five previous years (RQ1)
The analysis compared the overall assessment results of students who completed the Mathematics 1 course during the last five years, with evaluation of students’ overall assessments in this academic year.
A student passed the continuous assessment when they obtained at least 16% out of 30%. A student passed the final assessment when they obtained at least 36% out of 70%. The overall assessment is the sum of the continuous and final assessment obtained during semester.
Grading system:
- A (91–100%)—Outstanding/excellent work;
- B (81–90%)—Good/competent work;
- C (71–80%)—Adequate/reasonably satisfactory work;
- D (61–70%)—Less acceptable work;
- E (60–51%)—Minimally acceptable work;
- FX (under 50%)—Inadequate work.
Data were collected from 979 students’ overall assessments (2020/2021—248; 2019/2020—182; 2018/2019—171; 2017/2018—147; 2016/2017—231). This analysis used descriptive statistics.
- Questionnaire survey (RQ3—RQ6)
The data were collected by an anonymous questionnaire survey via Moodle from bachelor students of the Mathematics 1 course after the winter semester in 2020/2021. The collected data contained 110 responses from students who passed the course.
The questionnaire was divided into three parts. The first part looked into the participation of students in the online lessons (lectures and exercises) and their rating (Q1-Q4). The questions in this part used a five-point scale (5—always/excellent; 4—often/good; 3—sometimes/average; 2—seldom/poor; 1—never/N/A).
The second part focused on finding out how often students used/watched online materials/contents (Q5-Q9). The questions in this part used a five-point scale (5—always; 4—often; 3—sometimes; 2—seldom; 1—never).
The final part of the questionnaire examined whether students found the course topics difficult and interesting (Q10-Q12). In this section, the students could choose one of the topics.
All materials were stored or linked (online collection of solved examples, visualizations of examples) on Moodle. The data from the final part of the questionnaire were compared with the data from Moodle logs to find out how students had accessed study materials for given topics.
Descriptive statistics were used to describe the questionnaire survey data (frequencies, percentages and averages). Each question’s data were presented as a pie or bar chart.
An exploratory factor analysis was performed in order to assess the underlying key concepts of students’ evaluation of the teaching process. Nine questions from the first two parts of the questionnaire were analyzed. Factor analysis is a data reduction technique that seeks the set of latent underlying factors that summarize the essential information contained in the set of variables. The number of factors is usually smaller than the number of observed variables. Since the questionnaire items were measured on a Likert scale, we performed the analysis on a matrix of polychoric correlations. For this purpose, the package FACTOR was used [25].
3. Results
3.1. Success of Students in the Mathematics 1 Course
Student evaluations based on overall assessments for the last six academic years were compared (Table 1, Figure 5).
These results show that the ample online support for distance education had an impact on the improvement of grades in the student evaluation. More students passed the final test in the academic year 2020/2021. The distribution of individual evaluations changed only for marks D and E.
According to our findings, the change from face-to-face to distance education does not affect excellent students. It turned out that with sufficient online support, it is possible to observe a certain shift in knowledge and mathematical skills for students who previously had lower-level skills. The distance approach did not eliminate the number of disadvantaged students, although their number significantly decreased.
3.2. Questionnaire Survey
The questionnaire consisted of 12 questions (Table 2). The questions Q1-Q9 used a five-point Likert scale. Cronbach’s alpha for the Likert-type scales showed that the questionnaire has acceptable reliability, α = 0.71.
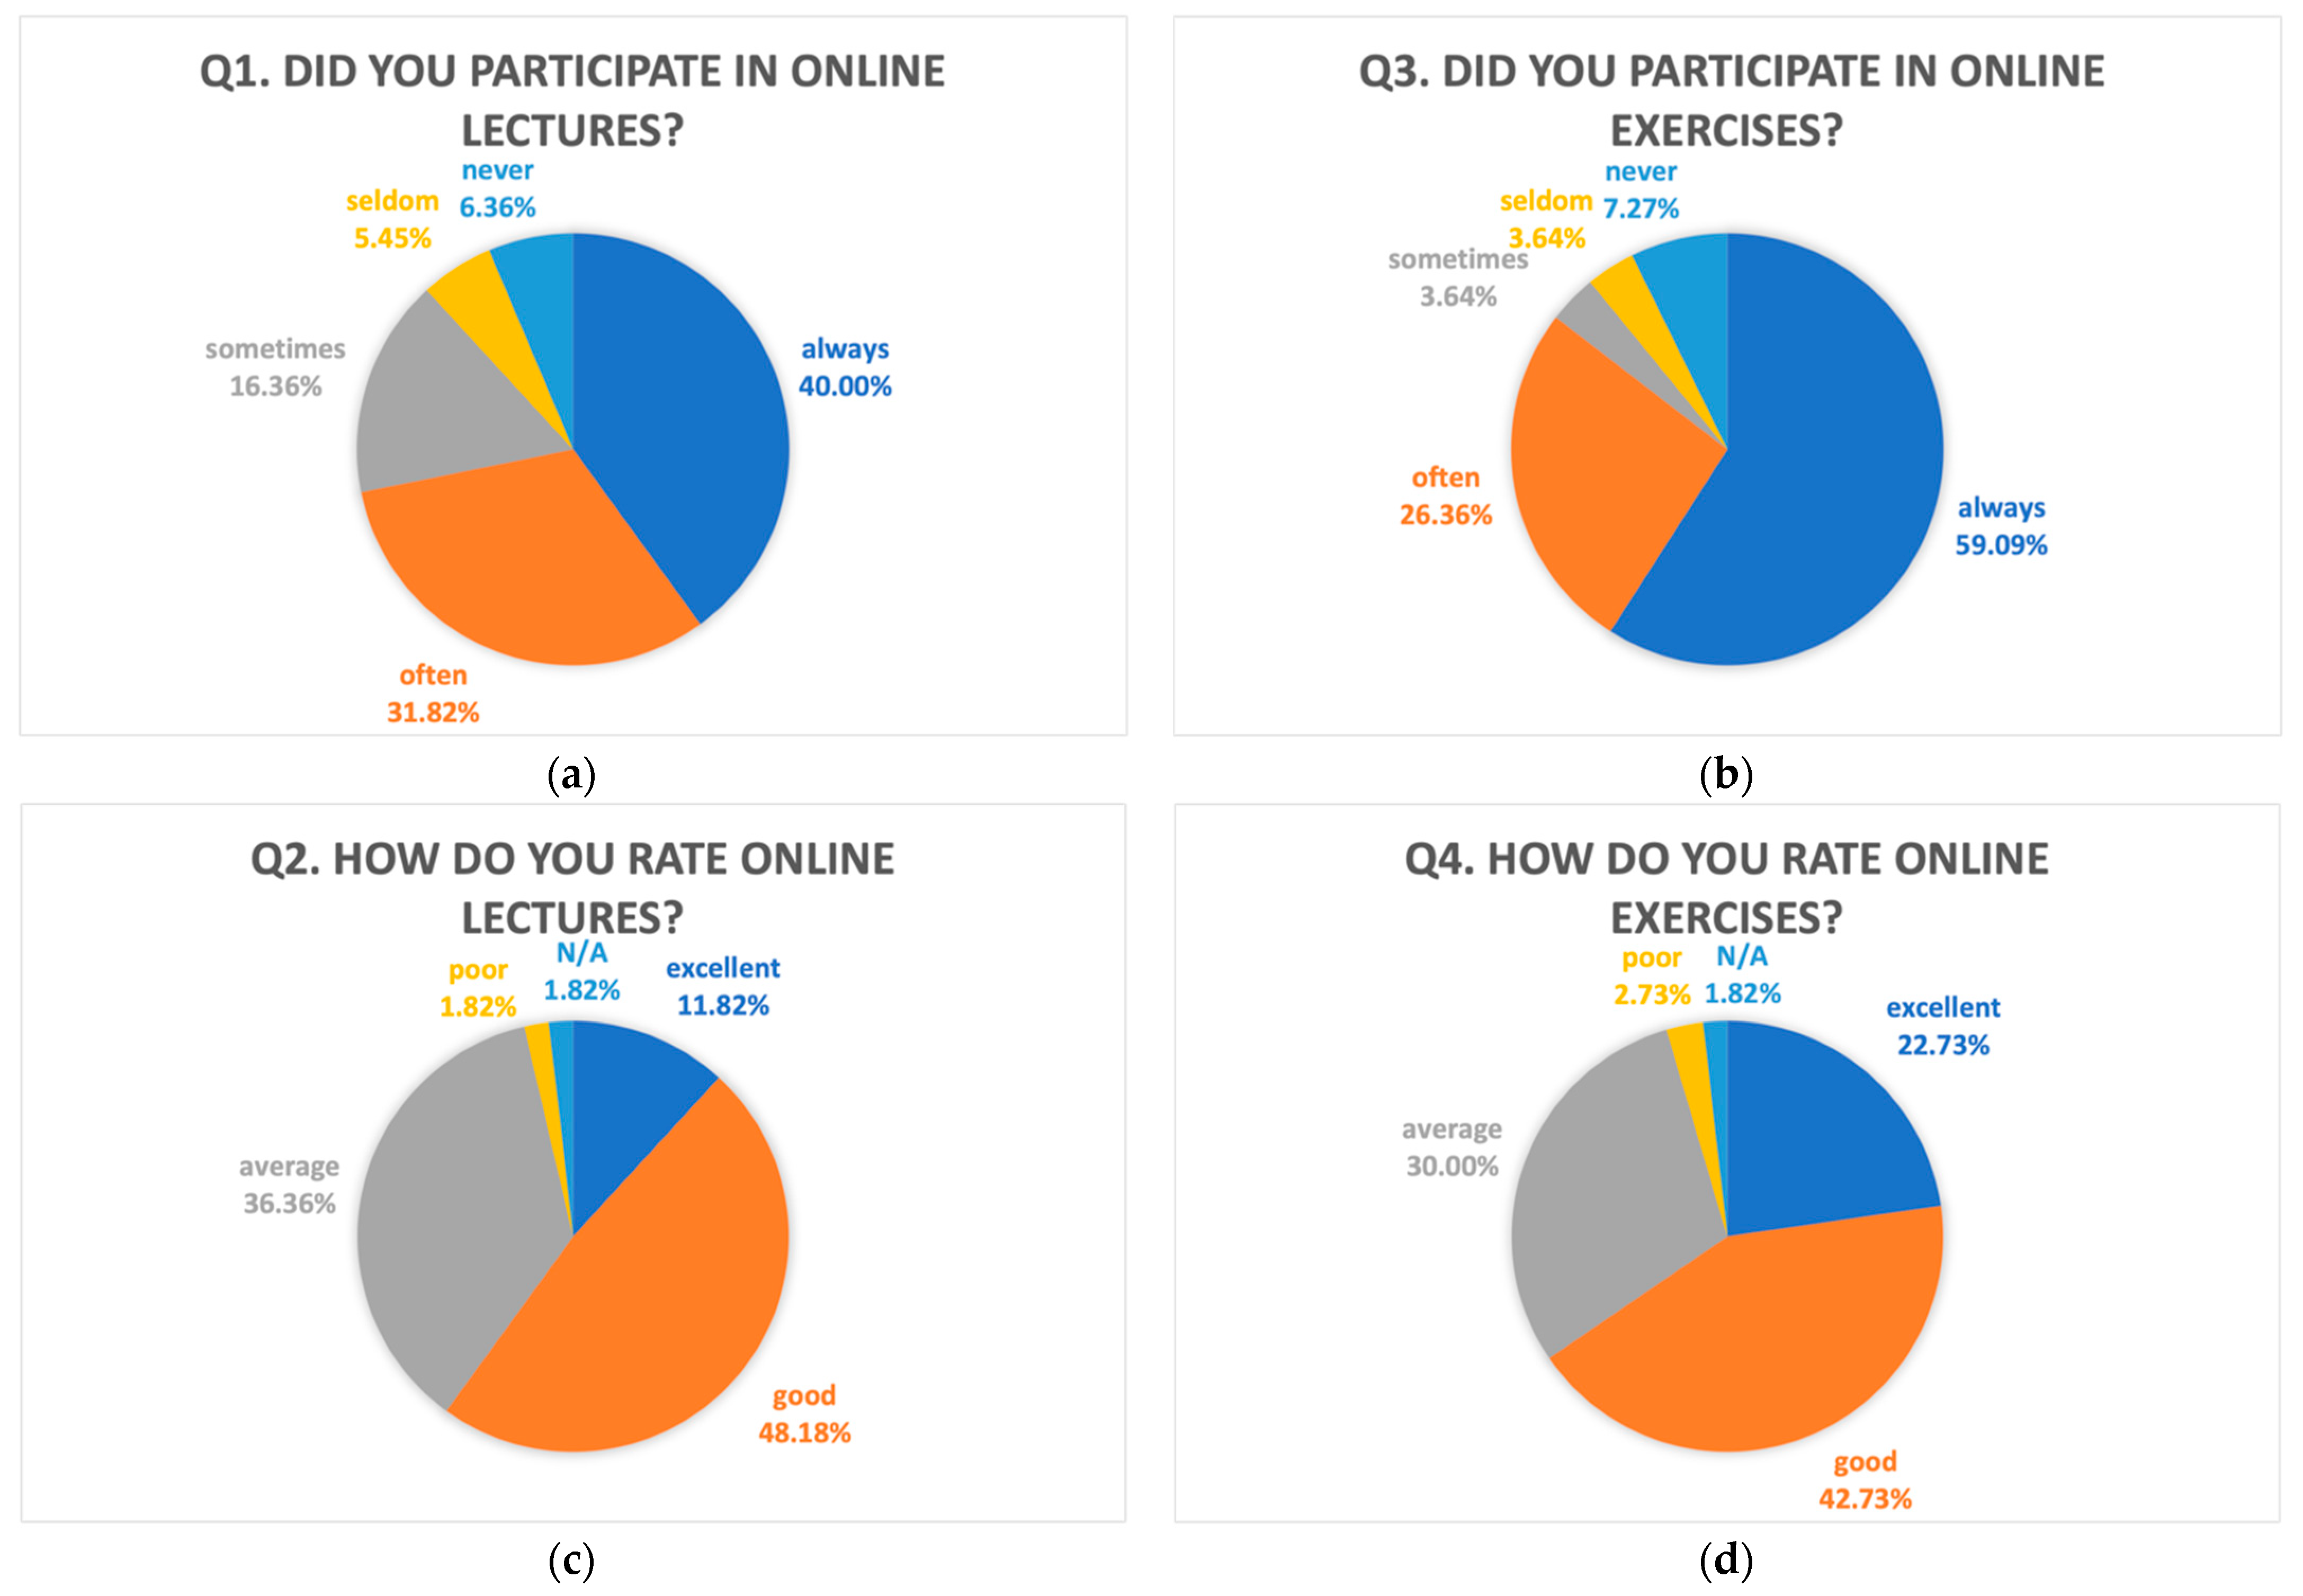
The first part (Q1–Q4) of the questionnaire was used to obtain information about participation in the online lectures and exercises (Figure 6). The results showed that 71.82% of the students participated in the online lectures every week (40%) or almost every week (31.82%), 21.81% had irregular attendance (16.36% sometimes and 5.45% seldom), and 6.36% never attended online lectures (Figure 6a). The average rating of online lectures was 73.27% (Figure 6c).
Online exercises had more regular attendance (85.45%, Figure 6b): 59.09% of the students participated every week and 26.36% almost every week, 7.28% of the students attended irregularly (3.64% sometimes and 3.64% seldom), and 7.27% of them never attended online exercises. The average rating of online exercises was 76.36% (Figure 6d).
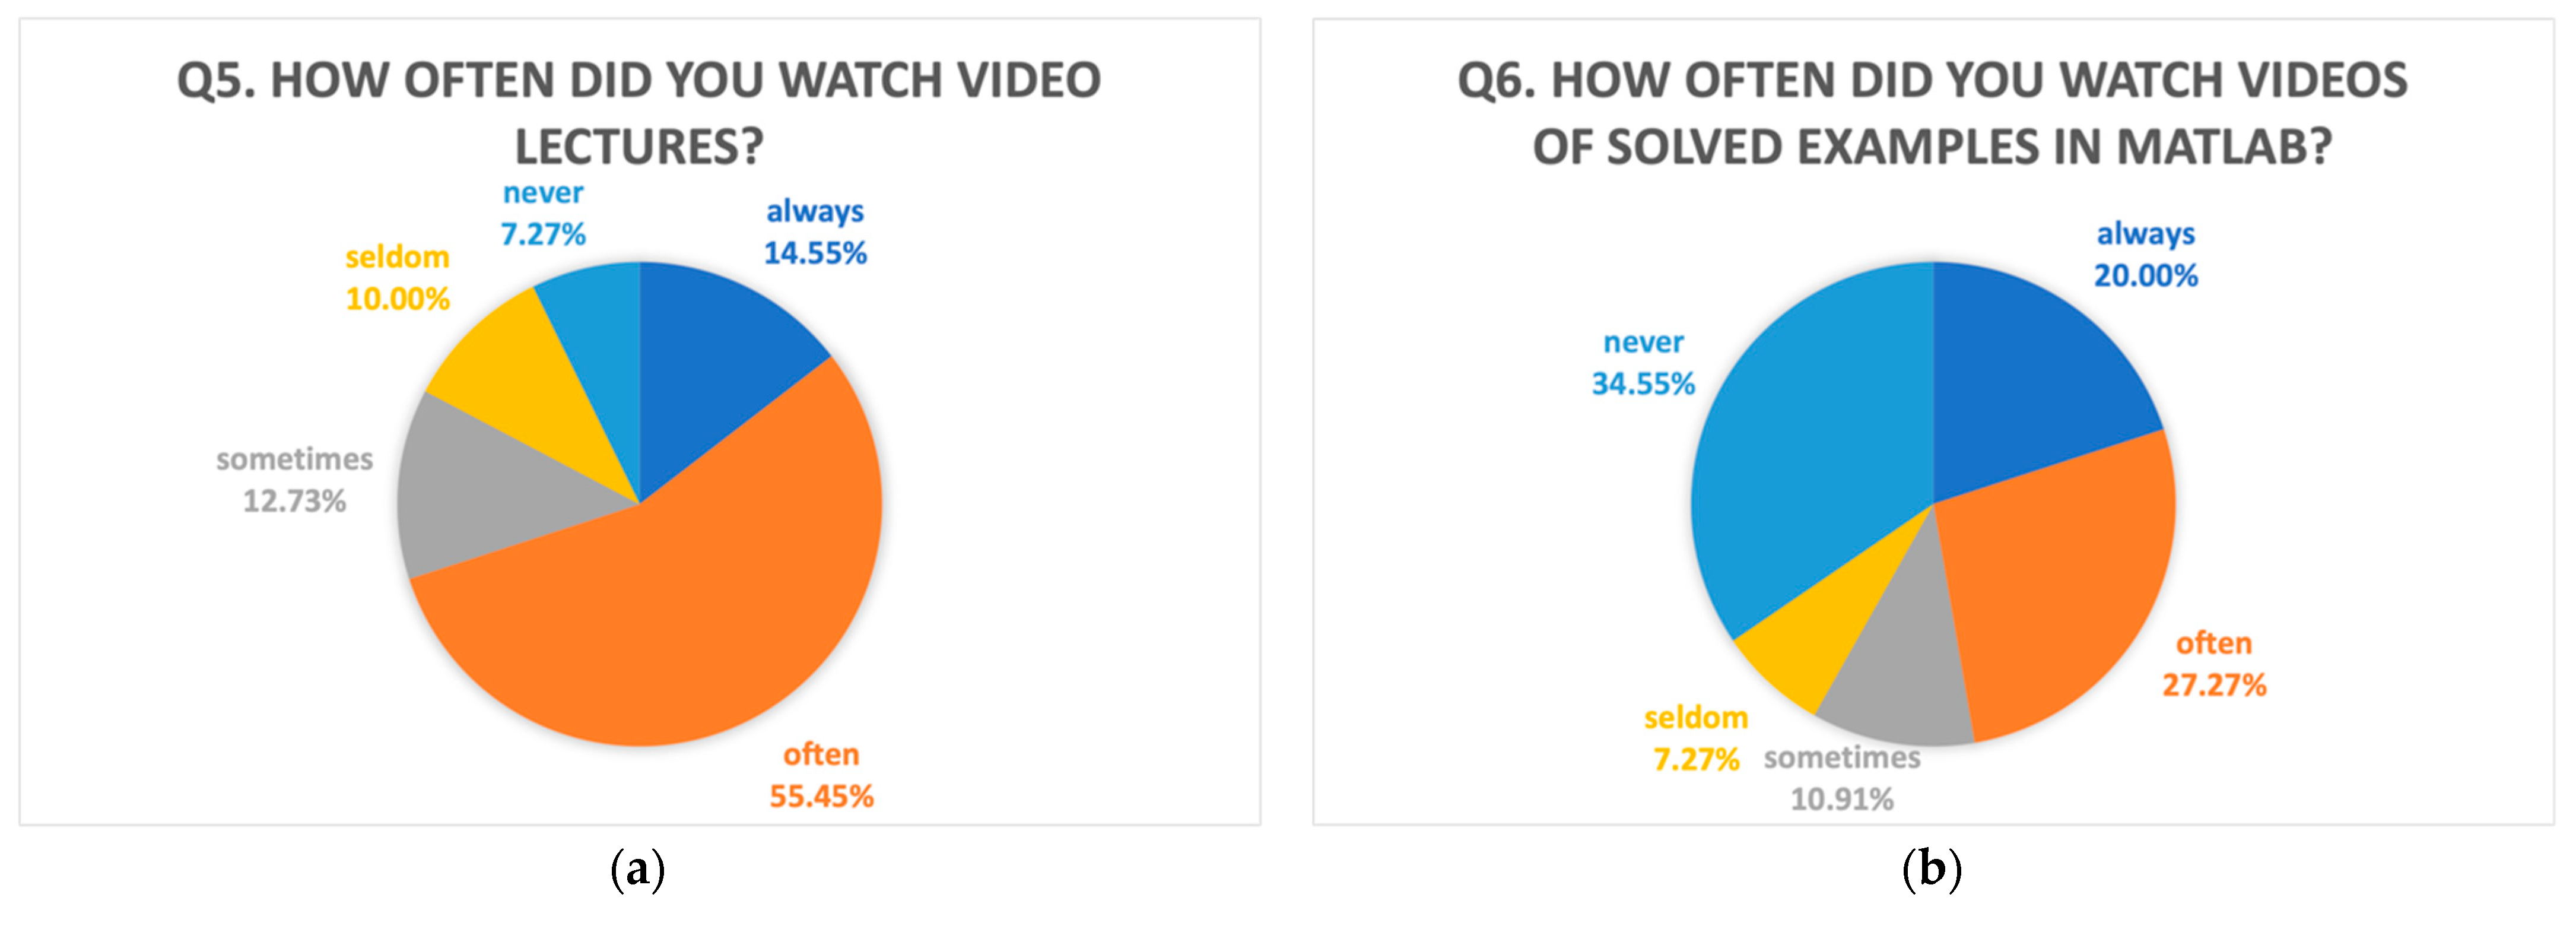
The second part (Q5-Q9) of the questionnaire focused on how often the students used online content (Figure 7). The results showed that 70% of the students watched video lectures regularly (14.55% every week, 55.45% almost every week), 22.73% of the students watched them occasionally (12.73% sometimes and 10% seldom—for example, when they had not attended the online lecture), and 7.27% never watched video lectures (Figure 7a).
Videos of solved examples in MATLAB were watched by 47.27% of the students every or almost every week (20% always, 27.27% often), by 18.18% of them occasionally (10.91% sometimes and 7.27% seldom), and 34.55% of the students never watched these videos (Figure 7b).
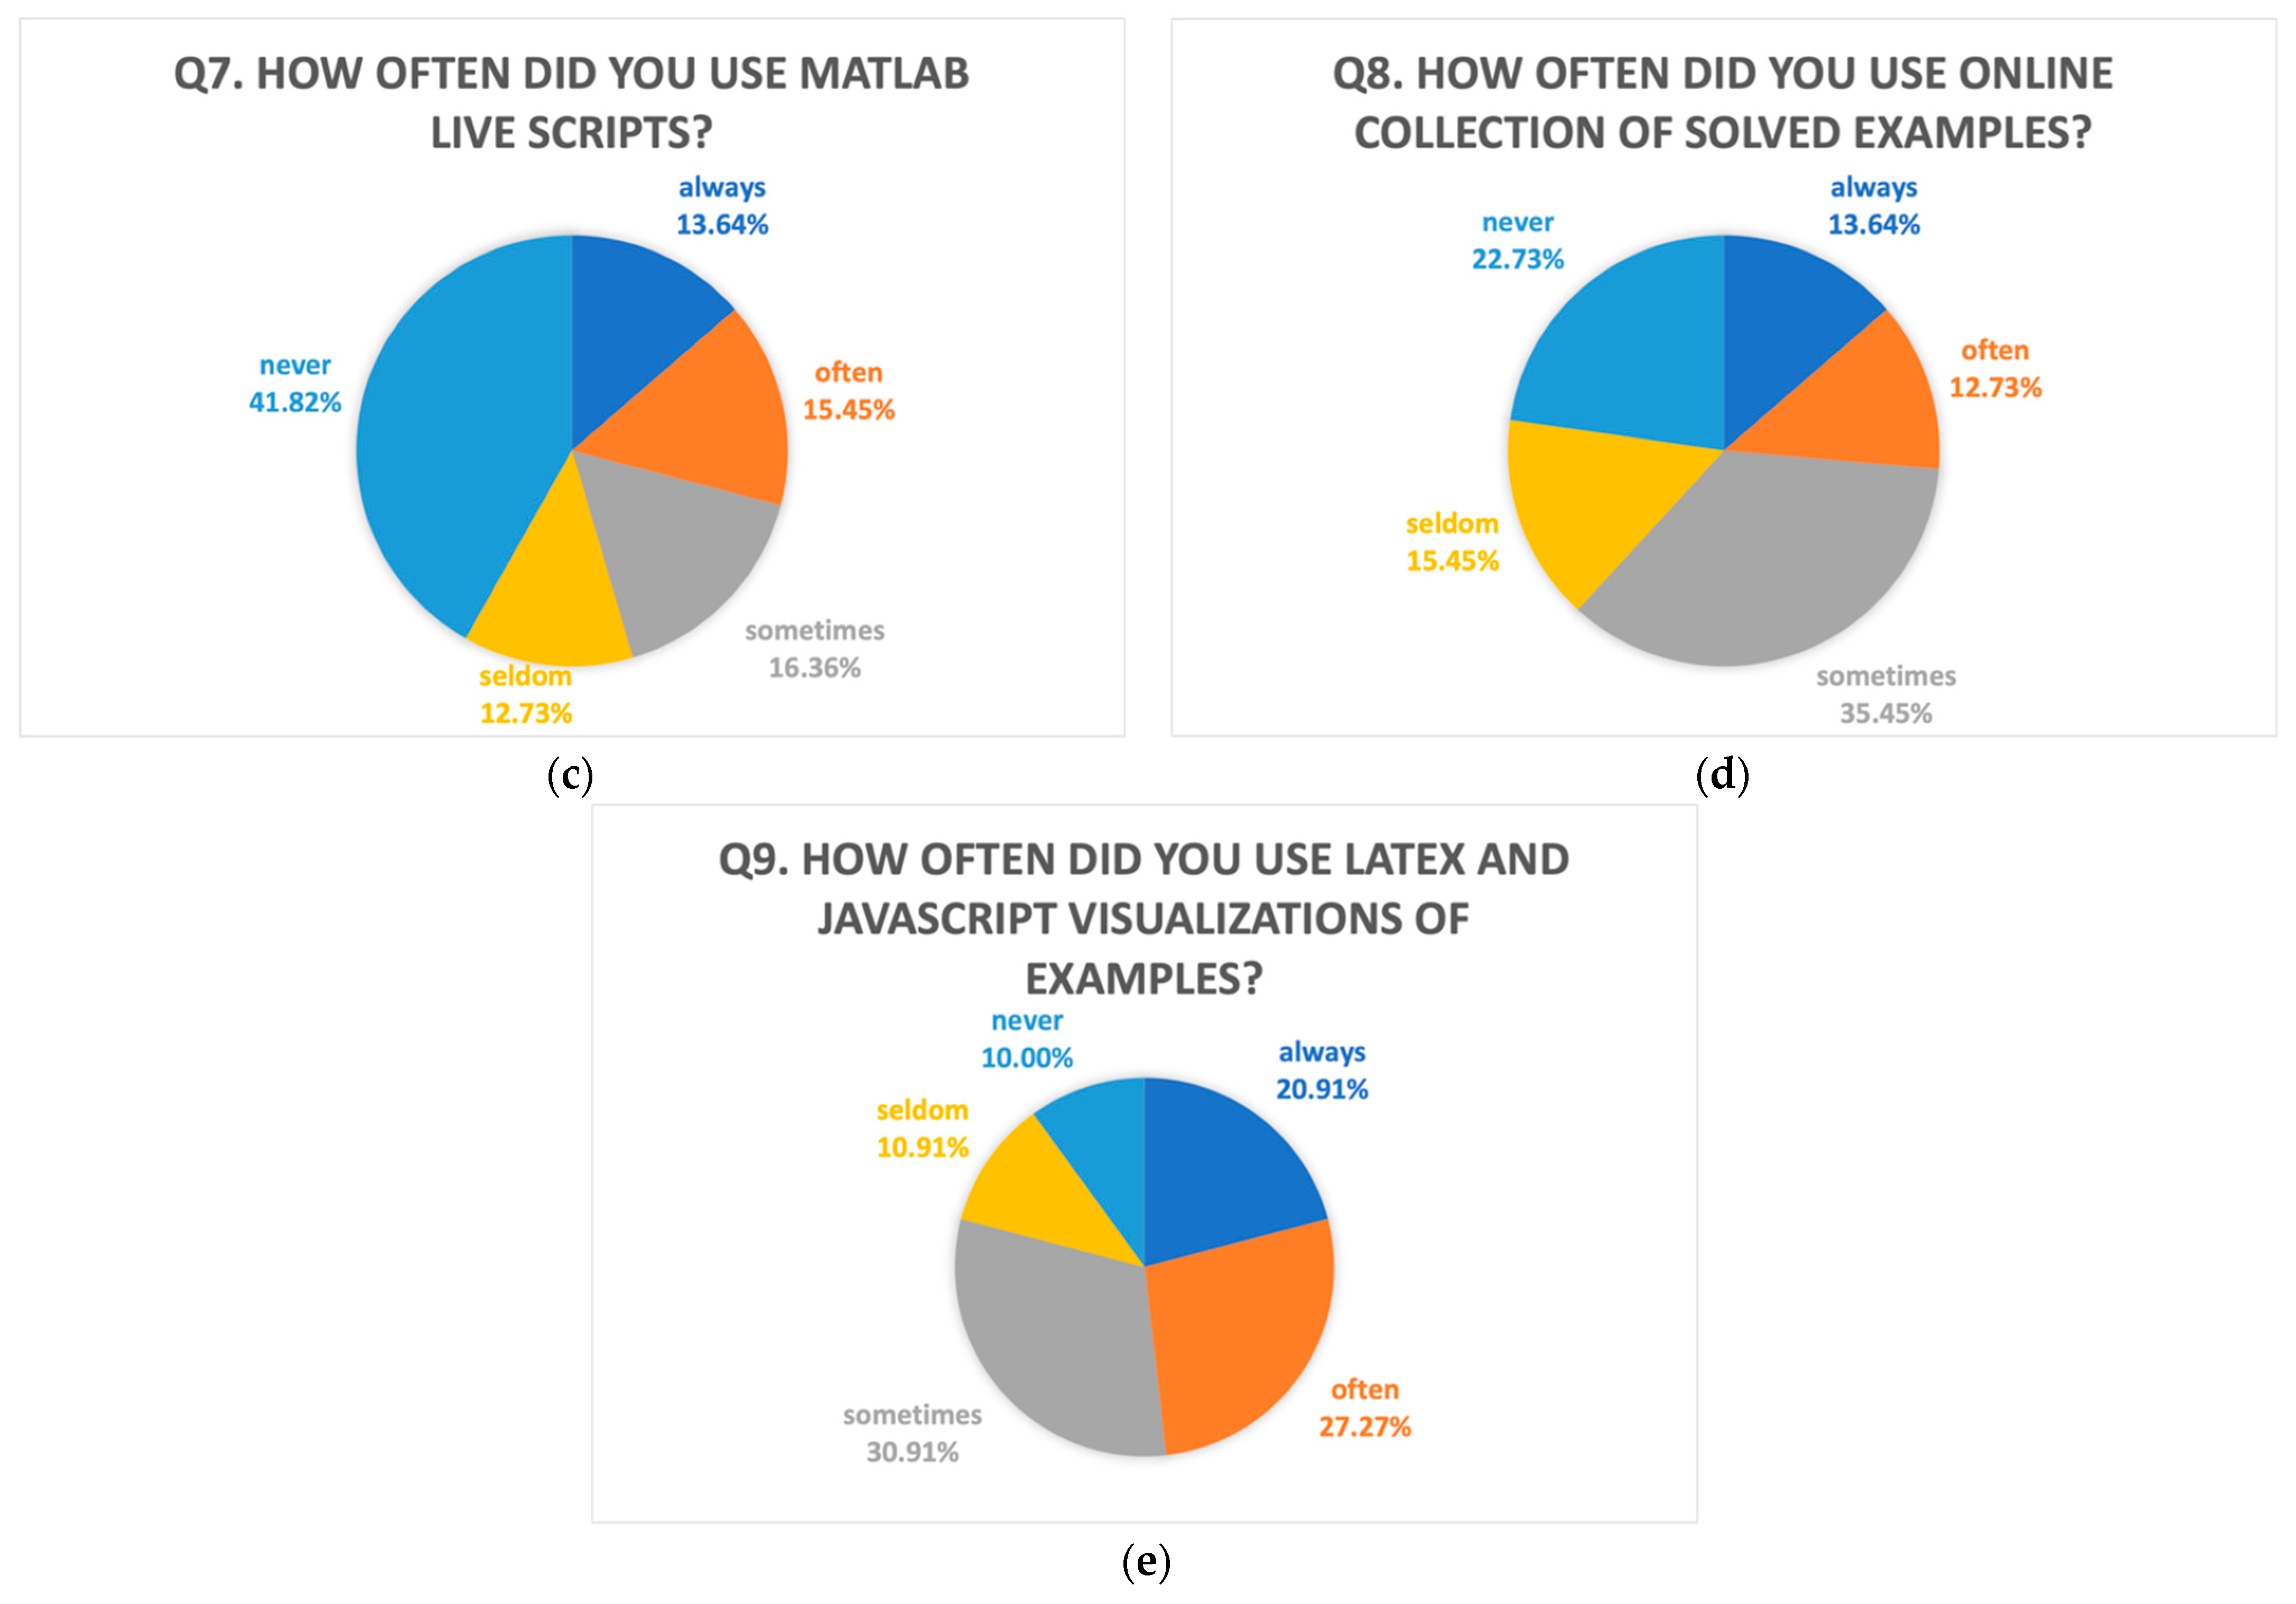
Similarly, MATLAB Live Scripts were used regularly by 29.09% of the students (13.64% always and 15.45% often), by 29.09% of them occasionally (16.36% sometimes and 12.73% seldom), and 41.82% of the students never used Live Scripts (Figure 7c).
The students’ answers showed that 26.37% of them regularly (13.64% always, 12.73% often) and 50.9% of them occasionally (35.45% sometimes and 15.45% seldom) used the online collection of solved examples. The remaining 22.73% of the students never used this collection (Figure 7d).
LaTeX and JavaScript visualizations of examples were regularly used by 48.18% of the students (20.91% always, 27.27% often); 41.82% of them used these visualizations irregularly (30.91% sometimes and 10.91% seldom), and 10% of them did not use this online content (Figure 7e).
The third part (Q10-Q12) of the questionnaire collected answers about the most difficult, the easiest, and the most interesting topics (Figure 8). The students answered that the most difficult topics were (Figure 8a) (12) integral calculus and its application; (9–10) monotone, convex, and extrema; and (11) sketch of the graph of the function.
The easiest topics were (Figure 8b) (1) vectors, (2) matrices, and (3) determinants. The most interesting topics for students were (Figure 8c) (2) matrices, (8) derivative of functions, and (3) determinants.
We analyzed Moodle logs to find out how students had accessed study materials. It is possible that students can access those link resources directly without leaving any trace in Moodle logs.
The easiest topics, 1, 2, and 3, had the most accesses to video lectures (Topic 1—989 accesses; Topic 2—701 accesses; Topic 3—255 accesses) and MATLAB Live Scripts (Topic 1—703 accesses; Topic 2—288 accesses; Topic 3—149 accesses).
The most difficult topic, 12, had more accesses to video lectures (138 accesses) and the online collection of solved examples (82 accesses). The more difficult topics, 9–10 and 11, had the most accesses to visualizations of examples (Topic 9–10—189 accesses; Topic 11—97 accesses) and the online collection of solved examples (Topic 9–10—186 accesses; Topic 11—126 accesses).
The most interesting topics, 2 and 3, had the most accesses to video lectures (Topic 2—701 accesses; Topic 3—255 accesses) and MATLAB Live Scripts (Topic 2—288 accesses; Topic 3—149 accesses); topic 8 had the most accesses to visualizations of examples (121 accesses) and an equal number of accesses to video lectures and the online collection of solved examples (98 accesses).
Exploratory Factor Analysis
In order to verify the validity of a factor analysis on our data, a Kaiser–Meyer–Olkin (KMO) test and Bartlett’s test of sphericity were first conducted to verify if the dataset was suitable for the factor analysis. Both tests are used to measure the sampling adequacy and to determine the factorability of the correlation matrix. Both Bartlett’s test (c2 × (36) = 386.4, p < 0.001) as well as the KMO test (=0.601) indicated that the factor analysis can be performed on the data. Based on a parallel analysis, three factors were recommended; however, after examining three- and four-factor solutions, we finally extracted four factors (these factors explained 95.9% of variability). The communalities for all variables were greater than 0.5, except that of Q5, where the communality was 0.351. The communality of a given variable is an estimate of the percentage of variance of that variable explained by all factors found. We also analyzed the data without this question; however, no improvement was achieved by means of overall fit, and the interpretation of factors was similar to that of the four-factor model with this item. Since this question fits the extracted factor, “Factor 3—Use of online materials”, we decided to leave this question in the solution. The extracted factors, questions, and question loadings of the rotated factor matrix are summarized in Table 3, where only loadings greater than 0.4 are shown.
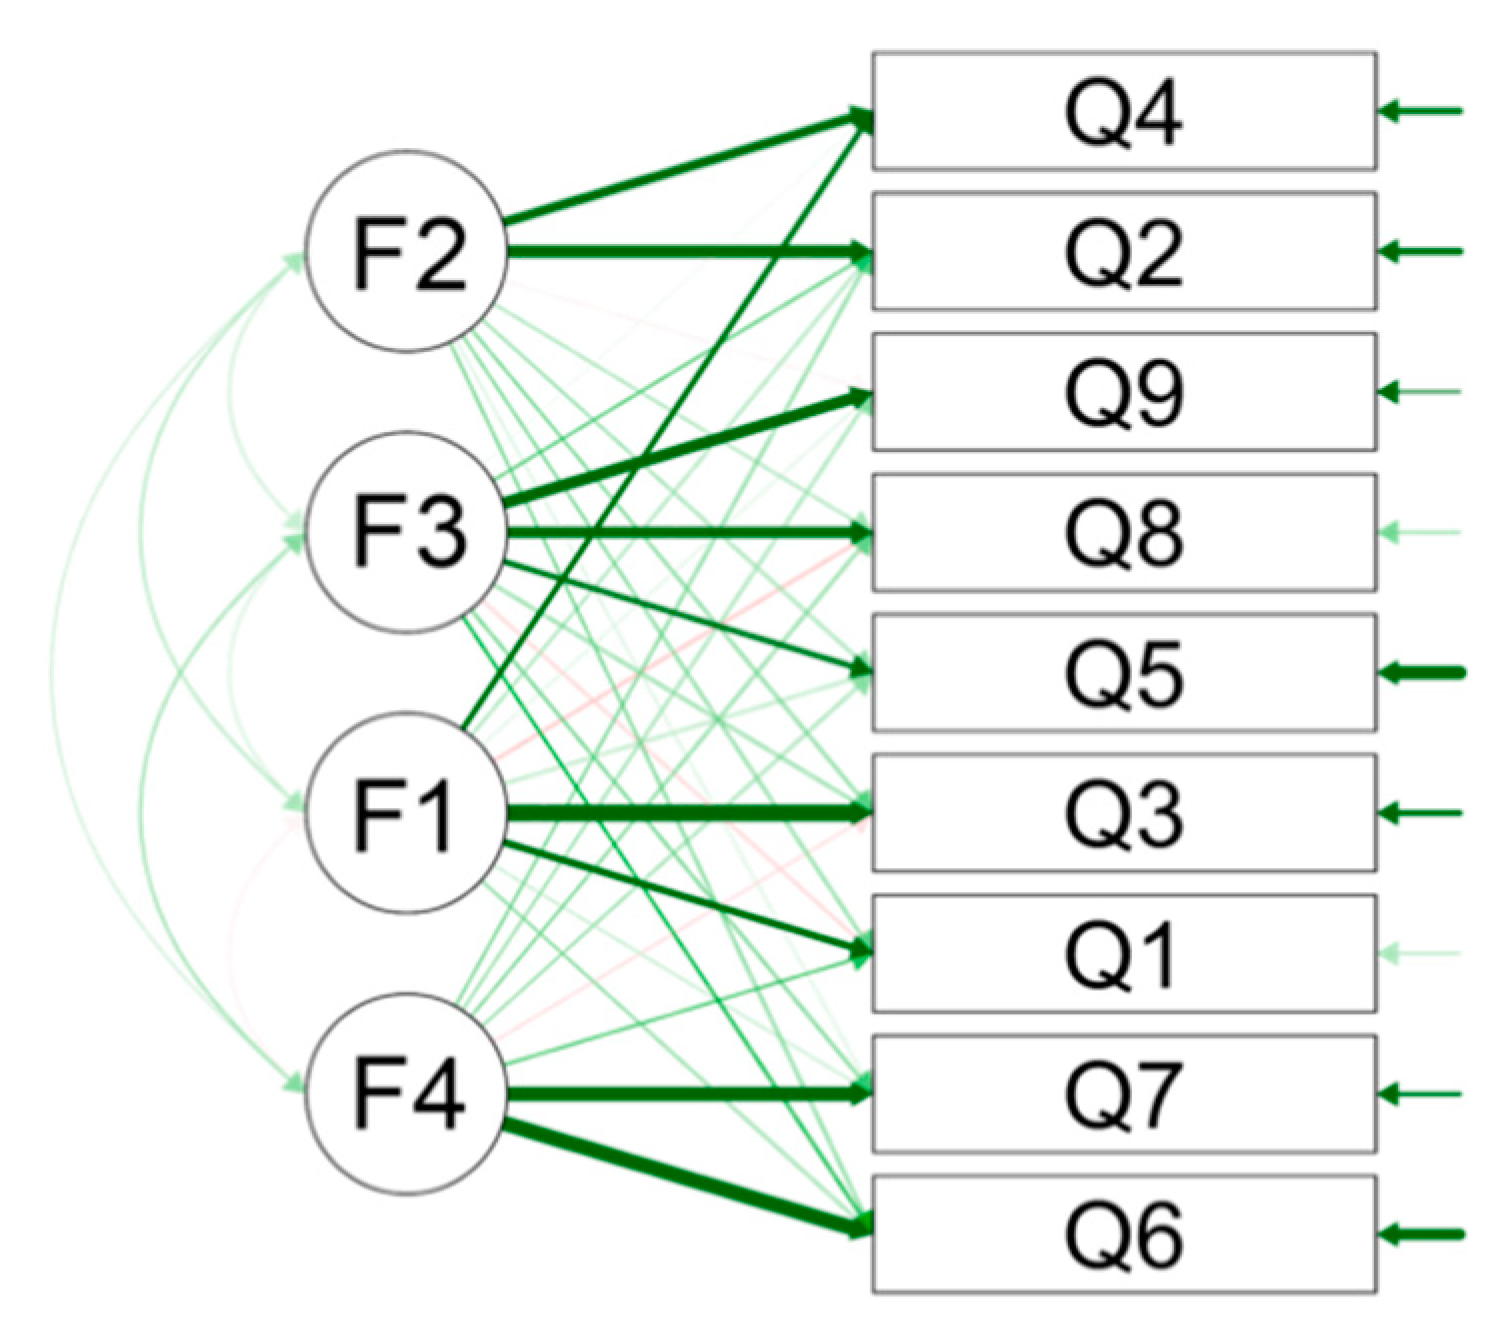
Factor 1 (F1) is correlated most strongly with participation in the exercises (0.977, Q3) and participation in the online lectures (0.675, Q1), so this factor describes “Participation in the online lessons”. Exercise rating (0.977, Q4) and lecture rating (0.734, Q2) have positive loadings on Factor 2 (F2), so this factor describes “Satisfaction with the online lessons”. Factor 3 is correlated with use LaTeX and JavaScript visualizations of examples (0.805, Q9) and the online collection of solved examples (0.717, Q8) and, to a lesser extent, watching video lectures (0.472, Q5), so this factor describes “Use of online materials”. Factor 4 is correlated most strongly with watching videos of solved examples in MATLAB (0.945, Q6) and use of MATLAB Live Scripts (0.926, Q7); therefore, it describes “Use of MATLAB-related online materials”.
The exploratory factor analysis confirmed that this questionnaire (Q1-Q9) followed the next four key concepts (Figure 9):
- Factor 1 (F1)—Participation in the online lessons;
- Factor 2 (F2)—Satisfaction with online lessons;
- Factor 3 (F3)—Use of online materials;
- Factor 4 (F4)—Use of MATLAB-related online materials.
Four of the questions (Q1-Q4) were related to distance learning, including participation in online lessons (F1) and satisfaction with them (F2). The remaining five questions (Q5-Q9) focused on self-education using supporting online materials. This concept was divided into two parts: MATLAB-related online materials (F4; Q6-Q7) and other online materials (F3; Q5, Q8–Q9).
4. Discussion
RQ1: What impact does distance education have on the evaluations of the students in the Mathematics 1 course?
Despite the significantly better evaluations of students in 2020/2021, it is impossible to declare that distance education is more efficient than face-to-face education.
The fundamental drawbacks of the diagnostics of received knowledge, abilities, and skills during distance education are as follows:
- It is not possible to verify the identity of the student due to GDPR;
- It is not possible to ensure the same conditions for all students.
A positive aspect of the need for evaluation during distance education is the preparation of a lot of tasks used to assess students’ knowledge, skills, and abilities. It will be possible to use bank tasks even after returning to face-to-face education.
RQ2: Which online material did students use most frequently?
The answers from the questionnaire were summarized, rated from 5 to 1 (5 means al-ways, 1 means never). Subsequently, the average scores and percentages of students who watched/used individual material at least once were calculated (Table 4). Figure 10 shows the order of individual materials’ use according to their average score.
RQ3: Which mathematical topics are the most interesting for students?
The most interesting topics for students were topics 2, 8, and 3—matrices, derivative of functions, and determinants, respectively. This result was surprising. From our experience, students consider the content of the first part of the Mathematics 1 course (Linear Algebra) easier. Students do not consider the content of one real variable’s function to be simple, which may be the reason for its unattractiveness. From this point of view, it is surprising to find that derivative of functions was among the most interesting topics.
RQ4: Which mathematical topic is the easiest for students, and which is the most difficult?
Students answered that the most difficult topics were 12, 9–10, and 11—integral calculus and its application; monotone, convex, and extrema; and sketch of the graph of the function, respectively. The easiest topics were 1, 2, and 3—vectors, matrices, and determinants.
Students described the first topics of the semester (Linear Algebra) as the easiest ones and the last topics of the semester (functions of one real variable—differential and integral calculus) as the most difficult ones. This answer of students was expected. For teachers, it is also a signal that these topics will receive more attention from the perspective of preparing different electronic materials.
RQ5: What is the relationship between the easiest topic and using online materials?
RQ6: What is the relationship between the most difficult topic and using online materials?
The most difficult topic, 12, had more accesses to video lectures and the online collection of solved examples. The more difficult topics, 9–10 and 11, had the most accesses to visualizations of examples and the online collection of solved examples.
According to our findings, students focused on video lectures and MATLAB Live Scripts while studying easy topics. For difficult topics, they focused on solving examples and used the online collection of solved examples, visualizations of examples, and also video lectures. Although they had online lectures and exercises, they still studied the online materials. We must also take into account the enthusiasm at the beginning of the semester and exhaustion at the end of the semester.
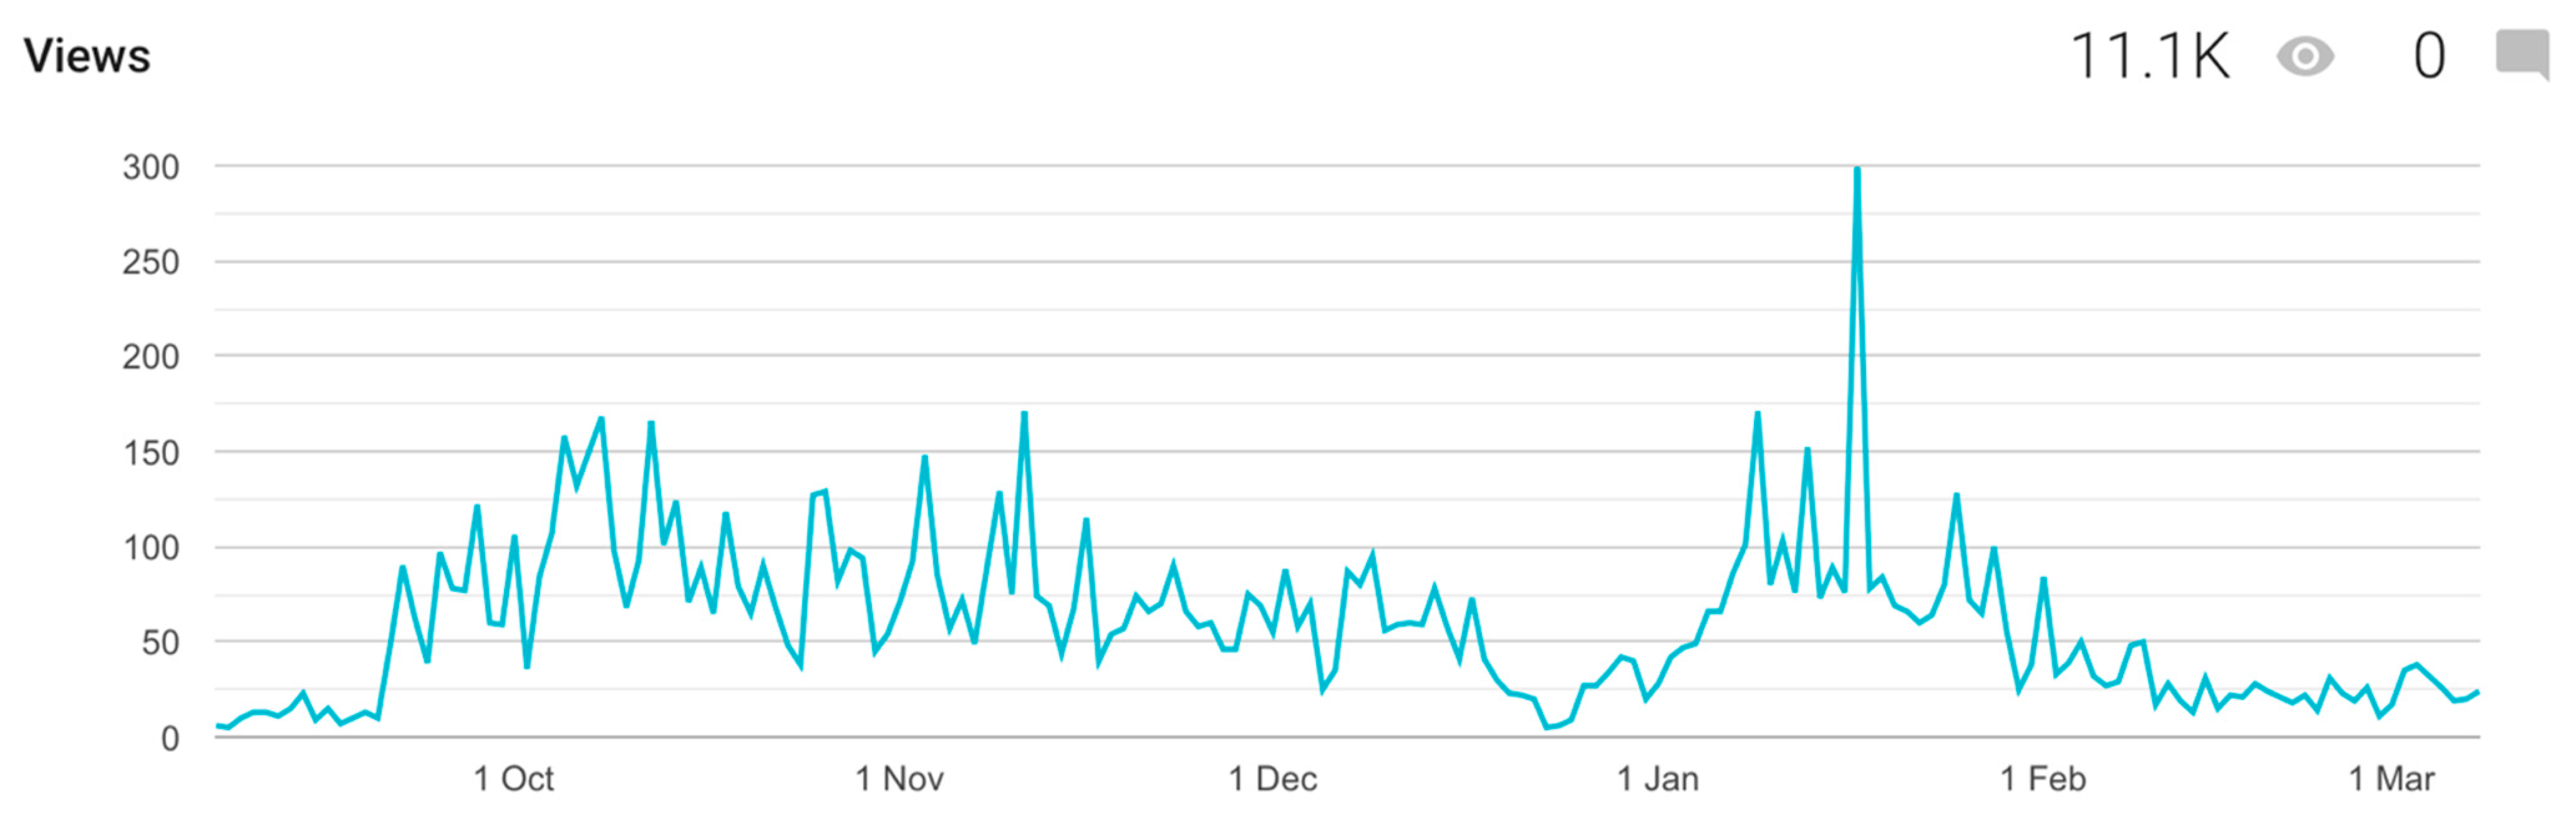
As mentioned above, it is possible that students could have accessed those online resources directly without leaving any trace in Moodle logs. For example, the online collection of solved examples had over 11,000 visitors/accesses during the reporting period (Figure 11).
4.1. Experience of Teachers with Distance Education
Even with the maximum prearranged online materials, continuous video meetings with students, and continuous automatic testing, distance education of a general subject is very time consuming. Despite teachers and students’ extraordinary efforts, the teacher cannot directly intervene in the activities of multiple students at the same time. Another problem is students’ insufficient technical accessories and unreliable Internet connections, which often fail due to adverse weather conditions. It is necessary to realize that students study from home, often in the remote areas of Slovakia or foreign countries.
4.2. Comparison to Related Work
The COVID-19 pandemic has multiplied the number of education studies dealing with distance education, online education, and e-learning.
The main focus is accented on the psychological effects of the pandemic on students and teachers and their overall readiness to change education [26,27].
Other types of studies deal with providing distance education from a technological point of view, including the present study.
When comparing results of the impact of online education, we observed a similar phenomenon as that in the study [15]:
- Students prefer to interact with the teacher through online streaming;
- Students prefer writing on the board.
The requirements of our students were the same. Interactions were made using online video conferences with students. Live writing during lessons was realized by connecting an online whiteboard (pen and tablet).
In contrast to the study [28], we have not identified the determinants of online effective learning, but rather the effectiveness of education was measured only on the basis of education results.
4.3. Future Plans
This case study demonstrated the scope for future research in distance education. We believe that the analysis of mathematical topics from the student point of view will bring more accurate results regarding the benefits and limits of distance education. Therefore, it is necessary to make the following changes.
- Use series of questions for students every week:
- ○
- Choose the material that you are using during studies this chapter.
- ○
- Choose the topic that is the most difficult for you in this chapter.
- Concentrate all materials only in the Moodle system without the possibility of other access to the electronic materials.
- Use Moodle learning analytics to predict or detect unknown aspects of the learning process based on historical data and current behavior.
- Use non-anonymous questionnaires.
- Examine the relationship between the answers to the questions and the final marks of the students.
At universities where the Python language is used for teaching introductory programming courses, advanced topics in mathematics, physics, and other technical subjects, it is useful to capitalize on it and use a Python environment such as Jupyter Notebook (JN) for teaching mathematics. For illustration purposes, it has been practiced for teaching the Mathematics course at the Department of Engineering at the University of Cambridge. JN is an open-source web application for creating and sharing online materials that contain live code, mathematical expressions written in LaTeX [29], visualizations, and narrative text. It is very similar to MATLAB Live Scripts.
5. Conclusions
Since the 1980s, the pros and cons of online education have been widely discussed. The debate has divided the scientific community into two camps: those who advocate for online education and those who are followers of classical, face-to-face education. With the new generation of students, a certain consensus has been adopted because online education is a suitable complement to traditional education, but the former cannot fully replace the latter.
The current situation leaves no room for this controversy. It opens up another strong topic: How can online distance learning be prepared so that it meets the primary learning goals? However, what is most important is to find an answer to the following question: How can the distance education process be managed so as to develop the knowledge, abilities, skills, and competencies of pupils and students and, thus, cultivate their personalities?
In our case, the quantity and quality of the prepared online materials were high, and therefore, the shift to distance education was relatively continual and without problems. Immediately after the end of the semester, we can say that students’ results were satisfactory, and the use of online materials was above average.
The question of the stability of the knowledge and its capability to be used to solve other engineering problems is open at this point.
Author Contributions
Conceptualization, J.P., A.M. and M.T.; methodology, J.P.; software, A.M. and M.T.; validation, J.P., A.M. and M.T.; formal analysis, A.M. and D.K.; investigation, A.M. and M.T.; resources, J.P., A.M. and M.T.; data curation, A.M. and D.K.; writing—original draft preparation, J.P., A.M. and M.T.; writing—review and editing, J.P., A.M., M.T. and D.K.; visualization, A.M., M.T. and D.K.; supervision, J.P. All authors have read and agreed to the published version of the manuscript.
Funding
This research was funded by the Scientific Grant Agency (VEGA) under grant No. VEGA 1/0365/19, the Cultural and Educational Grant Agency MŠVVaŠ SR (KEGA) under grant No. 040TUKE-4/2021, and by the Slovak Research and Development Agency under grant No. APVV-18-0526.
Data Availability Statement
Data are available from the authors on request.
Conflicts of Interest
The authors declare no conflict of interest.
References
- Lin, H.; Dwyer, F.M. The Effect of Static and Animated Visualization: A Perspective of Instructional Effectiveness and Efficiency. Educ. Technol. Res. Dev. 2010, 58, 155–174. [Google Scholar] [CrossRef]
- Daly, C.J.; Bulloch, J.M.; Ma, M.; Aidulis, D. A Comparison of Animated versus Static Images in an Instructional Multimedia Presentation. Adv. Physiol. Educ. 2016, 40, 201–205. [Google Scholar] [CrossRef] [PubMed]
- Kennedy, J.M. Picture Perception. In Advances in Visual Semiotics; Sebeok, T.A., Umiker-Sebeok, J., Eds.; DE GRUYTER: Berlin, Germany; Boston, MA, USA, 1995; ISBN 978-3-11-087425-9. [Google Scholar]
- Azman Abu, N.; Daud Hassan, M.; Sahib, S. Mathematical Animations: The Art of Teaching. In Proceedings of the 31st Annual Frontiers in Education Conference, Impact on Engineering and Science Education, Conference Proceedings (Cat. No.01CH37193), Reno, NV, USA, 10–13 October 2001; Volume 3, pp. S1C-10–S1C-15. [Google Scholar] [CrossRef] [Green Version]
- Lindner, A. Taylor Polynomials of Multivariable Functions’. Available online: https://www.geogebra.org/m/chMpCQz2 (accessed on 20 March 2021).
- Andrade-Arenas, L.; Cabana-Caceres, M.; Perez, W.R.; Sandoval, J.V. The Impact of Using Software to Learn Mathematics in Courses of Peruvian Engineering Programs. In Proceedings of the 2020 IEEE World Conference on Engineering Education (EDUNINE), Bogotá, Colombia, 15–18 March 2020; pp. 1–4. [Google Scholar]
- Azzam, N.A.; Al-Kayyali, R.A.-A. An Integrated Method for STEM Education Using MATLAB. In Proceedings of the 2020 Advances in Science and Engineering Technology International Conferences (ASET), Dubai, United Arab Emirates, 4 February–9 April 2020; pp. 1–4. [Google Scholar]
- Basogain, X.; Olabe, J.C.; Olabe, M.A. Fostering STEAM Education Using Computers and Information Technologies. In Proceedings of the 2020 2nd International Conference on Modern Educational Technology, Singapore, May 2020; Association for Computing Machinery: New York, NY, USA, 2020; pp. 54–57. [Google Scholar]
- Ďuriš, V. Geometric Applications of Measure as a Definite Integral in Mathematics Education. J. Interdiscip. Math. 2020, 23, 739–753. [Google Scholar] [CrossRef]
- Majid, M.A.; Huneiti, Z.A.; Balachandran, W.; Balarabe, Y. Matlab as a Teaching and Learning Tool for Mathematics: A Literature Review. Int. J. Arts Sci. 2013, 6, 23. [Google Scholar]
- Suharti, S.; Sulasteri, S.; Sari, N.; Sriyanti, A. Baharuddin The Development of Teaching Materials for Subjects of Numeri-cal Method Assisted by MATLAB Software in Mathematics Education Department Students. J. Phys. Conf. Ser. 2020, 1539, 012082. [Google Scholar] [CrossRef]
- Tokgoz, E.; Tekalp, B.S.; Tekalp, E.N.; Tekalp, H.A. Undergraduate Stem Students’ Role in Making Technology Decisions for Solving Calculus Questions and the Impact of These Decisions on Learning Calculus. In Proceedings of the 2020 ASEE Virtual Annual Conference, Ames, IA, USA, 15–16 October 2020. [Google Scholar]
- Pócsová, J.; Mojžišová, A.; Mikulszky, M. Matlab in Engineering Education. In Proceedings of the 2018 19th International Carpathian Control Conference (ICCC), Szilvásvárad, Hungary, 28–31 May 2018; pp. 532–535. [Google Scholar] [CrossRef]
- Moodle. Available online: https://moodle.org (accessed on 20 March 2021).
- Busto, S.; Dumbser, M.; Gaburro, E. A Simple but Efficient Concept of Blended Teaching of Mathematics for Engineering Students during the COVID-19 Pandemic. Educ. Sci. 2021, 11, 56. [Google Scholar] [CrossRef]
- Blogger. Available online: https://www.blogger.com (accessed on 20 March 2021).
- Mojžišová, A.; Pócsová, J. Application of a New Approach in the Engineering Education. In Proceedings of the 2015 16th International Carpathian Control Conference (ICCC), Szilvasvarad, Hungary, 27–30 May 2015; pp. 310–314. [Google Scholar] [CrossRef]
- The Latex Project. Available online: https://www.latex-project.org/ (accessed on 20 March 2021).
- Grahn, A. The Animate Package. 2019. Available online: https://gitlab.com/agrahn/animate (accessed on 1 February 2021).
- Tantau, T. The TikZ and PGF Packages-Manual for Version 3.1.5b. 2020. Available online: http://sourceforge.net/projects/pgf/ (accessed on 1 February 2021).
- JavaScript Tutorial. Available online: https://www.w3schools.com/js/ (accessed on 20 March 2021).
- Parisi, T. WebGL: Up and Running, 1st ed.; O’Reilly Media, Inc.: Sebastopol, CA, USA, 2012; ISBN 1-4493-2357-X. [Google Scholar]
- Wittens, S. Making MathBox. Presentation-Quality Math with Three.Js and WebGL. Available online: https://acko.net/blog/making-mathbox/ (accessed on 20 March 2021).
- Angel, E.; Haines, E. An Interactive Introduction to WEBGL and Three.JS. In Proceedings of the ACM SIGGRAPH 2017 Courses, Los Angeles, CA, USA, July 2017; Association for Computing Machinery: New York, NY, USA, 2017. [Google Scholar]
- Lorenzo-Seva, U.; Ferrando, P.J. FACTOR: A Computer Program to Fit the Exploratory Factor Analysis Model. Behav. Res. Methods 2006, 38, 88–91. [Google Scholar] [CrossRef] [PubMed] [Green Version]
- Daumiller, M.; Rinas, R.; Hein, J.; Janke, S.; Dickhäuser, O.; Dresel, M. Shifting from Face-to-Face to Online Teaching during COVID-19: The Role of University Faculty Achievement Goals for Attitudes towards This Sudden Change, and Their Relevance for Burnout/Engagement and Student Evaluations of Teaching Quality. Comput. Hum. Behav. 2021, 118, 106677. [Google Scholar] [CrossRef]
- Calder, N.; Jafri, M.; Guo, L. Mathematics Education Students’ Experiences during Lockdown: Managing Collaboration in ELearning. Educ. Sci. 2021, 11, 191. [Google Scholar] [CrossRef]
- Roman, M.; Plopeanu, A.-P. The Effectiveness of the Emergency ELearning during COVID-19 Pandemic. The Case of Higher Education in Economics in Romania. Int. Rev. Econ. Educ. 2021, 37, 100218. [Google Scholar] [CrossRef]
- Nelli, F. Writing Mathematical Expressions with LaTeX. In Python Data Analytics; Apress: Berkeley, CA, USA, 2015; pp. 317–326. ISBN 978-1-4842-0959-2. [Google Scholar]
Figure 1.
Solved problem sets on Blogger platform in static material form.

Figure 2.
Static animations created with LaTeX.

Figure 3.
Reactive elements created with JavaScript.

Figure 4.
MATLAB Live Editor with editable live script.

Figure 5.
Comparison of overall assessment evaluations from the year 2020/2021 and the average marks from the last 5 years.
Figure 5.
Comparison of overall assessment evaluations from the year 2020/2021 and the average marks from the last 5 years.

Figure 6.
Questionnaire part 1: (a) Participation in online lectures; (b) participation in online exercises; (c) online lectures rating; (d) online exercises rating.
Figure 6.
Questionnaire part 1: (a) Participation in online lectures; (b) participation in online exercises; (c) online lectures rating; (d) online exercises rating.

Figure 7.
Questionnaire part 2: (a) Video lectures; (b) MATLAB video tutorials; (c) MATLAB Live Scripts; (d) online collection of solved examples; (e) visualizations of examples.
Figure 7.
Questionnaire part 2: (a) Video lectures; (b) MATLAB video tutorials; (c) MATLAB Live Scripts; (d) online collection of solved examples; (e) visualizations of examples.


Figure 8.
Questionnaire part 3: (a) The most difficult topic; (b) the easiest topic; (c) the most interesting topic.
Figure 8.
Questionnaire part 3: (a) The most difficult topic; (b) the easiest topic; (c) the most interesting topic.

Figure 9.
Path diagram.

Figure 10.
Average score.

Figure 11.
Blogger report.


Table 1.
Student evaluation based on overall assessments for the last six academic years; numbers are given in percentages.
Table 1.
Student evaluation based on overall assessments for the last six academic years; numbers are given in percentages.
| Academic Year | A (100–91) | B (90–81) | C (80–71) | D (70–61) | E (60–52) | FX (<51) |
|---|---|---|---|---|---|---|
| 2020/2021 | 3.23 | 4.03 | 12.90 | 29.84 | 31.85 | 18.15 |
| 2019/2020 | 3.74 | 3.21 | 13.37 | 16.04 | 21.93 | 41.71 |
| 2018/2019 | 4.68 | 2.34 | 9.36 | 12.28 | 21.64 | 49.71 |
| 2017/2018 | 3.40 | 6.12 | 10.20 | 21.77 | 18.37 | 40.14 |
| 2016/2017 | 0.43 | 2.16 | 6.49 | 19.91 | 22.94 | 48.05 |
| 2015/2016 | 0.47 | 4.19 | 10.70 | 17.21 | 28.37 | 39.07 |
Table 2.
Questionnaire.
| Questions | Answers |
|---|---|
| Q1. Did you participate in online lectures? Q3. Did you participate in online exercises? | 5—Always 4—Often 3—Sometimes 2—Seldom 1—Never |
| Q2. How do you rate online lectures? Q4. How do you rate online exercises? | 5—Excellent 4—Good 3—Average 2—Poor 1—N/A |
| Q5. How often did you watch video lectures? Q6. How often did you watch videos of solved examples in MATLAB? Q7. How often did you use MATLAB Live Scripts? Q8. How often did you use online collection of solved examples? Q9. How often did you use LaTeX and JavaScript visualizations of examples? | 5—Always |
| 4—Often | |
| 3—Sometimes | |
| 2—Seldom 1—Never | |
| Q10. Which topic did you find the most difficult? Q11. Which topic did you find the easiest? Q12. Which topic did you find the most interesting? | 1. Vectors 2. Matrices 3. Determinants 4. Systems of linear equations 5. Functions of one real variable 6. Sequences, limit of a sequence 7. Limit of a function 8. Derivative of a function 9–10. Monotone, convex, and extrema 11. Sketch of the graph of the function 12. Integral calculus and its application |
Table 3.
Factor loadings.
| Question | Factor 1 | Factor 2 | Factor 3 | Factor 4 |
|---|---|---|---|---|
| Q1. Did you participate in online lectures? | 0.675 | |||
| Q2. How do you rate online lectures? | 0.734 | |||
| Q3. Did you participate in online exercises? | 0.977 | |||
| Q4. How do you rate online exercises? | 0.992 | |||
| Q5. How often did you watch video lectures? | 0.472 | |||
| Q6. How often did you watch videos of solved examples in MATLAB? | 0.945 | |||
| Q7. How often did you use MATLAB Live Scripts? | 0.926 | |||
| Q8. How often did you use online collection of solved examples? | 0.717 | |||
| Q9. How often did you use LaTeX and JavaScript visualizations of examples? | 0.805 |
Table 4.
Frequency of usage of online materials.
| Online Material | At Least Once | Average | Average Score |
|---|---|---|---|
| Video lectures | 92.73% | 72.00% | 3.60 |
| MATLAB video tutorials | 65.45% | 58.20% | 2.91 |
| MATLAB Live Scripts | 58.18% | 49.20% | 2.46 |
| Online collection of solved examples | 77.27% | 55.80% | 2.79 |
| Visualizations of examples | 90.00% | 67.60% | 3.38 |
Publisher’s Note: MDPI stays neutral with regard to jurisdictional claims in published maps and institutional affiliations. |
© 2021 by the authors. Licensee MDPI, Basel, Switzerland. This article is an open access article distributed under the terms and conditions of the Creative Commons Attribution (CC BY) license (https://creativecommons.org/licenses/by/4.0/).
Share and Cite
MDPI and ACS Style
Pócsová, J.; Mojžišová, A.; Takáč, M.; Klein, D. The Impact of the COVID-19 Pandemic on Teaching Mathematics and Students’ Knowledge, Skills, and Grades. Educ. Sci. 2021, 11, 225. https://doi.org/10.3390/educsci11050225
AMA Style
Pócsová J, Mojžišová A, Takáč M, Klein D. The Impact of the COVID-19 Pandemic on Teaching Mathematics and Students’ Knowledge, Skills, and Grades. Education Sciences. 2021; 11(5):225. https://doi.org/10.3390/educsci11050225
Chicago/Turabian StylePócsová, Jana, Andrea Mojžišová, Michal Takáč, and Daniel Klein. 2021. "The Impact of the COVID-19 Pandemic on Teaching Mathematics and Students’ Knowledge, Skills, and Grades" Education Sciences 11, no. 5: 225. https://doi.org/10.3390/educsci11050225
Note that from the first issue of 2016, this journal uses article numbers instead of page numbers. See further details here.