1. Introduction
The folding process—the process by which a protein adopts a conformation which supports biological activity—is primarily driven by optimization of non-binding interactions. In some proteins (particularly extracellular ones) covalent bonds between Cys residues, i.e., disulfide bonds, must also be taken into account. The main purpose of such bonds is structural stabilization. Hydrophobic interactions, resulting in the emergence of the hydrophobic core, also tend to exert a stabilizing influence upon tertiary protein structure.
The stabilizing role of disulfide bonds is well known [
1,
2]. Formation of structures which include disulfide bonds is significantly more complicated than in the case of polypeptide chains where such bonds are absent. From a chemical point of view, the former case calls for additional redox reactions. Not all Cys residues in the chain participate in SS bonds. A detailed study of the generation of disulfide bonds in BPTI (Bovine Pancreatic Trypsin Inhibitor) can be found in [
3]. The authors show that in BPTI folding does not proceed by way of simple sequential formation of the native SS-bonds system. Rather, the process follows a more complicated path which includes selection of a particular S-S pair from among many possible alternatives. On the one hand, the native structure may reinforce the correct set of S-S bonds, while on the other hand it may act as an inhibitor of the desired Cys/Cys combination by directing Cys residues towards the central part of the protein body, as observed in BPTI. For this reason, BPTI is regarded as a good study subject in the analysis of disulfide bond formation process. Reduction of SS bonds in BPTI causes immediate unfolding of the entire molecule, which implies that its tertiary conformation is thermodynamically linked.
Another interesting protein (in the context of disulfide bonds) is disulfide isomerase which catalyzes oxidative protein folding
in vivo. In order to fulfill its biological role it requires access to buried thiol residues which it rearranges in stable folding intermediates (necessitating prior unfolding of these intermediates) [
4].
The two domains of microcollagen-1, despite sharing an identical cysteine pattern, form differing SS bond systems and therefore adopt different conformations. The N-terminal domain, while sequentially identical to the C-terminal domain, folds in a different fashion [
5].
Despite unequivocal evidence of the stabilizing role of SS bonds their actual role seems varied. A fitting example is provided by a pair of proteins from the toxin subfamily, both of which exhibit similar folds and contain four SS bridges. Reduction of the fourth bridge in one protein molecule affects its 3D structure altering the status of two stranded beta sheets from twisted to non-twisted. Reduction of the corresponding bridge in the other molecule does not affect its 3D structure despite high structural similarity [
6].
This work discusses the status of disulfide bonds in the context of hydrophobic interactions. If the idealized hydrophobic core is modeled by a 3D Gaussian, we can assess to what degree actual proteins conform to theoretical predictions. Such quantitative assessment bases on ullback–Leibler’s divergence entropy criterion which expresses the relative distance between theoretical and empirical distributions and therefore reflects the structural ordering of the hydrophobic core, which is regarded as a stabilizing factor [
7,
8]. The divergence entropy formula can also be successfully applied to individual fragments of the polypeptide chain, including fragments bounded by Cys residues which participate in SS bonds [
9,
10]. It turns out that such fragments may either (1) reinforce the hydrophobic core structure by conforming to theoretical predictions regarding hydrophobicity density distribution, or (2) counteract stabilization of the chain by diverging from the FOD (Fuzzy Oil Drop) model. We may thus speculate that in the former case reduction of disulfide bonds should not significantly affect structural stability, while in the latter case reduction may result in major structural rearrangement as the stabilizing factor (
i.e., the SS bond) is removed. An open issue concerns the relation between nonbinding interactions (whose optimization is expected to guide the folding process towards the native conformation) and processes which result in the creation of a hydrophobic core. In many cases such processes reinforce each other, producing a structure which is stabilized both by nonbinding interactions and by hydrophobic effects. In some cases, however, the opposite is true—no stable hydrophobic core emerges and fragments linked by SS bonds do not conform to the idealized hydrophobicity density distribution model.
Analysis of arbitrarily selected enzymes in which the status of fragments bounded by SS-forming Cys residues varies is a step towards determining the relations between both factors in the context of tertiary structural stabilization. In the presented model disulfide bonds are regarded as additional constraints, reducing the degree of structural freedom and therefore enforcing a specific conformation. Covalent bonds cause the protein structure to become more rigid and less adaptable to external stimuli, including the presence of water. On the other hand, the hydrophobic core is a natural response to immersion in an aqueous environment. Under ideal conditions all hydrophobic residues should be encapsulated deep within the protein body while hydrophilic residues should be exposed on its surface. Departures from this principle are often linked to biological activity (ligand/substrate binding or protein/membrane complexation) while additional SS bonds stabilize structures in which hydrophobicity density distribution differs from theoretical expectations—e.g., when a strongly hydrophobic loop is found on the surface or a binding cavity is present.
The Fuzzy Oil Drop Model as an Expression of the Hydrophobic Stability of Proteins
The fuzzy oil drop (FOD) model is a modification of Kauzmann’s oil drop paradigm [
11]. The model likens the folding of a polypeptide chain to the behavior of a drop of oil immersed in an aqueous environment where the contact surface between the hydrophobic substance (oil) and the polar environment (water) is minimized. In proteins hydrophobic residues are shielded from contact with water by migrating to the center of the protein body, while hydrophilic residues are exposed on the surface. The fuzzy oil drop model introduces a quantitative description of this process, representing the resulting hydrophobicity density distribution with a 3D Gaussian. Values of this function peak at the geometric center of the molecule and decrease along with distance from the center, reaching almost 0 on the surface. The distance between the center of the molecule and its surface is expressed using the three-sigma rule in each principal direction, yielding three coefficients: σ
x, σ
y and σ
z. The molecule can thus be encapsulated in an ellipsoid, enabling us to compute theoretical hydrophobicity density at any point within this virtual “capsule”. Of course, actual (empirical) distribution of hydrophobicity density differs from theoretical expectations since it depends on the placement of each residue in the protein body as well as on its intrinsic hydrophobicity. Residues are assumed to interact with one another if their separation is below 9 Å (the assumed cutoff distance for hydrophobic interactions). Both theoretical and observed hydrophobicity density values are computed for the so-called effective atoms (averaged-out positions of all atoms belonging to the given residue).
The above procedure produces a list where each residue (represented by its effective atoms) is described by the following parameters: (1) intrinsic hydrophobicity (conforming to a predetermined scale); (2) expected hydrophobicity as represented by the idealized distribution; (3) observed hydrophobicity which depends on local interactions; (4) boundary hydrophobicity—another theoretical quantity calculated under the assumption that no hydrophobicity concentration exists at any point in the molecule.
The theoretical hydrophobicity distribution constitutes a limit case where the molecule is assumed to conform to the theoretical model with perfect accuracy, exhibiting a well-defined hydrophobic core along with a hydrophilic sheath which shields the core from contact with water. The other limit case corresponds to the “flat” hydrophobicity distribution profile, with equal values throughout the entire protein body. In mathematical terms these distributions can be expressed as follows.
1.1.1. Theoretical Distribution
is the theoretical hydrophobicity density (hence the t designation) at the j-th point in the protein body. correspond to the peak of the Gaussian in each of the three principal directions, while denote the range of arguments for each coordinate system axis. These coefficients are selected in such a way that 99% of the Gaussian’s integral is confined to a range of . Accordingly, values of the distribution can be assumed to equal 0 beyond this range.
The above distribution is discretized using positions of effective atoms. This distribution is called T in this paper.
1.1.2. Observed Distribution
Observed distribution (as proposed by Levitt [
12]):
is the number of amino acids in the protein,
expresses the hydrophobicity parameter of the
i-th residue while
rij expresses the distance between two interacting residues (
j-th effective atom and
i-th effective atom).
c expresses the cutoff distance for hydrophobic interactions, which is taken as 9 Å (following [
12]). Observed hydrophobicity density values
are also computed for effective atoms (geometric center of each side chain). Observed hydrophobicity distribution is called
O in this paper.
The coefficient, representing the aggregate sum of all components, is required to normalize the distribution and enable meaningful comparisons between the observed and theoretical hydrophobicity density distributions.
1.1.3. Unified Distribution
N is the number of amino acids in the chain.
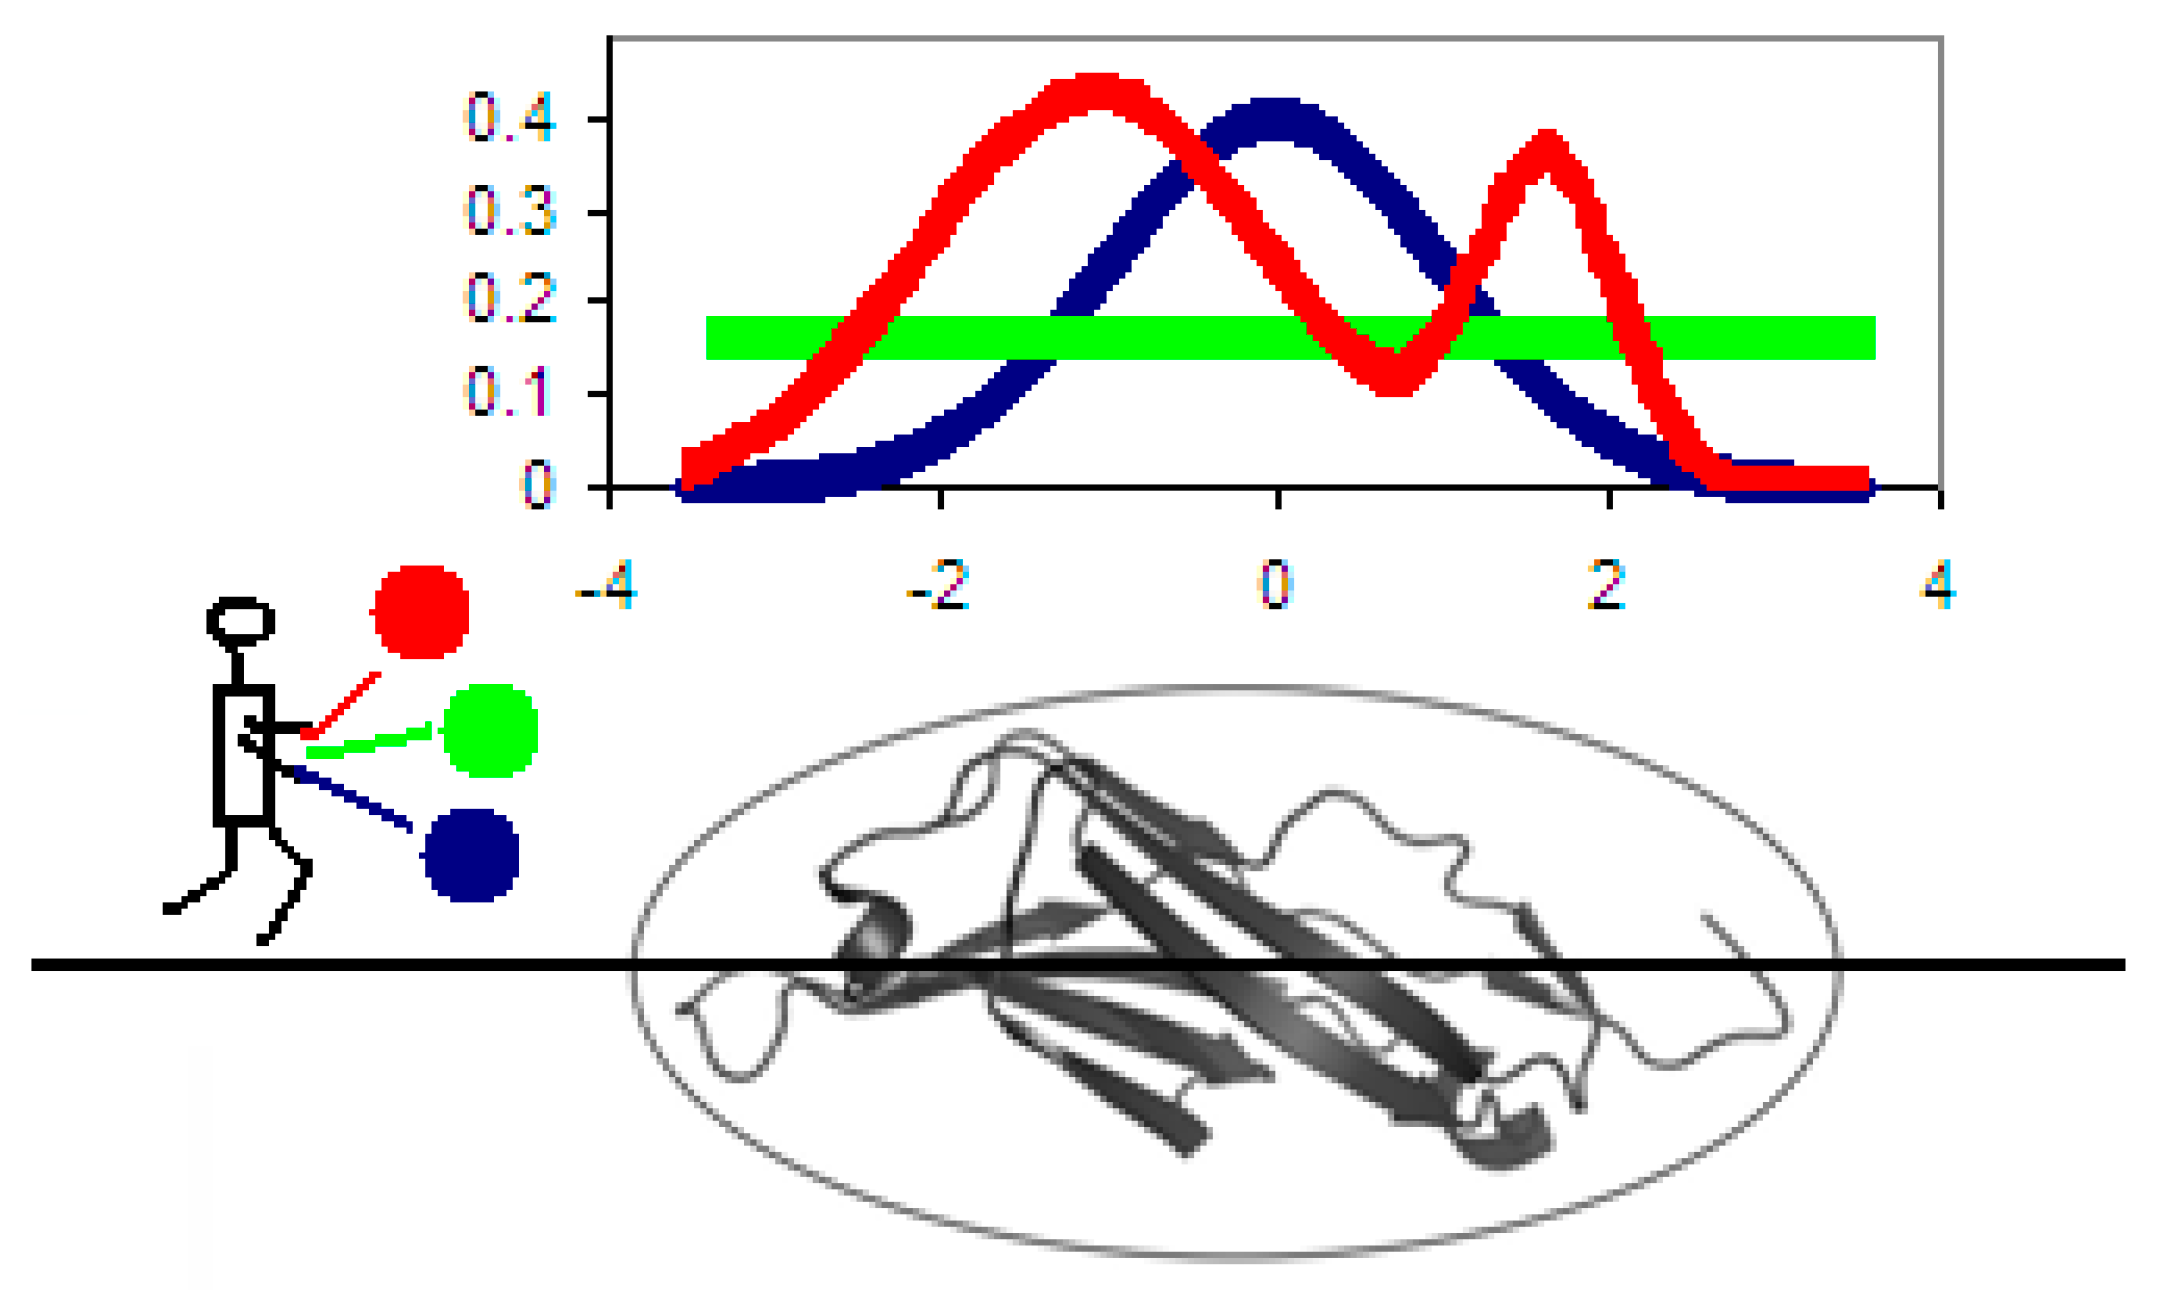
Figure 1 provides a graphical depiction of the model. Each residue represents equal hydrophobicity density producing the protein molecule deprived of any form of core—concentration of hydrophobicity in any place in the protein body. This distribution is called
R in this paper. Imagine three microscopic hydrophobicity density detectors traversing the protein molecule along a predetermined axis. The first detector measures theoretical density (readings shown in dark blue); the second one measures actual density which depends on the intrinsic hydrophobicity and placement of each residue (readings shown in red) while the third detector outputs a static reading, determined purely by the number of residues in the chain (readings shown in green). While all distributions shown in the figure (
T,
O and
R) are continuous (in the mathematical sense), our analysis focuses on discrete values computed for each effective atom.
1.1.4. Kullback–Leibler Entropy to Measure the Differences Between Distributions
Another important issue concerns the degree of similarity between the empirical and idealized distribution (perfect hydrophobic core) as well as between the empirical and static distribution (no hydrophobic core present). Quantitative assessment of these parameters bases on Kullback–Leibler’s divergence entropy formula [
13]:
The value of DKL expresses the distance between two distributions: target distribution (p0) and analyzed distribution (p). In the fuzzy oil drop model the target distribution (T) is given by the 3D Gaussian while the observed distribution is denoted as O.
For the sake of simplicity we introduce the following notation:
DKL (O/T) expresses the “distance” between both distributions. The more divergent the distributions, the greater the value of
DKL. This value cannot, however, be interpreted directly since it depends on the number of points (chain length). Moreover,
DKL is a measure of entropy and must be compared to a reference value. In order to facilitate meaningful comparisons we introduce another boundary distribution, opposite to the idealized one—the so-called unified distribution (denoted
R) which corresponds to a situation where each effective atom possesses the same hydrophobicity density (
Ri = 1/
N for each
i, where
N is the number of residues in the chain). The distance between the observed distribution and the unified distribution is therefore given as:
Comparing
O/T and
O/R tells us whether the given protein more closely approximates the theoretical (
O/T) or unified (
O/R) distribution. Proteins for which
O/T >
O/R are regarded as lacking a well-defined hydrophobic core. To further simplify matters we introduce the following relative distance criterion:
Here, RD < 0.5 indicates the presence of a hydrophobic core.
1.1.5. Summary of the Model
It should be noted that
RD may also be calculated for a selected fragment of the polypeptide chain—for example a fragment which corresponds to a known secondary fold (helix, beta strand, loop
etc.) or a disordered fragment [
9]. This, however, requires normalization (rescaling) of H
t, H
o and H
r (hydrophobicity yielded by distribution
R) so that the sum of all values assigned to a given section is equal to 1. In this work, in addition to assessment of known secondary structural folds we have also analyzed fragments bounded by disulfide bond attachment points. Our aim was to determine the degree to which a given structure is stabilized by SS bonds and assess the involvement of a well ordered hydrophobic core in structural stabilization.
It should be noted that the value of RD (1D representation) calculated for the red distribution is only 0.215, which means that—at least in the presented case—the observed hydrophobicity profile (restricted to a single axis) approximates the theoretical distribution with high accuracy, and that therefore the molecule contains a well-defined hydrophobic core (along with an encapsulating hydrophilic sheath). The presented RD value means that the observed distribution lies much “closer” to the theoretical distribution (blue line) than to the unified distribution (green line).
A detailed description of the fuzzy oil drop model can be found in [
8]—here we limit ourselves to a brief recapitulation of the model’s core concepts.
This work assesses the status of polypeptide chain fragments stabilized by disulfide bonds in the context of their conformance to the fuzzy oil drop model. We base our research on a set of enzymes, focusing on catalytic residues as well as residues involved in binding ligands or mediating protein complexation.
3. Results and Discussion
The status of sections bounded by Cys residues which form SS bonds is summarized in
Table 2. The table lists the status of the entire protein molecule (or domain, where appropriate) in relation to the status of its Cys-bounded fragments.
As can be seen, the relationship between the status of the entire molecule and its SS-bounded fragments varies. Below we discuss examples of proteins from each category.
3.1. Hydrophobic Core Supported by a System of Disulfide Bonds
An example of a protein which conforms to the idealized hydrophobicity density distribution model is provided by a single chain of the 1QLL homodimer—phospholipase (a neurotoxin; source:
Bothrops pirajai) [
14].
Local participation of catalytic residues in the hydrophobic core may be determined by calculating
RD values for a chain from which such residues have been excised. In the case of 1QLL this operation reduces the value of
RD (NoE in
Table 2) which means that catalytic residues generally diverge from the idealized distribution—as seen in
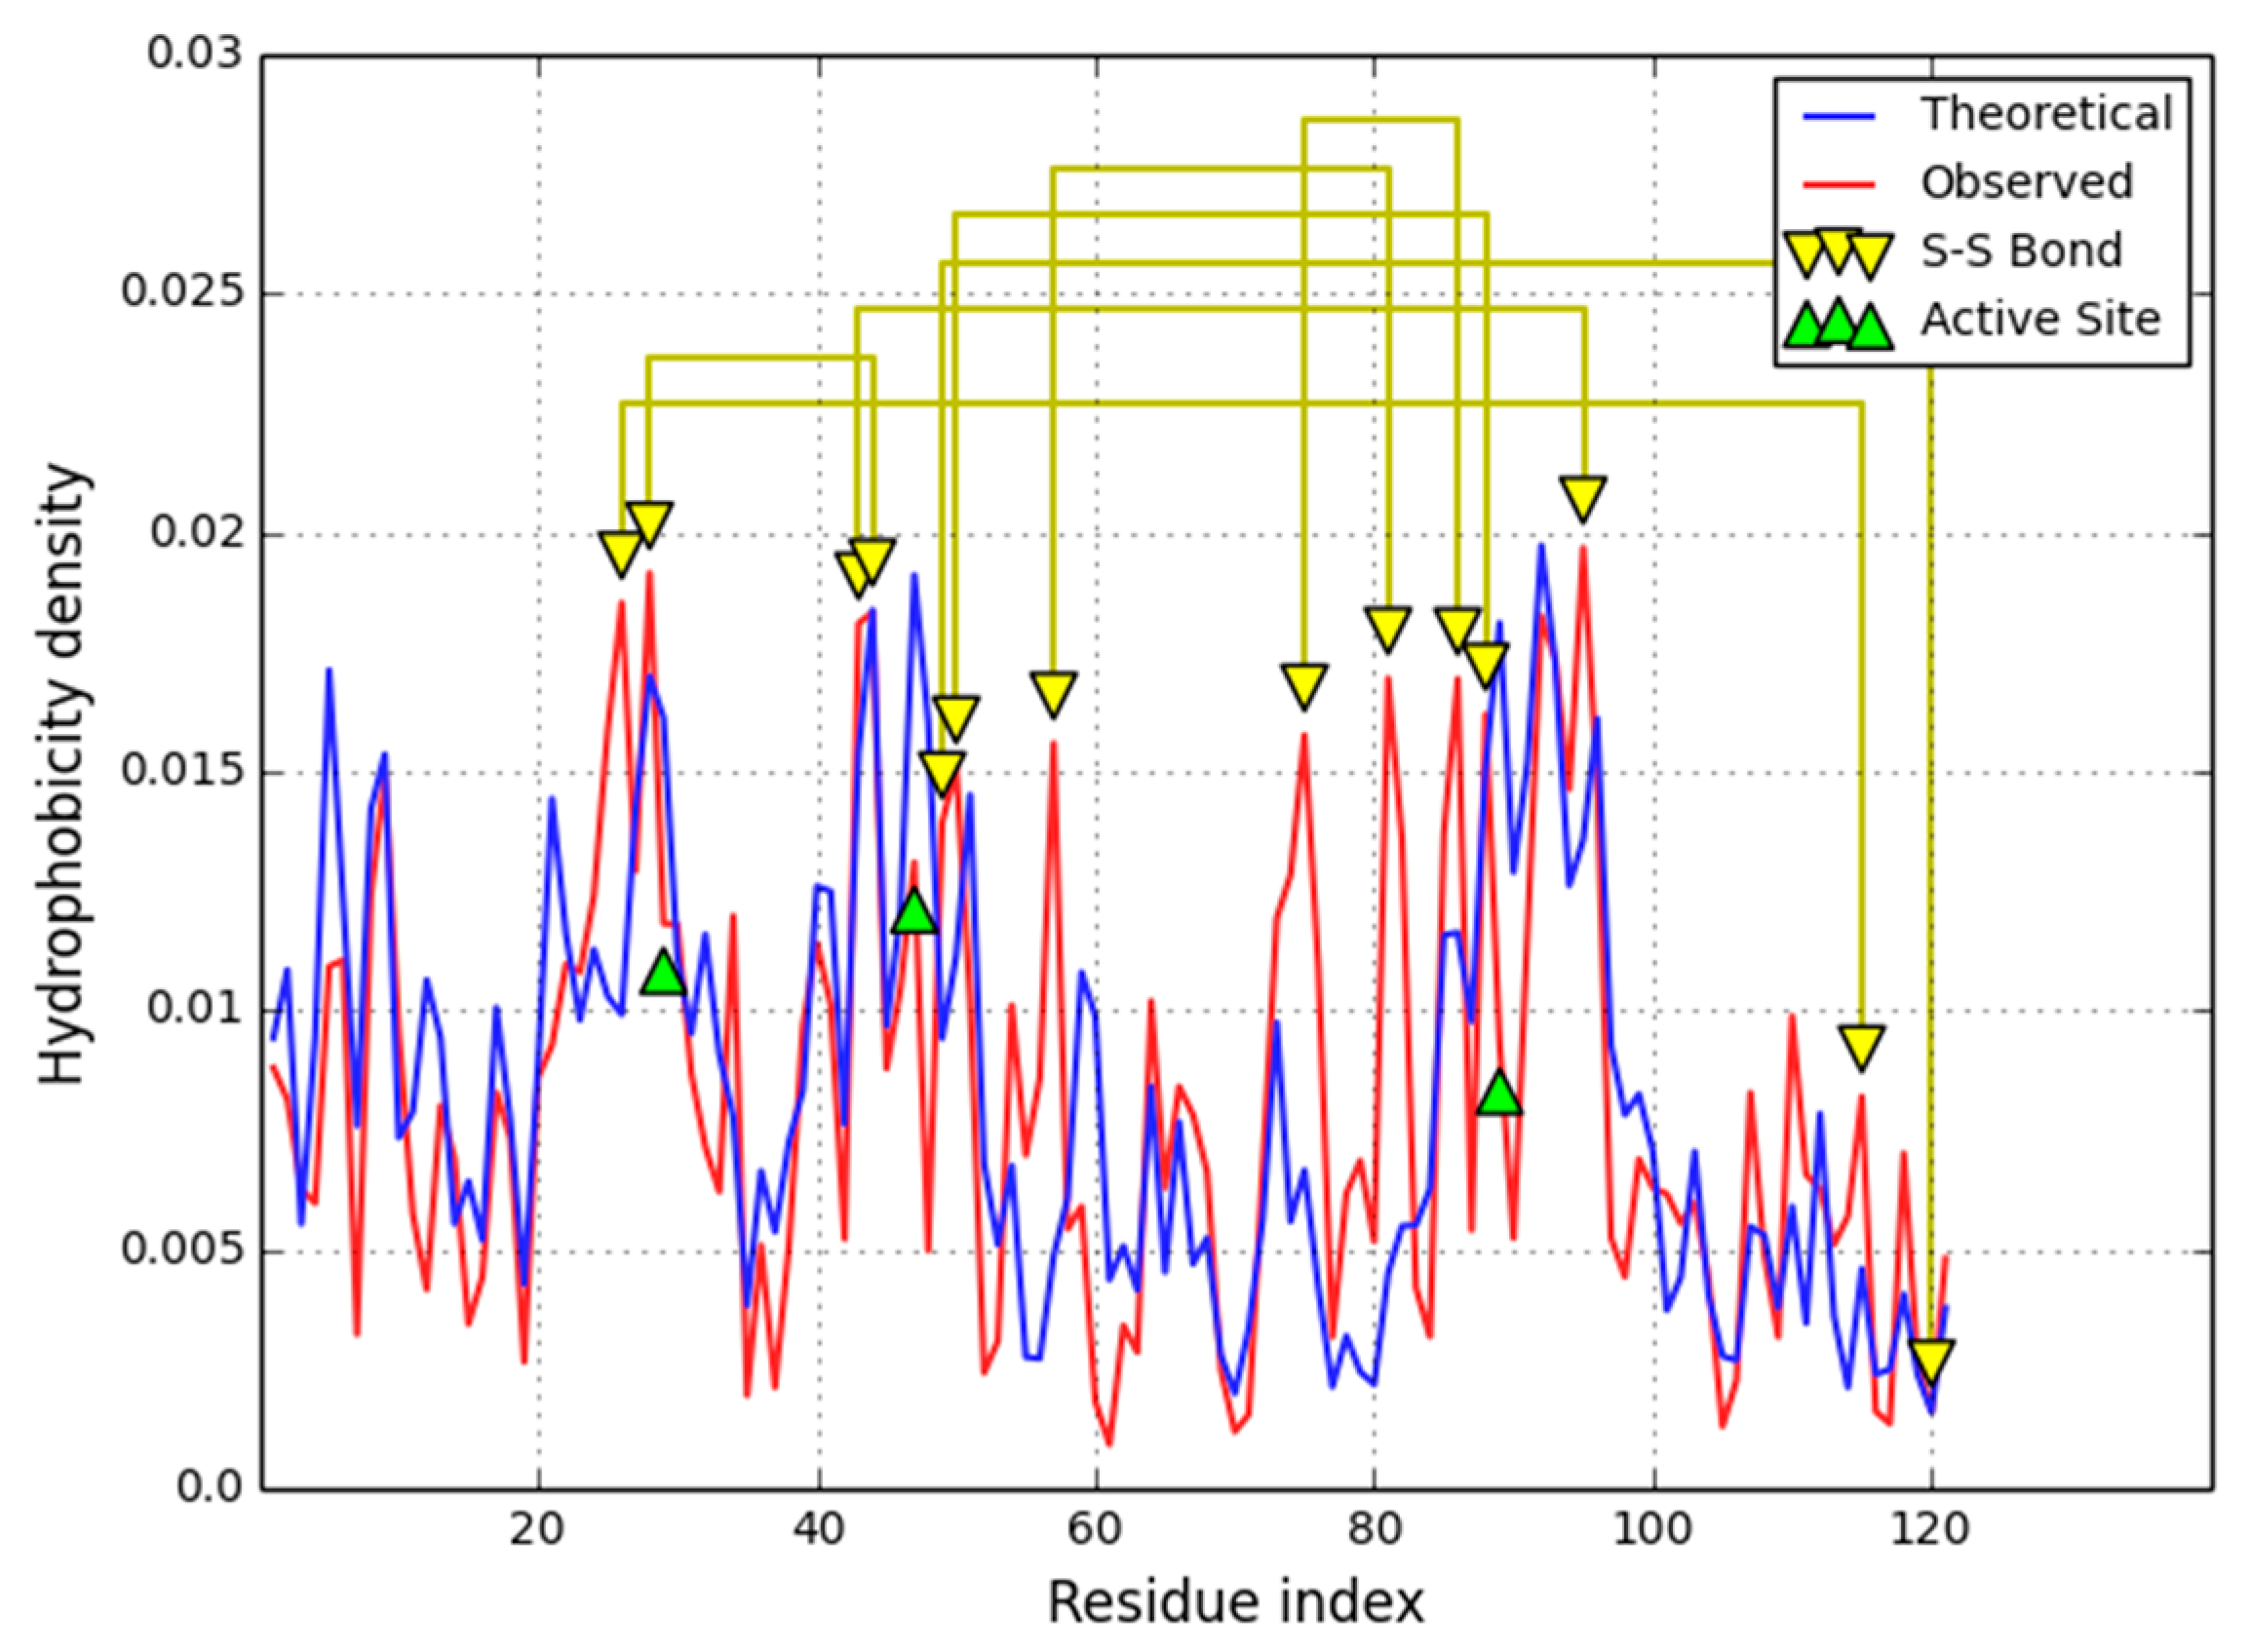
Figure 2. This property is shared by catalytic residues in most proteins.
Excision of residues involved in binding ligands (NoL in
Table 3) and mediating inter-chain interactions (NoP-P in
Table 3) does not appreciably affect
RD. This suggests that ligand binding and protein complexation do not require major rearrangements within the protein’s hydrophobic core. 1QLL’s ligand (tridecanoid acid) is bound on the surface of the protein and does require a specific cavity, while residues involved in P-P complexation are mostly hydrophilic—indicating that dimerization of 1QLL is driven primarily by electrostatic forces with scant involvement of hydrophobic effects. The inter-chain interface is comprised mostly of hydrophobic residues and does not produce a common hydrophobic core for the complex as a whole.
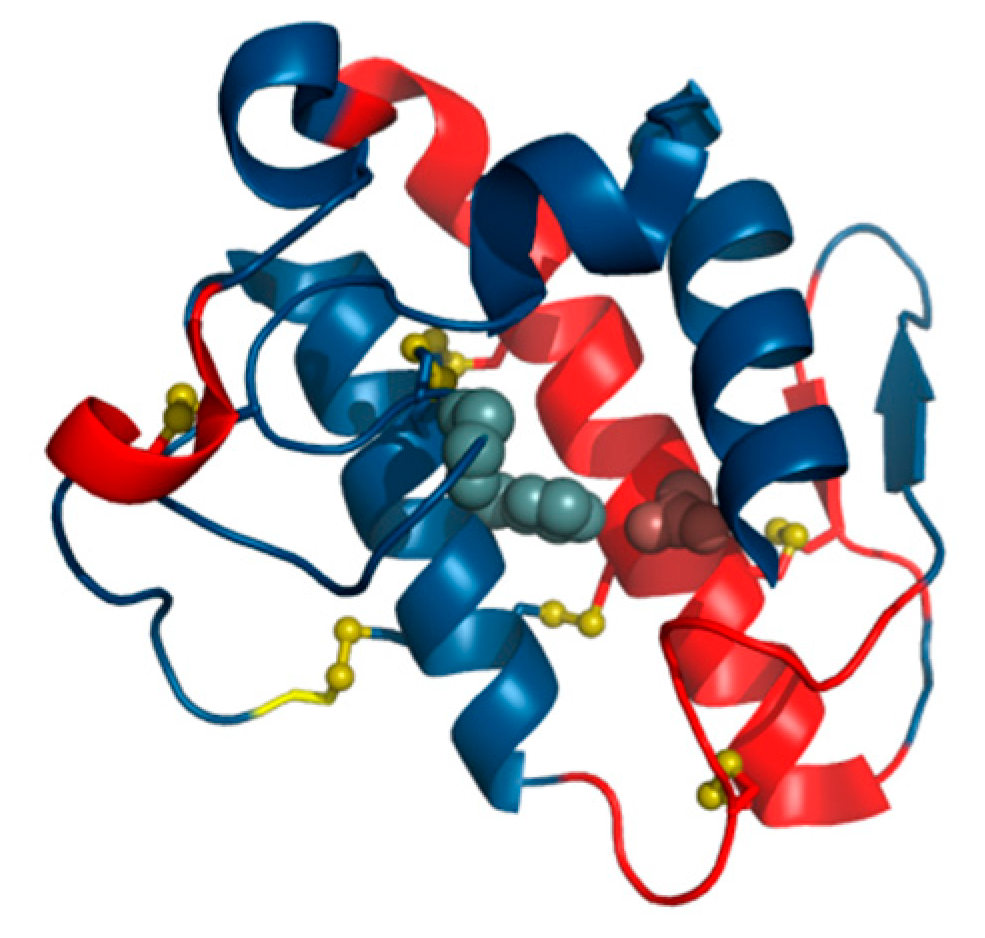
The status of individual secondary folds in 1QLL varies, despite the fact that the protein as a whole conforms to the fuzzy oil drop model (
Figure 3). Divergent fragments include the loop at 54–64, the beta-helix-helix system at 72–103 and the helix at 100–103. Of particular note is the 72–103 fragment which includes a catalytic residue (although the beta sheet taken as a whole appears to match the idealized hydrophobicity density distribution profile).
The main focus of our analysis are fragments defined by the placement of Cys residues which form disulfide bonds. As it turns out, all such fragments conform to the fuzzy oil drop model. Cys residues are generally expected to migrate towards the center of the molecule as the hydrophobic core emerges—their mutual interactions may be a consequence of this phenomenon. Nevertheless, RD values remain quite high for the 72–103 fragment which includes a catalytic residue in addition to one residue responsible for ligand binding and protein interaction. We can speculate that catalysis of the substrate requires local deformations in the hydrophobicity field, which, in turn, introduce local instabilities facilitating conformational changes during catalysis. Another interesting section, 57–80, is stiffened by the presence of four SS bonds—the RD value for this section is 0.500, suggesting that hydrophobic interactions alone are not sufficient to ensure its structural stability.
We may speculate that, at least in the case of 1QLL with highly organized hydrophobic core, reduction of a disulfide bond may not result in significant conformational changes, although the local deviations from the hydrophobicity density distribution model are present.
In 1QLL we can identify several fragments for which the actual hydrophobicity density exceeds theoretical values (shown in
Figure 2). When the theoretical distribution ascribes low hydrophobicity density to a given residue, we should expect to find that residue close to the molecular surface. If the observed hydrophobicity density is greater than the corresponding theoretical value, we are dealing with an externalized hydrophobic residue. Such residues frequently mediate interaction with hydrophobic ligands or membranes (as indeed is the case in 1QLL).
3.2. Discordant Core Structure with Some Sections Defined by SS Bonds Also Discordant
The human lysozyme—O-glycosyl hydrolase (EC 3.2.1.17) [
16]—does not follow the idealized hydrophobicity density distribution model (
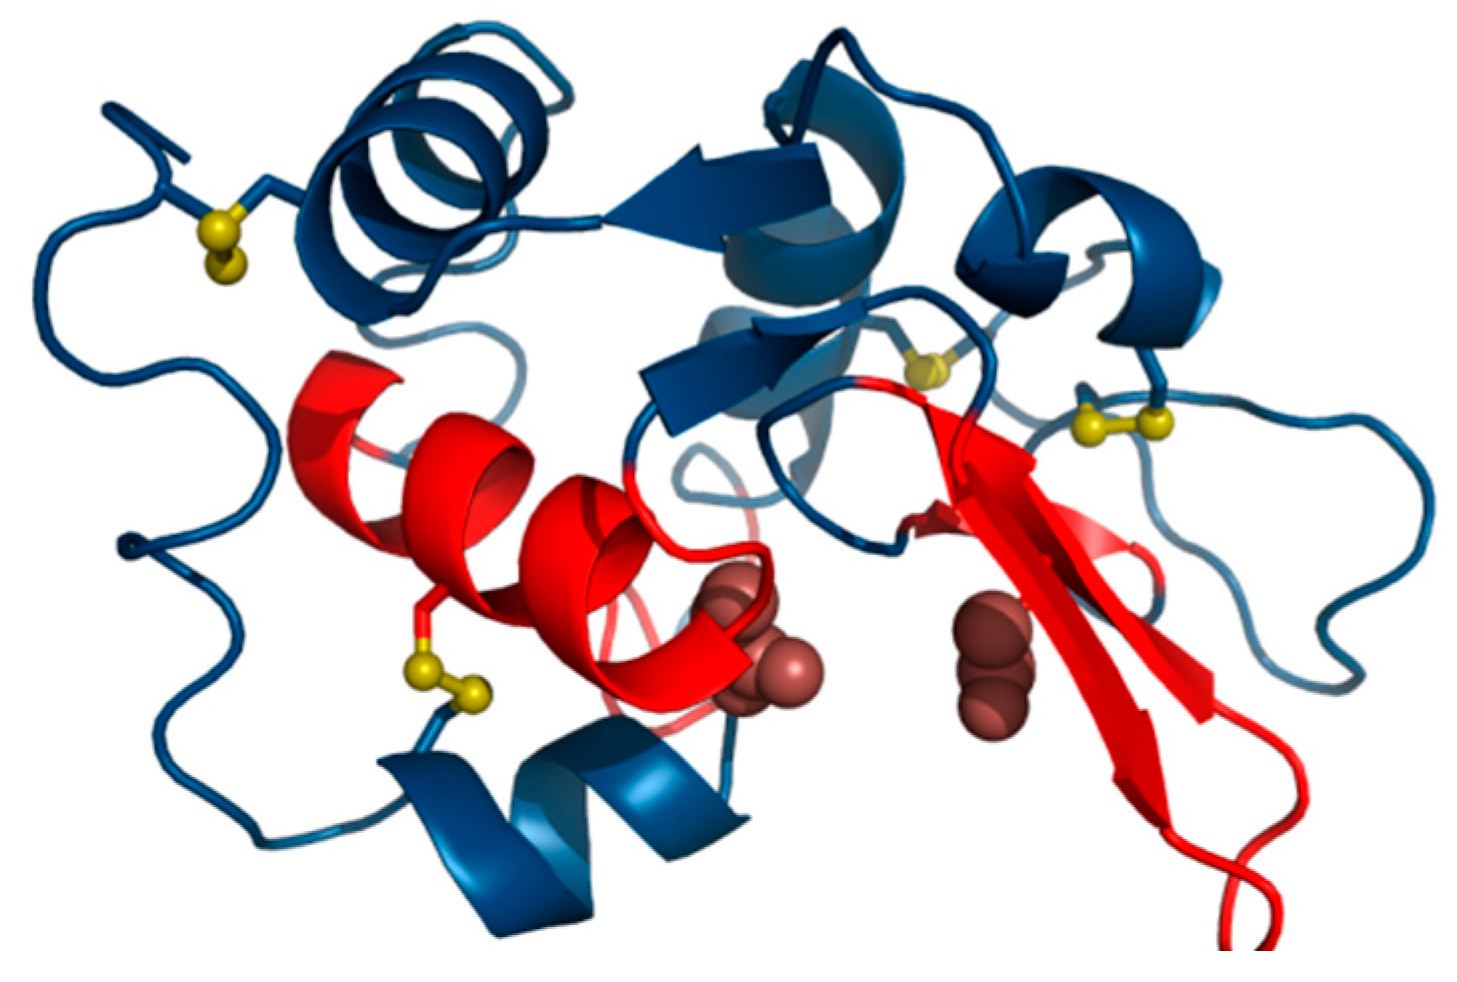
RD = 0.530). Elimination of catalytic residues brings the observed distribution closer to theoretical values, again proving that catalytic residues tend to diverge from the model. Among the secondary folds present in 1LZ1 the following are regarded as discordant: the helix at 24–37, the beta-loop-beta system at 42–55, the beta fold at 59–61 and the helix at 104–109. The beta-sheet as a whole is also discordant while all other fragments exhibit good accordance (
RD < 0.5), stabilizing the polypeptide chain in its native form. The 3D presentation of the status of secondary structural fragments is visualized in
Figure 4.
In the case of 1LZ1 all catalytic residues are surrounded by locally discordant neighbor (
Table 4). The status of fragments bounded by Cys residues which form SS bonds varies: major parts of the chain (6–128 and 30–116) remain discordant while shorter loops (65–81 and 77–95) match theoretical predictions. This suggests that the two latter bonds form spontaneously between residues brought into proximity in the process of creating a common hydrophobic core. Note that the outer SS bonds affect the placement of residues which end up participating in the inner bonds. The section at 30–65 diverges from the model.
Interpretation of the above phenomenon on the grounds of the fuzzy oil drop model suggests that poor local stabilization of the beta fragment, which includes a catalytic residue, as well as the helical fragment containing another catalytic residue, creates favorable conditions for binding and stabilizing substrates, and for the catalysis process itself. This is evidenced by the fact that the fragment bounded by Cys 30 and Cys 65 (including both catalytic residues) remains discordant from the model. Thus, both SS bonds are suspected of “enforcing” local structural instability, counteracting hydrophobic effects.
In [
22] the authors discuss the stabilizing role of selected helical fragments whose compact core can be observed even in the molten globule state, as predicted by the fuzzy oil drop model for helical fragments, with only the helix at 24–37 diverging from expectations. Other reports suggest that the lysozyme folding process occurs in stages. In particular, the alpha-helical domain is believed to fold faster than the beta-sheet domain [
23]. It was concluded in [
24] that folding does not become organized in a single cooperative event but that different parts of the structure become stabilized with very different kinetics. Alpha-helical domain folds faster than the beta-sheet domain.
The observed status of beta fragments remains in good correspondence with the empirically determined role of each fragment of the human lysozyme [
25].
3.3. Accordant Core Structure with All Sections Defined by SS Bonds Discordant
An example of this category is provided by human isomerase disulfide (EC 5.3.4.1) (1MEK) which contains a single, peculiar disulfide bond [
14]. The bond spans a very short section—just 4 residues, all of which are enzymatically active. Our analysis focuses on the N-terminal domain of this four-domain protein. Experimental studies indicate that its constituent domains are loosely linked (with just one inter-domain SS bond) and that the resulting conformation exhibits high flexibility [
26].
The domain under consideration as a whole follows the hydrophobicity density distribution model with good accuracy (
Table 5.). It comprises a beta sheet whose
RD value is 0.314, even though one of its constituent parts remains discordant (
RD = 0.503). Significant discordance is also observed for loops which include enzymatic residues. Elimination of catalytic residues from
RD calculations brings the remainder of the molecule closer to the idealized distribution.
Analysis of secondary structural folds reveals that discordant sections of the molecule include most of its loops, with all of them exhibiting higher-than-expected hydrophobicity density (
cf. Figure 5). These loops are all exposed on the surface of the molecule and can therefore be suspected of interacting with other hydrophobic molecules (or proteins). All beta folds and helixes remain highly accordant with the model and, together, form a compact hydrophobic core, with only the beta fragment at 9–12 slightly exceeding our classification threshold.
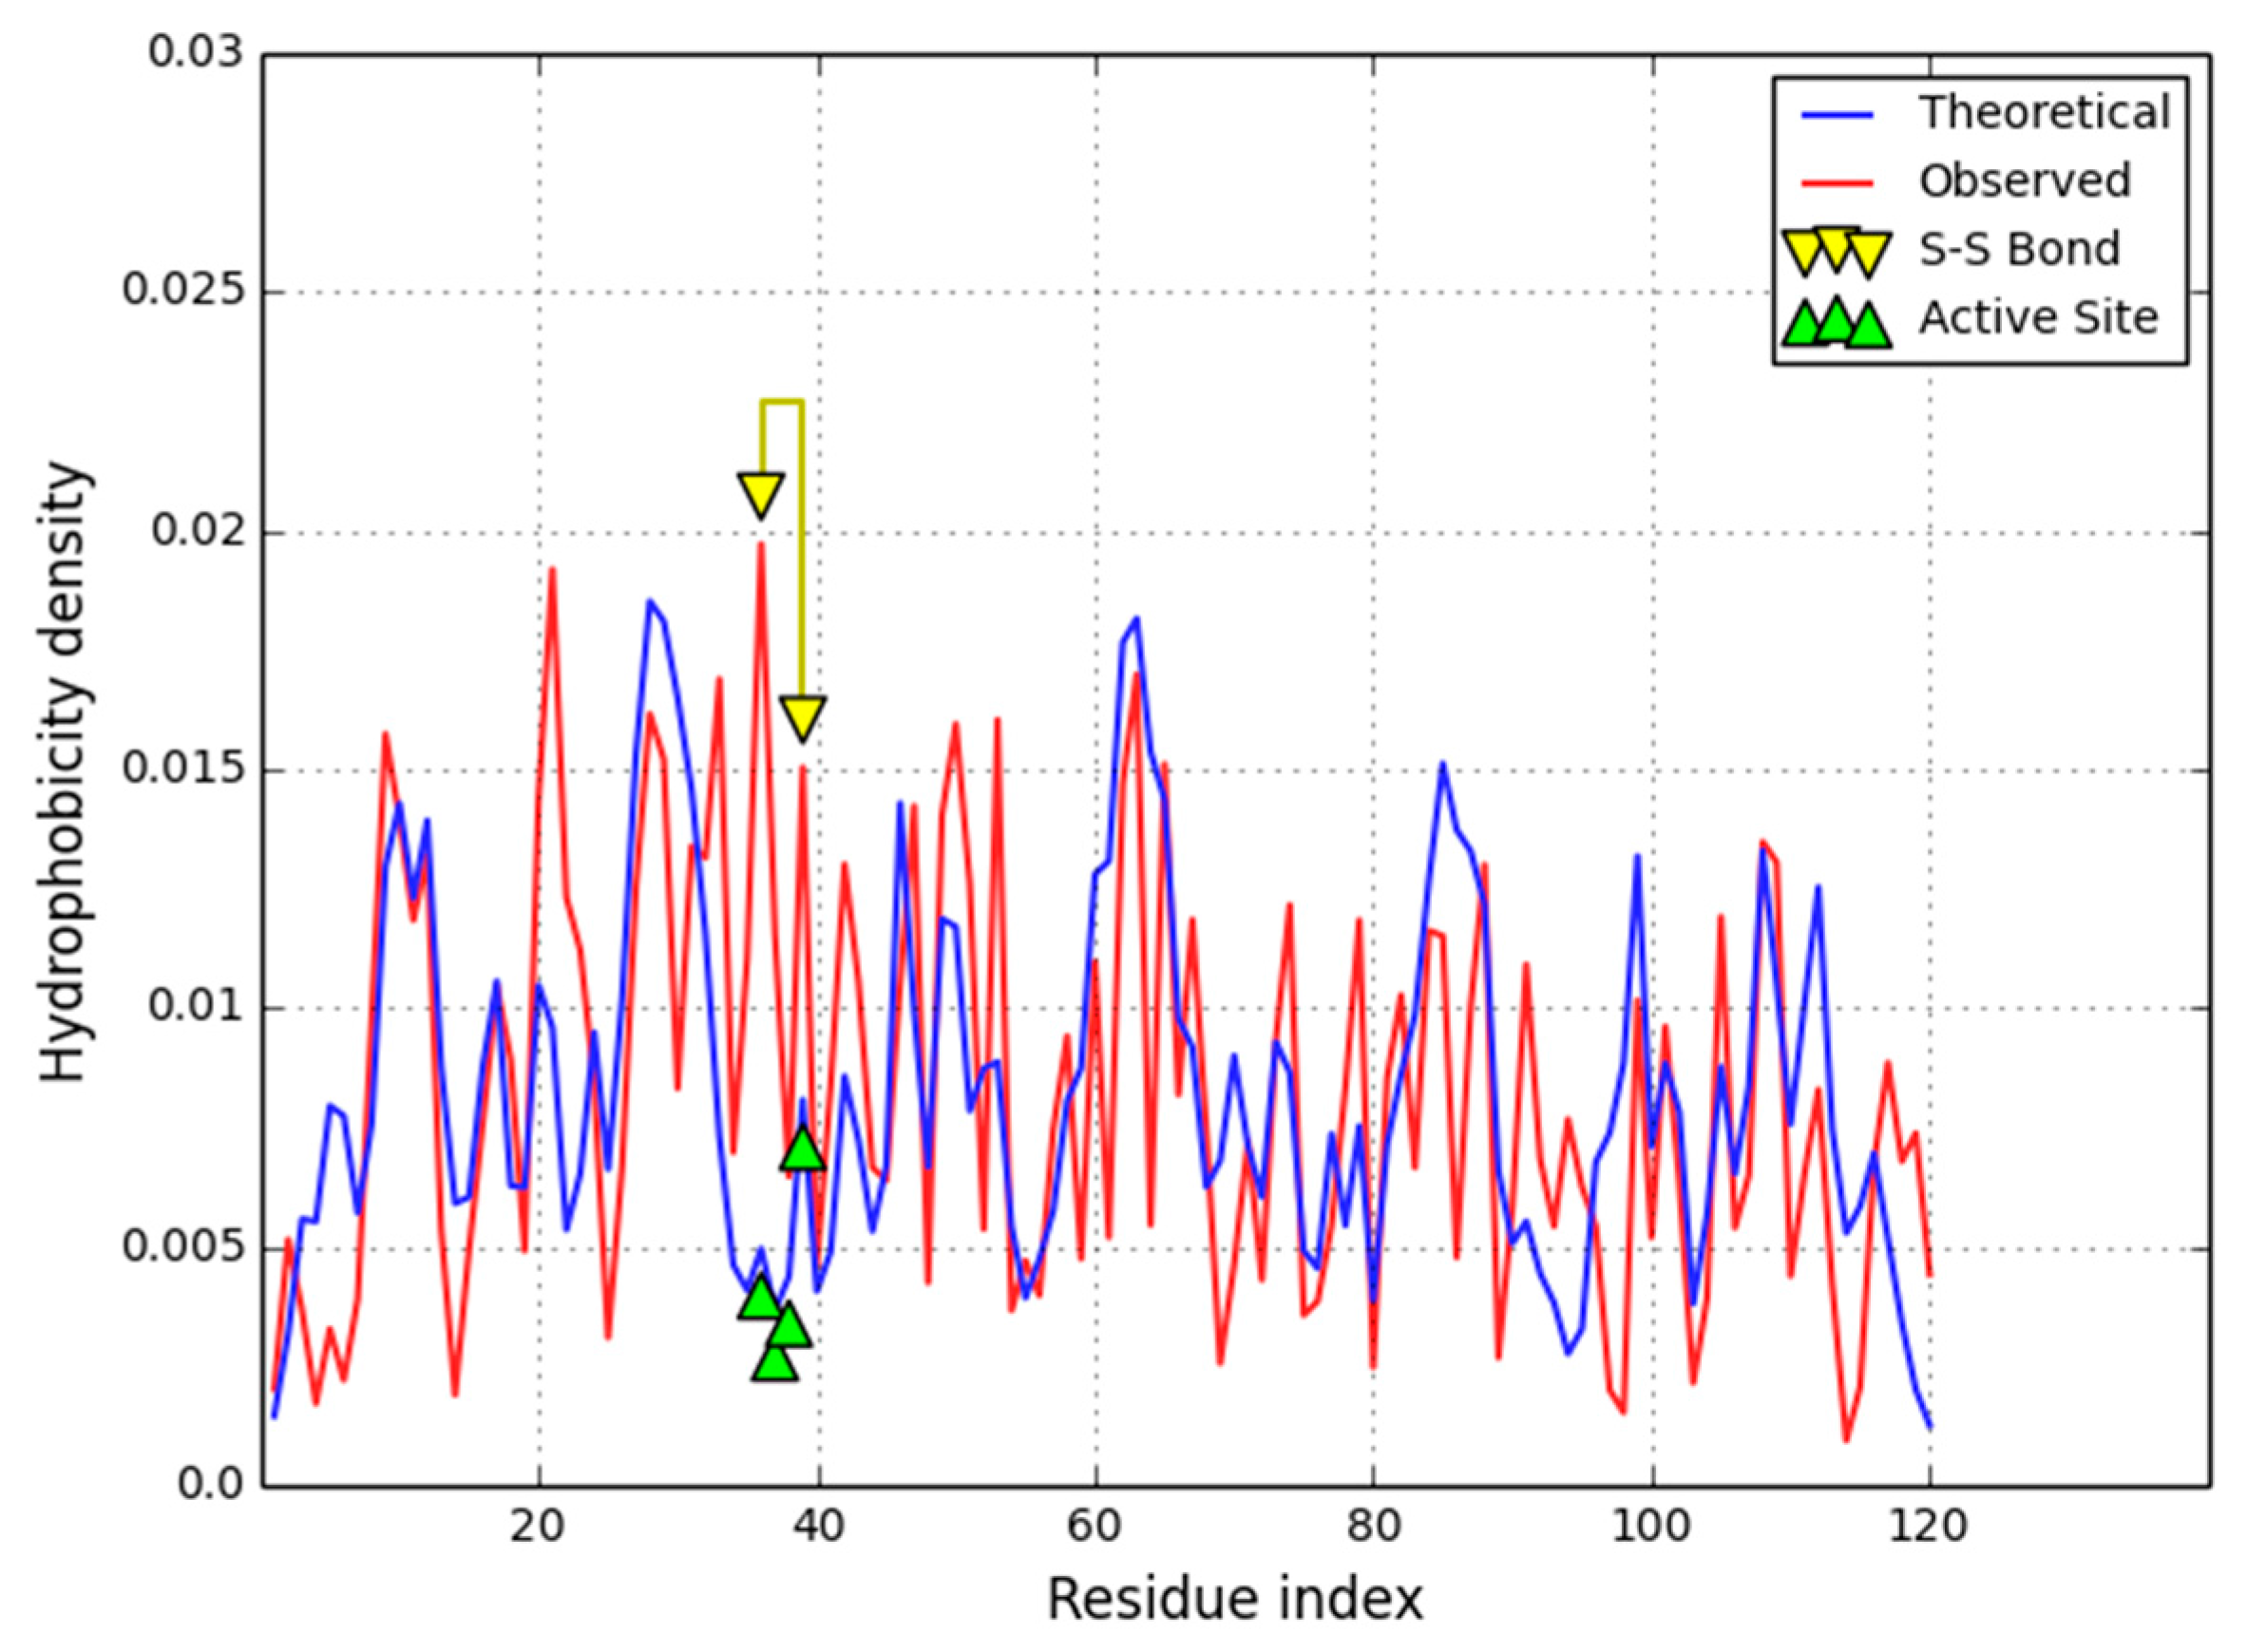
Figure 5 shows a section bounded by two Cys residues which form an SS bond (36–39). This section includes catalytic residues whose hydrophobicity density diverges from idealized values.
The loops at 91–96 and 115–120 are both exposed on the surface where no strong concentration of hydrophobicity is expected. Not much information is available regarding this enzyme’s interaction properties—we can only speculate that the observed discrepancy, as seen in
Figure 5, indicatesa potential ligand binding site or protein complexation site.Comparison with the four-domain yeast isomerase structure (3BOA—[
27]) excludes involvement of the analyzed fragments in inter-domain interactions.
3.4. Multi-Domain Enzyme with Variable Number of Disulfide Bonds in Each Domain
Human serine protease (EC 2.7.10.1) [
19] has been selected as an example of a multi-domain human protein, and also due to its pharmacological properties [
28]. Its constituent domains differ with respect to the number of SS bonds as well as their respective hydrophobicity density distribution profiles. Three of four domains in 1M6B diverge from the theoretical model and contain a large number of SS bonds (four in D1, seven in D2 and seven in D4). Domain 3 is the only one which remains accordant model—notably, it contains only two SS bonds.
According to CATH 3.80.20.20, domain D1 represents the Alpha-Beta Horseshoe architecture. Its disulfide bonds link loose fragments of the chain which do not participate in the ordered horseshoe conformation. It seems that SS bonds stabilize fragments not otherwise stabilized by nonbinding interactions (
Table S1 in Supplementary Material). As such, these bonds are not directly related to the structure of the domain’s hydrophobic core.
Domain D2 is classified (CATH 2.10.220.10) as a Beta Ribbon. Its loosely packed structure is made up of beta folds interspersed with locally disordered fragments. The overall conformation of the domain is stabilized by SS bonds which support a complex system of small beta sheets (
Table S2 in Supplementary Material). In general, this domain is highly nonglobular and does not comprise a clear hydrophobic core (as indicated by its relatively high
RD value).
Domain D3, classified (CATH 3.80.20.20) as an Alpha-Beta Horseshoe, has a globular shape and contains a hydrophobic core (
RD < 0.5). Despite superficial similarities to D1 most secondary folds in D3 are also accordant with the model, as are its inter-SS fragments, two beta sheets and a system of helixes (
Table S3 in Supplementary Material).
Domain D4, with seven disulfide bonds, is classified (CATH 2.10.220.10) as a Beta Ribbon and exhibits a nonglobular conformation. Its high
RD value suggests strong stabilizing influence of SS bonds which link loosely packed loops. Only two of its beta sheets (consisting of two fragments each) are locally accordant with the model (
Table S4 in Supplementary Material).
Comparison of 1M6B domains points to the role of disulfide bonds as the principal stabilizer of D1, D2 and D4, while the structure of D3 owes its stability mainly to hydrophobic effects. This domain exhibits a clear hydrophobicity density distribution gradient with a well formed hydrophobic core. Much like in 1QLL, fragments bounded by SS-forming Cys residues appear to emerge as a result of conformational rearrangement leading to the creation of a hydrophobic core. Comparative analysis of D1 and D3 reveals that—despite sharing a similar topology—these domains differ significantly with respect to the stabilizing role of the hydrophobic core and disulfide bonds. Both domains are involved in binding ligands—specifically, the epidermal growth factor. Their properties suggest that the more stable (from the point of view of hydrophobicity density distribution) domain D3 serves as the static “backbone” while domain D1 retains greater elasticity, facilitating accommodation of ligand particles. This functional and structural differentiation of similar domains justifies the comparative analysis presented in our work.
Table 6 summarizes the structure of individual domains in 1M6B. Surprisingly, one domain (D3) out of two identified as adopting a horseshoe-like conformation remains accordant with the theoretical model while the other one (D1) diverges from it. This observation appears to correlate with the low number of SS-bonds in D3, suggestingthat D3 may instead be stabilized by the presence of a hydrophobic core.
3.5. Discordant Core Structure with All Sections Defined by SS Bonds Also Discordant
Significant deviations from the theoretical hydrophobicity density distribution model, both with regard to the entire molecule and fragments defined by SS bonds, are found in bovine ribonuclease—nucleic acid hydrolase (EC 3.1.27.5) [
16]. The ribonuclease is analyzed in conjunction with the angiogenin molecule (1ANG) [
17] (
Table 7), which was found to exhibit ribonuclease A activity despite structural differences in its ribonucleolytic active center and in the putative receptor center.
We may ask—to what degree are similarities in catalytic activity reflected by the core structure and SS bond system?
Table 7 provides a comparative analysis of the hydrophobic core status in both molecules and their fragments.
The structure of the hydrophobic core (which, as defined by the fuzzy oil drop model, also comprises a hydrophilic shell
Figure 6) is not evident in ribonuclease (
RD = 0.550). Elimination of catalytic residues reduces the
RD value, bringing the molecule closer to the theoretical model. Analysis of hydrophobicity density distribution profiles reveals local discrepancies, especially in the neighborhood of catalytic residues. We may speculate that this neighborhood retains structural properties which favor enzymatic activity.
Comparative analysis of two enzymes chosen due to their similar enzymatic activity suggests the significance of fragments delimited by SS-bonds (40–95 in ribonuclease and 39–92 in angiogenin respectively). These fragments are both highly discordant with respect to the fuzzy oil drop model. Notably, they both contain catalytic residues (41K in ribonuclease and 40K in angiogenin). Common characteristics can also be observed in fragments 40–58 in ribonuclease and 39–57 in angiogenin—both delimited by Cys residues engaged in SS-bonds and both highly discordant. The above-mentioned catalytic residues are also localized in these fragments.
Catalytic residues 114H in angiogenin and 119H and 120F in ribonuclease are similarly localized in a strongly discordant loop at 111–116 in angiogenin and a discordant Beta-structural fragment at 116–124 in ribonuclease respectively.
A sort of “switch” may be observed for catalytic residues 12H and 41K in ribonuclease in comparison with 13H and 30K in angiogenin. One residue from each pair is localized in a discordant neighborhood while the other one is surrounded by an accordant fragment. The observed similaritiesinenzymatic activity may be explained by the status of catalytic residues and their local neighborhoods which appear to be similar in these two enzymes.
Many studies of the folding process of ribonuclease have been published over the years, including Anfisen’s seminal experiment [
29] which proves that, in the presence of disulfide isomerase, ribonuclease quickly achieves full
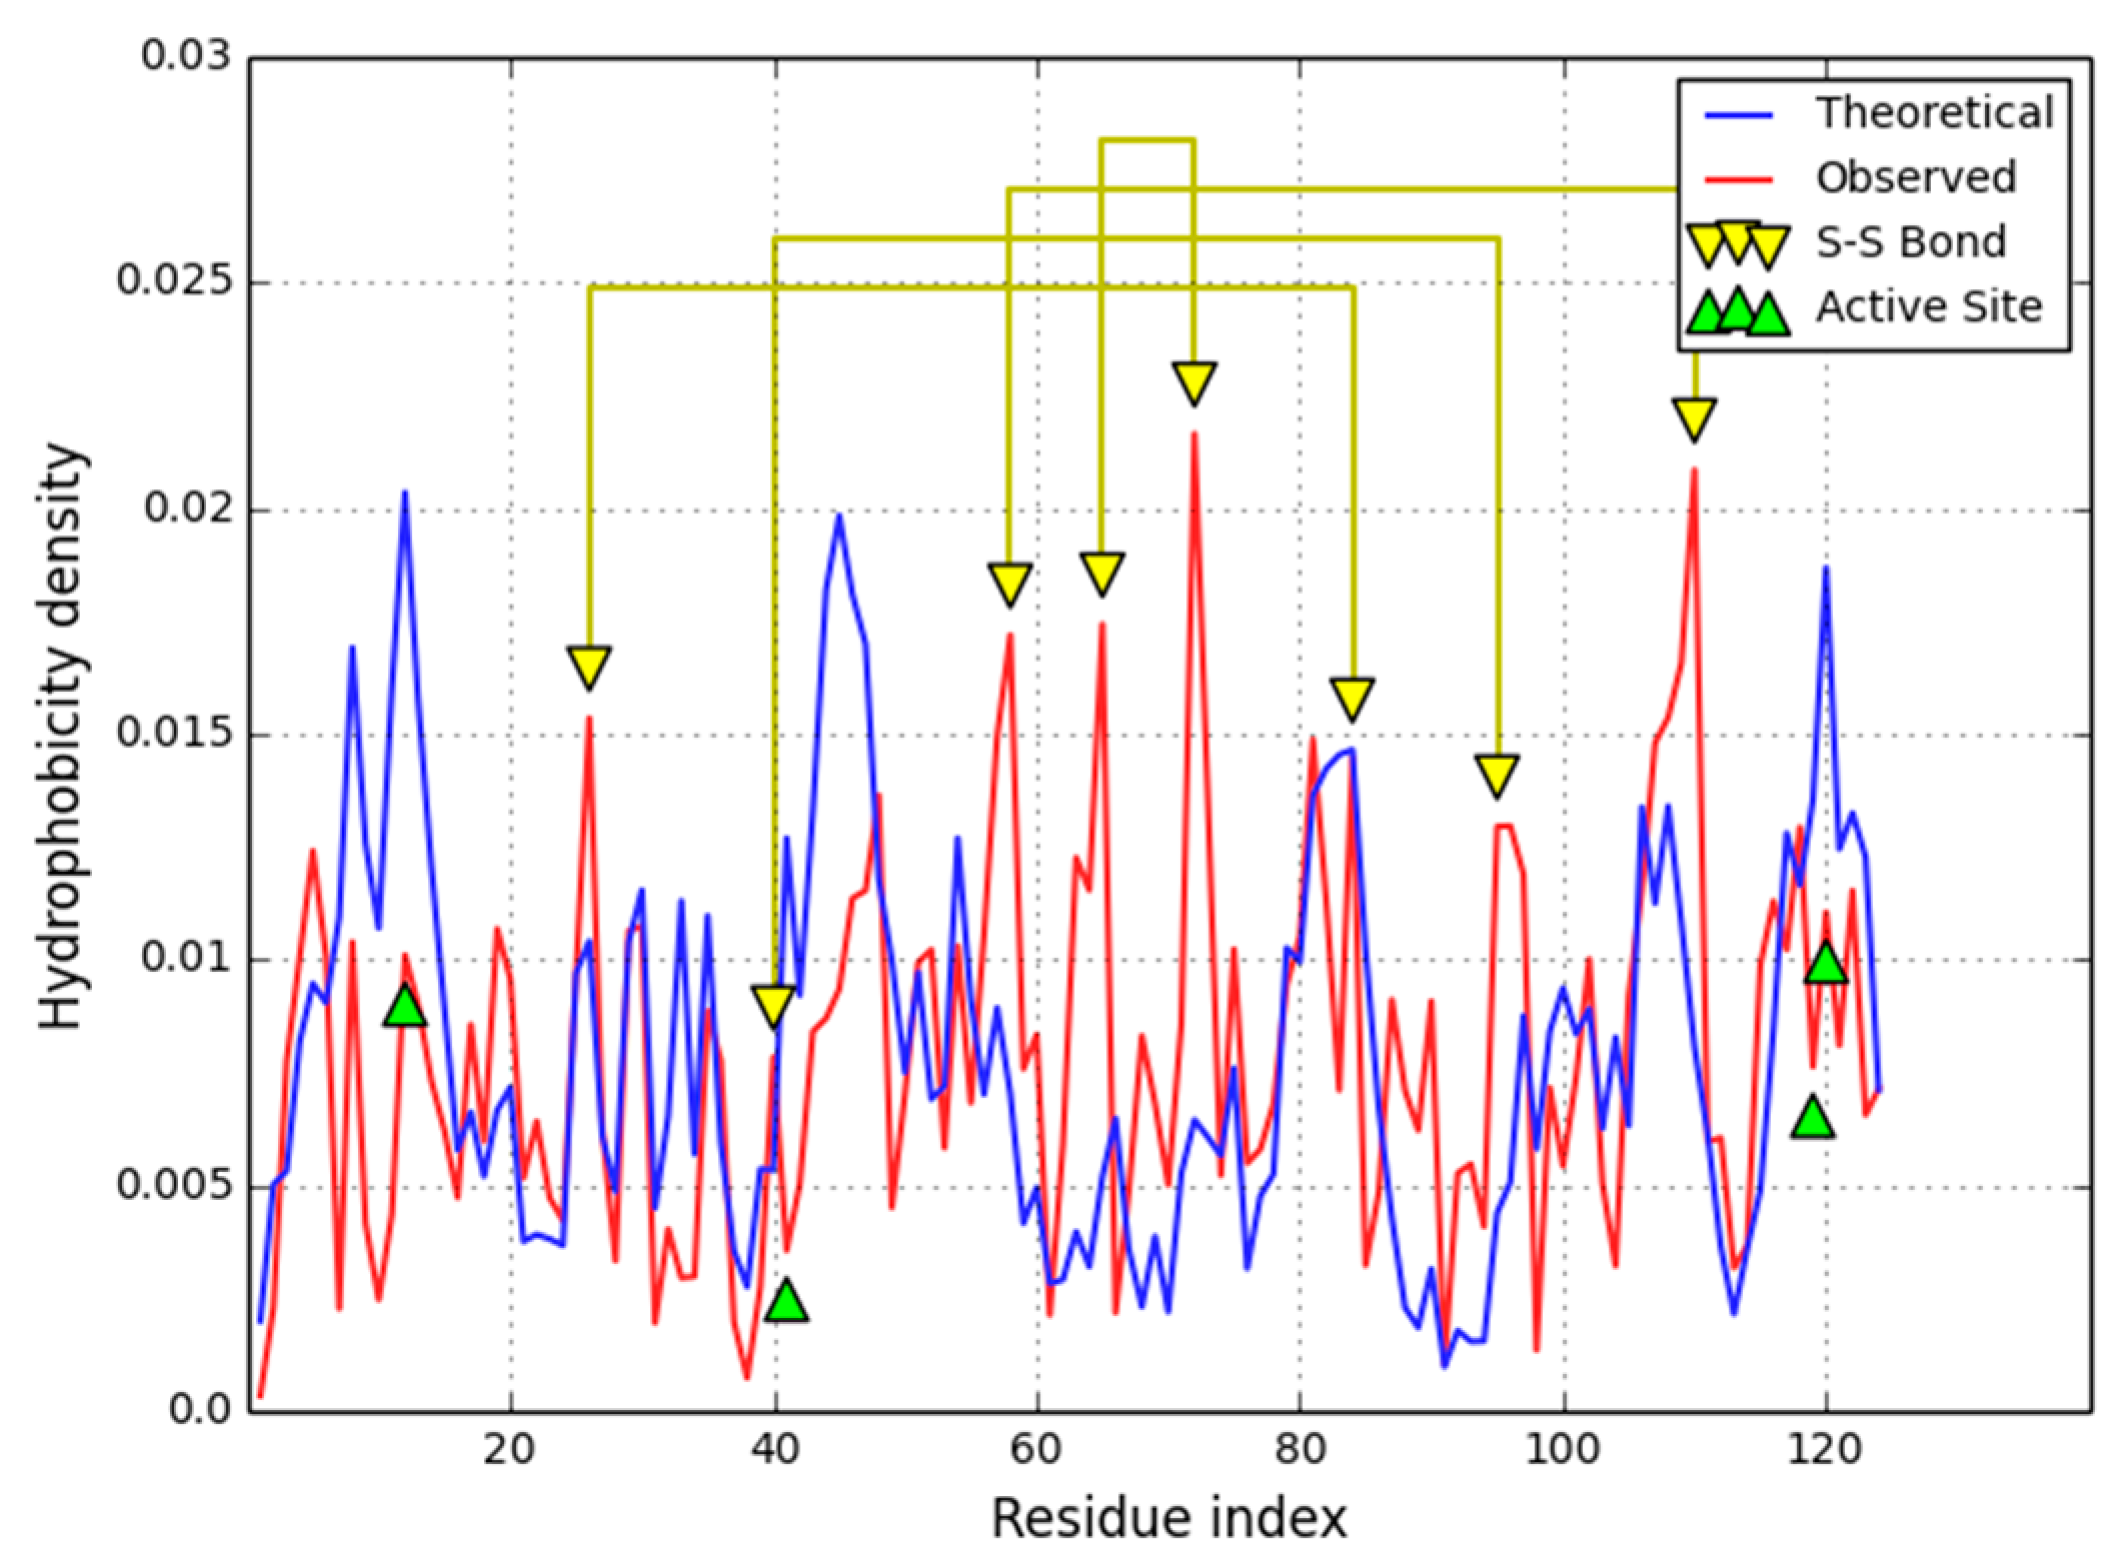
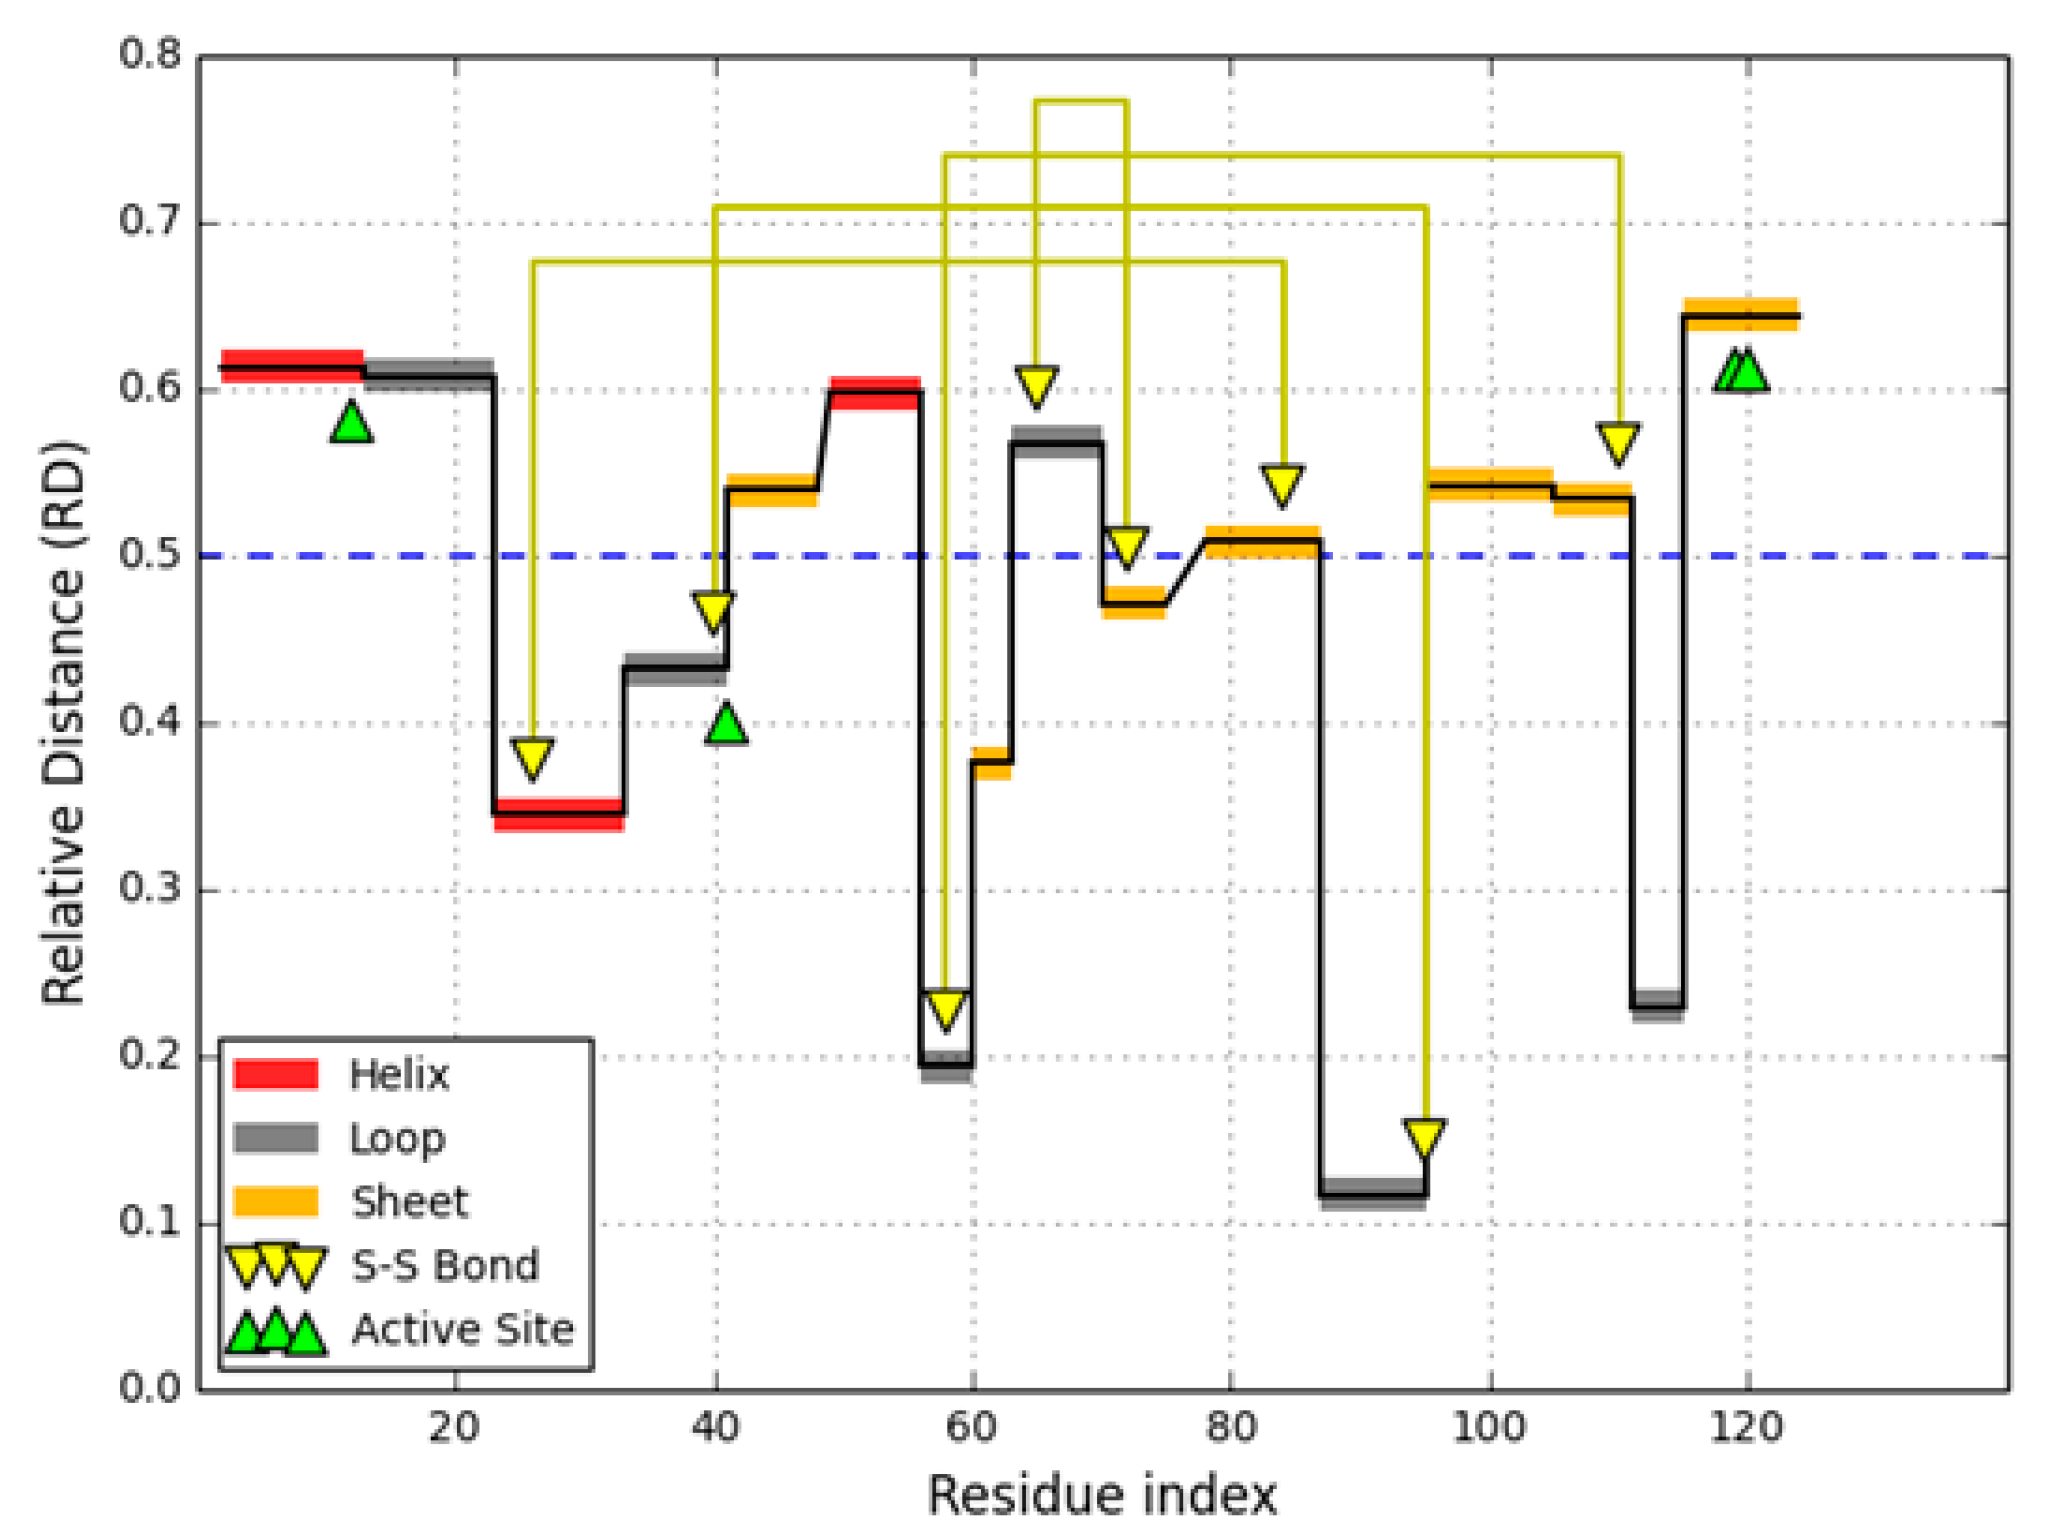
in vitro enzymatic potency, suggesting correct arrangement of disulfide bonds. The status of secondary fold is varied (
Figure 7).
In light of fuzzy oil drop analysis, structural stabilization in the presence of water is mediated by fragments which exhibit close-to-theoretical hydrophobicity density distribution (
Figure 7). We may speculate that, as the polypeptide chain folds, Cys residues at positions 26, 40 and 58 reach their preferred positions, as do their complementary residues at 95 and 72. In other words, the formation of a hydrophobic “drop” in the aqueous environment promotes correct positioning of the aforementioned residues, while the remaining Cys residues (at 84, 110 and 65) require further guidance. The folding process of ribonuclease results in a complex structure composed of a stabilizing backbone (which contains a hydrophobic core) and an unstable fragment which mediates biological activity. This selective instability is supported by the correct arrangement of disulfide bonds.
3.6. Discordant Section Defined by SS Bonds Related to Enzymatic Activity
Carboxylic esterase, a representative of the hydrolase group, contains two disulfide bonds. These bonds define a fragment which diverges from theoretical expectations and is located in close proximity to the active center. According to crystallographic analysis, the active center is described as “not accessible from the surface of the molecule” [
18]. A single, spacious catalytic cavity can be found inside the protein body. This cavity is bounded by two helixes which remain in contact with the surface. High temperature factor values have been reported for this fragment. As suggested in [
18] several residues participating in each helix exhibit discrete disorders. The authors of [
18] suggest that both helixes are involved in interfacial and substrate binding. On the basis of the fuzzy oil drop model, the presented fragment—a loop delimited by a disulfide bond (61–105)—diverges from the theoretical distribution, while the other similarly defined fragment (276–288) remains accordant with the model.
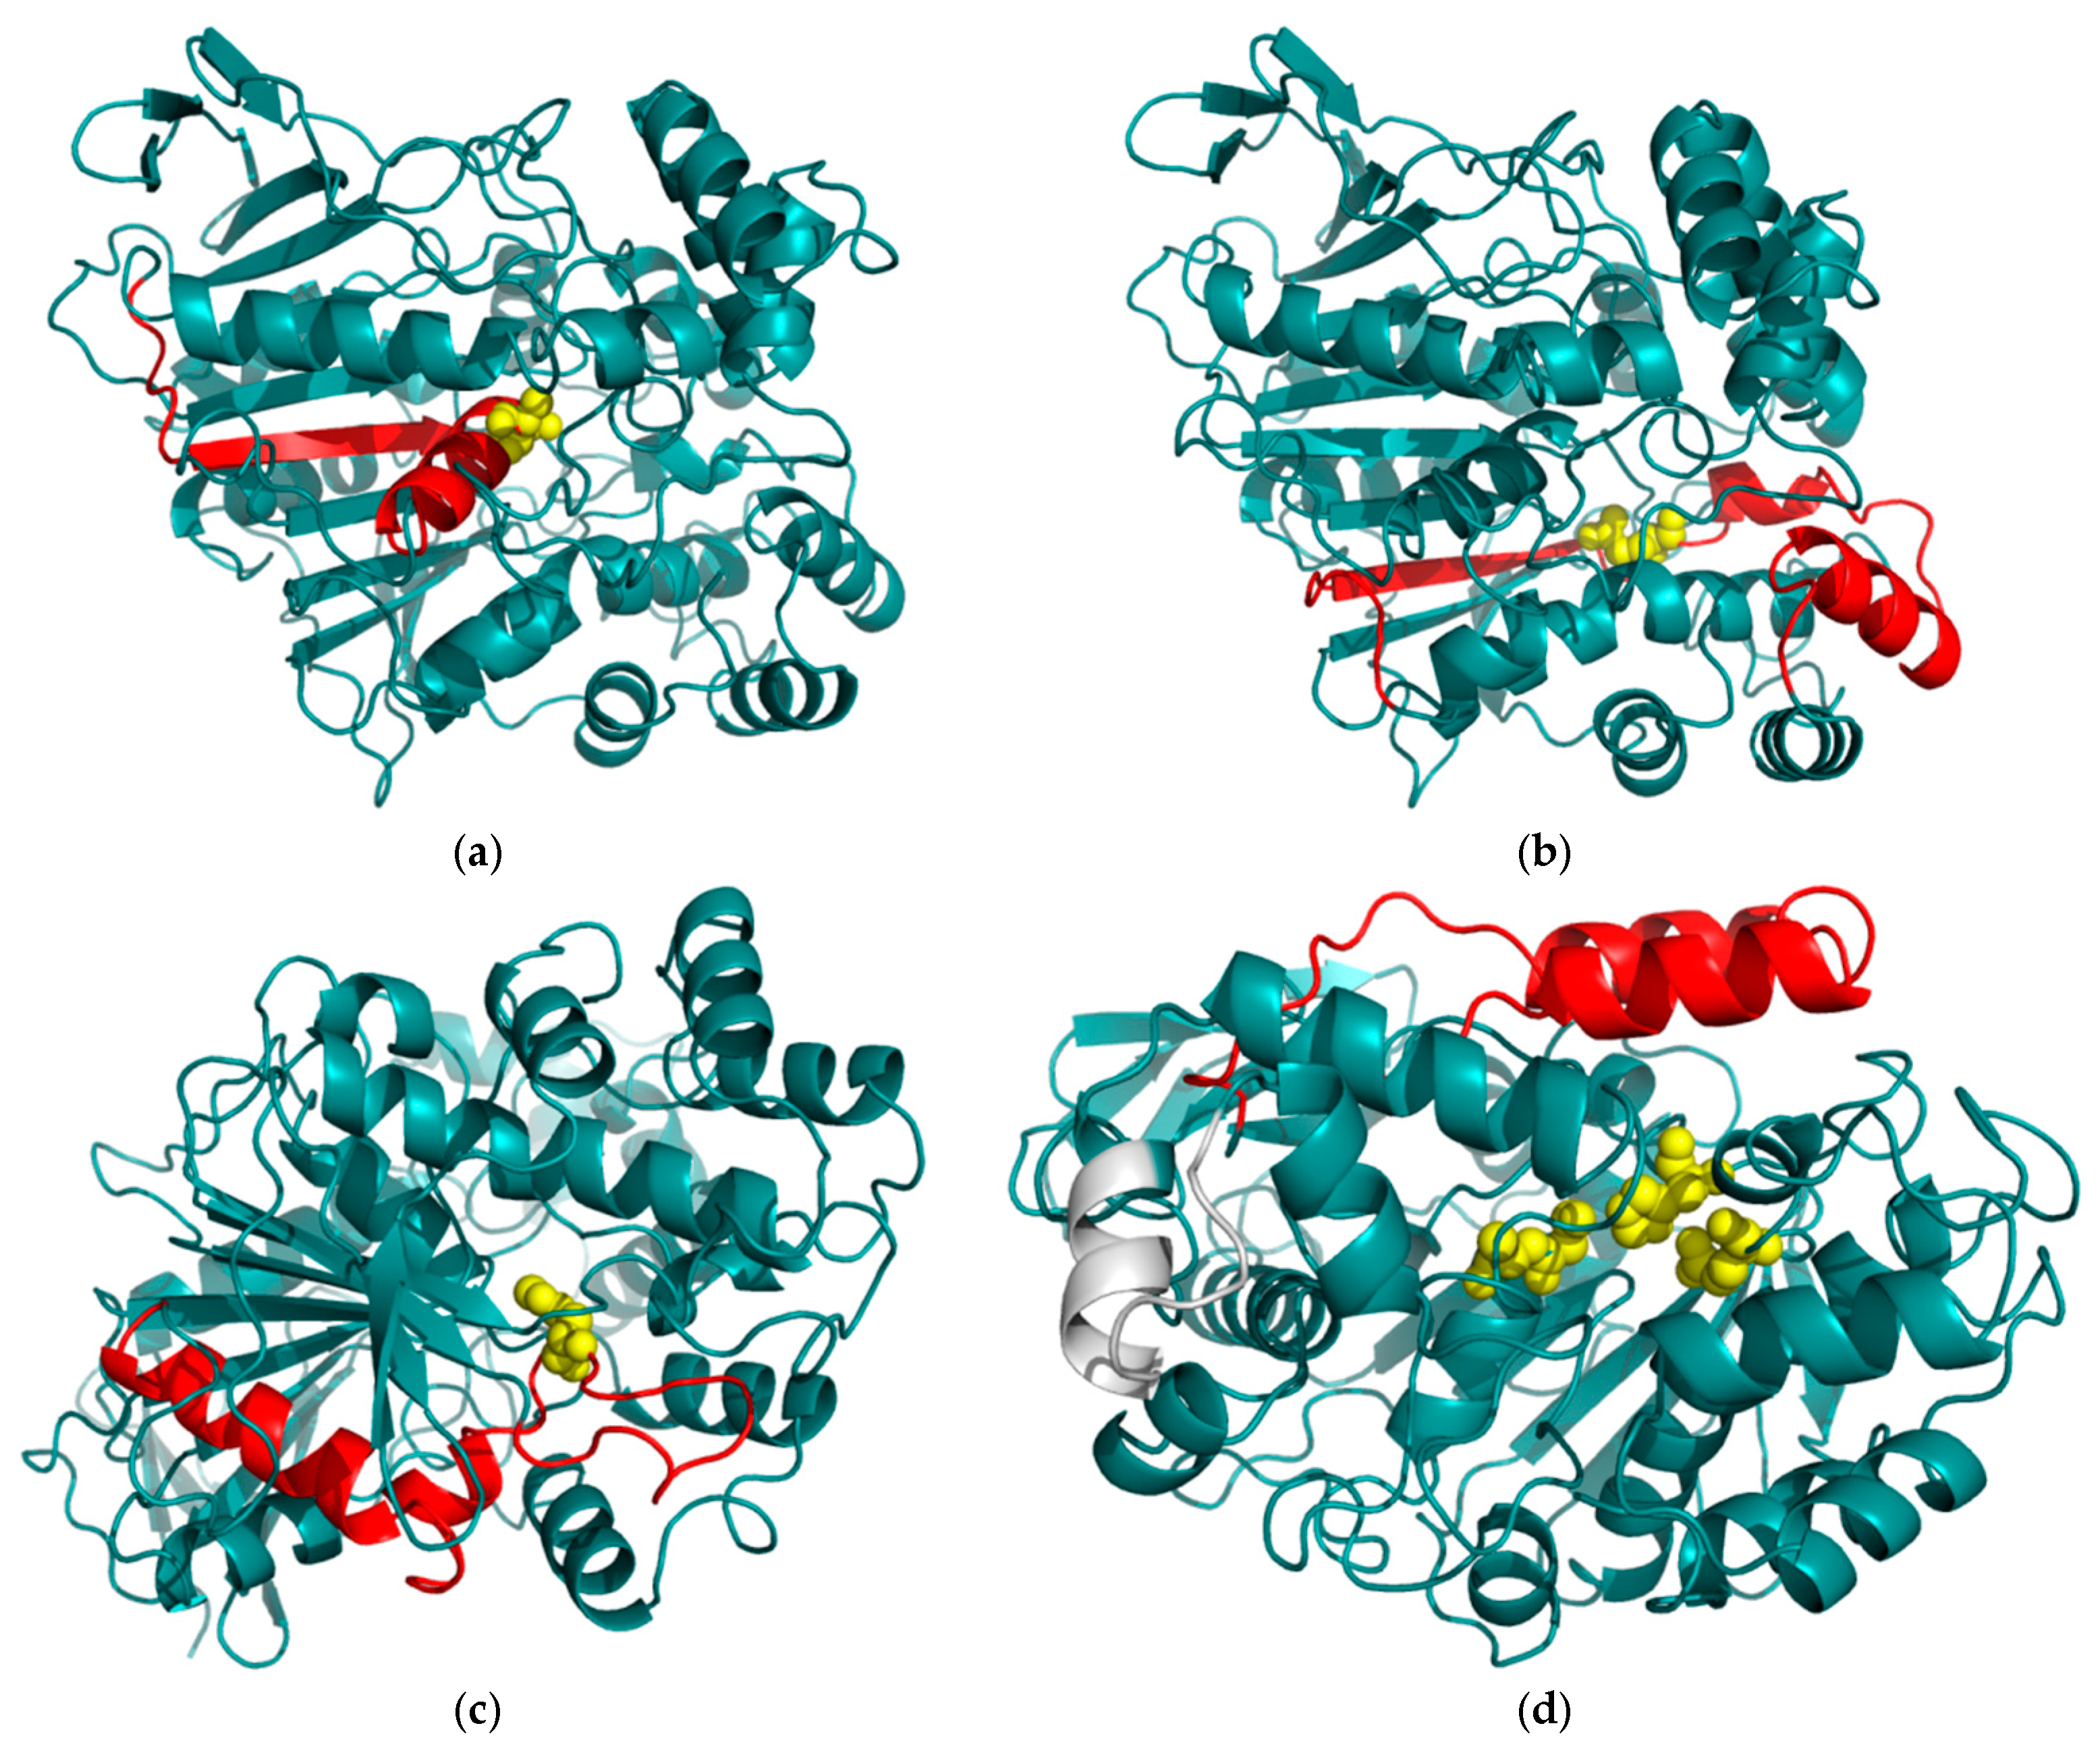
Figure 8 illustrates the distribution of discordant fragments. The immediate neighborhood of the catalytic center appears quite unstable, with fragments proximate to catalytic residues highly divergent from the model. A more in-depth analysis based on the fuzzy oil drop model reveals that these fragments are poorly integrated with the protein-wide hydrophobic core and can therefore undergo rearrangement and reorientation without affecting the molecule as a whole. The status of each of these fragments is listed in
Figure 8a–d. As can be seen, fragments located close to catalytic residues 217S and 218A deviate from the idealized hydrophobicity density distribution profile (see
Table 8).
Figure 8b shows the surroundings of catalytic residue 354E, which also deviates from the idealized profile (
Table 8).
Figure 8c presents catalytic residue 463H which is locally discordant. The fragment which forms the “lid” of the enzymatic cavity is a discordant loop delimited by a disulfide bond—accordingly, it does not form part of the molecule-wide hydrophobic core (
i.e., the loop at 61–105, also bounded by a disulfide bond—see
Figure 8d). On the other hand, the SS-bond-delimited loop at 276–288 remains accordant with the model and can therefore be suspected of promoting structural stability.
1THG, taken as a whole, does not appear to contain a prominent hydrophobic core. This is due to the presence of numerous discordant fragments (shown in
Figure 8). Nevertheless, the protein does include some fragments which promote structural stability by adhering to the theoretical hydrophobicity density distribution. The placement of red fragments suggests local flexibility which is necessary for the protein to perform its catalytic function (substrate binding, catalytic action, product release). This conclusion is in full agreement with the characteristics discovered via crystallographic analysis [
20].
3.7. Comparison of FOD Results with Accessible Solvent Area (ASA) Descriptions
The fuzzy oil drop model determines the status of each residue by considering its expected hydrophobicity density (which is a function of the residue’s placement
vis a vis the protein’s geometric center) and its actual hydrophobicity density, determined by hydrophobic interactions with other residues in a radius of 9 Å. In contrast, the Accessible Solvent Area (ASA) parameter depends on the area (Å
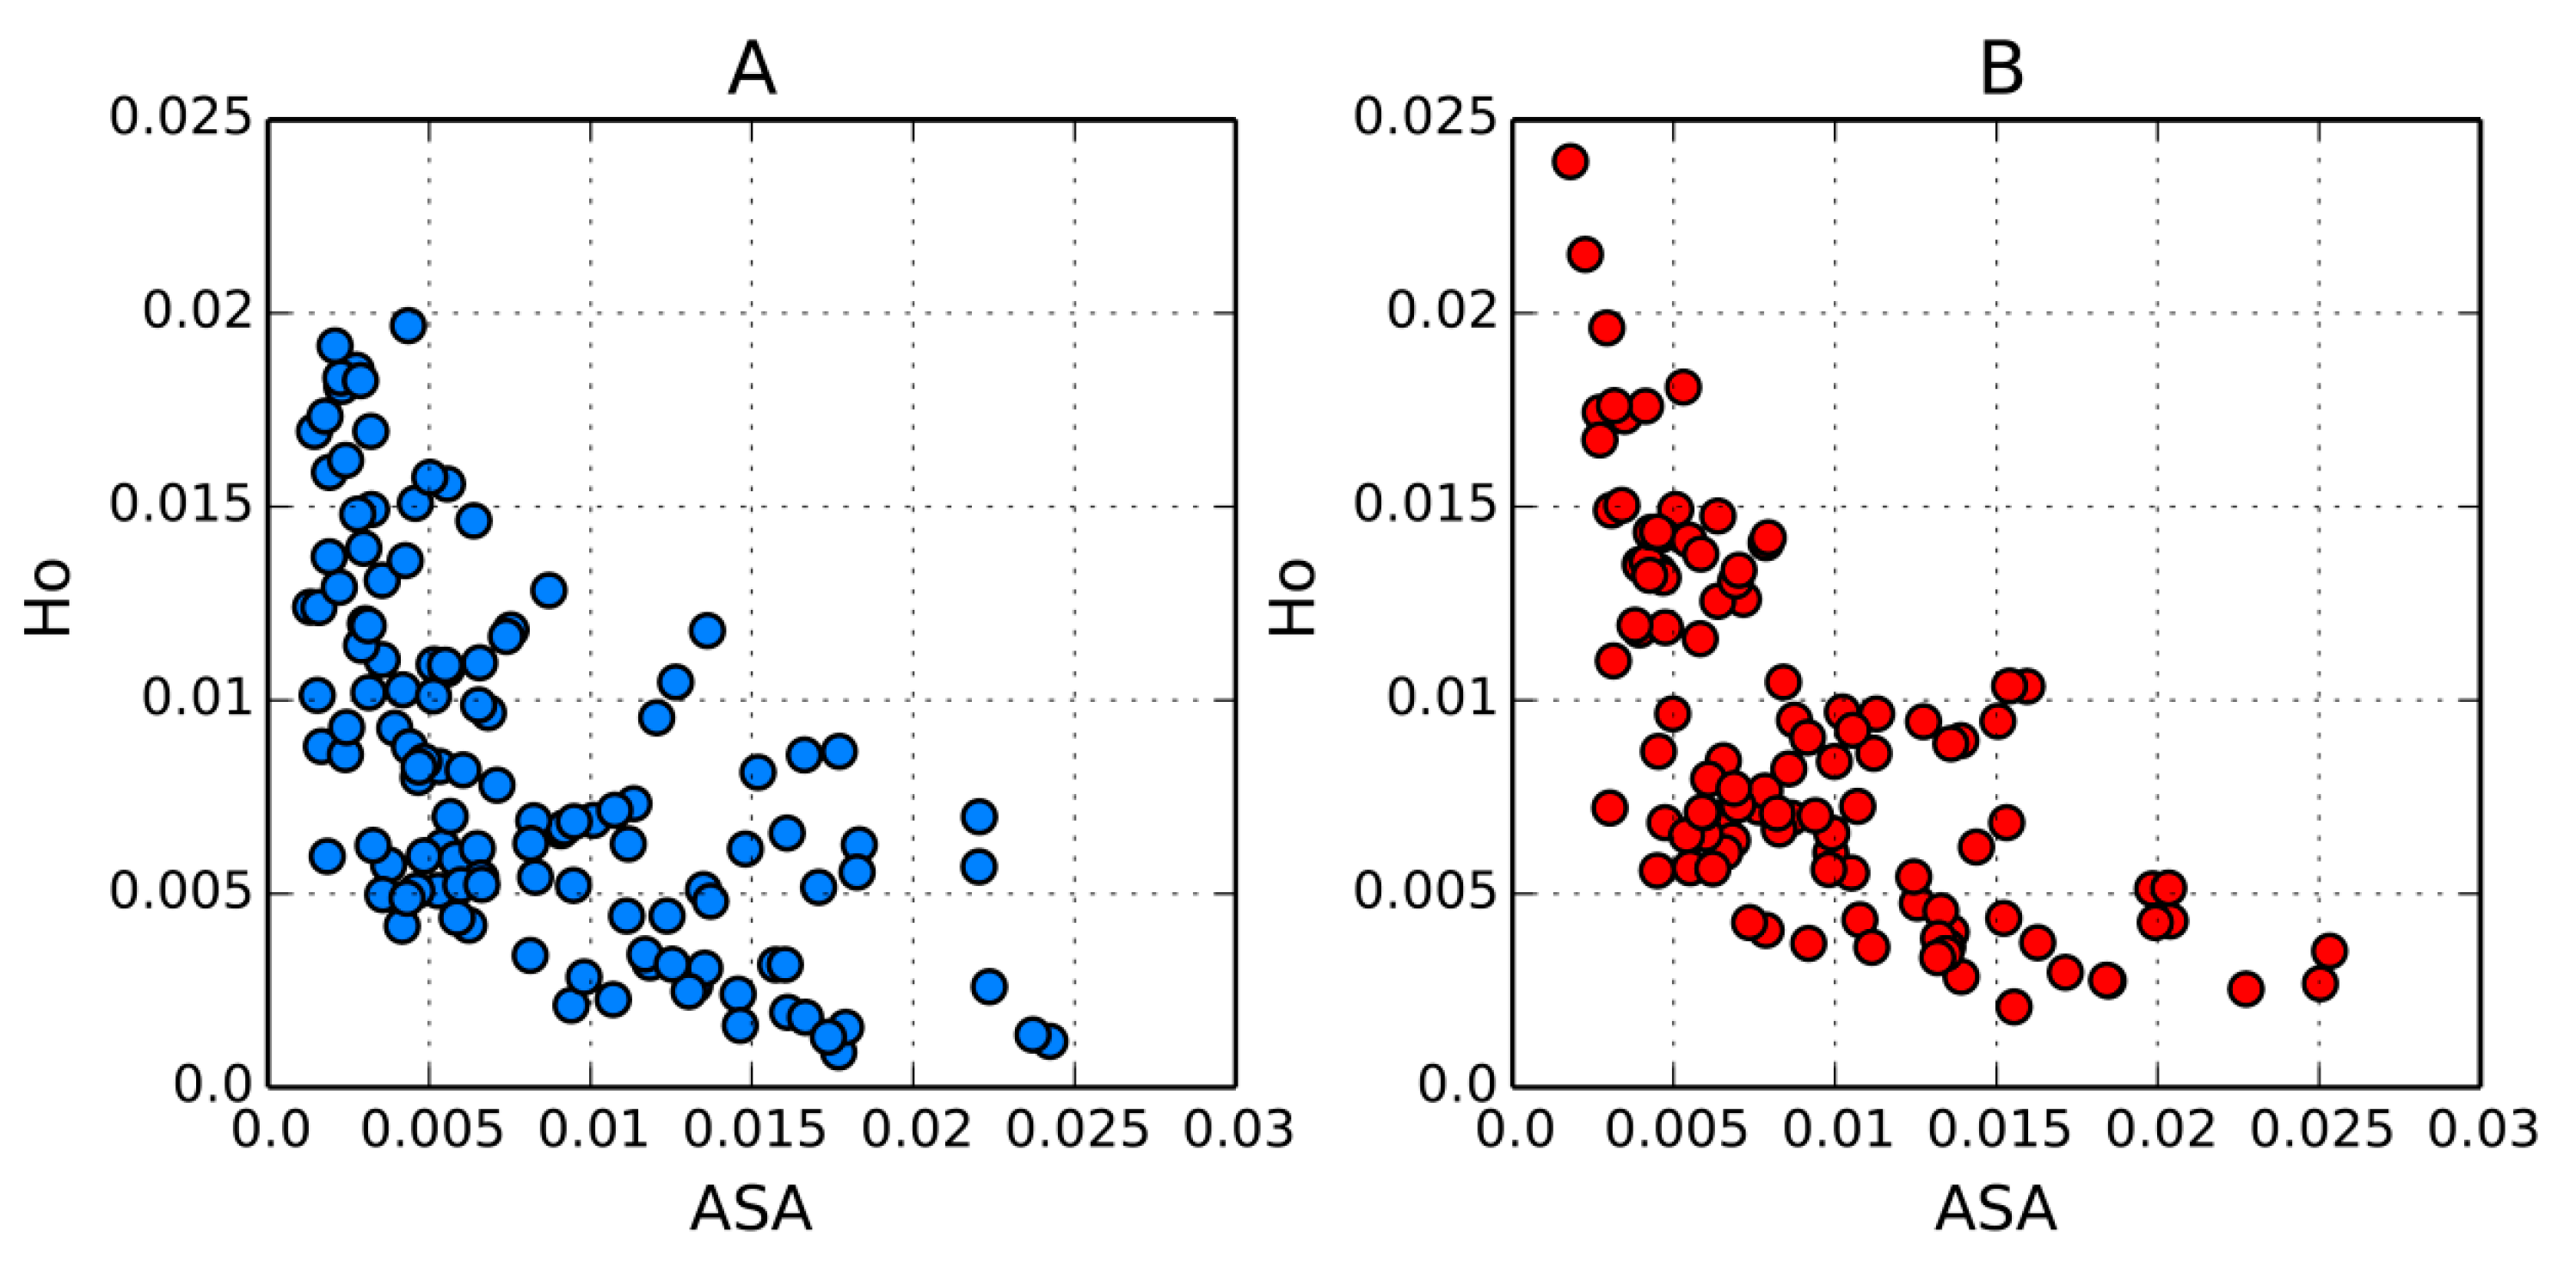
2) or fraction of the residue’s total surface area which remains in contact with water. It seems that both parameters should be correlated, with one parameter inversely proportional to the other. In order to test this hypothesis we have selected two proteins for which the FOD model yields differing results: 1QLL (
RD = 0.400 ) and domain 2 of 1M6B (
RD = 0.660).
Figure 9 illustrates the results of our study. In order to enable comparative analysis we focused on the observed hydrophobicity density (
Oi), since this parameter determines the overall status of the residue and is affected by interactions with neighboring residues (9 Å radius). This value can be interpreted as the “likelihood” that the given residue will act as a hydrophobic entity. As can be seen, the scatterplot depicting the mutual relation between both parameters approximates a hyperbole, with a relatively low spread.
4. Conclusions
Taking into account the high specificity of enzymes, ligand detection mechanisms must depend upon more than just the location of catalytic residues. When studying the immediate neighborhood of the catalytic center we should expect to encounter conditions which not only promote catalysis but also facilitate accommodation of specific ligands. Fragments which diverge from the idealized hydrophobicity density distribution profile appear to fulfill this purpose. In conclusion, while SS bonds are rightly regarded as enhancing the protein’s structural stability, it is worth noting that in many cases they specifically counteract the local effects of hydrophobic forces. Local instabilities, as recognized on the basis of the fuzzy oil drop model, appear to be related to biological function. Disulfide bonds—generally treated as important for tertiary structural stabilization—appear to reinforce these local instabilities; creating suitable conditions for local conformational changes related to biological function.
The hydrophobic core is regarded as an important factor in tertiary structural stabilization. The fuzzy oil drop model attempts to express this phenomenon in mathematical terms, describing the idealized hydrophobicity density distribution as a 3D Gaussian and applying Kullback–Leibler’s divergence entropy criterion to quantitatively express departures from this theoretical profile.As a result, we can identify fragments of the polypeptide chain which do not follow the theoretical model. A hypothetical protein characterized by perfect hydrophobicity density distribution (i.e., internalization of all hydrophobic residues coupled with exposure of all hydrophilic residues on the surface) would be highly soluble—a desired property in many biological systems—but would remain incapable of interacting with any other molecules. Thus, local deviations from the theoretical model may be—and indeed usually are—connected with areas of biological activity. Such activity may include catalysis (e.g., in enzymes), ligand binding or protein complexation (for proteins with a quaternary structure). Identification of discordant fragments is therefore an interesting research topic, particularly in the context of fostering favorable conditions for intermolecular interactions in the immediate neighborhood of the catalytic center.
Disulfide bonds are widely regarded as exerting a stabilizing influence upon the protein’s quaternary structure. Clearly, the introduction of additional covalent bonds produces a more rigid—and therefore more stable—molecule. The question remains: to what degree do all the listed factors reinforce each other? In the course our work we have identified proteins where both factors appear to serve a common purpose (well defined hydrophobic core reinforced by a system of SS bonds), such as 1QLL (phospholipase neurotoxin). In other cases SS bonds appear to counteract hydrophobic effects, supporting a locally divergent structure—e.g. in the ribonuclease lysozyme, disulfide isomerase or selected domains of serine protease (1M6Q). The location of catalytic residues in particular seems to correlate with locally divergent conditions. In most cases elimination of catalytic residues produces a more accordant molecule, as evidenced by changes in its RD value. Here, we focus on the effects of disulfide bonds which counteract hydrophobic forces—although this phenomenon is not evident in all proteins where such bonds are present (e.g. in 1QLL).
A spectacular example of local discordance found in the vicinity of catalytic residues is provided by the 1THG hydrolase—here, significant flexibility of the enzymatic cavity is required (as suggested by crystallographic analysis [
20]). The presented examples illustrate the interplay between various stabilizing factors: tertiary structure, disulfide bonds and hydrophobic cores. These relations—as already indicated—remain varied; however they all serve a common purpose, enabling the protein to fulfill its biological role.


