Development and Validation of an Automated Radiomic CT Signature for Detecting COVID-19

 , ,
, ,  , ,
, ,
Abstract
:1. Introduction
2. Materials and Methods
2.1. Ethics
2.2. Subjects
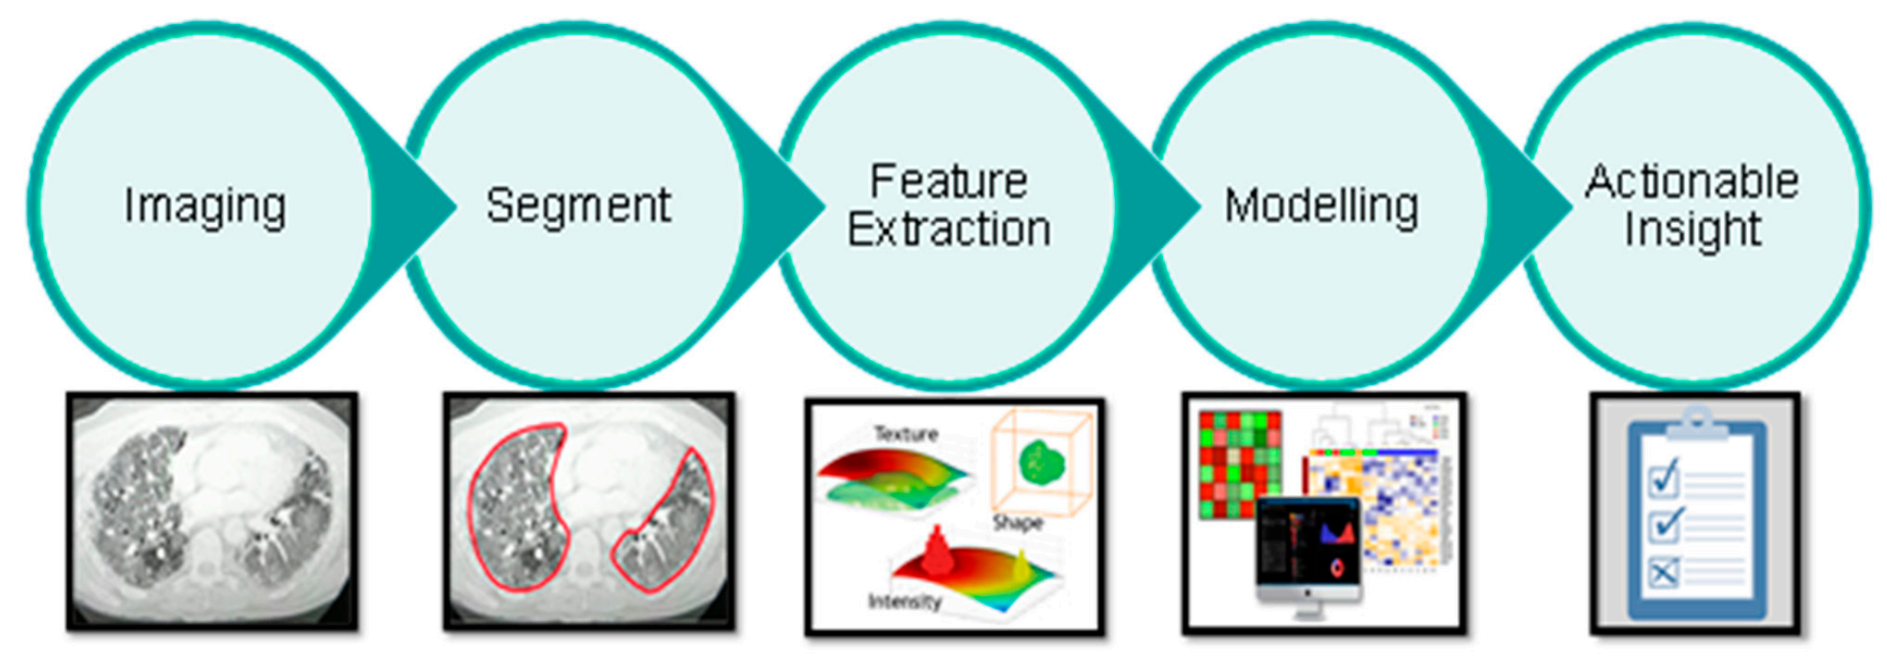
2.3. Radiomics
2.4. Imaging
- Lungs completely visible in the scan;
- Slice increment less than 1.5 mm;
- No missing slices;
- For GE scans: STANDARD reconstruction kernel;
- For Siemens scans: B30-range reconstruction intervals;
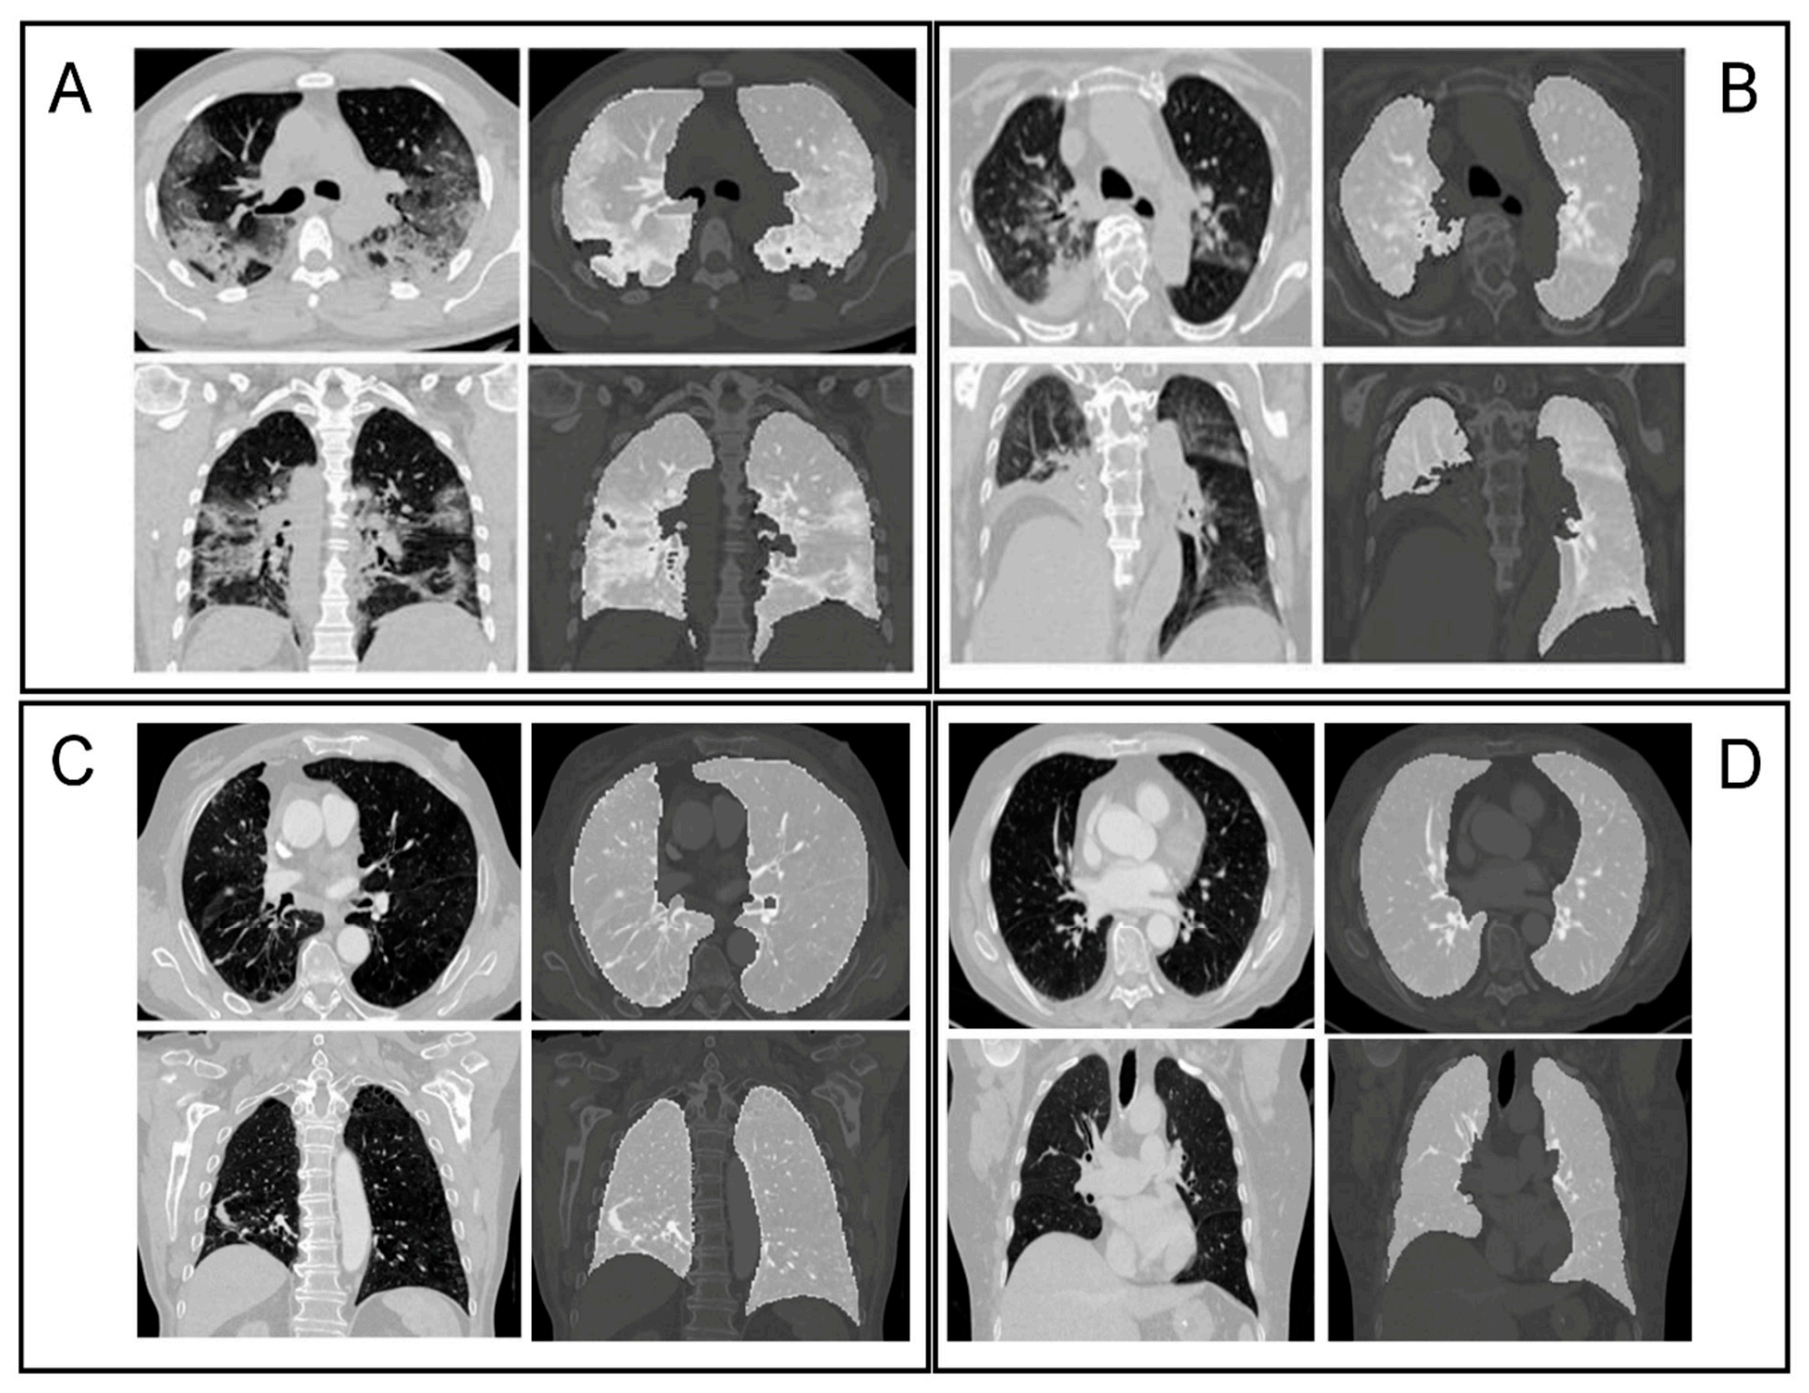
2.5. Lung Segmentation
2.6. Feature Extraction
2.7. Modelling
3. Results
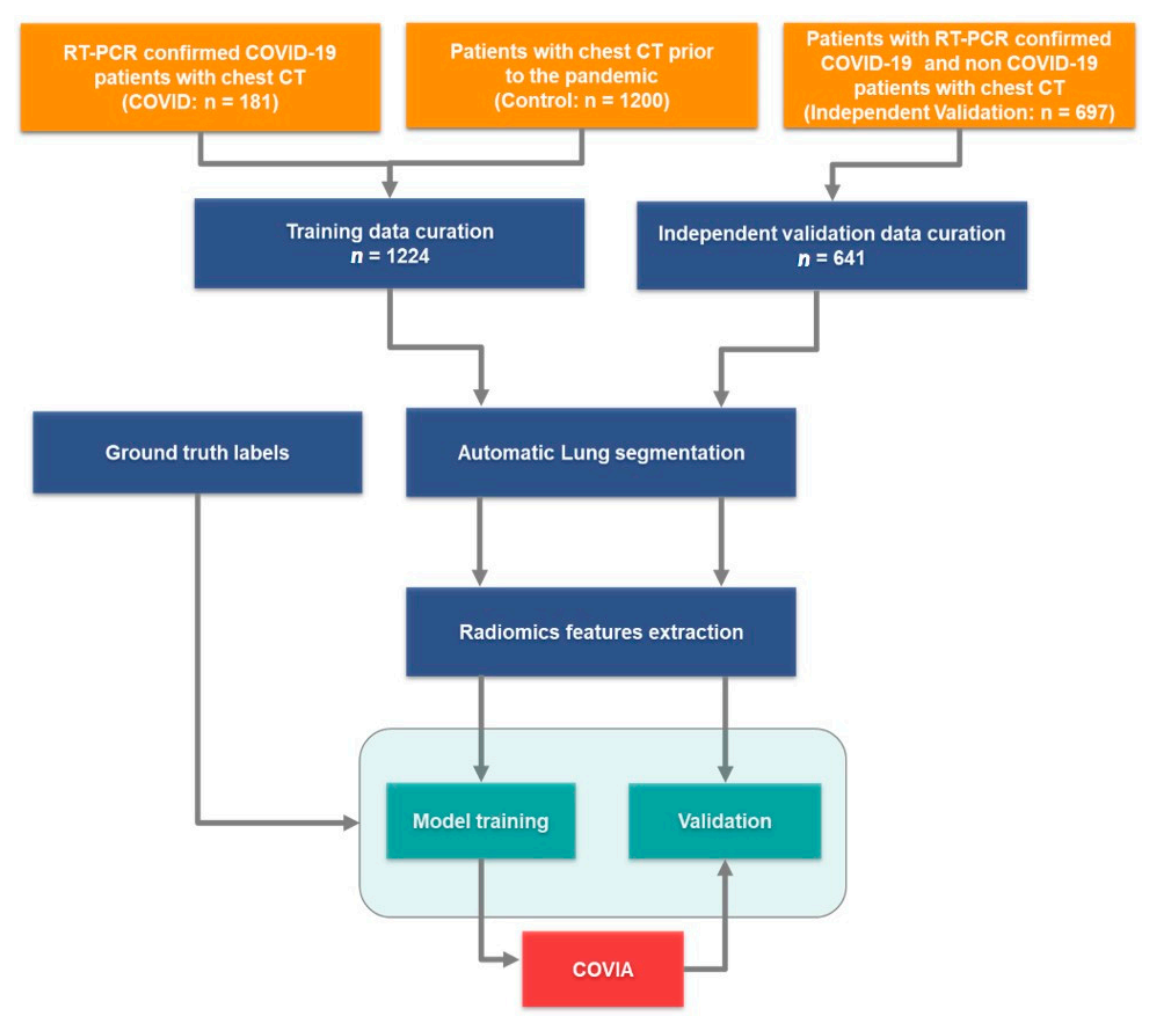
3.1. Study Population
3.2. Data Curation
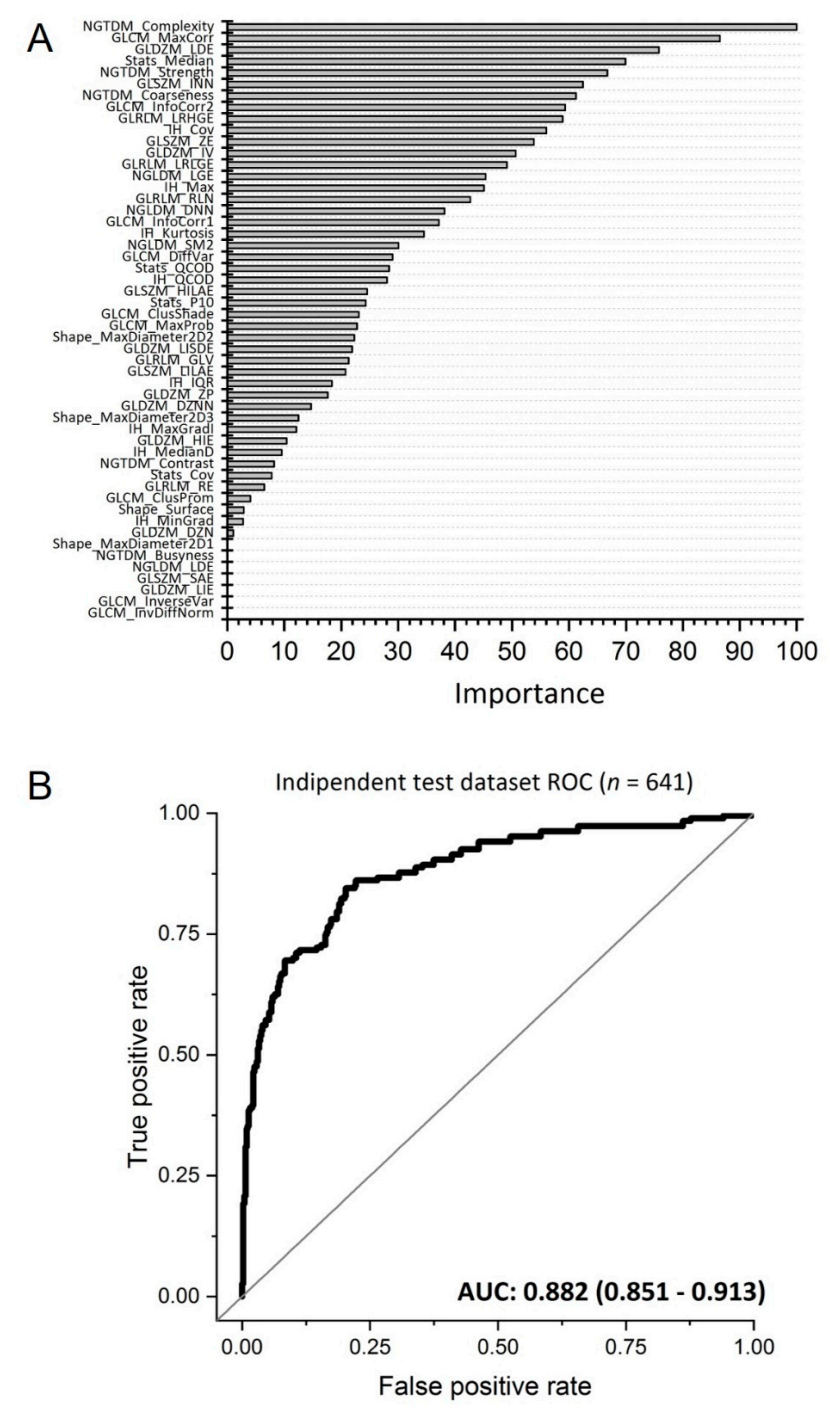
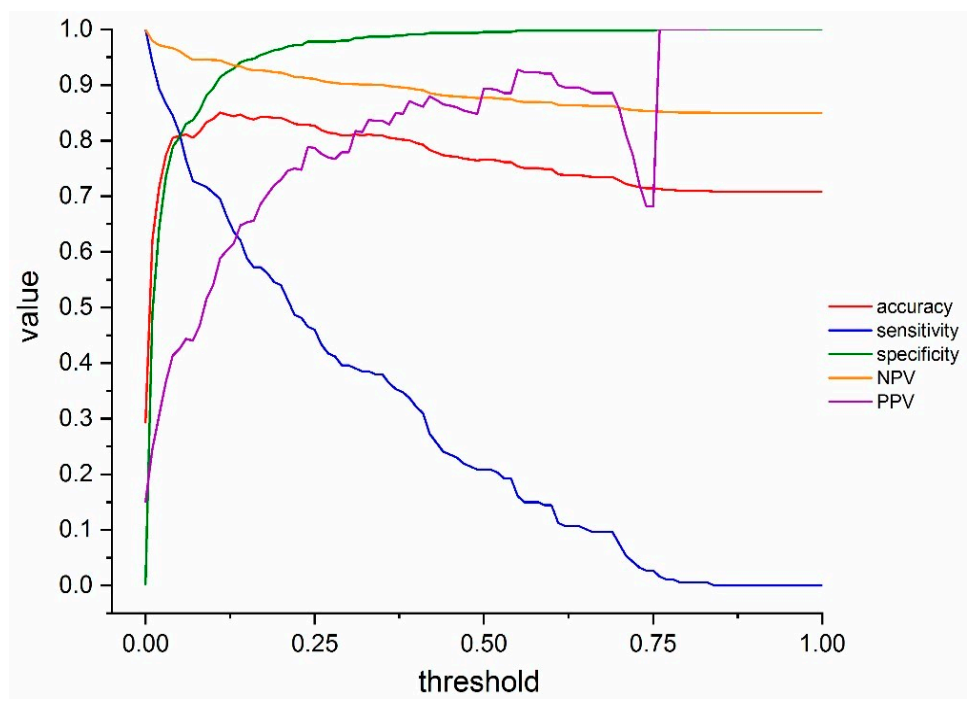
3.3. COVID-19 Infection Status Prediction
4. Discussion
5. Conclusions
Supplementary Materials
Author Contributions
Funding
Institutional Review Board Statement
Informed Consent Statement
Data Availability Statement
Acknowledgments
Conflicts of Interest
Abbreviations
| PPV | Positive Predictive Value |
| NPV | Negative Predictive Value |
| AUC | area under the receiver operating characteristic curve |
| RT-PCR | Reverse transcription polymerase chain reaction |
| SARS-COV-2 | severe acute respiratory syndrome coronavirus 2 |
| AI | Artificial intelligence |
| COVIA | coronavirus intelligence artificielle |
| CT | computed tomography |
References
- WHO Landing Page. Available online: https://www.who.int/ (accessed on 20 December 2020).
- Johns Hopkins University & Medicine Coronavirus Resource Center. Available online: https://coronavirus.jhu.edu/map.html (accessed on 20 December 2020).
- Wu, J.T.; Leung, K.; Leung, G.M. Nowcasting and forecasting the potential domestic and international spread of the 2019-nCoV outbreak originating in Wuhan, China: A modelling study. Lancet 2020, 395, 689–697. [Google Scholar] [CrossRef] [Green Version]
- Yang, S.; Shi, Y.; Lu, H.; Xu, J.; Li, F.; Qian, Z.; Hua, X.; Ding, X.; Song, F.; Shen, J.; et al. Clinical and CT features of early-stage patients with COVID-19: A retrospective analysis of imported cases in Shanghai, China. Eur. Respir. J. 2020, 2000407. [Google Scholar] [CrossRef] [PubMed]
- Ai, T.; Yang, Z.; Hou, H.; Zhan, C.; Chen, C.; Lv, W.; Tao, Q.; Sun, Z.; Xia, L. Correlation of Chest CT and RT-PCR Testing for Coronavirus Disease 2019 (COVID-19) in China: A Report of 1014 Cases. Radiology 2020, 296, E32–E40. [Google Scholar] [CrossRef] [PubMed] [Green Version]
- Fang, Y.; Zhang, H.; Xie, J.; Lin, M.; Ying, L.; Pang, P.; Ji, W. Sensitivity of Chest CT for COVID-19: Comparison to RT-PCR. Radiology 2020, 200432. [Google Scholar] [CrossRef] [PubMed]
- Huang, C.; Wang, Y.; Li, X.; Ren, L.; Zhao, J.; Hu, Y.; Zhang, L.; Fan, G.; Xu, J.; Gu, X.; et al. Clinical features of patients infected with 2019 novel coronavirus in Wuhan, China. Lancet 2020, 395, 497–506. [Google Scholar] [CrossRef] [Green Version]
- Li, R.; Liu, G.; Zhang, X.; Li, H. Letter to the Editor: Chest CT and RT-PCR: Radiologists’ Experience in the Diagnosis of COVID-19 in China. Available online: https://www.european-radiology.org/opinions/chest-ct-and-rt-pcr-radiologists-experience-in-the-diagnosis-of-covid-19-in-china/ (accessed on 20 December 2020).
- Hope, M. A role for CT in COVID-19? What data really tell us so far. Lancet 2020, 395, 1189–1190. [Google Scholar] [CrossRef]
- Huang, Y.; Cheng, W.; Zhao, N.; Qu, H.; Tian, J. Correspondence CT screening for early diagnosis of SARS-CoV-2. Lancet Infect. Dis. 2020, 51, 30241. [Google Scholar] [CrossRef] [Green Version]
- Aerts, H.J.W.L.; Velazquez, E.R.; Leijenaar, R.T.H.; Parmar, C.; Grossmann, P.; Carvalho, S.; Bussink, J.; Monshouwer, R.; Haibe-Kains, B.; Rietveld, D.; et al. Decoding tumour phenotype by noninvasive imaging using a quantitative radiomics approach. Nat. Commun. 2014, 5, 4006. [Google Scholar] [CrossRef]
- Walsh, S.L.F.; Calandriello, L.; Silva, M.; Sverzellati, N. Deep learning for classifying fibrotic lung disease on high-resolution computed tomography: A case-cohort study. Lancet Respir. Med. 2018, 6, 837–845. [Google Scholar] [CrossRef]
- McKinney, S.M.; Sieniek, M.; Godbole, V.; Godwin, J.; Antropova, N.; Ashrafian, H.; Back, T.; Chesus, M.; Corrado, G.C.; Darzi, A.; et al. International evaluation of an AI system for breast cancer screening. Nature 2020, 577, 89–94. [Google Scholar] [CrossRef]
- Ardila, D.; Kiraly, A.P.; Bharadwaj, S.; Choi, B.; Reicher, J.J.; Peng, L.; Tse, D.; Etemadi, M.; Ye, W.; Corrado, G.; et al. End-to-end lung cancer screening with three-dimensional deep learning on low-dose chest computed tomography. Nat. Med. 2019, 25, 954–961. [Google Scholar] [CrossRef] [PubMed]
- Deist, T.M.; Dankers, F.J.W.M.; Valdes, G.; Wijsman, R.; Hsu, I.-C.; Oberije, C.; Lustberg, T.; Van Soest, J.; Hoebers, F.; Jochems, A.; et al. Machine learning algorithms for outcome prediction in (chemo)radiotherapy: An empirical comparison of classifiers. Med. Phys. 2018, 45, 3449–3459. [Google Scholar] [CrossRef]
- Lambin, P.; Rios-Velazquez, E.; Leijenaar, R.; Carvalho, S.; Van Stiphout, R.G.P.M.; Granton, P.; Zegers, C.M.L.; Gillies, R.; Boellard, R.; Dekker, A.; et al. Radiomics: Extracting more information from medical images using advanced feature analysis. Eur. J. Cancer 2012, 48, 441–446. [Google Scholar] [CrossRef] [PubMed] [Green Version]
- Lambin, P.; Leijenaar, R.T.H.; Deist, T.M.; Peerlings, J.; De Jong, E.E.C.; Van Timmeren, J.; Sanduleanu, S.; Larue, R.T.H.M.; Even, A.J.G.; Jochems, A.; et al. Radiomics: The bridge between medical imaging and personalized medicine. Nat. Rev. Clin. Oncol. 2017, 14, 749–762. [Google Scholar] [CrossRef]
- Parmar, C.; Rios Velazquez, E.; Leijenaar, R.; Jermoumi, M.; Carvalho, S.; Mak, R.H.; Mitra, S.; Shankar, B.U.; Kikinis, R.; Haibe-Kains, B.; et al. Robust Radiomics Feature Quantification Using Semiautomatic Volumetric Segmentation. PLoS ONE 2014, 9, e102107. [Google Scholar] [CrossRef]
- Parmar, C.; Grossmann, P.; Bussink, J.; Lambin, P.; Aerts, H.J.W.L. Machine Learning methods for Quantitative Radiomic Biomarkers. Sci. Rep. 2015, 5, 13087. [Google Scholar] [CrossRef] [PubMed]
- Selvaraju, R.R.; Cogswell, M.; Das, A.; Vedantam, R.; Parikh, D.; Batra, D. Grad-CAM: Visual Explanations from Deep Networks via Gradient-Based Localization. Int. J. Comput. Vis. 2020, 128, 336–359. [Google Scholar] [CrossRef] [Green Version]
- Xie, X.; Zhong, Z.; Zhao, W.; Zheng, C.; Wang, F.; Liu, J. Chest CT for Typical 2019-nCoV Pneumonia: Relationship to Negative RT-PCR Testing. Radiology 2020, 200343. [Google Scholar] [CrossRef] [Green Version]
- Sheridan, C. Coronavirus and the race to distribute reliable diagnostics. Nat. Biotechnol. 2020. [Google Scholar] [CrossRef]
- Revel, M.P.; Parkar, A.P.; Prosch, H.; Silva, M.; Sverzellati, N.; Gleeson, F.; Brady, A. COVID-19 patients and the radiology department–Advice from the European Society of Radiology (ESR) and the European Society of Thoracic Imaging (ESTI). Eur. Radiol. 2020. [Google Scholar] [CrossRef] [Green Version]
- Liu, J.; Yu, H.; Zhang, S. The indispensable role of chest CT in the detection of coronavirus disease 2019 (COVID-19). Eur. J. Nucl. Med. Mol. Imaging 2020, 47, 1638–1639. [Google Scholar] [CrossRef] [PubMed] [Green Version]
- Song, Y.; Zheng, S.; Li, L.; Zhang, X.; Zhang, X.; Huang, Z.; Chen, J.; Zhao, H.; Jie, Y.; Wang, R.; et al. Deep learning Enables Accurate Diagnosis of Novel Coronavirus (COVID-19) with CT images. MedRxiv 2020. [Google Scholar] [CrossRef] [Green Version]
- Wang, S.; Kang, B.; Ma, J.; Zeng, X.; Xiao, M.; Guo, J.; Cai, M.; Yang, J.; Li, Y.; Meng, X.; et al. A deep learning algorithm using CT images to screen for Corona Virus Disease (COVID-19). MedRxiv 2020. [Google Scholar] [CrossRef] [Green Version]
- Chen, J.; Wu, L.; Zhang, J.; Zhang, L.; Gong, D.; Zhao, Y.; Hu, S.; Wang, Y.; Hu, X.; Zheng, B.; et al. Deep learning-based model for detecting 2019 novel coronavirus pneumonia on high-resolution computed tomography: A prospective study. MedRxiv 2020. [Google Scholar] [CrossRef] [Green Version]
- Leijenaar, R.T.H.; Bogowicz, M.; Jochems, A.; Hoebers, F.J.P.; Wesseling, F.W.R.; Huang, S.H.; Chan, B.; Waldron, J.N.; O’Sullivan, B.; Rietveld, D.; et al. Development and validation of a radiomic signature to predict HPV (p16) status from standard CT imaging: A multicenter study. Br. J. Radiol. 2018, 91, 20170498. [Google Scholar] [CrossRef] [PubMed]
- Wu, J.; Liu, J.; Li, S.; Peng, Z.; Xiao, Z.; Wang, X.; Yan, R.; Luo, J. Detection and analysis of nucleic acid in various biological samples of COVID-19 patients. Travel Med. Infect. Dis. 2020, 101673. [Google Scholar] [CrossRef]
- Oxford Centre for Evidence-Based Medicine. Levels of Evidence (March 2009)–CEBM. Available online: https://www.cebm.ox.ac.uk/resources/levels-of-evidence/oxford-centre-for-evidence-based-medicine-levels-of-evidence-march-2009 (accessed on 1 December 2020).
- Shi, F.; Wang, J.; Shi, J.; Wu, Z.; Wang, Q.; Tang, Z.; He, K.; Shi, Y.; Shen, D. Review of Artificial Intelligence Techniques in Imaging Data Acquisition, Segmentation and Diagnosis for COVID-19. IEEE Rev. Biomed. Eng. 2020, 1. [Google Scholar] [CrossRef] [Green Version]
- Kundu, S.; Elhalawani, H.; Gichoya, J.W.; Kahn, C.E. How Might AI and Chest Imaging Help Unravel COVID-19’s Mysteries? Radiol. Artif. Intell. 2020, 2, e200053. [Google Scholar] [CrossRef]
- Mei, X.; Lee, H.C.; Diao, K.; Huang, M.; Lin, B.; Liu, C.; Xie, Z.; Ma, Y.; Robson, P.M.; Chung, M.; et al. Artificial intelligence–enabled rapid diagnosis of patients with COVID-19. Nat. Med. 2020, 26, 1224–1228. [Google Scholar] [CrossRef]
- Harmon, S.A.; Sanford, T.H.; Xu, S.; Turkbey, E.B.; Roth, H.; Xu, Z.; Yang, D.; Myronenko, A.; Anderson, V.; Amalou, A.; et al. Artificial intelligence for the detection of COVID-19 pneumonia on chest CT using multinational datasets. Nat. Commun. 2020, 11, 1–7. [Google Scholar] [CrossRef]
- Ozsahin, I.; Sekeroglu, B.; Musa, M.S.; Mustapha, M.T.; Uzun Ozsahin, D. Review on Diagnosis of COVID-19 from Chest CT Images Using Artificial Intelligence. Comput. Math. Methods Med. 2020, 2020, 1–10. [Google Scholar] [CrossRef] [PubMed]
- Jalaber, C.; Lapotre, T.; Morcet-Delattre, T.; Ribet, F.; Jouneau, S.; Lederlin, M. Chest CT in COVID-19 pneumonia: A review of current knowledge. Diagn. Interv. Imaging 2020, 101, 431–437. [Google Scholar] [CrossRef] [PubMed]
- Hope, M.D.; Raptis, C.A.; Henry, T.S. Chest Computed Tomography for Detection of Coronavirus Disease 2019 (COVID-19): Don’t Rush the Science. Ann. Intern. Med. 2020, 173, 147–148. [Google Scholar] [CrossRef] [PubMed] [Green Version]
- Bai, H.X.; Wang, R.; Xiong, Z.; Hsieh, B.; Chang, K.; Halsey, K.; Tran, T.M.L.; Choi, J.W.; Wang, D.-C.; Shi, L.-B.; et al. Artificial Intelligence Augmentation of Radiologist Performance in Distinguishing COVID-19 from Pneumonia of Other Origin at Chest CT. Radiology 2020, 296, E156–E165. [Google Scholar] [CrossRef]
- Li, L.; Qin, L.; Xu, Z.; Yin, Y.; Wang, X.; Kong, B.; Bai, J.; Lu, Y.; Fang, Z.; Song, Q.; et al. Using Artificial Intelligence to Detect COVID-19 and Community-acquired Pneumonia Based on Pulmonary CT: Evaluation of the Diagnostic Accuracy. Radiology 2020, 296, E65–E71. [Google Scholar] [CrossRef]
- Xie, C.; Ng, M.-Y.; Ding, J.; Leung, S.T.; Lo, C.S.Y.; Wong, H.Y.F.; Vardhanabhuti, V. Discrimination of pulmonary ground-glass opacity changes in COVID-19 and non-COVID-19 patients using CT radiomics analysis. Eur. J. Radiol. Open 2020, 7. [Google Scholar] [CrossRef]
- Fang, M.; He, B.; Li, L.; Dong, D.; Yang, X.; Li, C.; Meng, L.; Zhong, L.; Li, H.; Li, H.; et al. CT radiomics can help screen the Coronavirus disease 2019 (COVID-19): A preliminary study. Sci. China Inf. Sci. 2020, 63, 172103. [Google Scholar] [CrossRef]
- Fu, L.; Li, Y.; Cheng, A.; Pang, P.; Shu, Z. A Novel Machine Learning-derived Radiomic Signature of the Whole Lung Differentiates Stable from Progressive COVID-19 Infection: A Retrospective Cohort Study. J. Thorac. Imaging 2020, 35, 361. [Google Scholar] [CrossRef]
- Van Timmeren, J.E.; Leijenaar, R.T.H.; Van Elmpt, W.; Wang, J.; Zhang, Z.; Dekker, A.; Lambin, P. Test-Retest Data for Radiomics Feature Stability Analysis: Generalizable or Study-Specific? Tomography 2016, 2, 361–365. [Google Scholar] [CrossRef]


| Training Set (n = 1381) | Independent Validation Set (n = 697) | |||
|---|---|---|---|---|
| CONTROL (n = 1200) | COVID (n = 181) | CONTROL (n = 500) | COVID (n = 197) | |
| Age (years) | 63.8 ± 14.4 | 64.4 ± 15.8 | 64.2 ± 14.0 | 69.1 ± 13.3 |
| Gender (% Male) | 52 | 56 | 51 | 56 |
| Normal (%) | 33 | 4.41 | 25.2 | 25 |
| Neoplasia (%) | 8.73 | 0 | 0 | 0 |
| CAP (%) | 12.50 | 8.10 | 6.6 | 8.6 |
| COPD (%) | 26 | 19.33 | 33.4 | 11.7 |
| Isolated pleurisy (%) | 6.2 | 1.10 | 4.2 | 4 |
| Pulmonary embolism (%) | 0.77 | 1.10 | 0 | 0 |
| Nodule (%) | 19 | 6.62 | 17.2 | 6.6 |
| Chronic inflammation (%) | 8.48 | 5.52 | 13.6 | 3 |
| Pneumothorax (%) | 0.68 | 0 | 0.6 | 0 |
| Isolated atelectasis (%) | 3.68 | 3.31 | 5.4 | 1.0 |
| Any Comorbidity | COVID Training Set (n = 181) |
|---|---|
| Neoplasia (%) | 23.7 |
| Acute Respiratory Failure (%) | 26.7 |
| Heart disorder (%) | 15.9 |
| Hypertension (%) | 6.8 |
| Diabetes (%) | 4.7 |
| Chronic renal failure (%) | 1.8 |
| Obesity (%) | 0 |
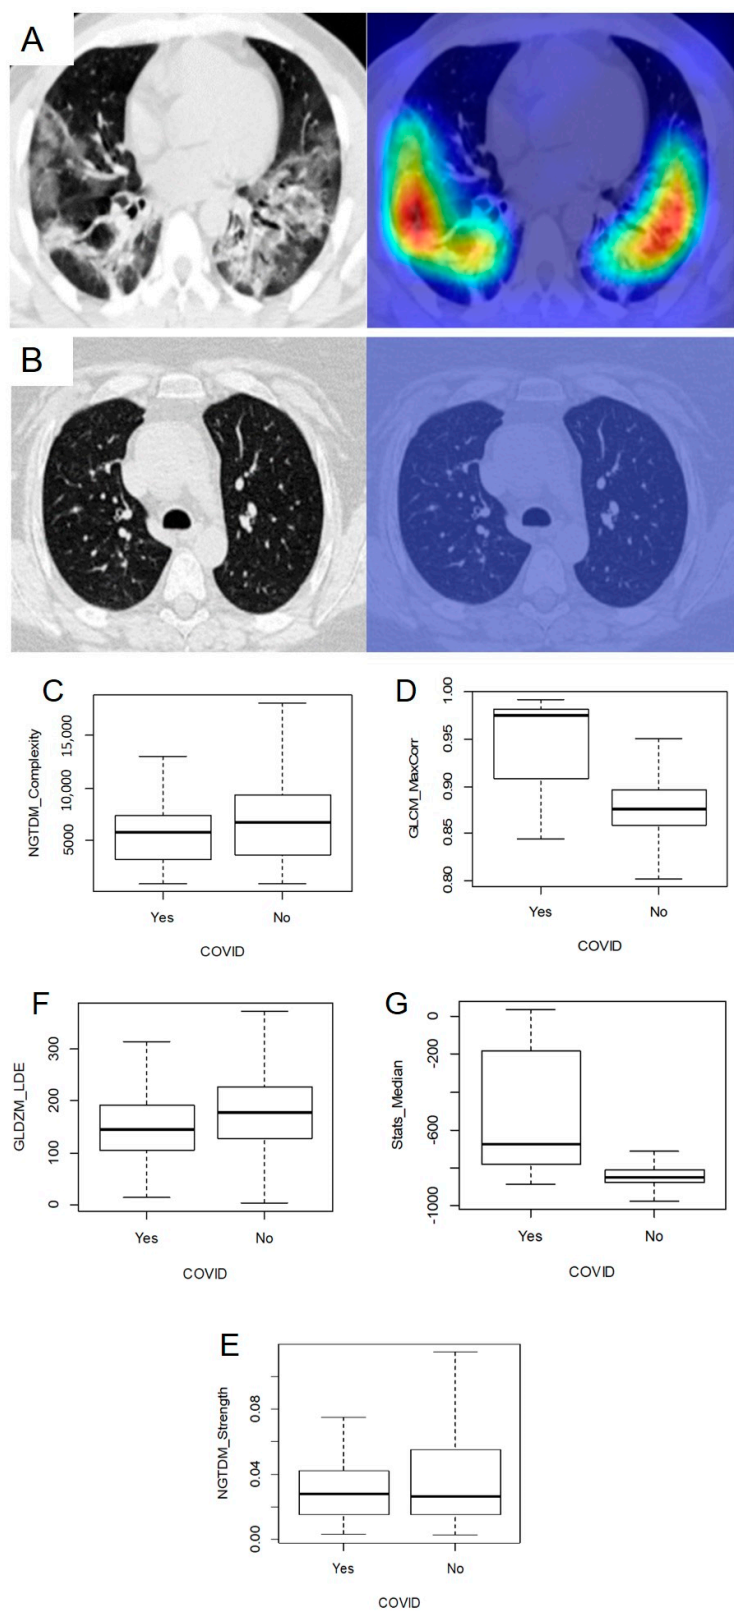
| Normal Chest CT | COVID-19 Positive | |
|---|---|---|
| NGTDM_Complexity | 7794.055 | 1147.344 |
| GLCM_MaxCorr | 0.8684842 | 0.9147317 |
| GLDZM_LDE | 143.07153 | 57.53219 |
| Stats_Median | −839 | −755 |
| NGTDM_Strength | 0.033166649 | 0.008062981 |
| SCORE | 0.01119137 | 0.765581 |
Publisher’s Note: MDPI stays neutral with regard to jurisdictional claims in published maps and institutional affiliations. |
© 2020 by the authors. Licensee MDPI, Basel, Switzerland. This article is an open access article distributed under the terms and conditions of the Creative Commons Attribution (CC BY) license (http://creativecommons.org/licenses/by/4.0/).
Share and Cite
Guiot, J.; Vaidyanathan, A.; Deprez, L.; Zerka, F.; Danthine, D.; Frix, A.-N.; Thys, M.; Henket, M.; Canivet, G.; Mathieu, S.; et al. Development and Validation of an Automated Radiomic CT Signature for Detecting COVID-19. Diagnostics 2021, 11, 41. https://doi.org/10.3390/diagnostics11010041
Guiot J, Vaidyanathan A, Deprez L, Zerka F, Danthine D, Frix A-N, Thys M, Henket M, Canivet G, Mathieu S, et al. Development and Validation of an Automated Radiomic CT Signature for Detecting COVID-19. Diagnostics. 2021; 11(1):41. https://doi.org/10.3390/diagnostics11010041
Chicago/Turabian StyleGuiot, Julien, Akshayaa Vaidyanathan, Louis Deprez, Fadila Zerka, Denis Danthine, Anne-Noëlle Frix, Marie Thys, Monique Henket, Gregory Canivet, Stephane Mathieu, and et al. 2021. "Development and Validation of an Automated Radiomic CT Signature for Detecting COVID-19" Diagnostics 11, no. 1: 41. https://doi.org/10.3390/diagnostics11010041