Volatile Compounds Emitted from the Cat Urine Contaminated Carpet before and after Treatment with Marketed Cleaning Products: A Simultaneous Chemical and Sensory Analysis


Abstract
:
1. Summary
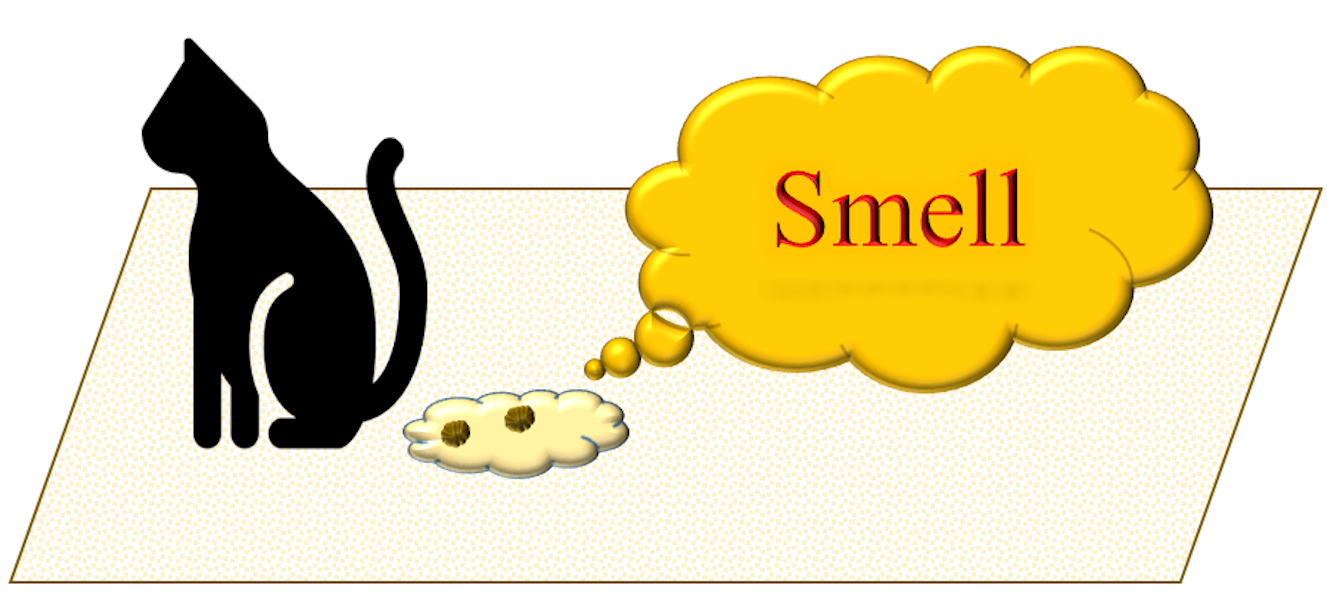
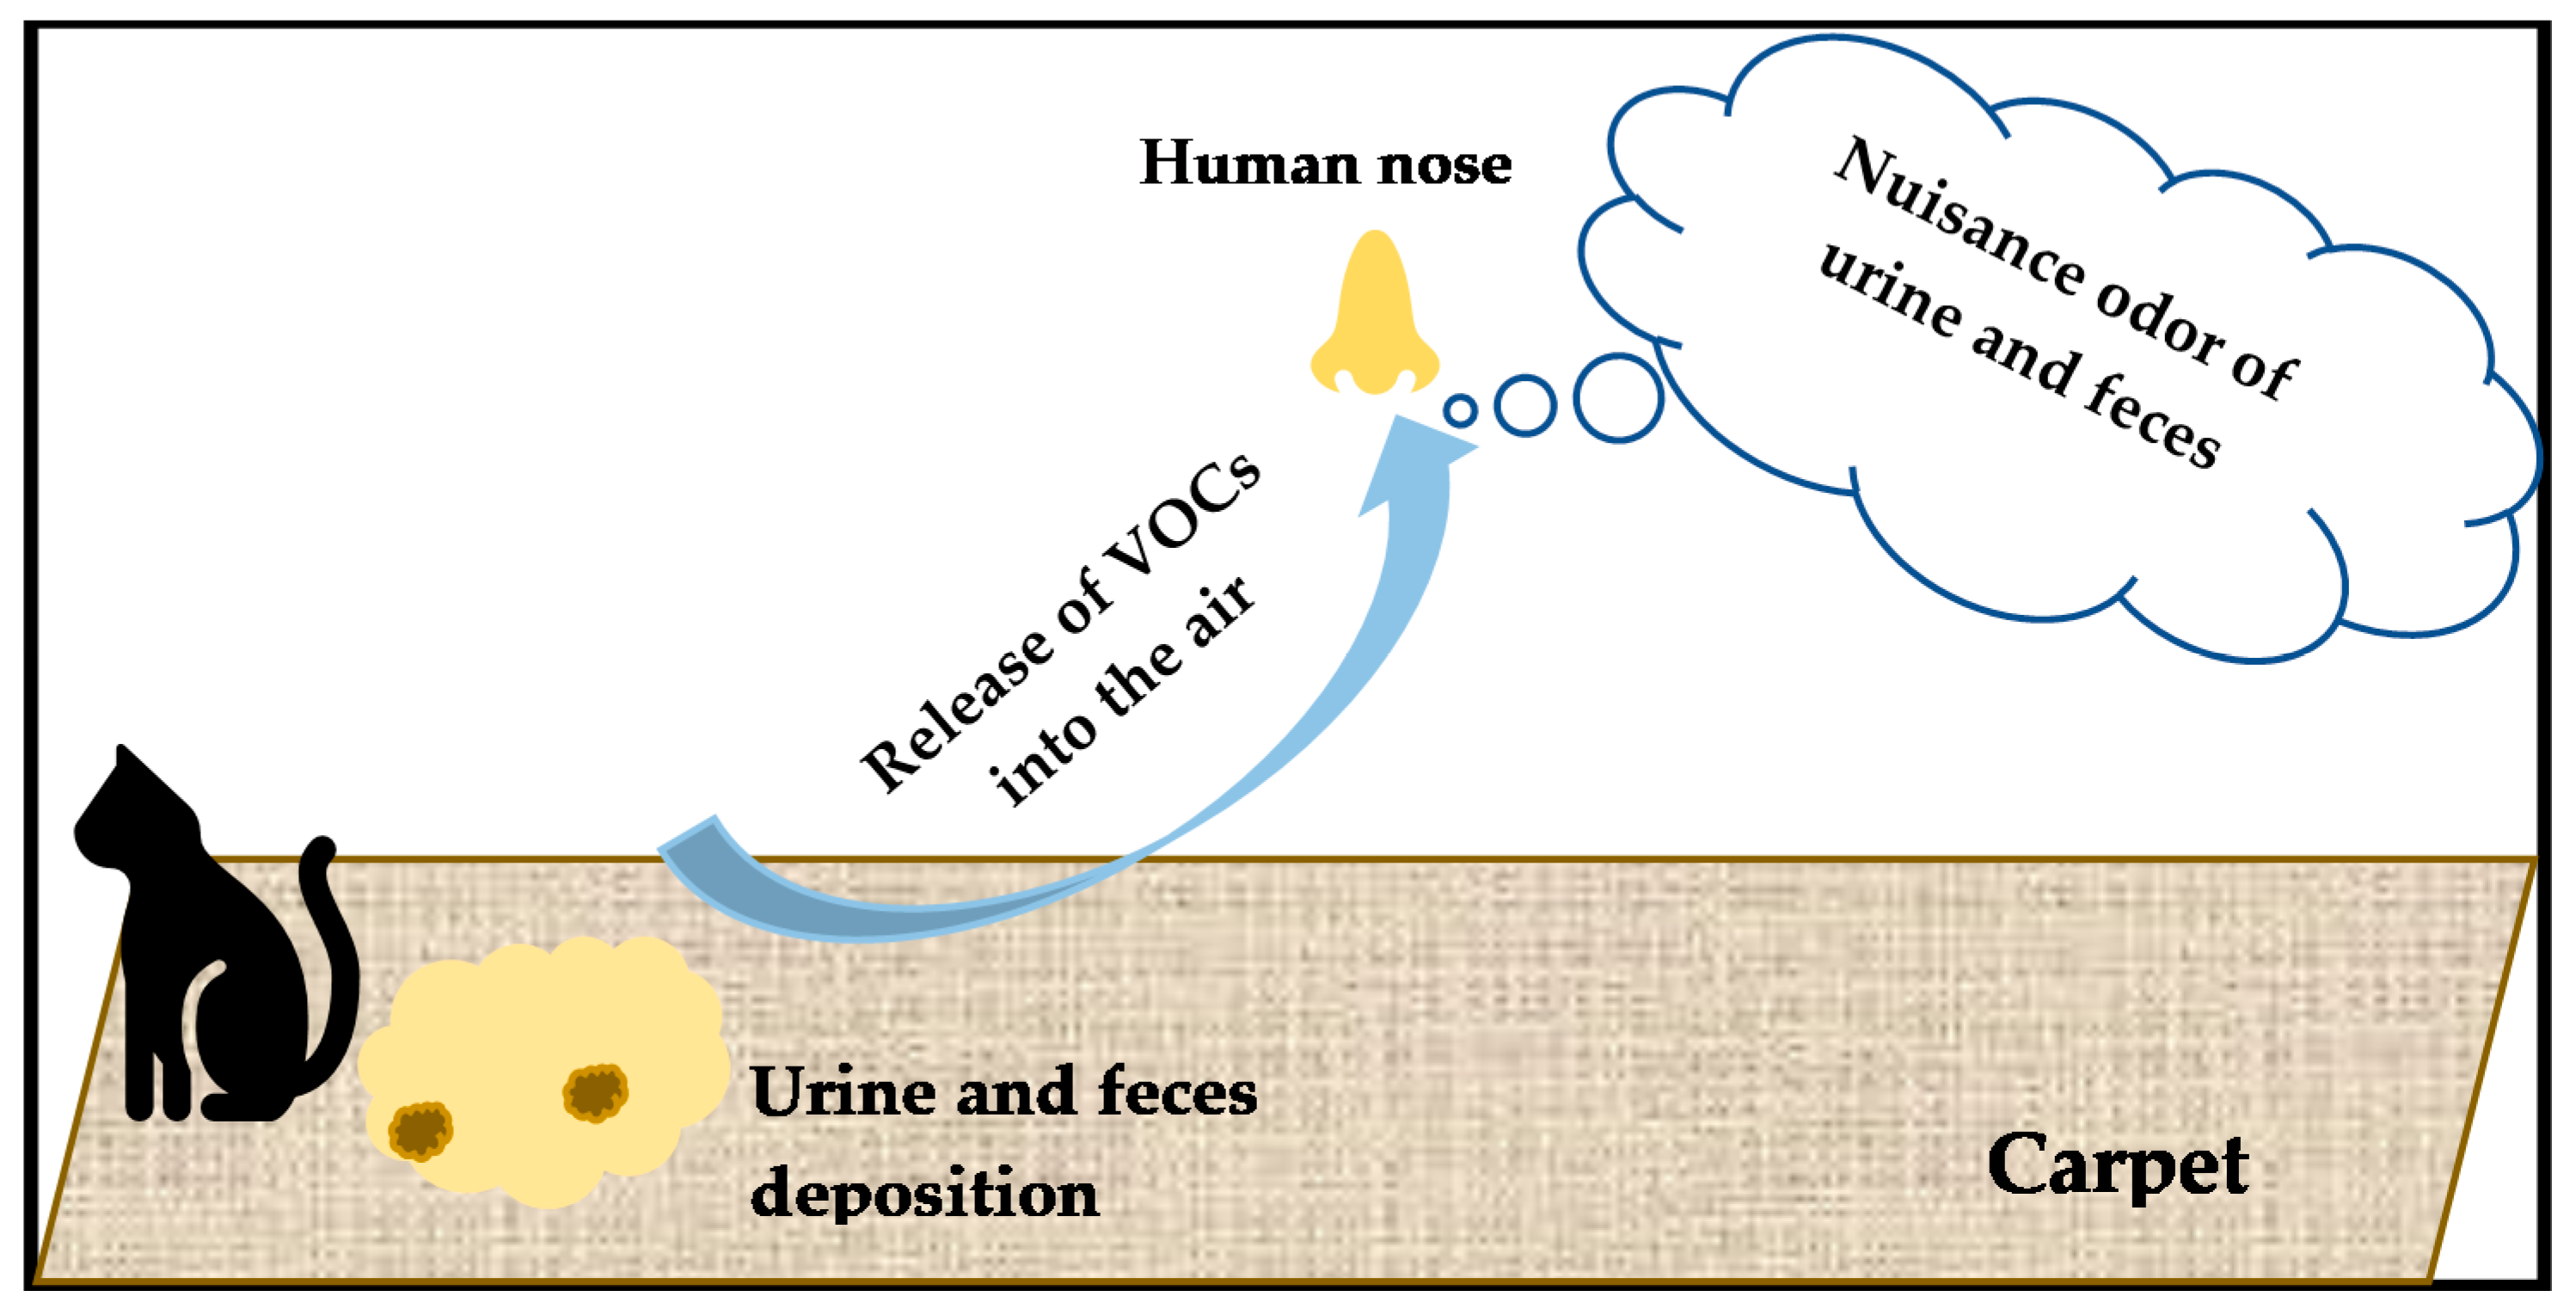
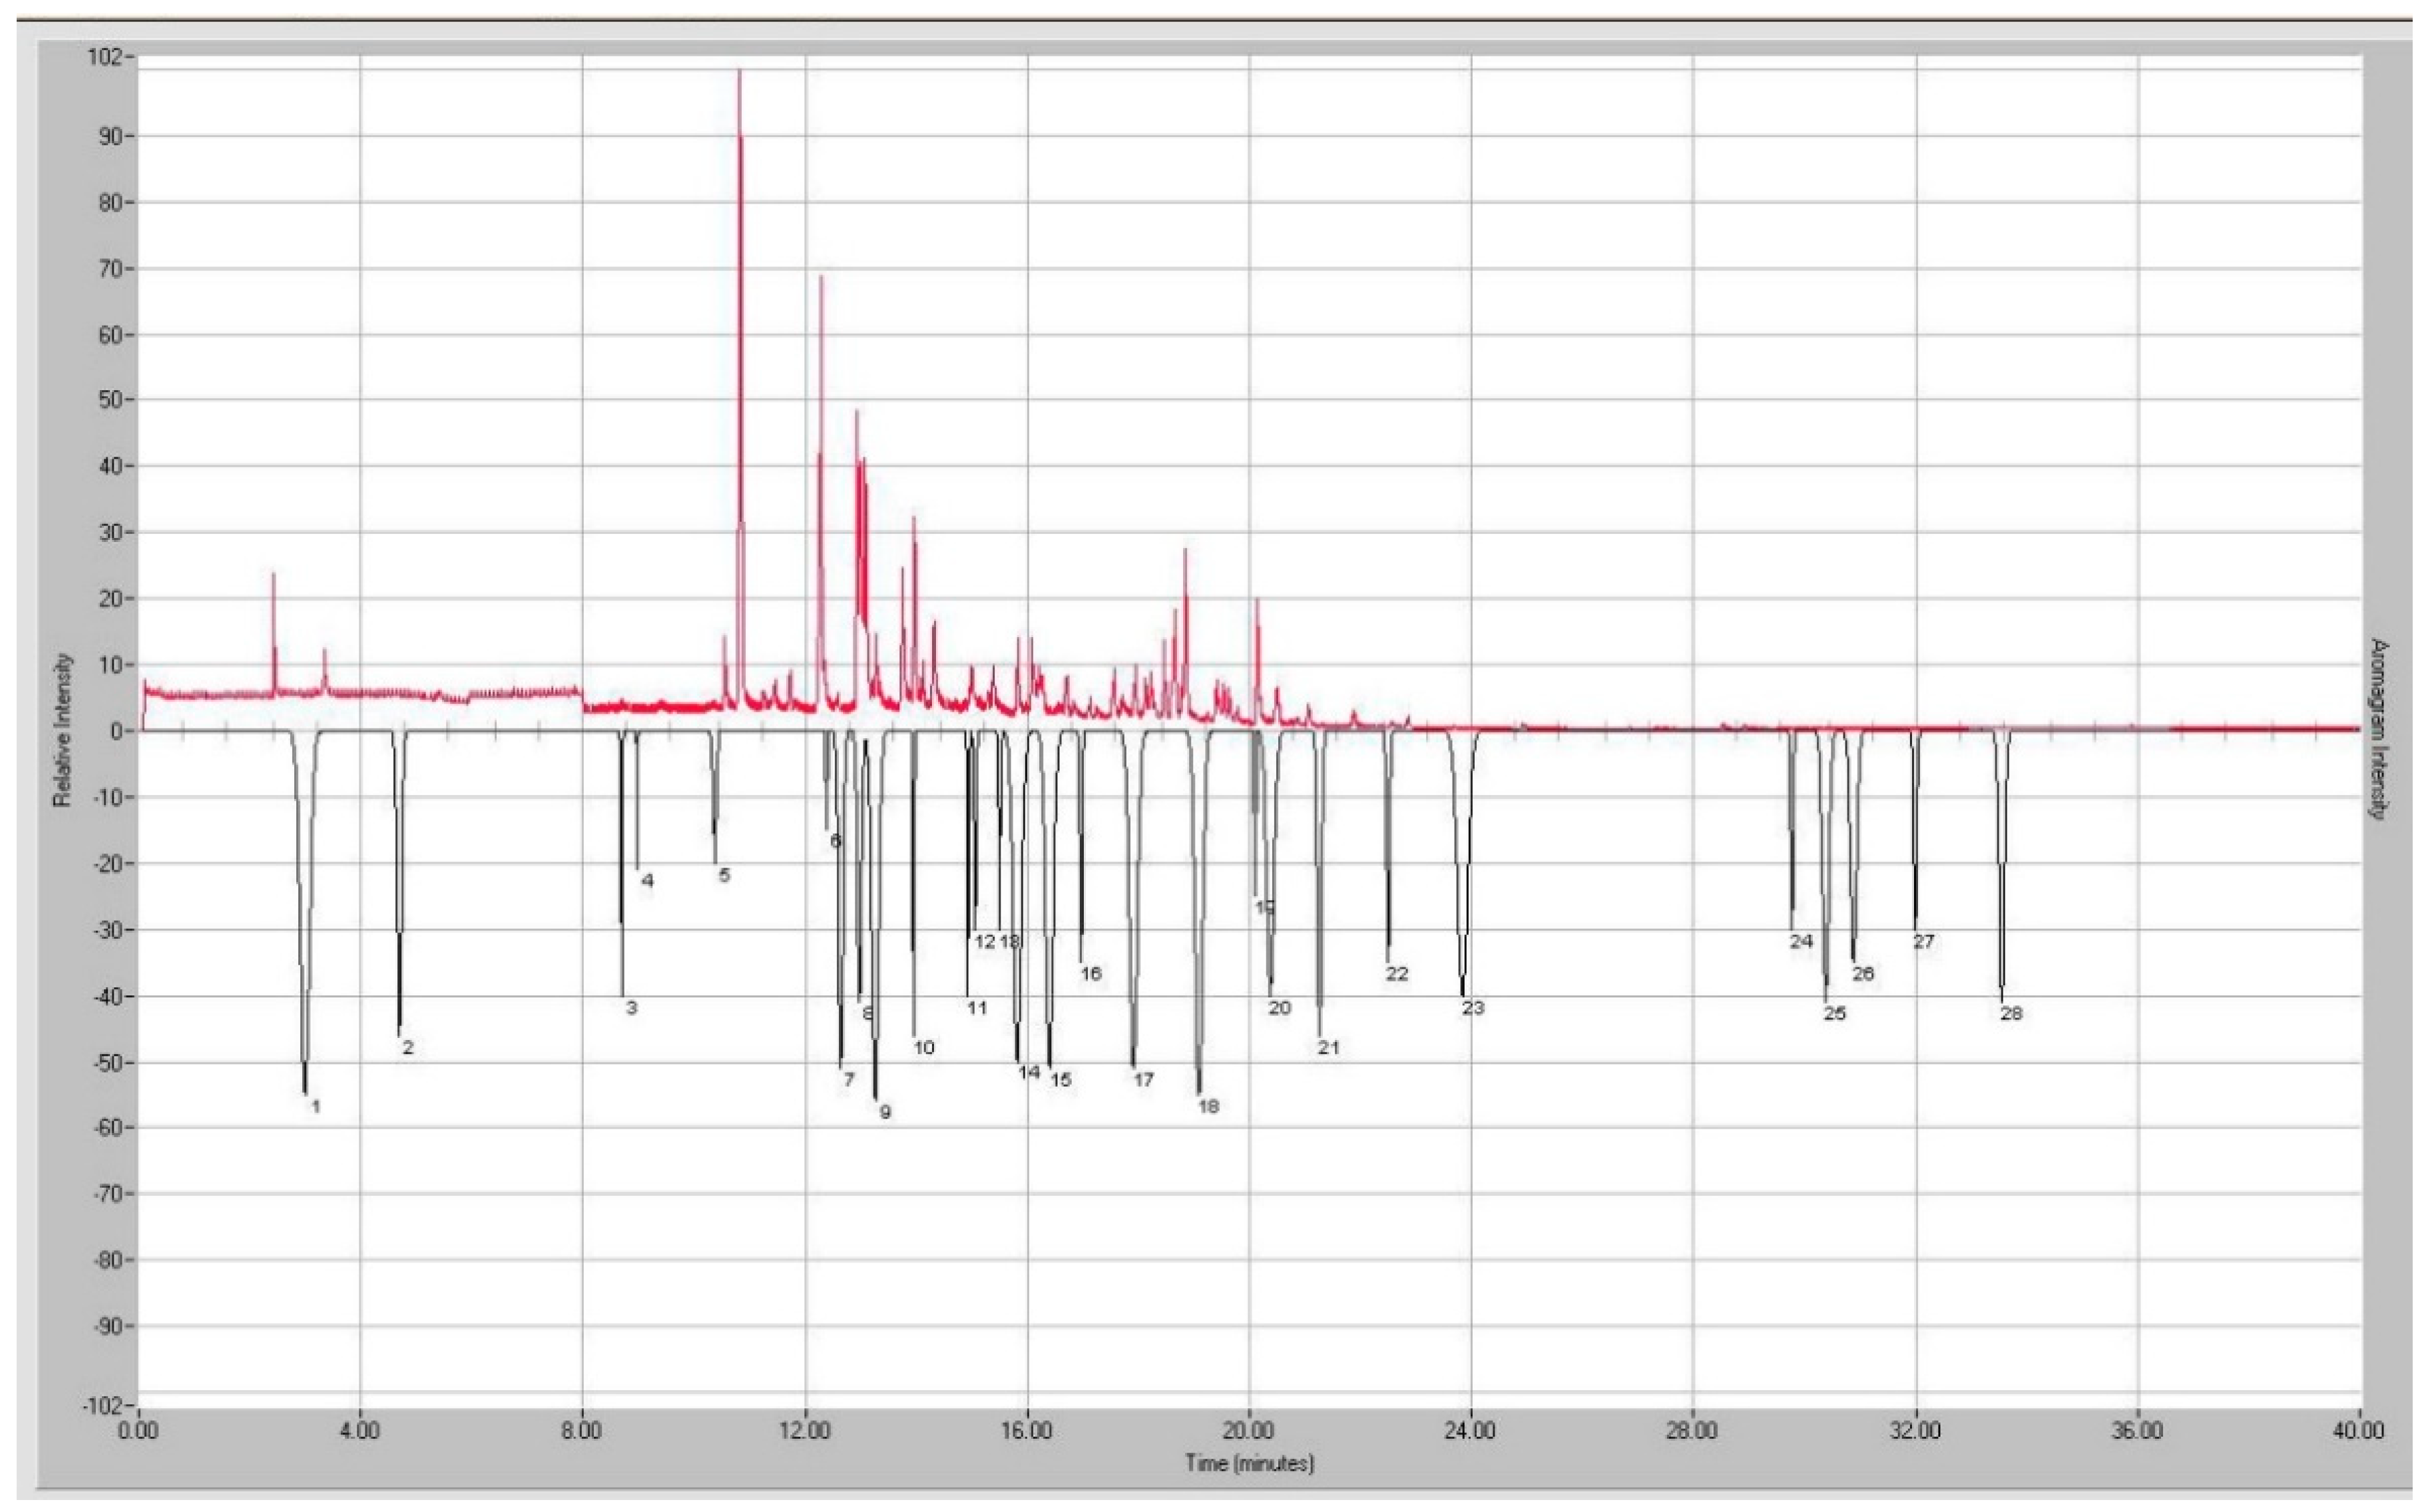
- The cat urine and urine and M. luteus treated carpet + subfloorings emitted malodors on day 0 (Table S1). However, the passage of time, aging of the urine, and M. luteus treated carpet + subflooring caused the emergence of additional malodors described as strong ‘fishy’ (most likely trimethylamine) and ‘moldy’ (most likely 3-octanone).
- The strong mold-like smell was observed by directly smelling the 15-day aged urine and M. luteus treated carpet samples. The 3-octanone’s ‘mushroom-’ or ‘mold-like’ smell was also detected by using a MS detector for M. luteus-urine contaminated test carpet samples (Table S2).
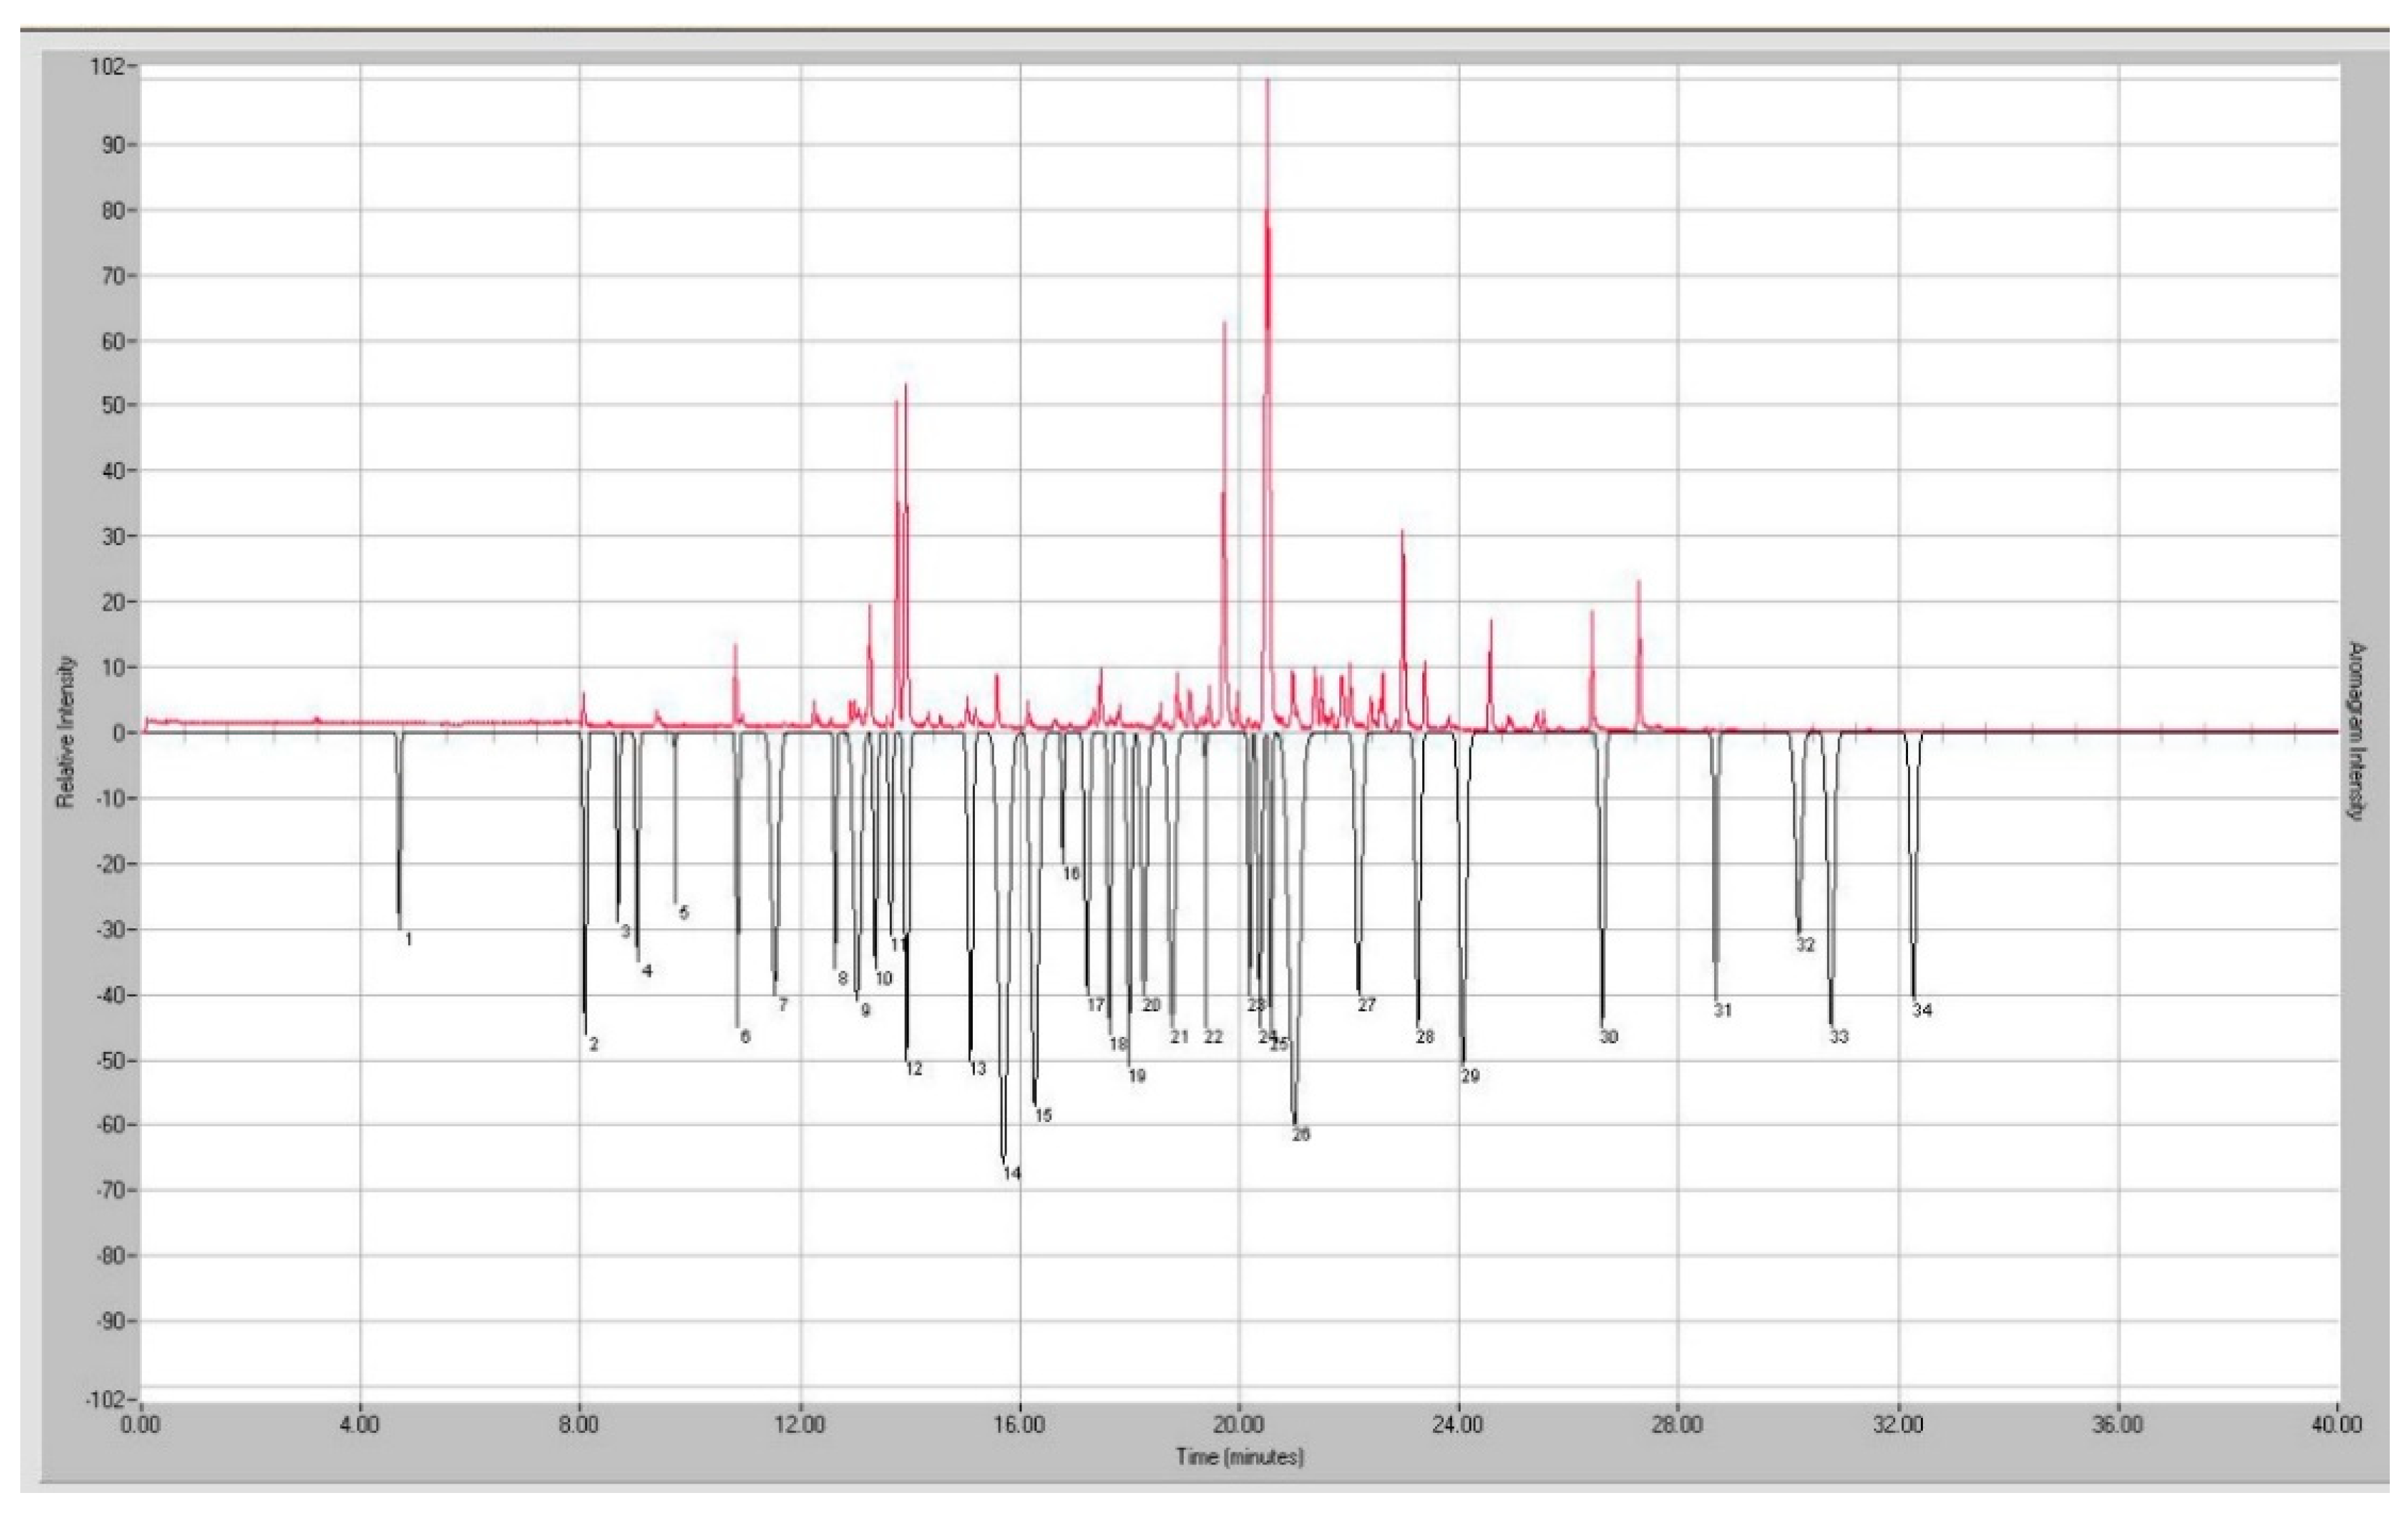
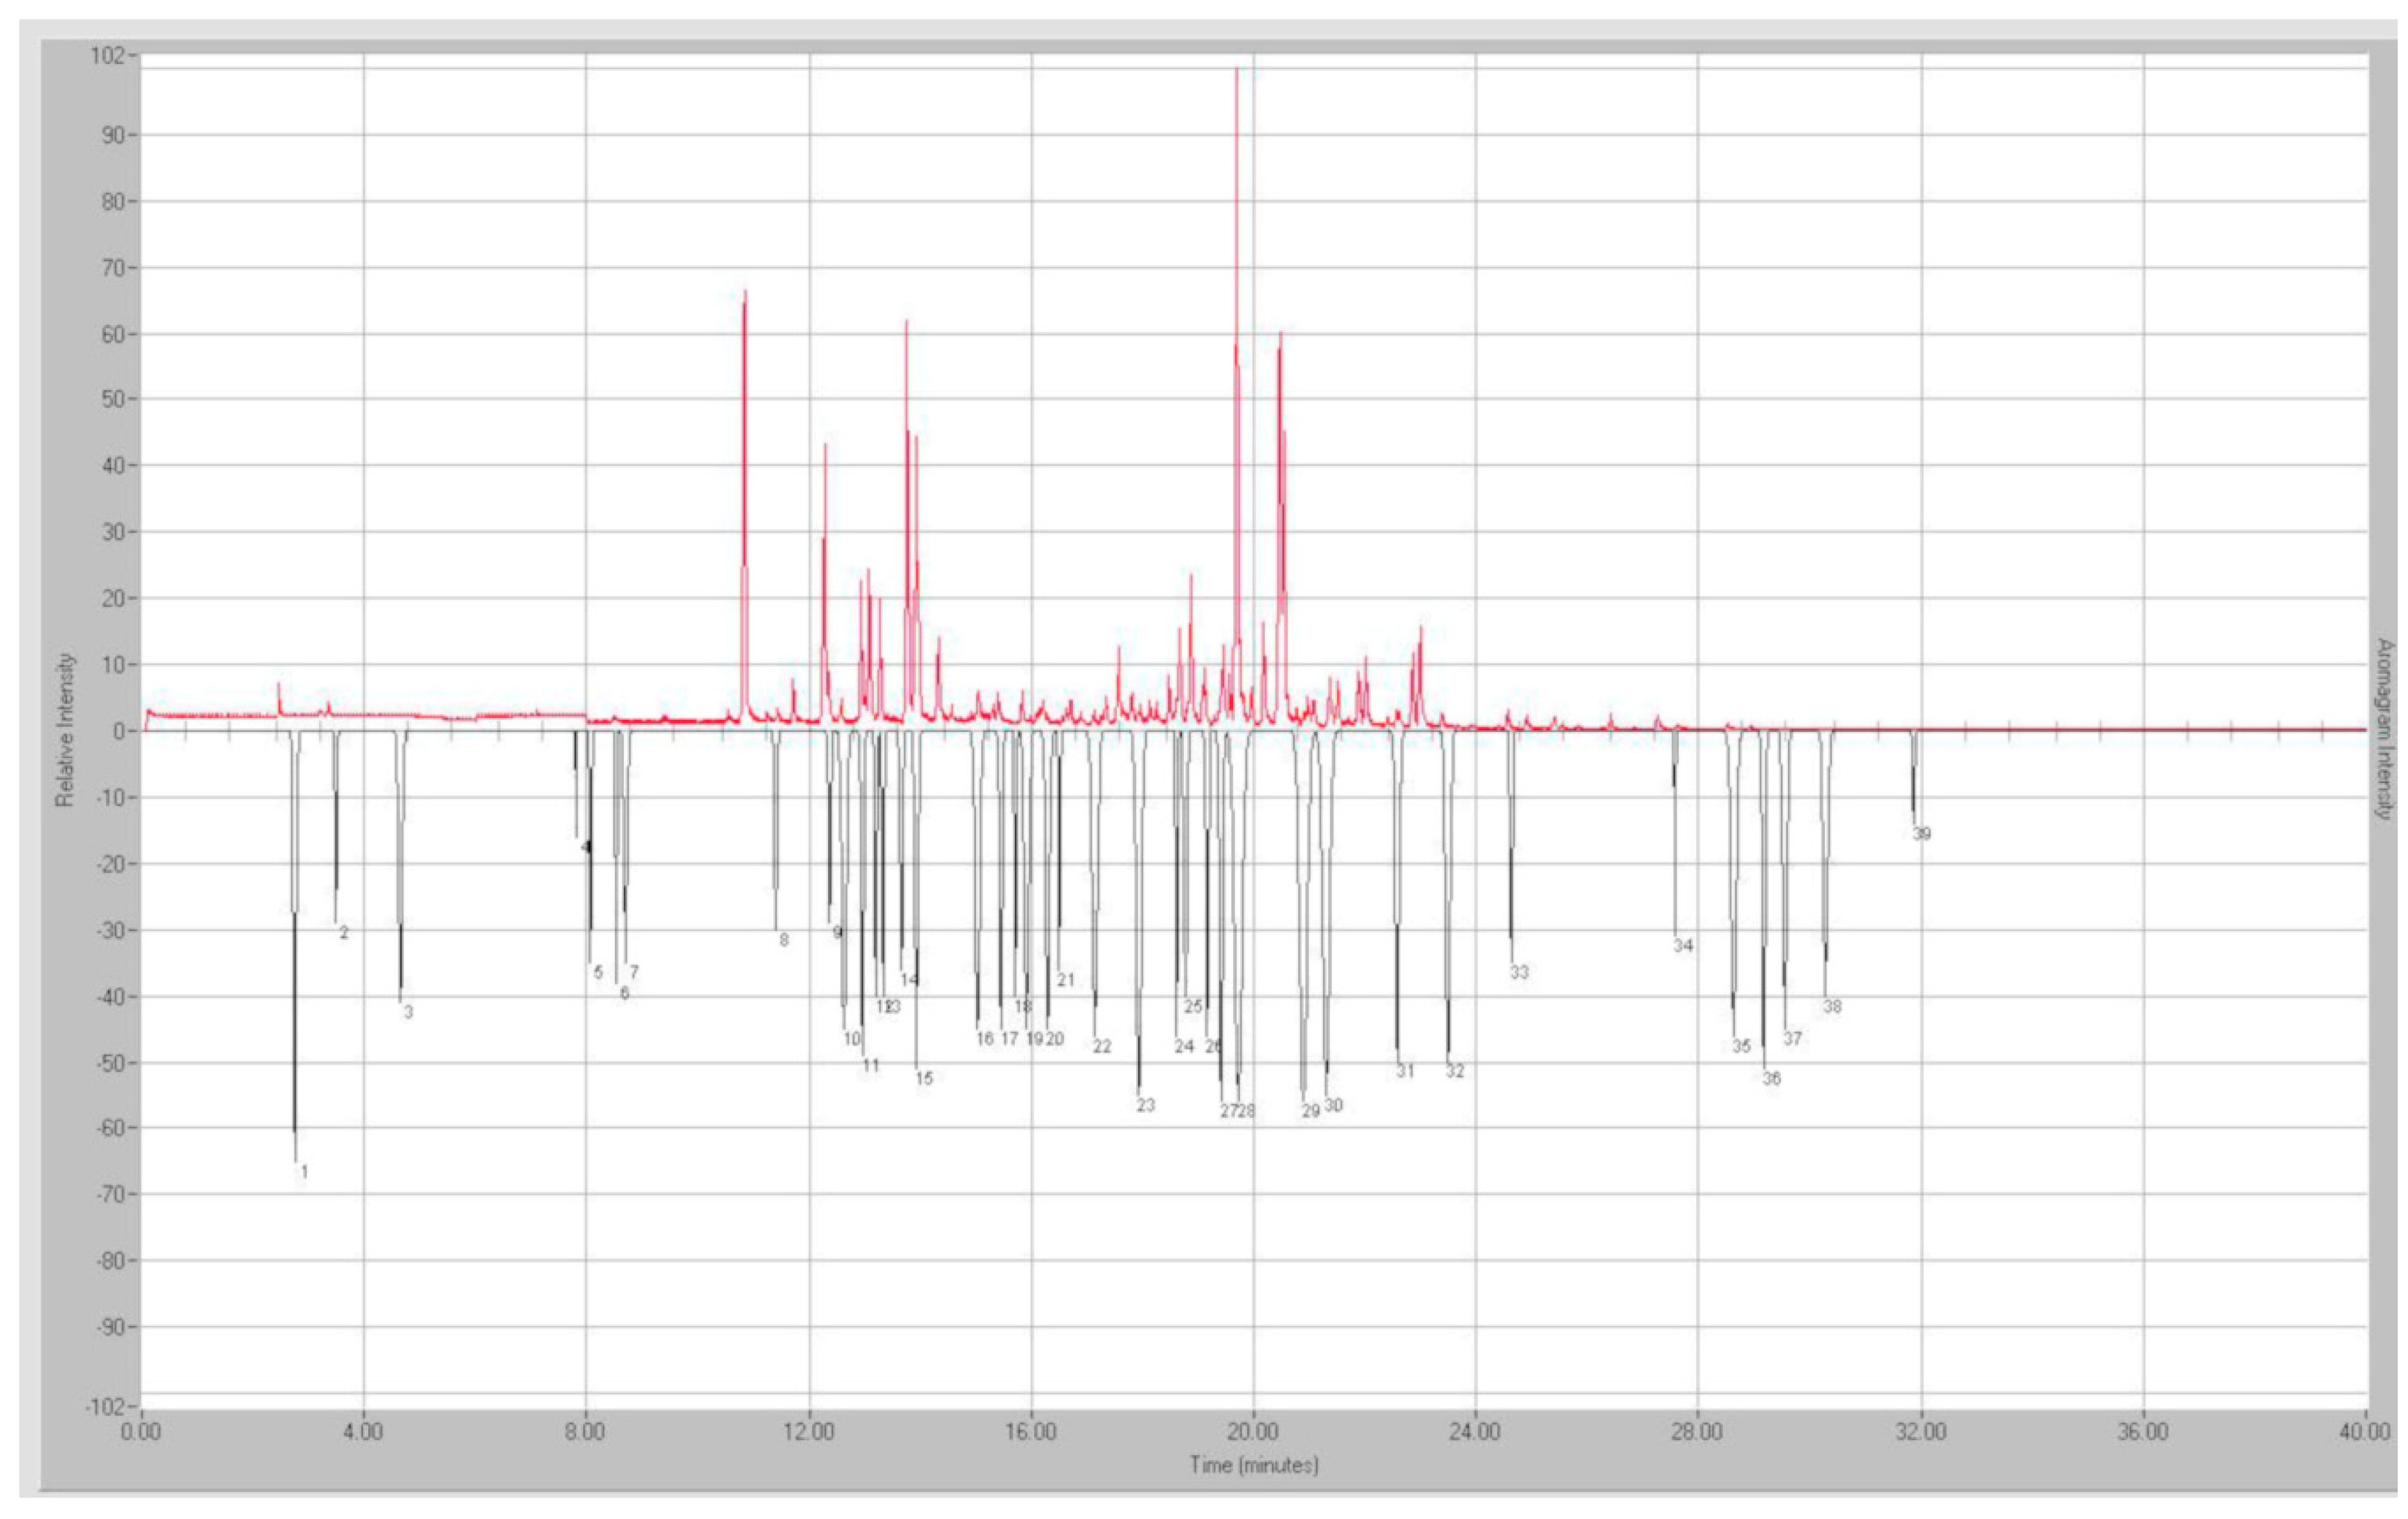
- On day 0, all four cleaning products treated test carpet + subflooring + urine + M. luteus had a profound ‘fresh’ and ‘camphorous’ smell when smelled with a human nose, and this observation was supported by the simultaneous chemical sensory analyses via GC-MS-O (Table S3). With the passage of time, the product-treated carpet had a less prominent ‘fresh’ ‘camphorous’ smell (Table S4). Also, the ‘fish-like’ and ‘mold-like’ odors emerged from the cleaning product-treated carpet + subflooring materials.
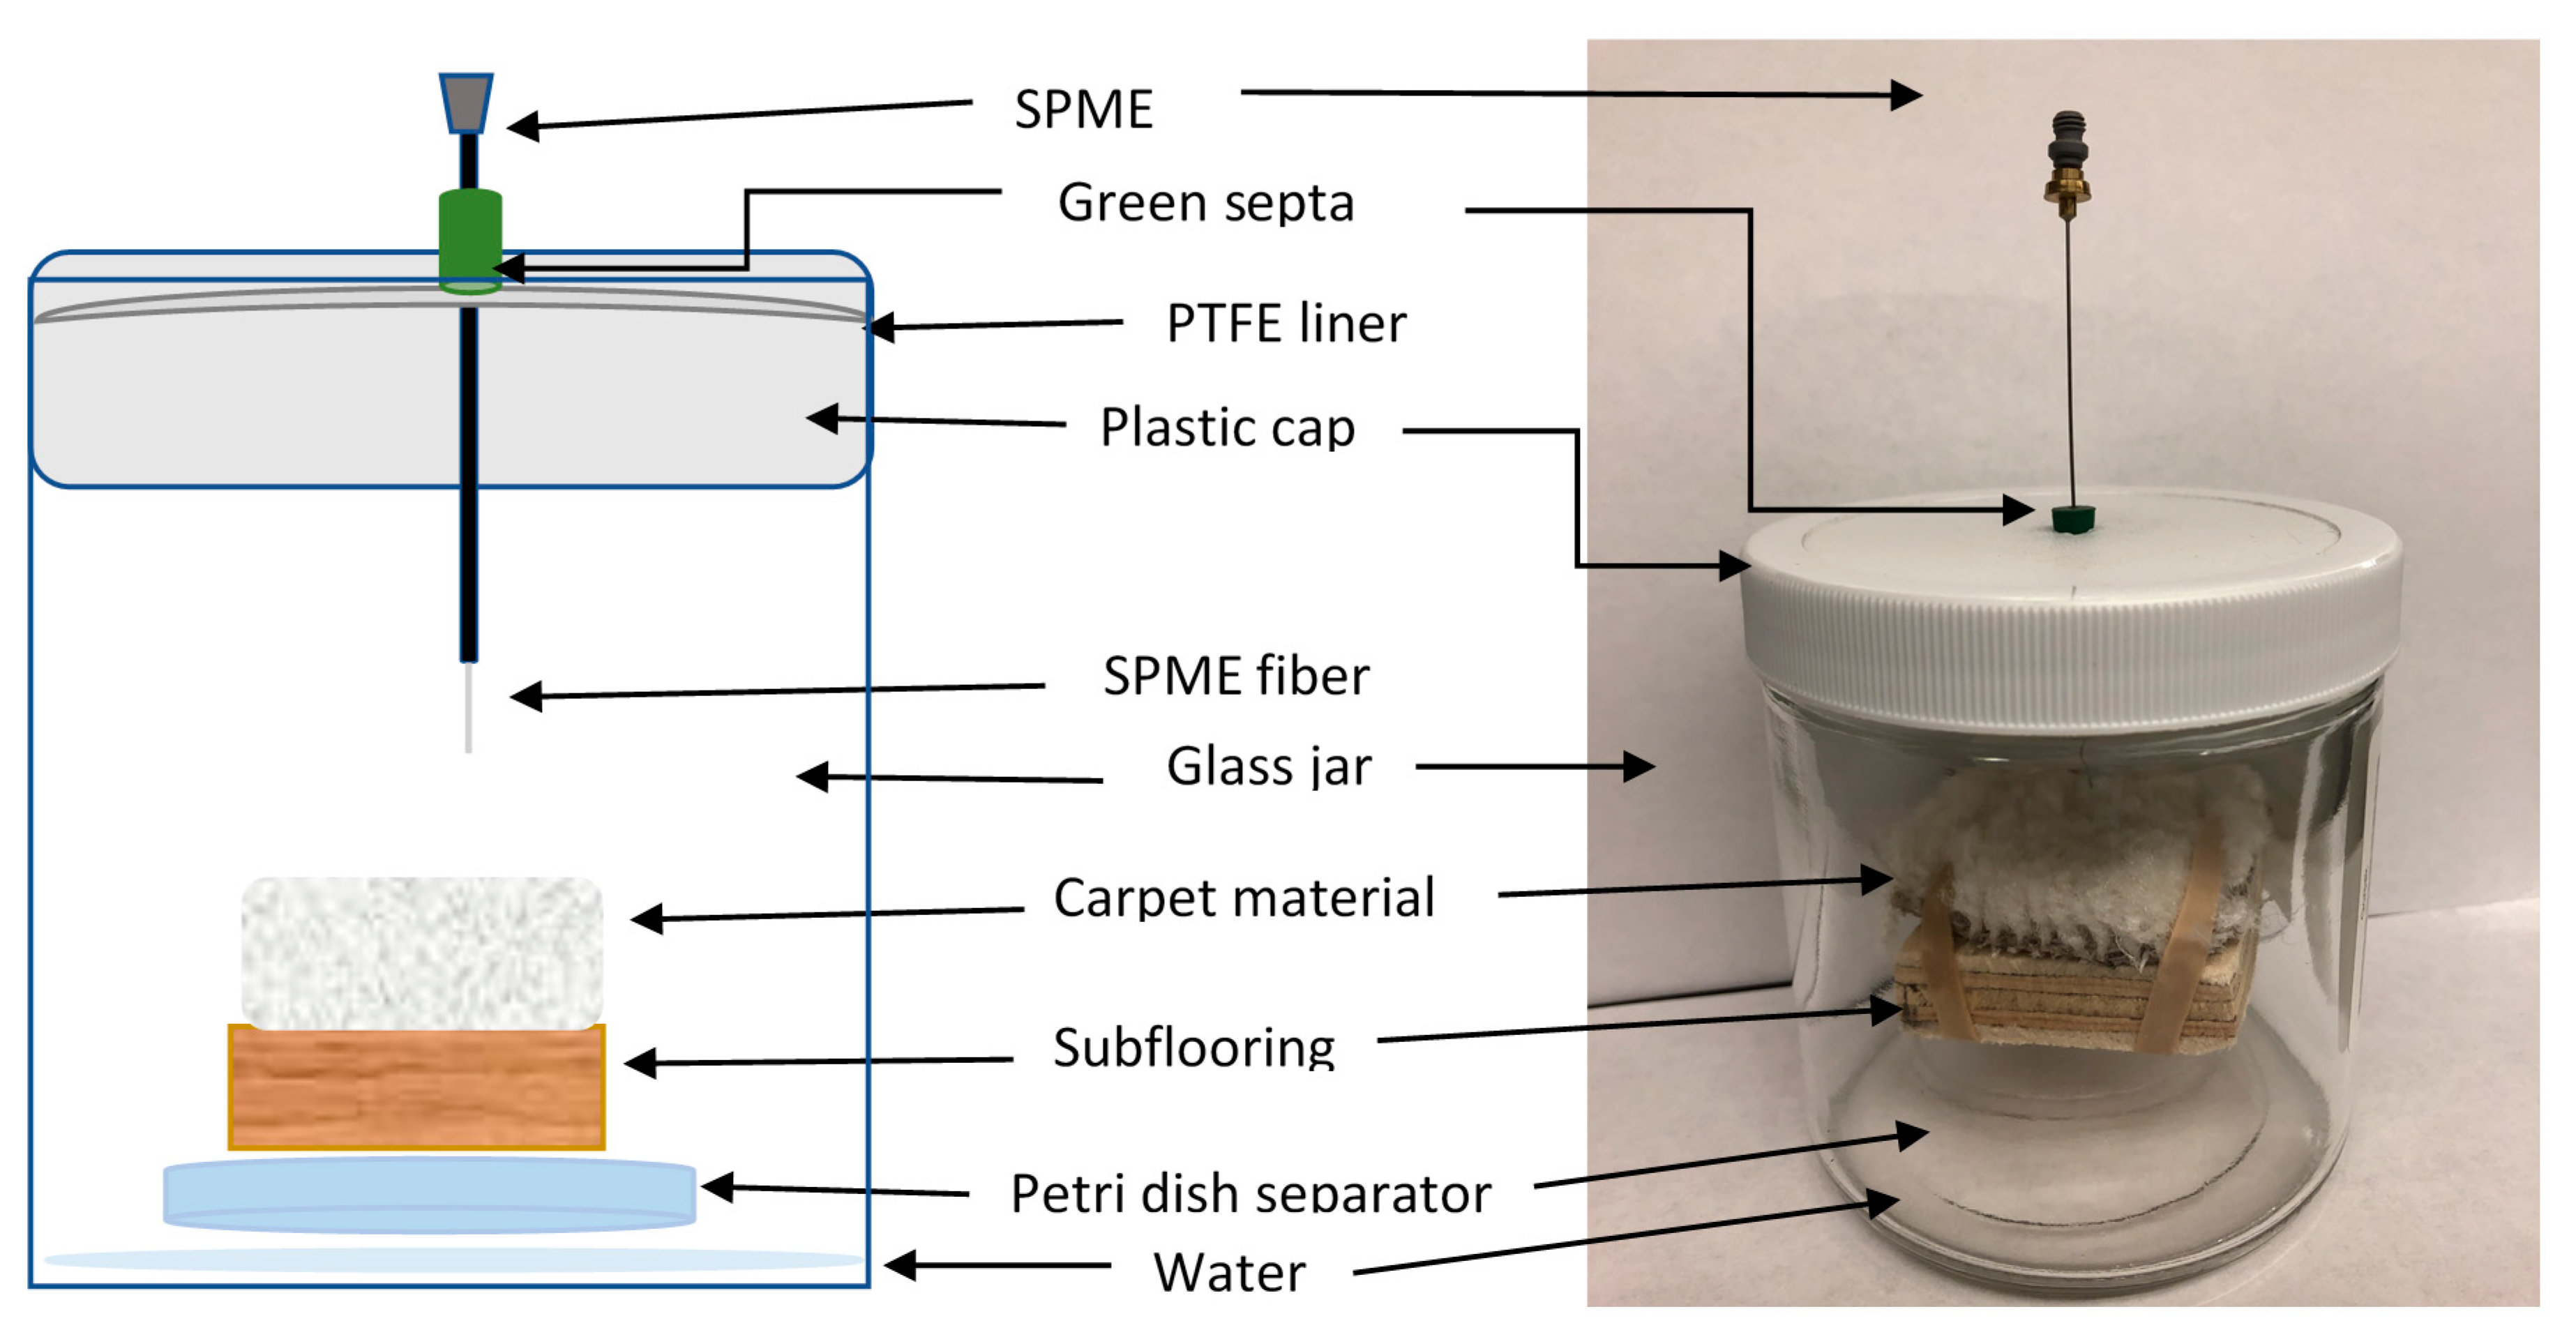
2. Data Description
3. Methods
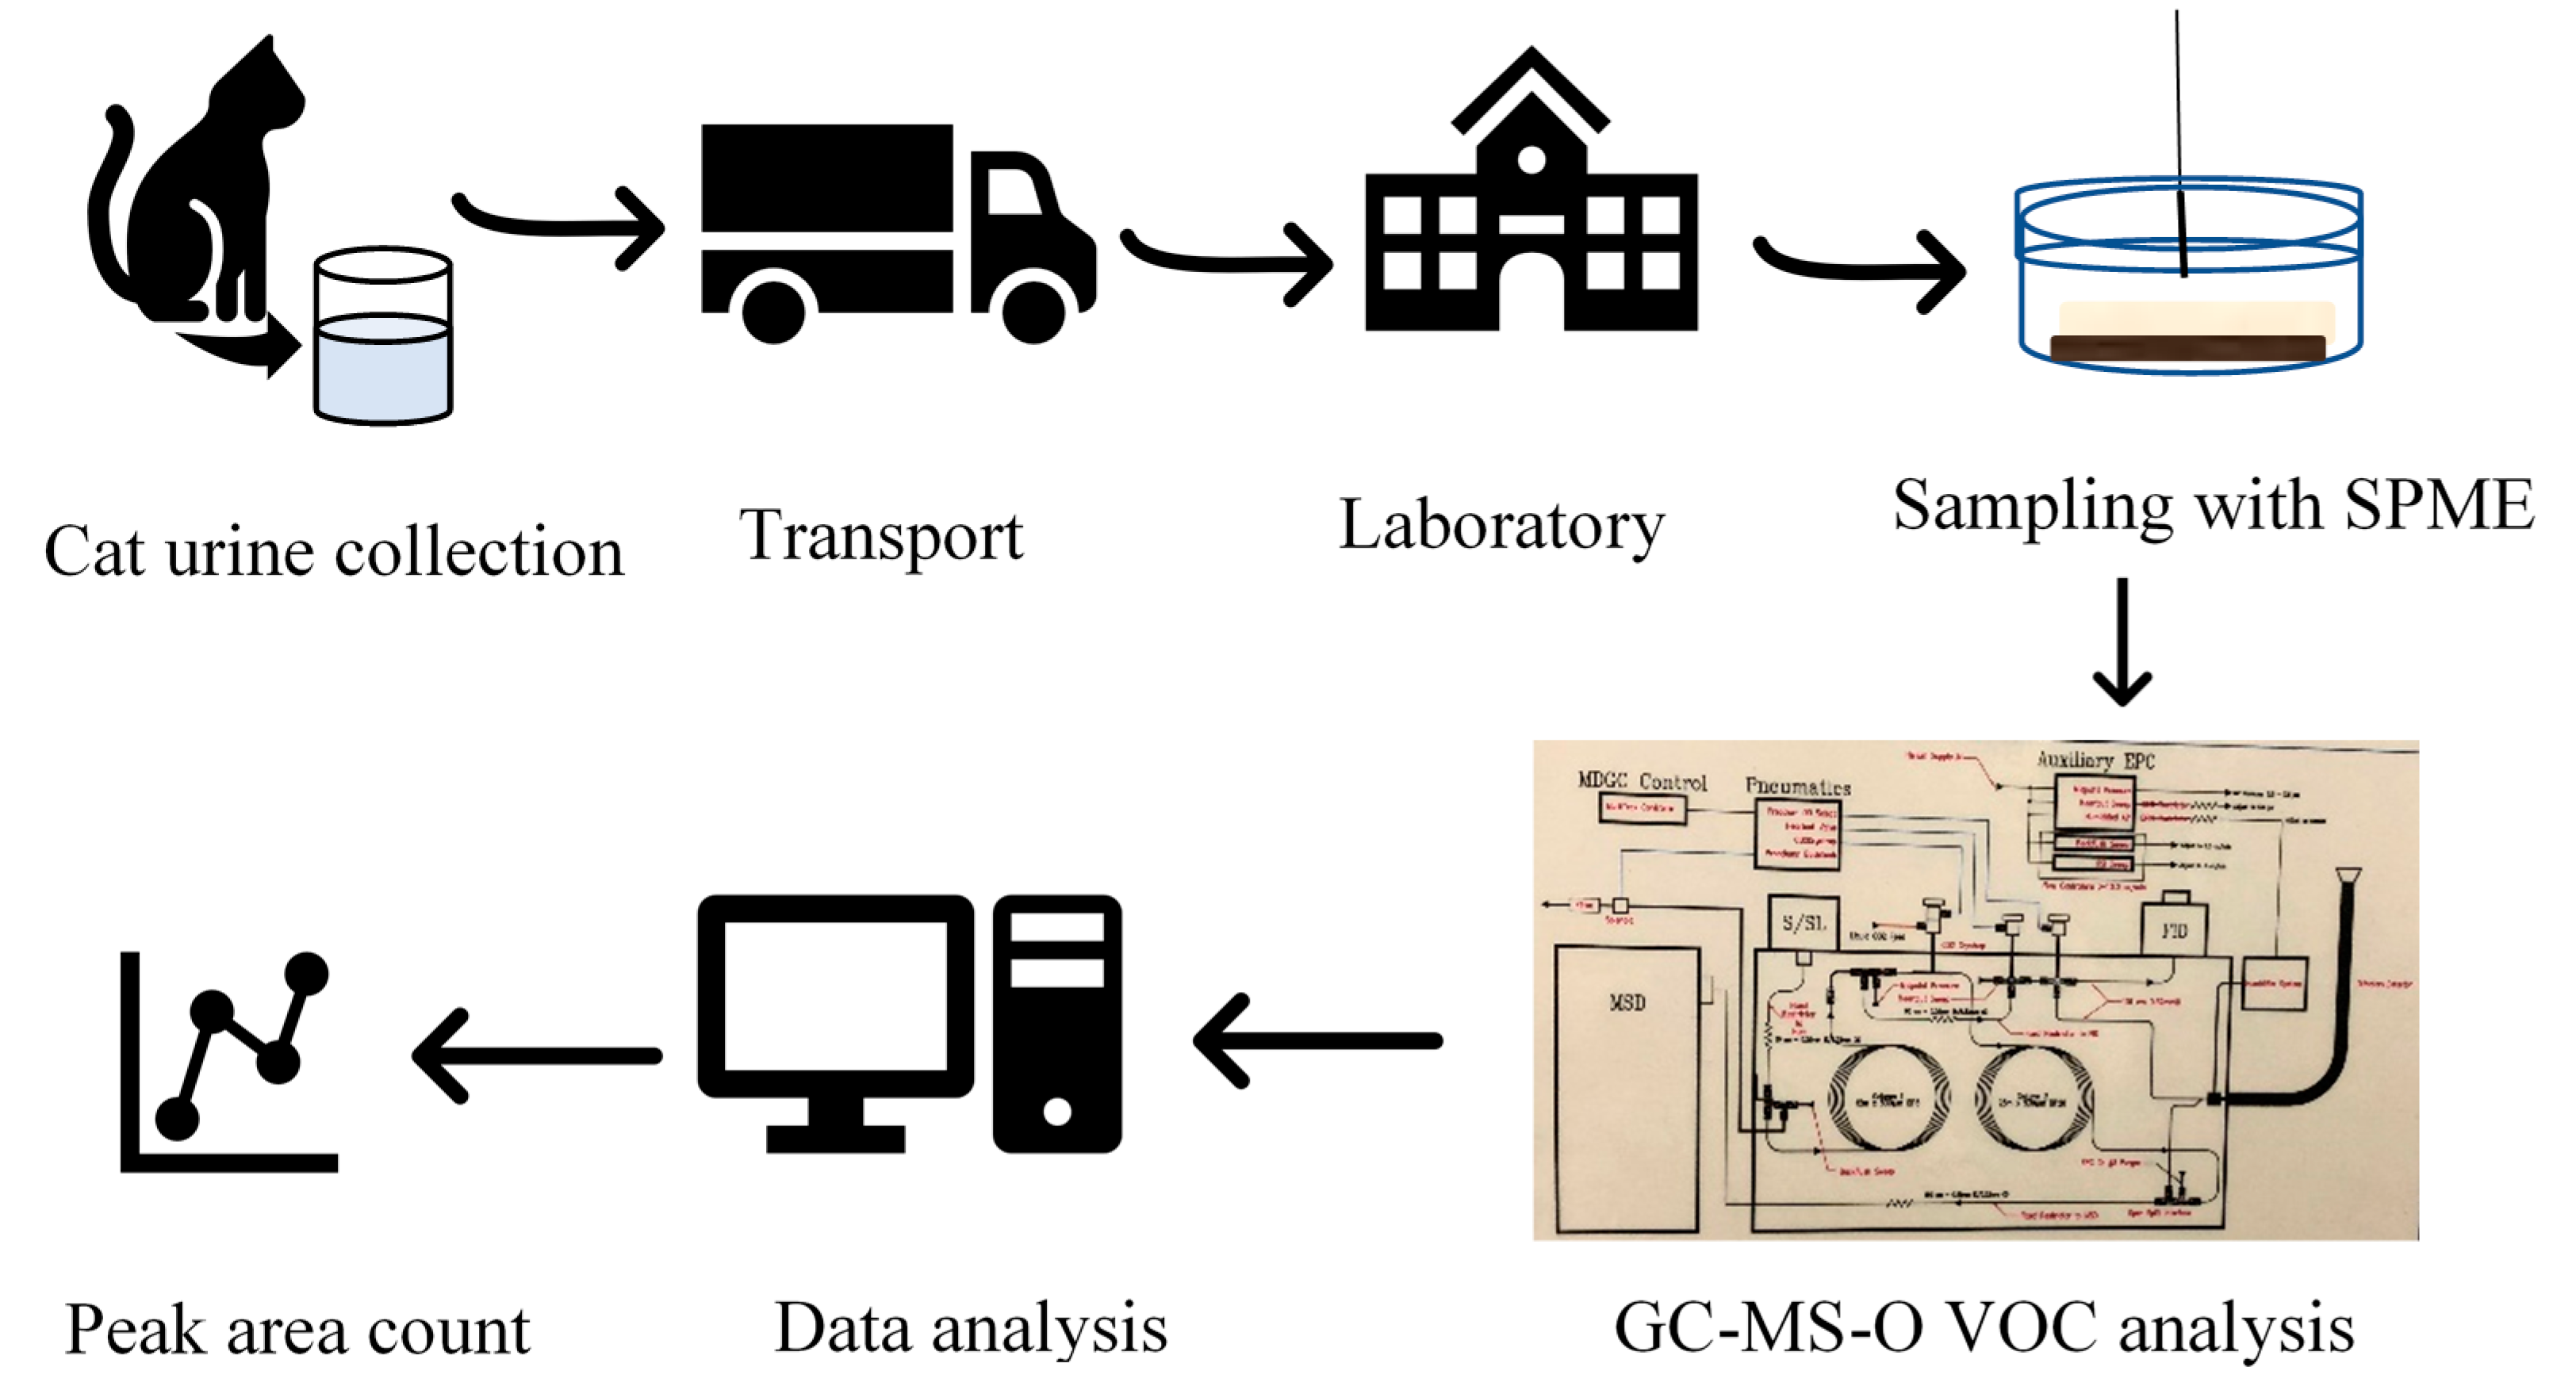
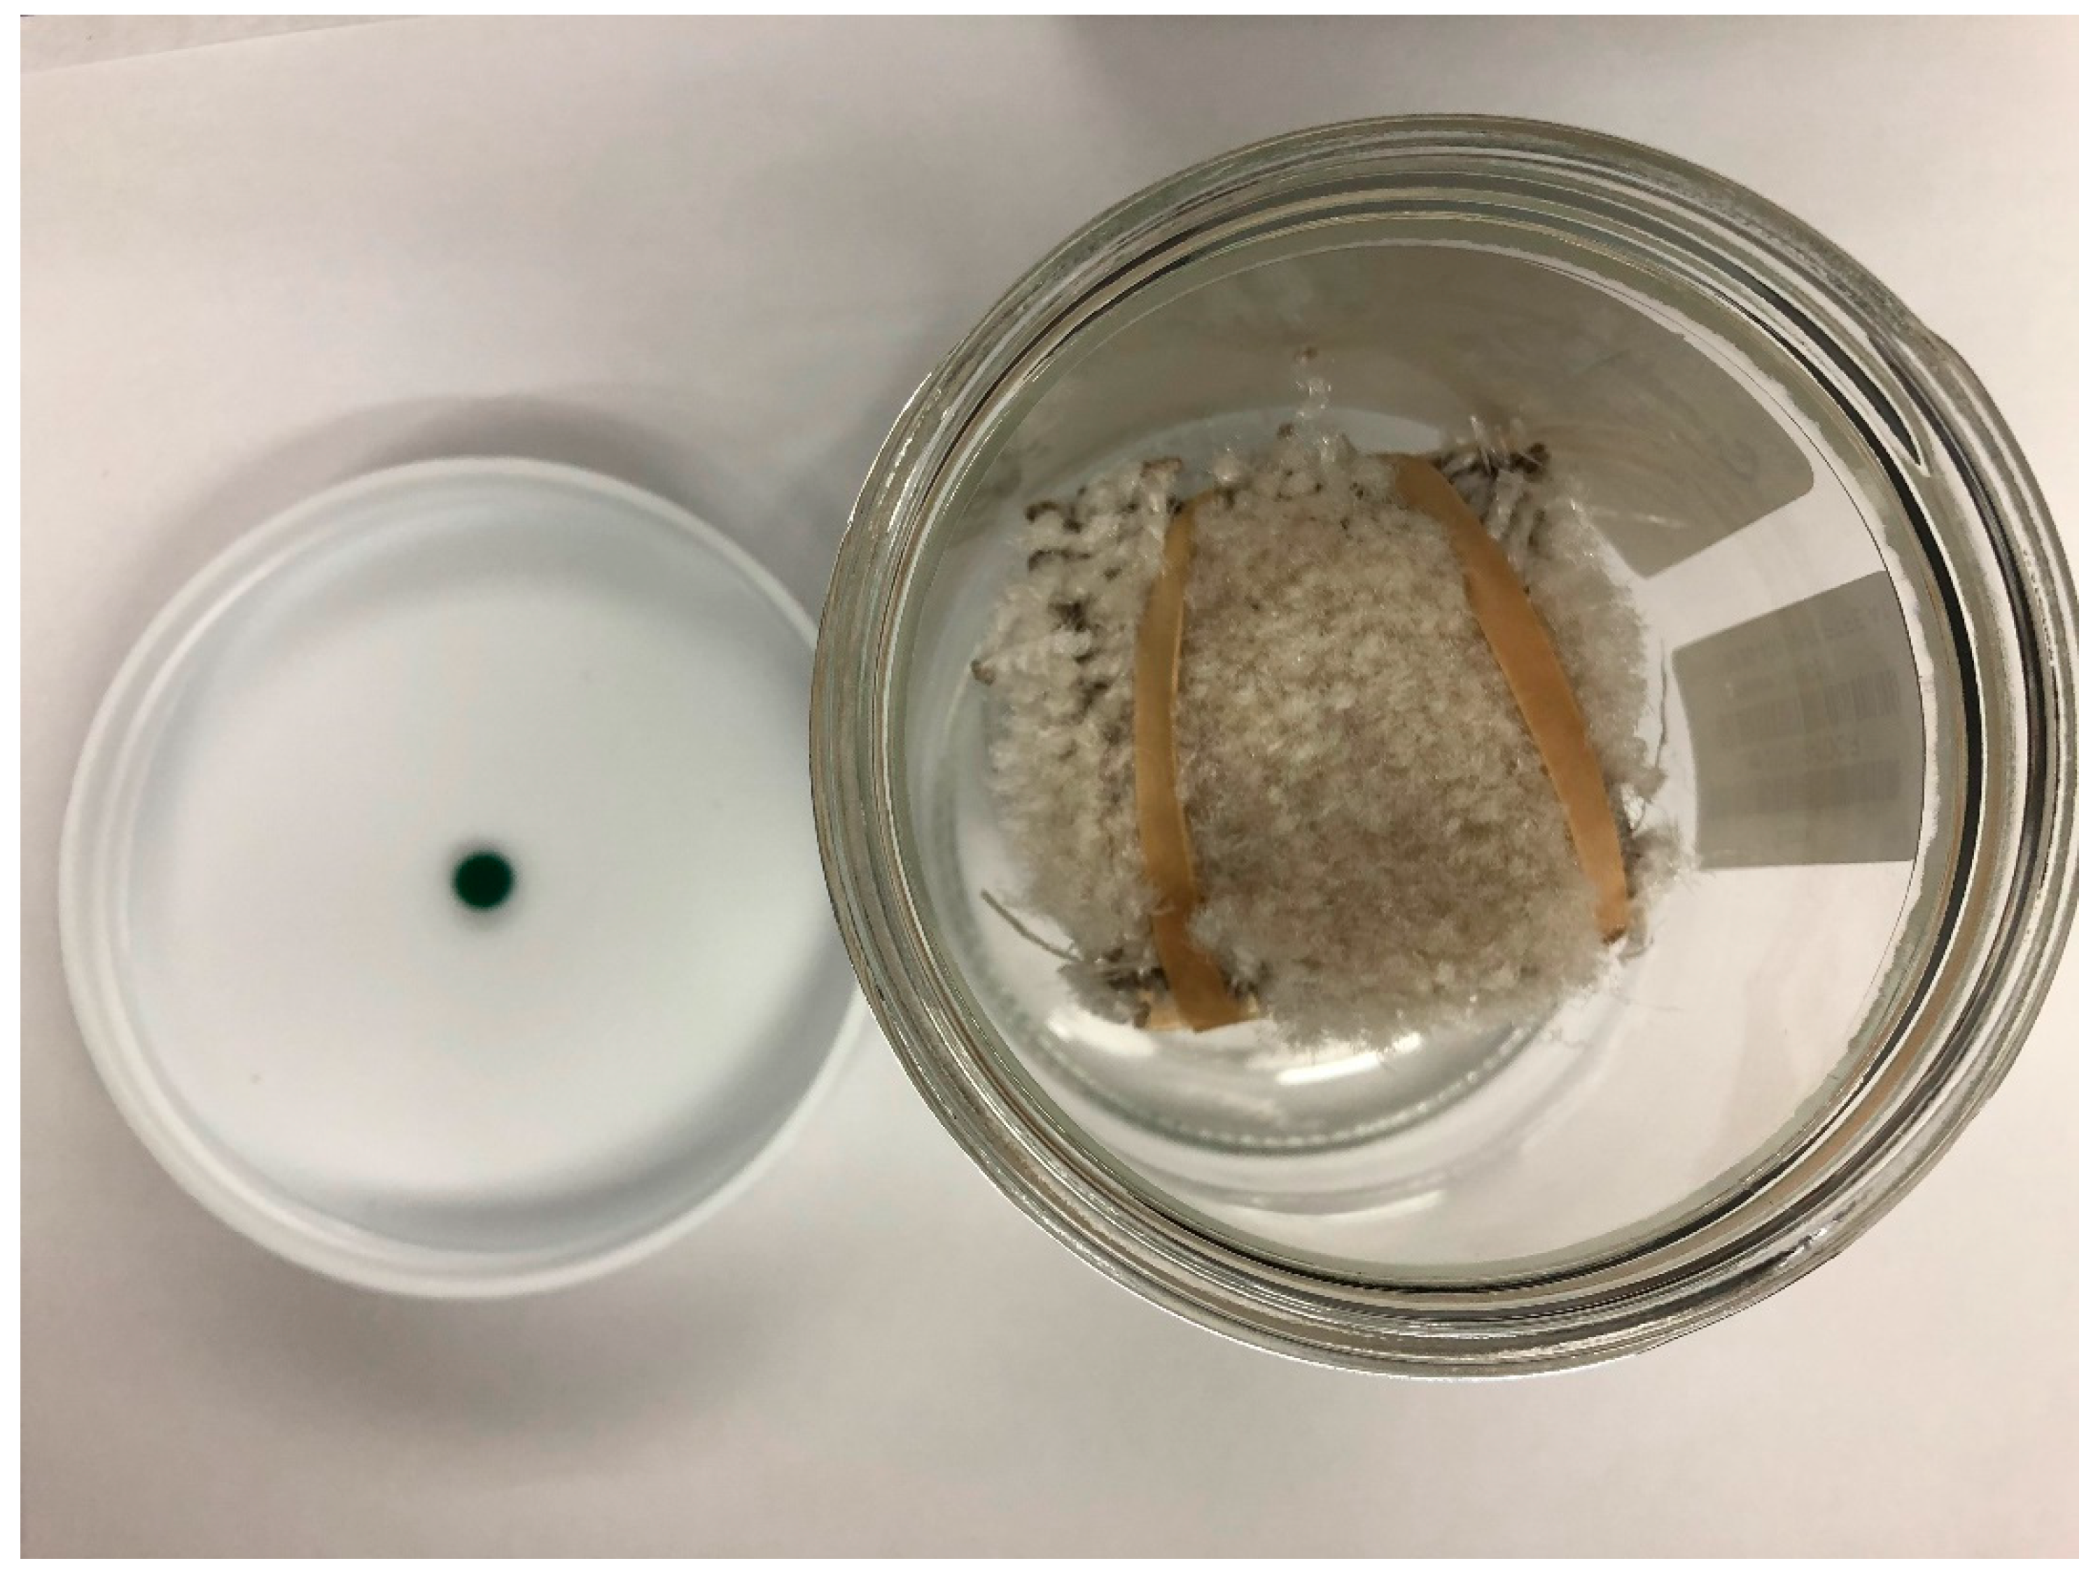
3.1. Cat Urine Collection and Sample Preparation
3.2. Data Acquisition and Analysis
4. User Notes
Supplementary Materials
Author Contributions
Funding
Acknowledgments
Conflicts of Interest
Appendix A


References
- Suzuki, C.; Miyazaki, T.; Yamashita, T.; Miyazaki, M. GC X GC-MS-based volatile profiling of male domestic cat urine and olfactory abilities of cats to discriminate temporal changes and individual differences in urine. J. Chem. Ecol. 2019, 45, 579–587. [Google Scholar] [CrossRef] [PubMed]
- Miyazaki, M.; Miyazaki, T.; Nishimura, T.; Hojo, W.; Yamashita, T. The chemical basis of species, sex and individual recognition using feces in the domestic cat. J. Chem. Ecol. 2018, 44, 364–373. [Google Scholar] [CrossRef] [PubMed]
- Westall, R.G. The amino acids and other ampholytes of urine 2. The isolation of a new Sulphur-containing amino acid from cat urine. Biochem. J. 1953, 55, 244–248. [Google Scholar] [CrossRef] [PubMed] [Green Version]
- American Veterinary Medical Association. U.S. Pet Ownership Statistics. Available online: https://www.avma.org (accessed on 10 July 2020).
- The Carpet and Rug Institute. Research and Resources. Available online: https://carpet-rug.org/resources/research-and-resources/#carpet-statistics (accessed on 10 July 2020).
- Hodgson, A.T.; Wooley, J.D.; Daisey, J.M. Emissions of volatile organic compounds from new carpets measured in a large-scale environmental chamber. J. Air. Waste Manag. Assoc. 1993, 43, 316–324. [Google Scholar] [CrossRef] [PubMed]
- Bouillard, L.; Michel, O.; Dramaix, M.; Devleeschouwer, M. Bacterial contamination of indoor air, surfaces, and settled dust, and related dust endotoxin concentrations in healthy office buildings. Ann. Agric. Environ. Med. 2005, 12, 187–192. [Google Scholar] [PubMed]
- Soso, S.B.; Koziel, J.A. Characterizing the scent and chemical composition of Panther leo marking fluid using solid-phase microextraction and multidimensional gas chromatography-mass spectrometry-olfactometry. Sci. Rep. 2017, 7, 5137–5152. [Google Scholar] [CrossRef] [PubMed]
- Soso, S.B.; Koziel, J.A. Analysis of Odorants in marking fluid of Siberian tiger (Panthera tigris altaica) using simultaneous sensory and chemical analysis with headspace solid-phase microextraction and multidimensional gas chromatography-mass spectrometry-olfactometry. Molecules 2016, 21, 834. [Google Scholar] [CrossRef] [PubMed] [Green Version]
- Dehnhard, M.; Hatt, J.M.; Eulenberger, K.; Ochs, A.; Strauss, G. Headspace solid-phase microextraction (SPME) and gas chromatography–mass spectrometry (GC-MS) for the determination of 5alpha-androst-2-en-17-one and -17beta-ol in the female Asian elephant: Application for reproductive monitoring and prediction of parturition. J. Steroid Biochem. Mol. Biol. 2003, 84, 383–391. [Google Scholar] [PubMed]
- Goodwin, T.; Schulte, B. Prospecting for mammalian chemical signals via solventless extraction techniques: An elephantine task. ChemoSense 2009, 11, 9–15. [Google Scholar]
- Koziel, J.A.; Pawliszyn, J. Air sampling and analysis of volatile organic compounds with solid phase microextraction. J. Air. Waste Manag. Assoc. 2000, 51, 173–184. [Google Scholar] [CrossRef] [PubMed]
- Devos, M.; Patte, F.; Rouault, J.; Laffort, P.; Van Gemert, L.J. Standardized Human Olfactory Thresholds; Oxford University Press: New York, NY, USA, 1990. [Google Scholar]
- Rice, S.; Koziel, J.A. Characterizing the smell of marijuana by odor impact of volatile compounds: An application of simultaneous chemical and sensory analysis. PLoS ONE 2015, 10, e0144160. [Google Scholar] [CrossRef] [PubMed] [Green Version]
- Rice, S.; Koziel, J.A. The relationship between chemical concentration and odor activity value explains the inconsistency in making a comprehensive surrogate scent training tool representative of illicit drugs. Forensic Sci. Int. 2015, 257, 257–270. [Google Scholar] [CrossRef] [PubMed] [Green Version]
- Flavornet. Available online: http://flavornet.org/flavornet.html (accessed on 13 July 2020).
- Good Scent Company. Available online: http://www.thegoodscentscompany.com/search.html (accessed on 13 July 2020).


| Contents | Table S1 | Table S2 | Table S3 | Table S4 |
|---|---|---|---|---|
| Treatments | VOCs without cleaning products | VOCs with cleaning products | ||
| Time (day) | 0 | 15 | 0 | 15 |
| Number of volatiles emitted | x | x | x | x |
| Names of the volatiles | x | x | x | x |
| Gas chromatography (GC) column retention time (RT; min) | x | x | x | x |
| MS Spectral Library (NIST & WILEY7) match (%) | x | x | x | x |
| Published odor descriptor | x | x | ||
| Chemical Abstract Service number (CAS#) | x | x | x | x |
| Carpet + sub-flooring | x | x | ||
| Carpet + sub-flooring + water | x | x | ||
| Carpet + sub-flooring + water + M. luteus | x | |||
| Carpet + sub-flooring + cat urine | x | x | ||
| Carpet + sub-flooring + cat urine + M. luteus | x | x | ||
| Carpet + sub-flooring + cat urine + M. luteus + Product 1 | x | x | ||
| Carpet + sub-flooring + cat urine + M. luteus + Product 2 | x | x | ||
| Carpet + sub-flooring + cat urine + M. luteus + Product 3 | x | x | ||
| Carpet + sub-flooring + cat urine + M. luteus + Product 4 | x | x | ||
| Ion abundance (% relative abundance) | x | x | x | x |
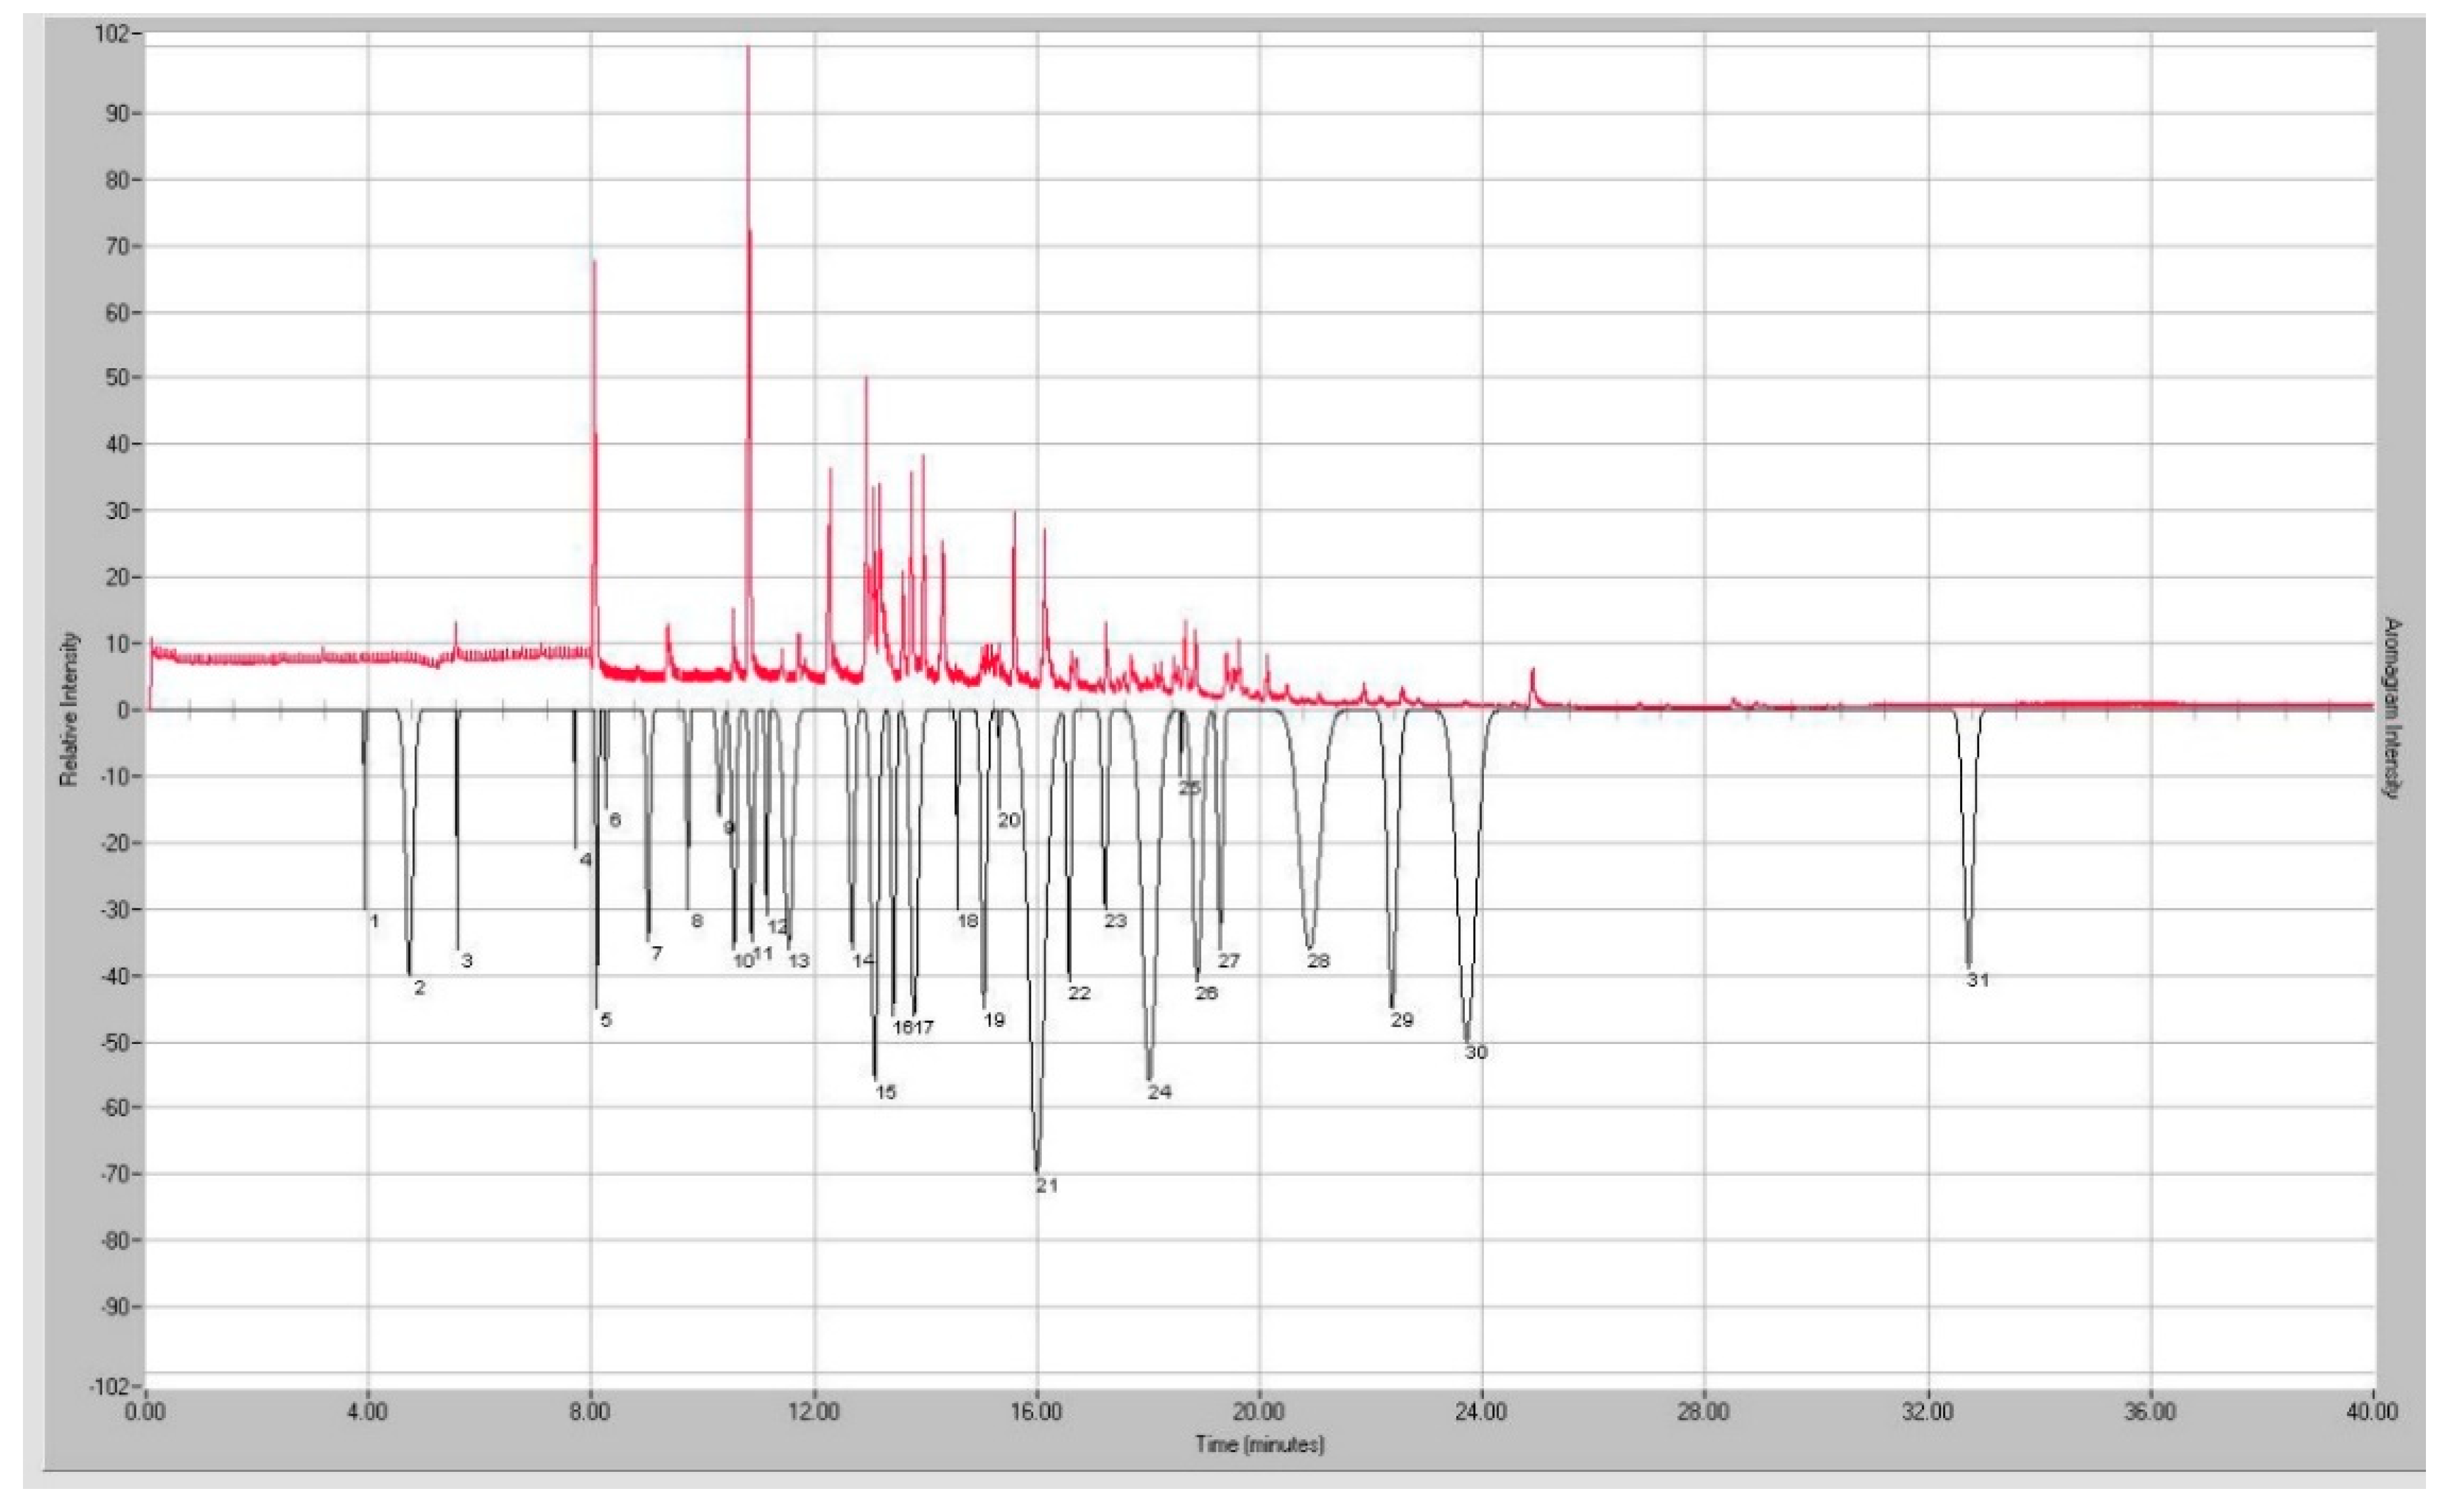
| # | Compounds | RT (min) | *Library Match % | Odor ‘Character’ Published/Recorded | CAS # | Carpet + Subflooring (day 0) | Carpet + Subflooring + Water (day 0) | Carpet + Sub-Flooring + Water + M. luteus (day 0) | Carpet + Subflooring + Cat Urine (day 0) | Carpet + Sub-Flooring + Cat Urine + M. luteus (day 0) | Ion (% rel. int.) |
|---|---|---|---|---|---|---|---|---|---|---|---|
| MS Detector Response, Peak Area Counts (PACs), Arbitrary Units | |||||||||||
| 1 | 2-Pentanone | 5.39 | 74 | 107-87-9 | 178,878 | 43(100), 86(35), 71(15), 58(10) | |||||
| 2 | Pentanal | 5.55 | 85 | Fruity, berry | 110-62-3 | 1,353,390 | 2,092,914 | 453,059 | 1,411,250 | 932,775 | 44(100), 41(60), 58(50), 57(40), 43(30) |
| 3 | Octane | 6.74 | 86 | alkane | 111-65-9 | 80,360 | 343,847 | 287,855 | 245,386 | 43(100), 85(80), 41(70), 57(50), 71(45) | |
| 4 | Toluene | 7.11 | 88 | 108-88-3 | 390,976 | 573,315 | 678,603 | 249,961 | 91(100), 92(60), 65(10), 51(5) | ||
| 5 | Hexanal | 8.06 | 95 | Green, leafy, fruity | 66-25-1 | 20,876,330 | 36,530,640 | 12,196,949 | 29,052,691 | 22,302,835 | 56(100), 41(95), 44(90),57(70), 43(60), 39(40) |
| 6 | 1,2-Dimethylcyclopropane | 8.83 | 63 | 2511-95-7 | 167,106 | 441,161 | 55(100), 70(90), 42(80), 41(50), 39(30), 43(20) | ||||
| 7 | 1-Pentanol | 9.37 | 76 | Sweet, balsam | 71-41-0 | 1,973,782 | 5,537,880 | 3,520,261 | 4,733,304 | 4,656,524 | 55(100), 42(80), 41(75), 70(70), 39(35), 57(30) |
| 8 | 1,2-Dimethylcyclohexane | 9.85 | 50 | 2207-01-4 | 1,120,465 | 326,959 | 97(100), 41(80), 81(70), 55(70), 70(65), 39(50), 69(40) | ||||
| 9 | 2,4-Octadienal | 10.23 | 54 | Green, fruity | 30361-28-5 | 429,872 | 1,777,135 | 1,721,952 | 273,430 | 81(100), 69(35), 124(25), 53(20) | |
| 10 | 2-Heptanone | 10.54 | 79 | Cheesy, banana, woody | 110-43-0 | 1,714,716 | 3,091,780 | 2,777,763 | 3,923,538 | 2,256,583 | 43(100), 58(75), 71(15), 114(10) |
| 11 | p-Mentha-1,5,8-triene | 10.82 | 42 | roasted | 21195-59-5 | 9,665,111 | 32,947,411 | 38,148,205 | 34,872,658 | 33,253,410 | 119(100), 93(90), 91(70), 92(40), 134(30) |
| 12 | Styrene | 11.24 | 94 | Sweet, balsam, floral, plastic | 100-42-5 | 606,000 | 389,091 | 602,067 | 104(100), 103(40), 78(40), 77(20), 51(15) | ||
| # | Compounds | RT (min) | *Library Match % | Odor ‘Character’ Recorded/Published | CAS # | Carpet + Sub-Flooring (day 15) | Carpet + Sub-Flooring + Water + M. luteus (day 15) | Carpet + Sub-Flooring + Cat Urine (day 15) | Carpet + Sub-Flooring + Cat Urine + M. luteus (day 15) | Ion (% Relative Intensity) |
|---|---|---|---|---|---|---|---|---|---|---|
| MS Detector Response, Peak Area Counts (PACs), Arbitrary Units | ||||||||||
| 1 | Acetone | 3.19 | 68 | 67-64-1 | 152,540 | 147,139 | 43(100), 58(30), 42(10), 39(5) | |||
| 2 | Acetic acid methyl ester | 3.33 | 63 | Sweet. fruity | 79-20-9 | 1,499,733 | 43(100), 74(35), 59(15), 42(10) | |||
| 3 | 2-Pentanone | 5.39 | 72 | 107-87-9 | 1,704,070 | 241,509 | 43(100), 86(35), 71(15), 58(10) | |||
| 4 | Octane | 6.74 | 75 | 111-65-9 | 338,270 | 750,351 | 43(100), 85(80), 41(70), 57(50), 71(45) | |||
| 5 | Toluene | 7.11 | 81 | 108-88-3 | 464,988 | 465,549 | 91(100), 92(60), 65(10), 51(5) | |||
| 6 | 2-Hexanone | 7.81 | 74 | 591-78-6 | 380,781 | 43(100), 58(60), 100(20), 57(20), 85(15), 71(10) | ||||
| 7 | 1-Pentanol | 9.37 | 76 | Balsamic, sweet | 71-41-0 | 3,766,579 | 55(100), 42(80), 41(75), 70(70), 39(35), 57(30) | |||
| 8 | 2-Methylpyrazine | 10.03 | 79 | 109-08-0 | 818,701 | 1,053,616 | 64(100), 67(45), 40(25), 53(15), 81(10) | |||
| 9 | 4-Pyridinamine | 10.3 | 79 | 504-24-5 | 797,924 | 1,145,074 | 94(100), 67(40), 40(35), 53(10) | |||
| 10 | 2-Heptanone | 10.54 | 79 | 110-43-0 | 1,882,830 | 8,674,944 | 2,855,575 | 43(100), 58(75), 71(15), 114(10) | ||
| 11 | α-Pinene | 10.85 | 91 | 80-56-8 | 137,164,634 | 119,185,423 | 74,314,748 | 94,769,143 | 93(100), 91(40), 119(30), 77(30), 79(20), 105(12) | |
| 12 | Styrene | 11.24 | 91 | Balsamic, plastic | 100-42-5 | 838,213 | 1,463,607 | 1,513,994 | 803,525 | 104(100), 103(40), 78(40), 77(20), 51(15) |
| # | Compounds | RT (min) | *Library Match % | CAS # | U + M.l + P1 (day 0) | U + M.l + P2 (day 0) | U + M.l + P3 (day 0) | U + M.l + P4 (day 0) | Ion (% Relative Intensity) |
|---|---|---|---|---|---|---|---|---|---|
| MS Detector Response, Peak Area Counts (PACs), Arbitrary Units | |||||||||
| 1 | Acetone | 3.24 | 68 | 67-64-1 | 358,744 | 380,560 | 474,903 | 430,839 | 43(100), 58(30), 42(10), 39(5) |
| 2 | 2,4-Hexadienal | 5.33 | 81 | 110-62-3 | 131,308 | 81(100), 96(40), 53(30), 65(10) | |||
| 3 | Pentanal | 5.56 | 88 | 110-62-3 | 1,354,983 | 1,653,133 | 725,418 | 1,945,524 | 44(100), 41(60), 58(50), 57(40), 43(30) |
| 4 | Toluene | 7.11 | 85 | 108-88-3 | 808,174 | 893,198 | 1,315,643 | 91(100), 92(60), 65(10), 51(5) | |
| 5 | Hexanal | 8.06 | 95 | 66-25-1 | 24,237,673 | 29,383,184 | 11,078,995 | 15,770,078 | 56(100), 41(95), 44(90),57(70), 43(60), 39(40) |
| 6 | (Z)-2-Pentene | 8.83 | 63 | 646-04-8 | 1,139,618 | 55(100), 70(90), 42(80), 41(50), 39(30), 43(20) | |||
| 7 | 1-Pentanol | 9.37 | 72 | 71-41-0 | 6,742,800 | 6,744,690 | 9,292,407 | 55(100), 42(80), 41(75), 70(70), 39(35), 57(30) | |
| 8 | Pentane, 1-chloro- | 9.4 | 59 | 543-59-9 | 4,209,417 | 55(100), 42(90), 41(75), 71(60), 39(35), 57(30) | |||
| 9 | 2-Butylfurun | 10.21 | 68 | 4466-24-4 | 1,463,055 | 1,006,109 | 81(100), 41(30), 55(30), 69(25), 124(25), 53(20) | ||
| 10 | 2-Heptanone | 10.54 | 86 | 110-43-0 | 2,818,994 | 6,796,498 | 990,983 | 5,096,800 | 43(100), 58(75), 71(15), 114(10) |
| 11 | α-Pinene | 10.8 | 91 | 80-56-8 | 16,649,718 | 46,983,540 | 9,096,994 | 25,095,633 | 93(100), 91(40), 92(35), 119(30), 77(30), 69(25), 41(25) |
| 12 | 1-Butanol, 3-methyl-, acetate | 10.97 | 76 | 123-92-2 | 1,560,496 | 43(100), 70(55), 61(30), 55(30),42(25) | |||
| # | Compounds | RT (min) | *Library Match % | CAS # | U + M.l + P1 (day 15) | U + M.l + P2 (day 15) | U + M.l + P3 (day 15) | U + M.l + P4 (day 15) | Ion (% Relative Intensity) |
|---|---|---|---|---|---|---|---|---|---|
| MS Detector Response, Peak Area Counts (PACs), Arbitrary Units | |||||||||
| 1 | Acetone | 3.19 | 63 | 67-64-1 | 643,351 | 332,952 | 43(100), 58(30), 34(5) | ||
| 2 | Acetic acid methyl ester | 3.34 | 63 | 79-20-9 | 196,721 | 4,500,806 | 43(100), 74(30), 59(10) | ||
| 3 | 2-Pentanone | 5.39 | 79 | 107-87-9 | 1,981,899 | 43(100), 86(20), 58(15), 71(10) | |||
| 4 | 1-Hexene 4-methyl | 8.52 | 63 | 3769-23-1 | 2,200,691 | 41(100), 57(90), 56(80), 55(70), 70(60), 39(40), 58(20) | |||
| 5 | 1-Pentanol | 9.4 | 63 | 71-41-0 | 2,211,532 | 55(100), 42(80), 41(75), 70(60), 39(40) | |||
| 6 | 2-Butylfuran | 10.33 | 85 | 4466-24-4 | 832,292 | 81(100), 124(25), 82(20), 53(10) | |||
| 7 | Methyl pyrazine | 10.32 | 76 | 109-08-0 | 874,537 | 1,435,565 | 94(100), 67(40), 39(15), 53(10) | ||
| 8 | 2-Heptanone | 10.56 | 83 | 110-43-0 | 1,452,480 | 6,756,435 | 1,881,383 | 43(100), 58(70), 71(20), 114(10) | |
| 9 | α-Pinene | 10.84 | 89 | 80-56-8 | 99,017,729 | 94,473,919 | 61,479,562 | 57,686,178 | 93(100), 119(60), 91(50), 92(40), 77(30), 79(20), 134(20) |
| 10 | Styrene | 11.25 | 95 | 100-42-5 | 1,324,148 | 966,762 | 4,458,613 | 1,322,208 | 104(100), 103(50), 78(45), 77(20), 51(20) |
| 11 | Camphene | 11.42 | 95 | 79-92-5 | 2,001,325 | 1,807,294 | 1,933,728 | 93(100), 121(80), 91(40), 79(35), 67(30), 136(20) | |
| 12 | Verbenene | 11.72 | 53 | 4080-46-0 | 3,218,321 | 6,737,442 | 5,177,868 | 2,561,949 | 91(100), 92(50), 119(20), 105(10), 65(10) |
© 2020 by the authors. Licensee MDPI, Basel, Switzerland. This article is an open access article distributed under the terms and conditions of the Creative Commons Attribution (CC BY) license (http://creativecommons.org/licenses/by/4.0/).
Share and Cite
Banik, C.; Koziel, J.A.; Flickinger, E. Volatile Compounds Emitted from the Cat Urine Contaminated Carpet before and after Treatment with Marketed Cleaning Products: A Simultaneous Chemical and Sensory Analysis. Data 2020, 5, 88. https://doi.org/10.3390/data5040088
Banik C, Koziel JA, Flickinger E. Volatile Compounds Emitted from the Cat Urine Contaminated Carpet before and after Treatment with Marketed Cleaning Products: A Simultaneous Chemical and Sensory Analysis. Data. 2020; 5(4):88. https://doi.org/10.3390/data5040088
Chicago/Turabian StyleBanik, Chumki, Jacek A. Koziel, and Elizabeth Flickinger. 2020. "Volatile Compounds Emitted from the Cat Urine Contaminated Carpet before and after Treatment with Marketed Cleaning Products: A Simultaneous Chemical and Sensory Analysis" Data 5, no. 4: 88. https://doi.org/10.3390/data5040088